Embed Size (px)
Citation preview
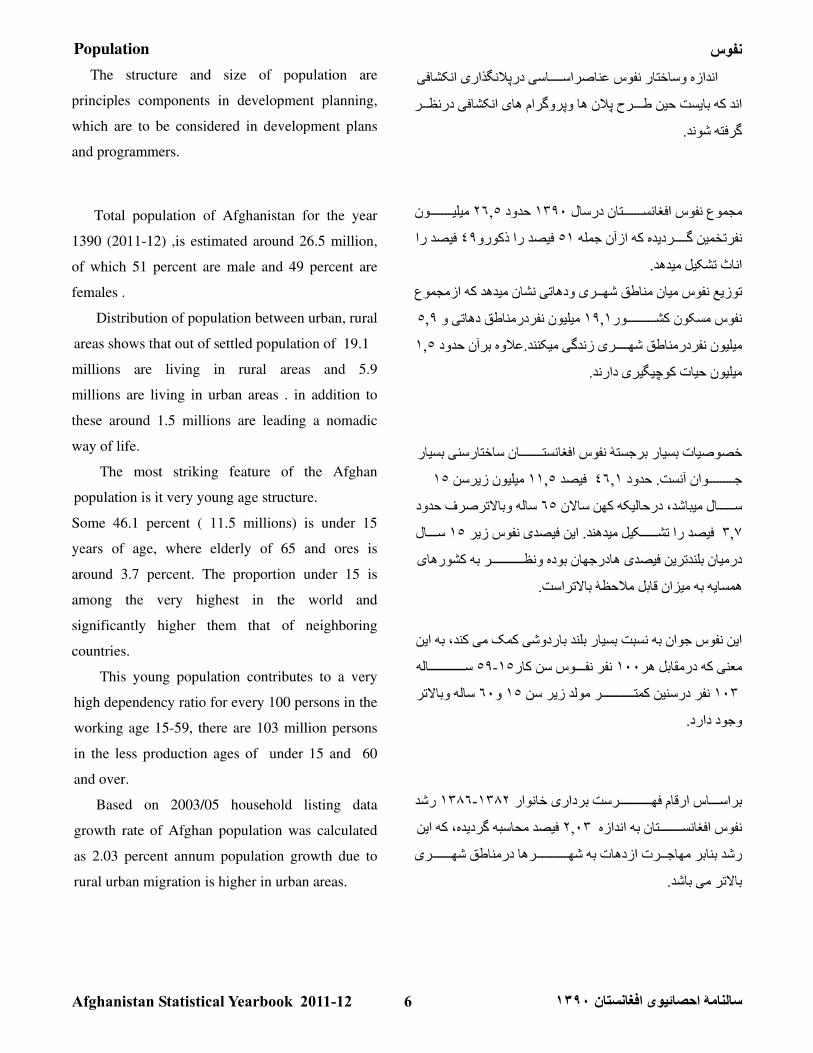
Afghanistan Statistical Yearbook 2011-12 6
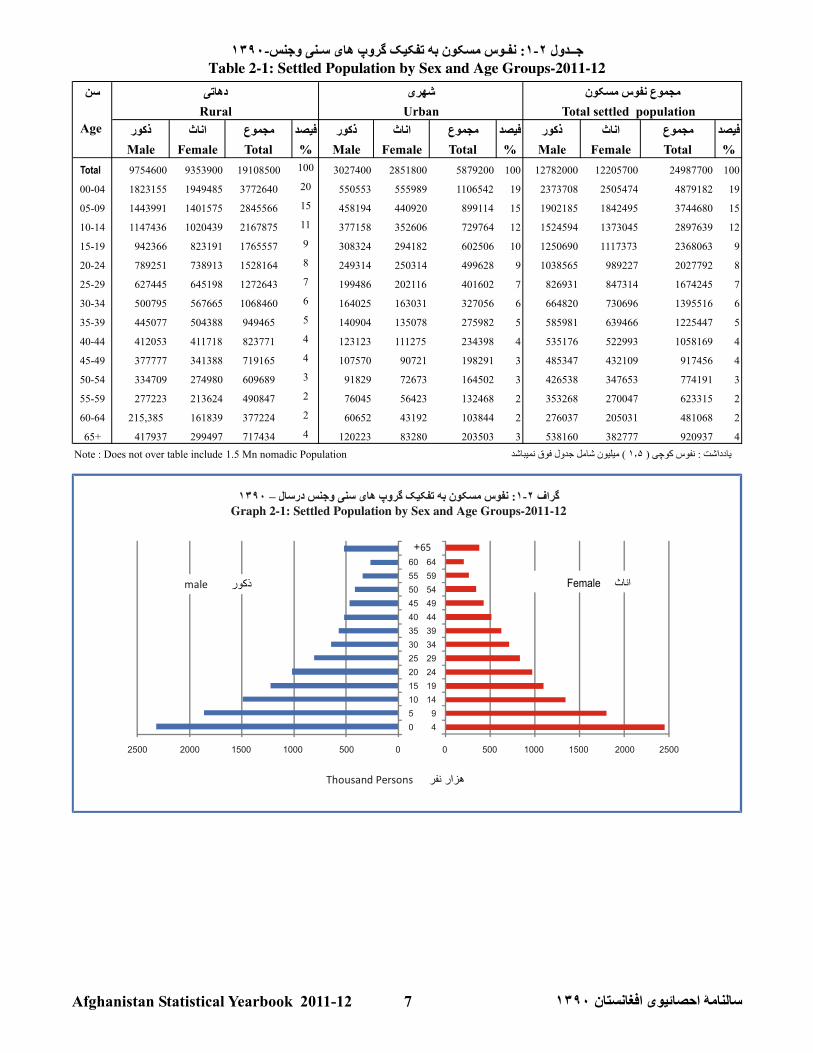
Male Female Total % Male Female Total % Male Female Total %
Total 9754600 9353900 19108500 100 3027400 2851800 5879200 100 12782000 12205700 24987700 100
00-04 1823155 1949485 3772640 20 550553 555989 1106542 19 2373708 2505474 4879182 19
05-09 1443991 1401575 2845566 15 458194 440920 899114 15 1902185 1842495 3744680 15
10-14 1147436 1020439 2167875 11 377158 352606 729764 12 1524594 1373045 2897639 12
15-19 942366 823191 1765557 9 308324 294182 602506 10 1250690 1117373 2368063 9
20-24 789251 738913 1528164 8 249314 250314 499628 9 1038565 989227 2027792 8
25-29 627445 645198 1272643 7 199486 202116 401602 7 826931 847314 1674245 7
30-34 500795 567665 1068460 6 164025 163031 327056 6 664820 730696 1395516 6
35-39 445077 504388 949465 5 140904 135078 275982 5 585981 639466 1225447 5
40-44 412053 411718 823771 4 123123 111275 234398 4 535176 522993 1058169 4
45-49 377777 341388 719165 4 107570 90721 198291 3 485347 432109 917456 4
50-54 334709 274980 609689 3 91829 72673 164502 3 426538 347653 774191 3
55-59 277223 213624 490847 2 76045 56423 132468 2 353268 270047 623315 2
60-64 215,385 161839 377224 2 60652 43192 103844 2 276037 205031 481068 2
65+ 417937 299497 717434 4 120223 83280 203503 3 538160 382777 920937 4
Note : Does not over table include 1.5 Mn nomadic Population
Rural Total settled populationUrban
Age
64
59
54
49
44
39
34
29
24
19
14
9
4
60
55
50
45
40
35
30
25
20
15
10
5
0
2500 2000 1500 1000 500 0 25002000150010005000
Female
Afghanistan Statistical Yearbook 2011-12 7

Female Male Total Sex ratio
Total 12205.7 12782.0 24987.7 104.7
Rural 9353.9 9754.6 19108.5 104.3
Urban 2851.8 3027.4 5879.2 106.2
Total 1846.1 1972.6 3818.7 106.9
Rural 308.1 322.3 630.4 104.6
Urban 1538.0 1650.3 3188.3 107.3
Total 204.6 208.4 413.0 101.9
Rural 204.0 207.6 411.6 101.8
Urban 0.6 0.8 1.4 133.3
Total 306.9 314.0 620.9 102.3
Rural 280.0 286.6 566.6 102.4
Urban 26.9 27.4 54.3 101.9
Total 273.4 285.0 558.4 104.2
Rural 272.0 283.6 555.6 104.3
Urban 1.4 1.4 2.8 100.0
Total 180.3 186.7 367.0 103.5
Rural 175.8 182.1 357.9 103.6
Urban 4.5 4.6 9.1 102.2
Total 688.1 721.5 1409.6 104.9
Rural 588.8 616.1 1204.9 104.6
Urban 99.3 105.4 204.7 106.1
Total 203.4 213.8 417.2 105.1
Rural 201.2 211.3 412.5 105.0
Urban 2.2 2.5 4.7 113.6
Total 70.2 73.5 143.7 104.7
Rural 70.2 73.5 143.7 104.7
Urban - - - -
Total 413.6 434.9 848.5 105.1
Rural 330.8 349.0 679.8 105.5
Urban 82.8 85.9 168.7 103.7
Total 206.4 212.1 418.5 102.8
Rural 200.5 206.2 406.7 102.8
Urban 5.9 5.9 11.8 100.0
Total 562.1 587.3 1149.4 104.5
Rural 535.1 559.1 1094.2 104.5
Urban 27.0 28.2 55.2 104.4
Total 198.2 208.9 407.1 105.4
Rural 197.0 207.5 404.5 105.3
Urban 1.2 1.4 2.6 116.7
Total 252.4 263.9 516.3 104.6
Rural 241.3 252.4 493.7 104.6
Urban 11.1 11.5 22.6 103.6
Total 262.5 275.3 537.8 104.9
Rural 257.3 269.8 527.1 104.9
Urban 5.2 5.5 10.7 105.8
Total 205.8 215.9 421.7 104.9
Rural 199.7 209.3 409.0 104.8
Urban 6.1 6.6 12.7 108.2
Total 67.9 70.7 138.6 104.1
Rural 67.9 70.7 138.6 104.1
Urban - - - -
Total 436.4 453.3 889.7 103.9
Rural 419.7 435.7 855.4 103.8Urban 16.7 17.6 34.3 105.4
Province
Total
Kabul
Kapisa
Parwan
Wardak
Logar
Panjsher
Baghlan
Laghman
Paktika
Paktya
Khost
Kunarha
Nooristan
Badakhshan
Figures in Thousand
Bamyan
Ghazni
Nangarhar
Afghanistan Statistical Yearbook 2011-12 8
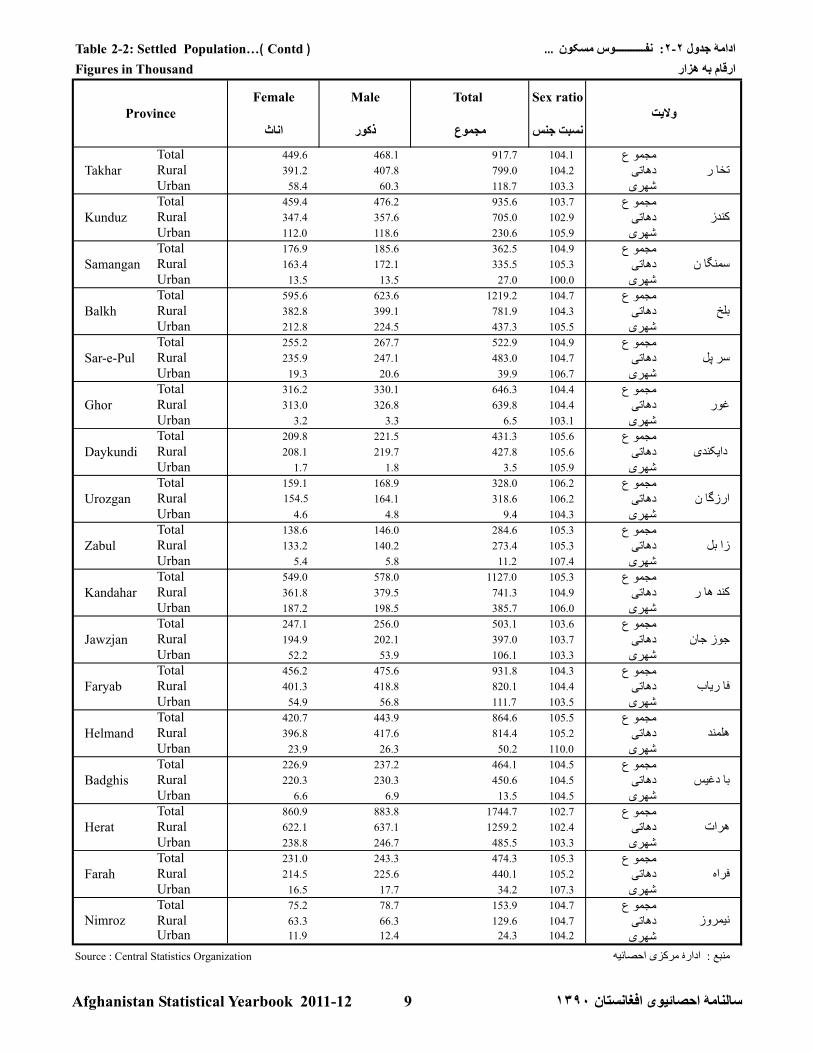
Table 2-2: Settled Population ( Contd )
Female Male Total Sex ratio
Total 449.6 468.1 917.7 104.1
Rural 391.2 407.8 799.0 104.2
Urban 58.4 60.3 118.7 103.3
Total 459.4 476.2 935.6 103.7
Rural 347.4 357.6 705.0 102.9
Urban 112.0 118.6 230.6 105.9
Total 176.9 185.6 362.5 104.9
Rural 163.4 172.1 335.5 105.3
Urban 13.5 13.5 27.0 100.0
Total 595.6 623.6 1219.2 104.7
Rural 382.8 399.1 781.9 104.3
Urban 212.8 224.5 437.3 105.5
Total 255.2 267.7 522.9 104.9
Rural 235.9 247.1 483.0 104.7
Urban 19.3 20.6 39.9 106.7
Total 316.2 330.1 646.3 104.4
Rural 313.0 326.8 639.8 104.4
Urban 3.2 3.3 6.5 103.1
Total 209.8 221.5 431.3 105.6
Rural 208.1 219.7 427.8 105.6
Urban 1.7 1.8 3.5 105.9
Total 159.1 168.9 328.0 106.2
Rural 154.5 164.1 318.6 106.2
Urban 4.6 4.8 9.4 104.3
Total 138.6 146.0 284.6 105.3
Rural 133.2 140.2 273.4 105.3
Urban 5.4 5.8 11.2 107.4
Total 549.0 578.0 1127.0 105.3
Rural 361.8 379.5 741.3 104.9
Urban 187.2 198.5 385.7 106.0
Total 247.1 256.0 503.1 103.6
Rural 194.9 202.1 397.0 103.7
Urban 52.2 53.9 106.1 103.3
Total 456.2 475.6 931.8 104.3
Rural 401.3 418.8 820.1 104.4
Urban 54.9 56.8 111.7 103.5
Total 420.7 443.9 864.6 105.5
Rural 396.8 417.6 814.4 105.2
Urban 23.9 26.3 50.2 110.0
Total 226.9 237.2 464.1 104.5
Rural 220.3 230.3 450.6 104.5
Urban 6.6 6.9 13.5 104.5
Total 860.9 883.8 1744.7 102.7
Rural 622.1 637.1 1259.2 102.4
Urban 238.8 246.7 485.5 103.3
Total 231.0 243.3 474.3 105.3
Rural 214.5 225.6 440.1 105.2
Urban 16.5 17.7 34.2 107.3
Total 75.2 78.7 153.9 104.7
Rural 63.3 66.3 129.6 104.7
Urban 11.9 12.4 24.3 104.2
Source : Central Statistics Organization
Farah
...
Daykundi
Urozgan
Takhar
Kunduz
Samangan
Balkh
Sar-e-Pul
Ghor
Nimroz
Zabul
Province
Faryab
Kandahar
Jawzjan
Herat
Helmand
Badghis
Figures in Thousand
Afghanistan Statistical Yearbook 2011-12 9

person Family person Family person Family person Family
Total 68581 12501 115 23 18733 3701 49733 8777
Kabul 16117 2994 89 17 6358 1209 9670 1768
Kapisa 1021 200 0 0 926 183 95 17
Parwan 1770 338 0 0 686 132 1084 206
Wardak 415 75 0 0 88 17 327 58
Logar 1477 273 0 0 29 5 1448 268
Nangarhar 12299 2203 5 1 67 10 12227 2192
Laghman 2708 467 0 0 155 28 2553 439
Panjsher 149 29 0 0 64 13 85 16
Baghlan 2457 458 0 0 573 117 1884 341
Bamyan 355 81 0 0 308 70 47 11
Ghazni 825 165 1 0 495 108 329 57
Paktika 112 16 0 0 0 0 112 16
Paktya 2140 402 0 0 0 0 2140 402
Khost 494 92 3 1 0 0 491 91
Kunar 2541 442 1 0 0 0 2540 442
Nooristan 11 3 0 0 0 0 11 3
Badakhshan 83 16 0 0 29 7 54 9
Takhar 836 155 0 0 215 46 621 109
Kunduz 4775 868 0 0 462 96 4313 772
Samangan 279 48 0 0 101 18 178 30
Balkh 2560 499 13 3 1112 225 1435 271
Sar-e-pul 729 150 0 0 391 89 338 61
Ghor 33 7 1 0 28 6 4 1
Daykundi 133 31 0 0 93 22 40 9
Urozgan 49 7 0 0 3 1 46 6
Zabul 224 36 0 0 0 0 224 36
Kandahar 3075 450 2 1 72 13 3001 436
Jawzjan 1309 241 0 0 521 98 788 143
Faryab 434 77 0 0 107 20 327 57
Helmand 2649 390 0 0 44 7 2605 383
Badghis 42 9 0 0 4 1 38 8
Herat 5047 1015 0 0 4538 925 509 90
Farah 1215 224 0 0 1127 210 88 14
Nimroz 206 38 0 0 127 24 79 14
Unknown 12 2 0 0 10 1 2 1
PakistanTotal
Source: UNHCR Office
ProvinceOther countries Iran
Afghanistan Statistical Yearbook 2011-12 10

Person Family Person Family Person Family Person Family
Total 115 23 18733 3701 49733 8777 68581 12501
April14 3 1643 320 5544 1008 7201 1331
May15 3 2262 454 9431 1685 11708 2142
June11 3 2113 455 9609 1725 11733 2183
July17 3 3315 634 5270 939 8602 1576
August3 1 2331 467 932 167 3266 635
September16 3 2547 510 5601 945 8164 1458
October6 1 2537 492 6974 1172 9517 1665
November11 2 582 112 2909 518 3502 632
December14 2 317 61 1119 190 1450 253
January5 1 114 21 400 66 519 88
February0 0 248 50 374 74 622 124
March 3 1 724 125 1570 288 2297 414
PakistanOther countriesMonth
TotalIran
Source : UNHCR Office
Afghanistan Statistical Yearbook 2011-12 11

Person Family Person Family Person Family Person Family
15665 2972 892004 148451 3697518 646123 4605187 797546 Total
9679 2273 259792 37231 1565066 281402 1834537 320906 2002 1380-81
1176 205 142280 22240 332183 58942 475639 81387 2003 1381-82
650 115 377151 68262 383321 66554 761122 134931 2004 1382-83
1140 65 63559 11532 449391 79234 514090 90831 2005 1383-84
1202 103 5264 913 133338 24046 139804 25062 2006 1384-85
721 71 7054 1388 357635 56335 365410 57794 2007 1385-86
628 68 3656 641 274200 45062 278484 45771 2008 1386-87
204 21 6028 1069 48320 8414 54552 9504 2009 1387-88
150 28 8487 1474 104331 17357 112968 18859 2010 1388-89
115 23 18733 3701 49733 8777 68581 12501 2011 1389-90
Total
Source: UNHCR Office
IranOther countries PakistanYear
0 200 400 600 800 1000 1200 1400 1600
2002-1380-81
2003-1381-82
2004-1382-83
2005-1383-84
2006-1384-85
2007-1385-86
2008-1386-87
2009-1387-88
2010-1388-89
2011-1389-90
Other countries
Iran
Pakistan
Afghanistan Statistical Yearbook 2011-12 12

Percentage Person No100.00 68581 Total23.50 16117 Kabul 11.49 1021 Kapisa 22.58 1770 Parwan 30.61 415 Wardak 42.15 1477 Logar 5
17.93 12299 Nangarhar 63.95 2708 Laghman 70.22 149 Panjsher 83.58 2457 Baghlan 90.52 355 Bamyan 10
1.20 825 Ghazni 11
0.16 112 Paktika 12
3.12 2140 Paktya 13
0.72 494 Khost 14
3.71 2541 Kunar 15
0.02 11 Nooristan 16
0.12 83 Badakhshan 17
1.22 836 Takhar 18
6.96 4775 Kunduz 19
0.41 279 Samangan 20
3.73 2560 Balkh 21
1.06 729 Sar-e-pul 22
0.05 33 Ghor 23
0.20 133 Daykundi 24
0.07 49 Urozgan 25
0.33 224 Zabul 26
4.48 3075 Kandahar 27
1.91 1309 Jawzjan 28
0.63 434 Faryab 29
3.86 2649 Helmand 30
0.06 42 Badghis 31
7.36 5047 Herat 32
1.77 1215 Farah 33
0.30 206 Nimroz 34
0.02 12 Unknown
Name of Province
Source: UNHCR Office
Afghanistan Statistical Yearbook 2011-12 13

death rate
(000)
birth rate
(000)
growth
rate (%)
total
population
(000)
No
female male
Afghanistan 17.39 37.83 2.03 26500.0 1
Bangladesh 71.65 67.93 5.75 22.98 1.57 158570.5 2
Bhutan 68.19 66.46 7.12 19.13 1.20 708.4 3
Brunei 78.53 73.91 3.35 17.87 1.71 401.9 4
Burma 67.33 62.57 8.16 19.31 1.08 53999.8 5
Cambodia 65.13 60.31 8.07 25.40 1.70 14701.7 6
China 76.94 72.68 7.03 12.29 0.49 1336718.0 7
East Timor 70.47 65.54 5.89 25.70 1.98 1177.8 8
India 67.95 65.77 7.48 20.97 1.34 1189172.9 9
Indonesia 73.99 68.80 6.26 18.10 1.07 245613.0 10
Iran 71.61 68.58 5.94 18.55 1.25 77891.2 11
Iraq 72.02 69.15 4.82 28.81 2.40 30399.6 12
Isreal 83.24 78.79 5.47 19.24 1.58 7473.1 13
Japan 85.72 78.96 10.09 7.31 -0.28 126475.7 14
Jordan 81.45 78.73 2.69 26.79 0.98 6508.3 15
Kazakhstan 74.08 63.24 9.38 16.65 0.40 15522.4 16
Korea (north) 72.93 65.03 9.08 14.51 0.54 24457.5 17
Korea (south) 82.49 75.84 6.26 8.55 0.23 48754.7 18
Kuwait 78.30 75.95 2.11 21.32 1.99 2595.6 19
Kyrgyzstan 74.24 66.04 6.79 23.66 1.43 5587.4 20
Laos 64.36 60.50 8.13 26.13 1.68 6477.2 21
Malaysia 76.73 71.05 4.93 21.08 1.58 28728.6 22
Maldives 76.80 72.22 3.71 14.83 -0.15 395.0 23
Mongolia 70.89 65.85 6.04 20.93 1.49 3133.3 24
Nepal 67.44 64.94 6.81 22.17 1.60 29391.9 25
Oman 76.16 72.38 3.45 24.15 2.02 3028.0 26
Pakistan 67.90 64.18 6.92 24.81 1.57 187342.7 27
Philippines 74.74 68.72 5.02 25.34 1.90 101833.9 28
Lebanon 76.62 73.48 6.54 15.02 0.24 4143.1 29
Country
Life expectancy at
birth
Afghanistan Statistical Yearbook 2011-12 14
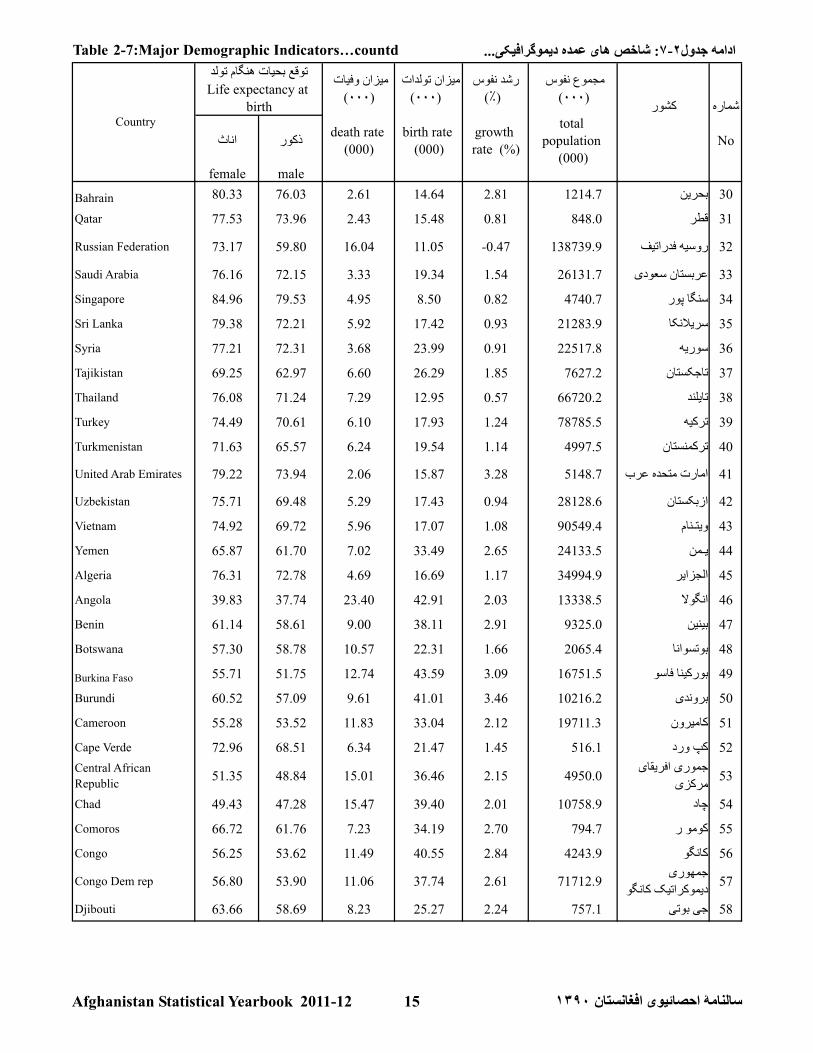
death rate
(000)
birth rate
(000)
growth
rate (%)
total
population
(000)
No
female male
Bahrain 80.33 76.03 2.61 14.64 2.81 1214.7 30
Qatar 77.53 73.96 2.43 15.48 0.81 848.0 31
Russian Federation 73.17 59.80 16.04 11.05 -0.47 138739.9 32
Saudi Arabia 76.16 72.15 3.33 19.34 1.54 26131.7 33
Singapore 84.96 79.53 4.95 8.50 0.82 4740.7 34
Sri Lanka 79.38 72.21 5.92 17.42 0.93 21283.9 35
Syria 77.21 72.31 3.68 23.99 0.91 22517.8 36
Tajikistan 69.25 62.97 6.60 26.29 1.85 7627.2 37
Thailand 76.08 71.24 7.29 12.95 0.57 66720.2 38
Turkey 74.49 70.61 6.10 17.93 1.24 78785.5 39
Turkmenistan 71.63 65.57 6.24 19.54 1.14 4997.5 40
United Arab Emirates 79.22 73.94 2.06 15.87 3.28 5148.7 41
Uzbekistan 75.71 69.48 5.29 17.43 0.94 28128.6 42
Vietnam 74.92 69.72 5.96 17.07 1.08 90549.4 43
Yemen 65.87 61.70 7.02 33.49 2.65 24133.5 44
Algeria 76.31 72.78 4.69 16.69 1.17 34994.9 45
Angola 39.83 37.74 23.40 42.91 2.03 13338.5 46
Benin 61.14 58.61 9.00 38.11 2.91 9325.0 47
Botswana 57.30 58.78 10.57 22.31 1.66 2065.4 48
Burkina Faso 55.71 51.75 12.74 43.59 3.09 16751.5 49
Burundi 60.52 57.09 9.61 41.01 3.46 10216.2 50
Cameroon 55.28 53.52 11.83 33.04 2.12 19711.3 51
Cape Verde 72.96 68.51 6.34 21.47 1.45 516.1 52
Central African
Republic51.35 48.84 15.01 36.46 2.15 4950.0 53
Chad 49.43 47.28 15.47 39.40 2.01 10758.9 54
Comoros 66.72 61.76 7.23 34.19 2.70 794.7 55
Congo 56.25 53.62 11.49 40.55 2.84 4243.9 56
Congo Dem rep 56.80 53.90 11.06 37.74 2.61 71712.9 57
Djibouti 63.66 58.69 8.23 25.27 2.24 757.1 58
Life expectancy at
birth Country
Table 2-7:Major Demographic Indicators countd
Afghanistan Statistical Yearbook 2011-12 15

death rate
(000)
birth rate
(000)
growth
rate (%)
total
population
(000)
No
female male
Egypt 75.38 70.07 4.82 24.63 1.96 82079.6 59
Equatorial Guinea 63.36 61.40 9.03 35.43 2.64 668.2 60
Eritrea 64.69 60.40 8.08 32.80 2.47 5939.5 61
Ethiopia 58.81 53.64 11.04 42.99 3.19 90873.7 62
Gabon 53.22 51.78 13.00 35.19 2.00 1576.7 63
Gambia 65.86 61.23 7.65 34.19 2.40 1797.9 64
Ghana 62.25 59.78 8.75 27.55 1.82 24791.1 65
Guinea 59.64 56.63 10.45 36.90 2.65 10601.0 66
Guinea-Bissau 50.67 46.80 15.27 35.15 1.99 1596.7 67
Ivory Coast 57.81 55.79 10.16 30.95 2.08 21504.2 68
Kenya 60.07 58.91 8.93 33.54 2.46 41070.9 69
Lesotho 51.76 51.51 15.19 26.93 0.33 1924.9 70
Liberia 58.60 55.44 10.62 37.25 2.66 3786.8 71
Libya 80.08 75.34 3.40 24.04 2.06 6598.0 72
Madagascar 65.70 61.62 7.79 37.51 2.97 21926.2 73
Malawi 52.48 50.93 13.22 40.85 2.76 15879.3 74
Mali 54.26 51.01 14.29 45.62 2.61 14159.9 75
Mauritania 63.41 58.94 8.83 33.23 2.35 3281.6 76
Mauritius 78.12 71.01 6.68 13.97 0.73 1303.7 77
Morocco 79.11 72.84 4.75 19.19 1.07 31968.4 78
Mozambique 52.57 51.01 13.00 39.62 2.44 22948.9 79
Namibia 51.89 52.48 12.95 21.48 0.87 2147.6 80
Niger 54.70 52.13 14.11 50.54 3.64 16468.9 81
Nigeria 48.41 46.76 16.06 35.51 1.94 155215.6 82
Rwanda 59.52 56.57 9.88 36.74 2.79 11370.4 83
Sao tome and principe 64.33 61.93 8.18 38.03 2.05 179.5 84
Senegal 61.77 57.85 9.26 36.73 2.56 12643.8 85
Seychelles 78.32 68.87 6.91 15.33 0.95 89.2 86
Sierra Leone 58.65 53.69 11.73 38.46 2.25 5363.7 87
Country
Life expectancy at
birth
Table 2-7:Major Demographic Indicators countd
Afghanistan Statistical Yearbook 2011-12 16

death rate
(000)
birth rate
(000)
growth
rate (%)
total
population
(000)
No
female male
Somalia 52.37 48.49 14.87 42.71 1.60 9925.6 88
South Africa 48.39 50.24 17.09 19.48 -0.38 49004.0 89
Sudan 56.71 54.18 11.00 36.12 2.48 45047.5 90
south sudan 8260.5 91
Swaziland 48.39 48.93 14.60 26.63 1.20 1370.4 92
Tanzania 54.42 51.34 12.09 32.64 2.00 42746.6 93
Togo 65.30 60.19 7.96 35.58 2.76 6772.0 94
Tunisia 77.17 73.00 5.83 17.40 0.98 10629.2 95
Uganda 54.33 52.17 11.71 47.49 3.58 34612.3 96
Zambia 53.63 51.13 12.61 44.08 3.06 13881.3 97
Zimbabwe 49.34 49.93 13.58 31.86 4.31 12084.3 98
Albania 80.30 74.82 6.15 12.15 0.27 2994.7 99
Andorra 84.64 80.35 6.35 9.66 0.33 84.8 100
Armenia 77.31 69.59 8.46 12.85 0.06 2968.0 101
Austria 82.84 76.87 10.14 8.67 0.03 8217.3 102
Azerbaijan 72.01 63.20 8.25 17.85 0.85 8372.4 103
Belarus 77.18 65.57 13.77 9.76 -0.36 9577.6 104
Belgium 82.81 76.35 10.57 10.06 0.07 10431.5 105
Bosnia and
Herzegovina 82.63 75.25 8.80 8.89 0.01 4622.2 106
Bulgaria 77.41 69.99 14.32 9.32 -0.78 7093.6 107
Croatia 79.60 72.17 11.91 9.60 -0.08 4483.8 108
Cyprus 80.74 75.04 6.45 11.41 1.62 1120.5 109
Czech Republic 80.66 73.93 10.86 8.70 -0.12 10190.2 110
Denmark 81.14 76.25 10.19 10.29 0.25 5529.9 111
Estonia 78.97 68.02 13.55 10.45 -0.64 1283.0 112
Finland 82.89 75.79 10.24 10.37 0.08 5259.3 113
France 84.54 78.02 8.76 12.29 0.50 65312.2 114
Georgia 80.82 73.80 9.92 10.73 -0.33 4585.9 115
Germany 82.44 77.82 10.92 8.30 -0.21 81471.8 116
Country
Life expectancy at
birth
Table 2-7:Major Demographic Indicators countd
Afghanistan Statistical Yearbook 2011-12 17

death rate
(000)
birth rate
(000)
growth
rate (%)
total
population
(000)
No
female male
Greece 82.65 77.36 10.70 9.21 0.08 10760.1 117
Hungary 78.76 71.04 12.68 9.60 -0.17 9976.1 118
Iceland 83.17 78.72 6.96 13.29 0.69 311.1 119
Ireland 82.55 77.96 6.34 16.10 1.06 4671.0 120
Italy 84.53 79.16 9.84 9.18 0.42 61016.8 121
Latvia 78.07 67.56 13.60 9.96 -0.60 2204.7 122
Liechtenstein 83.77 76.86 7.61 9.65 0.65 35.2 123
Lithuania 80.48 70.48 11.33 9.29 -0.28 3535.5 124
Luxembourg 83.08 76.36 8.48 11.69 1.15 503.3 125
Macedonia 77.87 72.61 8.91 11.87 0.25 2077.3 126
Malta 82.12 77.45 8.60 10.35 0.38 408.3 127
Moldova 75.28 67.68 10.74 11.16 -0.07 4314.4 128
Monaco 93.84 85.77 8.28 6.94 -0.12 30.5 129
Netherlands 82.44 77.06 8.85 10.23 0.37 16847.0 130
Norway 83.02 77.53 9.24 10.84 0.33 4691.8 131
Poland 80.25 72.10 10.17 10.01 -0.06 38441.6 132
Portugal 82.01 75.28 10.80 9.94 0.21 10760.3 133
Romania 77.66 70.50 11.81 9.55 -0.25 21904.6 134
San Marino 85.74 80.50 7.89 9.02 1.04 31.8 135
Serbia 77.34 71.49 13.85 9.19 -0.47 7310.6 136
Slovakia 79.93 71.92 9.60 10.48 0.12 5477.0 137
Slovenia 81.20 73.64 10.87 8.85 -0.16 2000.1 138
Spain 84.37 78.16 8.80 10.66 0.57 46754.8 139
Sweden 83.51 78.78 10.20 10.18 0.16 9088.7 140
Switzerland 84.05 78.24 8.72 9.53 0.21 7640.0 141
Ukraine 74.75 62.79 15.74 9.62 -0.62 45134.7 142
United Kingdom 82.25 77.95 9.33 12.29 0.56 62698.4 143
Montenegro 8.89 11.00 -0.71 661.8 144
Antigua and Barbuda 77.59 73.47 5.73 16.31 1.29 87.9 145
Country
Life expectancy at
birth
Table 2-7:Major Demographic Indicators countd
Afghanistan Statistical Yearbook 2011-12 18

death rate
(000)
birth rate
(000)
growth
rate (%)
total
population
(000)
No
female male
Bahamas 73.63 68.80 6.88 16.10 0.92 313.3 146
Barbados 76.64 72.07 8.39 12.35 0.37 286.7 147
Belize 70.02 66.53 5.87 26.43 2.06 321.1 148
Canada 84.10 78.81 7.98 10.28 0.79 34030.6 149
Costa Rica 80.46 75.10 4.33 16.54 1.31 4576.6 150
Cuba 80.08 75.46 7.47 9.99 -0.10 11087.3 151
Dominica 79.08 73.03 8.06 15.62 0.21 73.0 152
Dominican Rep. 79.55 75.16 4.35 19.67 1.33 9956.6 153
El Salvador 76.87 70.16 5.62 17.75 0.32 6071.8 154
Grenada 75.82 70.51 7.94 17.01 0.55 108.4 155
Guatemala 72.83 69.03 4.98 26.96 1.99 13824.5 156
Haiti 63.53 60.84 8.21 24.40 0.79 9719.9 157
Honduras 72.37 68.93 5.02 25.14 1.89 8143.6 158
Jamaica 75.19 71.79 6.54 19.20 0.73 2868.4 159
Mexico 79.43 73.65 4.86 19.13 1.10 113724.2 160
Nicaragua 74.09 69.82 5.03 19.46 1.09 5666.3 161
Panama 80.68 75.02 4.65 19.43 1.44 3460.5 162
SaintKitts & Nevis 77.01 72.25 7.10 14.07 0.82 50.3 163
Saint Lucia 79.68 74.15 7.00 14.63 0.39 161.6 164
Saint. Vincent & the
grenadines76.09 72.26 6.98 14.62 -0.33 103.9 165
Trinidad & Tobago 74.30 68.51 8.29 14.35 -0.09 1227.5 166
United States of
America80.93 75.92 8.38 13.83 0.96 313232.0 167
Argentina 80.36 73.71 7.38 17.54 1.02 41769.7 168
Bolivia 70.42 64.84 6.85 24.71 1.69 10118.7 169
Brazil 76.27 68.97 6.36 17.79 1.13 203429.8 170
Chile 81.13 74.44 5.97 14.33 0.84 16888.8 171
Colombia 78.03 71.27 5.26 17.49 1.16 44725.5 172
Ecuador 78.82 72.79 5.00 19.96 1.44 15007.3 173
Guyana 71.07 63.27 7.20 17.12 -0.44 744.8 174
Paraguay 78.93 73.59 4.57 17.48 1.28 6459.1 175
Country
Life expectancy at
birth
Table 2-7:Major Demographic Indicators countd
Afghanistan Statistical Yearbook 2011-12 19

death rate
(000)
birth rate
(000)
growth
rate (%)
total
population
(000)
No
female male
Peru 74.48 70.55 5.93 19.41 1.03 29248.9 176
Suriname 77.16 71.47 5.54 16.42 1.09 492.0 177
Uruguay 79.46 73.07 9.58 13.52 0.23 3308.5 178
Venezuela 77.17 70.84 5.17 20.10 1.49 27635.7 179
Australia 84.35 79.40 6.88 12.33 1.15 21766.7 180
Fiji 74.03 68.73 5.90 21.11 0.80 883.1 181
Kiribati 66.88 62.03 7.40 22.73 1.25 100.7 182
Marshall Islands 73.95 69.67 4.38 29.11 1.95 67.2 183
Micronesia 73.55 69.58 4.35 22.22 -0.31 106.8 184
Nauru 68.75 61.27 6.11 27.78 0.61 9.3 185
New Zealand 82.67 78.61 7.15 13.68 0.88 4290.3 186
Palau 75.12 68.63 7.87 10.74 0.36 21.0 187
Papua New Guinea 68.56 64.02 6.58 26.44 1.99 6187.6 188
Samoa 75.39 69.55 5.34 22.50 0.60 193.2 189
Solomon Islands 76.89 71.60 3.93 28.03 2.22 571.9 190
Tonga 76.58 73.79 4.90 25.27 0.24 105.9 191
Tuvalu 66.90 62.70 9.20 23.24 0.70 10.5 192
Vanuatu 66.44 63.04 7.43 20.86 1.34 224.6 193
Note: Net migration is include in growth rate.
Source: Google, internet site, World factbook, 2011 -12
Country
Life expectancy at
birth
Table 2-7:Major Demographic Indicators countd
Afghanistan Statistical Yearbook 2011-12 20


![content.alfred.com · B 4fr C#m 4fr G#m 4fr E 6fr D#sus4 6fr D# q = 121 Synth. Bass arr. for Guitar [B] 2 2 2 2 2 2 2 2 2 2 2 2 2 2 2 2 2 2 2 2 2 2 2 2 2 2 2 2 2 2 2 2 5](https://img.pdfslide.us/doc/110x75/5e81a9850b29a074de117025/b-4fr-cm-4fr-gm-4fr-e-6fr-dsus4-6fr-d-q-121-synth-bass-arr-for-guitar-b.jpg)