Embed Size (px)
Citation preview
Executive Summary
BUILDING MASS HOUSING IN INDIA
January 2014
CITY 2.0
clytics community + analytics
AFFORDABLE HOMES

Executive Summary
cytics iii
CITY 2.0 is our commitment to urbanization in emerging markets. We believe
technology data and innovation can be used to create disruptive solutions for
providing access to basic services. With a focus on housing, energy and
livelihood, CITY 2.0 integrates economics, operation research, and finance to
create insights into these sectors. We work with our partners to create and
support market based interventions.
At clytics we put our faith behind what you measure you can improve. We are
creating the next generation of knowledge platform to support decisions with
data.
clytics community + analytics
Affordable Homes Building mass housing in India
clytics iv
Contents
List of Exhibits v
List of Boxes v
Executive Summary vii
Turning Deficit into an Opportunity 1
Sizing the demand side 1
Locating growth 7
Overview of the supply side 9
Mass Manufacturing 12
Tightrope between affordability and aspiration 15
Building fast and building right 17
Banking on the right platform 21
Measuring up 24
Handholding a nascent market 26
Rebooting an Industry 29
Housing finance: enabling Aspirations 30
The Supporting Industry 31
Note on Methodology 34
Forecasting Population 34
Estimating Urbanization 34
Explaining the housing supply 36
Appendix A: Shifting power centers 39
Appendix B: Rural Urban Population Distribution 40
Appendix C: Glossary of terms 41
Executive Summary
v CITY 2.0
List of Exhibits
EXHIBIT 1 DEMAND CURVE VII
EXHIBIT 2 NATURE OF THE DEFICIT VIII
EXHIBIT 3 BATCH PRODUCTION IX
EXHIBIT 4 GETTING TO FLOW X
EXHIBIT 5 CONSTRUCTING AN ASSEMBLY LINE XI
EXHIBIT 6 LOW COST HOUSING OPPORTUNITY 2
EXHIBIT 7 ANNUAL DEMAND SUPPLY GAP 3
EXHIBIT 8 DISTRIBUTION OF DEFICIT ACROSS INCOME CLASS 4
EXHIBIT 9 SOURCES OF FINANCE FOR CONSTRUCTION OF A ‘PUKKA’ HOUSE 5
EXHIBIT 10 DISBURSEMENTS TO THE AFFORDABLE SEGMENT 2011-12 6
EXHIBIT 11 WHERE WILL THE URBAN GROWTH TAKE PLACE 7
EXHIBIT 12 EVOLUTION OF INDIAN CITIES 8
EXHIBIT 13 AFFORDABLE MARKET 9
EXHIBIT 14 EVOLVING BUSINESS MODEL 10
EXHIBIT 15 TRANSFORMATION OF THE OPERATING MODEL 13
EXHIBIT 16 OVERCOMING THE INCUMBENT INERTIA 14
EXHIBIT 17 DESIGNING THE AFFORDABLE HOUSE 15
EXHIBIT 18 BALANCING FSI AND CONSTRUCTION COSTS 16
EXHIBIT 19 CONSTRUCTING AN ASSEMBLY LINE 18
EXHIBIT 20 BATCH PRODUCTION 19
EXHIBIT 21 FLOW WITH SPIRAL 20
EXHIBIT 22 CHOOSING THE PLATFORM 22
EXHIBIT 23 SHIFTING DEMAND 24
EXHIBIT 24 APPROVAL TIMELINES 25
EXHIBIT 25 AUTOMATING THE WORKFLOW 26
EXHIBIT 26 RATIONAL FSI DENSIFICATION 27
EXHIBIT 27 STANDARDIZATION OF THE PROTOTYPES 29
EXHIBIT 28 EVOLUTION OF CONSTRUCTION PLATFORM IN INDIA 31
EXHIBIT 29 URBAN RURAL GROWTH RATE DIFFERENCE INDIA AND MAJOR STATES 34
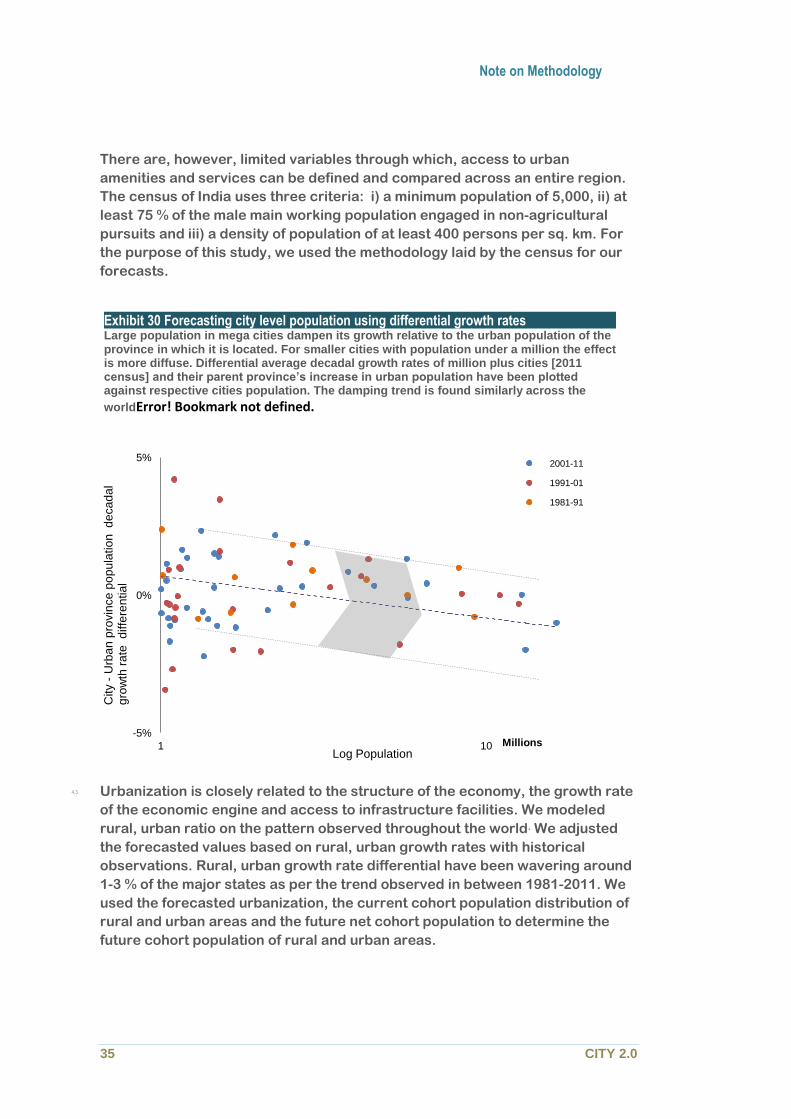
EXHIBIT 30 FORECASTING CITY LEVEL POPULATION USING DIFFERENTIAL GROWTH RATES 35
EXHIBIT 31 SIZE OF AFFORDABLE HOUSING OPPORTUNITY 36
List of Boxes
BOX 1 DELIVERY AND ACCESS TO FINANCE 5
BOX 2 GROWTH BEYOND SUPER-CITIES 8
BOX 3 MANUFACTURING HOUSES AND LEAN PARADIGM 19

Affordable Homes Building mass housing in India
clytics vi
Executive Summary
vii CITY 2.0
Executive Summary
Turning deficit into an opportunity
India has a deficit of 18 million houses in the urban areas. About 70% of which is
accounted by the bottom two quintile of the income pyramid, households with
income less than 5,000 Rs a month. Close to 800 households get added every day
to the 14 million families forced to live in the slums of urban India. 80% of the
housing deficit is accounted by congestion; large families are forced to live in small
tenements. On a business as usual scenario the housing deficit will rise annually by
half a million to about 40 million in 2051.
This report estimates that low cost housing has a business potential of 600 Bn US$
over the next two decades. However, unlocking this value requires surmounting
several constraints. Primary component, land is a scarce resource in Indian cities,
as a consequence of both topography and policy. Delay in getting approval for
construction can inflate the price of the land by 50% – 100%. Consequently the
mainstay industry has chosen to focus on the top quintile of the income pyramid.
The government has always accorded the importance of priority sector to housing.
Its role has shifted from a supplier to an enabler. In the mid 80’s it became clear
that the pace of the housing supply is unable to match that of population growth.
National housing Board was formed in 1988. However, private sector interest in the
low cost housing space remains muted till mid 2005. In an inefficient market
SU
BS
IDY
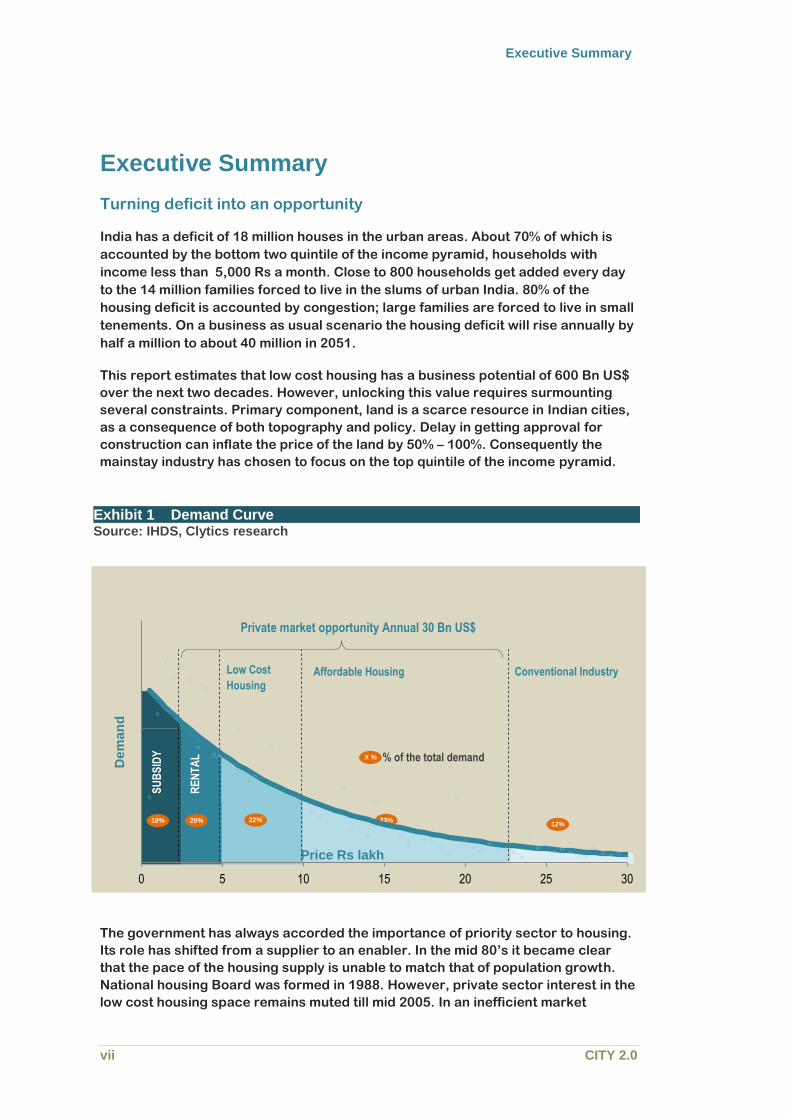
Exhibit 1 Demand Curve Source: IHDS, Clytics research
Private market opportunity Annual 30 Bn US$
% of the total demand
Low Cost
Housing
Dem
an
d
Conventional Industry
SU
BS
IDY
Affordable Housing
18% 25% 22% 23% 12%
RE
NT
AL
X %
Price Rs lakh
0 5 10 15 20 25 30
Affordable Homes Building mass housing in India
clytics viii
developers held on to the land banks to allow price appreciation and released the
supply into the market as premium units. Post financial crisis; crunch on the money
supply led to a correction in the industry. Speculative land assets, stressed
balance sheets and forced a rewiring in the operating model. Notwithstanding a
small start, a few successful projects in the low cost housing space and a huge
pent up demand, evokes curiosity in the industry.
Most of the low cost housing projects have come up in peri and suburban regions
on account of high land prices within the city precinct. Developers have financed
the land using equity. Close to 100,000 units, sized 25 – 60 m2 built up area priced
between 5 – 20 lakh, have been delivered till date. The sales off take has been
promising and construction was initiated post a sale deed had been signed, leading
to a low working capital requirement.
Mass Manufacturing
Context of operations in the low cost housing is different compared to the
conventional industry. Low operating margins, faster turnaround, low asset base
and a lean organization is the philosophy behind affordable housing.
Developers have followed three approaches for designing a low cost home. First,
they have adopted a smaller format 1 BHK and studio. Second projects carried
basic amenities, finishes and fittings. Lastly configurations, layouts and process
were standardized across the project.
Streamlining project management, which typically accounts for 75% of the low cost
project value and about 80% of the project duration, becomes a key challenge for
low cost housing. Period costs can comprise upwards of 25% of a projects topline.
While conventional construction is carried using large batches (see Box
Manufacturing Houses) we can re-engineer it to create a pull based process.
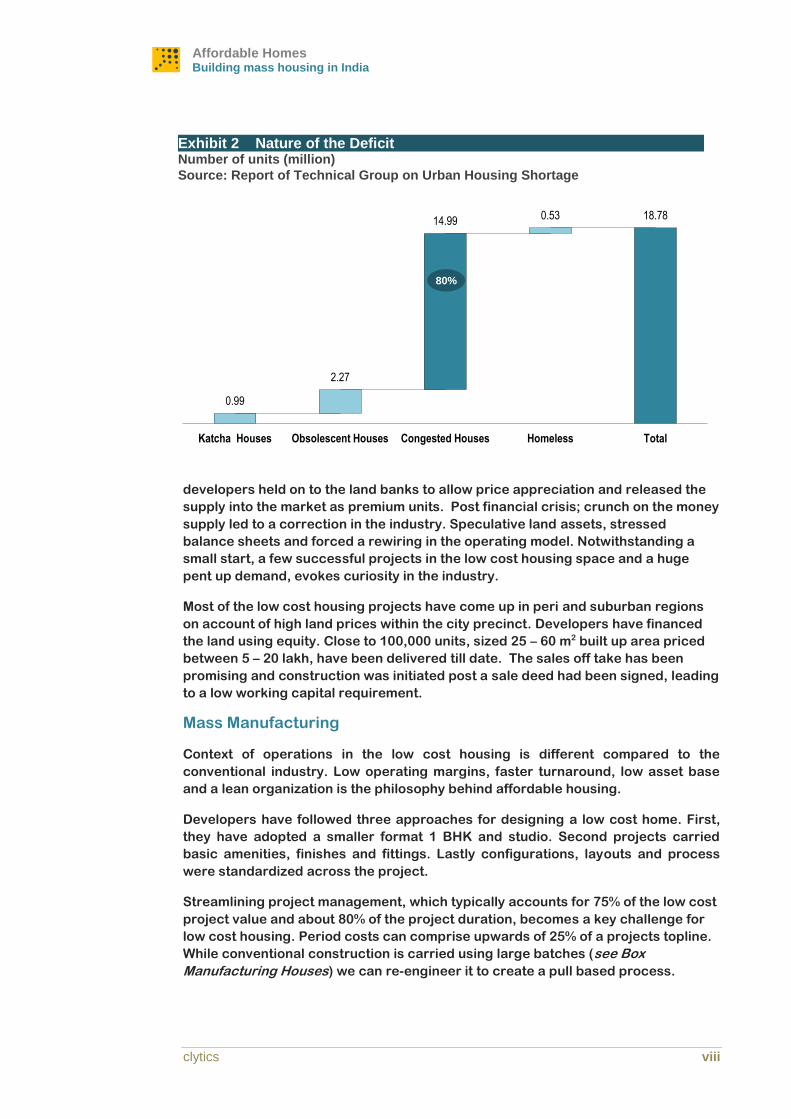
0.99
2.27
14.99 0.53 18.78
Katcha Houses Obsolescent Houses Congested Houses Homeless Total
Exhibit 2 Nature of the Deficit Number of units (million)
Source: Report of Technical Group on Urban Housing Shortage
80%
Executive Summary
ix CITY 2.0
Box Manufacturing Houses
There are striking similarities between the mass market automobile and the affordable housing sector. The paradigm extends into the operations as well. Standardizing the product over the last century has enabled vehicle manufacturers to reduce cost, reach a wider consumer base, and achieve consistent quality benchmarks. On the shop floor production managers migrated to a single piece flow. It gave insight into hidden wastage within the system and allowed repeated course correction of the process. In the next five decades many approaches of mass manufacturing would find their way into low cost housing segment.
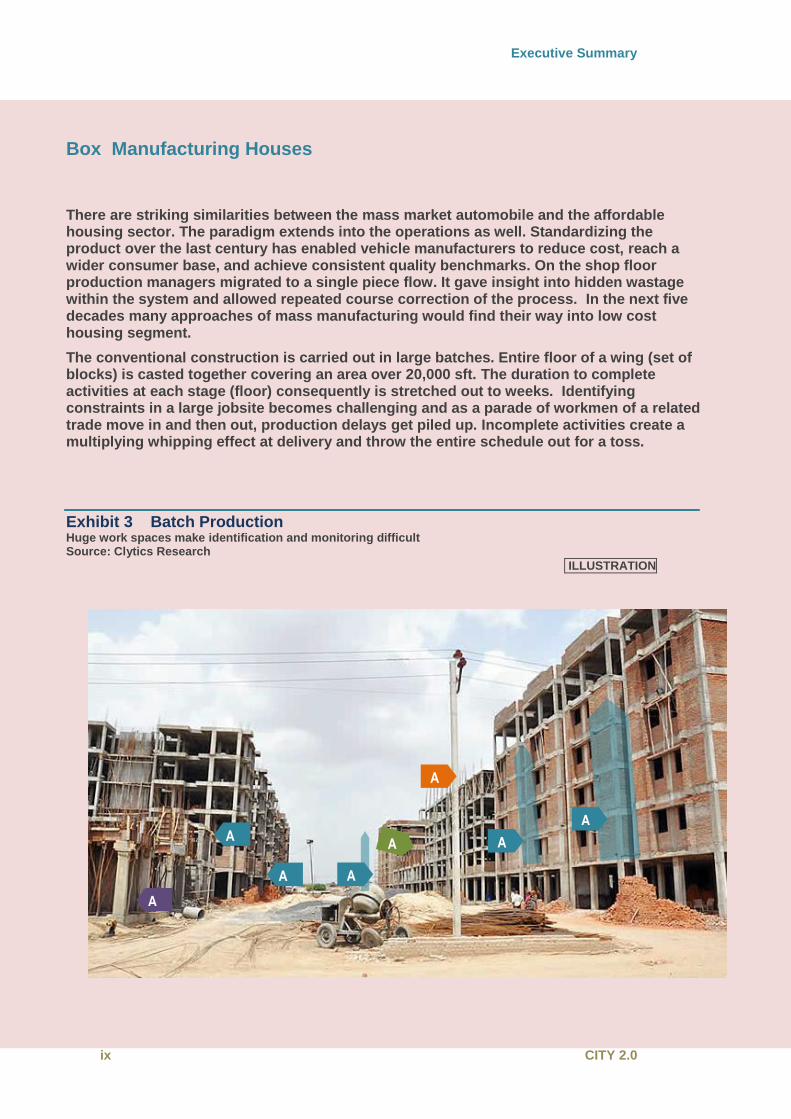
The conventional construction is carried out in large batches. Entire floor of a wing (set of blocks) is casted together covering an area over 20,000 sft. The duration to complete activities at each stage (floor) consequently is stretched out to weeks. Identifying constraints in a large jobsite becomes challenging and as a parade of workmen of a related trade move in and then out, production delays get piled up. Incomplete activities create a multiplying whipping effect at delivery and throw the entire schedule out for a toss.
Exhibit 3 Batch Production Huge work spaces make identification and monitoring difficult Source: Clytics Research
ILLUSTRATION
A
4
A
4
A
4
A
4
A
4
A
3
A
2
A
1
Affordable Homes Building mass housing in India
clytics x
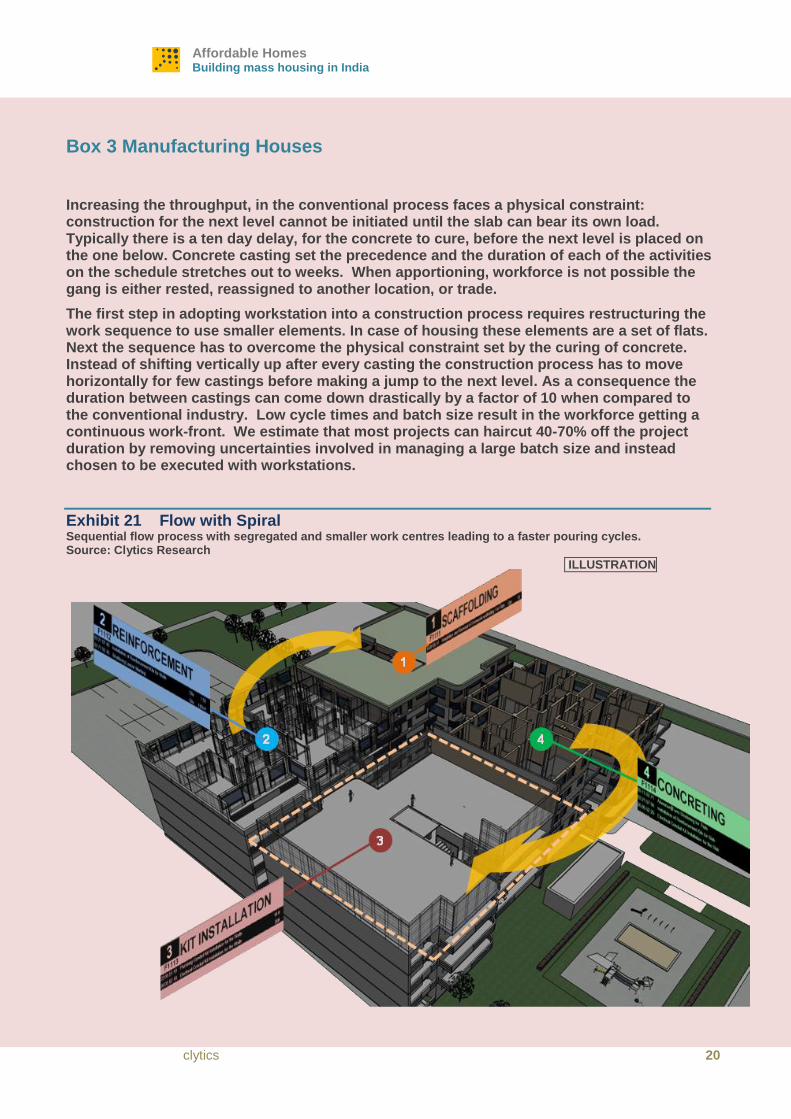
Box 3 Manufacturing Houses
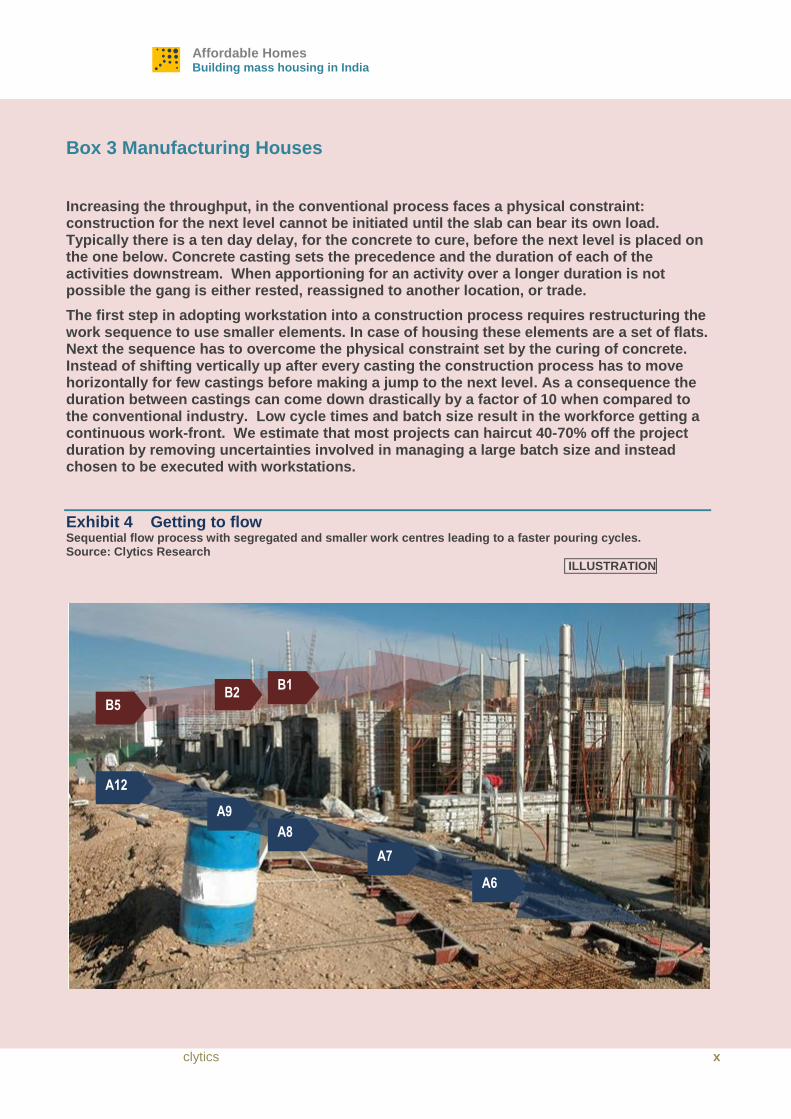
Increasing the throughput, in the conventional process faces a physical constraint: construction for the next level cannot be initiated until the slab can bear its own load. Typically there is a ten day delay, for the concrete to cure, before the next level is placed on the one below. Concrete casting sets the precedence and the duration of each of the activities downstream. When apportioning for an activity over a longer duration is not possible the gang is either rested, reassigned to another location, or trade.
The first step in adopting workstation into a construction process requires restructuring the work sequence to use smaller elements. In case of housing these elements are a set of flats. Next the sequence has to overcome the physical constraint set by the curing of concrete. Instead of shifting vertically up after every casting the construction process has to move horizontally for few castings before making a jump to the next level. As a consequence the duration between castings can come down drastically by a factor of 10 when compared to the conventional industry. Low cycle times and batch size result in the workforce getting a continuous work-front. We estimate that most projects can haircut 40-70% off the project duration by removing uncertainties involved in managing a large batch size and instead chosen to be executed with workstations.
Exhibit 4 Getting to flow Sequential flow process with segregated and smaller work centres leading to a faster pouring cycles. Source: Clytics Research
IILLUSTRATION
B1 B2
B5
A6
A7
A8
A12
A9
Executive Summary
xi CITY 2.0
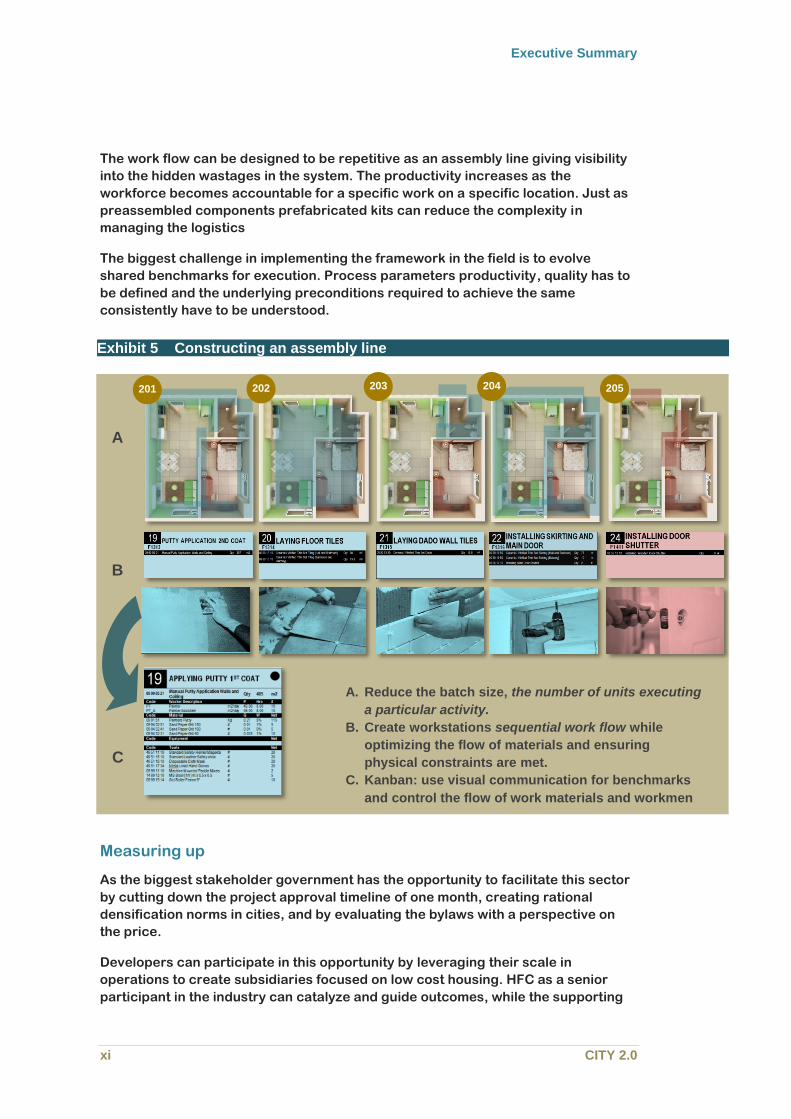
The work flow can be designed to be repetitive as an assembly line giving visibility
into the hidden wastages in the system. The productivity increases as the
workforce becomes accountable for a specific work on a specific location. Just as
preassembled components prefabricated kits can reduce the complexity in
managing the logistics
The biggest challenge in implementing the framework in the field is to evolve
shared benchmarks for execution. Process parameters productivity, quality has to
be defined and the underlying preconditions required to achieve the same
consistently have to be understood.
Measuring up
As the biggest stakeholder government has the opportunity to facilitate this sector
by cutting down the project approval timeline of one month, creating rational
densification norms in cities, and by evaluating the bylaws with a perspective on
the price.
Developers can participate in this opportunity by leveraging their scale in
operations to create subsidiaries focused on low cost housing. HFC as a senior
participant in the industry can catalyze and guide outcomes, while the supporting
Exhibit 5 Constructing an assembly line
201 202 203 204 205
B
A
C
A. Reduce the batch size, the number of units executing
a particular activity.
B. Create workstations sequential work flow while
optimizing the flow of materials and ensuring
physical constraints are met.
C. Kanban: use visual communication for benchmarks
and control the flow of work materials and workmen
Affordable Homes Building mass housing in India
clytics xii
industry of Equipment manufacturers and raw material providers could use this
opportunity to create new products for a new operating model.
Turning Deficit into an Opportunity
1 CITY 2.0
1. Turning Deficit into an
Opportunity
Housing, one of the primary necessities, opens the doorway of access to other
services including sanitation, security, financial inclusion, education, and
public health care.
India has a deficit of 18 million houses in the urban areas. About 70% of the
current deficit is accounted by the bottom two quintile of the income pyramid:
households with income less than 5,000 Rs a month.
To contain the backlog and balance the demand which is posed to be
generated over the next 20 years India has to produce on an average 8500 low
cost houses every day over the next two decades. Over 1.2 million highly
skilled masons, carpenters, welders; about half a million semi skilled workers,
besides over a lakh foreman, 25,000 engineers and project managers will be
will be directly involved and about twice the number supporting the execution.
Affordable housing will require ambitious investments to the tune of 30 Bn US$
annually. It has a potential to increase the mortgage to GDP ratio from 10%
currently, to 20% at the end of the decade. It can raise the national income by a
percentage point.
1.1. In this section we take a stock of the levers driving the demand and supply of
affordable housing. We take an overview of the housing finance sector and
evaluate its robustness to scale up in the next decade. We try to provide
answers where the future urban growth is likely to take place. Finally, we take a
stock of the affordable housing supply from a nascent industry.
1.2. In the next section we make a case for industrialization of construction and its
implication in affordable housing. We analyze how organizational structure
and core capabilities are changing as a response. We evaluate the approach
taken to design and to construct low cost homes. The final section of this report
explores the gaps in the market and presents a roadmap for scaling up.
Sizing the demand side
1.3. Every day about 800 households migrate and end up living in a slum in urban
India. More than a fifth of the population of Indian cities is unable to participate
in the formal housing markets. The price of the cheapest home in the market
today is still unaffordable for 18% of the urban households. However the
opportunity represented by households which may not be affluent and are not
Definitions: 1 lakh = 100,000 1 Crore = 10 Million 1US$ = 62 Rs 1 m2 = 10.76 sft
Affordable Homes Building mass housing in India
clytics 2
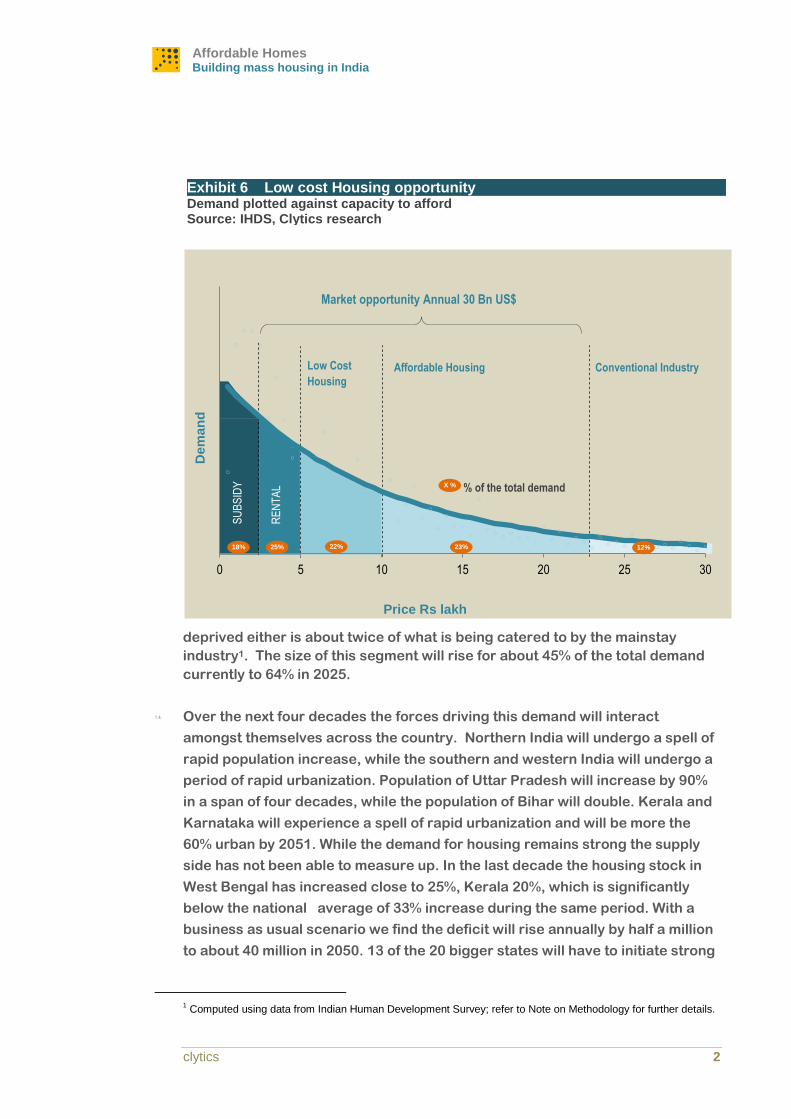
deprived either is about twice of what is being catered to by the mainstay
industry1. The size of this segment will rise for about 45% of the total demand
currently to 64% in 2025.
1.4. Over the next four decades the forces driving this demand will interact
amongst themselves across the country. Northern India will undergo a spell of
rapid population increase, while the southern and western India will undergo a
period of rapid urbanization. Population of Uttar Pradesh will increase by 90%
in a span of four decades, while the population of Bihar will double. Kerala and
Karnataka will experience a spell of rapid urbanization and will be more the
60% urban by 2051. While the demand for housing remains strong the supply
side has not been able to measure up. In the last decade the housing stock in
West Bengal has increased close to 25%, Kerala 20%, which is significantly
below the national average of 33% increase during the same period. With a
business as usual scenario we find the deficit will rise annually by half a million
to about 40 million in 2050. 13 of the 20 bigger states will have to initiate strong
1 Computed using data from Indian Human Development Survey; refer to Note on Methodology for further details.
Exhibit 6 Low cost Housing opportunity Demand plotted against capacity to afford Source: IHDS, Clytics research
X %
Market opportunity Annual 30 Bn US$
% of the total demand
Low Cost
Housing
Dem
an
d
Conventional Industry
SU
BS
IDY
Affordable Housing
RE
NT
AL
Price Rs lakh
0 5 10 15 20 25 30
18% 25% 22% 23% 12%
Turning Deficit into an Opportunity
3 CITY 2.0
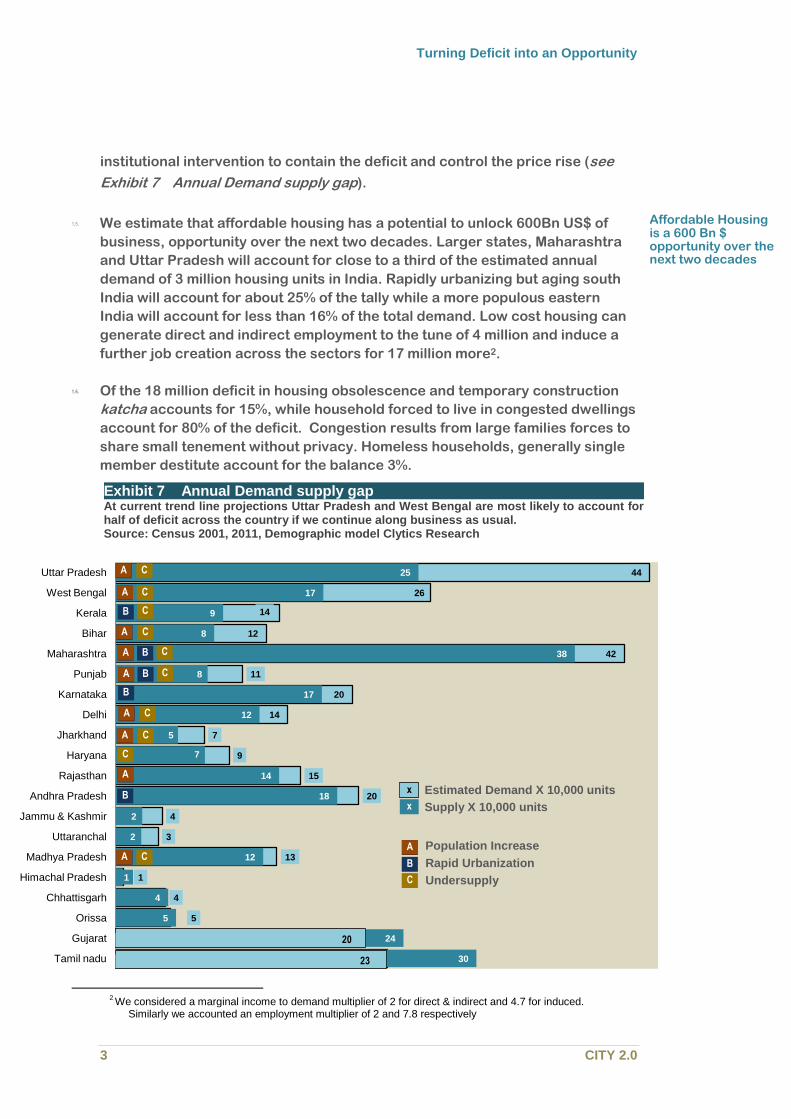
institutional intervention to contain the deficit and control the price rise (see
Exhibit 7 Annual Demand supply gap).
1.5. We estimate that affordable housing has a potential to unlock 600Bn US$ of
business, opportunity over the next two decades. Larger states, Maharashtra
and Uttar Pradesh will account for close to a third of the estimated annual
demand of 3 million housing units in India. Rapidly urbanizing but aging south
India will account for about 25% of the tally while a more populous eastern
India will account for less than 16% of the total demand. Low cost housing can
generate direct and indirect employment to the tune of 4 million and induce a
further job creation across the sectors for 17 million more2.
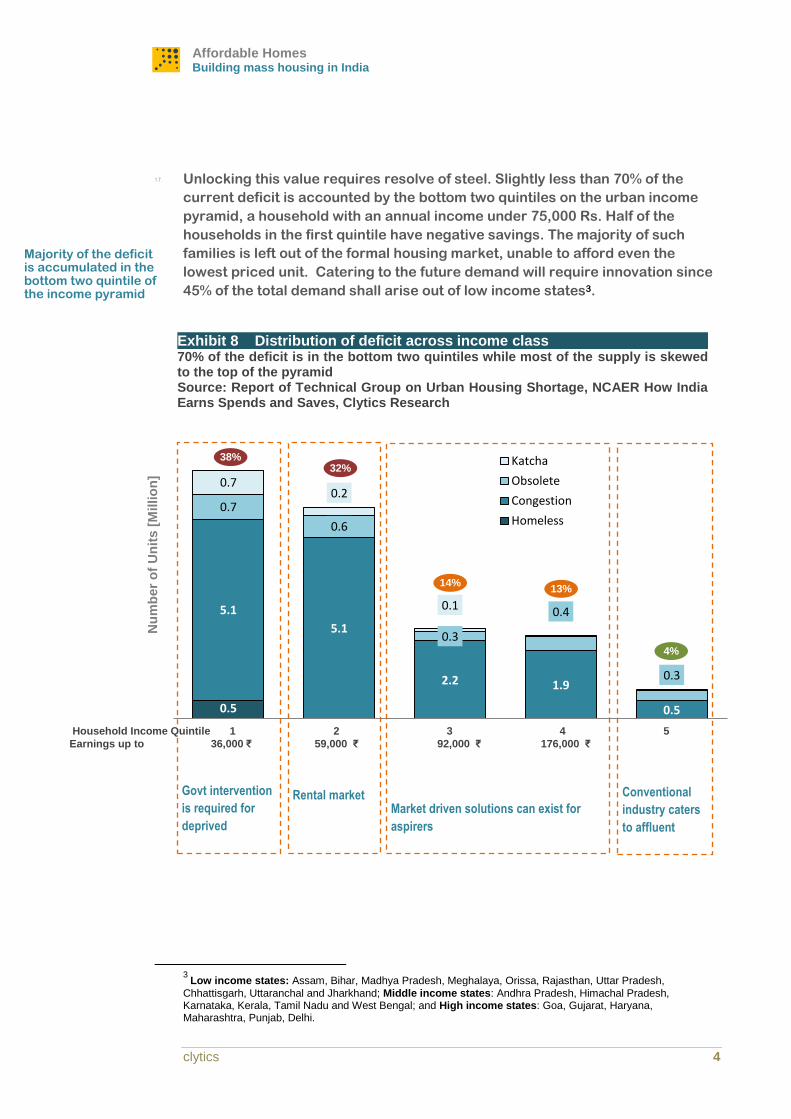
1.6. Of the 18 million deficit in housing obsolescence and temporary construction
katcha accounts for 15%, while household forced to live in congested dwellings
account for 80% of the deficit. Congestion results from large families forces to
share small tenement without privacy. Homeless households, generally single
member destitute account for the balance 3%.
2 We considered a marginal income to demand multiplier of 2 for direct & indirect and 4.7 for induced.
Similarly we accounted an employment multiplier of 2 and 7.8 respectively
23
20
5
4
1
13
3
4
20
15
9
7
14
20
11
42
12
14
26
44
30
24
5
4
1
12
2
2
18
14
7
5
12
17
8
38
8
9
17
25
Tamil nadu
Gujarat
Orissa
Chhattisgarh
Himachal Pradesh
Madhya Pradesh
Uttaranchal
Jammu & Kashmir
Andhra Pradesh
Rajasthan
Haryana
Jharkhand
Delhi
Karnataka
Punjab
Maharashtra
Bihar
Kerala
West Bengal
Uttar Pradesh
Affordable Housing is a 600 Bn $ opportunity over the next two decades
Exhibit 7 Annual Demand supply gap At current trend line projections Uttar Pradesh and West Bengal are most likely to account for half of deficit across the country if we continue along business as usual. Source: Census 2001, 2011, Demographic model Clytics Research
A C
A C
B C
A C
B C A
B C A
B
A C
A C
C
A
B
A C Population Increase
Rapid Urbanization
Undersupply
B
A
C
Estimated Demand X 10,000 units
Supply X 10,000 units x
x
20
23
Affordable Homes Building mass housing in India
clytics 4
1.7. Unlocking this value requires resolve of steel. Slightly less than 70% of the
current deficit is accounted by the bottom two quintiles on the urban income
pyramid, a household with an annual income under 75,000 Rs. Half of the
households in the first quintile have negative savings. The majority of such
families is left out of the formal housing market, unable to afford even the
lowest priced unit. Catering to the future demand will require innovation since
45% of the total demand shall arise out of low income states3.
3
Low income states: Assam, Bihar, Madhya Pradesh, Meghalaya, Orissa, Rajasthan, Uttar Pradesh,
Chhattisgarh, Uttaranchal and Jharkhand; Middle income states: Andhra Pradesh, Himachal Pradesh, Karnataka, Kerala, Tamil Nadu and West Bengal; and High income states: Goa, Gujarat, Haryana, Maharashtra, Punjab, Delhi.
0.5
5.1
5.1
2.2 1.9
0.5
0.7
0.6
0.3
0.4
0.3
0.7 0.2
0.1
Nu
mb
er
of
Un
its [
Millio
n]
Katcha
Obsolete
Congestion
Homeless
Majority of the deficit is accumulated in the bottom two quintile of the income pyramid
Exhibit 8 Distribution of deficit across income class 70% of the deficit is in the bottom two quintiles while most of the supply is skewed to the top of the pyramid Source: Report of Technical Group on Urban Housing Shortage, NCAER How India Earns Spends and Saves, Clytics Research
Market driven solutions can exist for
aspirers
Govt intervention
is required for
deprived
Rental market
Conventional
industry caters
to affluent
38% 32%
14% 13%
4%
Household Income Quintile 1 2 3 4 5 Earnings up to 36,000 ₹ 59,000 ₹ 92,000 ₹ 176,000 ₹
Turning Deficit into an Opportunity
5 CITY 2.0
Box 1 Delivery and access to finance
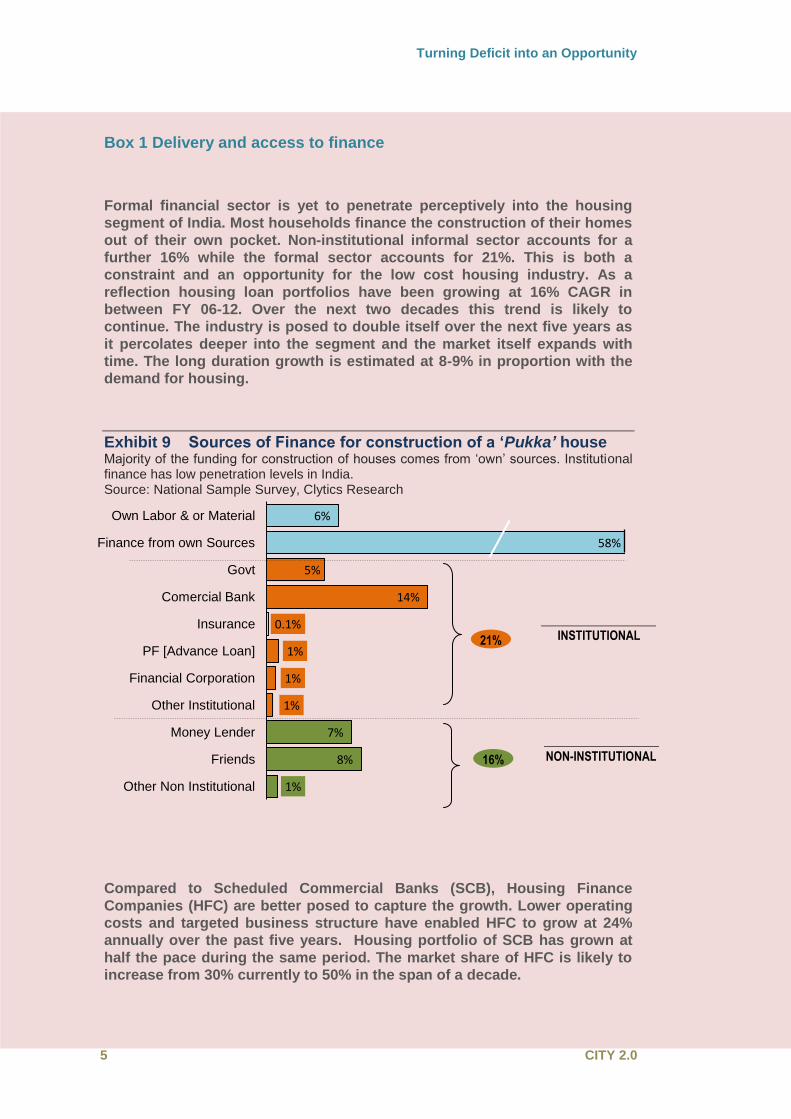
Formal financial sector is yet to penetrate perceptively into the housing
segment of India. Most households finance the construction of their homes
out of their own pocket. Non-institutional informal sector accounts for a
further 16% while the formal sector accounts for 21%. This is both a
constraint and an opportunity for the low cost housing industry. As a
reflection housing loan portfolios have been growing at 16% CAGR in
between FY 06-12. Over the next two decades this trend is likely to
continue. The industry is posed to double itself over the next five years as
it percolates deeper into the segment and the market itself expands with
time. The long duration growth is estimated at 8-9% in proportion with the
demand for housing.
Exhibit 9 Sources of Finance for construction of a ‘Pukka’ house Majority of the funding for construction of houses comes from ‘own’ sources. Institutional finance has low penetration levels in India. Source: National Sample Survey, Clytics Research
Compared to Scheduled Commercial Banks (SCB), Housing Finance
Companies (HFC) are better posed to capture the growth. Lower operating
costs and targeted business structure have enabled HFC to grow at 24%
annually over the past five years. Housing portfolio of SCB has grown at
half the pace during the same period. The market share of HFC is likely to
increase from 30% currently to 50% in the span of a decade.
6%
58%
5%
14%
0.1%
1%
1%
1%
7%
8%
1%
Own Labor & or Material
Finance from own Sources
Govt
Comercial Bank
Insurance
PF [Advance Loan]
Financial Corporation
Other Institutional
Money Lender
Friends
Other Non Institutional
16% NON-INSTITUTIONAL
21% INSTITUTIONAL
Affordable Homes Building mass housing in India
clytics 6
Box 1 Delivery and access to finance
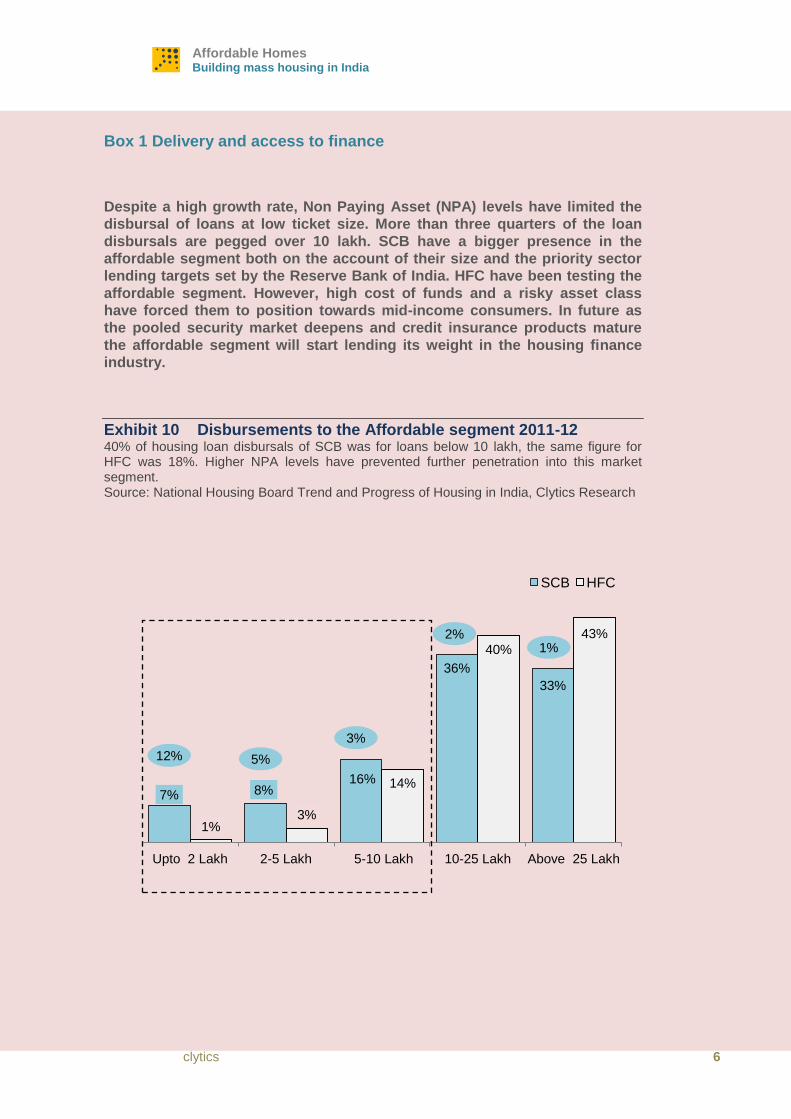
Despite a high growth rate, Non Paying Asset (NPA) levels have limited the
disbursal of loans at low ticket size. More than three quarters of the loan
disbursals are pegged over 10 lakh. SCB have a bigger presence in the
affordable segment both on the account of their size and the priority sector
lending targets set by the Reserve Bank of India. HFC have been testing the
affordable segment. However, high cost of funds and a risky asset class
have forced them to position towards mid-income consumers. In future as
the pooled security market deepens and credit insurance products mature
the affordable segment will start lending its weight in the housing finance
industry.
Exhibit 10 Disbursements to the Affordable segment 2011-12 40% of housing loan disbursals of SCB was for loans below 10 lakh, the same figure for HFC was 18%. Higher NPA levels have prevented further penetration into this market segment. Source: National Housing Board Trend and Progress of Housing in India, Clytics Research
7% 8% 16%
36%
33%
1% 3%
14%
40%
43%
Upto 2 Lakh 2-5 Lakh 5-10 Lakh 10-25 Lakh Above 25 Lakh
SCB HFC
5%
3%
2% 1%
12%
Turning Deficit into an Opportunity
7 CITY 2.0
Locating growth
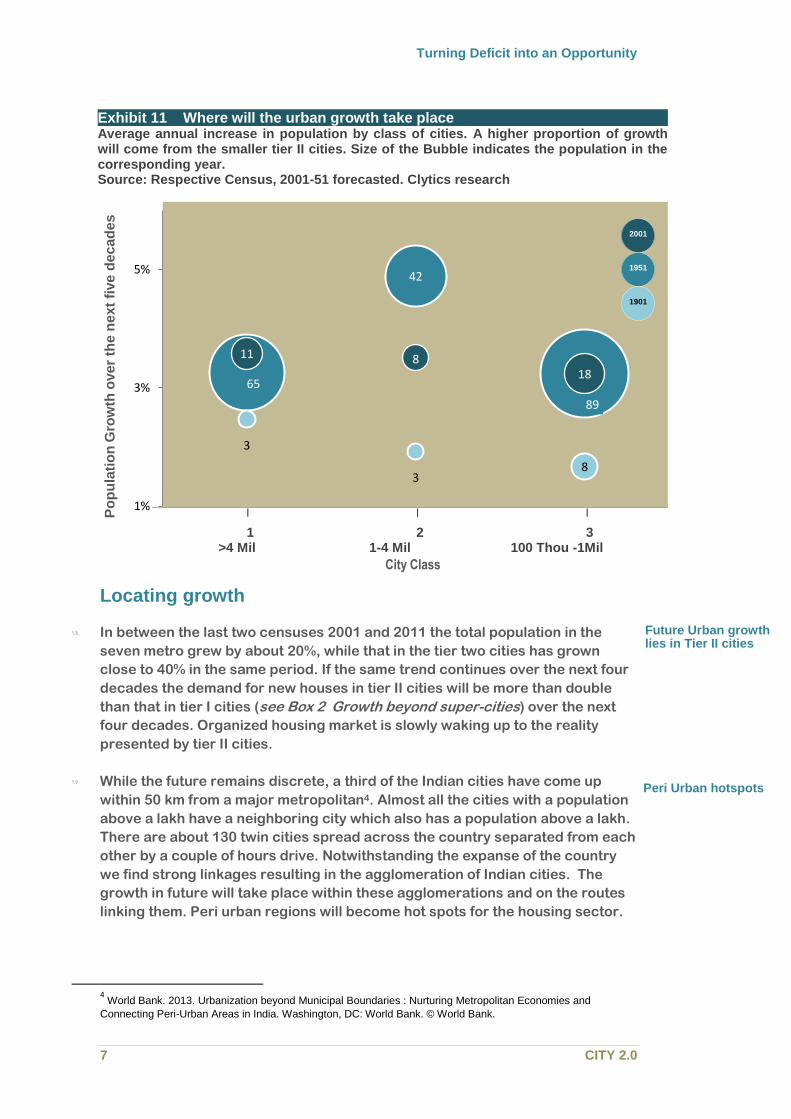
1.8. In between the last two censuses 2001 and 2011 the total population in the
seven metro grew by about 20%, while that in the tier two cities has grown
close to 40% in the same period. If the same trend continues over the next four
decades the demand for new houses in tier II cities will be more than double
than that in tier I cities (see Box 2 Growth beyond super-cities) over the next
four decades. Organized housing market is slowly waking up to the reality
presented by tier II cities.
1.9. While the future remains discrete, a third of the Indian cities have come up
within 50 km from a major metropolitan4. Almost all the cities with a population
above a lakh have a neighboring city which also has a population above a lakh.
There are about 130 twin cities spread across the country separated from each
other by a couple of hours drive. Notwithstanding the expanse of the country
we find strong linkages resulting in the agglomeration of Indian cities. The
growth in future will take place within these agglomerations and on the routes
linking them. Peri urban regions will become hot spots for the housing sector.
4 World Bank. 2013. Urbanization beyond Municipal Boundaries : Nurturing Metropolitan Economies and
Connecting Peri-Urban Areas in India. Washington, DC: World Bank. © World Bank.
65
42
89
11 8 18
3
3 8
1%
3%
5%
Po
pu
lati
on
Gro
wth
ove
r th
e n
ex
t fi
ve
de
ca
de
s
City Class
| | |
1 2 3 >4 Mil 1-4 Mil 100 Thou -1Mil
Exhibit 11 Where will the urban growth take place Average annual increase in population by class of cities. A higher proportion of growth will come from the smaller tier II cities. Size of the Bubble indicates the population in the corresponding year. Source: Respective Census, 2001-51 forecasted. Clytics research
Future Urban growth lies in Tier II cities
Peri Urban hotspots
2001
1951
1901
Affordable Homes Building mass housing in India
clytics 8
`
Box 2 Growth beyond super-cities
`
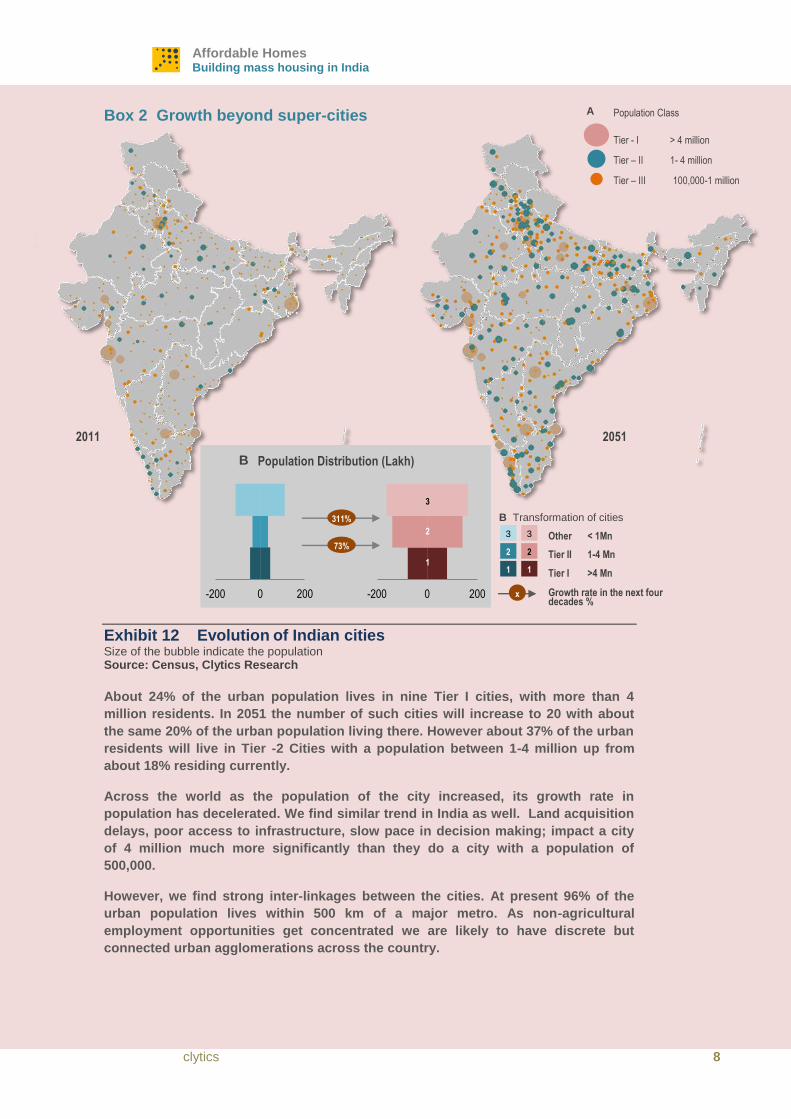
Exhibit 12 Evolution of Indian cities
Size of the bubble indicate the population Source: Census, Clytics Research
About 24% of the urban population lives in nine Tier I cities, with more than 4
million residents. In 2051 the number of such cities will increase to 20 with about
the same 20% of the urban population living there. However about 37% of the urban
residents will live in Tier -2 Cities with a population between 1-4 million up from
about 18% residing currently.
Across the world as the population of the city increased, its growth rate in
population has decelerated. We find similar trend in India as well. Land acquisition
delays, poor access to infrastructure, slow pace in decision making; impact a city
of 4 million much more significantly than they do a city with a population of
500,000.
However, we find strong inter-linkages between the cities. At present 96% of the
urban population lives within 500 km of a major metro. As non-agricultural
employment opportunities get concentrated we are likely to have discrete but
connected urban agglomerations across the country.
Population Distribution (Lakh)
311%
73%
B
-200 0 200
2
1
3
-200 0 200
2011 2051
Population Class
Tier - I > 4 million
Tier – II 1- 4 million
Tier – III 100,000-1 million
A
Other < 1Mn
Tier II 1-4 Mn
Tier I >4 Mn
Growth rate in the next four decades %
B Transformation of cities
x
1
3
1
3
2 2
Turning Deficit into an Opportunity
9 CITY 2.0
Overview of the supply side
1.10. Government of India has held low cost housing as a priority sector since
independence. Initially, the five year plans were crafted to give financial
assistance. Consequently, state housing boards were set up to modulate the
supply. From the late 70’s it became clear that the pace of addition of housing
stock was not measuring up to the demand generated by population growth.
HUDCO and HDFC were established to provide retail and commercial loan to
the sector. In the mid 80’s, policy reverted and the government stepped out of
the role as a supplier to assume the responsibility of an enabler with the
formation of the National Housing Bank in 1988. Private sector participation in
the low cost housing remained muted till 2005. Developers had acquired
speculative land assets and positioned themselves in the premium segment. In
the aftermath of the financial crisis speculative assets strained balance sheets.
Facing a liquidity crisis the industry looked has started looking at alternatives.
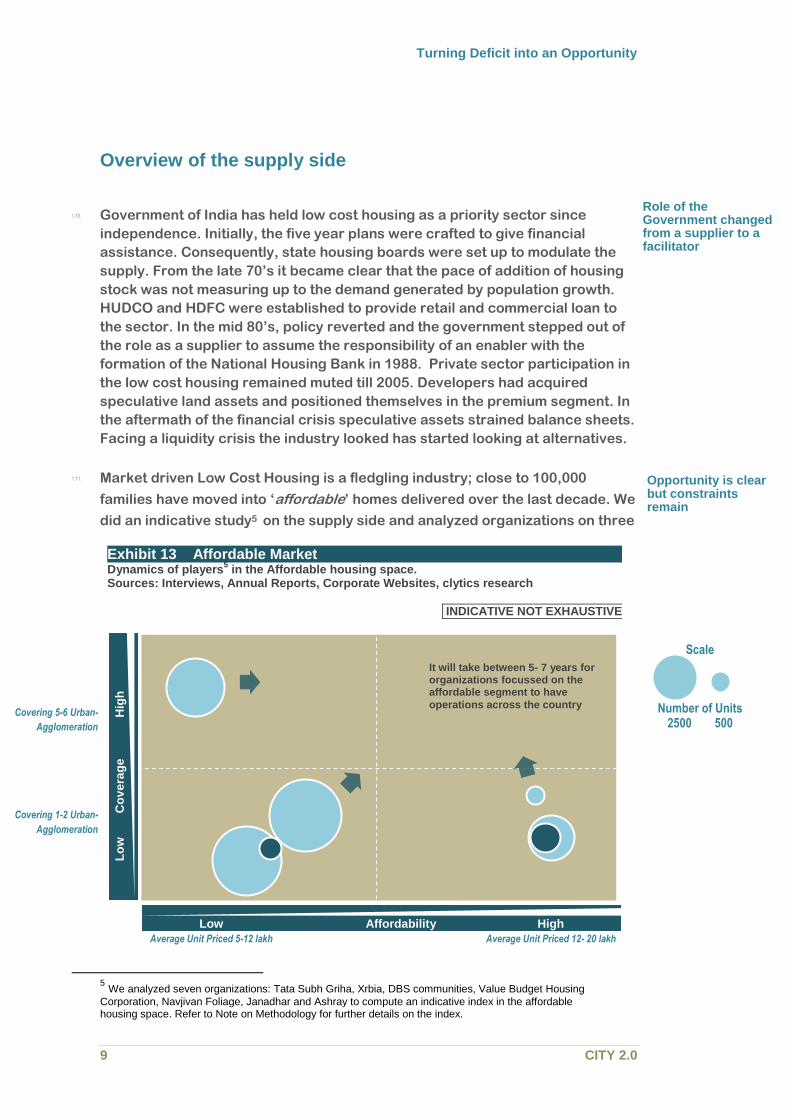
1.11. Market driven Low Cost Housing is a fledgling industry; close to 100,000
families have moved into ‘affordable’ homes delivered over the last decade. We
did an indicative study5 on the supply side and analyzed organizations on three
5 We analyzed seven organizations: Tata Subh Griha, Xrbia, DBS communities, Value Budget Housing
Corporation, Navjivan Foliage, Janadhar and Ashray to compute an indicative index in the affordable housing space. Refer to Note on Methodology for further details on the index.
Affordability
Opportunity is clear but constraints remain
Role of the Government changed from a supplier to a facilitator
It will take between 5- 7 years for organizations focussed on the affordable segment to have
operations across the country
Exhibit 13 Affordable Market Dynamics of players
5 in the Affordable housing space.
Sources: Interviews, Annual Reports, Corporate Websites, clytics research
IINDICATIVE NOT EXHAUSTIVE
High
Average Unit Priced 12- 20 lakh
Low
Average Unit Priced 5-12 lakh
Covering 5-6 Urban-
Agglomeration
Covering 1-2 Urban-
Agglomeration
Scale
Number of Units 2500 500
Affordability
Lo
w
Co
ve
rag
e
Hig
h
Affordable Homes Building mass housing in India
clytics 10
fronts: First their focus on the affordable segment, which draws from the
average cost of the product offering. Second, how well these organizations are
placed to grow by measuring their outreach within the urban population.
Finally, we looked at the experience of evaluating the number of units which
have been delivered or are under construction till date. We find that
developers, who have been able to grow or have spread across regions, have
found it difficult to keep the focus on affordability while pursuing growth.
Delays in land acquisition and obtaining approvals after entering into a new
location has forced some of them to realign a part of the offerings towards the
mid income segment. However, sales off take for small format units remain
strong. Some projects have been able to sell of an entire phase in two days.
Construction is initiated after sales deed has been signed, leading to lower
working capital compared to the conventional industry (see Exhibit 14
Evolving Business Model).
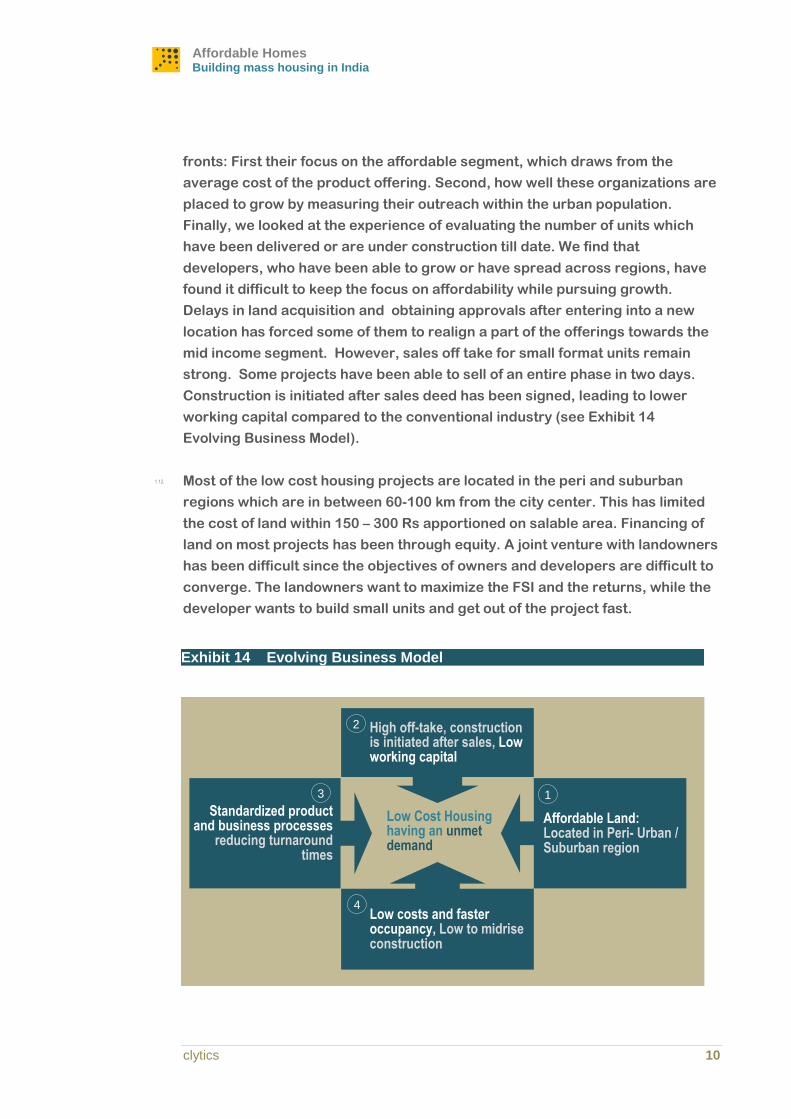
1.12. Most of the low cost housing projects are located in the peri and suburban
regions which are in between 60-100 km from the city center. This has limited
the cost of land within 150 – 300 Rs apportioned on salable area. Financing of
land on most projects has been through equity. A joint venture with landowners
has been difficult since the objectives of owners and developers are difficult to
converge. The landowners want to maximize the FSI and the returns, while the
developer wants to build small units and get out of the project fast.
Exhibit 14 Evolving Business Model
Low costs and faster occupancy, Low to midrise construction
Affordable Land: Located in Peri- Urban / Suburban region
High off-take, construction is initiated after sales, Low working capital
Standardized product and business processes
reducing turnaround times
Low Cost Housing having an unmet demand
1
2
3
4

Turning Deficit into an Opportunity
Turning Deficit into an Opportunity
11 CITY 2.0
Affordable Homes Building mass housing in India
clytics 12
2. Mass Manufacturing
The opportunity has been sensed; however the constraints still look daunting.
In this section we evaluate some of the best practices. We try to look for
answers: How should a low income house look like? What approaches can be
taken to execute profitable projects in this segment? How do we create
organizations that deliver? How do different construction platform pit against
each other? Finally, we analyze into how we can scale the model over the next
decade and create the capacity to execute over 8000 houses a day catering to
the affordable segment in urban India.
2.1. Conventional industry courted the affluent segment of the population.
Developer cherry picked land strategically located to allow for appreciation in
future. The construction and sales were initiated only when the city precincts
expanded and the services: roads, drains and electricity reached these areas.
Profitability arose out of from speculative skills. The business levers had been
marketing to pooled set of investors, and liaising with the local government
body. Most of the construction and project management is outsourced. The
cost of delay was transferred to the customers or accommodated within the
appreciated land prices. The operating model has made it difficult for the
industry to look beyond the top 20% of the population strata.
2.2. A low cost housing, consumer has several requirements similar to that of an
affluent consumer. As with the affluent, buying a house has strong emotional
connect. It is linked to the household’s social standing. As with the affluent low
cost housing customer view their home as a long term investment. Consumers
are comparatively more risk averse to try out new product innovation without
the presence of a strong brand or a financial incentive. Rather than making a
single investment in affordable housing, consumer makes incremental
additions to his home over a long duration of time to reflect his aspiration and
pressing need. Families strike a balance between the size of the unit, location,
number of rooms and affordability. Households can trade off smaller room size
and accommodate in a 2BHK which has the same size as that of a 1BHK.
Customers prefer faster delivery since servicing a home loan while paying rent
becomes strenuous.
2.3. Operating within this context is different compared to the conventional
industry. Unit priced below 10 lakh can be viable only if projects are turned
over faster. Operating in this segment does not allow room to accommodate
speculative risks. Wafer thin margins, low asset accumulation, high utilization
First time home buyers
view home as a long
term investment
Mass Manufacturing
Mass Manufacturing
13 CITY 2.0
rate and a lean organization set up are the philosophy of in designing the
operational and revenue model.
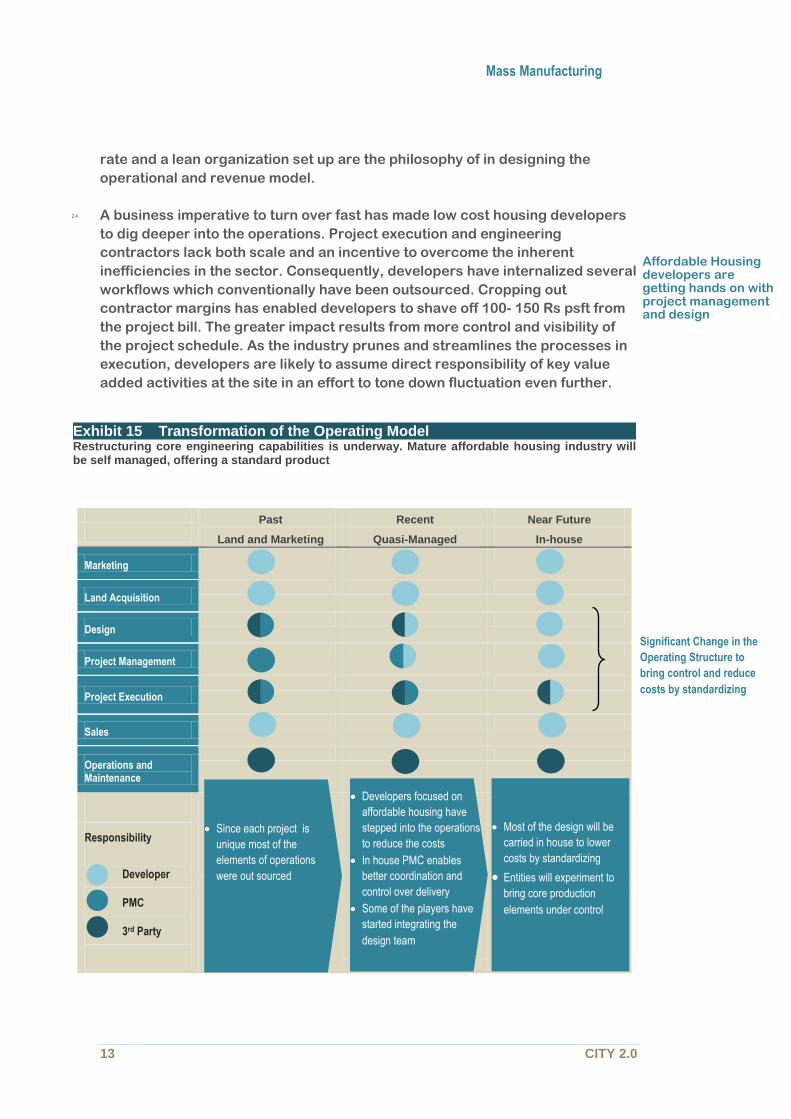
2.4. A business imperative to turn over fast has made low cost housing developers
to dig deeper into the operations. Project execution and engineering
contractors lack both scale and an incentive to overcome the inherent
inefficiencies in the sector. Consequently, developers have internalized several
workflows which conventionally have been outsourced. Cropping out
contractor margins has enabled developers to shave off 100- 150 Rs psft from
the project bill. The greater impact results from more control and visibility of
the project schedule. As the industry prunes and streamlines the processes in
execution, developers are likely to assume direct responsibility of key value
added activities at the site in an effort to tone down fluctuation even further.
Past Recent Near Future
Land and Marketing Quasi-Managed In-house
Marketing
Land Acquisition
Design
Project Management
Project Execution
Sales
Operations and Maintenance
Developers focused on affordable housing have stepped into the operations to reduce the costs
In house PMC enables better coordination and control over delivery
Some of the players have started integrating the design team
Responsibility
Developer
PMC
3rd Party
Significant Change in the
Operating Structure to
bring control and reduce
costs by standardizing
Exhibit 15 Transformation of the Operating Model Restructuring core engineering capabilities is underway. Mature affordable housing industry will be self managed, offering a standard product
Affordable Housing developers are getting hands on with project management and design
Developers focused on
affordable housing have
stepped into the operations
to reduce the costs
In house PMC enables
better coordination and
control over delivery
Some of the players have
started integrating the
design team
Most of the design will be
carried in house to lower
costs by standardizing
Entities will experiment to
bring core production
elements under control
Since each project is
unique most of the
elements of operations
were out sourced
Affordable Homes Building mass housing in India
clytics 14
Design Project Management Execution
Reluctance to collaborate in creating standards and protocols
Resistance to document design protocols
Opposition to standardization
Disinclination to move from managing with a span of weeks to a day
Conflict to accept standard process and change.
Refusal to log and share production and quality statistics
Failure to ensure prerequisites for the next activity is met.
Resistance to increase productivity and accepting ownership
Relinquishing control
Lack of time for fulfilling multiple projects.
Too much complexity in input parameters
Lack of time and expertise to manage change
Inability to understand and identify constraints
Common processes and benchmarks not evolved and developed
Lack of hands on knowledge
Fear of bringing out constraints in the open.
Process benchmarks are not available or recognized.
Frequent reallocation in between job locations
Lack of communication of a shared vision
Create cross functional teams working on specific standardization projects
Refrain from scaling operation till a maturity has set in
Have clarity in business plan before initiating design. Focus on a particular segment
Use a participative process to create benchmarks.
Hands on training facility
Allocate adequate buffer at the initial stages of the project to establish the process
Mix youth and experience while drawing the organization structure
Top management involvement in the change process on ground
Enable transparency visually communicate benchmarks
Peg the flow of information, drawings, material resources, finance, workforce in the process
Communicate the larger goal
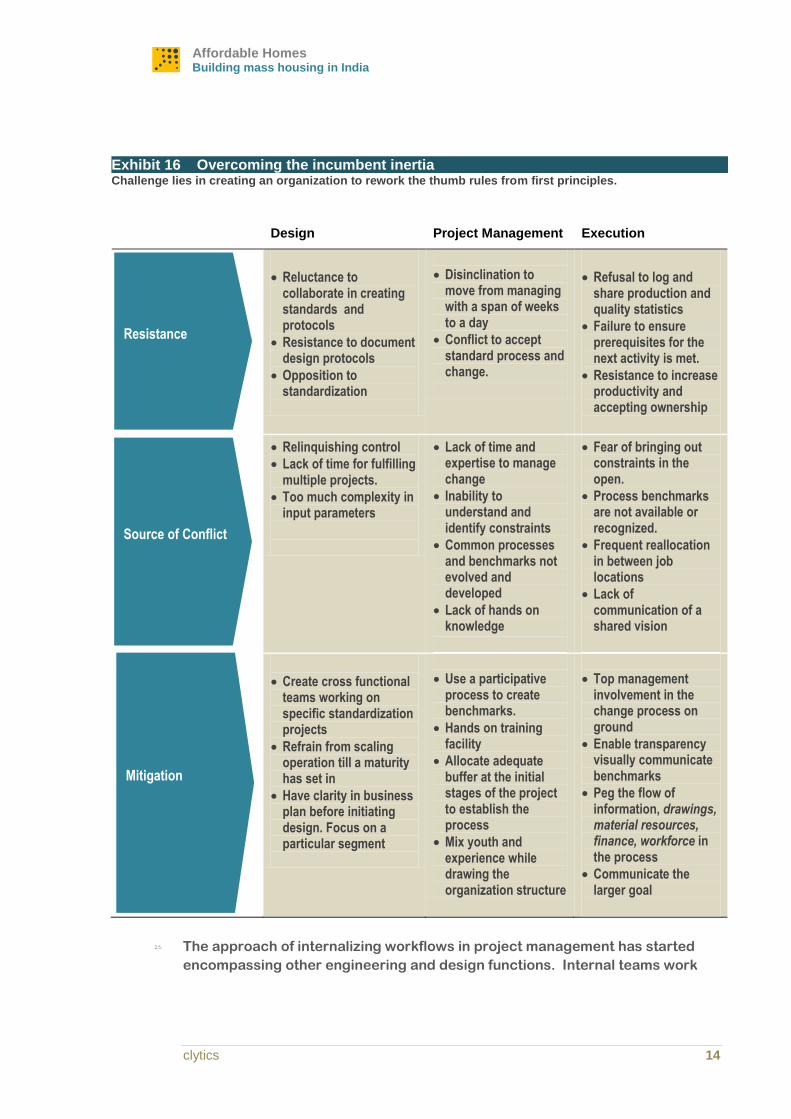
2.5. The approach of internalizing workflows in project management has started
encompassing other engineering and design functions. Internal teams work
Exhibit 16 Overcoming the incumbent inertia Challenge lies in creating an organization to rework the thumb rules from first principles.
Resistance
Source of Conflict
Mitigation
Mass Manufacturing
Mass Manufacturing
15 CITY 2.0
with standard templates of prototype units rather than outsource a design
contract to a third party who will then make a fresh start on every project.
Multiple disciplines architecture, services, structure interact and are able to
iterate to a decision faster, based on the past history of the prototype.
Tightrope between affordability and aspiration
Prototypes Remarks
Unit Level
Smaller sized unit of 1RK / 1BHK covering an area 270-450 sft. Minimal specification for dry finishes: flooring, wall painting
Avoiding Idle spaces and using passages intelligently
No external overhangs: balcony, eaves
Low wall to floor area ratio: more common walls.
Block Level
Standardization of unit level design across the project
Optimization of the common area / corridor footprint
Low to midrise (2-4 floors) precluding the need for a lift machine room
Project Level
Economies of scale justifying the use of machinery and equipment over the project duration
Open space parking minimizing construction costs
Finding a balance between standardization and consumption of the Legal FSI available
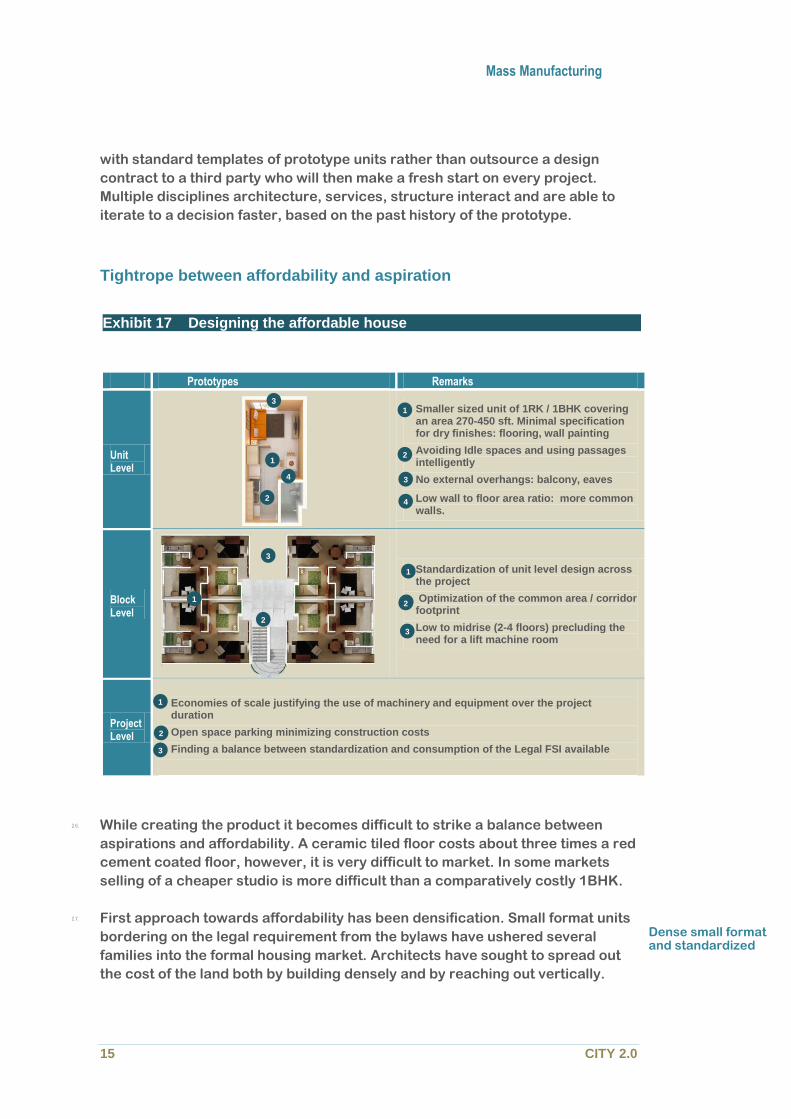
2.6. While creating the product it becomes difficult to strike a balance between
aspirations and affordability. A ceramic tiled floor costs about three times a red
cement coated floor, however, it is very difficult to market. In some markets
selling of a cheaper studio is more difficult than a comparatively costly 1BHK.
2.7. First approach towards affordability has been densification. Small format units
bordering on the legal requirement from the bylaws have ushered several
families into the formal housing market. Architects have sought to spread out
the cost of the land both by building densely and by reaching out vertically.
1
4
3
2
1
2
3
4
3
2
1
1
2 2
3
1
2
3
Dense small format and standardized
Exhibit 17 Designing the affordable house
Affordable Homes Building mass housing in India
clytics 16
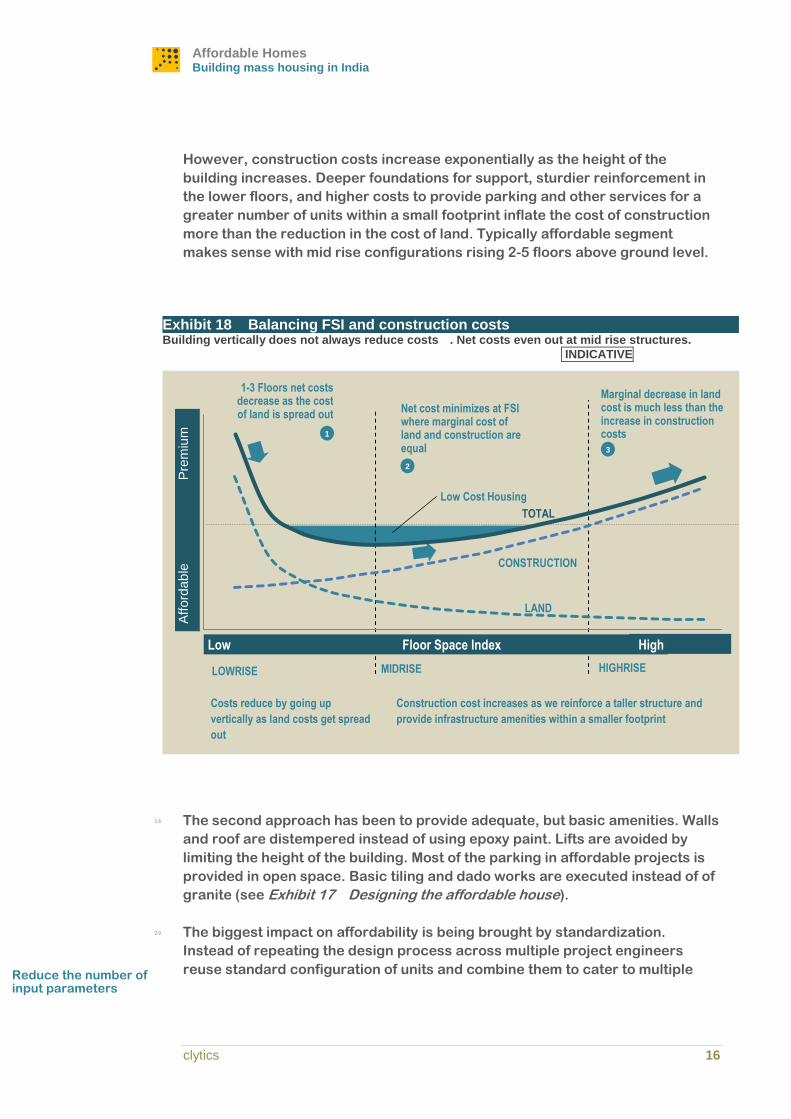
Exhibit 18 Balancing FSI and construction costs Building vertically does not always reduce costs . Net costs even out at mid rise structures.
IINDICATIVE
However, construction costs increase exponentially as the height of the
building increases. Deeper foundations for support, sturdier reinforcement in
the lower floors, and higher costs to provide parking and other services for a
greater number of units within a small footprint inflate the cost of construction
more than the reduction in the cost of land. Typically affordable segment
makes sense with mid rise configurations rising 2-5 floors above ground level.
2.8. The second approach has been to provide adequate, but basic amenities. Walls
and roof are distempered instead of using epoxy paint. Lifts are avoided by
limiting the height of the building. Most of the parking in affordable projects is
provided in open space. Basic tiling and dado works are executed instead of of
granite (see Exhibit 17 Designing the affordable house).
2.9. The biggest impact on affordability is being brought by standardization.
Instead of repeating the design process across multiple project engineers
reuse standard configuration of units and combine them to cater to multiple Reduce the number of input parameters
A
fford
ab
le
P
rem
ium
TOTAL
LAND
CONSTRUCTION
Low Cost Housing
1
Costs reduce by going up
vertically as land costs get spread
out
Construction cost increases as we reinforce a taller structure and
provide infrastructure amenities within a smaller footprint
2
3
1-3 Floors net costs decrease as the cost of land is spread out
Net cost minimizes at FSI where marginal cost of land and construction are equal
Marginal decrease in land cost is much less than the increase in construction costs
LOWRISE MIDRISE HIGHRISE
Low Floor Space Index High
Mass Manufacturing
Mass Manufacturing
17 CITY 2.0
projects. Standardization has enabled teams to, work autonomously, process
information faster and provide greater details for the execution. Initial business
plan, drawing on the depth of information about a standard unit, can be created
without requiring assistance from designers. The focus of engineering shifts
from coming up with creative inputs on every project to fine-tuning design
assets to streamline execution while cutting down costs. Typically,
standardization exercise has enabled teams to operate at one or two levels of
detail, deeper than the mainstay industry, reduce life cycle duration of projects
by 40% and cut costs by 30%. The impact on execution and project
management is even greater because of the resulting economies of scale.
Building fast and building right
2.10. Hiding within the disorganized sector is a significant value which we believe
can be unlocked by streamlining the project management. Period costs,
comprising of cost of finance, the salary head and administration can account
for 20-30% of the affordable projects topline. Frequent rescheduling in
response to multiple inputs and lack in business clarity limited the productive
output of the workforce. Business requirements will mandate the construction
industry to adopt several concepts from success of manufacturing and
technology sector in the country.
2.11. Working within a workstation a worker on an assembly performs the same task
in the same location. The flow of raw materials into his workstation, controlled
by bins and visual signals ‘Kanban’, triggers a just in time response from the
supply chain to ensure he gets the right component at the right time. Some of
the components are sub assembled before being delivered to his assembly line,
cutting short the number of activities and allowing his co-workers to produce
one unit every minute. An ‘Andon’ switch on the assembly line can be triggered
by any technician facing a problem, bringing the entire line to a stop after
which the entire floor tries to fix the problem. Process and quality benchmarks
are clearly defined and transparently displayed, enabling a newcomer to be
easily assimilated. Maintenance is autonomously managed by everyone, which
limits downtime of the production line. The culture promotes small incremental
continuous improvement.
Affordable Homes Building mass housing in India
clytics 18
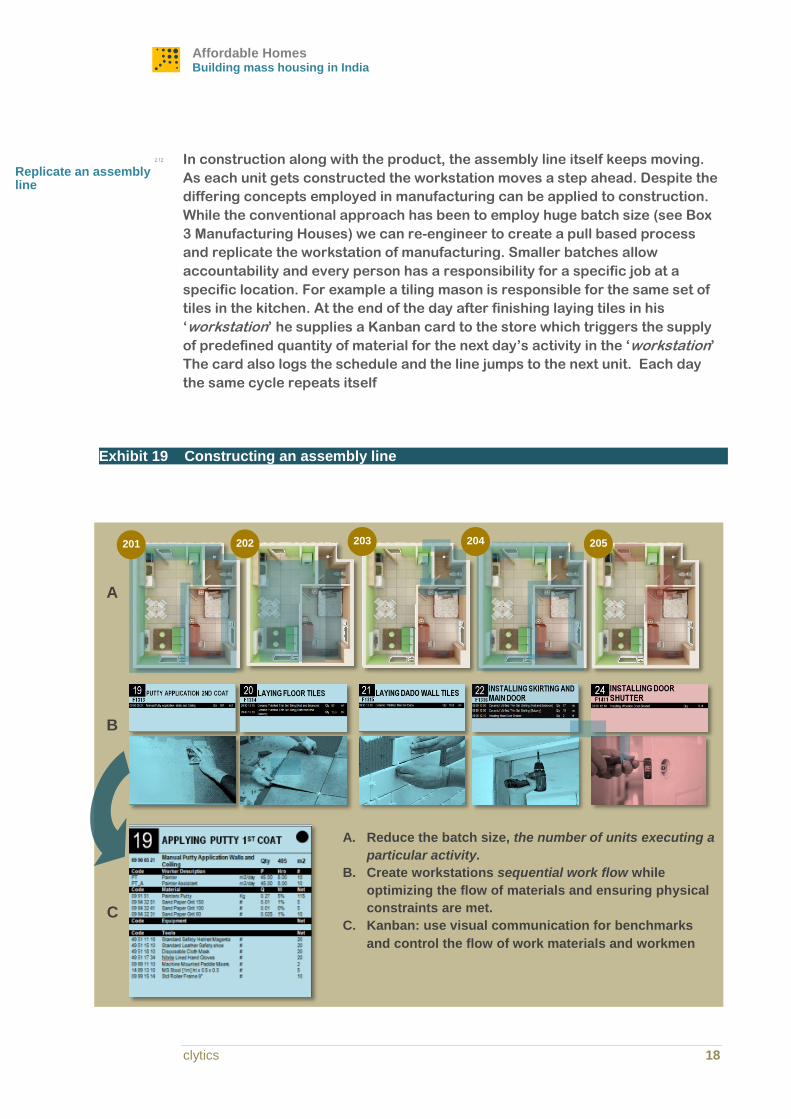
2.12. In construction along with the product, the assembly line itself keeps moving.
As each unit gets constructed the workstation moves a step ahead. Despite the
differing concepts employed in manufacturing can be applied to construction.
While the conventional approach has been to employ huge batch size (see Box
3 Manufacturing Houses) we can re-engineer to create a pull based process
and replicate the workstation of manufacturing. Smaller batches allow
accountability and every person has a responsibility for a specific job at a
specific location. For example a tiling mason is responsible for the same set of
tiles in the kitchen. At the end of the day after finishing laying tiles in his
‘workstation’ he supplies a Kanban card to the store which triggers the supply
of predefined quantity of material for the next day’s activity in the ‘workstation’
The card also logs the schedule and the line jumps to the next unit. Each day
the same cycle repeats itself
Exhibit 19 Constructing an assembly line
B
A
C
A. Reduce the batch size, the number of units executing a
particular activity.
B. Create workstations sequential work flow while
optimizing the flow of materials and ensuring physical
constraints are met.
C. Kanban: use visual communication for benchmarks
and control the flow of work materials and workmen
201 202 203 204 205
Replicate an assembly line
Mass Manufacturing
Mass Manufacturing
19 CITY 2.0
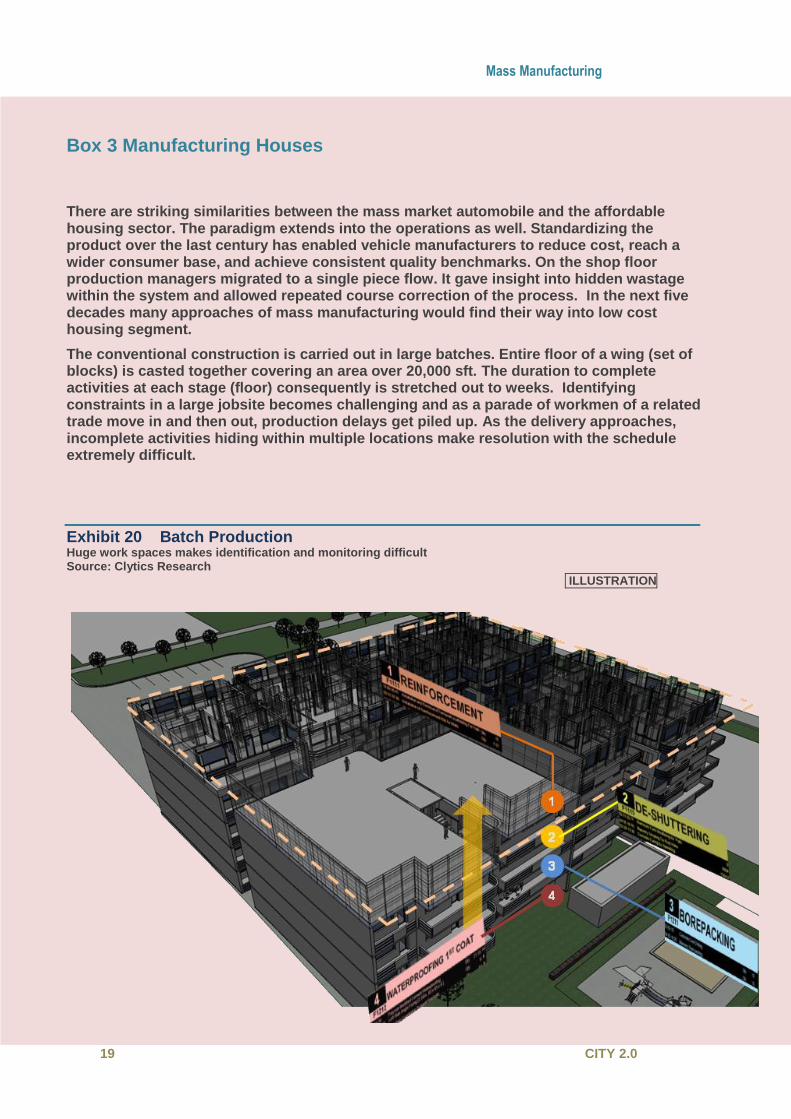
Box 3 Manufacturing Houses
There are striking similarities between the mass market automobile and the affordable housing sector. The paradigm extends into the operations as well. Standardizing the product over the last century has enabled vehicle manufacturers to reduce cost, reach a wider consumer base, and achieve consistent quality benchmarks. On the shop floor production managers migrated to a single piece flow. It gave insight into hidden wastage within the system and allowed repeated course correction of the process. In the next five decades many approaches of mass manufacturing would find their way into low cost housing segment.
The conventional construction is carried out in large batches. Entire floor of a wing (set of blocks) is casted together covering an area over 20,000 sft. The duration to complete activities at each stage (floor) consequently is stretched out to weeks. Identifying constraints in a large jobsite becomes challenging and as a parade of workmen of a related trade move in and then out, production delays get piled up. As the delivery approaches, incomplete activities hiding within multiple locations make resolution with the schedule extremely difficult.
Exhibit 20 Batch Production Huge work spaces makes identification and monitoring difficult Source: Clytics Research
ILLUSTRATION
Affordable Homes Building mass housing in India
clytics 20
Box 3 Manufacturing Houses
Increasing the throughput, in the conventional process faces a physical constraint: construction for the next level cannot be initiated until the slab can bear its own load. Typically there is a ten day delay, for the concrete to cure, before the next level is placed on the one below. Concrete casting set the precedence and the duration of each of the activities on the schedule stretches out to weeks. When apportioning, workforce is not possible the gang is either rested, reassigned to another location, or trade.
The first step in adopting workstation into a construction process requires restructuring the work sequence to use smaller elements. In case of housing these elements are a set of flats. Next the sequence has to overcome the physical constraint set by the curing of concrete. Instead of shifting vertically up after every casting the construction process has to move horizontally for few castings before making a jump to the next level. As a consequence the duration between castings can come down drastically by a factor of 10 when compared to the conventional industry. Low cycle times and batch size result in the workforce getting a continuous work-front. We estimate that most projects can haircut 40-70% off the project duration by removing uncertainties involved in managing a large batch size and instead chosen to be executed with workstations.
Exhibit 21 Flow with Spiral Sequential flow process with segregated and smaller work centres leading to a faster pouring cycles. Source: Clytics Research
IILLUSTRATION
Mass Manufacturing
Mass Manufacturing
21 CITY 2.0
Similar to an assembly line, partial completion of activities is not accounted and
mobilization of resource controls and enforces discipline
2.13. Like sub assemblies in a manufacturing assembly line, pre constructed
elements: welded wire mesh, pre-fabricated plumbing and electrical kits, pre-
cast partition walls, water tanks reduce the complexity at the site and move the
construction to a controlled environment. Prefabrication streamlines the
logistics, instead of over 40 components in a plumbing kit project management
and execution have to deal with a single item. As operations scale to multiple
sites in an urban agglomeration, each individual project can be fed by a central
facility which will be able to schedule and reroute based on real time demand
similar to a central machine shop feeding to multiple assembly lines.
2.14. The biggest challenge in implementing this framework in the field is to evolve
shared benchmarks for execution. Process parameters productivity, quality
has to be defined and the underlying preconditions required to achieve the
same consistently have to be understood. Similarly clarity is required in the
material consumption, movement plan and other physical constraints. If
sufficient groundwork has been done, creating an on demand system as
responsive as a manufacturing assembly line is much simpler.
Banking on the right platform
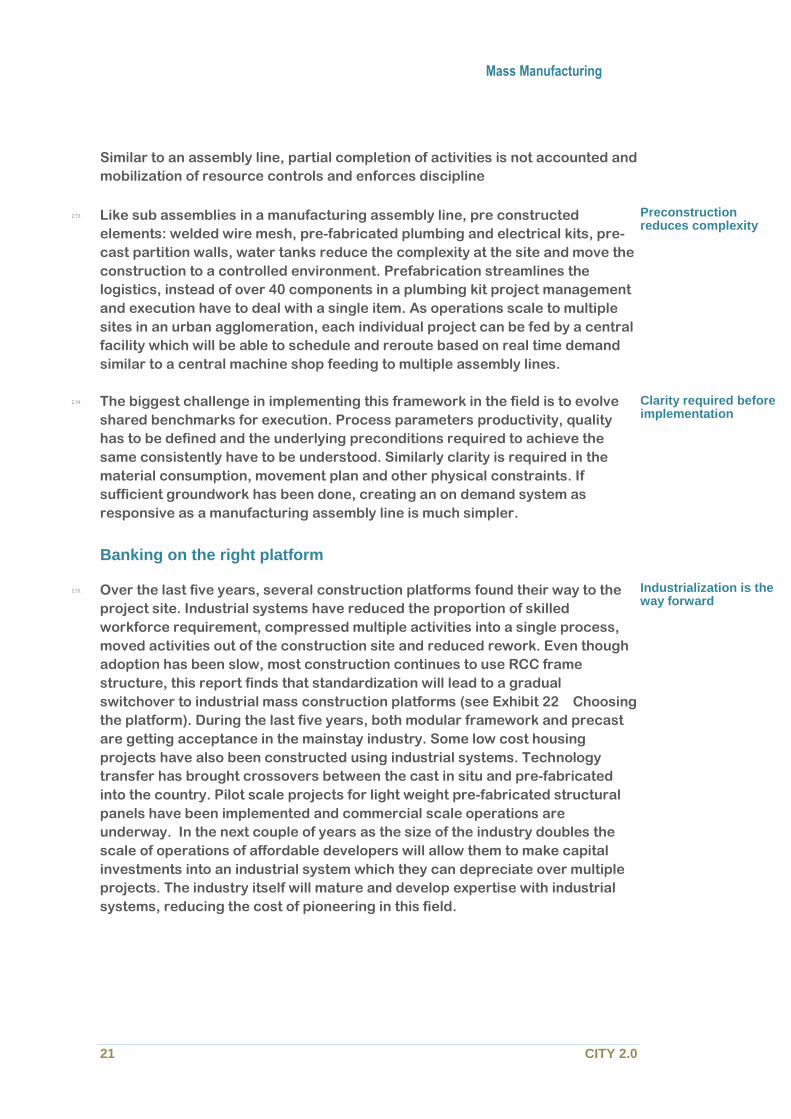
2.15. Over the last five years, several construction platforms found their way to the
project site. Industrial systems have reduced the proportion of skilled
workforce requirement, compressed multiple activities into a single process,
moved activities out of the construction site and reduced rework. Even though
adoption has been slow, most construction continues to use RCC frame
structure, this report finds that standardization will lead to a gradual
switchover to industrial mass construction platforms (see Exhibit 22 Choosing
the platform). During the last five years, both modular framework and precast
are getting acceptance in the mainstay industry. Some low cost housing
projects have also been constructed using industrial systems. Technology
transfer has brought crossovers between the cast in situ and pre-fabricated
into the country. Pilot scale projects for light weight pre-fabricated structural
panels have been implemented and commercial scale operations are
underway. In the next couple of years as the size of the industry doubles the
scale of operations of affordable developers will allow them to make capital
investments into an industrial system which they can depreciate over multiple
projects. The industry itself will mature and develop expertise with industrial
systems, reducing the cost of pioneering in this field.
Preconstruction reduces complexity
Clarity required before implementation
Industrialization is the way forward
Affordable Homes Building mass housing in India
clytics 22
RCC Frame System Formwork Precast
Conventional Industrial Industrial
Capital Investment
Capital Intensive platforms pose a significant risk in the early stages of a project
Site Operations
Lowering the number of operations at the worksite reduces the potential for variation and makes scheduling more predictable
Manpower Required
The greater the workforce required at the work site greater is the effort in coordinating and lower is the throughput.
Product Quality
Stricter tolerances in initial wet masonry / castings reduce the rework and costs at the later dry finishes
Availability of Expertise
Adoption of new processes is curtailed by availability of expertise in design, execution and managing the same
Flexibility at site
Low business maturity requires higher flexibility on site to accommodate changes
Project Duration
Shorter Project duration cuts through the indirect costs
High
Low
Prevalent construction method in India, good understanding of the process and resources is present with the contractors.
For Low and medium rise RCC frame structure units do not require significant capital outlay: Tools and Equipments are leased. This lowers the barrier to entry.
RCC frame entails handling multiple materials and equipments: Concrete, Brickwork / Blocks, Cement Mortar as against Cast in Situ.
Cast in situ merges multiple processes into a single operation resulting in about 60% of the value added in a single step.
It removes masonry process and reduces the skill required in finishing.
Projects can cut down costs up to 30% on account of faster cash flows.
Precast needs scale to be affordable.
It needs to be located under 60 km from the construction and adequate road infrastructure
Precast requires a higher skill set, to ensure compatibility with the tolerances, ensures watertight fitment.
In India, execution capability needs to be developed before this technology platform can be explored.
Exhibit 22 Choosing the platform Industry has started adopting new platforms to support faster turnover. Apart from precast and cast in situ cross-over approaches embodying attributes of both are being tested.

Mass Manufacturing
Mass Manufacturing
23 CITY 2.0
Affordable Homes Building mass housing in India
clytics 24
3. Measuring up
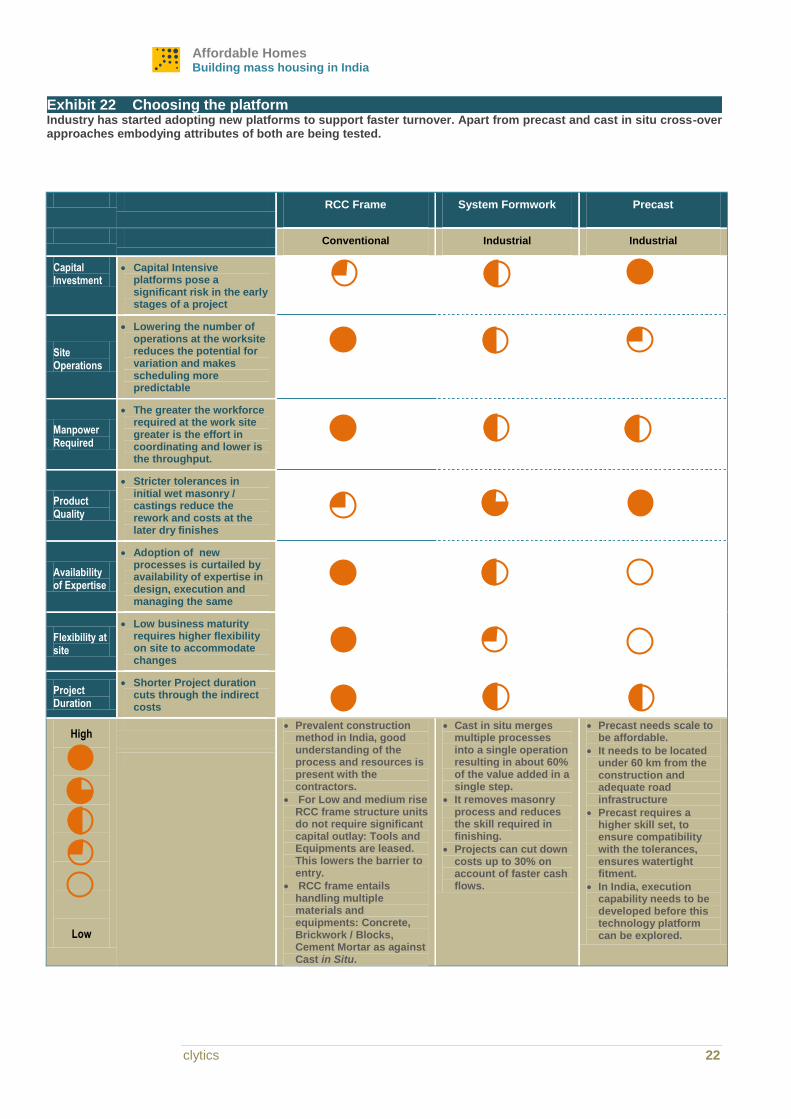
18% of the urban households cannot afford the cheapest unit offered by the market6.
It will be impossible to provide access to the deprived without cross subsidy and
strong government support. The deprivation gap measured as the total amount
required to bring all such families within the fold of the formal market stands slightly
under 8000 Cr Rs annually. As the real income rises the gap will reduce. In 2025 the
gap will stand at 2800 Cr Rs.
The next segment of impoverished families comprising 28% of the demand requires
both financial inclusion and a robust rental market. Strivers and Aspirers comprise
45% of the market demand and represent a business opportunity of 8 and 19 Bn US$
respectively.
6 Computed using data from Indian Human Development Survey; refer to Note on Methodology for further details.
Low Cost
Housing
Dem
an
d
1 2
Conventional Industry
SU
BS
IDY
Affordable Housing
RE
NT
AL
0 5 10 15 20 25 30
3
2025
Price Rs lakh
4 5
2012
18% 25% 22% 23% 12%
Private market opportunity Annual 30 Bn US$
Exhibit 23 Shifting Demand Even after a span of a decade Low cost housing demand will remain strong Annual demand plotted with capacity to pay
Source: IHDS, Clytics research
Measuring up
Measuring up
25 CITY 2.0
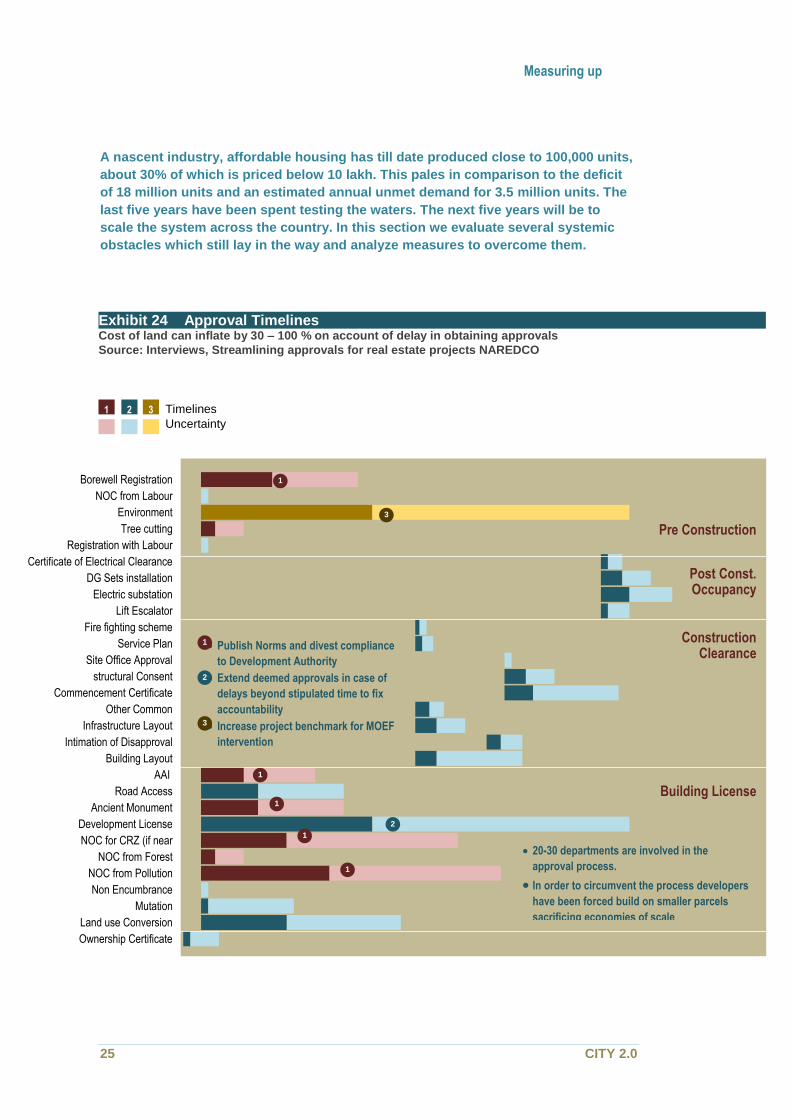
A nascent industry, affordable housing has till date produced close to 100,000 units,
about 30% of which is priced below 10 lakh. This pales in comparison to the deficit
of 18 million units and an estimated annual unmet demand for 3.5 million units. The
last five years have been spent testing the waters. The next five years will be to
scale the system across the country. In this section we evaluate several systemic
obstacles which still lay in the way and analyze measures to overcome them.
Ownership Certificate
Land use Conversion
Mutation
Non Encumbrance
NOC from Pollution
NOC from Forest
NOC for CRZ (if near
Development License
Ancient Monument
Road Access
AAI
Building Layout
Intimation of Disapproval
Infrastructure Layout
Other Common
Commencement Certificate
structural Consent
Site Office Approval
Service Plan
Fire fighting scheme
Lift Escalator
Electric substation
DG Sets installation
Certificate of Electrical Clearance
Registration with Labour
Tree cutting
Environment
NOC from Labour
Borewell Registration
1
2
1
1
1
3
Pre Construction
Post Const. Occupancy
Construction Clearance
Building License
1
20-30 departments are involved in the
approval process.
In order to circumvent the process developers
have been forced build on smaller parcels
sacrificing economies of scale
Publish Norms and divest compliance
to Development Authority
Extend deemed approvals in case of
delays beyond stipulated time to fix
accountability
Increase project benchmark for MOEF
intervention
2
3
1
Exhibit 24 Approval Timelines Cost of land can inflate by 30 – 100 % on account of delay in obtaining approvals
Source: Interviews, Streamlining approvals for real estate projects NAREDCO
Timelines
Uncertainty
2 1 3
Affordable Homes Building mass housing in India
clytics 26
Handholding a nascent market
3.1. India ranks at the bottom of the Doing Business Construction Index. Involving
over 30 departments, construction permits in India take over 15- 24 months.
Delay in getting approvals can escalate the cost of the land by a factor of two
making smaller format affordable homes unviable for developers to pursue (see
Exhibit 24 Approval Timelines).
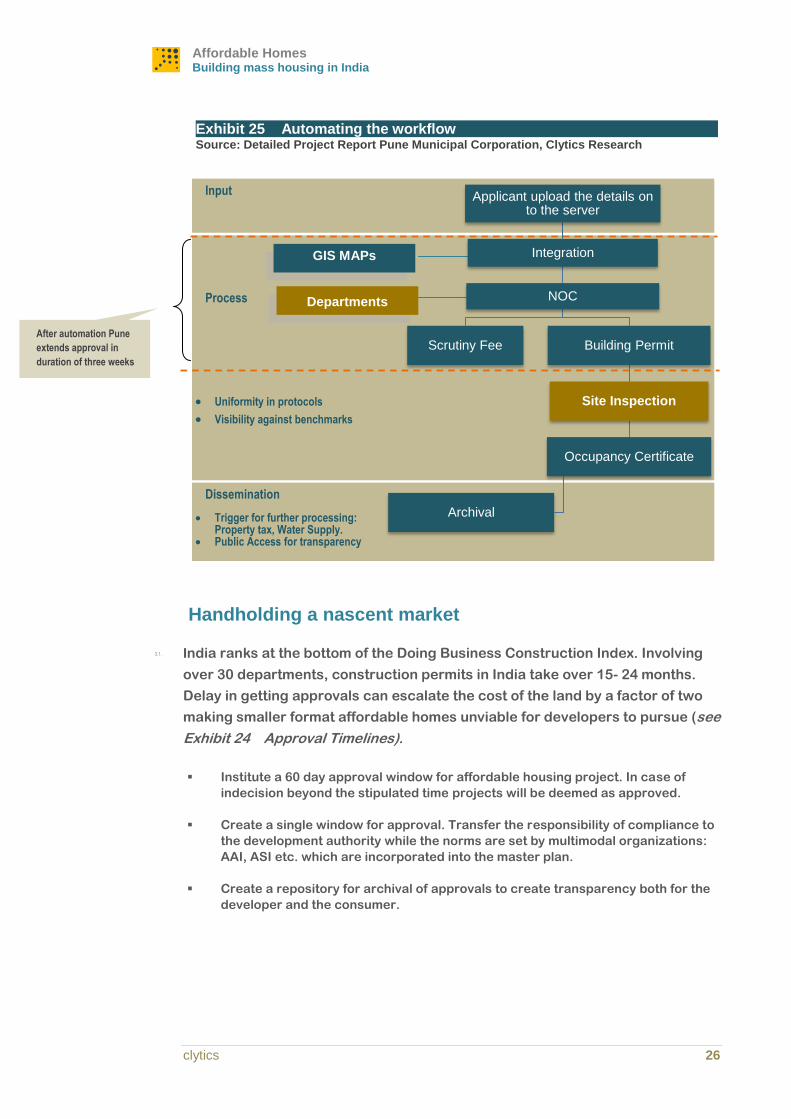
Institute a 60 day approval window for affordable housing project. In case of
indecision beyond the stipulated time projects will be deemed as approved.
Create a single window for approval. Transfer the responsibility of compliance to
the development authority while the norms are set by multimodal organizations:
AAI, ASI etc. which are incorporated into the master plan.
Create a repository for archival of approvals to create transparency both for the
developer and the consumer.
Exhibit 25 Automating the workflow Source: Detailed Project Report Pune Municipal Corporation, Clytics Research
Process
Uniformity in protocols
Visibility against benchmarks
Dissemination
Trigger for further processing: Property tax, Water Supply.
Public Access for transparency
Input
Departments
GIS MAPs
After automation Pune
extends approval in
duration of three weeks
Applicant upload the details on to the server
Integration
NOC
Scrutiny Fee Building Permit
Site Inspection
Occupancy Certificate
Archival
Measuring up
Measuring up
27 CITY 2.0
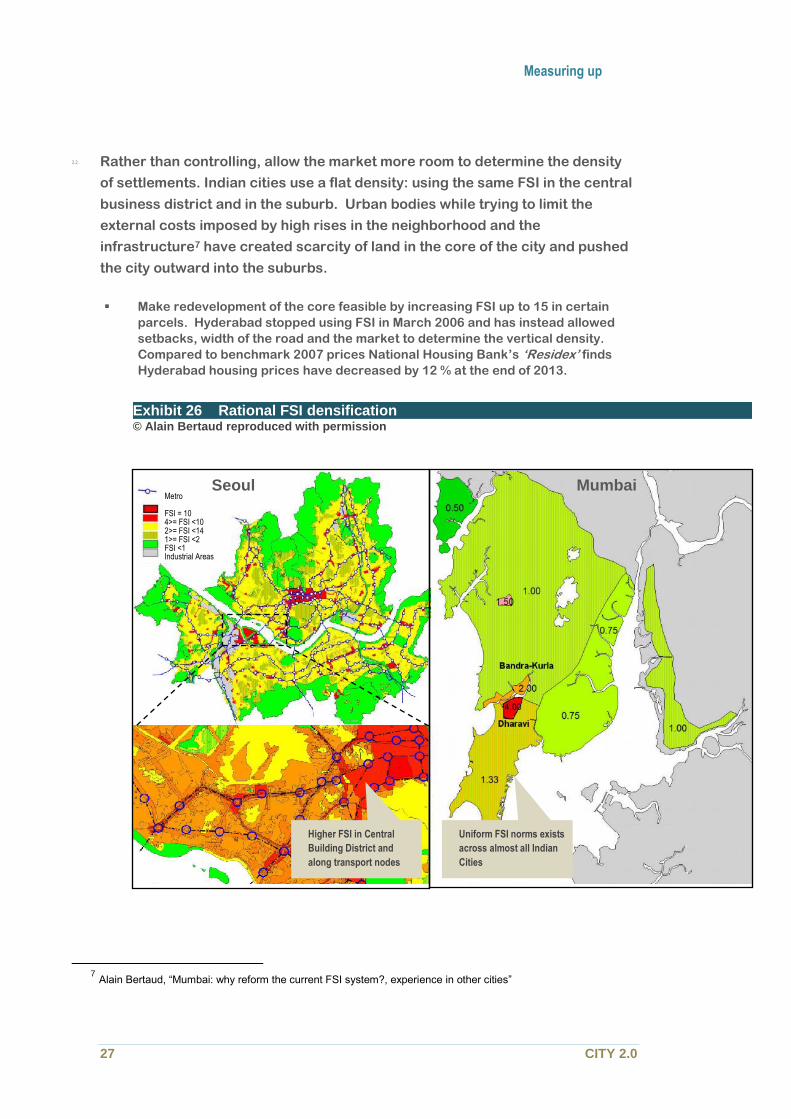
3.2. Rather than controlling, allow the market more room to determine the density
of settlements. Indian cities use a flat density: using the same FSI in the central
business district and in the suburb. Urban bodies while trying to limit the
external costs imposed by high rises in the neighborhood and the
infrastructure7 have created scarcity of land in the core of the city and pushed
the city outward into the suburbs.
Make redevelopment of the core feasible by increasing FSI up to 15 in certain
parcels. Hyderabad stopped using FSI in March 2006 and has instead allowed
setbacks, width of the road and the market to determine the vertical density.
Compared to benchmark 2007 prices National Housing Bank’s ‘Residex’ finds
Hyderabad housing prices have decreased by 12 % at the end of 2013.
7 Alain Bertaud, “Mumbai: why reform the current FSI system?, experience in other cities”
Exhibit 26 Rational FSI densification © Alain Bertaud reproduced with permission
Metro FSI = 10 4>= FSI <10 2>= FSI <14 1>= FSI <2 FSI <1 Industrial Areas
Higher FSI in Central
Building District and
along transport nodes
Uniform FSI norms exists
across almost all Indian
Cities
Seoul Mumbai
Affordable Homes Building mass housing in India
clytics 28
Support the infrastructure development costs by levying a development fee for
approval. A 60% premium for an extra unit of FSI levied on the 10% area of
Mumbai covering rail link and transport nodes can generate over 60,000 Cr
revenue.
80% of the 225 cities which will have over a million residents by 2051 are yet to
make a master plan or have initiated urban planning recently. While it is difficult
to make significant changes in existing tier I cities, adopting a spatially
determined FSI policy will be easier in tier II and tier III if it is backed by a central
policy.
3.3. Reduce the idle inventory. Housing census of 2011 found over 10% of the urban
housing stock lying vacant. This is about 60% of the current housing deficit.
Marginal reduction in the vacancy status brought by tax adjustments can lead to
significant mitigation in the housing deficit. However, given the sensitive nature,
it will require political hegemony to implement.
An easier measure will be to introduce a mutation fee on land lying vacant for
more than five years or every time the master plan of a city is redrawn to curb
land hoarding.
3.4. Target subsidies without distorting the market. It is amply evident that the
bottom quintile will not be able to participate in a free market without
government intervention and cross subsidy. However, unless the sops are
targeted they will distort a legitimate market.
3.5. Create savings linked subsidy products. Accumulating 20% equity component
of a home is daunting for the population in the bottom two quintiles. The second
challenge is to service the loan while waiting for occupancy along with a rental
burden. In both the cases, local government can provide gap funding to a
targeted consumer base contingent on the accumulation of a savings pool.
3.6. Taxes ranging from stamp duties to service tax inflate the basic sale price of a
home by 10%.There is no distinction between a product aimed at the affordable
segment and that aimed at the affluent.
Extend tax rebate on capital invested for all affordable housing projects,
providing incentive to developers to transit towards industrial construction
platform focusing on shorter turnaround time.
Provide relief on stamp duty, land use conversion and other taxes levied by urban
bodies for affordable housing project.
3.7. Create uniform by laws within an urban agglomeration
Measuring up
Measuring up
29 CITY 2.0
Overarching uniform templates to act as a guide for the project within a zone,
allowing developers to standardize their offerings based on market requirements
within a region.
Evaluate impact of housing standards imposed on the unit cost. For example,
reducing the requirements of a car parking 1 for every 2 units in Bangalore to 1
for every 35 units as in Hong Kong will enable developers to create smaller units
for the same land parcel size. Similarly, reducing the minimum dwelling size from
27m2 of 21 m2 will result in 5% additional household to enter into the formal
market.
Rebooting an Industry
3.8. The demand for branded standardized products offering value at an
inexpensive price far surpasses the supply of such units.
Climb down the ladder to deliver to a pent up demand. Existing brand catering to
the affluent segment can be isolated by creating a subsidiary to cater to the
affordable sector, with a separate organization set up and business model.
Step out from the metro into the Tier II and Tier III. Market growth will remain
robust, and competition is absent at present.
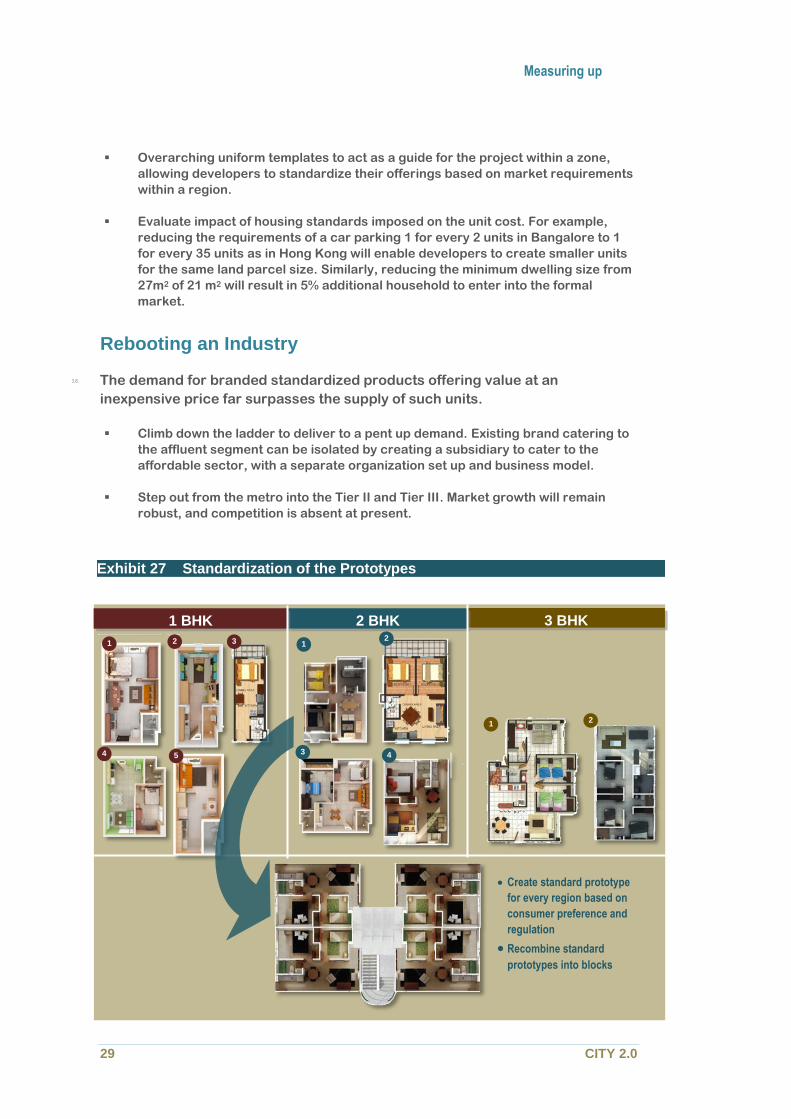
Exhibit 27 Standardization of the Prototypes
Create standard prototype
for every region based on
consumer preference and
regulation
Recombine standard
prototypes into blocks
1 2 3
4 5
1 2
3 4
1 2
3 BHK 2 BHK 1 BHK
Affordable Homes Building mass housing in India
clytics 30
Smaller format sell faster, giving faster turnaround and higher return on equity.
3.9. Reduce the number of parameters involved in design and execution. Create a
standard design configuration for unit layouts and use them across multiple
projects.
Integrate multiple disciplines and create intelligence for different prototypes:
marketing to understand the consumer preference for different combinations,
operational details to understand the process for each unit and subunit level
product costing. Detailed manuals which business development, land acquisition,
project execution and procurement teams can use to arrive at a decision faster.
3.10. Streamline project management and cut down the batch size: Period cost adds
up to 20-30 % of the bill. Cutting off project duration by half can cut down 100-
200 Rs per sft in large projects.
Subdivide the project schedule into a workstation. Manage by tracking the buffer
the number of flats lying ’idle’ between two workstations. Raise an alarm
whenever the buffer exceeds a benchmark ideally zero.
Cycle workforce with the same type of work and through the same location to
allow the workers to get specialized. For example, instead of applying tile
workers will specialize in fixing tiles only for the kitchen.
3.11. Invest in people. Productivity in the construction sector is a fifth of global
benchmarks. Creating capacity to construct 8500 houses every day will require
the direct involvement of close to 2 million workforces. While it may not be
feasible for developers to invest directly, they have to work with partners to
create a pipeline for future human capital.
Housing finance: enabling Aspirations
3.12. In a nascent market where the developers are yet to mark their presence HFC
has much greater brand awareness. In this context, housing finance companies
can play a catalytic role in this Industry. First, leveraging with their wide
network they can encourage existing developers to enter into this segment.
Second, they can work with existing developers to co-brand projects in this
space. Finally, they can work with the developers to reduce the processing
time and help develop a team to prescreen applications.
Measuring up
Measuring up
31 CITY 2.0
The Supporting Industry
3.13. In the absence of a business driver the process of evolution of the construction
platform has been slow in India. Most construction equipments were imported
and sold off in the market. The government insisted equipment providers to set
up a base in India and adopted a tariff structure to promote the local
manufacturing. Imported second was similarly discouraged. Manufacturers
were reluctant since they lacked the scale to set up a business development
outpost in the country, moving entire fleet of operations seemed difficult.
However, over the last five years, a relatively robust construction sector in the
country has started to court renewed interest as most of the developed
housing and infrastructure markets collapsed post the financial crisis. The gap
in the Indian market is not just access to technology but also an understanding
of its application and a capacity to absorb the same.
Build a strong portfolio of engineering services along with the product. While
markets Europe and America are mature, products such as concrete foaming
agents, floor accents, concrete fasteners, etc. which can have mass application
in affordable housing need several pilots to introduce the concept to the
construction Industry in the country. Business development will need a strong
engineering support.
Invest directly or with a partner to create a training infrastructure. Developers
are reluctant to adopt precast out of apprehension to find adequate manpower to
erect the panels at the jobsite despite having an engineering infrastructure
redesign their project with precast elements.
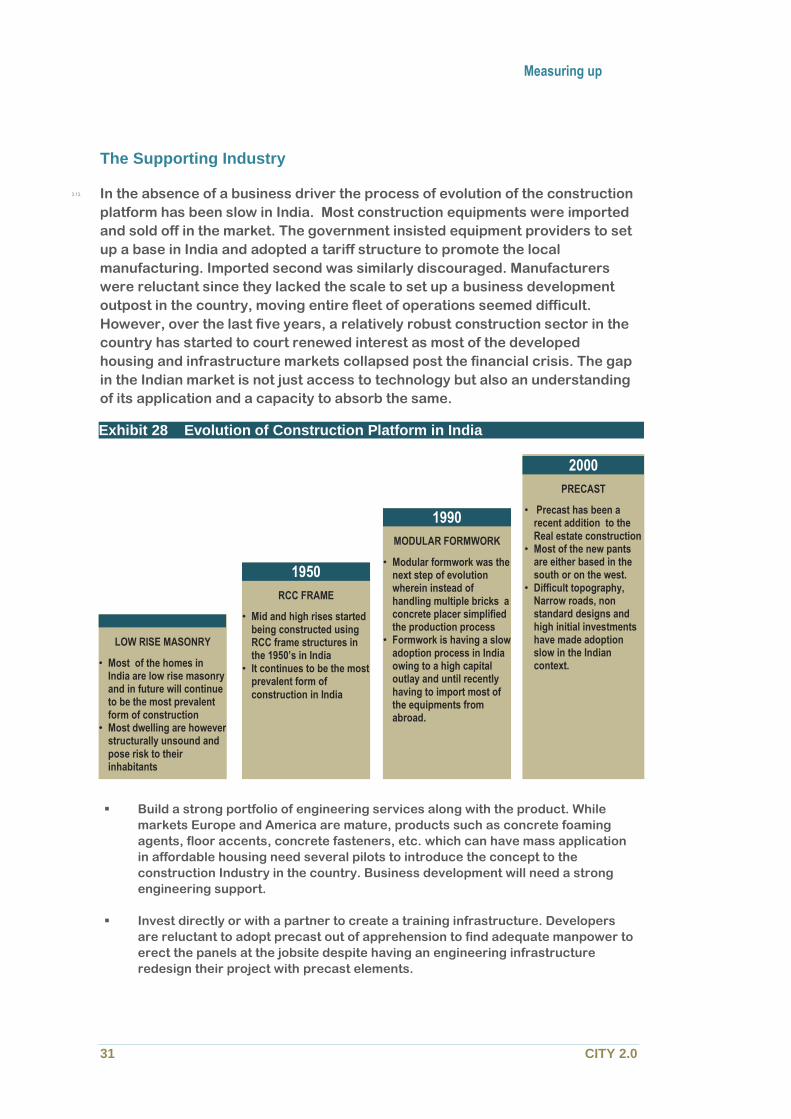
Exhibit 28 Evolution of Construction Platform in India
1990
MODULAR FORMWORK
• Modular formwork was the next step of evolution wherein instead of handling multiple bricks a concrete placer simplified the production process
• Formwork is having a slow adoption process in India owing to a high capital outlay and until recently having to import most of the equipments from abroad.
2000
PRECAST
• Precast has been a recent addition to the Real estate construction
• Most of the new pants are either based in the south or on the west.
• Difficult topography, Narrow roads, non standard designs and high initial investments have made adoption slow in the Indian context.
1950
RCC FRAME
• Mid and high rises started being constructed using RCC frame structures in the 1950’s in India
• It continues to be the most prevalent form of construction in India
LOW RISE MASONRY
• Most of the homes in India are low rise masonry and in future will continue to be the most prevalent form of construction
• Most dwelling are however structurally unsound and pose risk to their inhabitants

Affordable Homes Building mass housing in India
clytics 32
Intervene in the lease buy back market to combine financial products along with
the service. The Market for leaseholds for construction equipment is
disorganized. Typical contracts, price the cost of the equipment over two to three
fiscal which makes it difficult for developers to adopt.
Leverage on the low cost manufacturing base in India to create a base for further
expansion into South East Asia.

Measuring up
Measuring up
33 CITY 2.0
Affordable Homes Building mass housing in India
clytics 34
4. Note on Methodology
Forecasting Population
4.1. We used regional fertility and mortality indicators to estimate the future
regional demographic trends. Using the past fertility data from the sample
research surveys we forecasted future trends based on a sigmoid relationship.
Life expectancy indicators were modeled similarly, and were used to determine
the age specific fertility rates from the life tables. Using both the information
we prepared the population profile with a five year interval for the next four
decades across all regions.
Estimating Urbanization
4.2. Urbanization is a complex phenomenon to both measure and model. Notified
census towns like Yenaguda in Karnataka with a population close to 5000 are
but an extension of the nearby Tier II city Udupi. Boisar in northern
Maharashtra has increased from 14000 to over a lakh in the last decade,
although it is still classified as a census town governed by a Gram Panchayat
with limited state funding and without a property tax base to fall into. There are
neither any public transports available, nor are there any waste collection or
planned drainage systems. The urban population in Kerala has nearly doubled
in the last decade, but the majority of this has been a result of dwindling
productivity and climate change turning agriculturists into migrant workers.
These cases illustrate the difficulty in defining and measuring urbanization.
0%
1%
2%
3%
4%
1981 1986 1991 1996 2001 2006 2011
India JammuandKashmir HIMACHALPRADESH PUNJAB Uttaranchal HARYANA RAJASTHAN BIHAR MEGHALAYA ASSAM WESTBENGAL JHARKHAND ORISSA CHHATTISGARH MADHYAPRADESH GUJARAT MAHARASHTRA ANDHRAPRADESH KARNATAKA GOA KERALA
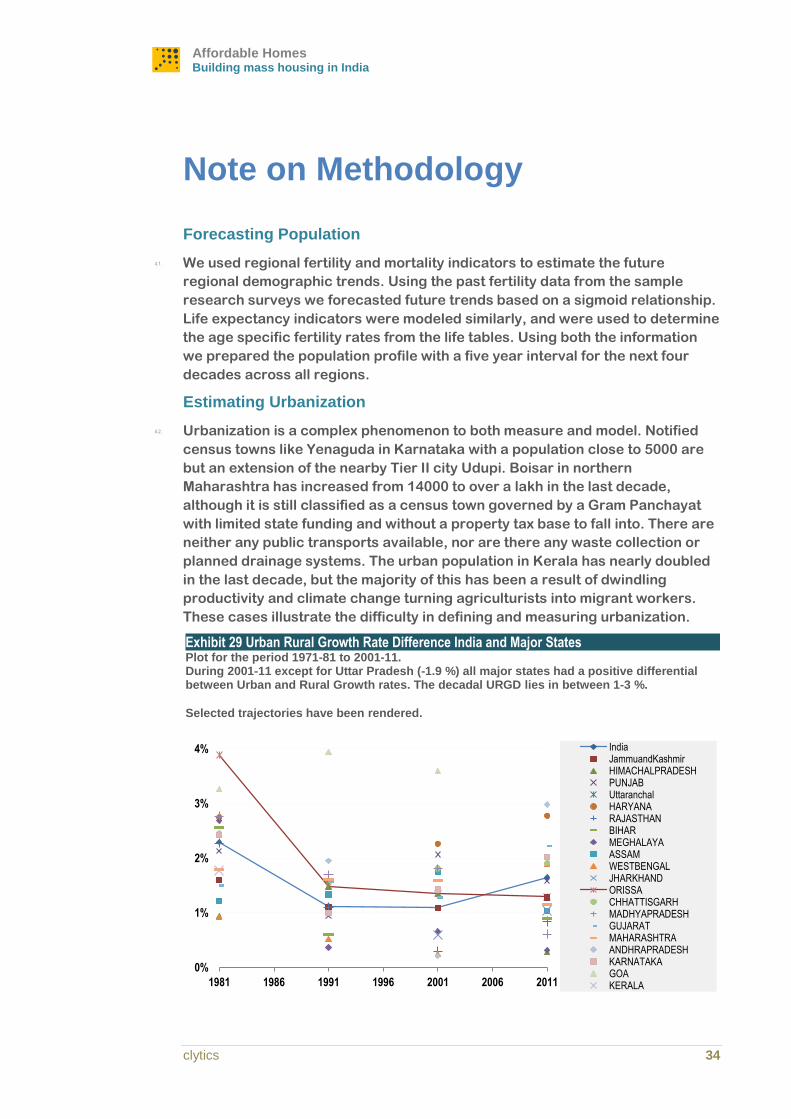
Exhibit 29 Urban Rural Growth Rate Difference India and Major States Plot for the period 1971-81 to 2001-11. During 2001-11 except for Uttar Pradesh (-1.9 %) all major states had a positive differential between Urban and Rural Growth rates. The decadal URGD lies in between 1-3 %.
Selected trajectories have been rendered.
Note on Methodology
Note on Methodology
35 CITY 2.0
There are, however, limited variables through which, access to urban
amenities and services can be defined and compared across an entire region.
The census of India uses three criteria: i) a minimum population of 5,000, ii) at
least 75 % of the male main working population engaged in non-agricultural
pursuits and iii) a density of population of at least 400 persons per sq. km. For
the purpose of this study, we used the methodology laid by the census for our
forecasts.
4.3. Urbanization is closely related to the structure of the economy, the growth rate
of the economic engine and access to infrastructure facilities. We modeled
rural, urban ratio on the pattern observed throughout the world. We adjusted
the forecasted values based on rural, urban growth rates with historical
observations. Rural, urban growth rate differential have been wavering around
1-3 % of the major states as per the trend observed in between 1981-2011. We
used the forecasted urbanization, the current cohort population distribution of
rural and urban areas and the future net cohort population to determine the
future cohort population of rural and urban areas.
-5%
0%
5%
1 10
City -
Urb
an
pro
vin
ce
po
pu
latio
n d
eca
da
l g
row
th r
ate
d
iffe
ren
tia
l
Log Population Millions
2001-11
1991-01
1981-91
Exhibit 30 Forecasting city level population using differential growth rates Large population in mega cities dampen its growth relative to the urban population of the province in which it is located. For smaller cities with population under a million the effect is more diffuse. Differential average decadal growth rates of million plus cities [2011 census] and their parent province’s increase in urban population have been plotted against respective cities population. The damping trend is found similarly across the
worldError! Bookmark not defined.
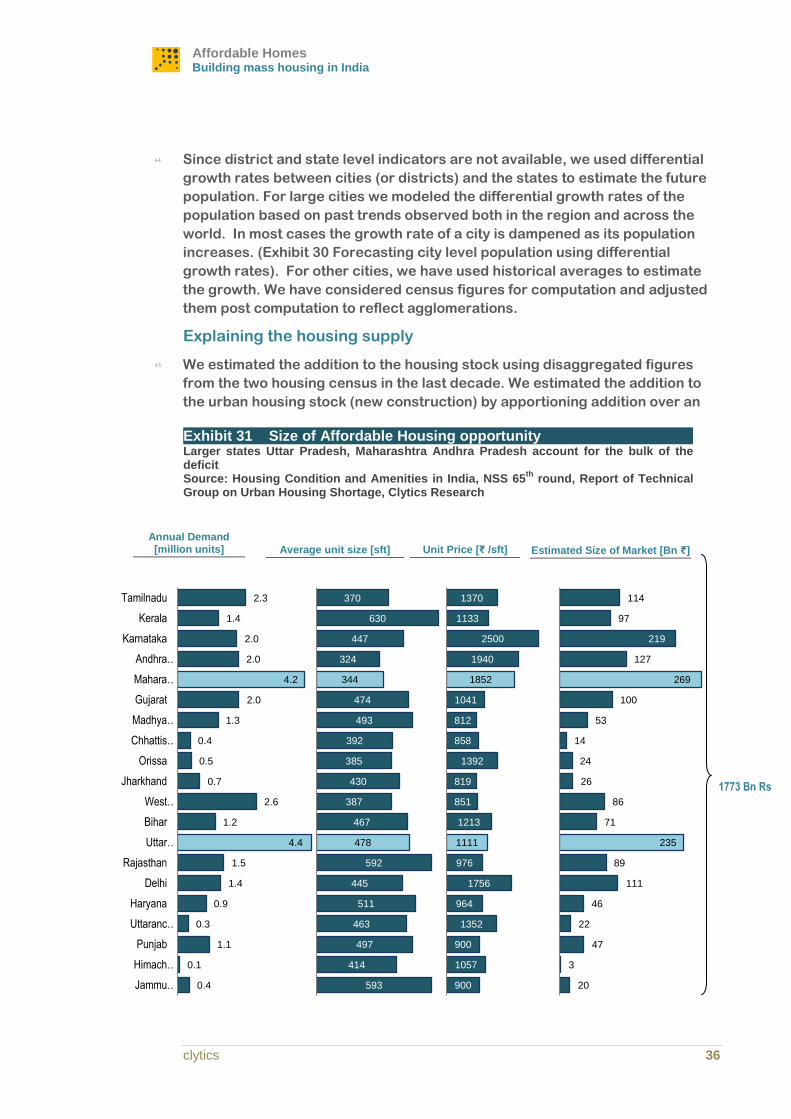
Affordable Homes Building mass housing in India
clytics 36
4.4. Since district and state level indicators are not available, we used differential
growth rates between cities (or districts) and the states to estimate the future
population. For large cities we modeled the differential growth rates of the
population based on past trends observed both in the region and across the
world. In most cases the growth rate of a city is dampened as its population
increases. (Exhibit 30 Forecasting city level population using differential
growth rates). For other cities, we have used historical averages to estimate
the growth. We have considered census figures for computation and adjusted
them post computation to reflect agglomerations.
Explaining the housing supply
4.5. We estimated the addition to the housing stock using disaggregated figures
from the two housing census in the last decade. We estimated the addition to
the urban housing stock (new construction) by apportioning addition over an
20
3
47
22
46
111
89
235
71
86
26
24
14
53
100
269
127
219
97
114
900
1057
900
1352
964
1756
976
1111
1213
851
819
1392
858
812
1041
1852
1940
2500
1133
1370
0.4
0.1
1.1
0.3
0.9
1.4
1.5
4.4
1.2
2.6
0.7
0.5
0.4
1.3
2.0
4.2
2.0
2.0
1.4
2.3
Jammu …
Himach…
Punjab
Uttaranc…
Haryana
Delhi
Rajasthan
Uttar …
Bihar
West …
Jharkhand
Orissa
Chhattis…
Madhya …
Gujarat
Mahara…
Andhra …
Karnataka
Kerala
Tamilnadu
593
414
497
463
511
445
592
478
467
387
430
385
392
493
474
344
324
447
630
370
Exhibit 31 Size of Affordable Housing opportunity Larger states Uttar Pradesh, Maharashtra Andhra Pradesh account for the bulk of the deficit Source: Housing Condition and Amenities in India, NSS 65
th round, Report of Technical
Group on Urban Housing Shortage, Clytics Research
Annual Demand [million units]
Average unit size [sft]
Unit Price [₹ /sft]
Estimated Size of Market [Bn ₹]
1773 Bn Rs
Note on Methodology
Note on Methodology
37 CITY 2.0
entire region to the percentage urban population in the last census. We
revisited the estimation using the National sample survey estimates for fresh
construction and readjusted the estimates. Our estimates of urbanization and
forecast of the household size and the demography gave a sense of the future
housing demand over urban regions. While the trends from the last two
censuses gave an indication to the supply. We combined both the information
to get a sense of the future deficit in a business as usual scenario.
4.6. To estimate the size of the opportunity of Affordable housing we had to first
figure out the average dwelling size in different regions. We plugged NSS
estimates for the same. To bring out differences in price in different regions we
used average monthly rentals in different regions and adjusted a mean price
point across India to reflect the difference. On the lower side, we used a cutoff
of 950 Rs shift to reflect the cost of construction Combining unit size , price
point and the future demand gave a sense to the business potential.
4.7. To cross check the estimates we used Indian Human development survey
findings to prepare a model of the demand curve. We adjusted the survey data
from 2005 to 2013 to reflect the household economic growth and inflation. We
used pooled estimates from the survey for the ratio of savings to income for
different income quintiles and used the result to prepare a potential demand for
houses across the demographic profile. We then applied this demand curve to
our estimates of household growth to bring out the demand. The estimates
from both the methods were found to be in close agreement.
4.8. While evaluating the industry, we chose to analyze the supply of affordable
housing along three dimensions: Affordability, Coverage and Scale.
Affordability of the units measuring the price point of the average unit sold till
date. We accounted any past unit / projects sold using the most recent price of
similar units offered in a similar location, to eliminate price inflation. On the
second dimension we measure coverage indicated by out of the total urban
population how many are being targeted. We accounted the entire population
of an urban agglomeration in which the project has been launched as a target
population. Finally, we accounted for the experience by the number of units
which are committed to customer or have been delivered till date.

Affordable Homes Building mass housing in India
clytics 38
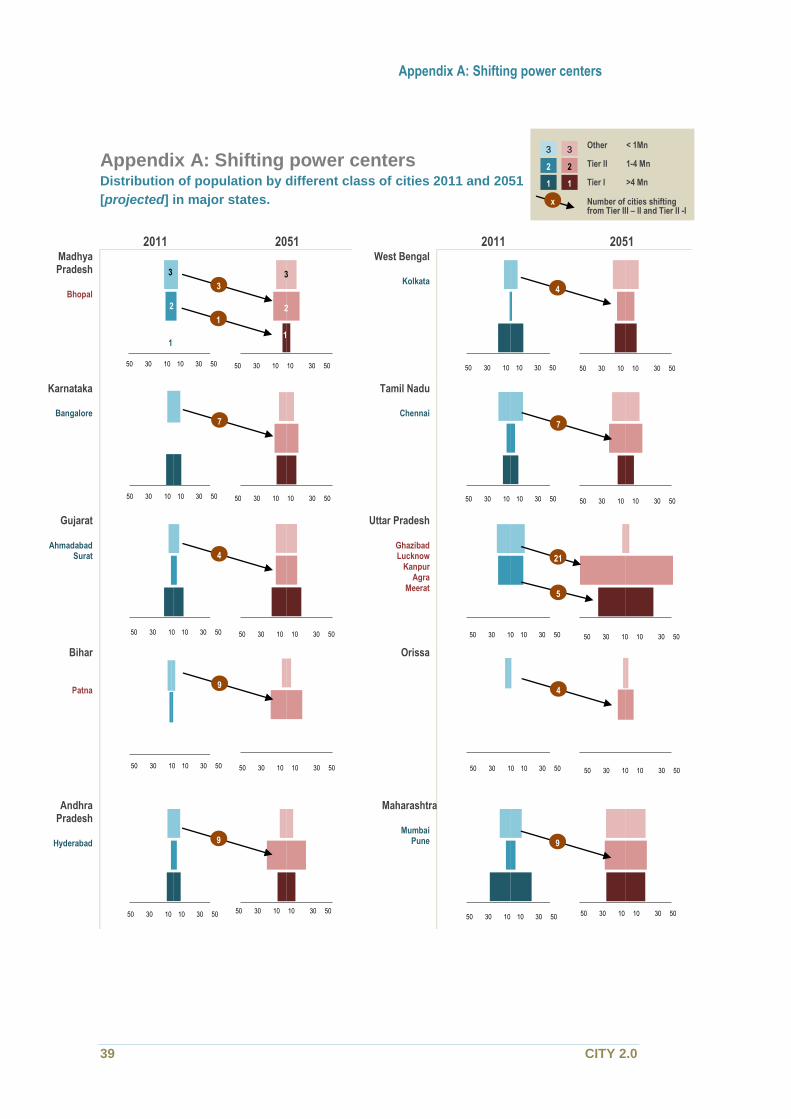
Appendix A: Shifting power centers
Appendix A: Shifting power centers
39 CITY 2.0
< 1Mn
3
2
1
2
1
3
Appendix A: Shifting power centers Distribution of population by different class of cities 2011 and 2051
[projected] in major states.
2011 2051 2011 2051 Madhya Pradesh
Bhopal
West Bengal
Kolkata
Karnataka
Bangalore
Tamil Nadu
Chennai
Gujarat
Ahmadabad Surat
Uttar Pradesh
Ghazibad Lucknow
Kanpur Agra
Meerat
Bihar
Patna
Orissa
Andhra Pradesh
Hyderabad
Maharashtra
Mumbai Pune
50 30 10 10 30 50 50 30 10 10 30 50
50 30 10 10 30 50 50 30 10 10 30 50 50 30 10 10 30 50 50 30 10 10 30 50
50 30 10 10 30 50 50 30 10 10 30 50 50 30 10 10 30 50 50 30 10 10 30 50
50 30 10 10 30 50 50 30 10 10 30 50
50 30 10 10 30 50 50 30 10 10 30 50
50 30 10 10 30 50 50 30 10 10 30 50 50 30 10 10 30 50 50 30 10 10 30 50
50 30 10 10 30 50 50 30 10 10 30 50
1
3
4
9
7
9
7
9
4
4
21
5
Other < 1Mn
Tier II 1-4 Mn
Tier I >4 Mn
Number of cities shifting from Tier III – II and Tier II -I
1
3
1
3
2 2
x
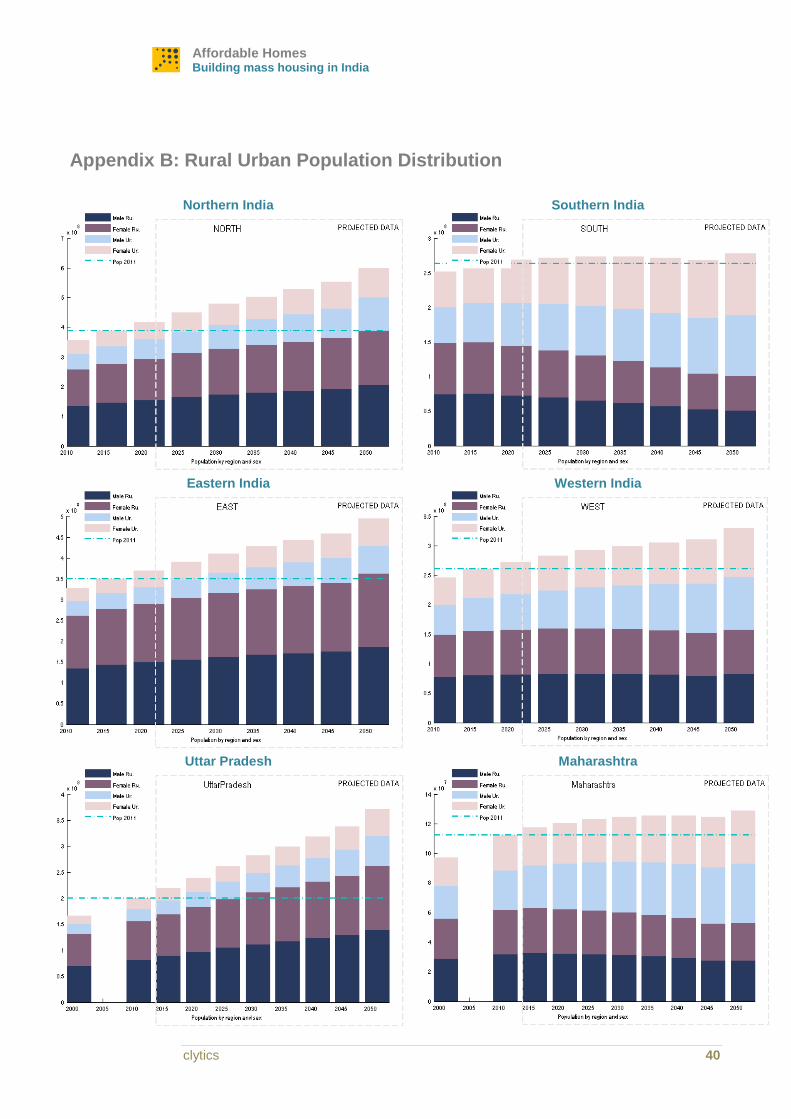
Affordable Homes Building mass housing in India
clytics 40
Appendix B: Rural Urban Population Distribution
Northern India Southern India
Eastern India Western India
Uttar Pradesh Maharashtra

Appendix C: Glossary of terms
Appendix C: Glossary of terms
41 CITY 2.0
Appendix C: Glossary of terms
Group Housing means a building unit constructed or to be constructed with one or
more floors having more than two dwelling units having common service facilities.
Land ownership is shared between the residents.
Carpet area is the area enclosed within the walls, which is required to lay the carpet.
This area does not include the thickness of the inner walls . It refers to the actual
usable area in a unit.
Build up area is the unit footprint. It includes the area of all internal and external
walls balconies, cupboard space over the carpet area.
Super Built up area is the built up area plus proportionate area of common areas
such as the lobby, lifts shaft, stairs, etc. The plinth area along with a share of all
common areas proportionately divided amongst all unit owners makes up the super
built-up area
Floor Space Index FSI is the ratio of the build up area to the total plot area. FSI is
used by urban bodies to control the density of development in different zones. For
example a FSI of 2 over a 5 Acre protect will allow a build up area of approximately
8000 m2
Ground Coverage is the footprint of the build-up area less exclusions dictated by
different by laws. Ground coverage is used as a tool for controlling the amount of
open space in a project. However restrictive ground coverage ratio forces
developers to reach out vertically which renders a project less affordable.
Tier I,II,III cities refer to classes of cities based on population A tier I metro has a
population over 4 million, while a tier II has a population between 1 – 4 million while
a tier III ranges from a lakh up to a million.
Kanban is a tool employed to control the work in process inventory in a supply
chain. Kanban card is a visual communication exchanged between work centers to
trigger the supply of a predefined quantity of materials.
Andon is a system to notify a problem in a workstation. Andon empowers the bottom
line worker to take a decision to stop the production of the line if he encounters a
defect. The entire shop floor focuses to fix the problem before the line in restarted.

Affordable Homes Building mass housing in India
clytics 42
All information contained herein has been obtained by clytics from sources believed by it to be accurate and
reliable. Although reasonable care has been taken to ensure that the information herein is true, such information
is provided 'as is' without any warranty of any kind, and clytics in particular, makes no representation or warranty,
express or implied, as to the accuracy, timeliness or completeness of any such information. All information
contained herein must be construed solely as statements of opinion, and clytics shall not be liable for any losses
incurred by users from any use of this publication or its contents.
Appendix C: Glossary of terms
Appendix C: Glossary of terms
43 CITY 2.0
If you would like any further information regarding this report, please reach out to: [email protected] (+91)-80-2842-7685

Affordable Homes Building mass housing in India
clytics 44
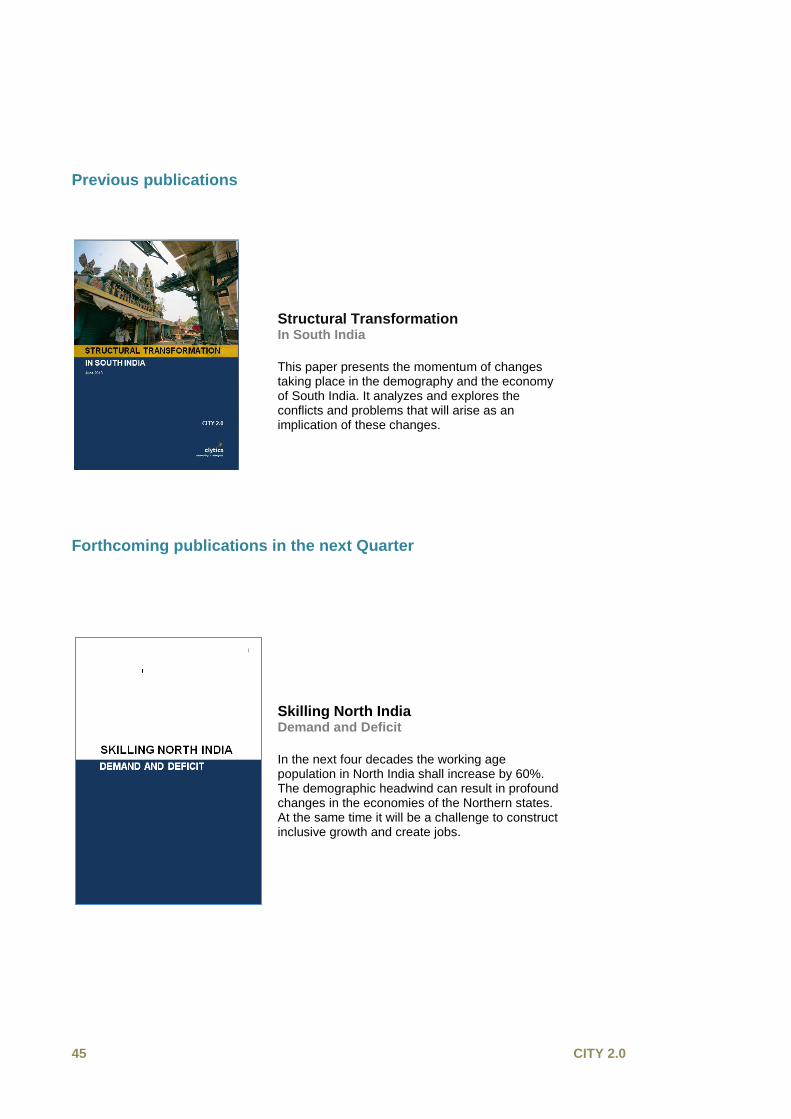
45 CITY 2.0
Previous publications
Structural Transformation In South India
This paper presents the momentum of changes taking place in the demography and the economy of South India. It analyzes and explores the conflicts and problems that will arise as an implication of these changes.
Forthcoming publications in the next Quarter
Skilling North India Demand and Deficit
In the next four decades the working age population in North India shall increase by 60%. The demographic headwind can result in profound changes in the economies of the Northern states. At the same time it will be a challenge to construct inclusive growth and create jobs.

Affordable Homes Building mass housing in India
clytics 46
January 2014 CITY 2.0
clytics
community + analytics