Embed Size (px)
Citation preview
AFFORDABLE FINANCING FOR SOLAR ENERGY
Presentation by
Abhilakh SinghGeneral Manager
21st June, 2017

Renewable Energy Potential, Achievements & Targets
* At 100 m hub height estimated by NIWE
Solar 100 GW
Wind 60 GW
Bio Energy 10 GW
Small Hydro 5 GW
Sector Potential (GW)
(As on date)
Achievement (GW)
(as on Mar 2017)
Wind 302* 32.3
Solar 750 12.3
Small Hydro 20 4.3
Biomass incl bagasse Cogen.
23 8.3
Total 1095 57.2
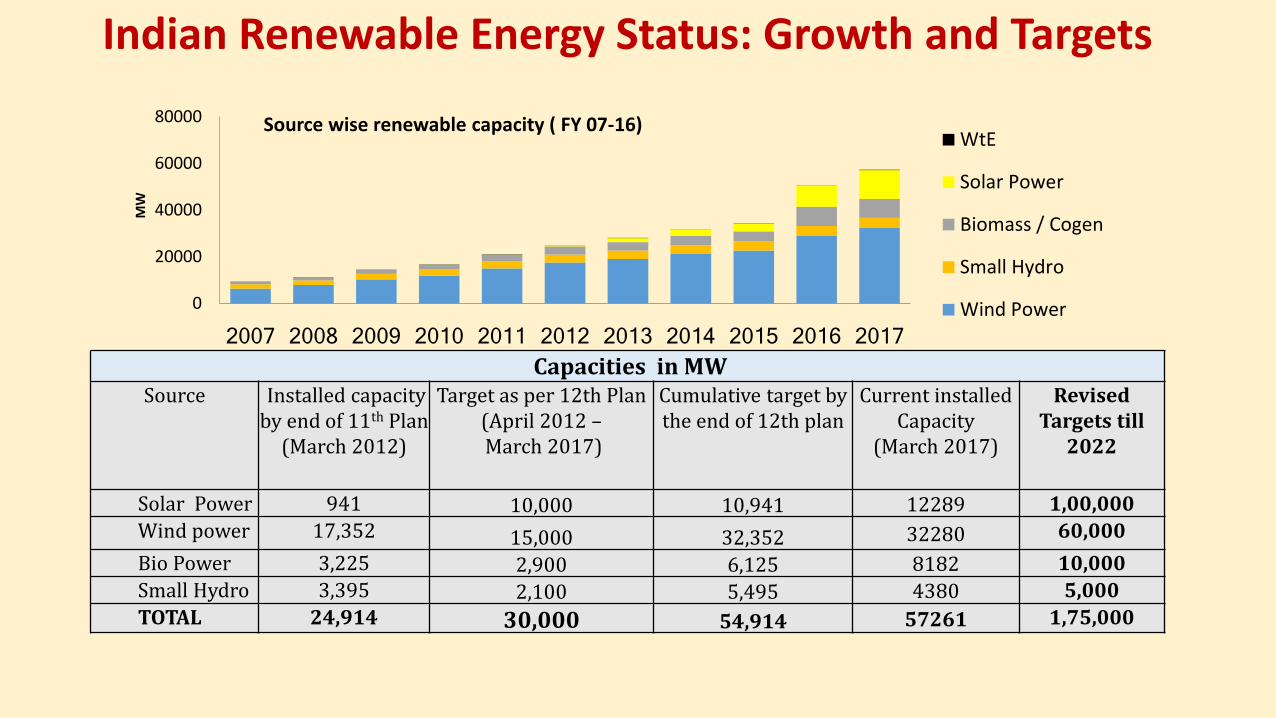
Indian Renewable Energy Status: Growth and Targets
0
20000
40000
60000
80000
2007 2008 2009 2010 2011 2012 2013 2014 2015 2016 2017
MW
Source wise renewable capacity ( FY 07-16)WtE
Solar Power
Biomass / Cogen
Small Hydro
Wind Power
Capacities in MWSource Installed capacity
by end of 11th Plan(March 2012)
Target as per 12th Plan(April 2012 –March 2017)
Cumulative target by the end of 12th plan
Current installed Capacity
(March 2017)
Revised Targets till
2022
Solar Power 941 10,000 10,941 12289 1,00,000
Wind power 17,352 15,000 32,352 32280 60,000
Bio Power 3,225 2,900 6,125 8182 10,000
Small Hydro 3,395 2,100 5,495 4380 5,000
TOTAL 24,914 30,000 54,914 57261 1,75,000
61.788
129.9
182.5205.2 206.8
276.1
317.5290.7
268.6
315348.5
287.5
0
50
100
150
200
250
300
350
400
2004 2005 2006 2007 2008 2009 2010 2011 2012 2013 2014 2015 2016
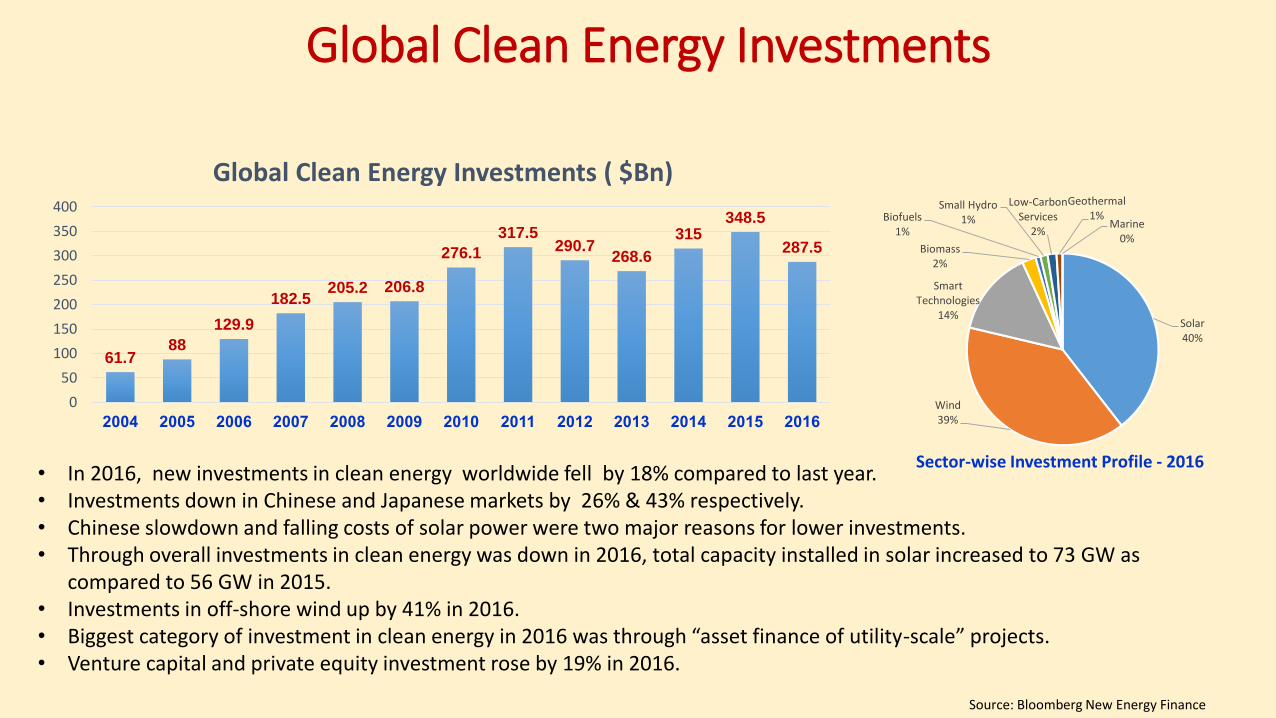
Global Clean Energy Investments ( $Bn)
• In 2016, new investments in clean energy worldwide fell by 18% compared to last year.• Investments down in Chinese and Japanese markets by 26% & 43% respectively. • Chinese slowdown and falling costs of solar power were two major reasons for lower investments.• Through overall investments in clean energy was down in 2016, total capacity installed in solar increased to 73 GW as
compared to 56 GW in 2015.• Investments in off-shore wind up by 41% in 2016.• Biggest category of investment in clean energy in 2016 was through “asset finance of utility-scale” projects. • Venture capital and private equity investment rose by 19% in 2016.
Solar40%
Wind39%
Smart Technologies
14%
Biomass2%
Biofuels1%
Small Hydro1%
Low-Carbon Services
2%
Geothermal 1%
Marine0%
Sector-wise Investment Profile - 2016
Global Clean Energy Investments
Source: Bloomberg New Energy Finance
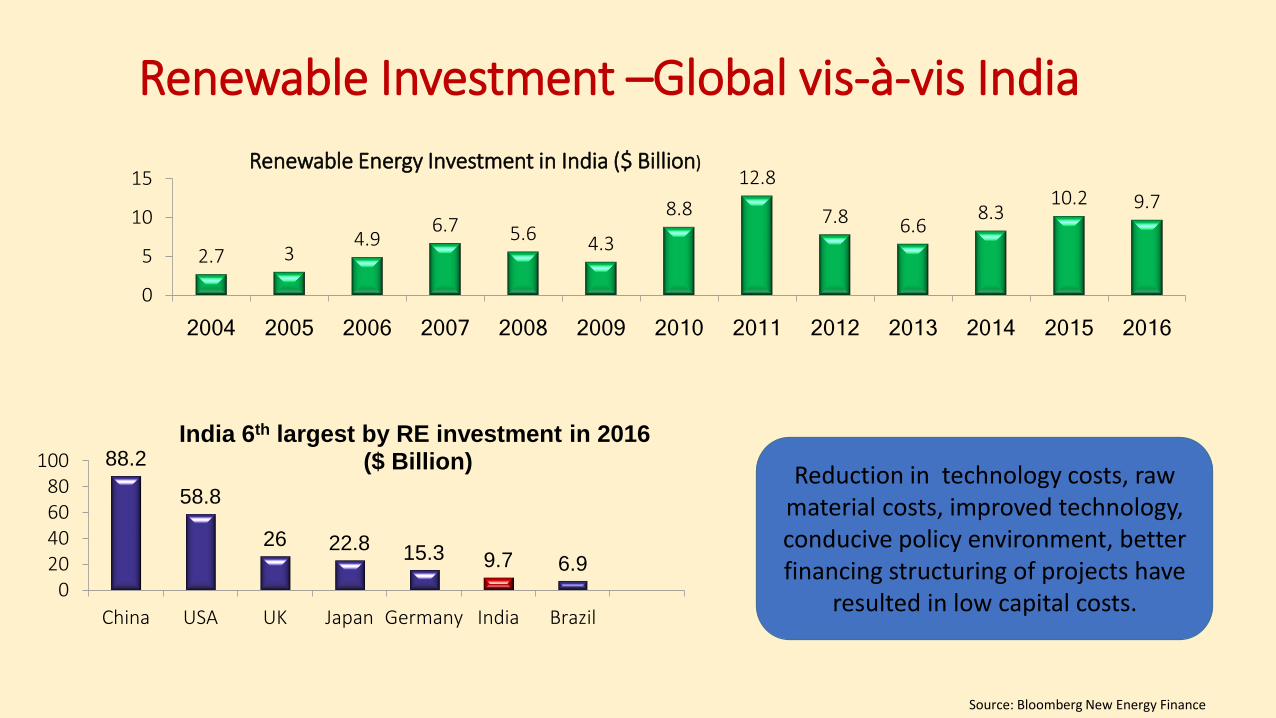
Renewable Investment –Global vis-à-vis India
2.7 34.9
6.7 5.6 4.3
8.8
12.8
7.8 6.68.3
10.2 9.7
0
5
10
15
2004 2005 2006 2007 2008 2009 2010 2011 2012 2013 2014 2015 2016
Renewable Energy Investment in India ($ Billion)
88.2
58.8
26 22.8 15.3 9.7 6.9
020406080
100
China USA UK Japan Germany India Brazil
India 6th largest by RE investment in 2016($ Billion)
Source: Bloomberg New Energy Finance
Reduction in technology costs, raw material costs, improved technology, conducive policy environment, better financing structuring of projects have
resulted in low capital costs.

Cumulative Growth of Solar Power Installed Capacity
2 10 37
941
1645
2631
3744
6763
12289
0
2000
4000
6000
8000
10000
12000
14000
2008-09 2009-10 2010-11 2011-12 2012-13 2013-14 2014-15 2015-16 2016-17
In MW
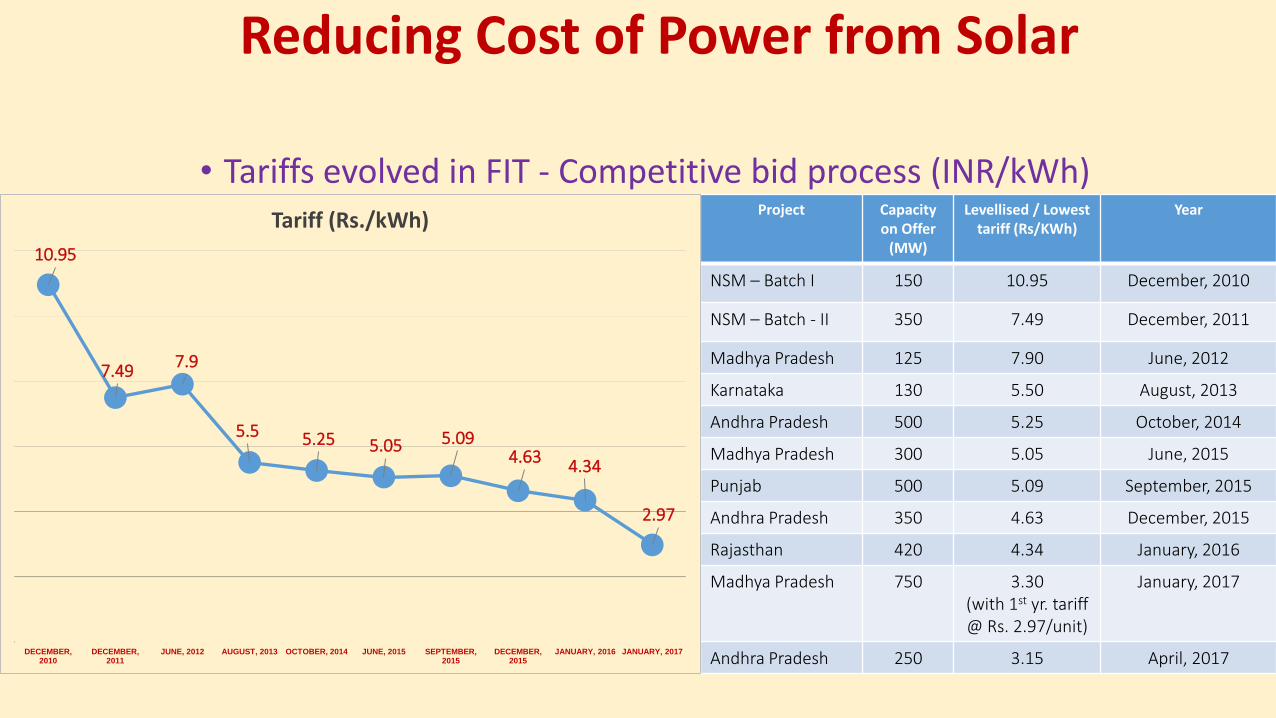
Reducing Cost of Power from Solar
• Tariffs evolved in FIT - Competitive bid process (INR/kWh)Project Capacity
on Offer(MW)
Levellised / Lowest tariff (Rs/KWh)
Year
NSM – Batch I 150 10.95 December, 2010
NSM – Batch - II 350 7.49 December, 2011
Madhya Pradesh 125 7.90 June, 2012
Karnataka 130 5.50 August, 2013
Andhra Pradesh 500 5.25 October, 2014
Madhya Pradesh 300 5.05 June, 2015
Punjab 500 5.09 September, 2015
Andhra Pradesh 350 4.63 December, 2015
Rajasthan 420 4.34 January, 2016
Madhya Pradesh 750 3.30(with 1st yr. tariff @ Rs. 2.97/unit)
January, 2017
Andhra Pradesh 250 3.15 April, 2017
10.95
7.497.9
5.5 5.25 5.05 5.094.63
4.34
2.97
DECEMBER, 2010
DECEMBER, 2011
JUNE, 2012 AUGUST, 2013 OCTOBER, 2014 JUNE, 2015 SEPTEMBER, 2015
DECEMBER, 2015
JANUARY, 2016 JANUARY, 2017
Tariff (Rs./kWh)

Factors leading to reduction in Solar Tariffs
- Payment security with NTPC and SECI as the power off-takers in most bids
- Three month payment guarantee in case of delays from the distribution company
Guarantee by Off-takers
- Enables developers to lower their bids in real time
- Promotes competition with transparent lower tariffs
Online reverse bidding
- Large scale projects being bid result in economies of scale
- Faster and easier implementation of projects
- Common pool of resources and better network utilisation
Scale of projects and Solar Parks
Reduction in EPC costs Entry of major foreign players
De-risked Bidding
Reduced technology costs
Strong competition with lower margins for EPC’s
Larger pool of investors
Concessional financing

Funding Requirements
• To achieve the target of 175 GW of renewable energy, approximately Rs. 7,15,000 Cr. (~$110 Bn) needed over the period of next 5 years (until 2022)
175 GW RE plan entails investment of Approx. $110 Billion (About Rs. 7,15,000 Crore)
Debt (70%) Equity (30%)
$ 33 Billion (~ Rs. 2, 15,000 Crores)
$ 77 Billion (~ Rs. 5, 00,000 Crores)

Sources of Funds for RE Sector
Domestic• During RE-Invest 2015, domestic Banks/ FIs committed to fund 76 GW of RE projects which is
equivalent to approx. Rs. 3,80,000 cr. / (~ $57 bn)
Multilateral / Bilateral Agencies support to RE Projects
• World Bank inked agreements with SBI for $ 625 mn facility to support grid connected rooftopsolar programme
• The Asian Development Bank (ADB) to provide $500 mn in financing for rooftop solarsystems through PNB.
• The New Development Bank (NDB), sanctioned a $250 mn loan for RE projects in India.
• US Trade and Development Agency committed $2 billion for developing green energyprojects.
• World Bank is providing $100 Mn to IREDA to further lend the amount for development ofSolar Parks

Sources of Funds for RE Sector
Green Bonds / Tax Free Bonds:• The Global green bond market is gaining momentum with issuance doubling to $81 billion in 2016
from $42 billion in 2015.
• According to Moody’s analysis, Green Bond market to touch $ 206 bn in 2017.
• Recently, NTPC , Yes Bank, Axis Bank raised money through Green Bonds amounting $300 mn, $490mn and $500 mn respectively.
• Recently, IREDA raised Rs. 700 Crs ($105 mn) through green energy bonds in domestic market
Masala Bonds:• Rupee-denominated bonds issued to offshore investors settled in dollars and, therefore, the
currency risk resides with investors.
• IREDA also plans to raise $350 mn green masala bonds at Singapore/ London Stock exchange.
• Pension/ Endowment Funds: These would play a key role as a capital source for RE projects

INTERNATIONAL SOLAR ALLIANCE
• Mobilize more than 1 trillion US $ of low cost capital for solar deployment by 2030.
• Maximize deployment of Solar Applications.
• Solar R & D.
• Capacity Building.
• 24 X 7 Solar Knowledge Centre.
• Other objectives as set out by the International Steering Committee / Assembly of ISA from time to time.
Five objectives of ISA

ISA Programme “Affordable Finance at Scale”
• ISA aims 1,000 GW of solar capacity by 2030 across its member countries.
• Expected investments are to the tune of about USD 1000 Bn.
• Reduced cost of finance through Innovative financial instruments- Critical Factor.

IREDA Financing Products / Schemes
Direct Lending Other Services Lending through and with Financial Intermediaries
Project & Equipment Financing
Loans for Manufacturing
Take Over Loans from other Banks / FIs
Co-financing/ Consortium
Bridge Loans against SDF
Underwriting of Debt / Loan Syndication
Line of Credit to NBFCs for on-lending to RE / EEC Projects
Guarantee Assistance Scheme to RE Suppliers / Promoters
Credit Enhancement Scheme
Letter of Comfort/ Letter of Undertaking
Discounting of Energy Bills
SDF : Sugar Development Fund
Loan against Securitization
• IREDA has always been the prime mover and showing the way to its peers in RE financing. • IREDA has been continuously developing new /innovative schemes to meet the market requirement & for the
development of RE sector.
Responsible for fund handling for some of the MNRE schemes Funding Scheme for Rooftop
Solar PV Projects
IREDA- Introduction of New Schemes / Products
Several innovative and new financial schemes /products introduced to cater emerging markets, namely:
1. Scheme for Solar Roof Top through Aggregator (RESCO)
2. Scheme for discounting of Energy Bills to address the issue of delay of payments by DISCOMs.
3. Lines of credit to Non-Banking Financial Companies for on-lending to RE/EEC projects
4. Short term loan assistance to RE developers / suppliers / contractors
5. Bridge loan assistance to RE promoters / developers against capital subsidies / VGF/ GBI
6. Underwriting of debt / loan syndication
7. Guarantee assistance to RE suppliers / promoters.
8. IREDA-NCEF RE-finance Scheme – for revival of stressed projects in biomass and small hydro sectors.
9. Credit Enhancement Scheme for raising Bonds towards Renewable Energy Projects (Solar / Wind).
10. Loan Scheme for “Access to Energy Projects” with “First Loss Mechanism” under KfW Line of Credit
11. Policy for issue of Letter of Comfort (LoC)/ Letter of Undertaking (LUT) for opening Letter of Credit (LC).
Measures for accessing “Affordable Finance at Scale
• Standardization of transaction documents
• Power Purchase Agreements (PPA)
• Request for Proposal (RfP)
• O&M Contract documents
• Trustee Agreements
• Trust & Retention Account (TRA)
• Conducive Policy Regime
• Long term visible policies
• Regulatory support
• Risk Mitigation Mechanisms
• Technological risks
• Financial risks
• Project implementation risks
• Power off-take risks
• Quality issues
• Performance & efficiency risks
• Capabilities of Banks and FIs to raise resources to the tune of US$ 1000 Billion by 2030.
Possible Solutions for raising affordable finance
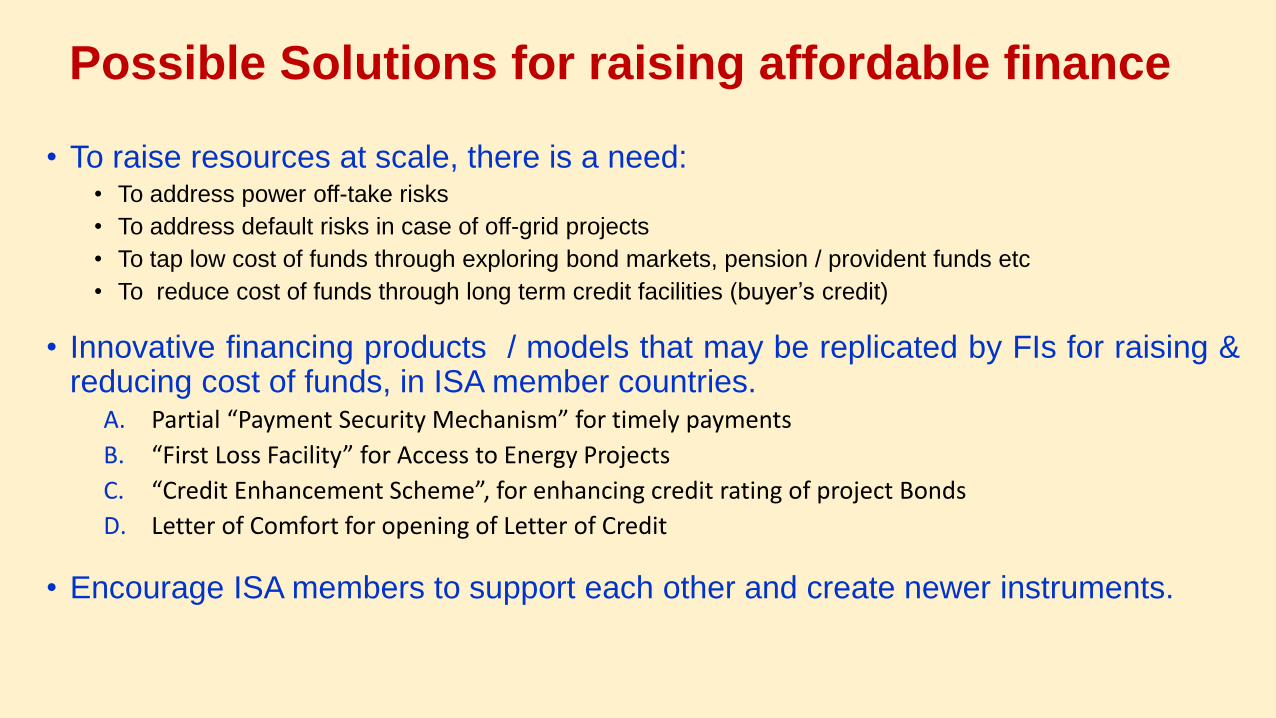
• To raise resources at scale, there is a need:• To address power off-take risks
• To address default risks in case of off-grid projects
• To tap low cost of funds through exploring bond markets, pension / provident funds etc
• To reduce cost of funds through long term credit facilities (buyer’s credit)
• Innovative financing products / models that may be replicated by FIs for raising &reducing cost of funds, in ISA member countries.
A. Partial “Payment Security Mechanism” for timely payments
B. “First Loss Facility” for Access to Energy Projects
C. “Credit Enhancement Scheme”, for enhancing credit rating of project Bonds
D. Letter of Comfort for opening of Letter of Credit
• Encourage ISA members to support each other and create newer instruments.

Partial Payment Security Mechanism (PPSM)
• Delays by DISCOMs in payments to developers impact the cash flows.
• Discourages lenders - charge higher risk premium
• Investors become wary of investing
• Bids invited by SECI & NVVN – which act as intermediary, have their own payment security mechanism .
• Attracted more competitive bids.
• Resulted in Tariff reduction by around 20 paise / Kwh. - equivalent to Rs. 30 cr p.a. for 1 GW.
• PSM can also help in partially replacing VGF
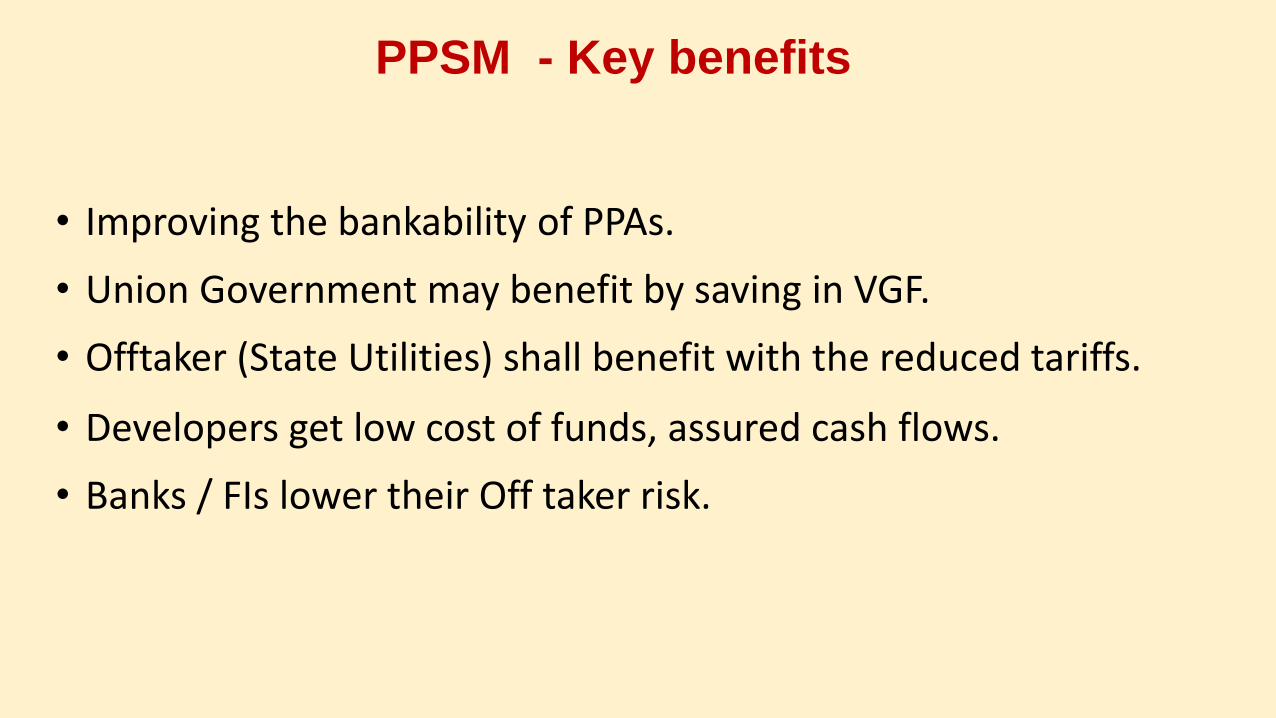
PPSM - Key benefits
• Improving the bankability of PPAs.
• Union Government may benefit by saving in VGF.
• Offtaker (State Utilities) shall benefit with the reduced tariffs.
• Developers get low cost of funds, assured cash flows.
• Banks / FIs lower their Off taker risk.
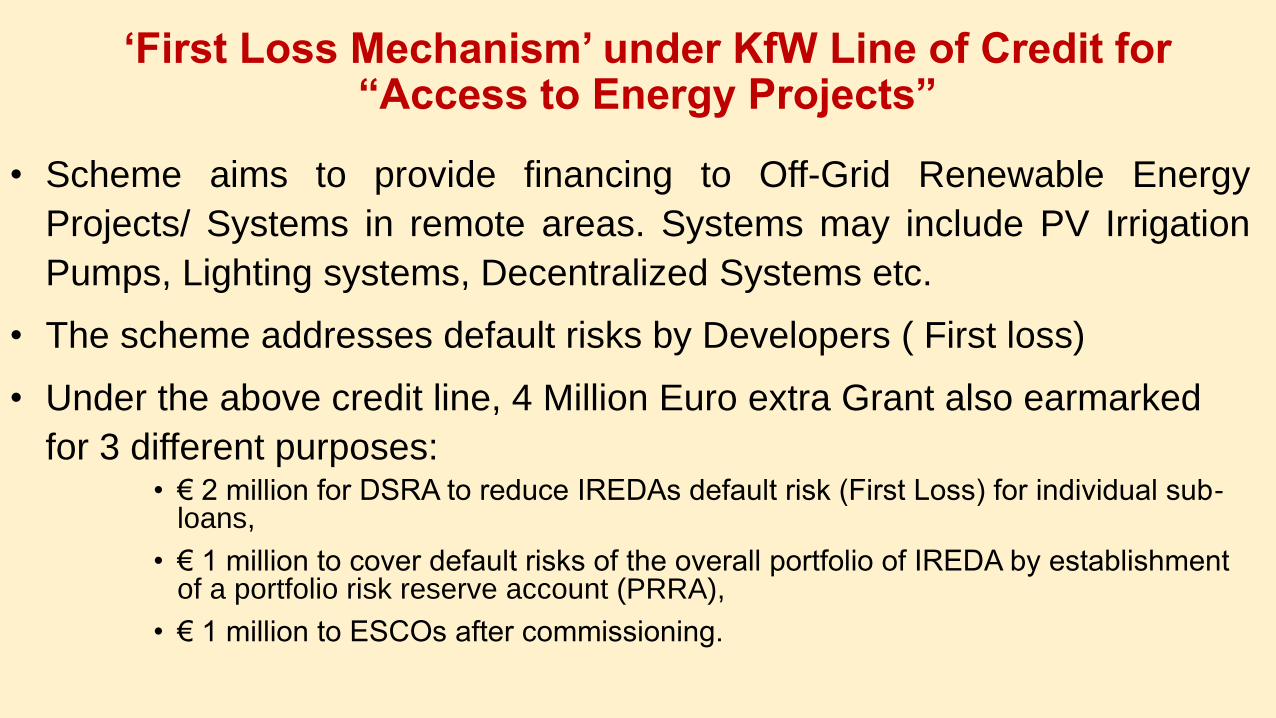
‘First Loss Mechanism’ under KfW Line of Credit for “Access to Energy Projects”
• Scheme aims to provide financing to Off-Grid Renewable Energy
Projects/ Systems in remote areas. Systems may include PV Irrigation
Pumps, Lighting systems, Decentralized Systems etc.
• The scheme addresses default risks by Developers ( First loss)
• Under the above credit line, 4 Million Euro extra Grant also earmarked
for 3 different purposes: • € 2 million for DSRA to reduce IREDAs default risk (First Loss) for individual sub-
loans,
• € 1 million to cover default risks of the overall portfolio of IREDA by establishment of a portfolio risk reserve account (PRRA),
• € 1 million to ESCOs after commissioning.
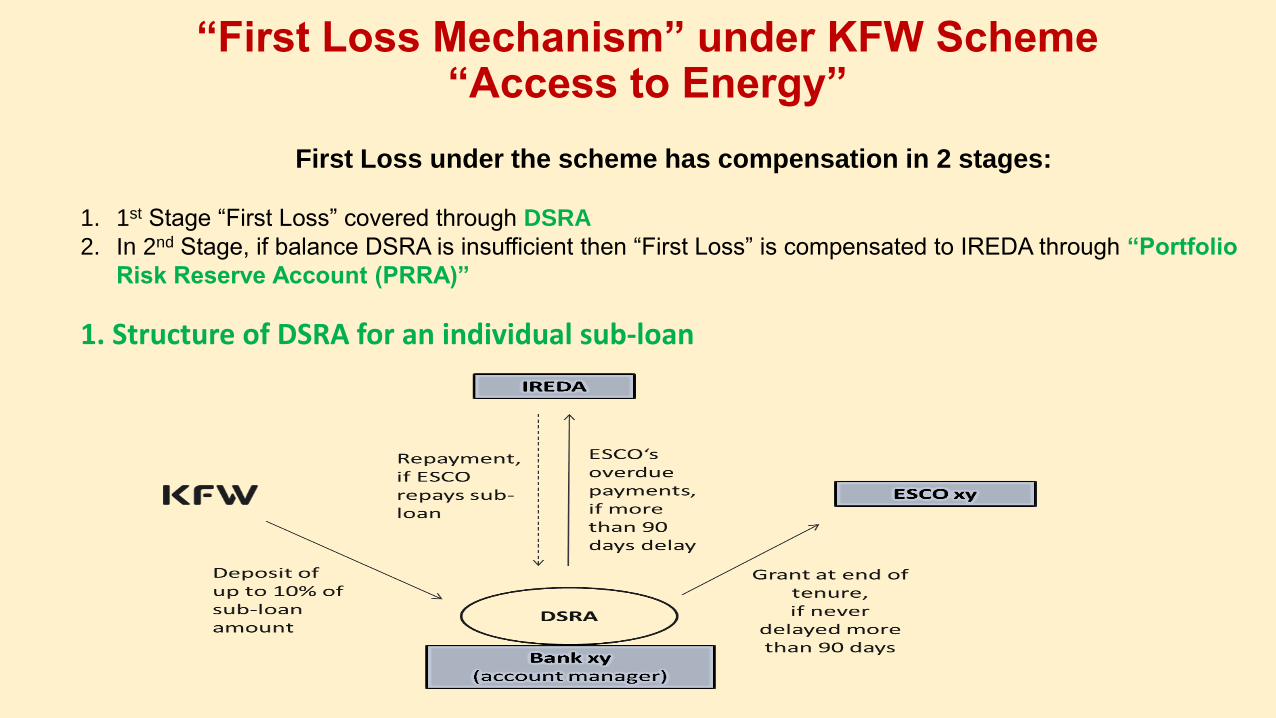
“First Loss Mechanism” under KFW Scheme “Access to Energy”
1. Structure of DSRA for an individual sub-loan
First Loss under the scheme has compensation in 2 stages:
1. 1st Stage “First Loss” covered through DSRA
2. In 2nd Stage, if balance DSRA is insufficient then “First Loss” is compensated to IREDA through “Portfolio
Risk Reserve Account (PRRA)”
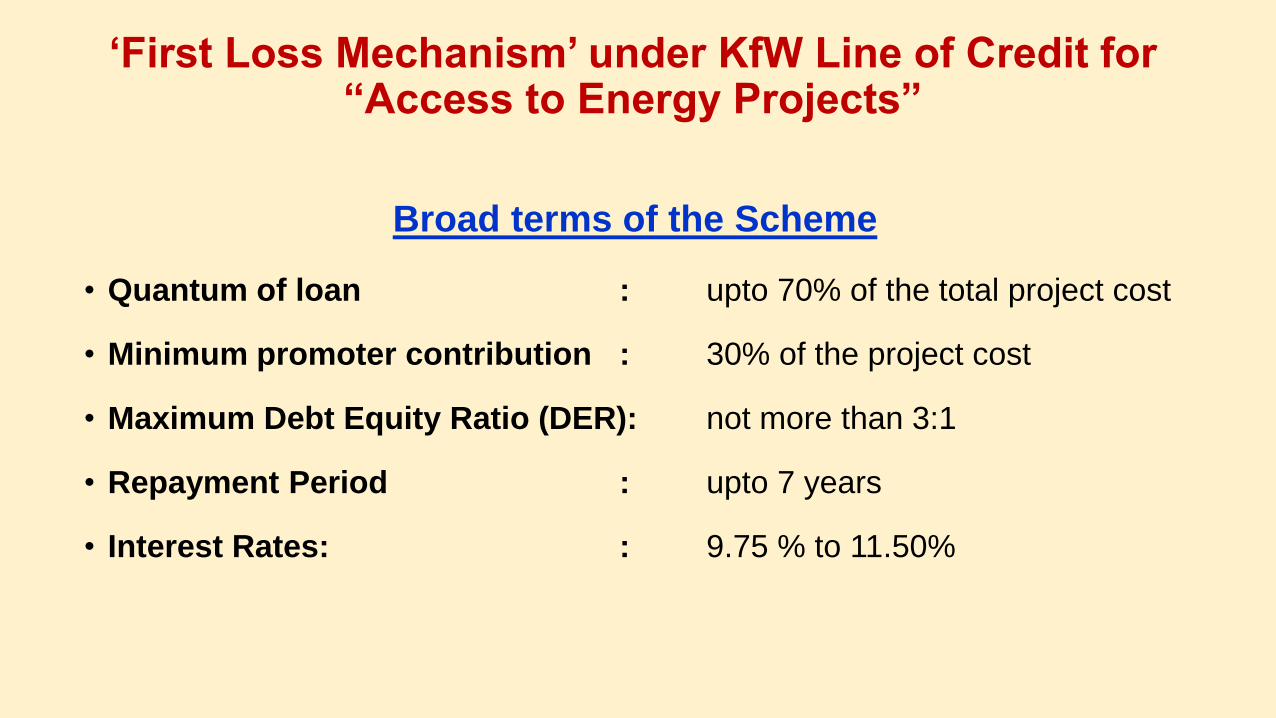
Broad terms of the Scheme
• Quantum of loan : upto 70% of the total project cost
• Minimum promoter contribution : 30% of the project cost
• Maximum Debt Equity Ratio (DER): not more than 3:1
• Repayment Period : upto 7 years
• Interest Rates: : 9.75 % to 11.50%
‘First Loss Mechanism’ under KfW Line of Credit for “Access to Energy Projects”
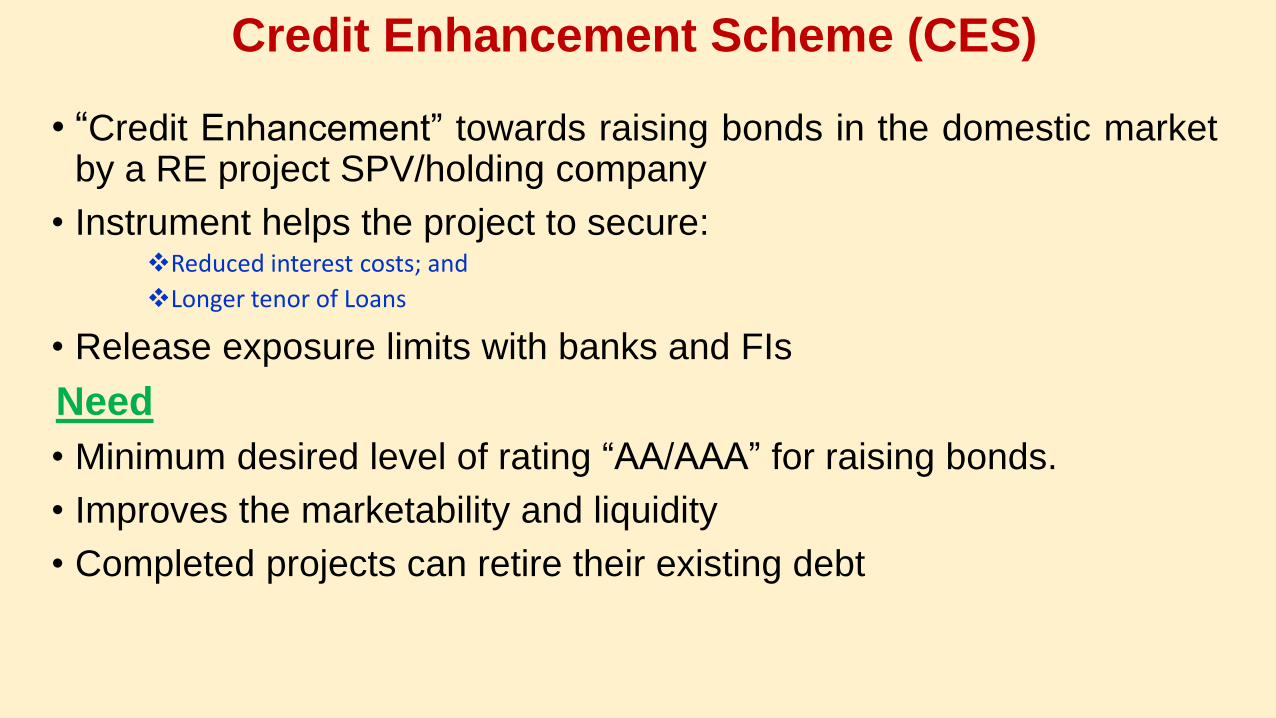
Credit Enhancement Scheme (CES)
• “Credit Enhancement” towards raising bonds in the domestic marketby a RE project SPV/holding company
• Instrument helps the project to secure:Reduced interest costs; and
Longer tenor of Loans
• Release exposure limits with banks and FIs
Need
• Minimum desired level of rating “AA/AAA” for raising bonds.
• Improves the marketability and liquidity
• Completed projects can retire their existing debt
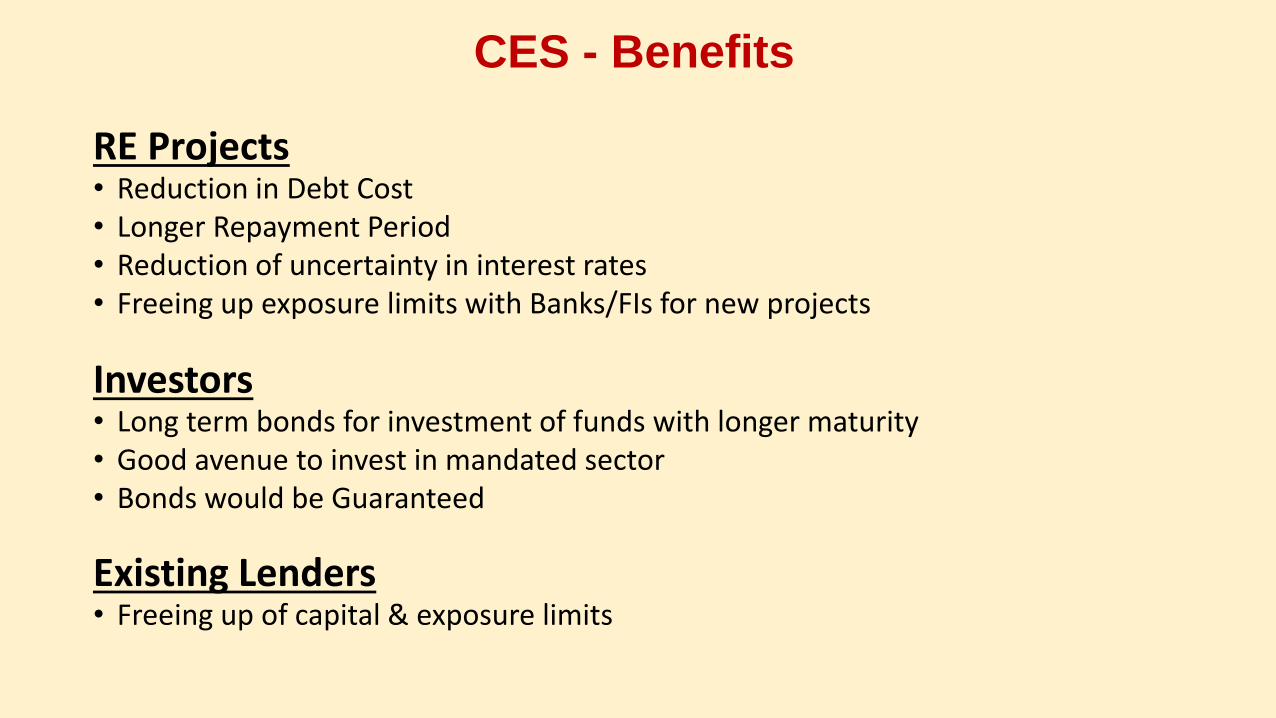
CES - Benefits
RE Projects• Reduction in Debt Cost• Longer Repayment Period• Reduction of uncertainty in interest rates • Freeing up exposure limits with Banks/FIs for new projects
Investors • Long term bonds for investment of funds with longer maturity• Good avenue to invest in mandated sector • Bonds would be Guaranteed
Existing Lenders• Freeing up of capital & exposure limits

Credit Enhancement – Structure
RE Project
AA
Bond Issue Programme
Partial Credit
GuaranteeBBB
Insurance
Companies
Pension Funds
Commercial
Banks
Inv
esto
rs
Co - Guarantor /Backstop Guarantor
Ratings Scale

Features of IREDA “CES” Scheme
Nature of Credit
Enhancement
Unconditional and irrevocable partial credit guarantee
Exposure Limit Upto 25% of the proposed issue size of the bonds &
Not more than 20% of Capitalized Project Cost
Tenure Upto 15 years
Pricing Guarantee Fee shall be in the range of 0.5% - 0.8% p.a
(Based on Bond tenure, External Credit Rating etc.)

Letter of Comfort (LoC) / Letter of Undertaking for Opening Letter of Credit (LC)
• Letter of Credit (LC) – Major requirement under EPC/ equipment supply contracts for Solar Projects
• Long term LoC facilities - Enable developers to avail cost benefits available under long term credit facilities such as Buyers Credit/ Suppliers Credit etc.
Benefits to Developers (Buyer’s Credit)
• Equipment Supplier gets paid on due date; whereas Developer gets extended date for making anpayment to supplier as per the cash flows.
• Developer can negotiate a better discount with Equipment Supplier and use the buyers credit route toavail financing.
• Developer can use this financing for any form of payment mode; open account, collections, or LCs.

IREDA Scheme Letter of Comfort (LoC) / Letter of Undertaking for Opening Letter of Credit (LC)
• Period of LoC : Up to 3 years
• Maximum Exposure : Up to 70% of total IREDA Loan exposure
Fee Structure
LoC Type Applicable Fee
For Short Term LoC (Upto 1 year) 0.50% (i.e. the Minimum applicable fee)
For Long Term LoC(beyond 1 year period and maximum upto 3 years
0.65% - 1.25% (Depending on the CRRS rating of the project

Way Forward
These instruments can be adopted in otherISA member countries and replicated forlarge scale deployment of solar powerprojects at affordable costs.
THANK YOU
Indian Renewable Energy Development Agency Limited Email: [email protected] | www.ireda.in