Embed Size (px)
Citation preview

A≈rmative Action Around the WorldAn Empirical Study

A≈rmative ActionAround the World
An Empirical Study
T h o m a s S o w e l l
yale university press new haven & london

Copyright ∫ 2004 by Thomas Sowell.All rights reserved.
This book may not be reproduced, in whole or in part, including illustrations, inany form (beyond that copying permitted by Sections 107 and 108 of the
U.S. Copyright Law and except by reviewers for the public press),without written permission from the publishers.
Designed by James J. Johnson andset in Baskerville type by Keystone Typesetting, Inc.
Printed in the United States of America by R. R. Donnelley & Sons.
Library of Congress Cataloging-in-Publication Data
Sowell, Thomas, 1930–Affirmative action around the world : an empirical study / Thomas Sowell.
p. cm.Includes bibliographical references and index.
ISBN 0-300-10199-6 (cloth : alk. paper)
1. Affirmative action programs—Cross-cultural studies. 2. Discriminationin employment—Cross-cultural studies. 3. Discrimination in
education—Cross-cultural studies. I. Title.HF5549.5.A34S685 2003
331.13%3—dc212003014024
A catalogue record for this book is available from the British Library.
The paper in this book meets the guidelines for permanence and durabilityof the Committee on Production Guidelines for Book Longevity
of the Council on Library Resources.
10 9 8 7 6 5 4 3 2 1

Facts are stubborn things, and whatever may be our wishes,
our inclinations, or the dictates of our passions,
they cannot alter the state of facts and evidence.
—john adams


Contents
Preface ix
chapter 1: An International Perspective 1
chapter 2: Affirmative Action in India 23
chapter 3: Affirmative Action in Malaysia 55
chapter 4: Affirmative Action in Sri Lanka 78
chapter 5: Affirmative Action in Nigeria 95
chapter 6: Affirmative Action in the United States 115
chapter 7: The Past and the Future 166
Notes 199
Index 233

Preface
Many—if not most—people who are for or against affir-mative action are for or against the theory of affir-mative action. The factual question of what actually
happens as a result of affirmative action policies receives re-markably little attention. Assumptions, beliefs and rationalesdominate controversies on this issue in countries around theworld. This book addresses the empirical question of just whatdoes and does not happen under affirmative action—and towhose benefit and whose detriment.
Even an observer highly sympathetic to affirmative actionin Malaysia noted in passing, ‘‘new policies were often put forthwithout considering what the success or failure of past policiesboded for their own prospects.’’∞ This was not unique to Malay-sia. It has been the rule, rather than the exception, in manycountries with affirmative action policies, as well as with otherpolicies. The purpose of this book is to consider the actualconsequences of affirmative action.
The experience of more than 30 years of researching andanalyzing affirmative action policies in the United States hasgone into this book. A considerable part of that period has alsoincluded the study of similar policies in other countries. Aninternational perspective on group preferences and quotas en-
x Preface
ables us to examine the arguments on both sides of this issuewith a much larger and more varied sample of evidence.
There are few policies more in need of evidence with whichto weigh the heated assertions and counter-assertions of advo-cates and critics. Merely cutting through the jungle of seman-tics which surrounds controversies over preferential policies inmany countries is a formidable challenge. If this book can con-tribute to clarity on that issue alone, it will have achieved one ofits main goals.
In the course of gathering material for the study of affirma-tive action policies, under the many different names that thesepolicies have in different countries, I have incurred many debtsto scholars, officials, librarians and others in many lands—toomany people to mention here by name. But I am grateful tothem all. My greatest debt, however, is to the Hoover Institutionat Stanford University, which paid for lengthy and costly inter-national trips to gather the information presented here. Aswith my other writings over the past 15 years, my research assis-tant Na Liu has contributed not only dedicated efforts but alsomany insights.
THOMAS SOWELLThe Hoover Institution
Stanford University

A≈rmative Action Around the WorldAn Empirical Study

chapter 1
An International Perspective
While controversies rage over ‘‘affirmative action’’ poli-cies in the United States, few Americans seem to no-tice the existence or relevance of similar policies in
other countries around the world. Instead, the arguments proand con both tend to invoke history and traditions that aredistinctively American. Yet group preferences and quotas haveexisted in other countries with wholly different histories andtraditions—and, in some countries, such policies have existedmuch longer than in the United States.
What can the experiences of these other countries tell us?Are there common patterns, common rationales, common re-sults? Or is the American situation unique?
Ironically, a claim or assumption of national uniqueness isone of the most common patterns found in numerous coun-tries where group preferences and quotas have existed under avariety of names. The special situation of the Maoris in NewZealand, based on the 1840 treaty of Waitangi, is invoked aspassionately in defense of preferential treatment there as theunique position of untouchables in India or of blacks in theUnited States.
Highly disparate rationales have been used in different so-cieties for programs which share very similar features and often
≤ an international perspective
lead to very similar results. Some group preferences have ex-isted for minorities, some for majorities, some for the less fortu-nate and some for the more fortunate who feel entitled tomaintain their existing advantages over other members of thesame society. Today, it is programs for the less fortunate whichare called affirmative action in the United States or by suchother names as ‘‘positive discrimination’’ in Britain and in In-dia, ‘‘standardization’’ in Sri Lanka, ‘‘reflecting the federalcharacter of the country’’ in Nigeria, and ‘‘sons of the soil’’preferences in Malaysia and Indonesia, as well as in some statesin India. Group preferences and quotas have also existed inIsrael, China, Australia, Brazil, Fiji, Canada, Pakistan, New Zea-land and the Soviet Union and its successor states.∞
Despite how widespread affirmative action programs havebecome, even the promoters of such programs have seldombeen bold enough to proclaim preferences and quotas to bedesirable on principle or as permanent features of society. Onthe contrary, considerable effort has been made to depict suchpolicies as ‘‘temporary,’’ even when in fact these preferencesturn out not only to persist but to grow.
Official affirmative action or group preference policies mustbe distinguished from whatever purely subjective preferencesor prejudices may exist among individuals and groups. Thesesubjective feelings may of course influence policies, but theprimary focus here is on concrete government policies andtheir empirical consequences—not on their rationales, hopes,or promises, though these latter considerations will not bewholly ignored. Fundamentally, however, this is a study of whatactually happens, rather than a philosophical exploration ofissues that have been amply—if not more than amply—ex-plored elsewhere.
an international perspective ≥
LIMITED AND TRANSIENT PREFERENCES
The resurgence of group preferences in societies committed tothe equality of individuals before the law has been accom-panied by claims not only that these preferences would be tem-orary, but also that they would be limited, rather than perva-sive. That is, these programs would supposedly be limited notonly in time but also in scope, with equal treatment policiesprevailing outside the limited domain where members of par-ticular groups would be given special help.
In India, for example, a government minister urging loweruniversity admissions standards for untouchables and mem-bers of disadvantaged tribes included the proviso that he wasrecommending ‘‘relaxation for admissions and not for passingor grading.’’≤ Just as he was for limiting the scope of preferen-tial treatment, so others were for limiting its duration. As anadvocate of reserving certain numbers of jobs for members ofspecified groups in India said: ‘‘Even the staunchest supportersof reservation acceded that it is a transitory provision.’’≥ It wasthe leaders of the untouchables themselves who proposed aten-year cutoff for reservations, in order to forestall politicalopposition and social conflict.∂ That was in 1949—and thereservations are still in place today.
Similar reasoning was applied in the United States to bothemployment and admissions to colleges and universities. Ini-tially, it was proposed that there would be special ‘‘outreach’’efforts to contact minority individuals with information andencouragement to apply for jobs or college admissions inplaces where they might not have felt welcome before, but withthe proviso that they would not be given special preferencesthroughout the whole subsequent processes of acceptance andadvancement. Much the same rationale appeared in Malay-sia—and so did the further extension of preferential treatmentwhich developed despite this rationale:
∂ an international perspective
Although grading is supposed to be without reference to eth-nicity, all grades must be submitted to an evaluation review com-mittee having heavy Malay representation. Individual facultymembers report various instances when grades were unilaterallyraised, apparently for purposes of ‘‘ethnic balance.’’∑
Similar policies and results have also been achieved in lessblatant ways. During the era of the Soviet Union, professorswere pressured to give preferential grading to Central Asianstudents∏ and what has been called ‘‘affirmative grading’’ hasalso occurred in the United States, in order to prevent exces-sive failure rates among minority students admitted underlower academic standards.π In India, such practices have beenreferred to as ‘‘grace marks.’’∫ Similar results can be achievedindirectly by providing ethnic studies courses that give easygrades and attract disproportionately the members of one eth-nic group. This too is not peculiar to the United States. Thereare Maori studies programs in New Zealand and special studiesfor Malays in Singapore.
In the job market as well, the belief that special concerns forparticular groups could be confined to an initial stage proveduntenable in practice. Initially, the term ‘‘affirmative action’’arose in the United States from an executive order by PresidentJohn F. Kennedy, who called for ‘‘affirmative action to en-sure that the applicants are employed, and that employeesare treated during employment without regard to race, color,creed, or national origin.’’Ω In short, there were to be no prefer-ences or quotas at all, just a special concern to make sure thatthose who had been discriminated against in the past would nolonger be discriminated against in the future—and that con-crete steps should be taken so that all and sundry would bemade aware of this.
However, just as academic preferences initially limited inscope continued to expand, so did the concept of affirmativeaction in the job market. A later executive order by President

an international perspective ∑
Lyndon Johnson in 1968 contained the fateful expressions‘‘goals and timetables’’ and ‘‘representation.’’ These were notyet full-blown quotas, for the 1968 guidelines referred to ‘‘goalsand timetables for the prompt achievement of full and equalemployment opportunity.’’ Still later, another executive orderin 1970, by President Richard Nixon, spoke of ‘‘results-orientedprocedures’’ and, finally, in December 1971, yet another Nixonexecutive order specified that ‘‘goals and timetables’’ weremeant to ‘‘increase materially the utilization of minorities andwomen,’’ with ‘‘underutilization’’ being spelled out as ‘‘havingfewer minorities or women in a particular job classification thanwould reasonably be expected by their availability.’’ Affirmativeaction was now a numerical concept, whether called ‘‘goals’’ or‘‘quotas.’’
In a very different society and governmental system halfwayaround the world—in Pakistan—attempts to confine affirma-tive action policies within their initial limits proved equallyfutile. Here preferential policies began in 1949 as an explicitly‘‘temporary’’ measure, to be phased out in five to ten years.∞≠
The principal beneficiaries were to be the very poor Bengalis ofEast Pakistan who were ‘‘under-represented’’ in business, theprofessions and the military, while even the administration ofEast Pakistan was largely in the hands of West Pakistanis.∞∞ How-ever, the preferential policies continued decades past the ini-tially specified cut-off time by repeated extensions.∞≤ Even afterEast Pakistan seceded to become the independent nation ofBangladesh in 1971, the preferential policies in Pakistan hadsufficient other political constituencies to continue on aftertheir principal initial intended beneficiaries were gone.
Britain’s Lord Scarman expressed a view widely held bythose initiating affirmative action in many countries when hesaid:
We can and for the present must accept the loading of the law infavour of one group at the expense of others, defending it as
∏ an international perspective
a temporary expedient in the balancing process which has tobe undertaken when and where there is social and economicinequality.∞≥
This confident pronouncement, however, presupposed adegree of control which has proved illusory in country aftercountry. Moreover, ‘‘when and where there is economic in-equality’’ encompasses virtually the entire world and virtuallythe entire history of the human race. A ‘‘temporary’’ programto eliminate a centuries-old condition is almost a contradictionin terms. Equality of opportunity might be achieved withinsome feasible span of time, but that is wholly different fromeliminating inequalities of results.
Even an approximate equality of ‘‘representation’’ of dif-ferent groups in different occupations, institutions or incomelevels has been a very rare—or non-existent—phenomenon,except where such numerical results have been imposed ar-tificially by quotas. As a massive scholarly study of ethnic groupsaround the world put it, when discussing ‘‘proportional repre-sentation’’ of ethnic groups, ‘‘few, if any societies have everapproximated this description.’’∞∂ Another international studyof multi-ethnic societies referred to ‘‘the universality of ethnicinequality’’ and pointed out that these inequalities are multi-dimensional:
All multi-ethnic societies exhibit a tendency for ethnic groupsto engage in different occupations, have different levels (and,often, types) of education, receive different incomes, and occupya different place in the social hierarchy.’’∞∑
A worldwide study of military forces likewise concluded that‘‘militaries fall far short of mirroring, even roughly, the multi-ethnic societies’’ from which they come.∞∏ At one time, nearlyhalf the pilots in the Malaysian air force came from the Chineseminority.∞π In Czarist Russia, 40 percent of the army’s highcommand came from the German ethnic minority that was
an international perspective π
only 1 percent of the country’s population.∞∫ Similar gross dis-parities in ethnic representation in occupations, industriesand institutions can be found in country after country aroundthe world and in century after century.∞Ω Often those over-represented in high-level occupations have been minoritieswith no power to exclude others, but simply possessing particu-lar skills. Germans, for example, have predominated amongthose who created the leading beer companies in the UnitedStates, as they created China’s famous Tsingtao beer and es-tablished breweries in Argentina, Australia, Brazil and othercountries. Similarly, Jews have predominated in the manufac-turing of clothing in medieval Spain, the Ottoman Empire,Argentina, the United States, and other countries.
In short, the even representation of groups that is taken as anorm is difficult or impossible to find anywhere, while the un-even representation that is regarded as a special deviation to becorrected is pervasive across the most disparate societies. Peo-ple differ—and have for centuries. It is hard to imagine howthey could not differ, given the enormous range of differinghistorical, cultural, geographic, demographic and other factorsshaping the particular skills, habits, and attitudes of differentgroups. Any ‘‘temporary’’ policy whose duration is defined bythe goal of achieving something that has never been achievedbefore, anywhere in the world, could more fittingly be charac-terized as eternal.
PREFERRED AND NON-PREFERRED GROUPS
Just as we cannot presuppose continuing control over the scopeand duration of preferential policies, so we cannot simply as-sume what will actually happen to those designated as the pre-ferred group or groups. Neither they nor the non-preferredgroups are inert blocks of wood to be moved here and there ac-cording to someone else’s grand design. Both confront laws andpolicies as incentives and constraints, not as predestination,
∫ an international perspective
and react in their own ways. These reactions include redesignat-ing themselves, altering their own efforts and attitudes towardachievement, and altering their attitudes toward members ofother groups.
Designation and Redesignation
One of the reactions of members of non-preferred groupshas been to get themselves redesignated as members of thepreferred group. This can be done either individually orcollectively.
Some individuals of mixed ancestry who have been re-garded and self-identified as members of group A may chooseto redesignate themselves as members of group B, when groupB is entitled to preferential treatment and members of group Aare not. In the United States, during the Jim Crow era, somelight-skinnd blacks simply ‘‘passed’’ as white, in order to escapethe legal and social disadvantages that went with being desig-nated black. Later, during the era of affirmative action, whiteswith traces of American Indian or other minority ancestry like-wise redesignated themselves, in order to take advantage ofpreferential policies for disadvantaged groups. These have in-cluded blond-haired and blue-eyed individuals with official pa-pers showing some distant ancestor of another race.
The number of individuals identifying themselves as Ameri-can Indians in the U.S. Census during the affirmative actionera rose at a rate exceeding anyone’s estimates of the biologicalgrowth of this population. Moreover, a breakdown of Censusdata by age cohort shows that the number of American Indiansincreased over time in the same age cohort—a biological impos-sibility made possible on paper by redesignations of the sameindividuals. For example, the number of American Indianswho were aged 15–19 in 1960 was just under 50,000. But,twenty years later, when these same individuals would be in theage bracket 35–39 years old, there were more than 80,000
an international perspective Ω
American Indians in that cohort.≤≠ In other words, more than30,000 people in the same cohort who had not designatedthemselves as American Indians in 1960 now did so in 1980,causing more than a 60 percent increase in the number ofAmerican Indians in that cohort.
A similar pattern emerged among the aborigines in Aus-tralia. A study in that country found that there was ‘‘a 42 per-cent increase in the size of the Aboriginal population betweenthe 1981 and the 1986 censuses’’≤∞—virtually a demographicimpossibility in five years, except by redesignation of the sameindividuals with different ethnic labels. As an Australian scholarhas noted:
The dramatic increase in numbers has much to do with recordkeeping, increasing intermarriage and the growing availability ofsubstantial subsidies to people of Aboriginal descent. . . . Thedefinition of ‘Aboriginal’ includes many persons of predomi-nantly non-Aboriginal descent, who might with equal or greatergenetic justification designate themselves as non-Aborigines.≤≤
It was much the same story in China, where, in the 1990s,more than 10 million Chinese proclaimed their ethnic minor-ity status, in order to gain preferential treatment, such as col-lege admissions. Even China’s draconian restrictions on havingmore than one child did not apply to ethnic minorities as theydid to the majority Han Chinese:
Article 44 states that, ‘‘in accordance with legal stipulations,’’ au-tonomous areas can work out their own family planning mea-sures. As a result, urban minority couples generally may have twochildren, while urban Han are restricted to one. Rural minoritiesmay have two, three, four or even more children, depending ontheir ethnicity and location.≤≥
An official of China’s State Nationality Affairs Committeecommented: ‘‘Some people would try all means to change theirnationality because they wanted to make themselves eligible to
∞≠ an international perspective
enter a university with lower scores or to stand a better chancethan their colleagues when it comes to promotion.’’ As in othercountries, people with mixed ancestry had the option of choos-ing how to designate themselves. Some ‘‘traced their ancestryback hundreds of years to prove minority blood’’ and claim thebenefits.≤∂
Another individual response to preferential policies hasbeen to use someone genuinely of the qualifying ancestry as a‘‘front’’ for businesses seeking preferential treatment in theawarding of government contracts or other desired benefits.This practice has been so widespread in both Indonesia andMalaysia that it has acquired a name—‘‘Ali-Baba enterprises,’’where Ali is the indigenous individual who ostensibly owns thebusiness and is legally entitled to government benefits, whileBaba is the non-indigenous person (usually Chinese in thesecountries) who actually controls the enterprise and essentiallypays Ali for the use of his name and ancestry.≤∑ Similar arrange-ments have been uncovered in the United States and else-where. Anti-Semitic policies in Poland during the years be-tween the two World Wars likewise led some Jewish businessesthere to operate behind Gentile front men.≤∏ Decades later,under preferential policies in Kenya, Africans served as frontsfor Asian-owned businesses, as they likewise served as fronts forLebanese-owned businesses in Sierra Leone.≤π
Members of some non-preferred groups can also get them-selves redesignated collectively. The Fourteenth Amendmentto India’s Constitution, like the Fourteenth Amendment to theConstitution of the United States, provides for equal treatmentof individuals but India’s Constitution provides explicit excep-tions for benefits to the untouchables, disadvantaged tribalgroups outside the Hindu caste system and ‘‘other backwardclasses.’’ This last proviso, especially, has created opportunitiesfor many other groups to get themselves collectively designatedas being among the ‘‘other backward classes.’’ Eventually, thismiscellaneous classification provided more individuals with the
an international perspective ∞∞
coveted rights to preferential treatment than were provided tothe members of the untouchable and tribal groups for whomthe preferences were created. In 1997, organized efforts werealso begun to seek preferential treatment for India’s 15 millioneunuchs,≤∫ though obviously they were not the descendantsof other eunuchs, and so could not inherit historic groupdisadvantages.
Redesignations of individuals and groups, like the spread ofpreferences from given groups to other groups, take preferen-tial policies further and further away from the initial rationaleson which they were based. No historic sufferings of blacksin the United States can justify preferential benefits to whitewomen or to recently arrived immigrants from Asia or LatinAmerica who happen to be non-white, but whose ancestors ob-viously never suffered any discrimination in the United States.Similarly, the painful history and continuing oppression ofuntouchables in India can hardly justify preferential benefitsto local majorities in particular states, such as Assam, Maha-rashtra, and Andhra Pradesh. Yet these local majorities andmembers of ‘‘other backward classes’’ outnumber the untouch-ables and are often in a better position to take advantage of thepreferences. Thus quotas for government jobs or university ad-missions have often remained unfilled by untouchables, whilethis has seldom been the case for members of the ‘‘other back-ward classes.’’≤Ω
The spread of benefits from group to group not only dilutesthose benefits—especially when more than half the populationof the country becomes entitled to them, as in both India andthe United States—it can also make the initial beneficiariesworse off after the terms of the competition are altered. Forexample, in the United States, where hiring and promotionsdecisions are subject to review by government agencies inves-tigating discrimination, objective criteria may be used increas-ingly by employers for legal self-protection, even if the rele-vance of these criteria to the job is questionable. If these
∞≤ an international perspective
criteria are met more often by one of the preferred groupsthan by another—if white women have college degrees moreoften than black men, for example—then one preferred groupmay be no better off, on net balance, than if the preferencesdid not exist. It is conceivable that they can be worse off.
Such a situation is not peculiar to the United States. Anofficial report in India in 1980 noted that the advancement ofone preferred group tended to ‘‘push back’’ another, creating‘‘greater tension between structural neighbors in this hier-archy than between the top level and the bottom level.’’ Thatcontinued to be so in the 1990s, with violent clashes in severalIndian states being found to be more common among compet-ing poorer groups than between these groups and the moreelite castes.≥≠ In 2001, a rally was held in the state of Rajasthan,protesting the inclusion of new groups among the backwardclasses and demanding ‘‘separate fixed quotas for originalbackwards’’ so that ‘‘new entrants’’ would not be able to reducethe existing benefits enjoyed by those for whom the prefer-ences were created.≥∞ Calls have been made for a ‘‘quota withinquota’’ to deal with such situations.≥≤
Insofar as affirmative action policies are aimed particularlyat offsetting existing economic disadvantages, their rationale isundermined when the benefits of these policies go dispropor-tionately to those individuals within the designated groups whoare the least disadvantaged—or perhaps are in more favorablepositions than members of the country’s general population.
In India’s state of Tamil Nadu, for example, the highest ofthe so-called ‘‘backward classes’’ legally entitled to preferences,constituting 11 percent of the total ‘‘backward classes’’ popula-tion in that state, received almost half of all jobs and universityadmissions set aside for these classes.≥≥ In Malaysia, where thereare preferences for the indigenous ‘‘sons of the soil’’ majority,Malay students whose families were in the top 17 percent of theincome distribution received just over half of all scholarships
an international perspective ∞≥
awarded to Malays.≥∂ In Sri Lanka, preferential university ad-missions for people from backward regions of the country ap-pear likewise to have benefited primarily students from afflu-ent families in those regions.≥∑
This should hardly be surprising, nor is it necessarily a mat-ter of corruption. Preferential access to education or jobs is justone factor in getting the education or the job. Obviously, thosepeople who have more of the other factors required are betterable to turn preferential access into actual success. Pre-existingprosperity provides more of those other factors.
Those American minority business owners who participatein the preferential program called business ‘‘set-asides’’ underSection 8(a) of the Small Business Act average a personal networth that is not only higher than the average net worth of thegroups they come from, but also higher than the average per-sonal net worth of Americans in general.≥∏ A scholarly study ofgroup preferences in India pointed out that preferences thatbenefit more fortunate members of less fortunate groups ‘‘bor-row legitimacy from the national commitment to amelioratethe condition of the lowest,’’ while at the same time ‘‘they un-dermine that commitment by broadcasting a picture of unre-strained preference for those who are not distinctly worse offthan non-beneficiaries.’’≥π
Just as specifying the scope and duration of affirmative ac-tion policies has proven illusory, so has the designation of thebeneficiaries in accordance with the rationales of these pol-icies. Both attempts suffer from assuming far more comprehen-sive knowledge and control than anyone has been able to ex-ercise, in any of the countries in which preferential programshave been instituted. What has also been over-estimated is theextent to which the attitudes resulting from such programs canbe assumed to be beneficial to the groups concerned or to thecountry at large. These attitudes tend to respond to incentives,rather than to rationales.
∞∂ an international perspective
Incentives
Both preferred and non-preferred groups have modifiedtheir own behavior and attitudes in response to preferentialpolicies and the rationales for such policies. While members ofthe officially preferred groups who already have the comple-mentary factors needed to take the fullest advantage of prefer-ences can do so, those who lack these factors often feel lessincentive to acquire them, now that entitlements are availableas substitutes for achievements. The development of job skills,for example, may be de-emphasized. As a leader in a campaignfor preferential policies in India’s state of Hyderabad put it:‘‘Are we not entitled to jobs just because we are not as quali-fied?’’≥∫ A Nigerian likewise wrote of ‘‘the tyranny of skills.’’≥Ω InMalaysia, where group preferences exist for the majority popu-lation, ‘‘Malay students, who sense that their future is assured,feel less pressure to perform.’’∂≠ In the United States, a study ofblack colleges found that even those of their students who wereplanning to continue on to postgraduate study showed littleconcern about needing to be prepared ‘‘because they believethat certain rules would simply be set aside for them.’’∂∞
Both preferred and non-preferred groups can slacken theirefforts—the former because working to their fullest capacity isunnecessary and the latter because working to their fullest ca-pacity can prove to be futile. After Jamaica gained its indepen-dence from British rule, many whites living there no longerbothered to compete for public office because they ‘‘felt thatthe day of the black man had come and questioned why theyhad to make the effort if the coveted job or the national honorwould go to the blacks, despite their qualifications.’’∂≤ Whileaffirmative action policies are often thought of, by advocatesand critics alike, as a transfer of benefits from one group toanother, there can also be net losses of benefits when bothgroups do less than their best. What might otherwise be a zero-sum game can thus become a negative-sum game.
an international perspective ∞∑
In some countries, complete physical withdrawal from thecountry by those in non-preferred groups has occurred in thewake of preferential policies which reduced their prospects.The exodus of Chinese from Malaysia, Indians from Fiji, Rus-sians from Central Asia, Jews from much of prewar Europe, andHuguenots from 17th century France in response to discrimi-nation drained all these countries of much-needed skills andtalents. In short, preferential policies represent not simply atransfer of benefits from one group to another, but can alsorepresent a net loss, as both groups respond by contributingless than they could to the society as a whole.
Not all incentives are economic or even tangible. Honorsare among the most powerful of incentives in many situations,especially where dangers and death must be faced, and wheremoney is less effective than a sense of honor, as in the military.In less dire circumstances as well, honor and the respect ofpeers play important roles, not only as rewards for achieve-ments, but also as factors helping to make individual achieve-ments possible in the first place.
The cooperation and collaboration of colleagues can beimportant in a variety of occupations from scholars to police-men—and that cooperation and collaboration can be compro-mised by group preferences. For example, minority professorson American campuses have complained that being thought ofas ‘‘affirmative action’’ professors by their colleagues has led toless intellectual and research interaction, which in turn re-duces the minority faculty’s development as scholars.∂≥ Thiscan be a serious handicap in achieving one’s potential. In lifeand death situations, such as those faced by the police, fire-fighters, and soldiers, mutual confidence is even more impor-tant. Yet black police sergeants promoted in Chicago overwhite policemen with higher test scores—as a result of a courtorder—found themselves taunted as ‘‘quota sergeants’’ whenthey made mistakes.∂∂
∞∏ an international perspective
Intergroup Relations
Even aside from losses to the economy as a whole, becauseof disincentives created for both preferred and non-preferredgroups, there are social losses due to intergroup resentments,which can be even more serious. Nor are these resentmentsdue simply to the transfers of benefits.
When a serious political backlash against affirmative actionbegan in the United States, many in the media were quick tocharacterize it dismissively as due to ‘‘angry white males,’’ re-sentful of the losses of various benefits to blacks and otherminorities—in other words, just an emotional reaction by peo-ple irked at losing a few of their many advantages. But thisresentment was by no means proportional to intergroup trans-fers of benefits or it would have been far greater against AsianAmericans, who displaced more whites in prestigious univer-sities and in many high-level professions, especially in scienceand technology. At many of the leading universities in theUnited States, whites ‘‘lost’’ more places to Asian Americansthan to blacks, and yet there was seldom any backlash againstAsian Americans. The outstanding academic and other achieve-ments of Asian Americans were widely recognized and widelyrespected. It was not the intergroup transfer of benefits that wasresented, but the basis for those transfers.
Among Americans especially, the idea that some are to betreated as ‘‘more equal than others’’ is galling. It was this feel-ing in the general population which leaders of the civil rightsmovement of the 1960s were able to mobilize behind theirefforts to destroy the Jim Crow laws of the South, so that amajority of the members in both houses of Congress from bothpolitical parties voted for the landmark Civil Rights Act of 1964and the Voting Rights Act of 1965. It was this same Americanresentment of special privilege which responded so strongly tothe historic words of the Reverend Martin Luther King, Jr., atthe Lincoln Memorial in 1963, that his dream was of a country
an international perspective ∞π
where people would be judged ‘‘not by the color of their skin,but by the content of their character.’’
It was after the civil rights movement itself began to moveaway from this concept of equal treatment of all individualsand toward the concept of equalized outcomes for groups, thata backlash against affirmative action set in and grew over theyears.
There is yet another sense in which resentments againstpreferences for other groups are not proportional to the bene-fits transferred. An observer of preferential policies in Indianoted the disproportionate resentment of places reserved for‘‘scheduled castes,’’ the official euphemism for untouchables:
. . . we hear innumerable tales of persons being deprived of ap-pointments in favour of people who ranked lower than they did inthe relevant examinations. No doubt this does happen, but if allthese people were, in fact, paying the price for appointments toScheduled Castes, there would be many more SC persons ap-pointed than there actually are. To illustrate: supposing that 300people qualify for ten posts available. The top nine are appointedon merit but the tenth is reserved, so that the authorities go downthe list to find an SC applicant. They find one at 140 and he isappointed. Whereupon all 131 between him and the merit listfeel aggrieved. He has not taken 131 posts; he has taken one, yet131 people believe they have paid the price for it. Moreover,the remaining 159 often also resent the situation, believing thattheir chances were, somehow, lessened by the existence of SCreservations.∂∑
In the United States as well, those who resent group prefer-ences may be some multiple of those who have in fact actuallylost anything that they would have had in the absence of thesepreferences. In the 1978 landmark Supreme Court challengeto affirmative action brought by Alan Bakke, a white studentdenied admission to a University of California medical school,neither side to the dispute could state with confidence that
∞∫ an international perspective
Bakke would or would not have been admitted in the absenceof the affirmative action policies which admitted minority stu-dents with lower academic qualifications than his. The admis-sions process was sufficiently complicated that it was not clearwhether some other white or Asian-American student mighthave been admitted instead of Bakke.
In other words, it was not certain that Bakke had in fact lostanything as a result of affirmative action, and yet his sense ofbeing wronged was sufficient for him to pursue the case all theway up to the highest court in the land. One of the things thatprevents affirmative action from being a zero-sum process isthat minor transfers of benefits can cause major resentmentsamong far more people than those who have actually lost any-thing. Moreover, these resentments do not end with political orlegal actions.
In India, where preferential policies have a longer historythan in the United States, they have also had more bitter conse-quences. Forty-two people died in riots over places reserved foruntouchables in a medical school in the state of Gujarat—justseven places.∂∏ This was part of a national trend of rising vio-lence against untouchables amid adverse reactions against pref-erential policies in general.∂π Meanwhile, less than 5 percent ofthe medical school places reserved for untouchables in Gujarathad actually been filled over a period of years. Studies of univer-sity admissions in general, in various parts of India, showed asimilar pattern of many places reserved for untouchables goingunfilled.∂∫ Nevertheless, minor transfers of benefits led to ma-jor resentments, including resentments erupting repeatedlyinto lethal violence.
Nowhere has this resentment led to more violence thanin India’s neighboring nation of Sri Lanka, which has beenracked by decades of civil war, in which the non-preferredgroup—the Tamils—have sought to secede and become an in-dependent nation. This tragic story will be left for Chapter 4.Here it is sufficient to mention it among other examples of in-
an international perspective ∞Ω
tergroup polarization brought on by affirmative action. It isclear that affirmative action in Sri Lanka has not been a zero-sum process. The material, political, economic, and socialhavoc created by that country’s long civil war has undoubtedlyleft all segments of the population worse off than they wouldhave been in the absence of group preferences and the reac-tions to which those preferences led.
TRENDS
Even where there are adequate statistical data on the progressof groups that have been given preferential treatment—andoften there are not—it remains a challenge to determine howmuch of that progress was due to preferential policies, ratherthan to other factors at work at the same time. Simple before-and-after comparisons will not do, as that would be assumingthat nothing else had changed, when in fact the very dynam-ics of establishing affirmative action programs often reflectchanges that were already under way before group preferencesbegan. Seldom is there a stationary situation to which a given‘‘change’’ is added.
Often it was precisely the rise of newly educated and up-wardly mobile groups which led to demands for preferentialpolicies. A study in Bombay, for example, found a ‘‘marked ad-vancement of the Maharashtrians occurred prior to the strin-gent policy measures adopted by the state government’’ to pro-mote preferential hiring of indigenous Maharashtrians.∂Ω Inpart this reflected a prior ‘‘enormous growth in school enroll-ments in Maharashtra’’ and a ‘‘rapid expansion in collegeenrollment’’—also prior to preferences.∑≠ In Malaysia as well,the number of children attending the government’s secondaryschools increased by 73 percent in just five years immediatelypreceding the New Economic Policy, which expanded prefer-ences and quotas for Malays.∑∞ In Sri Lanka likewise, there was a‘‘rapid expansion of educational opportunities in the Sinhalese
≤≠ an international perspective
areas’’ after independence∑≤—and before demands for prefer-ential treatment of the Sinhalese.
A similar growth of an indigenous, newly educated class inPoland, Czechoslovakia, and Lithuania during the years be-tween the two World Wars led to demands for preferentialpolicies in the form of group quotas, in order to relieve themfrom having to compete on an equal plane with Jews,∑≥ whowere already educated, experienced, and established in thepositions to which the newly-educated classes were aspiring.Likewise, in Nigeria, it was the recent growth of an educatedclass in the north that led to demands for preferential policiesto relieve them from having to compete with southern Nige-rians, who had predominated in universities and in many desir-able occupations.∑∂ This same pattern of a rising educated classprior to the preferential policies that they promoted can alsobe found in Indonesia, the Quebec province of Canada, andmuch of sub-Saharan Africa.∑∑
In the United States, the proportion of the black popula-tion going to college doubled in the two decades preceding thecivil rights revolution of the 1960s,∑∏ and this was reflected inthe occupational rise of blacks. While it is an often-cited factthat the proportion of blacks in professional and other high-level occupations rose substantially in the years following pas-sage of the Civil Rights Act of 1964, it is an almost totally ig-nored fact that the proportion of blacks in such occupationsrose even more substantially in the years preceding passage ofthe Civil Rights Act of 1964.∑π
Dramatic progress was also evident during these same de-cades in the lower socioeconomic levels of the American blackpopulation. The percentage of black families with incomes be-low the official poverty line fell from 87 percent in 1940 to 47percent by 1960—all of this before the civil rights legislation ofthat decade, much less the affirmative action policies of the1970s. Between 1960 and 1970, the poverty rate among blackfamilies dropped an additional 17 percentage points and, after
an international perspective ≤∞
the decade of the 1970s in which affirmative action was estab-lished, the poverty rate among blacks fell one additional per-centage point.∑∫
This striking difference between the political myth and theeconomic reality has many implications. Among them is thatwhat might otherwise be seen as a remarkable achievement byblack Americans is instead seen as an example of governmentbeneficence and largess—and a reason why affirmative actionis an absolute necessity for black advancement. The effectsof this misperception include white resentments and theirquestioning why blacks cannot advance themselves like othergroups, when in fact that is what most blacks have done. Inci-dentally, it is an equally ignored fact that the incomes of AsianAmericans and Mexican Americans also rose substantially—both absolutely and relative to that of the general popula-tion—in the years preceding passage of the Civil Rights Act of1964 and its evolution into preferential policies.∑Ω
Any assessment of preferential policies must take accountof pre-existing trends, rather than assume a static world towhich ‘‘change’’ was added.
SUMMARY AND IMPLICATIONS
Despite the highly varied rationales for official group pref-erences and quotas in particular countries around the world,the logic of their incentives and constraints tends to pro-duce similar consequences in very disparate societies. More-over, both the incentives and the consequences tend to getignored in political discussions of these policies, which focuson their justifications and presumed benefits, while ignor-ing actual empirical results. In the United States, mythicalresults—affirmative action as the basis for the economic rise ofblacks, for example—have so completely supplanted facts thatfew who discuss this policy find it necessary to check historicalevidence at all.
≤≤ an international perspective
For some supporters of affirmative action, it is just a matterof being in favor of helping the less fortunate, with the ‘‘de-tails’’ being left for others to consider and work out. However,even a broad-brush look at what affirmative action programshave actually done in various countries reveals that a failure toachieve their goals may be the least of the problems created bythese programs. Poisonous intergroup relations and real dan-gers to the fabric of society have also been produced by affirma-tive action in some countries. That should become painfullyclear when we look at the ‘‘details’’ in the chapters that follow.
chapter 2
A≈rmative Action in India
India is the world’s largest multi-ethnic society—and themost socially fragmented. A land of well over a hundredlanguages and hundreds of dialects, where even the most
widely spoken language in the country is spoken by less thanone-third of the population, India is also cross cut by strongcaste, religious, regional and ethnic divisions—expressed in awide range of ways, from radically different lifestyles to blood-shed in the streets. India has also had affirmative action pol-icies longer than any other nation, beginning in British colo-nial times, and then provided for in its constitution when itbecame an independent country in 1947.∞
The Fourteenth Amendment to India’s constitution, likethe Fourteenth Amendment to the constitution of the UnitedStates, prescribes equal treatment for individuals. Unlike theconstitutions of the United States, however, India’s equal-rightsamendment provides an explicit exception for policies de-signed to help disadvantaged segments of its population—affirmative action or ‘‘positive discrimination’’ as it is oftencalled there. These provisions were originally set to expire in 20years, but they have been extended again and again≤—andexpanded.
Today, there are basically two kinds of preferential policies
≤∂ affirmative action in india
in India—policies for national minorities deemed less fortu-nate and policies for various local groups in their respectivestates. The minority policies were quite explicitly designed pri-marily to deal with the severe social disabilities and discrimi-nation faced by India’s untouchables. Tribal groups outsidethe social mainstream of the country were also included, as insome ways analogous to untouchables. For others who mighthave similar disadvantages, an omnibus category of ‘‘otherbackward classes’’ was included in the constitutional exemp-tion from equal treatment provisions. This last mentioned cate-gory provided an opening through which numerous othergroups could acquire preferential access to jobs and otherbenefits.
Statistically, members of the omnibus category of ‘‘otherbackward classes’’ now outnumber the untouchables and tribalgroups combined. The untouchables (‘‘scheduled castes’’ or‘‘Dalits’’) constitute about 16 percent of the country’s totalpopulation and members of ‘‘backward tribes’’ another 8 per-cent. However, these two very poor and historically outcastgroups are greatly outnumbered by members of the ‘‘otherbackward classes,’’ who constitute 52 percent of all Indians.≥
Clearly, these ‘‘other backward classes’’ are in practice notthe incidental after-thought that they might have been in theminds of those who wrote India’s constitutional exemptionfrom equal-treatment requirements.
SCHEDULED CASTES AND SCHEDULED TRIBES
Nationally, preferential policies were meant to raise the socio-economic levels of the scheduled castes and scheduled tribesthrough ‘‘positive discrimination’’ in jobs, university admis-sions, representation in parliament, and other benefits de-signed to overcome historic patterns of discrimination andbackwardness. By virtually any definition, discriminationagainst India’s untouchables (‘‘scheduled castes’’) has been
affirmative action in india ≤∑
among the worst against any group in any society. Althoughuntouchability was officially abolished more than half a cen-tury ago, and the term ‘‘untouchable’’ banished from officialand polite discourse, the same people have faced continuingdiscrimination under their new designations as ‘‘scheduledcastes,’’ ‘‘Harijans’’ (children of God, a name given them byMahatma Gandhi) or ‘‘Dalits’’ (the downtrodden).
Untouchables have been outcastes in the literal sense of notbeing one of the four broad categories of castes recognized bythe Hindu religion. Because their work, such as working withleather, often goes against the tenets of Hinduism, there havebeen serious questions whether they could be considered Hin-dus at all. While they have historically considered themselvesHindus, many have converted to other religions that do nothave a caste stigma.
History
Historically, prohibitions against any physical contact withcaste Hindus were just some of the restrictions placed on un-touchables, backed up by severe punishments for any violation.In some places, untouchables were not even to allow theirshadow to fall upon a caste Hindu and had to beat drums uponentering a Hindu community, in order to warn others to keeptheir distance.∂ They could not draw water from the same wellused by caste Hindus—and, in some places, still could not inpractice, decades after they had the legal right to do so.
Two incidents involving wells showed the persistence ofcaste taboos in the late 1970s. In one episode, an untouch-able girl who drew water from a well reserved for caste Hindushad her ears cut off.∑ In another incident, in a place whereuntouchables were allowed to draw water from the same wellas caste Hindus, an untouchable woman put her pot on the potof a caste Hindu woman, setting off a riot in which an un-touchable was killed.∏ Similar incidents were reported by the
≤∏ affirmative action in india
international organization Human Rights Watch in the 1990sπ
and, in 2001, the Indian publication The Hindu reported: ‘‘At-tacks on Dalits (most often orchestrated by collectives rep-resenting upper caste interests) and even massacres of men,women and children belonging to the lowest rungs of the so-cial order are indeed a regular feature in most parts of thecountry.’’∫
In 1991, the news magazine India Today reported that, in avillage about 100 miles from Delhi, ‘‘a rural Dalit laborer daredto have a love affair with the daughter of a high-caste landlord’’and as a result ‘‘the lovers and their Dalit go-between weretortured, publicly hanged, and burnt by agents of the girl’sfamily in the presence of some 500 villagers.’’Ω The presence of500 witnesses takes this out of the realm of isolated incidents,since those who did these things obviously did not fear punish-ment or retribution. This says something about the society, notjust about them.
While such behavior is not pervasive across India, neitheris it confined to isolated incidents. Government statistics onatrocities against untouchables never fell below 13,000 peryear during the decade of the 1980s and reached well over16,000 in 1984.∞≠ Far from abating with time, these officiallyrecorded atrocities escalated to more than 20,000 a year in the1990s.∞∞
This escalation of violence has been associated with back-lashes against the official preferences given to untouchablesand with competition among other recipients of preferences,such as the ‘‘other backward classes.’’ Although there was lit-tle public criticism of affirmative action in India before the1970s,∞≤ such criticisms have grown louder over the years, alongwith escalating violence. A 1997 study concluded that ‘‘thequota system has eliminated whatever goodwill the upper casteshad for the lower castes,’’ partly because of a ‘‘pervasive over-estimation of the amount and effectiveness’’ of preferential
affirmative action in india ≤π
policies—which in fact benefit only an estimated 6 percent ofuntouchable families.∞≥
Despite such horrors, restrictions against untouchables orDalits have been in an irregular retreat across India for de-cades—more so in the cities than in the countrysides and moreso in public accommodations than in religious temples. As a1997 study reported: ‘‘The social stigma of caste and tribe isabsent in day-to-day intercourse in urban centers, but in ruralIndia to be from a scheduled caste or scheduled tribe is still asocial burden.’’∞∂ Yet in some places untouchable universitystudents are socially accepted as roommates of caste Hindus.∞∑
In other contexts, according to a Human Rights Watch reportin 1999, Dalit women were ‘‘raped as a form of retaliation’’by upper class men when there were organized movementsamong the Dalits to seek enforcement of minimum wage lawsor other redress.∞∏ India is a nation of sharp contrasts, in this asin many other things. One sign of these contrasts is the SixthAnnual Report of the Commission for Scheduled Castes andScheduled Tribes in 2001, which found that three states pro-vided nearly two-thirds of all the thousands of atrocities com-mitted against untouchables, while there were several otherstates with none.∞π
While the untouchables are, in many places, too econom-ically dependent, powerless, and outnumbered to do much todefend themselves, in other places, where they have been ableto respond, that response has been extreme, in both politicaland physical terms. The state of Bihar has been particularlyprime to violence and counter-violence involving the sched-uled castes. After two families of untouchables were murderedin 1987, neighboring villages inhabited by members of highercastes were attacked by almost a thousand men, armed withsticks, spears, and guns. Villagers were pulled from theirhomes, hacked to pieces and thrown into flames by attackerswho shouted, ‘‘We will take revenge’’ and ‘‘Love live the Maoist
≤∫ affirmative action in india
Communist Centre.’’ Although the attackers had guns, theypreferred to cut their victims to pieces.∞∫
The classical four castes of the Hindu religion are frag-mented into literally thousands of local castes or sub-castes,which are what circumscribe people’s social life. Back in colo-nial times, the British had a list or schedule drawn up of thosecastes which were considered untouchable. This was what ledto the phrase ‘‘scheduled castes’’ as a euphemism for ‘‘un-touchables.’’ The term ‘‘untouchable’’ originated early in thetwentieth century and was banished from laws and polite dis-course by the late twentieth century.
Whatever the historical origins of this pariah status in par-ticular occupations or ways of life, over the centuries the socialstigma acquired a life of its own, and was applied even to thosewhose occupations and ways of life were very different. Forexample, Dr. B. R. Ambedkar, destined to become the bestknown leader of the untouchables, was evicted from a hotel inIndia when he returned home after receiving a Ph.D. from Co-lumbia University, once his outcaste origins became known.∞Ω
The caste system also followed Indians to other countries,somewhat attenuated in more distant countries and in morerobust form in countries closer to India. In nearby Ceylon, forexample, untouchables were not allowed to be seated in busesin the 1930s:
. . . there was the refusal to concede to harijans the right to a seat inbuses. Eventually it required government intervention to enforcethis right, but attempts to enforce it led to outbreaks of violence in1930–31, and to a strike of bus drivers and conductors. Pre-viously, harijans were expected to stand at the back of the bus, orto sit, or squat, on the floor of the bus even though they were re-quired to pay the normal fare. It took decades before vellalas ac-cepted this change, and most of them did so with undisguised re-luctance. Discrimination against harijans extended to restrictionson entry into cafes and ‘‘eating houses,’’ access to village amen-
affirmative action in india ≤Ω
ities like wells and cemeteries, and on the clothes they wore—their right to wear shoes was a frequent point of contention.≤≠
Historically, then, the untouchables were clearly an op-pressed minority. Many people did not consider untouchablesto be Hindus at all≤∞ because (1) they were not among the fourvarnas designated by the Hindu religion, but were literally out-castes in the sense of being outside—and below—those in thecaste system, and (2) some of their occupations involved mak-ing products from animals slaughtered in violation of Hindutenets. Only relatively recently, as history is measured, did awidespread concern for the predicament of the untouchablesarise in the early decades of the twentieth century. Nor was thisbelated concern wholly a matter of humanitarian consider-ation. During the later colonial era, as Indians were strugglingto achieve independence from Britain, the inclusion or exclu-sion of untouchables from the ranks of Hindus had profoundpolitical implications for the political balance of power be-tween Hindus and Moslems in post-independence India. Poli-tics therefore dictated concern for the classification of the un-touchables and led Hindus to accept untouchables as fellowHindus for political purposes, even if they were still kept out ofmany temples. In this climate of opinion, Dr. B. R. Ambedkarsought to gain whatever concessions he could and MahatmaGandhi made the fate of untouchables a moral issue.
Even for Gandhi, however, the over-riding concern was thatthe untouchables remain classified as part of the Hindu elec-torate. When the British created a special electorate for theuntouchables in 1932, Gandhi vowed to fast till death unlessthis decision was reversed. In the national crisis that this cre-ated, a compromise was reached in which there was to be noseparate electorate for untouchables, but they would still haveseats reserved for them in the legislature. This historic episodehas sometimes been depicted as a fast against the principle ofuntouchability, rather than as what it was—a desperate effort
≥≠ affirmative action in india
to keep the Hindu vote from being splintered. Nevertheless,the increased attention to the untouchables and their prob-lems growing out of this episode led to various attempts tobetter their condition. In some states, there were laws passed togrant them equal access to public accommodations, includingHindu temples. There was also preferential access to govern-ment jobs for untouchables in some states. In short, preferen-tial policies for untouchables began under British colonialrule and were later expanded after India achieved nationalindependence.
PREFERENCES IN PRACTICE
The census of 1991 showed that the literacy rate was only 37percent among members of the scheduled castes and 30 per-cent among members of the scheduled tribes.≤≤ In higher edu-cation, most untouchables or members of backward tribes areunable to use the quotas and preferences to which they arelegally entitled, even when the government provides scholar-ships. A study of scholarships for untouchables pointed out thereason:
The scholarship money . . . can hardly be expected to induce thereally poor to go in for higher education and, if one does go in forit, to continue till he completes the course. Only those who havesome other sources to rely on can avail of these scholarships. A fewrespondents were frank enough to admit that this money providesthem with pocket money while their parents bear the major por-tion of the educational expenditure.≤≥
Among the consequences of this situation are that (1)many reserved places go unfilled, (2) those places that havebeen filled have been filled disproportionately by the morefortunate members of the less fortunate groups and (3) thosemembers of these groups who have gone on to higher educa-tion have usually gone to the less demanding institutions, spe-
affirmative action in india ≥∞
cialized in the easier (and less remunerative) subjects, takenlonger to graduate, and dropped out much more often thanother students. Unused reservations or quotas have long beencommon, and especially striking at the university or postgradu-ate level.≤∂
Studies in the 1960s and 1970s showed that scheduled castestudents filled less than half the places reserved for them inuniversities in general and in medical and engineering schoolsin particular.≤∑ Some institutions did not have a single studentfrom either the scheduled castes or the scheduled tribes.≤∏ Suchpatterns have persisted. In 1997, The Times of India quoted thechairman of the National Commission for Scheduled Castesand Scheduled Tribes as declaring that none of India’s eliteuniversities and engineering institutes had filled its quota formembers of scheduled castes.≤π In 2001, the central govern-ment asked universities and medical schools ‘‘to ensure that thefull quota of reserved seats was filled up’’ and suggested organiz-ing ‘‘special coaching’’ for students from scheduled caste andscheduled tribe backgrounds.≤∫
These unfilled quotas in higher education are not a resultof strict admissions standards. Explicitly lower cut-off scores formembers of the scheduled castes and scheduled tribes havebeen common among Indian universities and technical in-stitutes.≤Ω None of the students preferentially admitted to sixhighly selective engineering schools progressed through theseschools on schedule and most did not maintain a high enoughgrade average to continue in these institutions.≥≠ For the coun-try as a whole, members of the scheduled castes and scheduledtribes—combined—did not receive as much as 3 percent ofthe degrees in engineering or medicine,≥∞ though togetherthey add up to nearly one-fourth of the population of India.
Not only in higher education, but in elementary and sec-ondary education as well, the need for complementary re-sources, in order to be able to actually make use of preferencesand quotas, limits the benefits that members of the scheduled
≥≤ affirmative action in india
castes and scheduled tribes receive. Even when the govern-ment provides primary schooling free of charge, the costs ofbooks and supplies may not be affordable by very poor people.For secondary education, rural students especially may not al-ways find a school nearby, so that those whose parents cannotafford the costs of commuting or relocating—and paying forhousing and boarding—have little realistic prospect of attend-ing, regardless of preferential admissions policies. Perhaps thelargest cost of sending children to secondary and higher edu-cation is their lost labor on farms and their lost income else-where, especially among poverty-stricken people struggling tomake ends meet.
These educational handicaps can lead to employmenthandicaps. Patterns of unused quotas have existed in govern-ment employment, in part because of difficulties in passing therelevant examinations. According to a 1984 study:
When the State of Orissa conducted a combined examination forseveral of its services, 133 candidates were successful—i.e., hadtest scores high enough to support appointment. Although 18%of the places in each of the two services were reserved for Sched-uled Castes, there was just one successful SC candidate, who hadscored 105th on the examination.≥≤
There were still unfilled job reservations for untouchablesin the 1990s.≥≥ Moreover, the jobs they did fill were concen-trated at the bottom. While untouchables were 16 percent ofthe population, they were in 1994 nearly half of all sweepersbut just 10 percent of the Class A government employees.≥∂ Norwere all the jobs they held necessarily due to quotas, since thesetotals include those who met the normal job qualifications. Inshort, the actual net benefit of quotas and preferences on thewellbeing of the scheduled castes and scheduled tribes is prob-lematical, however much such ‘‘positive discrimination’’ maygenerate bitterness and resentment toward them from othergroups.
affirmative action in india ≥≥
Government jobs and education are not the only levelwhere preferential benefits often remain unused. The same istrue of housing subsidies, health programs, maternity andother benefits which remain unused so frequently that govern-mental spending on these programs has often been less thanthe sums authorized to be spent.≥∑ In all these cases, comple-mentary factors are needed, in order to be able to actually usethe preferences and quotas. Sometimes the complementaryfactor is money, sometimes a good educational background,sometimes job skills and experience, and sometimes just beingwell informed as to what is available. Given the need for com-plementary resources, it is hardly surprising that the moreprosperous of the scheduled castes have often taken the lion’sshare of the benefits.≥∏
Chamars, for example, began an economic rise during theSecond World War when there was a sudden increase in de-mand for leather goods.≥π In the state of Maharashtra, theChamars are among the most prosperous of the scheduledcastes. A study found that they were 17 percent of the state’spopulation and 35 percent of its medical students.≥∫ In thestate of Haryana, the Chamars received 65 percent of the schol-arships for the scheduled castes at the graduate level and 80percent at the undergraduate level.≥Ω Meanwhile 18 of the 37untouchable groups in Haryana failed to get any of the prefer-ential scholarships. In the state of Madhya Pradesh, Chamarswere 53 percent of all the scheduled caste students in theschools of that state.∂≠ In Bihar, just two of the 12 scheduledcastes in that state—one being the Chamars—supplied 61 per-cent of the scheduled class students in school and 74 percent ofthose in college.∂∞ In Uttar Pradesh, according to the Economic
and Political Weekly, the Chamars ‘‘have nearly monopolised thedalit quota.’’∂≤ In 2001, Uttar Pradesh passed an ordinancesplitting the quota for the scheduled castes, so that Chamarswere limited in how large a percentage of the government jobsset aside for scheduled castes they could receive.∂≥ However, in
≥∂ affirmative action in india
early 2002, the Supreme Court stayed the implementation ofthat ordinance.∂∂
In the state of Tamil Nadu, various less fortunate castesconstituted 12 percent of the backward classes in that state,while more fortunate castes constituted 11 percent of the back-ward classes. Yet, despite their similarities in numbers of peo-ple, the more fortunate castes within this group received morethan four times as much money per capita in scholarships andthey provided 44 percent of the backward classes’ students ad-mitted to study engineering, compared to less than 2 percentamong the least fortunate castes in this category.∂∑ Such dis-parities among preferred groups in their utilization of prefer-ential benefits have been found in other parts of India, for bothscheduled tribes and scheduled castes.∂∏ Similar disparitiesamong the ‘‘other backward classes’’ have led to demands for‘‘quota within quota’’ policies to prevent the more advancedof the other backward classes—widely known as ‘‘the creamylayer’’—from taking the lion’s share of the quotas, at the ex-pense of what are called the ‘‘most backward classes.’’
When it comes to seats in both the national and state legisla-tures set aside for untouchables, the pattern once again is oneof a disproportionate share of these benefits going to thosewho were more fortunate to begin with. While members of 65untouchable sub-castes were eligible for legislative seats in thestate of Andhra Pradesh, only 5 of these 65 untouchable sub-castes were actually represented in that state’s legislature.∂π
People who were not born untouchables held a majority of theseats set aside for untouchables in the state of Rajasthan. At onetime, 16 of the 28 legislators holding seats reserved for un-touchables in that state had acquired certificates of untouch-ability by being adopted.∂∫ Adoption as untouchables has alsobeen used by students as a means to gain admission to medicaland engineering schools,∂Ω among other means of redesignat-ing themselves to take advantage of group preferences andquotas. Although reserved seats in legislatures were scheduled
affirmative action in india ≥∑
to expire in ten years, they were repeatedly extended as newdeadlines for their expiration arrived.∑≠
LOCAL PREFERENCES
While the scheduled castes and scheduled tribes are legallyentitled to preferences nationwide, there are also local groupsentitled to preferences within their own respective states. Herethe rationale is not the same as that which was used to createquotas and preferences nationally. Local indigenous status as‘‘sons of the soil’’ has been taken to confer an entitlement tospecial consideration,∑∞ especially in states where outsiders haveclearly out-performed the locals in free competition in the mar-ketplace or in examinations for college admissions or govern-ment jobs. In the states of Assam, Maharashtra, and AndhraPradesh, for example, such outsider dominance has sparkedboth political movements and mob violence.
Where local preference laws have been instituted, ‘‘local’’has not meant simply people residing in the given state, becausesome groups—Marwaris and Bengalis in Assam, for example—have resided in that state for generations. What is meant, even ifthe law does not permit it to be said, is ethnic preference. As acommittee of the state legislature in Assam put it:
In the absence of any clear-cut definition of the term ‘‘local peo-ple,’’ the Committee has had to base its analysis in place of birth inAssam as being the yardstick of local people. This yardstick ispalpably inadequate and misleading and a clear understandingshould be there in government and all others concerned in thematter as to what is meant by the term ‘‘local people.’’∑≤
In the state of Maharashtra, a directive specified not merely‘‘local’’ persons but also speakers of the Marathi language—that is, people ethnically Maharashtrians. In the state of AndhraPradesh, where 86 percent of the people spoke the same lan-guage, and where the group seeking preferences was of the
≥∏ affirmative action in india
same race, religion and culture as the group whose superiorperformances they were trying to offset, making the distinctionbetween groups required much ingenuity and sophistry—butit was done.∑≥
In all these cases, there was abundant evidence that the lesssuccessful indigenous groups simply did not have the skills,experience, or attitudes that had enabled others to come in andsurpass them. In Maharashtra, for example, the Maharashtriansthemselves preferred to buy from South Indian shopkeepers,rather than from their fellow Maharashtrians. In Andhra Pra-desh, even a local leader who was demanding preferences ad-mitted that a rival group had higher qualifications:
Yes it is true that they are also better qualified for many of the jobsthan we are. Maybe they are better qualified but why is merit soimportant? We can have some inefficiency. That will be necessaryif our people are to get jobs. Are we not entitled to jobs justbecause we are not as qualified?∑∂
In the state of Karnataka, a local political leader uncom-promisingly advocated local preferences while in office. But,ten years later and out of office, he expressed very differentviews:
. . . outsiders come in when the local people are lazy and lethargic.If the local people are active and enterprising, outsiders cannotcome in. Many Kannadigas do not like to come out of their vil-lages. Especially for particular jobs like nursing, army, sweeping,carpentry, masonry and construction works, Kannadigas did notseem to be interested. They do not like to do the manual jobs,because they feel that such jobs are inferior.∑∑
While statistical disparities are often used as showing a needfor affirmative action, the reasons for these disparities usuallyget little serious investigation, while much attention is focusedon the supposed injustice of it all. The situation described inKarnataka is not unique.
affirmative action in india ≥π
Andhra Pradesh
The state of Andhra Pradesh is the product of one of theinternal reorganizations which have occurred at various timesafter India received its independence. During the era of Britishcolonial rule, the city of Hyderabad was capital of the state ofHyderabad—a state ruled by an Indian prince. Meanwhile,ethnically and culturally very similar people living in the ad-joining state of Madras were under the rule of the British. AfterIndia became independent and absorbed the princely state ofHyderabad, it was understandable that a territorial reorganiza-tion would bring these very similar people together in thenewly created state of Andhra Pradesh. But, although thesepeoples were the same in such things as race, language, andreligion, their different histories under two different sets ofrulers turned out to create very serious social, economic, andpolitical disparities. As elsewhere on the Indian subcontinent,people living under indigenous rulers tended not to becomeas educated or as modernized as those living under Britishrule. For example, 17,000 out of 22,000 villages in the state ofHyderabad lacked a school.∑∏
It was already understood on all sides, before the creationof the new state, that the people known as Andhras, who hadlived under British rule, had become more advanced—in agri-culture, in education, and in modernization in general—thanthe people called Telanganans, who had lived under princelyrule in Hyderabad. Accordingly, various ‘‘safeguards’’ wereprovided in 1956 to assure the Telanganans of, among otherthings, numerical representation in government and in educa-tional institutions for a period to end in 1969.∑π However, whentime for the end of these preferences and quotas arrived inJanuary 1969, demands were made for their extension andexpansion.
What had happened in the intervening years was that theAndhras had surpassed the Telanganans in field after field,
≥∫ affirmative action in india
wherever they came into competition. The city of Hyderabad,as the capital of the new state of Andhra Pradesh, became acenter of competition and confrontation between the Tele-ganans and the Andhras. Although Hyderabad was located inthe Telanganan region, Andhras who had migrated there weremore successful in this competition and formed what becameknown as ‘‘Andhra colonies’’ in the capital. By 1961, one-fourth of Hyderabad’s inhabitants were migrants. Althoughmost Indians were, and would remain for decades more, illiter-ate, most of the Andhra migrants were literate and thousandsof them had gotten higher education.
Unskilled migrants in the city were largely from other partsof the Telanganan region, while Andhra migrants held clericaland other white collar or middle-class jobs. Andhra farmersfollowed a long-standing practice of buying up land from Telan-ganans and making it more productive. The ‘‘green revolution’’was put to use by the Andhras, but not by the Telanganans.∑∫ Inshort, the Telanganans were bested in many ways on their ownturf, despite the preferences and quotas known as ‘‘safeguards,’’and were therefore understandably apprehensive about theirfuture if these safeguards ended on schedule in 1969.
University students began protests that spread to otherareas and escalated into mob attacks on railroads and govern-ment facilities. State officials promised to replace ‘‘outsiders’’with local Telanganans in government jobs but the SupremeCourt of Andhra Pradesh ruled that they had exceeded theirauthority. Later India’s Supreme Court overruled the statecourt, allowing local officials to proceed with local preferences.This set off six months of violence by contending forces inAndhra Pradesh.
Telanganans now began to demand their own separatestate, which would have given them the uncontested right toestablish their own preferences and quotas, but the centralgovernment of India saw in this the threat that other stateswould begin to fragment into innumerable ethnic enclaves
affirmative action in india ≥Ω
seeking their own statehood. Although it was legal for a state toestablish preferences and quotas to favor its indigenous peopleover ‘‘outsiders,’’ in this case both contending parties werefrom within the state. Amid political strife and violence in thestreets, a compromise was worked out, even though it requireda constitutional amendment. Preferences and quotas for localpeople were now officially permitted within a region within astate. This gave the Telanganans what they wanted, without theneed to fragment the state.
Although the situation in Andhra Pradesh was ultimatelyresolved without the on-going strife found in other Indianstates, this unusual situation highlights the fact that the differ-ences in language and religion which have been so contentiousin other states are neither necessary nor sufficient to causeintergroup polarization. What the situation in Andhra Pradeshhad in common with intergroup conflict in other states—andnations—was that one group was unable to compete on eventerms with another and therefore turned to politics and toviolence to get the preferences and quotas they wanted.
Assam
In the state of Assam, the economic development of a mod-ern industrial and commercial sector has been largely the workof outsiders, going all the way back to colonial times in BritishIndia. The British imported Chinese laborers from as far awayas Singapore, paying them four or five times the wages paid tothe local Assamese.∑Ω Later, in post-colonial India, other mi-grants continued to earn more than the Assamese.∏≠ Commentsfrom those employing Assamese workers were largely negative,both from the British in colonial times and from Indian em-ployers during the later era of independence. Marwari busi-nessmen characterized their Assamese employees as lethargic,unreliable, untrustworthy, and unwilling to work long hours,∏∞
just as the British during the colonial era had complained of the
∂≠ affirmative action in india
‘‘indolence and incapacity’’ of the Assamese and to their ‘‘utterwant of an industrious, enterprising spirit.’’∏≤
Marwaris are an entrepreneurial group that originated inthe western state of Rajasthan. Under British rule, they beganmigrating all over the Indian subcontinent, often beginning aspoor traders and later rising to prosperity as merchants, man-ufacturers, bankers and in other commercial and industrialroles. In the state of Assam, the Marwaris were a major factor inopening the region to trade, becoming in the process the dom-inant group in that trade. Marwaris remained a separate groupin Assam, with their own charities, hospitals, schools, news-papers and other institutions. Their language remained Hindi,rather than Assamese.∏≥
Another group whose history in Assam was in sharp con-trast with that of the indigenous Assamese has been the Ben-galis. They have included both Hindus and Moslems from Ben-gal, where land was much more scarce than in Assam. Arrivingin Assam in colonial times, the Bengalis eagerly seized theabundant idle land now available to them, cleared jungles, andfarmed with far more care, energy and success than the As-samese. Bengalis were not only successful in agriculture and inthe professions, the British authorities relied on them to fillresponsible positions in the colonial bureaucracy. Bengalis alsoseized upon educational opportunities created by the British,while the Assamese were slow to see a need for education. Un-like many others in India, the Assamese were seldom landlessagricultural laborers but were largely peasant farmers with rich,fertile land. What they suffered from was seeing others come inand surpass them in their own region.
Because the Assamese were slower to take advantage ofeducational opportunities, the Bengalis were far better repre-sented in educational institutions and in government employ-ment. Thus the language of education and government in As-sam became Bengali, rather than Assamese. As a result, those
affirmative action in india ∂∞
Assamese who eventually began to seek education found a lan-guage handicap confronting them. However, as far back as themid-nineteenth century, the Assamese were able to get the Brit-ish authorities to change the language of the schools from Ben-gali to Assamese.∏∂ Political activity to redress the imbalancescreated by unequal competition elsewhere became a patternfor the Assamese in the years and generations that followed. Inresponse to their fears and resentments of the Bengalis andothers, by 1920 British authorities sought to restrict the inflowof migrants into Assam.∏∑
As elsewhere in India, ethnic conflicts were often foughtout as language conflicts in Assam. Allowing both Assameseand other languages to be used in state institutions would implyequal opportunity for the various groups in Assam but onlyan exclusive use of the Assamese language could provide thepreferential treatment the Assamese were seeking, in order tobuttress the preferential treatment they already received ingovernment employment and were seeking in private employ-ment. During the 1960s, Marwari employers were denouncedby Assamese politicians and students for not hiring enoughAssamese employees. Such complaints were backed up by riotsand arson. The Assamese also favored socialism which, in As-sam, would mean confiscating businesses owned by the outsidegroups who dominated the local economy.
By 1972, both the Assamese and the Bengalis were riotingover the unresolved language issues. When Bengali studentswere allowed to answer questions on university examinations intheir own language, widespread riots, arson, and looting brokeout in a number of towns in Assam and troops had to be calledin to restore order.∏∏ Once again, in 1983 the Assamese andmembers of local tribes attacked Bengalis, killing 4,000 ofthem and making more than a quarter of a million peoplehomeless.∏π Assam has remained so unsettled that no censuswas possible there in 1981—or in the decades since then.

∂≤ affirmative action in india
Maharashtra
Violence in pursuit of ethnic preference claims have notbeen confined to Assam. In Maharashtra, a paramilitary move-ment called Shiv Sena has specialized in intimidation and vio-lence, directed against various ‘‘outsiders’’ who dominated theeconomy of Bombay (the capital of Maharashtra), as variousother outsiders dominated the economy of Assam. This intim-idation and violence has likewise been directed against politi-cal authorities and private businesses from whom preferentialhiring of Maharashtrians was demanded. When presentingsuch demands to an official of India Oil, for example, thesedemands were accompanied by the observation: ‘‘You are sit-ting inside the office, but your oil drums are outside.’’∏∫
The background to the pressures for preferential policiesin the city of Bombay (now renamed Mumbai) and in the sur-rounding state of Maharashtra was much the same as in Assam:Indigenous locals were simply no match for outsiders who weremuch preferred as employees and much more successful asentrepreneurs. Indeed, even advocates of the locals tacitly ad-mitted that they were not equal in performance to outsiders,and used that as an argument for preferential treatment:
If you have two plants, one with hardy roots and broad leaves andthe other with only weak roots and small leaves, they can not drinkthe water, the soil nutrients or absorb the sun’s energy with thesame efficiency. The weak plant needs more attention so that itcan catch up and one day produce beautiful fruit.∏Ω
Entrepreneurs from the neighboring state of Gujarat werethe largest group of business executives in Bombay in the mid-dle of the twentieth century and were more than half of allmanagers in companies surveyed then.π≠ Maharashtrians werevirtually non-existent at these high levels and were also notmuch in demand as workers, since they were considered to belacking in both skills and productive attitudes.π∞ All this was
affirmative action in india ∂≥
turned into sources of resentment of ‘‘discrimination’’ againstindigenous locals by an ambitious editor named Bal Thackeray,who also founded the Shiv Sena movement to redress thesegrievances. In 1965, the magazine that Thackeray edited ran aseries of stories about the dominance of ‘‘outsiders’’ in high eco-nomic positions in Bombay.π≤ These exposés not only causedthe magazine’s circulation to skyrocket, it created the atmo-sphere in which the Shiv Sena movement could be born andflourish. Operating much like the paramilitary forces whichbrought Mussolini and Hitler to power, Shiv Sena became aforce both in politics and in the streets. It ran candidates forpolitical office, organized boycotts, and has been implicated inviolence and murder, principally against ‘‘outsiders.’’π≥
Originating in Bombay, Shiv Sena over the years became adominant political force in the whole state of Maharashtra and,at the beginning of the twenty-first century, had 15 seats inIndia’s national parliament. Its central issue of hiring prefer-ences and quotas for Maharashtrians expanded to include anti-Moslem agitation, opposition to foreign ownership of Air In-dia, refusal to allow a cricket match between India and Pakistanto take place in Maharashtra—in short, whatever issues wouldappeal to xenophobia against a growing list of ‘‘enemies.’’Meanwhile, group-identity politics was growing in other statesand localities and, nationally, a Hindu extremist party was ris-ing to challenge the Congress Party that had ruled India for 30consecutive years since independence in 1947. This BharatiyaJanata Party, better known as BJP, whipped up emotions oversuch things as the fact that Moslems had invaded India in cen-turies past. BJP formed a political alliance with Shiv Sena andeventually became the ruling party of India.
In the wake of the rise of Shiv Sena, more Maharashtriansbegan to be hired in greater numbers, and in higher positions,than before. However, as noted in Chapter 1, this rise had beenpreceded by a huge increase in the number of educated Ma-harashtrians, antedating the founding of Shiv Sena, so that it is

∂∂ affirmative action in india
not easy to determine how much of their advancement was duespecifically to that organization and the preferential treatmentthat it fostered. What is more clearly attributable to Shiv Sena isan escalating polarization in Maharashtra between the indige-nous people, who are barely a majority, and various other eth-nic and religious groups, who began to fight back. A corres-pondent for the distinguished British magazine The Economist
reported from Bombay in 1993:
The murder, looting and arson that began on January 6th soonspread from the Muslim ghetto to the enclaves of the privileged.First the police were called in, then the paramilitary forces, andthen, on January 9th, the army—and still the mayhem spread.This week the railroad station was swamped with thousands offamilies trying to flee the city. At the airport fights broke out asthe rich found flights had been curtailed by a pilots’ strike.π∂
More, and sometimes worse, intergroup violence was tobreak out in Bombay in the years ahead. In a series of suchoutbreaks in 1994, the official death toll was more than a thou-sand people—and the Far Eastern Economic Review reportedthat unofficial estimates were in the thousands. It added, withquotes from The Times of India:
These statistics convey little of the real horror of hordes ‘‘stoppingvehicles and setting passengers ablaze’’; of ‘‘men brought bleed-ing to hospital who were knifed afresh’’; of the autorickshawdriver who ‘‘decoyed a Muslim couple into a fatal ambush’’; of‘‘neighbors leading long-time friends to gory deaths’’; of womendriven mad having ‘‘seen their children thrown into fires, hus-bands hacked, daughters molested, sons dragged away,’’ and ofthe 150,000 people hounded out of the city.π∑
It was not only people who fled the city. More than a millionjobs also left, as businesses began to consider Bombay a riskyplace to be. Whether Maharashtrians gained as many jobsthrough preferences and quotas as they lost through the ex-
affirmative action in india ∂∑
odus of employers is a question that may never be answered—or asked. No such considerations, however, dissuaded ShivSena from pushing on with its anti-Moslem rhetoric and sym-bolism. One such act of symbolism in 1995 was changing thename of Bombay back to a name it once had, centuries earlier,before the British conquests and—more to the point—beforethe Moslem conquests. Other names of towns and villages werealso changed back to what they had been before the Moslemsarrived in earlier centuries.
Asiaweek magazine said of Bal Thackeray: ‘‘Though he holdsno elected office, he is now widely acknowledged to be the mostpowerful leader in Maharashtra, India’s richest state.’’π∏ Time
magazine said: ‘‘Authorities have been so afraid that the Hinduleader’s arrest could trigger mass unrest that he wasn’t touchedeven after proclaiming in 1992 that stormtroopers from hisShiv Sena party had demolished the disputed mosque at Ayodh-ya, setting off nationwide violence.’’ππ
The turmoil that has been the life’s blood of an extremistmovement like Shiv Sena has drained away economic resourcesfrom Bombay (Mumbai). Despite the city’s long predominanceas India’s pre-eminent commercial and industrial center—40percent of all the direct taxes in India were collected there—many foreign companies began choosing Bangalore, Hydera-bad, and Madras for their headquarters instead, and domesticbusinesses have likewise begun to relocate. In 1998, Bombay’sexcise and customs revenues dropped for the first time.π∫
None of this seems to have dampened Shiv Sena’s penchantfor symbolic outbursts—for example, ‘‘ransacking and throw-ing cowdung at McDonald’s outlets.’’πΩ However, there havebeen signs that Shiv Sena may be losing support. In 2001, BalThackeray was finally arrested for his part in the destruction ofa mosque that he had admitted publicly nine years earlier.
However, the political success of local xenophobic move-ments seeking preferential treatment in various parts of In-dia has promoted xenophobia of other kinds, including anti-
∂∏ affirmative action in india
Western xenophobia. The state of Uttar Pradesh, for example,has officially banned Valentine’s Day celebrations, and gangs inthe state of Orissa have launched attacks on Christians:
Bibles were burnt, priests and nuns assaulted, churches damagedand chapels set afire. Graham Staines charred to death with hischildren. Father Christudas paraded naked and humiliated onthe streets of Dumka and a nun in Bihar forced to drink humanrefuse.∫≠
Tolerating, condoning, or rewarding lawless xenophobiahas only caused it to spread and become more extreme andmore ugly. In December 2002, the Hindu extremist BharatiyaJanata Party won a landslide victory in the state of Gujarat.
NON-PREFERRED GROUPS
Despite the relatively small amount of actual realized benefits tothe untouchables and poor tribal groups, the whole system ofpreferences and quotas bears heavily on non-preferred groups,especially those higher-caste individuals who do not have inde-pendent sources of income or wealth, and who are thereforemore dependent on access to education for professional andgovernment jobs. The progressive extension of preferences andquotas to numerous groups, and especially to ‘‘other backwardclasses’’ who are in a better position to actually utilize thesepreferences, means that at least three-quarters of the popula-tion of India are members of officially preferred groups. Whilethe remaining minority are generally members of higher castes,that ascribed status does not automatically translate into eco-nomic privilige. While brahmins are in general more prosper-ous than untouchables, there are also poor brahmins and afflu-ent untouchables. Those young people from non-preferredgroups who are dependent on gaining an education to earn thekind of living required to maintain their position in society canthus find themselves in a desperate situation and resort to des-
affirmative action in india ∂π
perate measures. After the national government elected in1989 expanded quotas, there were violent reactions from thenon-preferred groups:
Students set fire to themselves; others led protest campaignsacross the country; trains were derailed and vehicles burnt; thepolice opened fire and demonstrators were killed.∫∞
Much more is involved here than a simple moral melo-drama of the rich versus the poor. Most of the truly poor arelittle affected by the preferences and quotas instituted in theirname but going primarily to others. Nor are most of the trulyrich likely to be seriously inconvenienced by lessened access tocivil service jobs, especially since they can be appointed tomuch higher positions if they wish. Moreover, the ability of therich to provide their children with the finest primary and sec-ondary education virtually ensures that their offspring will beable to score high enough on university entrance examinationsthat they are not likely to be the ones sacrificed to provideplaces to members of preferred groups.
In short, neither the rich nor the poor are likely to be greatlyaffected by preferences and quotas. It is those in between whoreceive either windfall losses or windfall gains, according towhich broad-brush category they happen to fall in, and regard-less of whether their individual circumstances are more fortu-nate or less fortunate. As for the genuinely affluent or wealthy,they seem to have done well. As one study concluded:
The wealthier 25 percent now owned more land than they had ageneration earlier, and the level of rural unrest had risen in pro-portion to the immiseration of scheduled-caste families.∫≤
Preferences and quotas are not merely zero-sum games, asthe rich-versus-poor image might suggest. There are costs tosociety as a whole, borne to some extent by all the variousgroups in it. These include whatever losses of efficiency mayfollow from putting less qualified people in particular jobs or
∂∫ affirmative action in india
admitting them to universities for which they do not qualifyand from which they are unlikely to graduate. More seriouscosts include increased intergroup hostility, as well as the vio-lence and deaths to which this often leads.
SUMMARY AND IMPLICATIONS
As the country with the longest history of preferences andquotas for the purpose of advancing poorer and disadvantagedgroups, India’s experience is particularly relevant to the story ofthe actual consequences of such programs, as distinguished fromtheir hopes or rationales. Much of what happened in Indiaforeshadowed what happened later in other countries that fol-lowed in her wake with similar affirmative action policies.
The record is particularly clear in India because of moredetailed statistics being available on the country’s many sub-groups. While statistics in the United States, for example, arekept on such broad-brush categories as blacks, whites, and His-panics, in India the four broad castes of Hindus are brokendown more finely into the many sub-castes that are the livingreality in particular localities across the country. Thus it iseasier to see how the benefits set aside for untouchables godisproportionately to those groups of untouchables who aremore prosperous. While there is evidence that preferences andquotas in the United States—and in Malaysia and Sri Lanka,for that matter—also benefit primarily the more fortunatemembers of less fortunate groups, American government sta-tistics do not break down the black population by recognizableclasses (or ethnic sub-groups like West Indians) to see whogained and who lost.
There is no need to quarrel with the underlying purposes ofaffirmative action programs to help severely disadvantagedgroups. Nor is there the slightest reason to doubt that India hashad—and continues to have—some of the poorest and mostoppressed groups in the world. But, unless one is content to
affirmative action in india ∂Ω
simply ‘‘do something,’’ without regard to the actual conse-quences, it is hard to escape the conclusion that affirmativeaction in India has produced minimal benefits to those most inneed of them and maximum resentments and hostility towardthem on the part of others. The need for supplementary contri-butions—whether financial or cultural—from members of thedesignated beneficiary groups themselves, in order to makepreferences and quotas effective, has all but ensured that thebenefits would go disproportionately to those individuals andsubgroups who are already most fortunate, rather than thosemost in need.
Hard data tell this painful story again and again. Despite anemphasis on intergroup disparities as the driving force behindaffirmative action policies in India, these policies have them-selves shown great disparities in their distribution of benefits.Nor has this fact been lost on Indians themselves. Opponentsof affirmative action have argued in parliament that ‘‘a sectionof the backward castes are already wealthy and need no help tocompete.’’∫≥ India’s Supreme Court in 1992 upheld the exclu-sion of more fortunate individuals and groups from quotas formembers of ‘‘other backward classes.’’ In 1999, the SupremeCourt struck down a quota law in the State of Kerala whichhad declared that there was no ‘‘creamy layer’’ among thosegranted preferences in that state.
The continuing legal and political controversies in Indiaover what to do about the skewed distribution of the benefits ofgroup quotas, which go disproportionately to those alreadymore fortunate, at least shows a public awareness of this skew-ness—an awareness that has not yet become widespread in theUnited States, where a similar skewness exists.
Despite talk of limited or temporary preferences, thesepreferences have persisted and spread until they now apply toat least three-quarters of the population of India,∫∂ though In-dian courts limit quotas to 50 percent of available places. More-over, as an exhaustive scholarly study of group preferences in
∑≠ affirmative action in india
India concluded, quotas for the ‘‘other backward classes’’ areoften not only larger than quotas for untouchables and tribalpeoples, ‘‘they never go unfilled.’’∫∑
Such facts have been known for decades, but this has notled to any alternative approach to help those at the bottom ofthe socioeconomic scale. Given the vast amount of intellectual,judicial, and political thinking that has gone into assessmentsof affirmative action in India, it is hard to believe that there isany readily available solution. Nor does it seem politically possi-ble to end such programs, despite growing demands that theybe ended and the rising tide of violence against untouchablesas supposed beneficiaries. Nor have members of the ‘‘otherbackward classes’’ escaped violence. After the state govern-ment of Gujarat expanded the size of the quotas for membersof the backward classes in 1985 from 10 percent to 28 percent,riots broke out in which ‘‘some two hundred and seventy fivepeople died in an orgy of arson and murder.’’∫∏
Neither advocates nor critics of affirmative action seemready to back down. Where courts or officials have balked atvarious double standards, those double standards have oftengone underground, rather than going away. Objective stan-dards have been offset by an increase in non-objective stan-dards, used clearly as counterweights to produce the samegroup representation results produced by explicit double stan-dards. For example, applicants to a medical school in TamilNadu were allowed to receive 75 out of 275 points for suchthings as sports, extracurricular activities, ‘‘aptitude’’ and ‘‘gen-eral abilities’’—as determined by interviews which lasted approx-
imately three minutes per applicant. Moreover, the ratings ofthese applicants on the interviews showed what an Indian courtcalled a ‘‘disturbing’’ pattern of discrepancy from their ratingson other criteria.∫π
In short, whatever the appeal of ‘‘nuanced’’ and non-objective criteria, they lend themselves to being used as arbi-
affirmative action in india ∑∞
trary offsets to deficient qualifications by objective criteria. Inanother case that reached the Indian courts, it was found thatmany ‘‘students whose performance in the University examina-tions was none too satisfactory nor their past records cred-itable’’ nevertheless received ‘‘very high marks at the inter-view’’ while ‘‘a large number of students who had secured veryhigh marks in the University examinations and who had per-formed well in their earlier classes had secured low marks at theinterview.’’∫∫
Although the initial rationale for affirmative action or ‘‘pos-itive discrimination’’ in India was to help the poorest and mostdiscriminated against groups, these preferences and quotasrapidly spread to ‘‘other backward classes’’ and to many localgroups—such as those in Assam, Andhra Pradesh, and Maha-rashtra—whose main problem was their own inadequacy andtheir resentment of other groups who were more successful ineducation and in the economy. Neither the scope nor the ra-tionale for group preferences and quotas could be confined towhat they were initially.
Within the short run—which is to say, within the time hori-zon of elected officials—the most politically expedient thing todo is to continue to extend preferences to more groups andmore sectors of the society and the economy. That is in factwhat is being done. In the longer run, cultural changes withinthe intended beneficiary groups would be necessary in orderfor the poorest of them to actually utilize all the benefits theo-retically available to them. Yet there is no political mileage to bemade by telling people to change themselves. Nor would it beeasy for untouchables and others to adjust to changed condi-tions in ways that would promote their own advance or theadvance of their children.
Money for school supplies, transportation to schools thatare widely scattered, or living expenses for residential schoolsor colleges, are not easy to come by for desperately poor people.
∑≤ affirmative action in india
Equally difficult to provide are cultural prerequisites—parentalliteracy, books in the home, or just an appreciation of a need foreducation great enough to overcome the competing need forthe fruits of the children’s labor in families living on the edge ofsubsistence. Uneducated or less educated parents are also lessable to provide guidance to their children in their educationalchoices. Moreover, the apathy born of hoplessness does notevaporate immediately when a new world of opportunities andprerequisites appears. Even a fervent advocate of the untouch-ables, and of preferential policies for them, has urged untouch-able students in medical and engineering schools to abandontheir ‘‘indifference.’’∫Ω
The cumulative effects of these disadvantages are stagger-ing. Moreover, most of the ways of lightening the burdenare not politically expedient. In addition to telling disadvan-taged groups unpalatable truths, statesmanlike political lead-ers would have to tell taxpayers the equally unpalatable truththat more money is needed to cover complementary costs thatthe poorest simply cannot afford—and tell more fortunate in-dividuals and groups that there is no excuse for them to absorbbenefits more urgently needed by others. Given the scope ofthe political task, it can hardly be surprising that it has not beenperformed.
Even for intellectuals on the sidelines and free of the needto get re-elected, there are challenging tasks. The first chal-lenge is to give up easy indulgence in moral melodrama andlook at the actual empirical consequences of affirmative action,rather than its rationales or its vision. It is so much easier tocondemn a painful social reality than to determine what can bedone in an almost impossible situation to make matters incre-mentally better without making other things worse. Dealingseriously with such problems means giving up easy ‘‘feel-good’’gestures like adding points to the scores of less fortunate appli-cants for university admissions and subtracting points from the
affirmative action in india ∑≥
scores of the more fortunate—none of which changes the un-derlying realities or the consequences that will ultimately fol-low from those realities, including massive failures of studentsin settings where they are overmatched.
Any serious concern for the success of socially disadvan-taged students in higher education must begin years beforethey reach universities. This means that even the most success-ful efforts at giving them the educational foundation that theyneed—and such success is not easy to come by—is unlikely toshow results at the university level until perhaps a decade later.Yet how many politicians, activists, or intellectuals are preparedto wait that long? And if the easier path of group preferencesand quotas is in place in the meantime, how much incentivewill there be for the disadvantaged students to subject them-selves to the painful self-discipline and hard work required tobreak old patterns of behavior and attitudes, in order to seizeopportunities far out on the horizon? India is not the onlycountry in which those given group preferences have shown‘‘indifference’’ toward the hard task of preparing themselves tomeet the standards expected of others. Similar complacencyamong those given group preferences has been observed in theUnited States, South Africa, and Malaysia. Why should anyoneexpect Indians to be different?
A small but encouraging sign has been an opinion surveyamong untouchables who are scavengers in various villages.While most see no better alternatives available for themselves, amajority have aspirations for their children to become edu-cated for better work.Ω≠ This longer run perspective amongdowntrodden people is both encouraging in itself and puts toshame the short-run expediency too often found among thosefurther up the social scale in politics and in academia. Pref-erences and quotas can produce immediate increases in bodycounts of people from particular groups, however tenuousthe position of such people may be—especially as university
∑∂ affirmative action in india
students who fail to finish. The make-believe equality of theirphysical presence can be both a mockery and an obstacle toreal achievement.
How India will cope with its problems is a question with noeasy answer and one obviously to be dealt with by Indians. Whatis clearer are the lessons that others can learn from India’sexperience with affirmative action. It has been said that thosewho refuse to heed history will be forced to repeat it. Much ofthe history of affirmative action in India has already begun tobe repeated in other countries.
chapter 3
A≈rmative Action in Malaysia
Malaysia is a country of about 23 million people and oneof the more prosperous countries in Southeast Asia.The population of Malaysia is 50 percent Malay, 24
percent Chinese and 7 percent Indian.∞ In earlier times, theChinese minority was much larger—and at one time exceededin size the Malay population. As of 1948, the population ofcolonial Malaya was 45 percent Chinese, 43 percent Malay and10 percent Indian.≤ Much history lay behind those statistics, aswell as the very different statistics of today. The higher fertilityrate among the Malays than among the Chinese and Indianminorities≥ suggests that a Malay majority is assured for thefuture.
HISTORY
What is today called Malaysia is a combination of territories thatwere ruled by the British for about a century and a half. Duringmost of that colonial era, which ended with independence in1957, the central and most economically developed part ofthese territories was the Malay peninsula, at the tip of which isthe island of Singapore, one of the leading ports in Asia. As thecolony known as Malaya evolved into the independent nation of
∑∏ affirmative action in malaysia
Malaysia, it absorbed both Singapore and some territories onthe island of Borneo to the east, which these territories sharedwith Indonesia. Most of the large island of Borneo belongs toIndonesia, whose other great island—Java— flanks Malaysia onthe west.
While the two largest ethnic groups in Malaysia are theMalays and the Chinese, there is also a small Indian minority—mostly Tamils—and other indigenous peoples who, togetherwith the Malays, make up the bumiputeras or ‘‘sons of the soil,’’for whom special provisions are made by the government. Al-though Malays are just half of the population of Malaysia, allthe bumiputeras put together add up to 61 percent of the coun-try’s population.∂ In times past, the country’s changing demog-raphy had much to do with its changing political structure. Thefirst of these demographic changes began in the early nine-teenth century, when immigrants began arriving from China.
British-ruled Malaya was just one of the countries in South-east Asia to which vast numbers of immigrants from Chinamoved during the era of European imperialism.∑ These Chi-nese immigrants were typically poor and illiterate, and sostarted at the bottom, working in hard, dirty, and menial tasksthat the indigenous peoples of the region largely disdained. InBritish-ruled Malaya, the Chinese provided much of the laborof field hands working on rubber plantations, while peoplefrom India predominated among the miners working in thecountry’s tin mines, as Malaya became and remained for manyyears the world’s leading producer of these two products.
The capital and management for these enterprises weresupplied by Westerners, while the labor was supplied by theChinese and Indians, leaving little role for the Malays in thedevelopment of their own country’s modern sectors. However,the Malays owned land and thus many were in a position tospurn the lowly and arduous jobs filled by the poverty-strickenChinese and Indian immigrants. Where some Malays did workalongside the Chinese on rubber plantations, their output per
affirmative action in malaysia ∑π
worker was less than half that of the Chinese.∏ As the inflow ofimmigrants from China continued over the years and genera-tions, the Chinese population of the Malay states rose from anestimated 100,000 in 1881 to more than a million just 50 yearslater.π By 1941, the Chinese out-numbered the Malays in Brit-ish Malaya.∫
Although the Chinese began at the bottom economically,their frugality enabled them to begin to move out of the ranksof laborers by setting up small businesses, usually tiny retailshops. While more than half of all the Chinese in Malaya in1911 were laborers, either in agriculture or in the mines, justtwenty years later only 11 percent were still in those occupa-tions.Ω Even as they rose economically, however, the Chineseremained socially very separate and distinct from the indige-nous Malays. The two groups spoke different languages, haddifferent religions, and had wholly different lifestyles. The fru-gal Chinese lifestyle, for example, was very different from thatof the Malays, who were known for free spending and for go-ing into debt for the sake of social celebrations.∞≠ Populationgrowth rates and infant mortality rates among the Chinesewere both roughly half of these rates among the bumiputeras.∞∞
Given the many cultural differences among the various groupsin Malaysia, it is not surprising that there have been very fewinter-racial neighborhoods or inter-racial marriages in colonialMalaya or in the independent nation of Malaysia.
Over the years and generations, the Chinese built up busi-nesses across Malaya, creating whole new industries in the pro-cess. In addition to innumerable small retail establishments,the Chinese also went into some larger ventures. For example,by 1920 Chinese-owned mines produced nearly two-thirds ofthe tin in Malaya, though Europeans later overtook them in tinproduction.∞≤ Retail trade, however, continued to be domi-nated by the Chinese, who eventually came to own 85 percentof all retail outlets in the country.∞≥ Although the Chinese hadbegun in Malaya much poorer than the Malays, their incomes
∑∫ affirmative action in malaysia
rose over the years until they were earning more than doublethe average income of the Malays. Most of the capital investedin the country was owned by foreigners but, among the domes-tically owned corporate equity, most was owned by the Chinese.
Malaysia exhibits on a national scale patterns already seenin India’s states of Assam, Maharashtra, Andhra Pradesh, andKarnataka—local people outperformed by outsiders, whetherin education, in the labor force, or in business and industry.This situation produced the same explosive resentments foundin India and in other countries, and ended with similar de-mands for preferential policies for those who could not meetthe competition of the outsiders.
The Malays already enjoyed some preferential treatmentunder British colonial rule. Non-Malays faced strong restric-tions against owning land in Malaya and the colonial govern-ment provided free education for Malays, while leaving othersto educate their children however they could. Malays were alsopreferred for jobs in the colonial bureaucracy. Despite prefer-ential treatment for Malays, however, the Chinese continued tooutperform them. A higher percentage of Chinese childrenthan Malay children received an education, even though theChinese had to pay for their own private schooling.∞∂
Inter-ethnic tensions were among the major challenges fac-ing the British colony of Malaya when it became the indepen-dent Federation of Malaya in 1957. Later, after the addition ofSingapore and other territories, the Federation of Malaya be-came the nation of Malaysia. The country’s constitution guar-anteed the political supremacy of the indigenous Malays, bothdirectly and by weighting votes in rural areas, where the Malayspredominated, more heavily than votes in the cities, where theChinese were in the majority. The close similarity in populationsizes between the Chinese and the Malays at that point madethe Malays uneasy about maintaining that supremacy in thefuture. The Chinese were already demanding equal treatmentfor all citizens of Malaysia, while the Malays wanted to maintain
affirmative action in malaysia ∑Ω
and expand preferential treatment for themselves and otherindigenous people as bumiputeras or ‘‘sons of the soil.’’
This inter-ethnic strife was resolved by one of the most re-markable political decisions: Singapore was expelled from Ma-laysia in 1965—one of the few times in history when a countryhas voluntarily divested itself of part of its own territory. Be-cause Singapore had a heavily Chinese population, its expul-sion left Malaysia with a comfortable Malay majority, which wasthe whole point of the action. Now Malays held unchallenge-able political control of Malaysia.
POLITICS AND PREFERENCES
Malaysia’s major political parties have been ethnic parties—the United Malay Nationalist Organization (UMNO) being thelargest, with the Malayan Chinese Association and the Ma-layan Indian Congress representing the two principal minoritygroups. In other countries around the world, political partiesrepresenting a single ethnic group each have been promotersof polarization. In Malaysia, however, these three ethnic partiesformed a political coalition known as the Alliance Party, seek-ing to mollify all segments of the society. The mutual accom-modations growing out of coalition politics were challenged byother ethnic parties, each demanding more for its own respec-tive group. Yet none of these more militant ethnic parties hassucceeded in displacing the ruling coalition parties, whichhave held power in Malaysia from the moment of its indepen-dence onward, and the country’s prime ministers have all beenethnically Malay.
Government policies steered a middle course betweenequal rights for all—both politically and constitutionally un-attainable in Malaysia—and extreme demands for an Islamicstate and suppression of Chinese economic activities. The initialcompromise included a continuation and expansion of pref-erences for the Malays in government, with various symbolic
∏≠ affirmative action in malaysia
recognitions of Malay supremacy, and a raising of taxes largelyfrom Chinese and foreign businesses, to be spent largely tobenefit Malays.∞∑ Meanwhile, there was a more or less free handfor the Chinese, the Indians and others in the economy, andadmission to university education was by performance stan-dards that were the same for all. With admission to the Uni-versity of Malaysia being determined solely on the basis ofexamination results, Malays gained only 20 percent of theplaces and most of the non-Malay students were Chinese.∞∏ Inthe Malaysian air force, more than half the officers were Chi-nese in 1969.∞π
Another feature of the Malaysian political landscape hasbeen draconian emergency powers of the government, partly aholdover from colonial days, when the British had been fight-ing a Communist guerilla movement. Now these laws couldbe—and were—invoked whenever the government wished tosuppress any public questioning of the country’s racial policies.This severe limit on free speech was also a severe limit on thekind of racial demagoguery that has torn other multi-ethniccountries apart.
The continued and highly visible inferior position of Malaysoutside the political realm was galling to the pride and aspira-tions of the Malays, providing political fuel to those who wishedto attack the compromises of the ruling UMNO-led coalition.However, when the coalition won a close victory in the elec-tions of 1969, some jubilant Chinese began celebrating in thestreets—setting off riots by angry Malays that changed thewhole future direction of the country.
Malay mobs attacked Chinese and killed hundreds of them,with thousands more being made homeless.∞∫ In order to fur-ther mollify the Malays and spare the country more bloodshed,the government launched a sweeping set of programs called theNew Economic Policy, designed to achieve what it called ‘‘racialbalance.’’ In the words of an official government publication:
affirmative action in malaysia ∏∞
If racial balance in the employment field is to be achieved suchthat the proportion of the various races in employment in themajor sectors of the economy reflects the racial composition ofthe labour force, all racial groups benefit fully from full employ-ment and existing differentials in per capita income between thevarious races are narrowed, then intersectorial movements of la-bour, as well as movements to higher productivity activities withinsectors, of a sizeable order will be necessary.∞Ω
Under the New Economic Policy, the preferences whichalready existed in government employment were extended toemployment in the private sector, including foreign firms oper-ating in Malaysia. In addition, the New Economic Policy set as agoal the transfer of 30 percent of all corporate stock in Malay-sia to Malays—either individually or to the government actingin the name of the Malay population. As of the time this goalwas set, Malays owned less than 2 percent of the country’s cor-porate equity.≤≠ They did not reach the goal of 30 percentownership by the target date of 1990, but they did reach 21percent by 1995.≤∞ However, the composition of those who ben-efitted was biased toward elites whose political support was im-portant to the ruling coalition:
Malay businesspeople, virtually all of whom had UMNO connec-tions, were given preference in obtaining licenses, credit, andgovernment contracts. As part of the strategy to increase Malayparticipation in the modern economy, the government forcedestablished Chinese and foreign enterprises to restructure insuch a way that at least 30 percent of their shares would be ownedby Malays—either government agencies acting ‘‘on behalf of’’ theMalay community or private Malay businesspeople. Enterprisesthat failed to restructure found it increasingly difficult to re-new necessary licenses or obtain contracts with the expandingstate sector. The normal way for large companies to restructurewas through the issue of new shares that were made available toMalay purchasers at below par prices.≤≤
∏≤ affirmative action in malaysia
Government loan programs were also established to offercredit preferentially to Malays. Educational preferences forMalays were also greatly expanded. The New Economic Policyprovided numerous opportunities for dispensing patronage toofficials and supporters of the ruling coalition parties, espe-cially the dominant United Malays National Organization. Forexample, UMNO politicians have often had their own businessenterprises, which receive preferential treatment from the gov-ernment. A World Bank report on the issuance of housing li-censes in Malaysia called it ‘‘an easy route to instant wealth’’ forpoliticians.≤≥
While members of parliament and state assemblies had spe-cial opportunities to profit from the New Economic Policy, ben-efits were also passed down to lower level officials of govern-ment and of the ruling parties, as well as to their supporters.Preferential access to taxi or trucking licenses for Malays be-came, in practice, preferential access to those Malays who weremembers of UMNO or relatives or protégés of UMNO officials.Moreover, people who spoke out in opposition to the rulingcoalition could find government benefits denied or discon-tinued for themselves or their localities.≤∂
Loans to give Malays preferential access to credit to startbusinesses often became in practice gifts because of a wide-spread feeling that these ‘‘loans do not have to be repaid.’’ Thiswas especially so when ‘‘the debtors, drawn largely from theranks of the local, ruling party stalwarts, are well-nigh untouch-able.’’≤∑ Similarly with the State Economic Development Cor-porations. Of the 314 companies set up by the SEDCs, less thana third made a profit in 1982, while 125 operated at a loss and86 did not even bother to file reports.≤∏ In short, Malaysia’spreferential policies, like those in other countries, tended tobenefit primarily those who were already well off and well con-nected. Even Chinese developers with connections to Malaypoliticians benefitted from government housing programs.≤π
affirmative action in malaysia ∏≥
The country’s program to eradicate poverty likewise tended‘‘to benefit the relatively better off in rural areas.’’≤∫
Although preferential hiring of Malays for government jobshad existed since colonial times, Malay predominance in ad-ministrative and non-professional occupations did not extendto the scientific, professional, and technical branches of gov-ernment, where the Chinese and the Indians continued todominate for some time, even after independence.≤Ω This pre-dominance of the Chinese in the private economy and inthose government functions requiring higher levels of scien-tific, technical, or professional skills was too overwhelming togo unnoticed. Malaysia was not a poor country like India. TheMalays’ problem was not hunger or grinding poverty, but wasrather the fact that they were clearly outshone by others. TheNew Economic Policy was designed to remedy these embarrass-ing ethnic imbalances in educational insitutions and in theeconomy.
Like so many other preferential programs, the New Eco-nomic Policy was initially designed to be temporary. It was set toexpire in 20 years but, like those in India and Pakistan, hascontinued on long past the projected cut-off date. In a formalsense, the New Economic Policy ended in 1990 as planned, butwas replaced by the National Development Policy, which con-tinued many of the same policies under the new name. Whenin the year 2000 a Chinese political group suggested that pref-erences and quotas actually end, angry responses from theMalay public and the Malaysian government caused the sugges-tion to be withdrawn.
EDUCATIONAL DIFFERENCES AND CHANGES
Educationally, the Malays lagged behind the Chinese, not onlyquantitatively but also qualitatively. At the university level, Ma-lay students enrolled in the least demanding courses, while
∏∂ affirmative action in malaysia
there were few with the qualifications to specialize in subjectsrequiring mathematical or scientific knowledge.≥≠ As of aca-demic year 1962–63, for example, Malay students at the Uni-versity of Malaya were outnumbered by Chinese students in thefaculties of agriculture, arts, engineering, and science. In thelatter two faculties, Malays were outnumbered even by studentsfrom the small Indian minority.≥∞ In mathematical, scientific,and technological specialties, the disparities between the Chi-nese and the Malays were particularly extreme. In the 1960s,Chinese students received 1,488 Bachelor of Science degrees,while Malay students received just 69. In engineering, Chinesestudents received 408 Bachelor’s degrees, while Malay studentsreceived just four.≥≤
Although the government assured ‘‘other Malaysians’’ thatthe New Economic Policy to advance the indigenous bumipu-
teras would not adversely affect the minorities,≥≥ the changeshad a particularly adverse effect in education. Among thechanges in the rules was the imposition of the Malay languageas the medium of instruction in schools and colleges, and theending of admissions to the country’s universities on the basisof individual performance. Both changes had devastating im-pacts on the Chinese and Indian younger generations.
Under the new admissions policy, the number of Chinesestudents attending the University of Malaysia declined abso-lutely between 1970 and 1980,≥∂ despite an increase in thetotal number of university students during that decade.≥∑ Thetotal number of degrees received by students of Chinese ances-try in the country’s institutions of higher education declinedduring the decade of the 1970s,≥∏ even though the total num-ber of degree recipients in Malaysia more than doubled.≥π
The conversion of English-language public schools intoMalay-language schools began in 1970 with the first grade ofprimary school. Each year another grade was converted untilthe process was completed in 1982. The Chinese and Indians,long used to being educated in English and seldom being flu-
affirmative action in malaysia ∏∑
ent in Malay, found it more difficult to attend the government-provided schools and to master materials taught in a differentlanguage. While 72 percent of Malay students with six years ofeducation passed a composition test in the Malay language in1991, only 33 percent of the Chinese students and 19 percentof the Indian students passed. In mathematics, 87 percent ofthe Malay students passed, while only 57 percent of the Chi-nese students and 50 percent of the Indian students passed.≥∫
In view of the prior record of achievements in education, by theChinese especially, clearly these new results reflected problemscreated by the new language policy, rather than academic defi-ciencies in the students.
With Chinese and Indian students having a harder timegetting into Malaysia’s universities, many began to look toother countries as places for higher education. By 1980, tens ofthousands of students from Malaysia had left the country tostudy at the university level. Three-fifths of these students wereChinese.≥Ω A majority of all Indian students seeking higher edu-cation also left Malaysia.∂≠ Even at the secondary school level,more than 10,000 students left Malaysia to study in adjoiningSingapore,∂∞ where teaching was still done in the English lan-guage. Some of those who studied abroad stayed abroad.∂≤
A partial reversal in language policy occurred in 1993,when the prime minister of Malaysia announced that instruc-tion in English at the university level would be permitted in thefields of science, technology, and medicine∂≥—fields where ap-parently it was difficult to get enough Malays to replace theChinese and the Indians, and where there was a shortage ofhighly skilled personnel.∂∂ In August 2001, the governmentannounced that university admission would again be based onindividual performance.∂∑ However, this so-called ‘‘merit’’ sys-tem established two different ways of gaining university admis-sions, the easier method being open only to Malay students.The net result was that the Malay share of university admissionsrose from what it had been under the racial quota system.
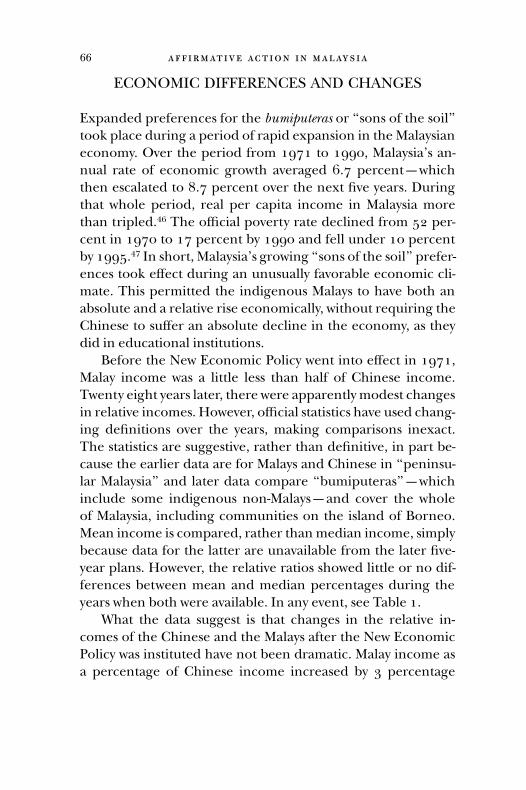
∏∏ affirmative action in malaysia
ECONOMIC DIFFERENCES AND CHANGES
Expanded preferences for the bumiputeras or ‘‘sons of the soil’’took place during a period of rapid expansion in the Malaysianeconomy. Over the period from 1971 to 1990, Malaysia’s an-nual rate of economic growth averaged 6.7 percent—whichthen escalated to 8.7 percent over the next five years. Duringthat whole period, real per capita income in Malaysia morethan tripled.∂∏ The official poverty rate declined from 52 per-cent in 1970 to 17 percent by 1990 and fell under 10 percentby 1995.∂π In short, Malaysia’s growing ‘‘sons of the soil’’ prefer-ences took effect during an unusually favorable economic cli-mate. This permitted the indigenous Malays to have both anabsolute and a relative rise economically, without requiring theChinese to suffer an absolute decline in the economy, as theydid in educational institutions.
Before the New Economic Policy went into effect in 1971,Malay income was a little less than half of Chinese income.Twenty eight years later, there were apparently modest changesin relative incomes. However, official statistics have used chang-ing definitions over the years, making comparisons inexact.The statistics are suggestive, rather than definitive, in part be-cause the earlier data are for Malays and Chinese in ‘‘peninsu-lar Malaysia’’ and later data compare ‘‘bumiputeras’’—whichinclude some indigenous non-Malays—and cover the wholeof Malaysia, including communities on the island of Borneo.Mean income is compared, rather than median income, simplybecause data for the latter are unavailable from the later five-year plans. However, the relative ratios showed little or no dif-ferences between mean and median percentages during theyears when both were available. In any event, see Table 1.
What the data suggest is that changes in the relative in-comes of the Chinese and the Malays after the New EconomicPolicy was instituted have not been dramatic. Malay income asa percentage of Chinese income increased by 3 percentage
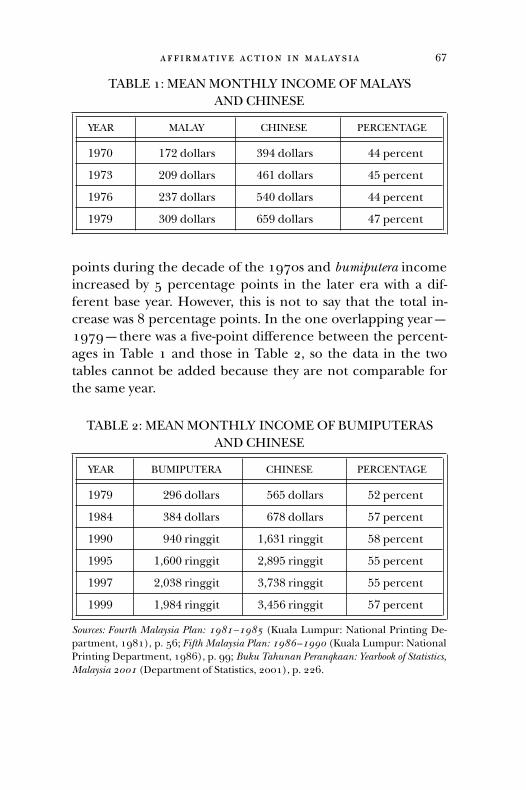
affirmative action in malaysia ∏π
TABLE 1: MEAN MONTHLY INCOME OF MALAYSAND CHINESE
YEAR MALAY CHINESE PERCENTAGE
∞Ωπ≠ ∞π≤ dollars ≥Ω∂ dollars ∂∂ percent
∞Ωπ≥ ≤≠Ω dollars ∂∏∞ dollars ∂∑ percent
∞Ωπ∏ ≤≥π dollars ∑∂≠ dollars ∂∂ percent
∞ΩπΩ ≥≠Ω dollars ∏∑Ω dollars ∂π percent
points during the decade of the 1970s and bumiputera incomeincreased by 5 percentage points in the later era with a dif-ferent base year. However, this is not to say that the total in-crease was 8 percentage points. In the one overlapping year—1979—there was a five-point difference between the percent-ages in Table 1 and those in Table 2, so the data in the twotables cannot be added because they are not comparable forthe same year.
TABLE 2: MEAN MONTHLY INCOME OF BUMIPUTERASAND CHINESE
YEAR BUMIPUTERA CHINESE PERCENTAGE
∞ΩπΩ ≤Ω∏ dollars ∑∏∑ dollars ∑≤ percent
∞Ω∫∂ ≥∫∂ dollars ∏π∫ dollars ∑π percent
∞ΩΩ≠ Ω∂≠ ringgit ∞,∏≥∞ ringgit ∑∫ percent
∞ΩΩ∑ ∞,∏≠≠ ringgit ≤,∫Ω∑ ringgit ∑∑ percent
∞ΩΩπ ≤,≠≥∫ ringgit ≥,π≥∫ ringgit ∑∑ percent
∞ΩΩΩ ∞,Ω∫∂ ringgit ≥,∂∑∏ ringgit ∑π percent
Sources: Fourth Malaysia Plan: 1981–1985 (Kuala Lumpur: National Printing De-partment, 1981), p. 56; Fifth Malaysia Plan: 1986–1990 (Kuala Lumpur: NationalPrinting Department, 1986), p. 99; Buku Tahunan Peranqkaan: Yearbook of Statistics,
Malaysia 2001 (Department of Statistics, 2001), p. 226.
∏∫ affirmative action in malaysia
There were a number of other factors at work, besidesgroup preferences, during this era, which might have influ-enced whatever income changes took place. Between 1970 and1995, the Malaysian economy evolved from being one where amajority of people worked in agriculture and forestry to one inwhich fewer than one fifth did.∂∫ Since the Chinese were al-ready predominantly urban at the beginning of the period, thismeant that it was the Malays whose rural-urban mix was chang-ing dramatically. This in turn affected the relative incomes ofthe two groups, since urban incomes have consistently beensubstantially higher than rural incomes in Malaysia, as in othercountries. Therefore, a mere shift of population from thecountrysides to the towns would itself raise the Malay income asa percentage of Chinese income nationally, whether or notthere were affirmative action policies and whether or not thosepolicies had much impact on the average Malay.
The emigration of Chinese professionals and Chinese capi-tal from Malaysia in the wake of the New Economic Policy isanother factor, of unknown magnitude in its effects on therelative incomes of the Chinese and the Malays. Between 1976and 1985, an estimated $12 billion worth of capital left Malay-sia, more than half owned by the Chinese.∂Ω If the Chinese whoemigrated from Malaysia were more prosperous than thosewho remained, as seems quite possible, then that would alsoaffect the relative income of the two groups, as an indirecteffect of group preferences.
Separating out the effect of preferences and quotas is com-plicated in Malaysia, as in other countries, by the fact that adramatic increase in education among the preferred grouppreceded these policies. The number of children attending thegovernment’s secondary schools increased by 73 percent in thefive years before 1970—that is, before the New Economic Pol-icy escalated Malay preferences. That number jumped another86 percent during the decade of the 1970s and by another 56percent during the 1980s.∑≠ The expansion of enrollments in
affirmative action in malaysia ∏Ω
higher education during these years further complicates anyattempt to assess how much of the income changes were due to‘‘sons of the soil’’ preferences, as such. Certainly policy changesdid not take place in an unchanging environment.
In Malaysia, as in other countries, the principal beneficia-ries of preferences and quotas were those who were alreadymore fortunate. An early empirical study of the effects of theNew Economic Policy concluded that ‘‘at most 5 percent’’ ofthe Malays benefited from such policies.∑∞ Within the Malaypopulation, the income share of the top 10 percent rose signifi-cantly.∑≤ Dr. Mahathir bin Mohamad, a Malay political leaderlater destined to become prime minister, recognized the factthat it was the elite, rather than the masses, who benefittedfrom group preferences for the bumiputeras and bluntly admit-ted it, as well as seeking to justify it:
These few Malays, for they are still only very few, have waxed richnot because of themselves but because of the policy of a govern-ment supported by a huge majority of poor Malays. It would seemthat the efforts of the poor Malays have gone to enrich a select fewof their own people. The poor Malays themselves have not gainedone iota. But if these few Malays are not enriched the poor Malayswill not gain either. It is the Chinese who will continue to live inhuge houses and regard the Malays as only fit to drive their cars.With the existence of the few rich Malays at least the poor can saytheir fate is not entirely to serve rich non-Malays. From the pointof view of racial ego, and this ego is still strong, the unseemlyexistence of Malay tycoons is essential.∑≥
With the passing decades, Malays began to move into areaswhere they had been greatly under-represented before. Be-cause of the country’s rising prosperity, combined with its shiftfrom an agricultural to a commercial and industrial economy,the demand for more skilled and educated people openedmore opportunities for the Malays, without reducing theabsolute numbers of Chinese in the same professions. For ex-
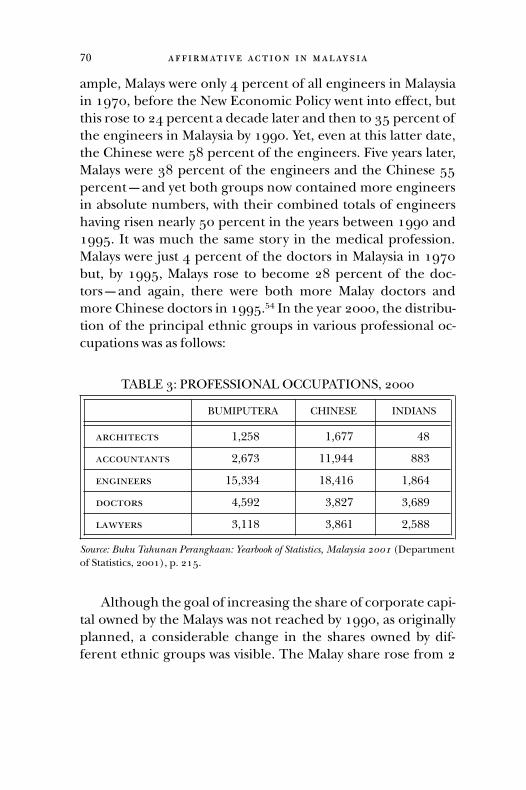
π≠ affirmative action in malaysia
ample, Malays were only 4 percent of all engineers in Malaysiain 1970, before the New Economic Policy went into effect, butthis rose to 24 percent a decade later and then to 35 percent ofthe engineers in Malaysia by 1990. Yet, even at this latter date,the Chinese were 58 percent of the engineers. Five years later,Malays were 38 percent of the engineers and the Chinese 55percent—and yet both groups now contained more engineersin absolute numbers, with their combined totals of engineershaving risen nearly 50 percent in the years between 1990 and1995. It was much the same story in the medical profession.Malays were just 4 percent of the doctors in Malaysia in 1970but, by 1995, Malays rose to become 28 percent of the doc-tors—and again, there were both more Malay doctors andmore Chinese doctors in 1995.∑∂ In the year 2000, the distribu-tion of the principal ethnic groups in various professional oc-cupations was as follows:
TABLE 3: PROFESSIONAL OCCUPATIONS, 2000
BUMIPUTERA CHINESE INDIANS
architects ∞,≤∑∫ ∞,∏ππ ∂∫
accountants ≤,∏π≥ ∞∞,Ω∂∂ ∫∫≥
engineers ∞∑,≥≥∂ ∞∫,∂∞∏ ∞,∫∏∂
doctors ∂,∑Ω≤ ≥,∫≤π ≥,∏∫Ω
lawyers ≥,∞∞∫ ≥,∫∏∞ ≤,∑∫∫
Source: Buku Tahunan Perangkaan: Yearbook of Statistics, Malaysia 2001 (Departmentof Statistics, 2001), p. 215.
Although the goal of increasing the share of corporate capi-tal owned by the Malays was not reached by 1990, as originallyplanned, a considerable change in the shares owned by dif-ferent ethnic groups was visible. The Malay share rose from 2
affirmative action in malaysia π∞
percent in 1969 to 19 percent by 1990. This included about 5percent owned by the government in the name of the bumipu-
teras. At the same time, the Chinese owned 46 percent of thecorporate capital—a little more than that owned by Malays andforeigners combined. By 1995, however, the Chinese share hadfallen to 41 percent while the Malay share rose to 21 percent,with the foreign share at 28 percent. Nevertheless, all of themhad more capital, in absolute amounts, as the corporate capitalin Malaysia grew by 11 percent per year.∑∑
In short, a rapidly growing Malaysian economy, especially inits modern and industrial sectors, has allowed the Malays toadvance economically, both absolutely and relative to the Chi-nese, without the Chinese having to suffer absolute declines inincome or occupation or ownership of capital. Only in govern-mental institutions did the Chinese suffer absolute declines as aresult of preferential policies for the Malays. This was in keep-ing with patterns found elsewhere around the world, wherepreferential policies have had their strongest effects within gov-ernment and in government-controlled institutions.
A 1971 survey showed that most Malay doctors, lawyers,engineers, and other such professionals were employed by thegovernment, while most Chinese in the same professions wereemployed in the private sector.∑∏ Moreover, within government,Malay advancement took place at the expense of the Chinese.Between 1969 and 1973, 98 percent of the new governmentemployees were Malays. Including the armed forces makes that99 percent.∑π While the total number of people in Malaysia’spolice force and the military expanded substantially between1969–70 and 1974–80, the number of non-Malays in both or-ganizations declined absolutely.∑∫ Similarly, in the government-controlled universities, as already noted, the number of Chi-nese students declined absolutely between 1970 and 1980,∑Ω
even as the total number of students there was increasing.∏≠
π≤ affirmative action in malaysia
SINGAPORE
Although Singapore is an independent city-state, its experi-ence is relevant to that of Malaysia, not only because it wasonce part of Malaysia back in the early 1960s, but also becausethe same two principal racial ethnic groups—Malays and Chi-nese—comprise the great majority of its population. As of1995, 77 percent of the people in Singapore were Chinese, 14percent Malay and 7 percent Indian.∏∞ Singapore is one of theprincipal ports in its part of the world, handling nearly one-fourth of Malaysia’s exports, in addition to its own exports.Singapore is also one of the most prosperous countries in Asia,with a per capita gross domestic product more than five timesthat of Malaysia.
Unlike Malaysia, Singapore does not have preferential pol-icies, and in fact tries to promote a generic Singaporean iden-tity for members of all groups. All children in Singapore aretaught English, which is the principal language of governmentand business there, though most Singaporeans do not speakEnglish in their homes,∏≤ but instead speak Chinese, Malay,or Tamil. Here, as in Malaysia, the Malays have been outper-formed by the Chinese in both the schools and the economy.Nor has this been demonstrably changed by the Singaporegovernment’s policy of scattering Malay families among Chi-nese families in housing developments. However, some Malaysexpress a preference for Chinese neighbors ‘‘because they con-sider that the Chinese will not intrude or interfere in theirpersonal or family lives.’’ Some Malay parents and children‘‘choose schools where there are more Chinese and few Malays,in the hope that the student will learn good study habits fromthe Chinese while also avoiding Malay company.’’∏≥ Chinese aswell as Malay parents recognize such differences. As one studyfound:
Some parents note with pride that their children have mostlyChinese friends, because they mix with fellow Chinese students at
affirmative action in malaysia π≥
school and avoid Malay company in the neighborhood. In theprocess of attempting to gain social mobility through education,it is not only non-studious children who must be avoided butMalay children in general, since non-studiousness is a trait takenby Malays (as well as non-Malays) to characterize Malays as anethnic group.∏∂
While it is fashionable in some quarters to dismiss suchviews of groups as ‘‘stereotypes,’’ the people who hold theseviews are in daily contact with the groups in question, whilethose who dismiss their beliefs are often far removed from thescene. Moreover, the same view is shared by both ethnic groupsin this case.
Although Singapore and Malaysia follow entirely differentpolicies as regards ethnic groups, both have for many yearsavoided intergroup outbreaks of violence of the sort plaguingIndia and other countries. The common factor behind relativepeace between the Chinese and the Malays in the two placescannot be affirmative action because Singapore does not haveaffirmative action. What both governments do have are verysevere repressions of free speech, preventing individuals fromfollowing careers as racial agitators or fomenters of intergroupstrife. Both countries have also had long periods of economicprosperity.
A minor flap erupted in 2001 when Singapore’s prime min-ister pointed out that Malays in Singapore are economicallybetter off than Malays in Malaysia. More Singaporean Malayshave an upper secondary or higher education than do Malaysin Malaysia. Accordingly, a higher percentage of the Malays inSingapore have administrative or professional jobs.∏∑ Clearly,Malays have done better as a minority without affirmative ac-tion in Singapore than as a majority with preferences andquotas in Malaysia.
π∂ affirmative action in malaysia
SUMMARY AND IMPLICATIONS
Affirmative action in Malaysia has produced results similar tothose in India and other countries with preferential policies, insome respects, but very different results in other respects. Justas the actual beneficiaries of preferences and quotas for un-touchables in India have been estimated to be no more than 6percent of the designated beneficiary group, so in Malaysia nomore than 5 percent of the Malays have been estimated to haveactually benefitted from such programs. In both countries,those people who were initially more fortunate were the mostbenefitted. In both countries—and in others—the supposedlytemporary preferences have been extended past the point pro-jected for their termination. Similarly, the ‘‘indifference’’ notedamong untouchable students admitted preferentially to highereducation in India has been also been observed in Malaysia:‘‘Malay students, who sense that their future is assured, feel lesspressure to perform.’’∏∏ Even Malaysia’s own long-time PrimeMinister, Mahatir bin Mohamad, one of the advocates and ar-chitects of the country’s affirmative action policies, said in Au-gust 2002:
Getting scholarships and places in the universities at home andabroad is considered a matter of right and is not valued any more.Indeed, those who get these educational opportunities, for someunknown reason, seem to dislike the very people who createdthese opportunities.
Worse still, they don’t seem to appreciate the opportunitiesthat they get. They become more interested in other things, poli-tics in particular, to the detriment of their studies.
In business, the vast majority regarded the opportunitiesgiven them as something to be exploited for the quickest return.
Very early on, they sold off their opportunities in order tobecome sleeping partners in an arrangement known cynically as‘Ali Baba,’ in which Ali merely obtains the licenses, permits,
affirmative action in malaysia π∑
shares or contracts, and immediately sells these to non-Malays,mainly Chinese.
They learn nothing about business and become even lesscapable of doing business and earning an income from theiractivities.∏π
Dr. Mahathir declared: ‘‘I feel disappointed because Iachieved too little of my principal task of making my race asuccessful race, a race that is respected.’’∏∫
In other respects, Malaysia has had one of the most success-ful programs of affirmative action in the world, where success isdefined solely in terms of the relative advancement of the des-ignated beneficiary group and avoidance of the kind of wide-spread violence found in India and elsewhere. But Malaysia haspaid the price in other ways.
Draconian sedition laws stifle public criticisms of the prefer-ential policies and of racial policies in general. Educationalstandards declined in the country’s universities after studentadmissions and faculty hiring were no longer based on individ-ual performances, but on group membership. Shortages ofhighly trained people in highly technical fields have devel-oped, as members of those groups who previously excelled inthese fields have been systematically kept out of the universi-ties and have often left the country for their education andnot returned. However, like some other countries promotinggroup preferences and quotas, Malaysia did so in the name of‘‘national unity,’’∏Ω however little unity it actually produced orhowever such disaffection it created.
While the degree of success of affirmative action in Malay-sia compares favorably with that of similar programs in othercountries today, it is not historically unique. Similar success, interms of benefitting one group at all costs, was achieved byapartheid in South Africa and by the racial laws in Germanyunder the Nazis. What has yet to be achieved is similar ‘‘suc-cess’’ in democratic nations with freedom of speech. Moreover,
π∏ affirmative action in malaysia
even in Malaysia, the benefits of preferential policies have gonedisproportionately to those who were already more fortunate.Nor is it clear, after more than 30 years of such policies, thateven the fortunate Malay beneficiaries have reached the pointwhere they are able to compete on equal terms with membersof the Chinese or Indian minorities.
Prime Minister Mahathir, who had declared in 1966 thatMalays must become prepared to compete with other groupson equal terms,π≠ declared in August 2000: ‘‘There are somewho think that they can progress on their own. They are mis-taken. Without the government’s help, those who think theyare strong will fall flat.’’ Moreover, he was keenly aware of theexplosive dangers of allowing racial agitators to stir up thecountry’s various groups against one another, creating a ‘‘con-flagration’’ that would ‘‘engulf us all.’’π∞ The history of manymulti-ethnic societies around the world makes this no idle para-noia—especially where one group’s achievements have greatlyoutstripped another’s, as in Fiji, Sri Lanka, India, Rwanda andmuch of pre–World War II Central and Eastern Europe, whereenvy and resentment of Jews was stirred up to a fever pitch thatculminated in widespread cooperation with the Holocaust, runby the Nazis but with a chilling amount of cooperation fromothers in Eastern Europe.
If there is any lesson from the history of affirmative ac-tion in Malaysia, it is that extraordinary economic prosperityand growth, combined with extraordinary repression of freespeech, can make preferential programs politically viable andrepress mass intergroup violence. But to say that the country asa whole is better off with affirmative action would be to ignoremany counterproductive consequences. The fact that the ad-joining city-state of Singapore, which has no affirmative actionprogram, has likewise had extraordinary prosperity and ex-traordinary repression of free speech—as well as being ruled byone political party, in power since its independence, decadesago—suggests some of the other factors responsible for racial
affirmative action in malaysia ππ
peace between the Malays and the Chinese. Neither country’sexperience can serve as a guide to racial peace in countrieswhere free speech and other democratic rights prevail.
Malaysia’s experience is very relevant, however, to a wide-spread belief in some countries that ethnic imbalances can onlybe a result of discrimination against the under-representedgroup—and that any suggestion that this is due to a failure ofthe group itself to achieve the same qualifications as others is‘‘blaming the victim,’’ if not racism. No one in Malaysia hasbeen in any position to discriminate against the Malays or tovictimize them otherwise. When admission to the University ofMalaysia was based on individual performance, this universitywas run by Malays and was responsible to a government that wasalso run by Malays. Yet Chinese students predominated in manyareas of the university and even the small Indian minority sup-plied more students than the Malay majority in some fields.There were simply not enough qualified Malays.
Even after the imposition of ‘‘some of the soil’’ preferencesfor their benefit, there were still not enough qualified Malays inscientific, medical, and technical fields to satisfy the Malaysiangovernment, dominated by Malays, leading to a reversal in lan-guage policy in 1993. A reversion to an admissions policy basedon individual achievement in 2001 further strengthens theconclusion that even a government dominated by Malays foundthe qualifications of Malay students inadequate. The fact thatsome groups are less qualified than others cannot be arbitrarilydismissed as a mere ‘‘stereotype’’ or ‘‘perception’’ by outsiders.Nor are performance differences limited to academic perfor-mances. According to The Straits Times, published in Singapore,in January 2002 Malaysia’s Prime Minister Mahathir ‘‘lamentedthe fact that bumiputeras are not serious in completing govern-ment projects because they tend to sell them to second, third,and fourth parties. According to the prime minister, nearly 85percent of the projects have not been completed.’’π≤
chapter 4
A≈rmative Action in Sri Lanka
The island nation of Sri Lanka, located about 20 miles offthe southeast coast of India, stretches 270 miles fromnorth to south and 140 miles from east to west. It has a
population of 19 million. Roughly three-quarters of its peopleare Sinhalese and the principal minority, the Tamils, are lessthan one-sixth of the population. Since the middle of the twen-tieth century, Sri Lanka has undergone one of the most re-markable—and catastrophic—changes in the relationship be-tween its majority and minority populations.
Formerly the British colony of Ceylon, Sri Lanka achievedindependence in 1948 with a promising future being antici-pated by its own people and by outside observers alike. Therewas a basis for such optimism. Although the Sinhalese and theTamils differed in ethnicity, language and religion—and sel-dom intermarried—there was much evidence of goodwillacross the social lines that divided them. The elites of bothgroups were Westernized, English-speaking, and cosmopoli-tan, and were used to working together in the British civil ser-vice and in private British businesses. Both elites tended to livein Westernized enclaves together, and apart from the moretraditional masses of their respective groups. Moreover, thecountry’s political leaders were committed to a secular, demo-
affirmative action in sri lanka πΩ
cratic state, recognizing the rights of all its citizens, regardlessof their ethnicity or religion. This live-and-let-live pattern wasnot confined to the elites or to politics. Whatever the historicclashes of Sinhalese and Tamils in centuries past, there hadnever been a race riot between them during the first half of thetwentieth century.∞
Other groups in the population of the country includedMoslems and Christians. Relations among the various ethnicand religious groups in Sri Lanka were described by an Ameri-can scholar as ‘‘cordial, unmarred by the sort of friction thatexists between Hindus and Moslems in India.’’ It was not un-usual for Buddhists to appear at Hindu festivals or Christmascelebrations, for example. As a Sri Lankan scholar describedthe situation:
In striking contrast to other parts of South Asia (includingBurma), Sri Lanka in 1948 was an oasis of stability, peace andorder. The transfer of power was smooth and peaceful, a reflec-tion of the moderate tone of the dominant strand in the country’snationalist movement. More important, one saw very little of thedivisions and bitterness which were tearing at the recent inde-pendence of the South Asian countries. In general, the situationseemed to provide an impressive basis for a solid start in nation-building and national regeneration.≤
Yet this all changed radically within a decade after indepen-dence, as a result of politicizing intergroup differences andinstituting preferential policies. The basis for such policies wasthe familiar fact that different groups were not proportionallyrepresented in the universities or the professions or in busi-nesses. More specifically, the Tamil minority was more favor-ably situated in all these respects than the Sinhalese majority.As with other such differences in other countries, the reasonsgo back into history.
∫≠ affirmative action in sri lanka
HISTORICAL BACKGROUND
A succession of European conquerors arrived in Ceylon overthe centuries—first the Portuguese (1597–1658), then theDutch (1658–1796), and finally the British (1796–1948). Thefirst two invaders conquered the coastal regions of the island,but the British eventually conquered all of it, though not all atone time. One lasting consequence of this history was that dif-ferent regions of the country experienced Westernization ofdifferent kinds for differing periods of time and therefore dif-fered among themselves culturally. Such differences existedwithin the Sinhalese and Tamil populations, as well as betweenthem.
The Tamils were concentrated in the geographically lesspromising and less prosperous northern part of the island, witha dry climate and a lack of natural resources, while the Sinhaleselived where there was more fertile soil and more ample rainfall.When the various conquerors established Christian missionaryschools, the Tamils more readily seized upon education as a wayout of their geographically disadvantaged circumstances. Dur-ing the era of British rule, Americans also established a mis-sionary school that eventually became Jaffna College, located inthe northern region, where Tamils were concentrated. Ameri-can educators put more emphasis on mathematics and sciencethan did the British schools, where a more literary educationwas offered. This meant that the Tamils were particularly welltrained in subjects that would permit them to enter the sci-ences, engineering, and the medical field in the years ahead.
Historic head starts had enduring consequences in Ceylon,as in other parts of the world. Nor were Tamils the only groupto benefit from Western education. The much earlier Dutchcolonial rule had left as part of its legacy a racially mixed Cey-lonese group known as ‘‘Burghers’’ (many being part-Dutch),whose earlier assimilation to Western culture enabled them to
affirmative action in sri lanka ∫∞
prosper in later colonial regimes, including that of the British,where they served in the colonial civil service. As of 1870,these Eurasian Burghers constituted the great majority of phy-sicians and surgeons employed by the colonial government,even though Burghers were less than one percent of Ceylon’spopulation.≥ Although descended from the Dutch and the Cey-lonese, most Burghers spoke English after the imposition ofBritish rule, since English facilitated employment by the Britishauthorities. As late as 1911, less than ten percent of the Sin-halese or Tamils spoke English, compared to more than three-quarters of the Burghers.
Geography has complicated the cultural differences withinboth the Sinhalese and the Tamil groups. As has often hap-pened in other parts of the world, the highlands resisted theinvaders longer than the lowlands. It was not until 1815 thatthe British conquered the Kandyan highlands in the south ofCeylon. What this meant culturally was that the lowland Sin-halese began to be Westernized before the Kandyan Sinhalese.After the British conquest of the Kandyan highlands, they be-gan to import Tamils from India to work on British-owned plan-tations there. This meant that there were now two culturallydifferent groups of Tamils in Ceylon as well, often referred to asthe ‘‘Ceylon Tamils’’ and the ‘‘Indian Tamils.’’ Separated geo-graphically as well as culturally, these two Tamil groups hadlittle interaction with or impact on one another. The ‘‘IndianTamils’’—still called that a hundred years after their settlementin Ceylon—were the poorest, most isolated and uneducatedportion of the country’s population and were generally oflower caste than the Ceylon Tamils.
Against this historical background, it is hardly surprisingthat there remained in the twentieth century great differencesin the relative representation of the various groups and sub-groups at the university level or in business and the professions.With the passing years and the spread of education among the
∫≤ affirmative action in sri lanka
Ceylon Tamils and the Sinhalese, the tiny minority of Bur-ghers was overtaken in government employment by these muchlarger groups. Moreover, among all these various groups, thetiming and degree of their Westernization, education, and abil-ity to speak English in colonial times was reflected in theireducational and employment patterns for generations, extend-ing well into the post-colonial era of Sri Lanka.
As of 1921, half the lawyers in Ceylon were Sinhalese, thelowlanders being 46 percent and the highlanders 4 percent,even though the highlanders were about half as numerous asthe lowland Sinhalese. Ceylon Tamils, who were only about halfas numerous as the highland Sinhalese, nevertheless provided28 percent of the lawyers, despite being only 12 percent of thetotal population at that time.∂ But there were no Indian Tamillawyers at all, even though Indian Tamils at that point outnum-bered Ceylon Tamils.∑
It was much the same story in the medical profession. TheCeylon Tamil minority actually produced more doctors thanany other group—44 percent of all doctors or other medicalpractitioners, compared to 34 percent who were Sinhalese(only a tenth of whom were highland Sinhalese). Burghersprovided another 12 percent—and, again, none at all wereIndian Tamils.∏ Similar patterns continued over the years. InCeylon University College in 1942, 30 percent of all the stu-dents were Ceylon Tamils, nearly three times their representa-tion in the population.π
Although the top echelons of the colonial civil service weredominated by Englishmen, and the Sinhalese were a majorityof the native Ceylonese civil servants, the Ceylon Tamils werestill much over-represented relative to their percentage of thepopulation.∫ Over the years, the Sinhalese began catching upwith the Tamils in English education and by 1946 there were205 Sinhalese doctors, compared to 115 Tamils.Ω However, theCeylon Tamils continued to be over-represented relative to
affirmative action in sri lanka ∫≥
their share of the population. That same year, two years beforeindependence, Ceylon Tamils occupied 30 percent of the posi-tions in the Ceylon government and 40 percent of the judicialposts.∞≠ In keeping with their educational backgrounds, CeylonTamils were especially successful in scientific and technicalfields.∞∞ As of 1948, the year of national independence, 40percent of the engineers in the government’s irrigation depart-ment were Tamils.∞≤
Although the vast majority of Indian Tamils remained plan-tation laborers, on into the second half of the twentieth cen-tury, there were other immigrants from India who came toCeylon in other capacities. While many of these other Indiansworked in lowly occupations such as laborers, servants, andrickshaw pullers, some of these later Indian immigrants be-came traders, businessmen, and money-lenders. These latterwere typically from groups with an entrepreneurial history inIndia, such as the Gujaratis and the Chettiars. In business aselsewhere, the Sinhalese were eclipsed by minorities, as well asby Europeans. At one point, 40 percent of all the credit ex-tended by pawn-brokers in Ceylon was extended by Chettiars.Nearly 90 percent of all the imported rice was imported byIndians—and the rest by Europeans. As of 1945, there were anestimated 750 Chettiar firms in Ceylon, with an aggregate capi-tal of £7.5 million.∞≥ The retailing, wholesaling, and textiletrades were also largely in the hands of Indians.∞∂
None of this went unnoticed, least of all by politicians look-ing for issues with which to mobilize voters. Even during Britishcolonial rule, laws passed in 1938 began restrictions againstIndian businessmen and these restriction were tightened inlater years.∞∑ Despite such restrictions, however, a Sinhalesepolitician could still complain in 1955, ‘‘in the towns and vil-lages, in business and in boutiques most of the work is in thehands of the Tamil-speaking people.’’∞∏ The stage was set foraffirmative action.
∫∂ affirmative action in sri lanka
AFFIRMATIVE ACTION AND ITS AFTERMATH
When Ceylon achieved its independence in 1948 and laterchanged its name to Sri Lanka, its positions of power, wealthand prestige were largely in the hands of an educated, English-speaking, often Christian, elite, both Sinhalese and Tamil. Yetthe great majority of the country’s population was Buddhistand Sinhala-speaking, while most members of its principal mi-nority were Hindu and spoke Tamil. However historically un-derstandable this situation might be, its political viability wasanother story. In Sri Lanka, as in some other countries, therewas a growing number of newly educated people seeking em-ployment in positions dominated by other groups—especiallyas government employees—and this newly educated groupcreated political pressures for group preferences and quotas.∞π
At first, the rising numbers of educated but non-English-speaking Sinhalese spearheaded a reaction against Westernculture, language and religion.∞∫ Buddhists resented the largerole of government-subsidized Christian missionary schools inthe education of Sri Lankans. There was also an understand-able demand that the affairs of the government no longer beconducted in English but in the people’s ‘‘own language.’’ Likeso many political catchwords, the demand for their ‘‘own lan-guage’’ instead of English concealed more than it revealed.There was no ‘‘own language’’ of the Ceylonese people as awhole, but two different languages representing the two largestpopulation groups. While this demand was made as far back asthe early 1940s, before independence, when it meant a transi-tion to the two languages of the principal groups in the coun-try, the transition from English was still not yet implemented asthe 1950s began, largely due to the caution of Prime MinisterD. S. Senanayake, who sensed the explosive potential of issueslike language and religion in a newly independent and eth-nically divided country.
Amid rising agitation over the language issue, an ambitious
affirmative action in sri lanka ∫∑
member of the government, Solomon Bandaranaike, went intoopposition in 1951, establishing his own party dedicated to aquick implementation of the ‘‘own language’’ policy. At thispoint, that still meant the two languages of the two principalgroups in the country but, in response to growing demandsfrom the Sinhalese majority, there was a swift transition in just afew years to demands for ‘‘Sinhala only’’ as the language of SriLanka. As in other countries, such as India, behind the lan-guage issue was the issue of access to jobs, especially jobs in thegovernment. For this purpose, a change from English to both
indigenous languages as the official language of governmentand free competition for civil service jobs could have meant adisplacement of an English-speaking elite by a largely, or dis-proportionately, Tamil elite.
The key figure in the transformation of a general resent-ment against the old elite and what they stood for into a specificprogram of preferential treatment of the Sinhala language—which entailed preferential access of the Sinhalese populationto jobs and education—was Bandaranaike. Like so many mili-tant group leaders in other countries, Bandaranaike himselfwas not at all representative of those in whose name he spokestridently. He was an Oxford-educated, Christian, Sinhalesearistocrat (his godfather was the British colonial governor),who grew up speaking English and unable to speak Sinhala.But, like some other Sinhalese politicians of his time, Ban-daranike became Buddhist, Sinhala-speaking and an extremiston language, religion, and Sinhalese culture.∞Ω His own goalswere neither religious nor ideological. He wanted to becomeprime minister—and he succeeded.
In 1956, Bandaranaike was elected in a landslide victorythat swept away the old elite so thoroughly that only he and onecabinet member in the new government had ever held highoffice before. Bandaranaike’s new government produced legis-lation requiring ‘‘Sinhala only’’ as the official language of SriLanka—the language not only of government itself, but also
∫∏ affirmative action in sri lanka
the language in which businesses and other institutions had tocommunicate with government. As in India and Malaysia, lan-guage policy in Sri Lanka became a focus of intergroup strife,because of its potentiality for having profound effects on edu-cational and economic opportunities. However, once havingachieved the prime minister’s office by whipping up inter-group resentments, Bandaranaike then attempted to moder-ate the anti-Tamil policies, but this only set off howls of protestfrom other Sinhalese demagogues with political ambitions oftheir own, including a future president, J. R. Jayawardene.≤≠
The Tamils’ disproportionate representation in institutionsof higher learning continued for some time, despite pref-erential treatment in favor of Sinhalese students. This over-representation of Tamil students was especially striking in engi-neering and medical science, where students from the Tamilminority were 48 and 49 percent, respectively, of all the stu-dents. The Sinhalese students were heavily concentrated in theliberal arts, while the Tamils were concentrated in the sci-ences.≤∞ However, a series of policies providing preferences andquotas for the Sinhalese progressively reduced the Tamils’prospects in education and employment.
Christian missionary schools also were a special target.In 1960, the government took over more than 2,000 privateschools ‘‘to ensure equality of educational opportunity to allchildren regardless of race, religion, economic condition orsocial status’’ and to provide a kind of education ‘‘which is na-tional in its scope, aims and objects and in conformity with thecultural, religious and economic aspirations of the people.’’≤≤
At the university level, Sinhalese applicants could gain ad-mission by meeting lower standards than those required forTamils to gain admission.≤≥ In the civil service, in 1963 thegovernment began sending Sinhalese employees to staff theiroffices in the northern region, where the Tamils were concen-trated. A year later, the government began the compulsoryretirement of Tamil civil servants who could not speak Sin-
affirmative action in sri lanka ∫π
hala.≤∂ Sri Lanka’s constitution was modified to eliminate asection that guaranteed minority rights.≤∑
Declining prospects for education and employment nowfacing many Tamils—especially the young, looking forward touniversity education and professional careers—led to protests.Although these were peaceful protests in the tradition estab-lished by Gandhi in India, in the frenzied atmosphere whippedup by Sinhalese politicians and Buddhist monks, these protestsled to Sinhalese mob attacks on Tamils. Despite the absence ofrace riots between these two groups in the first half of thetwentieth century, a number of such riots erupted from 1956 to1958,≤∏ but these were only the first in what would become along series of bloody and lethal riots in the years ahead. Trainsand cars were stopped by angry mobs, their passengers as-saulted and some burned alive. Such horrifying scenes wouldbe repeated many times in outbreaks of riots over the years.
The Tamils’ political responses at first included relativelymoderate demands for the use of their own language in offi-cial communications and then for some autonomy in the re-gions where they were concentrated. Such demands were inresponse to the central government’s unabashed favoritism to-ward the Sinhalese and to such weakening of the Tamils politi-cally as the disfranchisement of the Indian Tamils and the pres-suring of them to ‘‘return’’ to an India that many of them hadnever seen.
Bandaranaike created an accord with the Tamils, compro-mising on some issues, but political outcries from the Sinhaleseprevented this accord from being carried out. In 1959, a Sin-ahalese Buddhist extremist assassinated Bandaranaike for hav-ing betrayed the cause. As in other countries, the illusionof being able to control the course of events was shattered.Sinhalese political parties across the ideological spectrum alljumped on the bandwagon of group rights and tried to outbidone another for the Sinhalese vote. The disfranchisement ofthe Indian Tamils meant that the Tamil vote was now so small

∫∫ affirmative action in sri lanka
that it could be disregarded, leaving the only question how bestto compete for the votes of the Sinhalese majority.
Despite preferential admissions policies at the universitylevel, and despite attempts to reduce the Tamils’ educationaledge in the schools, Tamil students continued to be over-represented in the science-based fields. The next attempt tochange this was called ‘‘standardization.’’ Instead of basing ad-missions decisions on the actual scores made by individual stu-dents, each student was given a ‘‘standardized’’ score based onhis score relative to other students from his own ethnic group. Suchpreferences were later supplemented by quotas. In 1972, a‘‘district quota system’’ was introduced, to allocate universityadmissions on the basis of the population in each district. SinceSinhalese and Tamils were concentrated in different districts,district quotas were, in effect, ethnic quotas. Under this system,the proportion of Tamil university students in the sciences fellfrom 35 percent in 1970 to 19 percent by 1974.
Because the Tamil plantation laborers in the Kandyan re-gion were counted as part of the population, but were unlikelyto use any of the university places set aside in the districtquotas, this made it especially easy for Sinhalese students fromthat region to get into universities. Many of these students pref-erentially admitted were ‘‘from the affluent classes,’’ accordingto a study of these policies and their effects.≤π Protests againstquotas and preference by academics were futile, as universityadmissions policies were determined by political authorities atthe Cabinet level.≤∫
A drying up of educational opportunities was especially se-rious for Tamils, because of their concentration in a part of SriLanka with poor geographic conditions for making economicprogress without relying heavily on education. As attempts tosalvage opportunities at the national level proved unavailing,Tamils began to seek more autonomy in their own regions ofthe country, notably on the northern Jaffna peninsula. Afterappeals, protests, and civil disobedience campaigns all failed
affirmative action in sri lanka ∫Ω
to produce the autonomy that Tamils were seeking, armedguerilla warfare began—and the Tamils’ demands now esca-lated to include a separate, independent nation of their own.Moderate leadership among the Tamils gave way to more mili-tant and extreme leadership, eventually led by a guerilla groupcalled the Tamil Tigers, formed in 1975. Sri Lanka was now onthe road to civil war.
It was a war filled with atrocities on both sides. Moreover, asubstantial number of Tamils living in regions of the countrywhere the majority population was Sinhalese found themselvessingled out as targets for mob violence. A hundred and fiftypeople were killed and 20,000 made homeless in riots in 1977.≤Ω
This was only a prelude to new riots in 1981 and worse riots in1983—the riots in both these years bearing the marks of delib-erately organized activity by Sinhalese gangs, with indifferenceor complicity on the part of the police and the military.≥≠ Norwere such explosions of violence due solely to hooligans. Afterthe 1981 riots, President Junius Jayawardene said: ‘‘I regret thatsome members of my party have spoken in Parliament andoutside words that encourage violence and the murders, rapesand arson that have been committed.’’≥∞
In July 1983, there were ‘‘five days of pillage and slaughteraimed at Tamils living throughout the south and their busi-nesses and property.’’ It was a large-scale outbreak, beginningin the country’s capital city of Colombo:
As many as 3,000 Tamils are said to have been killed, nearly 60percent of the Tamils in Colombo were turned into refugees, andmost of the Colombo Tamil business community, which had ac-counted for over half the city’s commercial infrastructure, wasruined. Many Sinhalese burned down their own workplaces, tar-geting, in particular, Tamil-owned garment factories. Much of thewholesale food district of Colombo was destroyed. The statelyVictorian railroad station in the center of the city had to be con-verted into a morgue to accommodate the corpses.≥≤
Ω≠ affirmative action in sri lanka
Not only the numbers, but also the nature of the atrocities,suggested the levels of hatred that had developed in a oncepeaceful and harmonious country. For example, a bus was ac-costed by a mob and the bus driver ordered to turn over aTamil. He pointed to a woman passenger who was then takenout into the street, where her belly was ripped open with abroken bottle and she was set on fire. People in the mob‘‘clapped and danced’’ as she died in agony.≥≥
Meanwhile, in the Tamil areas, similar savagery was in-flicted on Sinhalese who lived there. Moreover, the Sinhalesearmy units sent into the Tamil areas were equally cavalier aboutthe lives of the civilians they encountered. After being am-bushed by guerrillas, the army sometimes lashed out with indis-criminate attacks on Tamil civilians. The New York Times ofAugust 7, 1983, reported:
Sri Lankan Army troops pulled 20 civilians off a bus and executedthem two weeks ago in retaliation for a Tamil guerrilla attack thatkilled 13 soldiers a government spokesman confirmed today.≥∂
Nor was this an isolated episode. A year later The Economist ofLondon reported, ‘‘random acts of revenge by soldiers or riotpolicemen continue.’’≥∑
Tamils began to flee, not only from the areas with a Sin-halese majority, but also from Sri Lanka as a whole. By 1985,nearby India had received 40,000 Tamil refugees.≥∏ Other Ta-mils emigrated to European or European offshoot societies,including Australia, Britain, and the Scandinavian countries.≥π
Meanwhile, the Tamil Tigers took over de facto control of thenorthern areas between 1977 and 1987, fighting the Sinhalesearmy and slaughtering other Tamils who opposed them, killingin the process more Tamils than the Sinhalese army killed.≥∫
As violent incidents escalated into full-scale civil war in SriLanka, nearby India was drawn into the conflict. The Indianstate of Tamil Nadu, across the water from Sri Lanka, became abase for the training of Sri Lankan guerrillas, who returned to
affirmative action in sri lanka Ω∞
their native land to fight for independence. In August 1987,the Indian army intervened directly by landing 50,000 troopsas peace-keepers in the northern Tamil regions of Sri Lanka—a move which outraged the Sinhalese population and was ini-tially welcomed by the Tamils. The Indian troops’ mission wasto take over the maintenance of order from the Sri Lankanarmy and police forces and to disarm the Tamil guerrillas. Butthe Tamil guerrillas resisted being disarmed and the processcost the Indian army more than 400 lives in the first year. Nowengaged in hostilities, the Indian army’s own brutalities andatrocities alienated many Tamils, while their very presence—ostensibly at the invitation of President Jayawardene, who actu-ally had no choice, given the relative sizes of the two coun-tries—spurred the formation of Sinhalese terrorists, as op-posed to any peace effort as their Tamil counterparts in thenorth.
Sinhalese terrorists killed more than 200 supporters ofthe international accord that had ratified the intervention ofIndian troops, and narrowly missed an assassination attempton President Jayawardene himself.≥Ω An assassination attemptwhich did not miss was one in which a Tamil suicide bomberfrom Sri Lanka killed herself and Indian Prime Minister RajivGandhi in India in 1991.
Sri Lanka had now reached a stage where the initial issuesthat ignited the conflict were buried under a large overlay ofmutual hatreds, distrust, vengeance and counter-vengeance.Perhaps most ominous of all was the formation of murderousextremist organizations among both the Sinhalese and the Ta-mils—organizations with a vested interest in the continuationof conflict and prepared to kill those who sought reconcilia-tion. A provision in a new constitution in 1978 recognized lan-guage rights of the Tamils, but this could not restore the statusquo ante. It was, in a World War II phrase, ‘‘too little and toolate.’’ The civil war continued on for decades more.
With all the lives that it has claimed, what did affirmative
Ω≤ affirmative action in sri lanka
action accomplish in Sri Lanka? By 1973, the Sinhalese hadovertaken the Sri Lankan Tamils in education and incomes,∂≠
and of course they were already better off than the IndianTamils in both respects, even before group preferences andquotas were instituted. Contrary to widespread assumptions,it was not when economic disparities were greater that inter-group strife was greater. On the contrary, the Sinhalese andTamils co-existed peacefully in the 1920s, when the Tamil mi-nority produced more doctors than the Sinhalese majority. Itwas a decade after the Sinhalese had overtaken the Tamils innumbers of doctors in 1946 that the first mob violence againstthe Tamils erupted, and it was a decade after the Sinhalese hadovertaken the Tamils in income and education—with the helpof preferences and quotas—that the majority unleashed its big-gest and most savage riots against the minority. In short, it wasnot the disparities which led to intergroup violence but thepoliticizing of those disparities and the promotion of groupidentity politics.
SUMMARY AND IMPLICATIONS
The history of Sri Lanka in the second half of the twentiethcentury represents the most blatant, painful, and tragic mock-ery of the underlying assumption of being able to control thecourse of events—an assumption implicit in affirmative actionpolicies in countries around the world. The actual course thatevents took in Sri Lanka was foreseen by no one and made allgroups worse off, on net balance, as the country as a wholesuffered repeated race riots, civil war, atrocities, widespreadterror and the assassinations of the country’s national leaders,not to mention the assassination of the prime minister of Indiaby a Tamil extremist, as a result of the Indian army’s interven-tion. Such a record of carnage and atrocities would be shock-ing in any country, but was especially shocking in a country
affirmative action in sri lanka Ω≥
with a record of intergroup toleration that was once among thebest in the world.
If nothing else, Sri Lanka demonstrated that complacencyis never in order when racial or ethnic relationships are con-cerned, for even generations of peaceful co-existence canquickly turn ugly when the right circumstances and the rightdemagogue come together. Nor are such developments asreadily stopped as they are started. Even concessions thatwould have brought peace in the past can fail to bring peaceafter many bitter experiences have hardened both sides andproduced extremists with a vested interest in the continuationof the struggle itself, which enhances their power, rather thanconcern for any social results likely to be produced by thestruggle. In September 2000, The New York Times reported thisscene of casual deaths in Jaffna:
A young woman riding a bicycle near her home was struck byshrapnel that severed her femoral artery. A cow, lazily chewing itscud, was taken out by a stray shell. A 5-year old boy, whose grand-mother had sent him to the store to buy fruit juice, was struck inthe spine by shrapnel from a shell that had crashed into a drum-stick tree. Two people died when incoming fire hit a home forelderly residents.∂∞
The same account also reported this:
A plaintive, unsigned poster, pasted to walls all over town,asks, ‘‘Can’t we stop this madness?’’
Stopping such madness was not nearly so easy as starting it,as was done nearly half a century earlier, by a man who was noteven a racial fanatic but simply someone who wanted to be-come prime minister and decided that stirring up intergroupconflict was the easiest way to achieve that political goal. Thenet result has been a decades-long civil war in which a smallisland nation has suffered more deaths than the United States
Ω∂ affirmative action in sri lanka
suffered during the long years of the Vietnam war. The 2001election in Sri Lanka brought to power a party pledged to try-ing to negotiate a peace with the Tamil political leaders.∂≤ Inthe worldwide revulsion against terrorism after the Septem-ber 11, 2001, attacks against the United States, many foreigngovernments pledged to stop Tamil Tiger fund-raising in theirrespective countries, which had been financing a civil war inwhich roughly 64,000 Sri Lankans died.∂≥
Early in 2002, the Tamil Tigers announced a cease fire andthe end of suicide bombing. Their leader emerged from thejungle, for the first time in more than a decade, to pledge towork for peace. By the end of the year, an accord between thegovernment and the Tamil Tigers set in motion a process forthe final settlement of their differences. It was the first hopefulsign in nearly half a century. Near the end of the year, the New
York Times reported:
The unexpected concessions during the second round of talksraised hopes of a permanent solution to the 19-year war that haskilled 64,500 people. But a final settlement could be years away,as both sides and the Norwegian mediators brokering the talksconceded.∂∂
chapter 5
A≈rmative Action in Nigeria
Like many a country which emerged from colonial rule,Nigeria was never a country before colonial rule. Its veryname was given to it by its British rulers. More important,
it was an amalgamation of many very diverse West African com-munities—a fact that was to have fateful implications for itsfuture as a multi-ethnic state. The regions brought togetherunder British hegemony were not only different ethnically, theywere different economically, culturally, and geographically.
Islamic conquests from the north were in progress whenBritish conquest intervened. The Moslem Fulani tribe had con-quered the Hausa tribe in the north, but not the Yoruba or Ibotribes in the South, when British rule was extended over themall. Although these were and are the largest ethnic groups in Ni-geria, there are numerous other tribes, some exclusive to agiven territory and others scattered among larger tribal groups.While these various groups are called ‘‘tribes’’ in Nigeria, theyare by no means all small bands of people. Some tribes num-ber in the millions and are scattered over areas larger thansome nations in Europe. Nigeria has the largest population ofany nation in Africa and one out of every eight Africans is aNigerian.
Internally, Nigeria is fragmented by language, religion, and
Ω∏ affirmative action in nigeria
ethnicity. There is no majority group in any of these respects.The largest of the ethnic groups are the Hausa-Fulani tribesof the northern region, constituting about 28 percent of thecountry’s population. The next largest group—about 18 per-cent of the population—are the Ibos, with the Yorubas fromthe southwestern region being very similar in size at 17 per-cent.∞ Altogether, there are hundreds of smaller tribes.
More than demographic or even cultural differences areinvolved. These tribal divisions are accompanied by deeplyfelt alienation and hostility among many of these groups. A1970 study of Nigerian students studying abroad in Edinburghfound that, among the Yoruba, more than 40 percent of themales and more than 60 percent of the females excluded thepossibility of friendship with a Hausa. Marriage with a Hausawas excluded by more than 80 percent of the males and morethan 90 percent of the females. Among the Ibos, similar pro-portions would exclude marriage with Hausas—or with Yo-rubas.≤ Such alienation has social, political, and economicimplications. An econometric study in 1997 estimated thatNigeria’s economic growth rate would have been almost dou-ble its actual rate if its ethnic diversity were only average forAfrican nations, instead of being nearly double the average.≥
HISTORY
Geographically more fortunate than many other parts of sub-Saharan Africa, the region of West Africa now called Nigeriacontains the Niger River and its tributaries, facilitating the de-velopment of towns and villages, which have long been morecommon in this region than in most of tropical Africa. Abouthalf the population of Nigeria lived in these urban commu-nities before the beginning of the twentieth century. Nigeriahas also had larger and more complex indigenous politicalsystems than those in other parts of sub-Saharan Africa and has
affirmative action in nigeria Ωπ
been more advanced in other ways. For example, iron wassmelted in what is now Nigeria, five centuries before Christ.∂
Islam came to the northern regions of the country five cen-turies ago, while the southeastern region inhabited by the Ibosbecame predominantly Christian in the wake of British mission-ary activity and, later, British political hegemony. The south-western region, inhabited by the Yoruba, has become roughlyhalf Islamic and half Christian, while indigenous African reli-gions also continue to be practiced. In centuries past, thecoastal peoples of the region were more powerful and more ad-vanced than the peoples of the interior, as in much of the rest ofthe world. As elsewhere in sub-Saharan Africa, these coastalpeoples raided and enslaved their less fortunate brethren in theinterior—in this case, the Ibos. The Ibos have been described,by a scholar largely sympathetic to Africans, as having barelyadvanced beyond the state of savagery in the early twentiethcentury. This was said not in denigration of the Ibos, but ratherto accentuate their rapid rise later in that century.∑
The British became involved in West Africa in the nine-teenth century, seeking to advance and protect various Britishinterests, including British missionaries and traders, by estab-lishing a sphere of influence. Britain’s historic decision to banthe international slave trade in 1808 led not only to the banish-ment of slave trading from the British Empire, but also to thesuppression of the slave trade in other places, including itsprincipal sources in sub-Saharan Africa.
Whether or not the colonial officials realized it at the outset,this entailed a long-run political and military involvement inthe region, while the British navy patrolled the Atlantic off thewest coast of Africa to deter and intercept slave shipments to theWestern Hemisphere. Reluctant to incur the expense of estab-lishing and administering a colony, the British were neverthe-less drawn into local political and military conflicts among thevarious contending Africans. Eventually, the British sphere of
Ω∫ affirmative action in nigeria
influence evolved into British rule in the twentieth century—though ‘‘indirect rule’’ through local indigenous authorities.
What the British attempted was what might be called low-budget imperialism, with local societies, political structures,and cultures left as much as they had been as possible. Despitethis conservative agenda, however, the British presence was it-self a transforming and even revolutionary influence. Unwill-ing to bear the high costs of staffing their colonial administra-tion from top to bottom with people from Britain, the Britishhired local Nigerians as clerks and in other subordinate oc-cupations. This in turn meant creating a whole new class ofAfricans with English-language education, familiar with West-ern concepts and experienced in Western ways of doing things.This class tended to become critical of indigenous African in-stitutions and authorities—and eventually also critical of Brit-ish authorities and their colonial rule.
Group Differences
British rule also had major effects on the relationshipsamong the various peoples of Nigeria. Some of these peopleswere more receptive than others to the Western education nowbeing offered by missionaries, leading to great disparities in thenumbers of educated indigenous people in the different re-gions. The Moslem authorities in the north, for example, didnot want Christian missionaries establishing schools in theirregion. Since virtually all schools in Nigeria were missionaryschools during the colonial era, this left the north lagging farbehind the south in modern education and the skills and eco-nomic experience growing out of it. Moreover, after the Britishestablished their hegemony over the various African tribes, itwas now safe for people from one region of Nigeria to traveland even settle in what had once been enemy territory beforethe colonial era. This led to a large influx of southern Nige-rians into the north, not only to staff colonial institutions but
affirmative action in nigeria ΩΩ
also to establish themselves in business and in various modernoccupations in the private sector.
One of the groups particularly prone to seize upon theopportunities presented by Western education were the Ibos ofsoutheastern Nigeria, a group once lowly and backwards,∏ whonow rose up the occupational ladder, often above their erst-while superiors. These erstwhile superiors, particularly in thenorth, did not take this social reversal with good grace. AsNigeria approached its independence in 1960, intergroup jeal-ousies and friction delayed the creation of a constitution and agovernment—which in turn delayed independence itself. TheBritish were prepared to grant independence before the vari-ous ethnic groups within Nigeria were prepared to agree toaccept it, since they had first to iron out their disagreements ona constitution.
Although the upstart group whose rise was particularly re-sented were the Ibos, the Yorubas had the highest per capitaincome of any of these groups. The southeastern region wherethe Ibos originated had less fertile land and had long laggedbehind other regions in economic level and urbanization, afact which led many ambitious and Western-educated Ibos tomigrate elsewhere to pursue their careers. This in turn led totheir being widely interspersed among other peoples hostileto them. Northern authorities, for example, insisted that Iboslive in separate communities and send their children to segre-gated schools.π Around the middle of the twentieth century, asindependence approached, per capita income in the western(Yoruba) region was twice that in the northern (Hausa-Fulani)region, with the eastern (Ibo) region income being in between.
These economic differences reflected in part the fact thateducational differences among the tribes and regions remainedextreme throughout the colonial era. As of 1912, for example,there were fewer than a thousand students in elementary schoolin northern Nigeria, where more than half the population ofthe country lived, while there were 35,000 students attending

∞≠≠ affirmative action in nigeria
primary schools in the southern regions. While Western educa-tion grew over time in all regions of Nigeria, the huge disparitiescontinued.
By 1957, when there were approximately 185,000 childrenenrolled in elementary school education in the northern re-gions, there were 2.3 million in the other regions whose com-bined populations were not as large. Similar disparities existedand persisted in secondary and higher education. As of 1951,only one person out of the 16 million people in the northernregion had a university degree. Virtually all the Nigerian stu-dents in institutions of higher learning, whether overseas or athome, were from southern Nigeria. In academic year 1959–60,on the eve of independence, northern Nigerians were just 9percent of the students at the country’s University of Ibadan.Among the much larger number of Nigerian students receiv-ing a higher education abroad, only 2 percent were Hausa-Fulani as late as 1966, six years after independence.
Such disparities in higher education were reflected in oc-cupational disparities, especially in the higher professions. Ofthe 160 physicians in Nigeria in the early 1950s, 76 were Yoru-bas, 49 were Ibos, and only one was from the Hausa-Fulanigroup, the largest group in the population.∫ In the army, three-quarters of the riflemen were Hausa-Fulani, while four-fifths ofthe officers were southerners. As late as 1965, one-half of theofficer corps were specifically Ibos.Ω Even within the northernregion, southern Nigerians outnumbered northern Nigeriansin many coveted occupations. These included not only occupa-tions requiring medical or technical skills,∞≠ but also clericaland other semi-skilled jobs in the postal service, banks and therailroad, and southerners were also prominent as traders, ar-tisans, merchants and factory workers in northern Nigeria.∞∞
Among senior public officials in northern Nigeria, morethan four-fifths were expatriates—mostly Europeans but a fewfrom other African countries—and about one-third of theNigerians in such positions in the north were southerners. This
affirmative action in nigeria ∞≠∞
dependency on outsiders was very different from the situationin the eastern and southern regions of Nigeria. In each of theseother regions, Nigerians were roughly three-quarters of thesenior public officials.∞≤ Among the spoils of independencewere government jobs currently held by Europeans, and whilea policy of ‘‘Nigerianization’’ of such jobs was proclaimed, inthe northern region the policy was more specifically ‘‘north-ernization.’’ There the emphasis was on expelling southernNigerians from these jobs, even if that required replacing themfor the time being with European expatriates, because of a lackof qualified northern Nigerians.∞≥
National Independence
Demands for independence came first from the southernand eastern regions of Nigeria, while northern Nigerian offi-cials resisted until they could get some constitutional guar-antees that the country’s administrative apparatus would notbe dominated by officials from the other regions. NorthernNigeria, where a majority of the country’s population lived, wasthe politically dominant region of the country, but the centralgovernment apparatus required to carry out policy—the bu-reaucracy—would clearly not be, if hiring for government posi-tions were to be on the basis of individual qualifications alone.Those positions were important not only as a means of con-trolling the application of whatever policies the political lead-ers might choose, but also as a source of patronage assuring thecontinuation in power of incumbent northern politicians.
Both the northern resistance to early independence and itsinsistence on group representation in federal government po-sitions put them in conflict with the leaders and peoples of theother regions. All clearly understood the high stakes involvedin these conflicts and both sides reacted with hostility and bit-terness. As one northern leader later confessed, ‘‘We had toteach the people to hate the southerners; to look at them as
∞≠≤ affirmative action in nigeria
people depriving them of their rights,’’ so as to gain the politi-cal support of the northern population.∞∂ Another northernspokesman said:
The South with its many schools and colleges, is producing hun-dreds of academically and technically qualified people for thepublic services. The common cry now is Nigeranisation of thepublic services. It is most important that the federal service shallbe fully representative of all units which make up the federation.Now, what do we find in Nigeria today? There are 45,000 men andwomen in the Federal Public Services. I have not been able toobtain the figures of the number of northerners in the service butI very much doubt if they even amount to one percent . . . ∞∑
In short, the northern position was that group representa-tion was more important than individual skills. One advocate ofgroup representation rejected what he called ‘‘the tyranny ofskills.’’∞∏ This was not simply an issue to be settled in the politicalarena after independence. Northern fears of southern domina-tion of the administrative apparatus of government led to op-position to early independence without some prior guaranteesof northern representation in the bureaucracy. In turn, thisprovoked southern hostility to northern leaders. In 1953, aftera motion in the House of Representatives, located in Lagos inthe south, asking the British to grant independence in 1956,was opposed by northern members, those members were latersurrounded by groups of Ibos and Yoruba who called them‘‘thieves,’’ ‘‘slaves of the white man’’ and ‘‘stupid Hausas.’’∞π
Afterwards, when advocates of early independence tooktheir case to the people in the north, they were met with riots,fomented by northern political leaders, in which dozens ofpeople were killed and more than a hundred wounded.∞∫ In aneffort to defuse the situation, the British held a conference inLondon at which it was decided to allow more regional auton-omy. As a result of this, between January 1954 and August 1958
affirmative action in nigeria ∞≠≥
more than 2,000 southerners were fired by the Northern Pub-lic Service and urged to go south. Nor could they be imme-diately replaced by qualified northern Nigerians; hence thelarge number of expatriates employed. Before 1954, there wasnot a single northern Nigerian in the administrative cadre ofthe Northern Public Service. Immediately after the ‘‘northern-isation’’ policy, five were appointed and by 1958 there were alittle over 300. But they had still not replaced all the south-erners fired earlier.
Although such group preferences were initially limited togovernment employment, they began to spread into the pri-vate sector as a result of northern government actions. Euro-pean firms in northern Nigeria, which tended to hire southernNigerians for responsible positions, found themselves underpolitical pressure to hire northerners instead. In addition, thelocal government itself provided loans to northern Nigerianbusinessmen trying to compete with southern Nigerians, whowere more successful. Ironically, one of the political advocatesof the northernization policies himself hired Ibos rather thanother northerners in his private businesses.∞Ω Apparently thebelief that southern Nigerians were more efficient was not justa ‘‘perception’’ or ‘‘stereotype.’’
Given such intergroup hostility, it was perhaps not surpris-ing that the first decade of Nigeria’s independence was markedby riots, plots, and coups. The country’s first census had to benullified, amid charges of fraud. Early in 1966, the prime min-ister was assassinated in the course of a military coup. Becausehe was from the Moslem northern region and most of the coupleaders were Ibo military officers from the Christian south, thisset up a fateful backlash, in which the new military governmentwas rebelled against and then overthrown in a counter-coup inJuly of the same year by Moslem military officers. By Septem-ber, the backlash against the Ibos took the form of new andbloodier riots in the north:
∞≠∂ affirmative action in nigeria
Northern soldiers chased Ibo troops from their barracks and mur-dered scores with bayonets. Screaming Moslem mobs descendedon the Ibo quarters of every northern city, killing their victimswith clubs, poison arrows and shotguns. Tens of thousands of Iboswere murdered in the systematic massacres that followed.≤≠
After these traumatic events, more than a million Ibos fledthe northern region to join their fellow Ibos in the south-eastern part of the country. This region then decided to secedefrom Nigeria, where they no longer felt safe, and form theirown independent country, which they named Biafra. This isturn set off a civil war that lasted two years. The Nigerian gov-ernment blockaded this landlocked region, to prevent food ormilitary supplies from reaching it. Ibos then starved to death ata rate of a thousand a day.≤∞ Altogether, more than a millionpeople died in Biafra from a combination of starvation, mili-tary actions, and disease. Biafra collapsed and was re-absorbedinto Nigeria.
After this catastrophic episode, and after all the years of in-tergroup hostility that preceded it, Nigeria changed to a policyof reconciliation. The devastated economy in the southeasternregion was rebuilt and Ibo political and military personnel wererehabilitated, including some officials of the former Biafrangovernment. Years later, in 1982, even the exiled leader ofBiafra was pardoned. Ibos in general resumed their role as aprosperous element in Nigerian society.
The Federal Military Government which took power in theJuly 1966 coup remained in power until 1979, when a newconstitution was written for a return to civilian rule. The newconstitution was designed to mitigate ethnic politics by reorga-nizing political regions, in an attempt to break up ethnic blocs.Nevertheless, in the 1979 elections held under the new consti-tution, each of five presidential candidates received an abso-lute majority of the votes in at least one state and less than fivepercent of the vote in another state or states.≤≤ Since Nigeria’s
affirmative action in nigeria ∞≠∑
major ethnic groups live in different states, this voting patternrepresented a continuation of extreme ethnic polarization.
What also continued was a large role for government in theeconomy and rampant corruption in the carrying out of thatrole. In a very poor country, the central government’s controlof much of the country’s wealth makes the struggle to controlthe central government desperate and the use of that controlshameless. Although not unique in these respects, Nigeria isusually ranked among the most corrupt countries in the worldand in some years an international survey has ranked it as the
most corrupt country in the world.≤≥ Widespread and large-scale financial corruption—$30 million stolen by one state gov-ernor, for example—has been accompanied by equally grosselectoral fraud, in which a ‘‘defeated’’ candidate later turnedout upon investigation, years later, to have won by more than amillion votes.≤∂ Meanwhile, civil servants’ pay fell in arrears,inflation soared, and total national output declined.
As public confidence in their elected officials also declined,this set the stage for another military coup in 1983, part of ahistory of short-lived civilian governments and long-lived mili-tary regimes in Nigeria. Even in its more or less legitimateactivities, the government of Nigeria has served as an instru-ment for milking one ethnic group for the benefit of another. In1961, for example, the northern region paid only 9 percent ofthe country’s personal income taxes and received 45 percent ofthe money dispensed to the various regions by the federal gov-ernment. Meanwhile, the western region paid 64 percent of thecountry’s personal income taxes and received less than one-quarter of the regional funds.≤∑ In essence, the Yoruba werebeing drained financially for the benefit of the Hausa-Fulani.
PREFERENCES AND QUOTAS
In addition to various informal ways in which Nigerian gov-ernments at state and national levels have practiced favoritism
∞≠∏ affirmative action in nigeria
toward one ethnic group over another, more formal systems ofethnic preferences and quotas have been imposed under therequirement that numerous activities must ‘‘reflect the federalcharacter of the country.’’ This expresses ethnic preferences inregional terms. According to a provision of the 1979 constitu-tion, ‘‘the composition of the Government of the Federationand any of its agencies, shall be carried out in such a manner asto reflect the federal character of Nigeria, and the need topromote national loyalty, thereby ensuring that there shall beno predominance of persons from a few states or from a fewethnic or other sectional groups in that government or any ofits agencies.’’≤∏ Even before this constitutional provision waswritten, special efforts were made to recruit northerners intothe national government’s civilian branches and into its mili-tary services.
Seeking to redress regional—and therefore ethnic—im-balances in education, the federal government establishedboth universities and pre-university remedial educational in-stitutions in the more educationally backward regions. Then itestablished a Joint Admissions and Matriculation Board tocontrol admissions to the country’s universities, using ethnicquotas. Moreover, similar principles of regional and ethnic bal-ance were applied to a wide range of government activities andprojects:
With the enunciation of the principle of federal character,politicians and ethnic champions as well as ethnic entrepreneursnow watch assiduously every aspect of life to make sure that theyare not denied any possible benefits arising from the implementa-tion of the concept. Hence demands have arisen over the siting ofindustries by the government, the building of roads, hospitals andschools in various parts of the federation in conformity with theprinciple of federal character. Emphasis is placed on balancingthe location of socio-economic projects in the North with those inthe South. In fact, the iron and steel project of the country wasdelayed over the demands for balancing in the location of signifi-
affirmative action in nigeria ∞≠π
cant national projects. Similarly, the construction of the oil refin-ery in Kaduna, an area where no crude oil is produced, is moti-vated in part by the principle of ethno-regional balancing. Thelocation of federally-sponsored specialist hospitals has followedthe same principle of balancing that inspired the geographic loca-tion of the federal government colleges.≤π
As in other countries, the things made available throughethnic balancing have been primarily those things of interestand concern to the more fortunate members of the variousethnic groups, such as university admissions, rather than freeand universal compulsory education for the poor. In Nigeria,group preferences concentrate on those things which serve theinterests of those people who have already moved out of tradi-tional ways of life and into the modern sectors of the economyand society, with little concern for those still left behind.≤∫ The‘‘federal character’’ principle has been extended to promo-tions, school admission, and even membership on the nationalsoccer team.≤Ω Intergroup hostilities have been especially sharpin those modern sectors, such as in the cities, where locallyindigenous and non-indigenous groups have confronted oneanother:
Native urban dwellers resent migrants and often seek preferentialtreatment with respect to urban administration and planning.Non-indigenous dwellers, on the other hand, feel alienated andreluctant to participate in the development of the city. This isespecially evident in northern Nigerian cities and in Lagos where‘sons of the soil’ regularly harass ‘strangers.’≥≠
Because the ‘‘federal character’’ principle is administeredby the federal government, these affirmative action programshave strengthened the role of the central government vis-à-visstate and local governments, which have lost much of theirtaxing authority and have therefore been forced to rely for thebulk of their income on money received from the nationaltreasury. Moreover, competing ethnic and regional claims on
∞≠∫ affirmative action in nigeria
the federal treasury have made something as ordinarily mun-dane as a census a matter of heated controversy and bittercharges and counter-charges of corruption and fraud. Yet, farfrom settling or defusing intergroup tensions, the administra-tion and application of the federal character principle becameitself a matter of unending contention.
Regional autonomy allowed the dominant tribal or ethnicgroup in each region to show favoritism to its own members inthe allocation of government jobs, subsidies and other benefits.Because these represented essentially preferences and quotasfor the majority population of each region, the ability of othergroups to challenge such policies politically was limited. How-ever, with the concentration of power in the federal govern-ment, more evenly matched regional majorities could moreeffectively vie with one another for the favors of those holdingthe power of the central government. Whether or not this re-sulted in more fairness, it resulted in more conflict.
SUMMARY AND IMPLICATIONS
Territorially separated and politically polarized ethnic groupshave been a formula for disaster in many countries around theworld. Some of these countries have degenerated into civil war,like Sri Lanka and Yugoslavia, or have broken apart, either withor without military action—like Czechoslovakia, the SovietUnion, and first Pakistan from India and then Bangladeshfrom Pakistan. Nigeria’s civil war was part of this general pat-tern, and its re-uniting after breaking apart was one of themore favorable outcomes, tenuous as its national unity has con-tinued to be.
Against this background, the effects of group preferencesand quotas are harder to assess. Given the huge differences ineducation and cultures among the different tribes in Nigeria,would a policy of equal opportunity for all—with its inevita-ble predominance of southern Nigerians in coveted positions,
affirmative action in nigeria ∞≠Ω
even in northern Nigeria—have been politically viable? It ishard to imagine how such a situation would not have led topolitical demands for group preferences and quotas—and tomutual recriminations, demonization and polarization amongthe different groups. Perhaps a country with a long history ofnational concerns predominating over regional or tribal differ-ences, or a tradition of equal treatment for all, could haveavoided the tragedies which have racked Nigeria. But Nigeriawas not such a country. The very idea of making such disparateregions of the British empire in West Africa into one countrywas a belated and perhaps ill-advised decision. As far back as1899, early colonizers recommended breaking the territory ofNigeria into two separate provinces. In the years immediatelyfollowing independence in 1960, more than one region threat-ened secession before the Ibos actually seceded to form the ill-fated nation of Biafra.≥∞
If the goal of group preferences and quotas was to create asense of national unity, as often proclaimed, there is no evi-dence that it has in fact advanced that goal or even moved thecountry in that direction. As a study in 2001 concluded: ‘‘Nige-rians seldom categorize others by their wealth or occupationbut by ethnicity.’’≥≤ This is more than a social custom. It haspolitical implications. As an earlier study put it:
To the average Nigerian, a political leader is good only if he is ableto patronise members of his family at the expense of other fam-ilies, to promote the cause of his tribe at the expense of the na-tion, and, if need be, to defend the wrong of a brother at theexpense of justice.≥≥
In October 2001, the president of Nigeria acknowledgedcontinuing ethnic clashes and found it necessary to re-assertthe right of any Nigerian citizen ‘‘to live and enjoy full citizen-ship anywhere within this country.’’ He urged all Nigerians‘‘not to see any fellow Nigerian as a settler—in our coun-try where he or she is a citizen by birth—so that we can feel
∞∞≠ affirmative action in nigeria
justified to demand that he or she departs our neighborhood,when it suits our whims.’’≥∂ Nor had such ethnic clashes sub-sided months later, when a correspondent in Lagos reported:
Gangs of youths armed with machetes, swords and bows and ar-rows took to the streets of Lagos yesterday in a third day of ethnicconflict in which at least 55 people have been killed.
Grabbing what possessions they could, thousands left their homesas plumes of black smoke rose from the city’s slum. . . . Soldierswere deployed yesterday to help contain the violence, which be-gan on Saturday between Yoruba and Hausa tribal fights in theimpoverished northern areas of Idi Araba and Mushin.≥∑
Estimates of the number of deaths in intergroup clashesbetween 1999 and early 2002 ranged from 6,000 to 10,000.≥∏
If it is difficult to isolate the effects of preferences andquotas, as such, on Nigeria’s troubled history, it is much clearerthat the group polarization which preceded and produced thepreferences and quotas has been deadly in its effects, both inpeace and in war, and under both civilian and military govern-ments. So much rancor and bitterness had been built up inNigeria before policies ‘‘reflecting the federal character of thecountry’’ were instituted, that both the policies and the disas-ters which followed may be seen as consequences of the sameunderlying polarization. This situation is somewhat differentfrom that in a country where a majority chooses to grant prefer-ences and quotas to a minority, whether out of a sense of guilt,fear, or magnanimity. In such countries, good will may prevail,at least initially, and subsequent polarization may later be at-tributed to the effects of the policies themselves. In Nigeria,however, both the policies and the poisonous politics whichproduced them have been inextricably bound up togetherfrom the beginning, in a situation which unfolded with vir-tually the inevitability of a Greek tragedy.
Only in the wake of repeated disasters have there been steps
affirmative action in nigeria ∞∞∞
taken to dampen the ethnic polarization through political re-structuring, aimed at requiring candidates to demonstrate po-litical support in different regions of the country—which isto say, among different ethnic groups. That such efforts havelargely failed thus far may be less important in the long runthan the fact that the problem has been identified and its im-portance recognized, which is a necessary prelude to any fu-ture actions that might succeed.
While preferences cannot be said to have created ethnicpolarization in Nigeria, as they did in Sri Lanka, neverthelessthe question may be asked whether these preferences haveeased or accentuated the pre-existing frictions and hostilitiesamong the country’s many minorities—in a country with nomajority. The prestigious Economist Intelligence Unit in Lon-don made this assessment:
Various explanations have been given for the sharp rise in sec-tarian and communal violence in Nigeria since 1999. The unrestis said to stem from the release of pent-up anger and frustrationfollowing years of authoritarian military rule. Unease in the coun-try has also increased as historically fragile relations between pre-dominantly Muslim northerners and mainly Christian southern-ers have been critically strained by the introduction of sharia(Islamic law), including harsh punishments for offenders in manyparts of the north. But the most widely accepted reason for Nige-ria’s enduring civil unrest is the mistrust between its more than250 ethnic groups that make up Nigeria, many of which considerthemselves separate nationalities. The persistence of racial mis-trust reflects the failure of nation-building in Nigeria, where mostpeople’s loyalty is to their ethnic group rather than the nation.≥π
From the standpoint of others seeking to glean some les-sons from the experience of Nigeria, clearly the spectacle ofethnic groups organized into different political parties—eachparty exclusively dependent on the votes of one group, and allfighting over the dispensation of government largess—is not
∞∞≤ affirmative action in nigeria
one to encourage emulation elsewhere. It is not the simple factthat one group gives the vast majority of its votes to one partythat is crucial. That happens in many countries, including theUnited States, without producing ethnic parties in the sense inwhich such parties have existed in Nigeria or Sri Lanka, wherethese parties have freely insulted, demonized, and alienatedother groups—and led both countries into civil wars. Whatmust also exist to produce such tragedies is such exclusive pre-occupation with intergroup struggles that attacks on othergroups provoke no backlash from voters offended by such po-larization. That situation existed in the American South duringthe era when ‘‘white supremacy’’ was loudly proclaimed duringelection campaigns. But, in the absence of such extreme condi-tions, parties based on a variety of issues and constituencieshave tended to play down or paper over inter-ethnic conflictsthat could cost them votes among the general public.
What has saved the United States from the fate of Nigeria isthat polarizing political tactics have for more than a centurybeen confined to one region of the country and that the disap-proval of many other Americans limited how far such tacticscould go. Where there was no such disapproval of unbridledpolarization, Americans also had a civil war, even though be-tween two groups that were not racially or ethnically different,but territorially separate. In Nigeria, there was no such concernover polarization or even violence directed against other ethnicgroups. For example, during the bloody outbreaks of violencein northern Nigeria that killed tens of thousands of Ibos in1966, the Yoruba expressed little concern, either from a hu-manitarian point of view or from the standpoint of the damageto the nation as a whole.≥∫
India has not had an outright civil war between territoriallyseparated groups, though it has had escalating violence aroundthe country, in the wake of polarization among many groups,including in recent years polarization by Hindu politicians tar-geting Moslems. Malaysia and Singapore have avoided the fates
affirmative action in nigeria ∞∞≥
of Nigeria and Sri Lanka partly by not having territorially sepa-rate ethnic groups, and has avoided the fate of India by essen-tially banning free speech on ethnic issues. But where none ofthese restraints or countervailing forces is at work, Nigeria hasbeen a painful example of what can happen. What has beenclear from its experience is that the often repeated idea thatattempts at equalizing outcomes through group preferencesand quotas would enhance ‘‘national unity’’ has been provento be as false in Nigeria as in other countries. The goal ofnational unity behind policies ‘‘reflecting the federal characterof the country’’ has given the various groups something to fightover, rather than something to bring them closer together.
The underlying assumption that the degree of economic orother inequality is not only correlated with the degree of inter-group antagonism, but is the main cause of it, may seem plausi-ble to some and may be accepted without question by others,but it does not fit the facts in Nigeria, nor in other countries.While the region where the Yoruba are indigenous has longhad a higher economic level than the region inhabited by theIbos, the hostility of the Hausa-Fulani toward the upstart Ibos,who were historically closer to their own economic level, haslong been far more fierce than that toward the more pros-perous Yoruba. Moreover, it was precisely when the Ibos beganto close the economic gap between themselves and the Yorubaduring the late 1940s that hostilities between Ibos and Yorubathen erupted and escalated.≥Ω In the 1990s, when the Katafs,formerly lagging behind the Hausa economically, had closedthe gap, the relations between these two groups likewise be-came more polarized than ever, so that ‘‘the slightest disagree-ment tends to explode into violence.’’ The same phenomenonhas been found among other Nigerian tribal or ethnic groups.∂≠
Similar patterns have existed in other African countries, as wellas in Asia, Europe, and the Western Hemisphere. In Sri Lanka,for example, the disproportionate success of the Tamils in edu-cational institutions and professional occupations was even
∞∞∂ affirmative action in nigeria
greater in the peaceful first half of the twentieth century thanin the tragically bloody second half. There, as in Nigeria andelsewhere, it was not the economic or other differences, assuch, which provoked polarization and violence, but the pol-iticizing of those differences.
Intergroup strife within various regions of Nigeria has ledto the creation of more states—first a dozen in 1967 and then36 in 1996.∂∞ Having suffered the deadly consequences of con-flicts growing out of ethnic heterogeneity, Nigeria has soughtto create more homogeneity within separate enclaves, in orderto defuse the polarization that has threatened to tear the coun-try apart.
chapter 6
A≈rmative Action in the United States
Affirmative action policies by the government of theUnited States confront a problem not found in manyother countries. Both the American Constitution and
statutes such as the Civil Rights Act of 1964 mandate equaltreatment of individuals. Advocates of official group prefer-ences and quotas in the United States have therefore oftensought to deny that these were in fact group preferences andquotas. Instead, such policies have been depicted as a correc-tion or forestalling of discrimination, or as promoting ‘‘diver-sity,’’ whose social benefits are sweepingly asserted or assumed,without actually being tested or demonstrated.∞
The historical evolution of affirmative action in the UnitedStates would be difficult to understand without first realizingthe legal obstacles which such policies must overcome in orderto be acceptable in American courts of law, as well as in thepolitical arena. Group preferences and quotas in the UnitedStates evolved out of laws initially seeking to ban discriminationagainst individuals—including laws explicitly repudiating theprinciple of group preferences and quotas.
The central statute in this evolution was the Civil RightsAct of 1964 and the central group whose plight provided the
∞∞∏ affirmative action in the united states
impetus and rationale for this law were blacks. As in othercountries, however, these policies spread far beyond the initialbeneficiaries. Blacks are just 12 percent of the American popu-lation, but affirmative action programs have expanded over theyears to include not only other racial or ethnic groups, but alsowomen, so that such policies now apply to a substantial majorityof the American population. Put differently, failure to havestatistical representativeness among employees can be equatedwith job discrimination for a wide range of groups, with theburden of proof to the contrary falling on the employer.
Official group preferential policies go far back in Americanhistory. Religious discrimination existed in much of colonialAmerica. Different laws applied to whites and free blacks in theantebellum South, and continuing legal distinctions betweenblacks and whites persisted during the long Jim Crow era thatbegan after the Civil War and extended past the middle of thetwentieth century. Nor were blacks the only racial group dis-criminated against in law and policy, for the sake of the whitemajority. The indigenous population of American Indians werealso subject to different—and worse—laws than the white ma-jority, as were Chinese and Japanese immigrants. Ironically,however, the first official preferential policy for a racial minor-ity in the United States appeared in the 1830s, long beforeracial discrimination laws were repealed. American Indianswere given preferential employment status in the Bureau ofIndian Affairs.≤
Rather than attempt to follow in detail the changing lawsand policies affecting the many religious, racial, ethnic andother groups at various times in American history, we can see inbroad outline what has happened to American blacks, becausethis is the group most often used as justification for affirmativeaction policies, however more widely such policies have beenapplied to others. While this history is rather straightforward,what is a challenge is disentangling the myths which have be-come intertwined with that history.
affirmative action in the united states ∞∞π
MY THS VERSUS HISTORY
In a history geared toward justifying current political policiesand movements, blacks have been seen as a group whose eco-nomic and social disparities today are a direct consequence oftheir enslavement and maltreatment in the past, as well as con-tinuing racism and discrimination in the present. Whether it isthe lower incomes of blacks, compared to other Americans, ortheir higher infant mortality rates, lower levels of marriage andlabor force participation, or other social pathology, the generalcause has been believed to be the behavior of whites. Accord-ingly, the socioeconomic rise of blacks in the second half of thetwentieth century has been seen as a consequence of laws andpolicies countering the discrimination inflicted on blacks bywhites and attempting to redress past inequities. Virtually allthese widespread explanations of social pathology among blackAmericans are demonstrably false.
Blacks have indeed been maltreated—first enslaved formore than two centuries and then subjected to gross officialdiscrimination for another century in the South, where mostblacks have always lived. Nor was the rest of the country free ofeither racism or discrimination. But neither the initial povertyof blacks, nor the later rise of most blacks out of poverty fol-lows the path sketched by those who promote preferential poli-cies. The facts of history contradict much of today’s prevailingvision.
While such things as the much lower labor force participa-tion rates of blacks and the much lower marriage rates amongblacks today are often attributed to ‘‘a legacy of slavery,’’ inreality blacks had higher rates of labor force participation thanwhites, and slightly higher marriage rates than whites, in thelate nineteenth century, when they were just one generationout of slavery.≥ Indeed, this continued to be true well into thetwentieth century. The drastically different patterns seen todaybegan after the 1960s.
∞∞∫ affirmative action in the united states
Undoubtedly, racial discrimination has contributed histor-ically to blacks having lower incomes than whites. But that isvery different from saying how much or in what ways. It cannotsimply be assumed that blacks would have had the same in-comes as whites in the absence of racial discrimination, giventhat various groups of American whites have had very differentincomes from one another at various periods of history. Inaddition, a number of non-white groups in the United States—Chinese, Japanese, Asian Indians, and black Barbadians—havehad higher incomes than white Americans. Moreover, one ofthe most serious forms of discrimination against blacks hashistorically been discrimination by government in its provisionof education. Black-white differences in per pupil expenditure,especially in the South during the Jim Crow era, have beenextensively documented. Inferior education would assure in-come differences, even in the absence of employer discrimina-tion. The point here is not to deny employer discrimination,either in the public sector or the private sector, but simply topoint out some of the difficulties in determining its nature andmagnitude—difficulties that are too often overlooked whenequating statistical disparities in income or employment withemployer discrimination.
Although simple quantitative differences in education arenot the only criteria of educational discrimination againstblacks, historically the differences in this respect have beensufficiently dramatic to make it unnecessary to go into qualita-tive differences as well. Suffice it to say that blacks lagged sub-stantially behind whites in education for most of Americanhistory. As late as 1940, non-white males had completed just 5.4years of school, compared to 8.7 years for white males. Foryoung adult males, aged 25 to 29 years of age, the black-whitedifference was four years. Twenty years later, the black-whitedifference in schooling among young adult males in these agebrackets had shrunk to less than two years. By 1970, the years ofschooling for young black men in these age brackets was less
affirmative action in the united states ∞∞Ω
than one year—12.1 years of schooling for young black men,compared to 12.7 years for their white counterparts.∂
In short, black education rose substantially, both absolutelyand relative to white education, in the decades preceding thecivil rights legislation of the 1960s and the affirmative actionpolicies that began in the 1970s. What economic changes ac-companied this rise in black education? As of 1940, 87 percentof black families had incomes below the official poverty line. By1960, this was down to 47 percent of black families.∑ This dra-matic 40-percentage-point decline came at a time when therewas no major federal civil rights legislation. But this was a timenot only of rising black education, but also a time of a mas-sive exodus of blacks out of the South—more than 3 millionpeople∏—escaping both the Jim Crow laws and the substan-dard Southern black schools. In short, this was a time when vastmembers of blacks lifted themselves out of poverty—‘‘by theirown bootstraps,’’ as the phrase goes.
Beginning in the 1960s, there were also major federal civilrights laws. While the percentage of black families with in-comes below the poverty level continued to decline, to 30 per-cent during this decade, it is not so clear which factors contrib-uted most to this. But it cannot be assumed arbitrarily that itwas all due to civil rights laws, as too often it is in various politi-cal discussions. While it is an often repeated fact that the num-ber of blacks in professional and other higher level occupationsincreased in the five years following passage of the landmarkCivil Rights Act of 1964, it is an almost completely ignored factthat the number of blacks rising into such occupations waseven greater in the five years preceding passage of the CivilRights Act of 1964.π
While the role of the 1960s ‘‘equal opportunity’’ legislationand policies epitomized by the Civil Right Act can be debated,the effect of the federal affirmative action policies that beganin the 1970s are clearly less impressive. During the decade ofthe 1970s, the poverty rate among black families fell from
∞≤≠ affirmative action in the united states
30 percent to 29 percent.∫ Even if all of this one-percentage-point decline were arbitrarily attributed to affirmative action, itwould still not be a significant part of the history of the eco-nomic rise of blacks out of poverty, however crucial affirmativeaction has been made to seem politically. Nor should this besurprising, given that preferences and quotas in India and Ma-laysia have benefitted primarily the already more fortunate,rather than those in poverty.
In the United States as well, affirmative action has been aboon to those already more fortunate. A study of a randomsample of minority beneficiaries of government contracts setaside by the Small Business Administration showed that morethan two-thirds of these beneficiaries had net worths of morethan a million dollars each. These include a black businessmanin a position to offer to arrange a buy-out of the multibillion-dollar Viacom media conglomerate. This entrepreneur hadpreviously been a government official at the Federal Communi-cations Commission and thus knew from the inside how minor-ity set-aside programs worked in the media. These programsalso benefitted wealthy black athletes like Lou Brock, JuliusErving and O. J. Simpson. Yet when some members of Congresspublicly opposed such programs, Congressman Charles Rangelfrom Harlem compared them to Hitler and depicted any at-tempt to roll back affirmative action as an attack on all blacks.Ω
In reality, during the period from 1967 to 1992—most ofthis being in the affirmative action era—the top 20 percent ofblack income-earners had their income share rising at aboutthe same rate as that of their white counterparts, while thebottom 20 percent of black income-earners had their incomeshare fall at more than double the rate of the bottom 20 per-cent of white income earners.∞≠ In short, the affirmative actionera in the United States saw the more fortunate blacks benefitwhile the least fortunate lost ground in terms of their share ofincomes. Neither the gains nor the losses can be arbitrarilyattributed to affirmative action, but neither can affirmative ac-
affirmative action in the united states ∞≤∞
tion claim to have advanced low-income blacks when in factthose blacks fell behind.
Because minority immigrants are eligible for affirmative ac-tion, even though they have obviously suffered no past discrimi-nation in the United States, members of the Fanjul family fromCuba—with a fortune exceeding $500 million—have receivedgovernment contracts set aside for minority businesses.∞∞ Anabsolute majority of the money paid to ‘‘minority’’-owned con-struction firms in Washington, D.C., during the period from1986 to 1990 went to European businessmen from Portugal.Asian entrepreneurs have likewise immigrated to the UnitedStates and then acquired preferential access to governmentcontracts.∞≤ Such results once again demonstrate how far thereality of affirmative action departs from its rationale of reme-dying past discrimination.
Although affirmative action began as a program primarilyintended to benefit blacks, most of the ‘‘minority and women-owned businesses’’ favored by government preferences areowned by groups other than blacks. More than four times asmany businesses are owned by Hispanics and Asian Americansand thirteen times as many businesses are owned by women asby blacks. Moreover, even within this omnibus category of mi-nority and women-owned businesses, some evidence suggeststhat the vast majority of firms receive nothing from these pref-erences, while a relatively few receive the bulk of the benefits.In Cincinnati, for example, the city vendor list identified 682such firms, but 13 percent of these firms received 62 percent ofall the preferential contracts and 83 percent of the money.Nationally, only about one-fourth of one percent of minority-owned enterprises were even certified as entitled to prefer-ences under the Small Business Administration. Then, evenamong this tiny fraction of minority firms, 2 percent received40 percent of the money.∞≥
A special benefit has been created for American Indianswho run gambling casinos on reservations. But here, again,
∞≤≤ affirmative action in the united states
there has been the same skewed distribution of benefits seen inmany other contexts. Five states, with almost half the totalAmerican Indian population of the country, receive less than 3percent of all casino proceeds, amounting to about $400 per In-dian. Meanwhile, three states with only 3 percent of the Indianpopulation receive 44 percent of all casino revenue—and aver-age of $100,000 per Indian. One casino in California brings inmore than $100 million a year, or about $900,000 per Indian.These are revenues, rather than profits, and many non-Indianinvestors reap profits from Indian casinos.∞∂
THE EVOLUTION OF AFFIRMATIVE ACTION
The Civil Rights Act of 1964 was not only a law mandatingequal rights for individuals, both the Congressional debatesleading up to its passage and particular provisions of the Actitself explicitly repudiated the concept of group preferences orquotas. The term ‘‘discrimination’’ which sometimes has verydifferent meanings to different people, was specifically definedin the Civil Rights Act of 1964 to mean intentional actions by anemployer against individuals, as distinguished from disparateconsequences of particular tests or other criteria on differentgroups. The principal advocate for the Act, Senator HubertHumphrey, put it this way:
The express requirement of intent is designed to make it whollyclear that inadvertent or accidental discriminations will not vio-late the title or result in entry of court orders. It means simply thatthe respondent must have intended to discriminate.∞∑
While guiding the Civil Rights Act of 1964 through theSenate, Senator Humphrey assured his colleagues that it ‘‘doesnot require an employer to achieve any kind of racial balancein his work force by giving preferential treatment to any indi-vidual or group.’’∞∏ He pointed out that subsection 703( j) un-der Title VII of the Civil Rights Act ‘‘is added to state this point
affirmative action in the united states ∞≤≥
expressly.’’∞π That subsection declared that nothing in Title VIIrequired an employer ‘‘to grant preferential treatment to anyindividual or group on account of any imbalance which mayexist’’ with respect to the numbers of employees in such groups‘‘in comparison with the total number or percentage of personsof such race, color, religion, sex, or national origin in any com-munity, State, section or other area.’’
While the Civil Rights Act clearly did not create affirmativeaction in the United States, it is much less clear just what specif-ically did. In part this is because group preferences and quotasarose and evolved incrementally and even surreptitiously. Thevery phrase ‘‘affirmative action’’ meant different things at dif-ferent times.
In the American context, there has been what might becalled generic affirmative action, as well as highly specific affir-mative action. Generic affirmative action is distinguished froma policy of passively adhering to a non-discrimination principle,while waiting to respond to particular problems as they arise.Thus the National Labor Relations Act of 1935 required em-ployers to take ‘‘affirmative action’’ to ensure that their em-ployees had a free choice as to whether or not to vote to berepresented by a labor union. Such actions might include post-ing relevant federal laws on the subject in the workplace and/or announcing the end of any anti-union activities or policiespreviously engaged in by the management. In other words, itwas not considered sufficient simply to ‘‘cease and desist’’ fromanti-union activity and passively comply with the new federallaws giving workers the right to choose collective bargaining, itwas necessary to affirmatively proclaim that right and repudi-ate any pre-existing policies whose lingering effects might in-timidate workers in exercising their rights.
Similarly, in the much later application of this principle toracial and other groups, it was not considered sufficient for theemployer simply to cease and desist from discriminating. It wasnecessary for the employers to take ‘‘affirmative action’’ to en-
∞≤∂ affirmative action in the united states
sure that previously excluded groups were made aware of newopportunities now open to them, so as to be able to take practi-cal steps to prepare for and apply for such opportunities. Affir-mative action might also include voluntary efforts, both insideand outside the workplace, by both employers and others, toadvise and train people for new opportunities in employment,college admissions and other benefits.
Such generic affirmative action has long had far wider sup-port from the general public, and from both conservatives andliberals in the political arena, than more specific affirmativeaction in the form of group preferences and quotas.∞∫ In short,there has been widespread support in the American popula-tion at large for efforts to bring less fortunate groups up to theexisting standards, even among people completely opposed tobringing the standards down to these groups.
The first official use of the term ‘‘affirmative action’’ in a racialor ethnic context was in President John F. Kennedy’s ExecutiveOrder No. 10,925 in 1961, where he said that federal contractorsshould ‘‘take affirmative action to ensure that the applicants areemployed, and that employees are treated during employment,without regard to their race, creed, color or national origin.’’ Thisfirst in a series of Executive Orders, extending over several ad-ministrations, was clearly not calling for group preferences orquotas. On the contrary, it was calling upon employers to hireand promote without regard to group membership—and to makethat fact clear to all. It was generic affirmative action.
The next major development in the evolution of affirmativeaction was the creation of the Office of Federal Contract Com-pliance in the U.S. Department of Labor by President LyndonJohnson’s Executive Order No. 11,246 in 1965. In May 1968,this office issued guidelines containing the fateful expression‘‘goals and timetables’’ and ‘‘representation.’’ But as yet thesewere still not quotas, for 1968 guidelines spoke of ‘‘goals andtimetables for the prompt achievement of full and equal em-ployment opportunity.’’ By 1970, however, during the Nixon
affirmative action in the united states ∞≤∑
administration new guidelines referred to ‘‘results-orientedprocedures,’’ which hinted more strongly at what was to come.In December 1971 the decisive guidelines were issued, whichmade it clear that ‘‘goals and timetables’’ were meant to ‘‘in-crease materially the utilization of minorities and women,’’with ‘‘under-utilization’’ being spelled out as ‘‘having fewer mi-norities or women in a particular job classification than wouldreasonably be expected by their availability . . .’’∞Ω Employerswere required to confess to ‘‘deficiencies in the utilization’’ ofminorities and women whenever this statistical parity could notbe found in all job classifications, as a first step toward correct-ing this situation. The burden of proof—and remedy—was onthe employer. ‘‘Affirmative action’’ was now decisively trans-formed into a numerical concept, whether called ‘‘goals’’ or‘‘quotas.’’ Affirmative action in this specific sense was thus aproduct of the decade of the 1970s.
Many have seen the emergence of affirmative action, in thesense of group preferences and quotas, as a later perversion ofthe initial equal-opportunity intent of the law. However, evenbefore the Civil Rights Act of 1964 was passed, there were al-ready developments which foreshadowed the shift to prefer-ences and quotas. Moreover, this shift was in keeping with theunderlying social vision of the problems of black Americans. Ifeconomic differences between groups were presumed to bestrange and/or sinister, then the obvious remedy was to elimi-nate such differences. The fact that such differences can befound in countries around the world and over centuries ofhistory—often on a larger scale than differences between blackand white Americans—may be known to some scholars andtheir students and readers, but these are still a minuscule frac-tion of the population, and certainly too small to have anypolitical or even intellectual effect on widespread beliefs.
When the Civil Rights Act of 1964 was being debated inCongress, there was already a prominent state case in Illinois,in which the Motorola Company was judged to have violated
∞≤∏ affirmative action in the united states
state laws against discrimination by refusing to hire a blackapplicant who had failed a test they had given him. An exam-iner for a state agency considered the test to be ‘‘unfair toculturally deprived and disadvantaged groups.’’≤≠ Here thecharge was not that this individual was given a test not requiredof other individuals, but that the group to which he belongedwas less likely to pass such tests. The question of whether thelaw should focus on individuals or groups was joined early on atthe state level, while the federal Civil Rights Act was still underconsideration in Congress.
Supporters of the Civil Rights Act dismissed the Illinoiscase as an oddity unlikely to survive the normal legal processes,as a case where one examiner ‘‘went too far’’ and as a ‘‘redherring’’ as regards Congressional debates over federal anti-discrimination law.≤∞ But when one of the critics of the Act,Senator John Tower of Texas, introduced an amendment todeclare that an employer ‘‘may give any professionally devel-oped ability test to any individual seeking employment’’ anduse such tests in making hiring or promotions decisions, Sena-tor Humphrey said: ‘‘These tests are legal. They do not need tobe legalized a second time.’’ He also said: ‘‘The Motorola casehas been discussed, discussed, and cussed.’’≤≤
Despite this clear legislative history, the U.S. SupremeCourt later ruled in Griggs vs. Duke Power Company (1971) thattests and other procedures which ‘‘act as ‘built-in headwinds’for minority groups’’ could not be allowed to stand, even if theywere ‘‘neutral on their face, and even if neutral in terms ofintent,’’ when they are ‘‘unrelated to measuring job capabil-ity.’’≤≥ This last proviso meant that employers had to ‘‘validate’’any tests they used which had a disparate impact on minor-ity groups. This apparently innocent requirement concealedcostly and complicated statistical validation processes, open toendless legal challenges, that became for many employers sim-ply prohibitions against using tests.≤∂
The Griggs decision was not the only example of courts
affirmative action in the united states ∞≤π
reading the Civil Rights Act of 1964 to mean precisely what theAct and its legislative history had clearly said that it did not
mean. A case that was decided by the U.S. Supreme Court in1979 was brought by a white employee of Kaiser Aluminumnamed Brian Weber, who had been rejected for a job trainingprogram for insufficient seniority, even though black employ-ees with less seniority were accepted. This was because of thecompany’s affirmative action plan—a plan ‘‘voluntarily’’ estab-lished by the company to retain its status as a government con-tractor. Weber sued on grounds that the Civil Rights Act of1964 had been violated by discrimination based on race. Sec-tion 703(a) of the Act declared it unlawful for an employer ‘‘todiscriminate against any individual with respect to his compen-sation, terms, conditions, or privileges of employment, becauseof such individual’s race, color, religion, sex, or national ori-gin’’ and Section 703(d) more specifically declared it unlawfulto ‘‘discriminate against any individual’’ in ‘‘apprenticeship orother training.’’
Notwithstanding this plain language, the Supreme Courtvoted against Weber’s claim of discrimination. Writing for themajority, Justice William J. Brennan rejected ‘‘a literal inter-pretation of these words.’’ He claimed that the ‘‘spirit’’ of theAct had as its ‘‘primary concern’’ the economic problems ofblacks, so that it did not bar ‘‘temporary, voluntary, affirmativeaction undertaken to eliminate manifest racial imbalance intraditionally segregated job categories.’’ Quite aside from thefact that these racial quotas were neither temporary nor volun-tary, this interpretation ignored both the language and thelegislative history of the Civil Rights Act of 1964, which hadrejected discrimination against anyone of any clor, as well asrejecting ideas of correcting racial ‘‘imbalances.’’ Brennan’scomplete evasion of the plain words of the statute was de-scribed in a dissenting opinion as reminiscent of the great es-capes of Houdini.≤∑
The Weber case became both a legal landmark and a
∞≤∫ affirmative action in the united states
political model for evasions of the law by citing such rationalesas remedial action or ‘‘diversity’’—and for taking the issue outof the realm of government-sponsored discrimination, whichwould be a violation of the Fourteenth Amendment, by main-taining that affirmative action quotas and preferences createdby employers in order to maintain their eligibility for govern-ment contracts were ‘‘voluntary’’ and ‘‘private.’’ Although theWeber case was the high-water mark for advocates of grouppreferences and quotas, the Supreme Court continued to goback and forth on the legality or illegality of particular affir-mative action programs. Judicial vacillation was signalled notonly by differing decisions on very similar cases—the samenine justices had invalidated a University of California medicalschool quota in the Bakke case just one year before affirmingthe job training quota in the Weber case—but also by 5 to 4decisions and by decisions in which there was no overall major-ity for the decision as a whole, but only shifting majorities,made up of different justices, for the particular sections thatadded up to the whole decision. Reconciling equal treatmentof individuals with group preferences was not easy.
Despite a zig-zag pattern of judicial decisions over the years,the general trend has been toward ever more expansive defi-nitions of ‘‘discrimination,’’ leading to more and more ‘‘re-medial’’ group preferences and quotas. In the controversiesswirling around both judicial and political policies involvingaffirmative action, there has been much confusion betweengeneric affirmative action, such as ‘‘outreach’’ efforts, andmore specific affirmative action in the sense of group prefer-ences and quotas. Indeed, much of that confusion has beencultivated by defenders of affirmative action who decry thenotion that nothing should be done to help the less fortu-nate—which is of course not the issue at all.
The real issue is what specifically shall and shall not bedone, for whom, for what reason, and for how long. Such issuesremain unresolved. As late as 2003, the Supreme Court of the
affirmative action in the united states ∞≤Ω
United States declared in Grutter v. Bollinger that ‘‘all govern-ment use of race must have a logical end point.’’ Yet the Courtneither imposed such a time limit nor provided any criterion bywhich anyone could know when that limit had been reached.
EXTENSIONS OF AFFIRMATIVE ACTION
As in other countries, affirmative action in the United Stateshas not merely evolved but spread. It has spread to a successionof groups, to a wider range of activities and industries, and themeanings of words have also spread, so that ‘‘discrimination,’’for example, now encompasses things that no one would haveconsidered to be discrimination when the Civil Rights Act of1964 was passed.
Extensions of ‘‘Discrimination’’
Because discrimination so often serves as a predicate forpreferences and quotas under American laws and policies, thedefinition of discrimination has tended to expand over time,along with the groups and activities to which affirmative actionhas been successively extended. The ‘‘intentional’’ act whichconstituted discrimination, as described by Senator HubertHumphrey when he successfully led the effort to get the CivilRights Act of 1964 passed, has long since been superseded bymore expansive concepts and more vague and shifting stan-dards of proof.
The most decisive shift in the burden of proof has been tomake the accused disprove a prima facie case of discrimina-tion, based on statistical disparities in group results. These maybe disparities in test results or disparities in group ‘‘representa-tion’’ among employees of businesses or students admitted tocollege, for example. The Griggs decision by the U.S. SupremeCourt shifted the burden of proof to employers whenever testswere passed at very different rates by different segments of the
∞≥≠ affirmative action in the united states
population. This became known as the principle of ‘‘disparateimpact,’’ which was applied not only to tests but also to othercriteria such as academic credentials or a non-criminal history,when these criteria led to different proportions of differentgroups being accepted.
The policies of federal administrative agencies codified andextended the principle that lesser performances by A were tobe regarded as presumptively the fault of B, the latter being leftto try to prove a negative, so as to avoid a charge of discrimina-tion. Guidelines issued by the Equal Employment OpportunityCommission declared that ‘‘a selection rate for any race, sex, orethnic group which is less that four-fifths . . . of the rate for thegroup with the highest rate will generally be regarded by theFederal enforcement agencies as evidence of adverse impact’’of the selection process.≤∏
The redefinition of ‘‘discrimination’’ was often accom-panied by denials that this represented a lowering of stand-ards. The argument has been made that no one was beingforced to hire people who were not ‘‘qualified.’’ But this wordsidestepped the real question, which was whether people oflesser qualifications were to be hired in preference to people ofgreater qualifications, simply because of the respective groupsto which they belonged. The word ‘‘qualified’’ essentially ho-mogenized applicants who met whatever minimum standardmight be arbitrarily set by third parties. If that standard were tobe set as correctly answering half the questions on a test, thensomeone who answered 51 percent correctly was just as much apart of the ‘‘qualified’’ pool as someone who answered 99 per-cent. More important, an employer who hired proportionatelyfewer black ‘‘qualified’’ applicants than white ‘‘qualified’’ appli-cants could be considered to be engaging in racial discrimina-tion, even if the average test scores of the black applicants weresubstantially lower. Moreover, this was not officially consideredto be a policy of racial preferences, but only an application ofanti-discrimination law.
affirmative action in the united states ∞≥∞
The boldest application of this principle was ‘‘race-norming’’of tests. The U.S. Employment Service, for example, reportedthe percentile rankings of job applicants to employers, withoutinforming those employers that these were separate percentilerankings according to the racial group to which the applicantbelonged. Thus a black job applicant who ranked at the 90thpercentile among fellow blacks might have a lower absolutescore than a white applicant who ranked at the 80th percentileamong whites. In Sri Lanka, the same practice was called by theinnocuous name ‘‘standardization,’’ which offset the higheraverage academic performances of Tamil students as comparedto Sinhalese students. In both countries, it was simply a dis-guised form of group preferences.
When the clandestine practice of race-norming becameknown and a matter of public controversy in the United States,it was banned in the Civil Rights Act of 1991. However, the kindof thinking it involved was not banned and has continued inother guises. Moreover, that such a practice could have beenimposed secretly in the first place—and persist undetected fora decade≤π—suggests some of the difficulties of attemptingto ban affirmative action—and especially of trying to have a‘‘nuanced’’ reduction of it, to ‘‘mend it, not end it,’’ as somehave said. Anything short of unequivocally banning it outrightsimply invites such subterfuges. Indeed, even outright bans ongroup preferences in admissions to state colleges and univer-sities in Texas and in California have set off searches for non-objective criteria, such as have already been used in India tocircumvent court limitations on group preferences there.
In addition, laws have been passed to admit students whofinish in the top 10 percent of their high school classes, indisregard of the highly disparate qualities of different highschools— and, more particularly, the very low quality of thehigh schools from which many minority students graduate.Thus students with composite SAT scores below 900 have beenadmitted to the University of Texas because they were in the top
∞≥≤ affirmative action in the united states
10 percent of their high schools, while other students with SATscores hundreds of points higher—some over 1500—havebeen rejected.≤∫ In California, the search for non-academic cri-teria for granting admissions to the University of California hasin practice meant the use of such criteria to admit more His-panics, but not Asian Americans who meet those same non-academic criteria, in addition to having higher academic cre-dentials.≤Ω It is race-norming by another name.
The ease with which discrimination charges can be madewith statistics alone, and the difficulty or impossibility of prov-ing a negative when the burden of proof shifts to the employer,provide incentives for businesses to locate away from concen-trations of blacks, for example. Whether the jobs lost by blacksas a result of such locational decisions are greater or less thanthe jobs gained by blacks as a result of racial preferences isanother empirical question seldom asked, much less answered.Here, as in other countries, affirmative action tends to be dis-cussed and debated primarily in terms of its rationales andgoals, rather than its actual consequences.
Extensions to New Groups
The rationale of remedying or forestalling the effects ofdiscrimination extends well beyond the various racial or ethnicgroups originally used as a reason for creating affirmative ac-tion policies. The largest of these new groups—indeed, largerthan all the other groups put together—are women. And, ofcourse, in the United States most of those women are white.Although the rationale has wandered far from the ‘‘legacy ofslavery’’ argument, the practices growing out of affirmative ac-tion have not wandered far from the practices used in situa-tions involving blacks. Women have become entitled to employ-ment quotas and business set-asides like other groups. Theneed for specific evidence of prior specific harm has likewisebeen evaded, in this case by the phrase ‘‘glass ceiling’’—that
affirmative action in the united states ∞≥≥
is, discrimination that cannot be seen but which is simply as-sumed as a basis for preferential treatment.
Women have even had a fictitious history created for them,much as there has been a fictitious history of the rise of blacksfrom poverty. In reality, the socioeconomic history of women inthe United States is very different from the socioeconomic his-tory of blacks—and even more radically different from thehistory depicted by those seeking affirmative action for women.Unlike the more or less continuous rise of blacks from lower tohigher levels of education and from lower to higher occupa-tional levels during the twentieth century, women’s educa-tional and occupational trajectories varied considerably duringthat century. Although the conventional explanation of wom-en’s lag behind men in the economy is discrimination, andtheir rise in more recent times has been credited to feminist or‘‘women’s liberation’’ movements that began in the 1960s andthe government laws and policies created in response to suchpolitical efforts, the cold fact is that women were in many waysbetter represented in higher occupational levels in the 1930sor earlier than in the 1960s. This can scarcely be credited tomovements that had not yet begun in these earlier times, muchless to affirmative action policies that began in the 1970s.
Unlike what happened in the history of blacks, women’spercentage share of the jobs in professional and technical oc-cupations declined in the middle decades of the twentieth cen-tury—and then rose later. A similar pattern of fall followed byrise can be seen in women’s percentage shares of the collegeand university degrees required for such occupations.
Women’s representation in professional and technical oc-cupations declined by 9 percent from 1940 to 1950 and thenby another 9 percent from 1950 to 1968.≥≠ As far back as 1902,women’s share of the people listed in Who’s Who was more thandouble their share in 1958.≥∞ Women received 34 percent ofthe Bachelor’s degrees in 1920 but only 24 percent in 1950.They received just over 15 percent of the doctoral degrees in
∞≥∂ affirmative action in the united states
1920 but just under 10 percent in 1950.≥≤ In mathematics,women’s share of doctorates declined from 15 percent to 5percent over a period of decades, and in economics from 10percent to 2 percent.≥≥ There were similar declines in women’sshares of doctoral degrees in the humanities, law and chemis-try. For no year during the 1950s or 1960s did women receiveas high a percentage share of all master’s degrees, or of alldoctoral degrees, as they had back in 1930.≥∂
If statistical disparities between women and men are attrib-utable to discrimination by men, then this remarkable historywould suggest that men inexplicably became more discrimina-tory toward women during the first half of the twentieth cen-tury and then relented later in the second half, causing thetrend to reverse. However, this whole puzzling—and politi-cally inconvenient—question does not even arise in discussionswhere the educational and occupational history of women inthe early twentieth century is ignored and trends are plottedonly for the period since 1960. Such ignoring of an inconve-nient earlier history has been the rule, rather than the excep-tion, in discussions of discrimination against women and ofthe presumed need for affirmative action to overcome thatdiscrimination.
In reality, the fall and later rise of women in their educationand occupations, relative to men, is far more strongly corre-lated with demographic trends than with political, legal, orideological trends. As women began having fewer children—atrend that began in the nineteenth century and continued oninto the 1930s—they became better represented in higher lev-els of education and professional occupations. Then, whenbirth rates began to rise again, from the 1930s to the 1950s,≥∑
women began to be less well represented in these higher educa-tional and occupational levels. The role of men in all this wasprimarily that of fathers of the children born to women. Ifthis period of relative occupational retrogression were due tomen’s actions as employers, then it would be hard to see why
affirmative action in the united states ∞≥∑
the very same trends occurred in the hiring of faculty at wom-en’s colleges, run by women administrators.≥∏ Alumni of wom-en’s colleges, returning for class reunions in the later period,were often surprised to find male professors far more commonin women’s colleges than in the days when these alumni werestudents.
After the birth rate began to decline again in the 1960s,≥π
women’s representation in higher levels of education and oc-cupations began to rise again. The crucial role of marriage andchild-bearing on women’s economic level can also be seen bybreaking down the female population as a whole into thosewho do and those who do not become wives and mothers, thosewhose careers are continuous and those who interrupt their ca-reers to assume domestic responsibilities. As far back as 1971,women who remained unmarried into their thirties and whohad worked continuously since high school earned slightly more
than men of the same description.≥∫ Academic women whonever married averaged slightly higher incomes in 1968–69—before affirmative action—than academic men who nevermarried.≥Ω
Substantial male-female differences in income reflect thefact that most women do get married, do have children, and dointerrupt their careers for domestic responsibilities more oftenthan men do. Different occupations have different rates of ob-solescence of their respective skills, so that interruptions ofcareers in some fields are more damaging to one’s career thanin other fields. For example, a physicist loses about half thevalue of his or her knowledge from a six-year layoff, but it wouldtake a historian more than a quarter of a century to suffer asimilar loss.∂≠ Women tend to specialize in occupations wherecareer interruptions are easier to accommodate—teachingrather than computer engineering, for example.
Another factor in male-female differences in earnings isthat men tend to specialize more in hazardous occupationsthat pay higher compensation. Although men are 54 percent
∞≥∏ affirmative action in the united states
of the workforce, they account for 92 percent of job-relateddeaths.∂∞ Innumerable other economically relevant differencesbetween the sexes exist, even with men and women who seemto be ‘‘the same’’ superficially,∂≤ and whose different incomescannot therefore be automatically attributed to employerdiscrimination.
As for the effect of ‘‘women’s liberation’’ movements andgovernment legislation in increasing women’s income relativeto that of men, there is no evidence of any such trend for thosewomen who worked full-time and year around over the periodfrom 1960 to 1980.∂≥ What was happening over this span wasthat more women were working full time and year around,both absolutely and relative to men.∂∂ This says nothing abouthow employers were treating given women or how successful‘‘women’s liberation’’ was. A significant increase in the ratio offemale to male earnings began in the 1980s∂∑—during the Rea-gan administration—which is not when most feminists wouldclaim that their influence began to be felt.
While women are the largest group to whom affirmativeaction has been extended, there are others who have bene-fitted from similar extensions of this principle—and whoare similarly remote from the ‘‘legacy of slavery’’ rationale orrationales based on lingering effects of past discrimination.These include not only various immigrants from Latin Amer-ica, Europe and Asia, but also Eskimos who have been grantedpreferential status in Virginia, where it is doubtful that many oftheir ancestors ever lived, much less suffered discrimination.Even for women, the ‘‘lingering effects’’ of past discriminationargument is far less weighty than it is for blacks or AmericanIndians, for example. Since women are descended from menas well as women, there is no evidence that whatever disadvan-tages their mothers, grandmothers, etc., suffered had moreimpact on their current socioeconomic condition than the cor-responding advantages enjoyed by their fathers, grandfathersand other male ancestors.
affirmative action in the united states ∞≥π
Successive extensions of the principle of affirmative actionto more and more groups adversely affect both blacks andwhites. As of 1970, blacks were two-thirds of all people in racialor ethnic groups legally entitled to affirmative action but, aquarter of a century later, blacks were just 49 percent of suchgroups.∂∏ Moreover, this does not count the effect of the exten-sion of affirmative action to women, mostly white women. Withthe addition of women, what affirmative action amounts to islegalized discrimination against the residual non-preferredpopulation, mostly white males. None of this takes into accountthe illegal or semi-legal uses of affirmative action which haveoccurred in the United States, as in other countries.
Minority businesses preferentially awarded governmentcontracts, for example, can then turn over the actual work offulfilling those contracts to others, in essence collecting a roy-alty for letting non-minority firms rent their minority status toacquire business from the government. The ‘‘Ali-Baba’’ enter-prises found in Malaysia and Indonesia have their counterpartin American firms ostensibly owned by blacks but in fact servingas ‘‘fronts’’ for whites. A Baltimore grand jury was kept busy formonths exposing such fronts, and an investigation of ‘‘disadvan-taged business enterprises’’ in Indianapolis ended up decertify-ing more than one-third of all businesses with that designation.At the individual level, jobs, promotions and government con-tracts may go to people with only minute traces of some mi-nority ancestry—an entrepreneur who was 1/64th CherokeeIndian won a set-aside contract in California—or with theeffrontery to claim minority status fraudulently.∂π
The successive extension of preferred status to moregroups, both legally and illegally, not only dilutes the bene-fits for those for whom the original rationale is strongest,it changes the terms of competition in ways that can work tothe further disadvantage of genuinely less fortunate groups.For example, where group preferences must masquerade asanti-discrimination policies, employers have incentives to use
∞≥∫ affirmative action in the united states
employment and promotion criteria which can pass muster incourt, so as to avoid discrimination charges—whether or notthese are the best criteria for assessing the ability to do the jobsin question. Objective criteria, such as diplomas and degrees,thus acquire greater weight than they might otherwise have. Asin other countries, the genuinely less fortunate—black malesfrom the ghetto, for example—are less likely to have thesecredentials as compared to white women, who are also legallyentitled to affirmative action. Whether the advantages thatblack males acquire over white males, as a result of affirmativeaction, outweigh the disadvantages they have relative to whitewomen is an empirical question. But it is a question unlikely tobe asked.
PRIVATE BUSINESSES
In the United States, as in other countries, businesses closelycontrolled by government have tended to have different hiringstandards for different groups to a greater extent than busi-nesses operating more freely in a competitive marketplace. Inthe United States, blacks were more likely to be discriminatedagainst in government-regulated businesses before the civilrights era and more likely to received preferential hiring insuch businesses after that era. The telephone industry, beforethe break-up of the American Telephone & Telegraph Com-pany, was a classic example of a heavily regulated enterprisewith a monopoly in its markets nationwide.
As of 1930, there were approximately 235,000 telephoneoperators in the United States, of whom just 331 were black. Inall categories of telephone company employees, black maleswere 1.2 percent and black females 0.2 percent. Male em-ployees included many manual laborers doing such work asdigging holes for telephone poles, while the women were pre-dominantly operators.∂∫ As late as 1950, black women held onlyone percent of all jobs in the telephone industry nationwide. In
affirmative action in the united states ∞≥Ω
the South, few blacks were employed as telephone operatorsduring the entire decade of the 1950s and they failed to reacheven one percent as late as 1960. Between 1950 and 1960, thenumber of telephone operators employed in the Southernstates increased by 6,611, while the number of black telephoneoperators increased by just 20.∂Ω
Meanwhile, outside the South, the number of black tele-phone operators rose rapidly during the decade of the 1950s,both absolutely and relative to white telephone operators. Infact, the increase in the number of black telephone operatorsnationwide exceeded the total increase in the number of tele-phone operators nationwide. In short, there were dramaticchanges in the employment of black telephone operators dur-ing the decade of the 1950s, virtually all of it outside the South,with more than two-thirds of this increased employment ofblack women employed in the telecommunications industryoccurring in just five states—New York, Pennsylvania, Illinois,Michigan, and Ohio.∑≠ How can this pattern be explained—and what does it imply?
Although A.T.&T.’s nationwide operations, such as long-distance service, were regulated by the Federal Communica-tions Commission, the individual phone companies were regu-lated by their respective state governments. The immediatepostwar years saw changes in racial attitudes and in state anti-discrimination legislation∑∞—outside the South. The numberof black women working as telephone operators in New YorkCity, for example, tripled during the 1950s, even though thetotal number of telephone operators in the city remained vir-tually unchanged during that decade. In San Francisco, thenumber of black women hired as telephone operators tripledduring the same decade, while again the total number of tele-phone operators remained virtually unchanged. In Detroit, thenumber of black women who were telephone operators in-creased five-fold, despite a slight decline in the total numberof telephone operators in the city. No such dramatic changes
∞∂≠ affirmative action in the united states
occurred in such Southern cities as Atlanta, Birmingham,Dallas, or New Orleans, nor in such border state cities as St.Louis or Washington, D.C.∑≤
The point here is not to claim that these racial employmentpolicies were a direct consequence of orders from state regula-tory commissions. Prior to 1970, public utility commissionsgenerally did not seek to influence the racial hiring policies ofthe companies they regulated.∑≥ Instead, the point here is thatthe very fact of being a regulated public utility made prefer-ences for or against any given group less expensive than theywould have been in a free, competitive market. For a regulatedmonopoly, any additional costs associated with discriminationagainst qualified applicants could simply be passed on to cus-tomers. Thus it was virtually costless to discriminate againstblacks in an earlier era and it was virtually costless to show thempreferential treatment in a later era. In other words, publicutilities could reflect prevailing social views at little or no coststo themselves, whether those views favored or opposed the hir-ing of blacks.
To some extent, the same reasoning applies to non-profitorganizations, such as academic institutions, hospitals, andfoundations. Accordingly, it is not surprising that most Ameri-can colleges and universities had no black tenured professorsuntil 1940 and few black or Jewish professors at Ivy Leagueinstitutions until well after World War II. As of 1936, only threeblack Ph.D. holders were employed by all the white collegesand universities in the United States. By contrast, more thanthree hundred black chemists alone were employed in privateindustry at the same time.∑∂ To private industry, these blackchemists represented profits that could be made by hiringthem. But, to a college or university chemistry department,there was no such incentive and they could easily afford to passover these chemists.∑∑
In later decades, the evolution of affirmative action, along
affirmative action in the united states ∞∂∞
with the still surviving anti-discrimination laws, created a di-lemma for many businesses. If they failed to have ‘‘enough’’black employees, they were liable to be sued for discriminationby individual blacks, by civil rights groups, or by governmentagencies acting on their behalf. However, if they engaged inpreferential hiring of blacks, they could be sued for discrimina-tion by whites. Court decisions legitimizing affirmative actionunder prescribed conditions then provided businesses with aset of guidelines that could minimize their legal jeopardy.Therefore, when efforts were made to end group preferencesand quotas during the 1980s by some within the Reagan ad-ministration, big business support for the continuation of af-firmative action helped doom the efforts to rescind it.∑∏ Inaddition, large corporations tend to have their own internalaffirmative action officials and departments, with their ownvested interests in the continuation of such policies. In the year2000, several large corporations filed briefs supporting the con-tinuation of affirmative action at the University of Michigan.∑π
THE ACADEMIC WORLD
Nowhere is affirmative action more deeply entrenched than inthe academic world. Moreover, that world has a special impor-tance as the gateway to upward mobility. Various argumentshave been made for the admission of black, Hispanic, andAmerican Indian students to colleges and universities underlower standards than those applied to white or Asian Americanstudents. Chief among these is the claim that conventional cri-teria such as test scores and academic records do not revealthese students’ ‘‘real’’ ability or likelihood of success. Over theyears, this has been one of the most repeatedly studied—andrepeatedly refuted—claims. Black students with low test scoresdo not perform better academically than white students withthe same low test scores. On the contrary, black students tend
∞∂≤ affirmative action in the united states
to perform slightly less well than white students with the sametest scores—and this applies across the board, not just with low-scoring students.∑∫
Other claims made as rationales for preferential admissionsof black or other minority students have tended to be eithernot testable empricially or not to have been subjected to anyempirical test. One of these claims is that ‘‘diversity’’ enhancesthe educational experience for all students. Typical of thisgenre of claims was an article in The Chronicle of Higher Education
titled ‘‘Why Affirmative Action Works at Michigan’’—but thearticle in fact provided no empirical evidence of either why orwhether it ‘‘works’’ by any definable standard, but only assertionsand anecdotes.∑Ω
Often a related claim is made that black students must beadmitted in numbers sufficient to provide a certain ‘‘criticalmass’’ on campus that will enable individual black students tofeel socially comfortable and secure enough to be able to dotheir best work. Again, empirical evidence in support of thisproposition is neither asked nor given. Conceivably, one mightget data from colleges and universities with relatively few blackstudents and comparable institutions with more substantialnumbers of black students, and then compare these students’academic performances. Nothing of the sort has been done byproponents of the ‘‘critical mass’’ theory.
Alternatively, one might compare the academic perfor-mances of black students in past eras in predominantly whiteacademic institutions, where there were only a relative handfulof black students at the time, with the academic performancesof later generations of black students in the same institutionswhich now have a better approximation of the ‘‘critical mass.’’But this too remains undone. Nor is there any incentive for pro-ponents of affirmative action to do such studies when their un-substantiated assertions are so widely accepted and repeated.
Some data that might be relevant to the ‘‘critical mass’’theory come from the history of all-black Dunbar High School
affirmative action in the united states ∞∂≥
in Washington, D.C. Between 1892 and 1954, Amherst Collegeadmitted 34 graduates of this school. Of these, 25 graduatedfrom Amherst—74 percent of the admittees—and 21 percentof these black graduates were Phi Beta Kappas.∏≠ There werenever enough black students at Amherst during this period toconstitute a ‘‘critical mass.’’ The contrast between the aca-demic achievements of these early black pioneers at Amherstand the widespread academic failures of black students of alater era is much more consistent with the opposite theory ofJohn H. McWhorter, a black professor at the University of Cal-ifornia at Berkeley, that an anti-intellectual black subculturereduces black students’ performances well below what they arecapable of.∏∞ If so, then a ‘‘critical mass’’ is likely to be coun-terproductive academically.
Further evidence of the negative potential of a ‘‘criticalmass’’ comes from numerous reports by observers of black stu-dents in schools across the country that these students havedeveloped a habit of referring to fellow black students who areacademically oriented and academically achieving as ‘‘actingwhite’’—a charge that can bring anything from social ostra-cism to outright violence. A recent empirical study publishedby the National Bureau of Economic Research found that ‘‘ahigher percentage of Black schoolmates has a strong adverseeffect on achievements of Blacks and, moreover, that the effectsare highly concentrated in the upper half of the ability distribu-tion.’’∏≤ In other words, black students with higher ability per-form less well when there are more black students present.
Another bit of empirical evidence comes from a study of theacademic consequences of ability-grouping in schools, whichconcluded: ‘‘Schooling in a homogeneous group of studentsappears to have a positive effect on the achievements of high-ability students’ achievements, and even stronger effects on theachievements of high-ability minority youth.’’∏≥ In other words,black youngsters with high ability improve particularly wellwhen put among other high ability youngsters, rather than
∞∂∂ affirmative action in the united states
being educated in the presence of other students of lesser abil-ity. An intellectual critical mass produces opposite results from aracial critical mass.
Still another bit of evidence comes from a study of gradua-tion rates in state colleges and universities in Colorado. Thisstudy found that, in general, whites graduated at higher ratesthan blacks at most of the institutions studied. However, ‘‘forthe two instances in which blacks graduate at higher rates thanwhites, we are dealing with extremely small sample sizes for theblacks.’’∏∂ In short, it was precisely where they lacked a racial‘‘critical mass’’ that the black students did markedly better.
All this is more consistent with the McWhorter thesis thanwith the ‘‘critical mass’’ theory. However, it is not necessary toclaim that this evidence is conclusive or even to choose be-tween competing theories of the effects of a ‘‘critical mass’’ onblack students in a given institution. The more fundamentalpoint here is that the assumption that a ‘‘critical mass’’ is notonly academically beneficial, but academically essential, hasbecome prevailing dogma without empirical evidence beingasked or given.
A companion dogma is that black ‘‘role models’’ are essen-tial to the education of black students—another widely trum-peted belief for which evidence has seldom been asked norgiven. In 2003, long after ‘‘role models’’ had become a mantra,a survey of empirical studies concluded, ‘‘there is no systematicevidence that same-gender or same-race/ethnicity role modelshave significant influence on a range of dependent variablesthat they are assumed to influence, including occupationalchoice, learning, and career success.’’∏∑
Certainly most Dunbar High School students who suc-ceeded at Amherst College between 1892 and 1954 were un-likely to have seen a black professor. The spectacular rise of theNisei generation of Japanese Americans after World War IIcame at a time when they were at least equally unlikely to havebeen taught by a Japanese American teacher or professor, or to

affirmative action in the united states ∞∂∑
have seen or known a Japanese American scientist or engineer,since the majority of their parents were farmers.
Although racial preferences and quotas in admissions toAmerican colleges and universities began in the 1960s, usuallywithout much real discussion of pro’s and con’s—and withinstant dismissal of any critics, some of those critics neverthe-less made the case against such preferences at length and withconsiderable logical and empirical support. One of the mostcogent of these critics was Professor Clyde W. Summers of theYale Law School. Like many other critics of affirmative action,Professor Summers had in previous years written in oppositionto discrimination against blacks, even before that was a popularposition to take.∏∏ Nor was he entirely comfortable when find-ing himself now arguing against affirmative action:
Anyone who is at all aware of our historic brutal discriminationagainst minority groups, and is sensitive to our continued patternof deprivation, wants to believe in measures which promise toopen doors of opportunity and provide some recompense for pastinjustices. To raise questions about this program in which so manyso deeply believe almost inevitably leads to misunderstanding, nomatter how one tries to make himself understood. More trouble-some, what one writes may be seized upon and used by those whoseek excuses for doing nothing and thus preserving the presentpattern of deprivation.∏π
Summers called preferential admissions policies ‘‘an unrealsolution to a real problem.’’ His first objection was that prefer-ential admissions, beginning at the top elite institutions, wouldcreate a nationwide mismatching of minority students and theinstitutions they attended, all up and down the academic peck-ing order. Since his own field was law, he illustrated the patternwith the admissions policies of law schools:
If Harvard or Yale, for example, admit minority students with testscore 100 to 150 points below that normally required for a non-minority student to get admitted, the total number of minority
∞∂∏ affirmative action in the united states
students able to get a legal education is not increased thereby.The minority students given such preference would meet the nor-mal admissions standards at Illinois, Rutgers or Texas. Similarly,minority students given preference at Pennsylvania would meetnormal standards at Pittsburgh; those given preference at Dukewould meet normal standards at North Carolina, and those givenpreference at Vanderbilt would meet normal standards at Ken-tucky, Mississippi and West Virginia. Thus, each law school, by itspreferential admission, simply takes minority students away fromother schools whose admissions standards are further down thescale. . . . In sum, the policy of preferential admission has a perva-sive shifting effect, causing large numbers of minority students toattend law schools whose normal admission standards they do notmeet, instead of attending other law schools whose normal stan-dard they do meet.∏∫
Because of this ‘‘pervasive shifting effect,’’ minority stu-dents would find themselves in serious academic difficulties allup and down the scale of law schools and other institutions,because they would be systematically mismatched with institu-tions at all levels. Put bluntly, many minority students with allthe prerequisites for success would be artificially turned intofailures because of this pervasive mismatching. This argumentwould for decades remain at the heart of objections to affirma-tive action. Attempts to get data on which to confirm or refutethis argument were met by blanket refusals of academic author-ities to release such information. Instead, there were assur-ances issued that no ‘‘unqualified’’ students were being admit-ted—a virtually meaningless statement when coming fromthose who arbitrarily define what ‘‘qualified’’ meant, withoutrevealing what that definition is.
Despite academic policies secreting the data needed to re-solve this key issue, some such data did become public, in oneway or another. Almost invariably, such data completely under-mined the academic defenders of affirmative action.
At the University of California at Berkeley, for example, a
affirmative action in the united states ∞∂π
1988 study showed that the average composite Scholastic Apti-tude Test scores of black undergraduates was 952, which wasabove the national average of 900, but well below the univer-sity’s average of 1232 for white students and 1254 for AsianAmerican students. Black students with above-average SATscores cannot be called ‘‘unqualified’’ but they were certainlymismatched—and 70 percent of black students failed to grad-uate from Berkeley. Despite rising numbers of black students atBerkeley during the 1980s, the number of black graduates de-clined.∏Ω At M.I.T., the average black student’s math SAT scorewas in the top 10 percent nationwide—and in the bottom 10percent at M.I.T. Nearly one-fourth of these extraordinarilyhigh-ranking black students failed to graduate from M.I.T.π≠
At the University of Texas, where the average SAT score ofblack undergraduates was more than 100 points below that ofwhite undergraduates, the grade point average for black fresh-men was 1.97, compared to 2.45 for white freshmen.π∞ At theGeorgetown University Law School, the median test score ofblack students on the Law School Aptitude Test was at the 75thpercentile—again, hardly ‘‘unqualified,’’ but that score waslower than the score of any white student admitted to this elitelaw school.π≤ Incidentally, the student who released this George-town data was denounced as ‘‘racist’’ in the national media, aswell as on campus, despite a lack of any evidence of racism,unless the release of the data is arbitrarily defined that way,making the whole argument circular.
As Professor Summers had predicted, the failures were notconfined to the elite institutions. Thus San Jose State Univer-sity had 70 percent of its black students fail to graduate, justlike Berkeley,π≥ though it is doubtful that the minority studentsat Berkeley would have failed at San Jose State. That is thedomino effect of mismatching. Moreover, these costs of affir-mative action would not stop with unnecessary academic fail-ures among minority students.
Professor Summers and others predicted, back in the 1960s,
∞∂∫ affirmative action in the united states
that black students who were completely overmatched at manycolleges and universities, would not only find their positionintolerable, but would then proceed to find academic standardsand much else about academic life intolerable, leading to a shiftof their focus from academics to ideological crusades on cam-pus and beyond. Demands for ‘‘relevant’’ courses, black studiesdepartments, and quota hiring of black faculty without regardto ‘‘irrelevant’’ academic credentials proliferated across thecountry, often backed up by campus disruptions and violence.As in other countries, the illusion of being able to control thecourse of events from the top down under affirmative action waspainfully dispelled.
Easier courses in black studies and in some other depart-ments were accompanied by what Harvard professor DavidRiesman called ‘‘affirmative grading.’’ Many professors inflatedgrades all around, reducing failure rates and making most stu-dents A students. The credible threats represented by orga-nized black students also tended to lead to preferential treat-ment of behavioral offenses.π∂
White students were not unaware of all this. As Summersand others had predicted in the 1960s, whites who saw theirblack classmates consistently at the bottom academically andallowed to get away with things that would not be tolerated inothers, began to manifest increasingly negative attitudes, de-spite draconian punishments for saying or doing anything thatcould be construed as ‘‘racism.’’ White students on a numberof campuses have had outbursts of violence against black stu-dents of a sort unknown on those campuses in the era beforepreferential admissions programs and double standards oncampus.π∑ Even in the absence of overt hostility, black studentsat M.I.T. complained that other students there did not regardthem as being desirable partners on group projects or as peo-ple to study with for tough exams.π∏ Similar reports came fromother academic institutions—and from black professors as wellas black students. Blacks regarded as ‘‘quota’’ professors have
affirmative action in the united states ∞∂Ω
complained of being less often invited to collaborate on re-search, which is crucial to their advancement.ππ Even liberalacademic supporters of affirmative action began commentingon the increasing hostility toward black students on campusand coined the term ‘‘the new racism.’’π∫
At the heart of the problem, for both black students andblack professors, is the unyielding fact that the numbers whohave the credentials required for being at selective institutionsare nowhere near the numbers required for fulfilling arbitraryquotas based on their ‘‘representation’’ in the population atlarge. As far back as 1969, those black professors with Ph.D.sfrom top universities and numerous publications were earningmore than white professors of the same description.πΩ It was justthat there were not very many black professors like this. Theproblem was not discrimination, but inadequate numbers withthe requisite qualifications.
Similarly with black students. When elite law schools beganadmitting black students preferentially in the 1960s, the totalnumber of black students who met their usual standards whomet their usual standards on Law School Aptitude test scoresand grade-point average was 39—in the entire country.∫≠ Twodecades later, there were just sixteen.∫∞ At the college level, thenumber of black students who scored 650 or higher on theverbal SAT was less than 700 nationwide in 1995.∫≤ Most IvyLeague institutions average at least 650 in verbal SAT scores.But there are not enough black students in the whole countrywith a 650 verbal SAT score to be admitted to the eight IvyLeague institutions in proportion to their ‘‘representation’’ inthe general population, much less to other elite institutionsfrom coast to coast.
Although test scores and grade-point averages were pooh-poohed as predictive factors by advocates of affirmative action,early factual studies showed the standing of black law schoolstudents averaging at the 8th percentile.∫≥ That is, 92 percentof their classmates had better academic performance in law
∞∑≠ affirmative action in the united states
schools. Moreover, disproportionately higher numbers of blacklaw school graduates failed the bar exam and disproportion-ately higher numbers of black medical school graduates failedmedical licensing board exams.∫∂ In the face of such mountingevidence, in medicine, law and other fields, defenders of affir-mative action have argued that black doctors, lawyers and otherprofessionals are so much needed in black communities that itwas still a good thing for them to be preferentially admitted tocolleges, graduate schools and professional schools. ∫∑ Nor hasthis argument been forced to confront the fact that many doc-tors who are not black serve in inner city hospitals, with noevidence that black patients are any the worse for that.
One example who was repeatedly singled out over the yearsas a justification for affirmative action was a young black mannamed Patrick Chavis, who had been admitted under affirma-tive action to the medical school at the University of Californiaat Davis, where Allan Bakke had been initially rejected. Chavishad gone back to practice medicine in the black community, incontrast to Bakke, who went on to become an anesthesiologistin Minneapolis after graduating from the same medical school,to which he was admitted in the wake of the landmark SupremeCourt case that bears his name. Senator Edward Kennedy ofMassachusetts was among the many people who extolled Cha-vis as an example of what affirmative action was meant to ac-complish. The Lawyers Committee for Civil Rights made theusual comprison between Chavis and Bakke—to Chavis’ advan-tage—in 1997, just two weeks before the Medical Board ofCalifornia suspended Chavis’ license to practice medicine inthe wake of a suspicious death of one of his patients.∫∏ TheBoard cited Chavis’ ‘‘inability to perform some of the mostbasic duties required of a physician,’’ according to an admin-istrative law judge when he ordered the emergency suspensionof Chavis’ license.∫π A year later, after a fuller investigation ofhis treatment of several patients, Chavis’ license was revoked.∫∫
Those who had been using Chavis as an example before
affirmative action in the united states ∞∑∞
now switched to the position that one isolated example doesnot prove anything. Unfortunately, Chavis was not an isolatedexample. Plans to use double standards to maneuver black stu-dents through medical school were reported to me back in1969 and published in a 1972 book of mine.∫Ω Four years later,Professor Bernard Davis of the Harvard Medical School re-ported in the New England Journal of Medicine that black stu-dents there and at other medical schools were being granteddiplomas ‘‘on a charitable basis.’’ He said, ‘‘It is cruel to admitstudents who have a very low probability of measuring up toreasonable standards’’ and that it was ‘‘even crueler to abandonthose standards and allow the trusting patients to pay for ourirresponsibility.’’Ω≠ The only response to his revelations was apredictable denunciation of him as a ‘‘racist.’’
Discussions of college admissions policies often proceed asif the issue is the distribution of benefits to various applicants,when in fact the issue is selecting those applicants who can bestmaster the kind and level of academic work at the particularinstitution. Those who see the issue as distributing benefits toapplicants object to admissions ‘‘criteria that benefit primarilywhite middle-class students.’’Ω∞ Arbitrarily focussing on dif-ferent groups of applicants ignores those who have the largeststake of all—in this case, people needing medical attention. Inother fields as well, it is the ignored third parties who have thebiggest stake in what institutions of higher learning do and howwell they do it. Applicants for engineering schools do not havenearly as large a stake as those millions of other people whoselives depend on the quality of the engineering that goes intothe bridges they drive across or the planes they fly in or theequipment they work with.
Colleges and universities were not created to distribute ben-efits to applicants but to develop minds and create skills thatserve society at large. The criteria that matter are the criteriawhich best enable these institutions to carry out that respon-sibility. Such a responsibility cannot be subordinated to the
∞∑≤ affirmative action in the united states
impossible task of equalizing probabilities of academic successfor people born and raised in circumstances which have handi-capped their development, even if for reasons that are not theirfault and are beyond their control. Perhaps if we were capableof fully understanding everything that had happened to Pat-rick Chavis from the moment he was born, we might judge himless harshly. But the role of academic institutions is not to playGod in judging individual souls. It is, among other things, tosee that people like Patrick Chavis do not end up with scalpelsin their hands and ‘‘M.D.’’ after their names to lure unsuspect-ing patients to their deaths.
Empirical Studies
While many of the crucial assumptions behind preferencesand quotas are widely accepted without evidence being askedor given, there have been some empirical studies which bear onthese assumptions. However, the same uncritical acceptancewhich has allowed conclusions favorable to affirmative actionto prevail without evidence has also allowed studies done inquestionable ways to be accepted as proof when those studiesreached conclusions favorable to the continuance of grouppreferences and quotas.
One of the most widely praised of these exercises in defenseof affirmative action in the academic world was the 1998 bookThe Shape of the River by former university presidents WilliamBowen and Derek Bok, of Princeton and Harvard, respec-tively.Ω≤ This book’s premise was that admitting black applicantsto colleges and universities with lower qualifications than thoserequired of other applicants has not produced the bad resultsclaimed by critics of affirmative action. The authors mobilizedand displayed voluminous statistics, in an attempt to show thatsuch students succeeded academically and succeeded laterin life. Unfortunately, however, these many statistics, tables,graphs and equations were not about black students who were
affirmative action in the united states ∞∑≥
admitted with lower qualifications than other students. Theywere about black students in general in the institutions cov-ered, including black students admitted under the same standards as
white students. This much-touted study is Hamlet without theprince of Denmark.
The controversies about preferences and quotas in collegeadmissions are not about whether any black students should beadmitted to colleges, but is precisely about the admission ofthose particular black students who do not meet the normalstandards applied to other students at the particular institu-tions they attend. The failure of Bowen and Bok to single outsuch students raises the first of many serious questions abouttheir study—especially since other studies have separated outsuch students and found the opposite of what Bowen and Bokclaim to have found. Submerging black students who were ad-mitted with lower qualifications in broad statistics about blackstudents in general is particularly suspicious when the raw databehind the published numbers are not available to others, whomight break down the statistics differently and get at the keyinformation that these authors excluded. Scholars whose re-quest for the same data was flatly denied noted that Bowen andBok had ‘‘access to student records that schools have nevermade available to investigators before.’’Ω≥ While the institu-tional decision to release this data only to two long-time de-fenders of affirmative action raises doubts, the way the statisticswere then used casts a further cloud over the Bowen-Bok study.
The sample used in the Bowen-Bok study consists of 24private and just 4 public institutions of higher education, whenin fact only 9 percent of black students attend private institu-tions, which constitute the bulk of the Bowen-Bok sample.Ω∂
Moreover, other minorities such as Hispanics and Asians areomitted from the study. As for the black students in this sample,64 percent had at least one parent who had graduated fromcollege—more than five times the proportion among all black,college-age youths.Ω∑ In short, Bowen and Bok used a highly
∞∑∂ affirmative action in the united states
atypical sample of minority students attending highly atypicalcolleges and universities—and from this they draw conclusionsabout affirmative action admissions policies in general, despitea pro forma caveat against this early in the preface.Ω∏
More specifically, Bowen and Bok deny the claims of criticsof affirmative action that minority students admitted underlower standards (1) do not perform as well as other students,(2) do not survive to graduate as often, and (3) do not do aswell in their post-college careers. The key problem seen bythese critics is that minority students admitted to elite institu-tions under lower standards are mismatched, rather than un-
qualified, and could have been more successful at other institu-tions geared to students of their own academic ability levels,many of which colleges and universities are good institutions.In short, the argument is that there is no point failing at a big-name institution when you can succeed at a good quality in-stitution without such a big name.
How do Bowen and Bok answer such critics of preferentialadmissions policies? First of all, The Shape of the River rede-fines preferences and quotas as ‘‘race-sensitive admissions,’’and Bowen and Bok say that they are against ‘‘quotas’’—whichapparently means that they are against the word ‘‘quotas,’’since they make the usual arguments for numerical representa-tion and assert (without evidence) the educational benefits of‘‘diversity.’’
Their most triumphant finding is that black students ‘‘grad-uated at higher rates, the more selective the school that theyattended’’ (emphasis in the original).Ωπ The implication is thatmismatching does not hurt black students’ prospects of gradu-ating, after all. But closer scrutiny reveals a very different story.
As Bowen and Bok themselves say elsewhere: ‘‘There hasbeen a much more pronounced narrowing of the black-whitegap in SAT scores among applicants to the most selective col-leges.’’Ω∫ This is substantiated more clearly by data from others’research, which show that the gap between black and white
affirmative action in the united states ∞∑∑
composite SAT scores has been 95 points at Harvard but 184points at Duke and 271 points at Rice.ΩΩ The crucial question isnot how selective the college is, but how wide is the gap be-tween the qualifications of its black students and the normalstandards of the institution, as indicated by the qualifications ofthe other students.
A study of racial differences among students in state col-leges and universities in Colorado found that, although ingeneral a higher percentage of whites than blacks graduatedwithin a six-year period, 50 percent of blacks and 48 percent ofwhites graduated within that span at the University of Coloradoat Denver, where the difference in SAT scores was only 30points. Where there were negligible differences in test scores,there were negligible differences in graduation rates. In Colo-rado, it so happened that there were smaller differences in testscores at the lower ranked institution. At the flagship Univer-sity of Colorado campus at Boulder, where the test score differ-ence between blacks and whites was more than 200 points, only39 percent of the black students graduated, compared to 72percent of the whites.∞≠≠
Clearly racial preferences were greater at the University ofColorado at Boulder, where 75 percent of both black and whiteapplicants were accepted, despite a 205-point difference inSAT scores. Meanwhile, at the University of Colorado at Den-ver, only 68 percent of black applicants were accepted, com-pared to 82 percent of white applicants, leading to a studentbody with only negligible differences in test scores betweenblack and white students—and negligible differences in gradu-ation rates.
A study of five state-run medical schools around the coun-try found similar patterns. Among these five medical schools,black-white differences in scores on the Medical College Ad-mission Test were greatest at the medical school at the StateUniversity of New York in Brooklyn and least at the medicalschool at the University of Washington. The racial difference in
∞∑∏ affirmative action in the united states
the percentage of students later passing the U.S. Medical Li-censing Examination was likewise greatest at SUNY Brooklyn(20 percentage points’ difference) and least at the Universityof Washington (9 points’ difference). Even this understatesthe difference between these institutions, since 25 percent ofthe black medical students at SUNY Brooklyn did not even takethe U.S. Medical Licensing Examination, compared to 10 per-cent at the University of Washington.∞≠∞
Although blacks in general have had a higher rate of dis-missal from medical residency programs than other groups,those particular blacks with academic credentials comparableto whites have had dismissal rates comparable to whites. Al-though black physicians in general obtained board certificationonly half as often as white physicians, those black physicians whohad college grades and Medical College Admissions Test scorescomparable to those of white physicians actually obtainedboard certification more often than whites.∞≠≤ In short, the cru-cial factor in the success or failure of black students has not beenwhether an institution was highly ranked or lower ranked, butwhether the gap between the qualifications of black and otherstudents was large or small. Bowen and Bok, however, considertheir sample results ‘‘much more conclusive’’∞≠≥ than otherstudies—though apparently not so conclusive that the raw datacan be allowed to be seen by other researchers. Yet their resultsnot only differ from what others have found in studies of par-ticular institutions, they differ from national patterns:
Blacks with SAT scores between 851 and 1,000 have a 77percent graduation rate from colleges whose overall SAT averageis 900. By contrast, blacks who score between 700 and 850 on theSAT graduate from those same schools only 56 percent of thetime, and blacks whose SAT scores are below 700 have just a 38percent chance of graduating.∞≠∂
The institutions compared by Bowen and Bok differ inmore than just test scores. The most selective group of institu-
affirmative action in the united states ∞∑π
tions—Yale, Stanford, Princeton and the like—averaged anundergraduate student body of fewer than 3,000 students,while the least selective group of institutions in this particularsample—Michigan, Penn State, University of North Carolina atChapel Hill, etc.—averaged more than 13,000 undergradu-ates. Indeed, the largest number of undergraduates on anycampus in the first group was smaller than the median numberof undergraduates on campuses in the second group. More-over, even the least selective set of institutions in the Bowen-Bok sample are by no means mediocre. They appear regularlyin various lists of leading American universities and no oneconsiders them ‘‘average.’’
Given this context, what the Bowen and Bok data show isthat, within a very narrow range of institutions, black studentswho attend the most elite institutions, whose average size is lessthan one-fourth of that in another set of elite institutions, grad-uate at a higher rate. This may say more about large versussmall undergraduate institutions, especially for students whomay need more individual help from their professors, thanabout anything else. A well-known study of college studentsfound that their satisfaction with faculty was inversely related tothe size of the college or university.∞≠∑
Data from other sources reinforce the importance of col-lege size in the survival rates of black students. For example, 13percent of black students at Stanford failed to graduate in sixyears, compared to 42 percent who failed to graduate in thesame time at the University of California at Berkeley. Therewere nearly three times as many undergraduates at Berkeley asat Stanford and the student:faculty ratio at Berkeley was morethan double the Stanford ratio. Similarly, 12 percent of blackstudents attending Yale failed to graduate in six years, com-pared to 41 percent at the University of Michigan at Ann Ar-bor. Here again, Michigan’s student:faculty ratio was morethan double that at Yale and there were four times as manyundergraduates at Ann Arbor.∞≠∏
∞∑∫ affirmative action in the united states
The conclusions of the Bowen-Bok study are further under-mined by the nature of their sample of institutions, as well as bytheir atypical sample of students. Because their comparison isbetween different sets of elite institutions with differing averageSAT scores, but with all having scores above the national aver-age, this creates what statisticians call the ‘‘restricted range’’problem. You cannot tell the general importance of some fac-tor by seeing what difference it makes in a sample where there isonly a very limited range of variation in that factor. For exam-ple, you may find very little correlation between height andperformance among professional basketball players, but pro-fessional basketball players as a group are much taller thanmost other people, so the fact that a player who is 6 foot 11inches tall is just as good as another player who is 7 foot 2 inchestall does not disprove the role of height in basketball. No onewould hire a midget to play professional basketball because of alow correlation between height and performance among exist-ing basketball players.
Bowen and Bok point out that even the lowest scoring blackstudents graduate at a higher rate in their sample of the mostelite institutions than in the other elite institutions in theirsample.∞≠π This might be more weighty evidence if was not (1)based on such an atypical sample of students and institutions,and (2) contradicted by so much evidence based on others’statistics that were not such tightly held secrets.
What makes affirmative action urgently needed, accordingto Bowen and Bok, is that (1) without it, few black studentswould be admitted to the most elite colleges and universitiesand that (2) these particular institutions are the gateways tohigh-level professions in which blacks are currently under-represented, so that otherwise these young blacks’ prospectsare bleak. A critic has parodied this argument as suggesting that‘‘It’s Yale or jail.’’ So long as the big-name colleges and univer-sities are able to acquire a disproportionate share of the best-qualified black students, it should not be surprising that such
affirmative action in the united states ∞∑Ω
students do well after graduation. The only meaningful ques-tion is whether such students would have done well at othercolleges whose normal admissions standards they met. Manylesser known colleges have outperformed big-name collegeswhen it comes to getting their graduates into top postgraduate,earning Ph.D.s, or ending up in Who’s Who in America.∞≠∫
In the case of black students, there is a whole history oftheir going to predominantly black colleges—none of which isranked in the top tier—for generations on end. Today, blackcolleges enrol only about one-fourth of all black students inhigher education, but their graduates receive 40 percent of allscience and engineering degrees received by black studentsnationwide. Of the ten undergraduate institutions whose blackstudents go on to receive the most Ph.D.s in science, six areblack institutions.∞≠Ω Apparently it is not Yale or jail, after all.In fact, none of the institutions in the large Bowen-Bok samplewas among the top ten as the undergraduate home of blackPh.D.s—and only one—the University of Michigan—was amongthe top eighteen.∞∞≠ Again, what is salient is not simply that theBowen-Bok thesis is inconsistent with the empirical facts butthat it was so widely accepted with the relevant facts being nei-ther asked for nor given.
Post–Affirmative Action Results
In 1995, racial preferences and quotas in university admis-sions were banned by the Regents of the University of Cali-fornia, and in 1996 a statewide referendum confirmed thatban. In Texas, the Fifth Circuit Court of Appeals banned pref-erential admissions at the University of Texas Law School in1996. In both states, there were predictions of dire conse-quences. President Bill Clinton said that the California ban ongroup preferences would ‘‘resegregate’’ the universities.∞∞∞
Jesse Jackson likewise spoke of a ‘‘radical resegregation of ourschools and reduction in opportunity’’∞∞≤ and called the ban on
∞∏≠ affirmative action in the united states
affirmative action ‘‘ethnic cleansing.’’∞∞≥ Much the same mes-sage was echoed by many others.
What actually happened?Black freshmen enrolment in the flagship of the University
of California system—the Berkeley campus—dropped sub-stantially. So did black freshmen enrolment at the other lead-ing campus of the system, UCLA. However, these did not repre-sent similar reductions in the total number of black freshmengoing to college in the University of California system as awhole. Moreover, the UC system is not the only state-supporteduniversity system in California. There is also the CaliforniaState University system, which in fact enrolls more students.∞∞∂
Within the University of California system as a whole, theenrolment of black freshmen dropped from 917 in 1997 to739 the following year but rose again to 832 in the year 2000—a decline of 9 percent over this period—and then rose to 936in 2002. While there was only a temporary and relatively mod-est decline in the number of black freshman throughout theUniversity of California system as a whole, on the flagshipBerkeley campus the decline was much sharper, from 222 in1996 to 122 by 1999 and the recovery was only to 142 by theyear 2002. At UCLA, the decline from 230 black freshmen in1996 was likewise never fully recovered and by 2002 there werejust 161 black freshmen on that campus. However, on someother campuses within the University of California system—Santa Barbara, Riverside, Irvine, Santa Cruz—there were in-
creases in the number of black freshmen.∞∞∑ What this meant wasthat black students redistributed themselves within the Univer-sity of California system, with no net decline at all between1996 and 2002. It was much the same story in the CaliforniaState University system, where there were more black freshmenenrolled in 2002 than there had been back in 1996, before theend of affirmative action∞∞∏—a fact receiving remarkably littleattention or comment in the media, which had widely pub-
affirmative action in the united states ∞∏∞
licized earlier hysterical claims about an impending ‘‘resegre-gation’’ of higher education.
In the University of Texas system, there was likewise a de-cline in black undergraduate enrolment at the flagship campusin Austin, but a rise on almost every other campus. In 1996,there were 1,479 black undergraduates enroled on the Austincampus and that fell to 1,298 by 2000—a decline of 12 per-cent. But, for the University of Texas system as a whole, the totalnumber of black undergraduates rose from 5,250 to 5,657.∞∞π
Although the total number of undergraduates in the systemalso rose over these same years, black undergraduates never-theless increased from 4.6 percent of all undergraduates to4.8 percent.
In short, despite many hysterical media reports and direpredictions of minorities losing ‘‘access’’ to higher education inthe wake of bans on affirmative action, there were very modestchanges in the numbers and proportions of black students inthe state university systems of both California and Texas—and,in the end, a rise. The more substantial change was in blackstudents’ redistribution among the campuses within these sys-tems. The crucial question, however, is not how many black orother minority students are on campus at any given moment,but how many graduate. There may well be more minority grad-uates, now that minority students are no longer so mismatchedwith the institutions they are attending. Existing data on varia-tions in test score differences and graduation rate differencesalready point in that direction. But data on survival to gradua-tion have not yet been forthcoming—and may never be forth-coming, if such data substantiate what critics of affirmative ac-tion have been saying for decades.
While there are more data available for making compari-sons between blacks and whites than among other racial orethnic groups, there is also a vast amount of data on AsianAmericans. However, proponents of affirmative action tend to
∞∏≤ affirmative action in the united states
avoid discussing Asian Americans, even though Asian Ameri-can experiences might be very relevant to testing many of thetheories behind affirmative action. Indeed, the experiences ofAsian Americans often flatly contradict much that is said bythose making a case for affirmative action.
For example, black-white differences in test scores are oftenattributed to cultural biases in the test favoring white, middle-class students. Yet a higher percentage of Asian Americans stu-dents score above 700 on the mathematics SAT than amongwhites. Despite an emphasis on the lower incomes of the fam-ilies of black students, as a factor in these students’ lower testscores, Asian American students from families with low in-comes average higher scores on the mathematics portion of theSAT than black students from high-income families.∞∞∫ Claimsof culturally biased tests are also used to back up the claim thatthese tests under-estimate the future performances of blackstudents. Although such claims have been refuted repeatedlyfor black students, it is a claim that has in fact turned out tobe true for Asian American students, who outperform whiteswith the same IQs in academic institutions and in their latercareers.∞∞Ω But those who use the unsubstantiated allegationthat blacks will perform better than their scores indicate, andso should be admitted to colleges and universities with lesserscores than whites, never use the empirically verified fact thatAsian Americans perform better than whites with the samescores to argue for larger quotas for Asian Americans.
Finally, the argument is often made that objections to affir-mative action are due to ‘‘angry white males’’ who resent blackstaking places in college that would normally go to them. Inreality, Asian Americans take more places than blacks in manyleading colleges and universities—and especially in engineer-ing schools. They have outnumbered blacks at seven of theeight Ivy League colleges and on all nine campuses of the Uni-versity of California, as well as at Stanford, the University ofChicago, and Cal Tech, among other places. Yet there is no
affirmative action in the united states ∞∏≥
such backlash against Asian Americans, who are admitted with-out any group preferences and quotas. This suggests that it isnot the places but the processes that are resented. Again, how-ever, it is not a question of one set of evidence against another,but of one set of beliefs becoming prevailing dogma withoutevidence being either asked or given.
SUMMARY AND IMPLICATIONS
In the United States, as in other countries, the rationale foraffirmative action has had little to do with its actual operation orconsequences. Supposedly a means to redress the harm createdby discrimination in the past, preferences and quotas estab-lished under affirmative action policies require neither the in-dividual beneficiary nor even the group from which that indi-vidual comes to demonstrate any specific harm from priordiscrimination. Thus recent immigrants from Asia or LatinAmerican are eligible for affirmative action benefits in theUnited States, though obviously there was no past discrimina-tion against these individuals or their forebears in this country,simply because they were not living in this country. Moreover,even among blacks, benefits to black millionaires under af-firmative action are far more demonstrable than benefits toblacks in poverty. Rationales produce political support but thepolicy produces results far removed from those rationales.
The costs of affirmative action are as seldom scrutinized asto the benefits or alleged benefits. Among the costs are loweredstandards of performance in order to get numerical results.Moreover, these standards are sometimes lowered for all, inorder to avoid the political embarrassment or legal liability ofobvious double standards for favored groups. Grading systemsmay be changed to pass-fail or grade inflation may occur allaround. Physical strength requirements may be reduced, sothat more women can be hired, but if that requirement is re-duced for all, then that can lead to more men, as well as women,
∞∏∂ affirmative action in the united states
with inadequate strength in such life-and-death occupations asfirefighters, soldiers, or policemen. Indeed, there may be morelow-performing men than low-performing women in somefields after the physical standards are lowered to allow morewomen to become eligible.
In addition to the hostilities between groups created orexacerbated by preferences and quotas in other countries, af-firmative action in the United States has made blacks, who havelargely lifted themselves out of poverty, look like people whoowe their rise to affirmative action and other government pro-grams. Moreover, this perception is not confined to whites. Ithas been carefully cultivated by black politicians and civil rightsleaders, who seek to claim credit for the progress, so as to solid-ify a constituency conditioned to be dependent on them, aswell as on government.
In this context, there has been a virtual moratorium onrecognition of achievements by blacks, except in so far as theyare collective, political milestones or otherwise serve currentideological or political interests. Thus, despite much hand-wringing and finger-pointing over the abysmal education per-formances of black students in ghetto schools, there has beenat best utter indifference among black organizations and move-ments to documented examples of black schools that havebeen academically successful.∞≤≠ Nor has there been much in-terest in the fact that some very ordinary black schools inHarlem performed as well on city-wide tests in the 1940s as thepredominantly white working class schools on the lower eastside of Manhattan—much less that a black high school inWashington outperformed most white high schools in D.C. asfar back as 1899.∞≤∞ While the rise of many prominent individ-uals from the lower east side of Manhattan has been justly cele-brated, there has been little or no interest in blacks who havedone the same thing, for that would be a distraction from thepolitics of grievance and demands.
The transparent dishonesty with which quotas and pref-
affirmative action in the united states ∞∏∑
erences have been instituted and maintained—a dishonestyreaching into the highest court in the land, as the Weber case,among others, demonstrates—has produced cynicism and bit-terness. As another insult added to injury, airs of moral superi-ority on the part of those perpetrating deception add to a gall-ing sense of grievance among many people who are part of thenon-preferred population. That all of this has done relativelylittle for the genuinely poor in ghettos and barrios across theUnited States is part of the painful irony of the situation.
Many defenders of affirmative action ignore or dismiss un-welcome facts in favor of more palatable assumptions. Thus,higher failure rates for blacks on bar exams or medical boardexams are taken as evidence that there is something wrong withthose exams. Fewer blacks made partners in big law firms meanthat there is something wrong with those law firms∞≤≤—and soon down the line. The very possibility that preferential policiesmay have put some people in settings where their chances ofsuccess are reduced is arbitrarily banished from the realm ofpossibility. Affirmative action continues to be judged by its ra-tionales, rather than its results.
chapter 7
The Past and the Future
If studying history is one way to avoid repeating it, there ismuch in the history of affirmative action policies aroundthe world that should never be repeated. In too many coun-
tries, such policies have turned out to be ways of producingrelatively minor benefits for a few and major problems for so-ciety as a whole. Both advocates and critics of such policies havetended to over-estimate the benefits that have been transferred.Moreover, the distribution of benefits from group preferencesand quotas often shows the same disparities as the broadersocial inequalities which they are supposed to be remedying.
Allowing black millionaires in the United States to havepreferential access to the purchase of radio station licensesdoes not reduce inequality among Americans, nor does it ben-efit people living in ghettos. Affirmative action does little forthe poor in America, as elsewhere. The poverty rate amongblacks was cut in half before there was affirmative action andhas changed very little since then.
Whatever the peculiarities of particular countries, the gen-eral patterns which have emerged in one country after anotherstrongly suggest that similar incentives and constraints tend toproduce similar consequences among human beings in widelydisparate circumstances. The fact that so many of these conse-
the past and the future ∞∏π
quences were not anticipated by those who promoted grouppreferences creates a painful contrast with the confident andsweeping assertions with which such policies were often begun.Those who thought that they were directing the course ofevents often discovered that they had simply opened the flood-gates and that events were taking a course far different fromwhat had been envisioned.
The spread of preferences from group to group and fromactivity to activity is just one symptom of the floodgates’ beingopen. The whole mindset behind preferences and quotas hasspread as well. France has passed a law requiring political par-ties to have equal numbers of male and female candidates.∞ InPakistan, places have been reserved in educational institutionsfor the children of ‘‘sportsmen,’’ military officers, governmentemployees, attorneys, doctors, and university employees.≤ TheAmerican Society of Newspaper Editors keeps statistics onthe percentage of minority journalists—out to two decimalplaces—lamenting a decline in ‘‘journalists of color’’ from11.86 percent to 11.64 percent in one year and expressingsatisfaction when this rose again to 12.07 percent a year later.≥
Too often, sweeping assumptions about the past and sweep-ing assertions about the future have served as substitutes forthe difficult task of analyzing hard facts. These facts include abitter history of escalating intergroup violence where affirma-tive action has existed longest, in India, and outright civil warin Sri Lanka. There has also been a moral dimension to theseillusions—namely, the assumption that we can compensate in-dividuals today for what was done to groups in the past, that wecan make right among the living the wrongs done to peoplelong dead. Galling as it may be to acknowledge, every evil ofpast generations and past centuries will remain indelibly andirrevocably evil, despite anything that we can do now. Acts ofsymbolic expiation among the living simply create new evils.
The illusion of compensation for disadvantages too of-ten ignores the reality that those individuals most likely to be
∞∏∫ the past and the future
compensated are often those with the least disadvantages, evenwhen the groups they come from may suffer misfortunes. InPakistan, for example, quotas favoring people from the lessdeveloped districts of the country turned out to favor ‘‘therelatively well-off candidate from both backward and devel-oped regions.’’∂ Conversely, those individuals who end up be-ing sacrificed for the sake of symbolic expiation are likely to bethe least advantaged of the non-preferred population, even ifthat population as a whole may be more fortunate than thegroup that has been given preferences.
Those whites displaced from admission to elite Americancolleges when blacks are admitted with lower qualifications areunlikely to be named Rockefeller or Vanderbilt and are morelikely to be named Bakke or Grutter. The same pattern can befound in other countries. When affirmative action was insti-tuted in Bombay to increase the number of Maharashtriansamong business executives there, the biggest losses of these exe-cutive positions were not among the dominant Gujaratis butamong the less represented South Indians.∑ In Malaysia, therequirement that businesses take in Malay partners was moreeasily circumvented by the larger Chinese and foreign firms:
Both Chinese and foreign companies began to actively solicit busi-ness ties with politically-influential Malays willing to lend theirnames for a price without taking on executive roles after becom-ing owners and directors of the companies. . . . Small, predomi-nantly manufacturing, enterprises, which were not privy to suchavenues to bypass the state were those most affected by the gov-ernment’s new constraints.∏
THE VOCABULARY OF AFFIRMATIVE ACTION
Failure to come to grips with the actual consequences of affir-mative action policies has been due not only to an unfamiliaritywith the history of such policies, or to a dearth of statistics in aparticular country, but is also due to words and conceptions
the past and the future ∞∏Ω
which obscure and confuse. The desirability of one policyversus another cannot even be discussed seriously when wordshave chameleon-like changes in meaning during the course ofa discussion. Such expressions as ‘‘a level playing field’’ canhave diametrically opposite meanings when no distinctionis made between performance differences and favoritism.Whether one advocates or opposes affirmative action, its conse-quences have been too serious to be ignored or hidden behinda fog of words with vague and shifting meanings.
Blurring Distinctions
In the context of affirmative action, blurring the distinctionbetween performance differences and favoritism serves the po-litical purpose of providing a rationale for government inter-vention with preferences and quotas for particular groups, asways of offsetting the supposed favoritism or ‘‘advantages’’ en-joyed by other groups. However, if we are serious about wantingto confront realities, then our vocabulary cannot confuse per-formance differences with favors or advantages.
The expression ‘‘a level playing field’’ cannot mean both (1)having the same performance receive the same evaluation orreward, regardless of the group from which the individualcomes, and (2) equal outcomes or equal statistical probabilitiesof success for different groups. It is a matter of semantic prefer-ences which of these definitions one chooses, but it is a matterof simple clarity and honesty not to choose both, nor to driftback and forth between these very different concepts in thecourse of a discussion. Where it is clear that those whom one isaddressing mean the first and the expression is used to meanthe second, then that is sheer deceit. Among advocates of affir-mative action, the phrase ‘‘a level playing field’’ has often beenused to describe—not even-handed rules applied to all—but adeliberate tilting of the rules to produce a preconceived equal-izing of results.
∞π≠ the past and the future
These shifting definitions serve to evade facts which chal-lenge the central dogma behind many discussions of discrim-ination and affirmative action—namely, that statistical dif-ferences between groups are due to how others treat thesegroups, not due to differences in the performances of thegroups themselves. Yet all around the world, there are perfor-mance differences among groups.
People from higher socioeconomic classes tend to scorehigher on mental tests, whether in China, the Philippines, orthe United States.π People from some geographic settings tendto score higher than people from other geographic settings:Indonesians from the island of Java have scored higher thanIndonesians from the outer islands, Filipinos from Manila havescored higher than Filipinos from other parts of the country,Pakistanis from the Punjab score higher than people fromother parts of Pakistan, and Tamils from the Jaffna peninsulaconsistently outscored the Sinhalese who predominate in therest of the country.∫ In the United States, regional differ-ences in mental test scores among soldiers tested during theFirst World War sometimes outweighed even racial differences,as whites in some Southern states scored lower than blacksfrom some Northern states.Ω Indeed, test score differences be-tween different generations of the same people have, in variouscountries, been greater than those between black and whiteAmericans.∞≠
In countries where there are minority students who havedramatically outperformed students from the majority popula-tion which controls the educational institutions, as in Sri Lankaand Malaysia, then clearly this is not a matter of discriminationor bias. Nor can the above-average incomes of Japanese Ameri-cans be attributed to any ability on their part to discriminate orotherwise get an advantage over white Americans. Superioreconomic performances by minorities have been commonaround the world—not just in the countries studied here. Ger-mans in Russia, Armenians in Turkey, Lebanese in West Africa,
the past and the future ∞π∞
Italians in Brazil, Indians in Fiji, and Jews throughout EasternEurope have been just some of the minorities who have ex-celled economically, without any ability to discriminate againstthe majority populations of these countries. In short, the auto-matic dismissal of evidence that one group performs better orworse than another by blaming ‘‘test bias,’’ ‘‘covert racism’’or other such convenient explanations may sound plausiblewithin the confines of one country, but not against the back-ground of large and numerous performance differences incountries around the world.
Groups are often said to be ‘‘excluded’’ from various institu-tions or activities because they do not meet the qualificationsfor those institutions or activities as often as members of someother groups do, or do not perform as well in these institutionsor activities. But when the Malays are referred to as a ‘‘de-prived’’ group in Malaysia∞∞ and non-Malays as having ‘‘priv-ilege,’’∞≤ it would seem that surely no one really means thatthere are either legal rights of a lesser nature for Malays oreconomic activities which anyone can prevent Malays from en-gaging in within Malaysia. Yet it is hard to know whether suchstatements represent only current verbal fashions or a seriousbelief about the real world, especially when a writer for theBritish newspaper The Guardian described the situation beforethe New Economic Policy in Malaysia this way:
Malays were on the sidelines in their own society, with hardly anyplace in economic life, little role in the media, and not muchmore in intellectual and academic life.
So action which would normally be inadmissible, interven-tions in the economic, cultural and education sphere to giveMalays a chance to catch up, ought to be permitted. Foreign firmsand governments which blocked Malay progress could be sim-ilarly treated.∞≥
When others are said to have ‘‘blocked’’ the progress ofMalays in Malaysia, the clear implication seems to be that the
∞π≤ the past and the future
outcome was due to what others did, rather than to what theMalays did not do. In other words, this implies that it was notany lack of skills, experience, or other capabilities on the partof the Malays which was responsible for their not ending upwith the same achievements as others in Malaysia. But if this wasmeant as a serious statement about the real world, there was noattempt to specify just what this blocking consisted of.
No doubt there are reasons why one group excels over oth-ers in particular fields. Nor are these reasons necessarily in-nate or due to personal merit. The Tamils in Sri Lanka, forexample, were in colonial times educated in American mission-ary schools that emphasized mathematics and science more sothan the British missionary schools in which the Sinhalese wereeducated. The Chinese who immigrated to Malaysia came fromcircumstances in southern China that had long made hardwork and frugality necessary for survival, while the Malay cul-ture developed in easier circumstances, permitting an easier-going way of life. Much the same distinction could be madebetween the Indians who settled in Fiji and the indigenousFijians. Many other influences may have been behind otherdifferences between other groups in other countries. But thatdoes not make those differences any less real or automaticallymake them simply results of discrimination by others.
Words can confuse the vagaries of fate with the sins of man.Philosophically, we might regard it as unjust, in some cosmicsense, that one group was better prepared for a particular kindof competition than other groups, even if its advantage con-sisted only of prior adversity. However such a conception mightbe debated in the abstract around a seminar table, the empiri-cal question in public policy issues is whether one group out-performs another or is simply rewarded more for the same (orlesser) performances. At the very least, these are different ques-tions, even if these differences are blurred or confused bywords and phrases about one group’s greater ‘‘access,’’ ‘‘advan-tages,’’ ‘‘opportunity’’ and the like.
the past and the future ∞π≥
A common complaint in countries around the world is thatsome groups have less ‘‘access’’ to credit, making it harder forthem to start businesses or to buy homes, for example. Yet bothgovernment programs and private lending organizations havesuffered devastating losses when lending to groups who are saidto have been denied ‘‘access’’ to credit in a market economy. InMalaysia, for example, ‘‘of the 55,000 loans that had beengiven to Malay businesses, only 6,000 had been paid back.’’∞∂ Inthe United States, when the Bank of America set up a specialsubsidiary to lend to people in the ‘‘subprime market’’—thatis, people with lower credit ratings—it lost hundreds of mil-lions of dollars and announced that its offices ‘‘will stop makingsubprime loans immediately.’’∞∑
When people with a track record of not repaying loans asoften as others are not granted loans as often as others, or notat as low an interest rate as others, is that a denial of equal‘‘opportunity’’ or a reflection of unequal prospects of repay-ment? When those students or workers who do not perform aswell as others do not advance as well as others, does this mean alack of ‘‘access’’ beforehand or a lack of achievement after-ward? These are not semantic questions but questions aboutthe real world. Beclouding the realities of these situationswith tendentious words does not facilitate determining eithercauses or cures.
The widely accepted doctrine that prior favoritism pre-determines the future likewise cannot withstand scrutiny. Theclear favoritism of the British colonial government in providingfree education to Malays did not prevent the Chinese fromexcelling the Malays in education, either during colonial timesor in the first decades after independence. Only affirmativeaction preferences and quotas enabled Malays to increase theirshare of places in the universities. Moreover, even this quanti-tative increase did not lead to a sufficient qualitative perform-ance to satisfy the Malay government, which began to take stepsto allow other groups to enter university programs needed to
∞π∂ the past and the future
supply scientific and technical skills that the Malays still failedto supply.
Hiding Asian Success
Not only particular facts, but whole groups of people, havebeen hidden behind a fog of words. For example, in the Bowen-Bok study of affirmatve action in higher education in theUnited States, black students admitted to American collegesunder lower standards have been hidden within a larger groupof black students, which included those who met the samestandards of admission as white students. Although the Bowen-Bok study has been widely accepted as proving that affirmativeaction ‘‘works,’’ those for whom it supposedly works are neverallowed to appear alone anywhere in the voluminous statisticspresented in that study. The performances of those blacks ad-mitted under the same standards as whites prove nothing aboutaffirmative action.
Many other statistical comparisons of blacks and whites bythose supporting affirmative action policies often omit otherethnic groups, whose data are readily available and whose expe-rience might serve as a check on theories about the causes ofthe black-white differences. If the central premise of affirma-tive action is that groups cannot on their own rise to parity inAmerican society when they have a history of poverty and lowoccupational status, and are indelibly different in skin color,then the history of Chinese Americans or Japanese Americansmight be relevant to testing this belief empirically, since bothgroups have in fact done what has been said to be impossible.
At the beginning of the twentieth century, Japanese immi-grants were agricultural laborers and domestic servants to aneven greater extent than the blacks.∞∏ It was only after the Sec-ond World War that the younger generation of Japanese Amer-icans went into very different occupations and rose up the so-
the past and the future ∞π∑
cioeconomic ladder. By 1979, Japanese American males hadhigher incomes than white American males.∞π
Current socioeconomic differences between blacks andwhites, which are routinely ascribed to racial discrimination orcultural bias, might look very different if data were examinedshowing that Asian Americans often have the same ‘‘advan-tages’’ over whites that whites have over blacks. For example,whites’ applications for home mortgages are approved at ahigher rate than those of blacks, but applications from AsianAmericans are approved at a higher rate than those of whites.∞∫
Blacks tend to lose their jobs during an economic downtownmore often than whites, but whites are more likely to lose theirjobs than are Asian Americans.∞Ω The fact that whites scorehigher than blacks on the mathematics SAT has been taken asproof of the cultural bias of this test, but the fact that AsianAmericans score higher than whites≤≠ has been passed over insilence. Higher infant mortality rates among black women thanwhite women has been blamed on the failure of society to pro-vide equal access to prenatal care, but the fact that ChineseAmerican women have lower infant mortality rates than whitewomen—despite not having prenatal care as often≤∞—has like-wise been passed over in silence.
Clearly Asian Americans are an embarrassment to thosemaking the usual arguments for affirmative action. ThereforeAsian Americans are either ignored or are submerged statis-tically in larger aggregates. These larger aggregates include‘‘non-whites’’ where they are swamped by the much largernumber of black Americans. More recently Chinese Americansand Japanese Americans have been lumped together with Sa-moans, Hawaiians, Vietnamese and others under the omnibuscategory ‘‘Asian and Pacific Islanders,’’ whose heterogeneity issuggested by the fact that Japanese Americans have nearly dou-ble the income of Samoans—as well as incomes higher thanthat of white Americans.≤≤
∞π∏ the past and the future
This burying of inconvenient facts in heterogeneous statis-tical aggregates is not peculiar to the United States. In Canada,the popular omnibus category is ‘‘visible minorities,’’ submerg-ing the highly successful Japanese minority there in a categorywith less successful minorities. In Britain, people of Chineseancestry are submerged in the omnibus category ‘‘black,’’ asare Indians, Pakistanis and others. These are just some of theways words are used to obscure evidence that could be dan-gerous to clarify, from the standpoint of those defending thesocial vision behind affirmative action. A study in New Zea-land says: ‘‘Bitter resentment of Asian immigrant success is ex-pressed’’ in a government document from the Maori Develop-ment Ministry.≤≥ In all these countries, the facts about Asiansuccess are a deadly threat to the social vision used to explainaway the failures of others and to claim preferential treatmentas compensation for the presumed failures of society.
An official report titled Ethno-Racial Inequality in the City of
Toronto declares: ‘‘Combining all the non-European groups,the family poverty rate is 34.3 percent, more than twice thefigure for Europeans and Canadians.’’≤∂ In other words, this ispresented as a racial difference by lumping together ‘‘all thenon-European groups.’’ But a detailed breakdown of the familypoverty rates of the many European and non-European groupsshows that Canadians of Japanese ancestry in Toronto havepoverty rates lower than those of Canadians of British, French,German, Polish, or Hungarian ancestry in that city.≤∑ In classicrhetoric that evades achievement, the report says, ‘‘The Japa-nese are among the most privileged groups in the city.’’≤∏ Any-one familiar with the history of severe racial discriminationagainst the Japanese in Canada—including internment duringWorld War II longer than Japanese Americans≤π—must surelyregard the word ‘‘privileged’’ as Orwellian Newspeak.
It is much the same story when it comes to median familyincome in Toronto. The median family income of people ofBritish ancestry living in Toronto is above the median family
the past and the future ∞ππ
income for the city as a whole, but that of Japanese Canadiansin Toronto is above that of the British.≤∫ Among the many otherdifferences among various groups in Toronto are differences inthe percentage of their families which include couples ratherthan simple parents—41 percent among blacks and 91 per-cent among Japanese≤Ω—and in how recently they arrived inCanada, as well as in their median ages, their knowledge ofEnglish, and other factors. Clearly those who lump together‘‘visible minorities’’ in Canada are able to bury social differ-ences that are highly relevant and empirical evidence that ishighly inconvenient for those attempting to explain differ-ences in group success by racial discrimination.
Nothing has been more common, in countries around theworld and over centuries of recorded history, than large dis-parities in the success or failure of different groups—whetherthese groups have been of the same or a different color. Theattempt to ascribe the same phenomenon in particular coun-tries today to barriers against non-whites must not only ignoreall this history but also bury the facts about Asian minoritiesstatistically.
INTERGROUP RELATIONS
Among the most remarkable rationales for group preferencesand quotas is the claim that such things promote a more co-hesive society—‘‘national unity’’ being a popular phrase in In-dia, Malaysia, and Nigeria, for example≥≠—despite a historyof increasing intergroup resentments, polarization, violence,and even civil war in the wake such policies in a number ofcountries. Nor are India, Malaysia, and Nigeria the only coun-tries where affirmative action is promoted as a means of betterintergroup relations. The actual track record of group-identitypolitics is in sharp contrast with the mystical benefits of ‘‘di-versity,’’ endlessly asserted but seldom tested empirically, andnever proved.
∞π∫ the past and the future
In India, for example, the number of people killed in inter-group violence during the decade of the 1980s was four timesas high as in the 1970s.≥∞ In Nigeria, the phrase ‘‘nationalunity’’ has appeared repeatedly in official pronouncements jus-tifying group preferences, even as members of different tribesslaughtered each other before, during, and after that country’scivil war. Despite incessant repetition of the word ‘‘diversity’’and sweeping dogmas about its social benefits, countries thathave suffered the intergroup strife which has so often accom-panied the politicization of intergroup differences have thengone to great trouble to try to create enclaves of homogeneityas a means of reducing internal strife. Both India and Nigeriahave split existing states or provinces into smaller politicalunits, in which some former minority group can become amajority. In short, those who have suffered the most severeconsequences of group identity politics have then turned tolocal reduction of diversity as a way to defuse polarization andviolence.
A related, and equally unsubstantiated, assumption is thatdisparities in income and wealth promote intergroup strife. Asa corollary, reductions in such disparities are assumed to re-duce resentments and the hostility and violence growing out ofsuch resentments. Seldom, if ever, is this widespread beliefsubjected to empirical scrutiny. Among the countries studiedhere, all the evidence points in the opposite direction. In Ma-laysia, Nigeria, and Sri Lanka, there was far less intergroupviolence in the first half of the twentieth century, when inter-group disparities were greater, and far more violence afterthese disparities had been politicized and group identity poli-tics promoted.
In the United States as well, the worst ghetto riots occurredduring administrations which most sympathetically publicizedand dramatized the grievances of blacks—especially the admin-istration of President Lyndon Johnson. Moreover, such riotsdeclined abruptly with the election of Richard Nixon as presi-

the past and the future ∞πΩ
dent, and major ghetto riots became virtually unknown duringthe eight years of the Reagan administration, when group iden-tity politics were ignored or frowned upon. Here again was thesame pattern found in other countries, where it was not dis-parities, but the politicization of those disparities and the pro-motion of group identity politics, which was the harbinger ofintergroup hostility and violence.
Other countries not covered here show similar patterns.The Volga Germans in Russia co-existed peacefully for morethan a century with their Russian neighbors, despite the greaterproductivity and prosperity of these Germans. But this pros-perous minority became targeted as ‘‘exploiters’’ after the Bol-shevik revolution and suffered spoilation and violence. Indians,Pakistanis, and Lebanese likewise lived peacefully for yearsamong Africans whose economic level did not approach theirown—until political demagogues made Asians targets of envy,resentment, discrimination, and violence. It was much thesame story with Indians in Fiji, Jews in Germany, Armenians inTurkey, and other groups in other places.
A study of group preferences and quotas in Pakistan con-cluded: ‘‘Paradoxically, Pakistan’s redistribution policies havebeen effective in increasing ethnoregional proportionality, butthey have done little to restrict, or in some cases have served toenhance, the level of ethnoregional conflict in the state.’’≥≤
Such conflict escalated to the point of civil war when EastPakistan seceded to become the new nation of Bangladesh.
Those who imagine themselves to be promoting intergroupharmony by attempting to reduce economic disparities be-tween groups seldom consider whether their politicizing ofthose differences may have the opposite effect. What has actu-ally happened seems to carry far less weight than what prevail-ing theories say will happen. Nor is this just a matter of politicalspin. It was not a cynical politician in India but an earnestAmerican scholar who had researched affirmative action pro-grams there who said:
∞∫≠ the past and the future
The compensatory discrimination policy is not to be judgedonly for its instrumental qualities. It is also expressive: through itIndians tell themselves what kind of people they are and whatkind of nation. These policies express a sense of connection andshared destiny.≥≥
This was said about a policy which has repeatedly provokedriots in which dozens—or even hundreds—of people havebeen killed. The ‘‘altruistic fraternal impulse that animatescompensatory policies’’≥∂ was given much credit by this scholar,despite the age-old warning that the road to hell is paved withgood intentions. India’s most intolerant and violent massmovement—Shiv Sena—began as an organization seekingpreferences and quotas for Maharashtrians in Bombay. Thegranting of those quotas only boosted Shiv Sena’s standing andpower. Moreover, its success in exploiting group identity led itto ‘‘defend’’ its constituency against an ever growing list of‘‘enemies’’—Tamils, Moslems, Christians, foreigners, amongothers—both politically and violently in the streets. Just as pref-erences and quotas tend to spread over time to new groups andnew activities, so success at group identity politics tends to ex-pand the list of grievances and ‘‘enemies’’ necessary to keepthe movement viable and its leaders powerful.
The progression of India’s Shiv Sena movement to everwider circles of enemies and ever more expansive notions ofgrievances is instructive. At first, the enemy was primarily peo-ple from South India living in Bombay who were more econom-ically successful than the indigenous Maharashtrians. However,a series of concessions on that issue only whetted the move-ment’s appetite for more concessions on more things and forever more grievances to keep its followers aroused and combatready. Muslims were then targeted in a campaign climaxed bylethal riots and atrocities in 1992 and 1993. According to The
Times of India, there were mobs ‘‘stopping vehicles and settingpassengers ablaze’’ and ‘‘men brought bleeding to hospital who
the past and the future ∞∫∞
were knifed afresh,’’ as well as ‘‘neighbours leading long-timefriends to gory deaths’’ and women who ‘‘seen their childrenthrown into fires, husbands hacked, daughters molested, sonsdragged away,’’ while more than 100,000 people fled Bombay.≥∑
India’s different groups do not have the geographical separa-tion that facilitates civil war, as in Sri Lanka or Nigeria, butclearly the hatred and violence have been very similar.
The ever-expanding list of enemies or targets grew to in-clude foreigners in general and those Indians who followedforeign customs, such as celebrating Valentine’s Day. Shopsselling Valentine cards had their windows smashed by thugs.Shiv Sena warned that it would not tolerate foreign ownershipof Air India or the playing of a cricket match between India andPakistan in Bombay. Moreover, the success of Shiv Sena hasinspired other xenophobic movements in other parts of India.Attempts to appease or neutralize these movements with con-cessions have been largely unsuccessful and may well have con-tributed to their continued growth and escalating virulence.
What a movement needs for its own survival is not a set ofconcessions won in the past, though these may be celebrated,but an inventory of demands still outstanding, grievances stillunassuaged, and ‘‘enemies’’ still to be dealt with. This is as trueof American protest movements as of group-identity move-ments in India. Things have not reached the same stage ofviolent hostility in the United States. But neither has affirmativeaction existed as long in American society. Nevertheless, a verysimilar pattern of ever more extremist group-identity politicsand grievance politics can be seen in the United States, movingin the same general direction of ever-expanding ‘‘enemies,’’ever-expanding demands and ever more bitter polarization.
The first demands of black civil rights movements were forequal opportunity in the plain and straightforward sense ofbeing treated just like everyone else. Only after that goal wasclearly within reach did the new demand for preferential treat-ment arise. Then it was decades after black protest movements
∞∫≤ the past and the future
began demanding and receiving preferential treatment that de-mands for reparations for the slavery of centuries past became amajor campaign. Black protest movements’ initial enemies—segregationist whites in the South—have expanded over theyears to include Korean and Vietnamese shopkeepers in theghettos, whose deaths in riots are virtually ignored by muchof the media, lest they be accused of being ‘‘racist’’ in theirreporting.
The idea that affirmative action promotes good relationsamong groups remains central to the defense of that policy inthe United States and is implicit in the endlessly repeated word‘‘diversity.’’ The Bowen-Bok study of the effects of affirmativeaction in colleges and universities credits this program with thefact that 56 percent of white students in the institutions studiedreport knowing two or more black classmates ‘‘well,’’ despitethe fact that 86 percent of whites in American society at largereport having black friends and 54 percent reported havingfive or more black friends.≥∏ Diversity has added nothing. Onthe contrary, a number of elite American colleges and univer-sities have had reports of growing racial hostility among theirstudents during the affirmative action era.≥π
The more plausible-sounding claim that ‘‘the cumulativestructural character of inequality’’ means that ‘‘a regime offormal equality tends to perpetuate disparities we find intol-erable’’≥∫ likewise ignores a very large body of history aboutgroups who began in lowly positions and then rose to levelsabove the level of the average member of the larger society.Jewish, Chinese, Lebanese, Indian, Japanese, German, Italian,and other immigrants have done this in countries around theworld. In twentieth century America, so many individuals rosefrom the bottom 20 percent in income to the top 20 percentwithin their own lifetimes—indeed, within a decade—that thevery notion of ‘‘class’’ becomes open to serious question in thiscontext, when there is such rapid turnover of individuals ingiven income brackets.
the past and the future ∞∫≥
The idea that one can automatically read the injustices ofthe past in the disparities of the present becomes ludicrous inlight of all the minorities in numerous countries who haveprospered more than the respective majority populations ofthose countries, without any ability to discriminate againstthose majorities, and often despite those majorities’ continueddiscriminations against them. It would be very convenient if thepresent so neatly recapitulated the past, but the facts have beenuncooperative. None of this denies that some groups—un-touchables in India, blacks in the United States—have not onlyexperienced large-scale and long sustained discrimination, buthave also been held back by it, even if we cannot quantify howmuch. What the larger picture says, however, is that we cannotautomatically call group preferences and quotas compensationfor past discrimination nor can we credit it with reducing vio-lence arising out of resentments about past discrimination.
Preceding chapters have shown, time and again, inter-group violence arising from majority groups that no one hasdiscriminated against, and preferences and quotas being givensuch groups, whose only real problem has been their inabilityto compete with more skilled or more diligent minorities. Norhave either untouchables or blacks been more violent whenthey were most discriminated against. Poetic justice might havejustified such a consequence but poetic justice does not neces-sarily prevail.
Often the claim is made that ‘‘benign’’ preferences are verydifferent from the kind of racial discrimination found in theAmerican South during the Jim Crow era or apartheid in white-ruled South Africa or the anti-Semitism of the Nazi era. But allgroup preferences are benign to those who benefit—and ma-lign to those who pay the price. The exclusion of blacks frommajor league baseball before Jackie Robinson broke the colorline in 1947 was undoubtedly benign to many white ballplay-ers, who would otherwise never have gotten out of the minorleagues if they had had to compete for jobs with such stars of
∞∫∂ the past and the future
the old Negro leagues as Satchel Paige and Josh Gibson. Was it‘‘benign’’ that so many Aryans were able to get prestigious posi-tions vacated by Jewish scholars and scientists who fled NaziGermany? Even looking beyond preferential policies, most ofthe harms and horrors inflicted on people throughout historywere inflicted so that somebody else could benefit. All were‘‘benign’’ if one looks only at the effects on the beneficiaries.
EMPIRICAL EVIDENCE ON AFFIRMATIVE ACTION
The prominence of semantic issues in controversies over af-firmative action policies in various countries reflects in parta shortage of empirical evidence with which to test policiesand beliefs about their consequences. For example, after manyyears of affirmative action policies in favor of New Zealand’sMaori minority, a Wellington newspaper reported in November2000: ‘‘Extraordinarily, there appears to be little or no researchinto whether teaching kids the standard curriculum, but inMaori, has improved their educational outcomes.’’ The paperadds: ‘‘Nobody knows, because nobody seems to be asking.’’≥Ω
Unfortunately, such disinterest in empirical consequences isnot confined to New Zealand.
In the United States, where many group preferences havesought to justify themselves as counterweights to discrimina-tion that would otherwise prevail, such ‘‘discrimination’’ oftenturns out to be statistical ‘‘under-representation’’ in desirableoccupations or institutions. The implicit assumption, tena-ciously held, is that great statistical disparities in demographic‘‘representation’’ could not occur without discrimination. Thiskey assumption is seldom tested against data on group dispari-ties in qualifications. For example, as of the year 2001, therewere more than 16,000 Asian American students who scoredabove 700 on the mathematics SAT, while fewer than 700 blackstudents scored that high—even though blacks outnumberedAsian Americans several times over.∂≠ Data such as these are
the past and the future ∞∫∑
simply passed over in utter silence—or are drowned out bystrident assertions of ‘‘covert’’ discrimination as explanationsof a dearth of blacks in institutions and occupations requiring astrong background in mathematics.
False beliefs are not small things, because they lead to falsesolutions. In the field of medicine, it has long been recognizedthat even a false cure that is wholly harmless in itself can becatastrophic in its consequences if it substitutes for a real curefor a deadly disease. Proponents of affirmative action cannotconsole themselves for their false assumptions on grounds thattheir intentions were good, because social quackery likewisesubstitutes for real efforts to deal with real problems that cantear a society apart. Despite an orientation of asking what ‘‘we’’can do for ‘‘them,’’ those who want to see blacks advance infields requiring a mathematics background need to confrontblack students with a need to master this subject, even if thatmeans giving up other diversions and giving up attitudes thatdoing academic work is ‘‘acting white.’’∂∞ This will win fewfriends and fewer votes. But the question is whether one isserious about results for others or simply wants to feel goodabout oneself.
The strongest moral case for affirmative action policies is ina country like India, where individuals are born, live, and diein the same caste. Yet that case is remarkably weak, even inIndia—if one judges affirmative action by its actual conse-quences, rather than by its ideals, rationales, or hopes. How-ever, in India as in other countries around the world, suchpolicies are usually not judged by their empirical consequences,either by most intellectuals or by most politicians.
When judged by what actually happens, what is wrong withaffirmative action is even clearer in India than in the UnitedStates or in other countries, simply because of the way officialstatistics are collected there. American government data arecollected in broad-brush categories, such as blacks, whites, andHispanics. The parallels in India would be the four varnas of
∞∫∏ the past and the future
the Hindu religion—Brahmins Kshatriyas, Vaisyas, and Su-dras—but these broad idealized categories, which apply allacross India, are not the socially relevant ‘‘functional groups’’in which people actually live, interact socially, and marry intheir own communities. These latter groups are called jatis—and there are thousands of them in the many communitiesscattered across the vast reaches of India. The term caste hasbeen applied to both varnas and jatis, but statistical data areavailable for the latter.∂≤
The availability of official statistics broken down more finelyin India than in the United States has enormous implications.It means that data can be discussed in much more specificterms in India than in the broad-brush categories used in theU.S. In India, the effects of affirmative action policies can betraced not just to such a general category as ‘‘untouchables’’ ordalits, but more specifically to Chamars in Maharashtra orHaryana or Madhya Pradesh, as compared to other jatis in thesame broad category of ‘‘untouchables’’ in those states. Thatis how we know that the more fortunate of the untouchablesor dalits receive the lion’s share of the benefits or how the‘‘creamy layer’’ tends to get a disproportionate share of prefer-ential benefits in other groups. One cannot discover from U.S.government statistics how much of the benefits of affirmativeaction go to West Indian blacks or to those blacks who aredescendants of the ‘‘free persons of color’’ who were freedbefore the Civil War, even though other studies show that thesesub-groups have had very different histories from the history ofmost other blacks.∂≥
Such data as can be gleaned from a variety of private sourcesin the United States suggest that the more fortunate Americanblacks receive a disproportionate share of the benefits going toblacks as a whole in the United States, just as the more fortunateMalays tend to benefit most from affirmative action in Malaysiaor the more fortunate untouchables benefit from affirmativeaction in India. But this is not so massively demonstrated statis-
the past and the future ∞∫π
tically as in India. So, while the moral case for affirmative actionis stronger in India, the empirical case is weaker, because so fewof the poorer untouchable groups benefit and the more fortu-nate ‘‘other backward classes’’ receive far more than all theuntouchables put together. That is because these ‘‘other back-ward classes’’ are more numerous and because they are usuallyin a better position to take advantage of preferences and quo-tas, since they are more likely to have more of the complemen-tary resources required. In the United States, there is not yetsuch widespread awareness as in India of how preferential pro-grams for the less fortunate end up helping disproportionatelythe more fortunate, and therefore there are no comparablepolitical or legal issues about ‘‘the creamy layer.’’
Neither in India nor elsewhere are affirmative action pol-icies simply a matter of redistributing benefits. Such programsalso generate major social costs which fall on the population asa whole. Losses of efficiency are among these costs, whetherbecause less qualified persons are chosen over more qualifiedpersons or because many highly qualified members of non-preferred groups emigrate from a society where their chanceshave been reduced. However, the cost of inefficiency is over-shadowed by the cost of intergroup polarization, violence andloss of lives. Bloody and lethal riots over affirmative action inIndia are the most obvious examples, but there have also beenyoung brahmins who have died by setting themselves on fire inprotest against policies which have destroyed their prospects.
As the country which has had preferences and quotas forthe less fortunate longer than any other, India presents theclearest historical picture of their consequences, as well as theclearest statistical picture. Its history is not one to encourageother countries to follow in India’s footsteps, much less thefootsteps of Sri Lanka.
The history of Sri Lanka is even more chilling to those whoare concerned about what actually happens in the wake of affir-mative action policies, as distinguished from what was expected
∞∫∫ the past and the future
or hoped would happen. Sri Lanka’s well deserved reputationas a country with exemplary relations between its majority andminority populations in the middle of the twentieth centuryhas become a bitter mockery in the course of a decades-longcivil war, marked by hideous atrocities. Despite Sri Lanka’sbeing a much smaller country than the United States, the num-ber of Sri Lankans who have died in its internal strife exceedsthe number of Americans killed during the long years of theVietnam war.
The history of blacks in the United States has been virtuallystood on its head by those advocating affirmative action. Theempirical evidence is clear that most blacks got themselves outof poverty in the decades preceding the civil rights revolution ofthe 1960s and the beginning of affirmative action in the 1970s.Yet, the political misrepresentation of what happened—byleaders and friends of blacks—has been so pervasive that thisachievement has been completely submerged in the publicconsciousness. Instead of gaining the respect that other groupshave gained by lifting themselves out of poverty, blacks arewidely seen, by friends and critics alike, as owing their advance-ment to government beneficence.
Within the black community itself, the possible ending ofaffirmative action has been portrayed as a threat to end theireconomic and social progress. Thus whites are resentful andblacks are fearful because of policies which have in fact donerelatively little, on net balance, to help blacks in general or poorblacks in particular. Among black students in colleges and uni-versities, those admitted under lower standards face a higherfailure rate and those admitted under the same standards asother students graduate with their credentials under a cloud ofsuspicion because of double standards for minority students ingeneral.
One of the most widely used defenses of group preferencesand quotas is that there are precedents for them. In collegeadmissions, for example, there have been preferences for ath-
the past and the future ∞∫Ω
letes and for alumni children. Merit criteria have not beenuniversal in other institutions either. Why then the objectionsto racial or ethnic preferences or preferences for women? As astrategic argument, this arbitrarily puts the burden of proof oncritics of affirmative action, as if the demonstrable social costsof this program needed no justification. But of all justifications,precedent is one of the weakest. Everything that has ever beendone wrong—from jay-walking to genocide—has had prece-dents. Any justification or criticism of affirmative action mustbe based on its actual consequences. If we took the argumentfrom precedents as conclusive, then nothing could ever be cor-rected until there was perfection in everything else.
Verbal parallels are not enough. Hard evidence on the mag-nitude or empirical consequences of such things as alumnipreferences is needed, but is seldom asked for or given. Noone, for example, asks how far below the usual admissions stan-dards are the alumni children who are admitted preferentially,compared to how much the standards are lowered to get theracial profile required for ‘‘diversity.’’
There is, however, some empirical evidence on the conse-quences of preferential admissions of individuals from priv-ileged groups. When the president of the University of thePhilippines had discretionary powers to admit particular stu-dents without regard to the usual academic criteria, the resultswere that (1) the great majority admitted this way were off-spring of ‘‘the rich and powerful,’’ and (2) ‘‘those admitted bypresidential discretion performed worse than the rest of theaudience.’’∂∂ At Harvard, back during the era when more thanhalf of all alumni sons were admitted, those special admit-tees were disproportionately represented among students whoflunked out.∂∑
Despite verbal parallels between affirmative action andpreferences for the privileged, when some rich student of mod-est ability does not make it through an elite college, thatis neither a personal nor a social tragedy, given the range of
∞Ω≠ the past and the future
options still available to that student. But, with students from alower income background, for whom education may be theirone shot at a better life, the story is entirely different.
As for the important question of how much of a prefer-ence exists—that is, how far below the usual admissions stand-ards are alumni children versus minority children admittedthrough racial preferences—a child of modest ability from awealthy family is likely to have had the best education thatmoney can buy, so his academic preparation and test scores arelikely to be solid, even if not outstanding. But a minority young-ster admitted to a college where the other students have com-posite SAT scores hundreds of points higher faces a muchtougher prospect.
If the only issue in affirmative action were whether there areany other unmerited benefits, then arguments about the pref-erential admissions of the children of affluent alumni mightmake some sense. But, when the consequences of racial orethnic quotas include creating artificial failures among the os-tensible beneficiaries and polarization in the society at large,then mere verbal parallels are not enough.
MISLEADING TACTICS
One of the unquantifiable, but by no means unimportant, con-sequences of affirmative action has been a widespread dishon-esty, taking many forms. The redesignation of individuals andgroups, in order to receive the benefits of preferences andquotas intended for others, has been common in various coun-tries. In the United States, a special dishonesty has been neces-sary to square group preferences and quotas with the require-ment of the American constitution for equal rights amongindividuals. This has involved both concealment of the exis-tence of preferential treatment and claims that such treatmentis only a remedial response to existing discrimination. Thisadds insults to people’s intelligence to the injuries they may

the past and the future ∞Ω∞
have received, or perceived themselves as receiving, and canonly add to the backlash. There is all the difference in the worldbetween saying that you have not had an even chance in lifeand saying that a particular individual or institution with whomyou dealt has discriminated against you.
Another widespread kind of dishonesty, in both India andthe United States, is the use of hazy, unverifiable criteria toconceal group preferences in college and university admissionsby automatically offsetting the better academic records of mem-bers of one group with higher ‘‘leadership’’ and other subjec-tive rankings of members of other groups who would be inad-missible, in competition with others, on academic grounds. Inboth countries, court decisions restricting the scope or terms ofgroup preferences in admissions to colleges and universitieshave been followed by efforts to put a greater emphasis on non-academic criteria in admissions. As noted in Chapter 2, therankings of students on these non-academic criteria in Indiahas almost invariably turned out to be higher for those withlower academic records and lower for those with higher aca-demic records.
In the United States, nebulous factors like ‘‘leadership’’ or‘‘overcoming adversity’’ have likewise served as automatic off-sets whose validity or lack of validity is not subject to proof ordisproof. State bans on affirmative action in California andTexas public universities set off a wave of creative proposals fornon-objective criteria for admissions, echoing what had hap-pened in India decades before, where the state government ofMysore ‘‘suddenly exhibited an enhanced concern for theextra-curricular accomplishments of applicants to professionalcolleges.’’∂∏ Nothing is easier than to come up with rationalesfor non-objective criteria. In India’s state of Madras, for exam-ple, one supporter of such criteria argued that such criteriawould ‘‘eliminate puny creatures with no personality from be-coming engineers and doctors.’’∂π
One of the common dishonesties in the academic world is
∞Ω≤ the past and the future
faculty rejection of affirmative action in anonymous polls andsupport of it when voting publicly in faculty meetings or com-menting in the media. A 1996 Roper poll, for example, foundthat a majority of professors, nationwide, were opposed to affir-mative action in faculty hiring and to affirmative action in stu-dent admissions. Yet it is virtually impossible to find a facultyvote against these policies in American colleges and univer-sities. Bitter fights have erupted over the issue of using secretballots for votes on this issue, since both sides have recognizedthat whether the voting was secret or public could lead to op-posite results.
History itself has been misrepresented as a way of strength-ening the case for particular policies. Such misrepresentationsof the history of the rise of blacks and women in the UnitedStates have already been noted in Chapter 6. The history ofthe aboriginal population in Australia has also been misrepre-sented in the quest for more current government benefits.∂∫ Incountry after country, deception has been an integral part ofthe case for affirmative action. One of the most common formsof deception is the use of rationales which bear little or norelationship to what has actually been done. No sufferings byblack Americans, past or present, can justify admitting whitestudents to an elite San Francisco public high school over bet-ter qualified Chinese American students who applied.∂Ω Yet,once a policy of racial quotas has been authorized, the flood-gates have been opened to such things, wholly at odds with therationales for these quotas.
Emotionally powerful and politically explosive issues oftenproduce desperate searches for a ‘‘third way’’ to resolve dilem-mas without confronting realities. Some even flatter themselvesthat this represents a more subtle and nuanced approach. But,however subtle and nuanced one’s thinking may be, ultimatelythinking must confront a reality where options can be few,crude, and discrete. Given the tenacity with which group pref-erences and quotas have persisted, and the zeal with which they
the past and the future ∞Ω≥
have been expanded, in countries around the world, subtletiesin trying to reform or reduce affirmative action can amount tolittle more than a verbal fig leaf over the naked continuance ofthe same policies as before.
ALTERNATIVES TO AFFIRMATIVE ACTION
Concern for the less fortunate is entirely different from imagin-ing that we can do what we cannot do. Nor is the humblingadmission of our inherent limitations as human beings a rea-son for failing to do the considerable number of things whichcan still be done within those limitations. In America, at least,history has demonstrated dramatically that can be done be-cause it has already been done.
Americans need only look back to the beginning of thetwentieth century to see what enormous social and economicprogress has been made by some of the poorest and apparentlyleast promising segments of the population. At the beginningof the twentieth century, only about half of the black popu-lation of the United States could read and write. Jews livedpacked into slums on the lower east side of New York, withmore overcrowding than in any slums in America today. As lateas the First World War, the results of mass mental testing ofAmerican soldiers led a leading authority on mental tests toconclude that it was a myth that Jews were highly intelligent.∑≠
The situation of Chinese Americans looked so hopeless that apopular expression of the time described someone facing im-possible odds as having ‘‘not a Chinaman’s chance.’’
Not even most optimists would have predicted at that timehow much all these groups would rise over the next half cen-tury—before there were preferences or quotas. Even for blacks,at the center of current controversies about affirmative action,the decline in their poverty and their rise in the professionswere both more dramatic before the federal government createdaffirmative action in the 1970s. With all these American ethnic
∞Ω∂ the past and the future
groups—and others—what happened was not a transfer ofbenefits from the rest of the population, but a rising contribution
from these minorities to the growing prosperity of Americansociety as a whole, from which both they and the larger societybenefitted, as the less educated became more educated, as farmlaborers and domestic servants acquired the skills and experi-ence to take on more challenging work. This was not a zero-sumprocess, while redistribution is at best a zero-sum process, if itsomehow manages to avoid disincentive effects and intergroupturmoil.
Why is this social process, with a proven track record, solittle appreciated, or even noticed—and sometimes dismissedas a policy of ‘‘doing nothing’’? Perhaps that is because, what-ever its economic and social benefits, it offers few rewards topoliticians, activists, and intellectuals, or to those who wish toseem morally superior by denouncing society. The heroes ofthese groups’ rise are anonymous individuals, not public fig-ures. Here is some history worth repeating—but only if thegoal is the advancement of the less fortunate, rather than theaggrandizement of those who would be their guardians orspokesmen or elected officials.
SUMMARY AND IMPLICATIONS
The skewed pattern of beneficiaries of affirmative action pro-grams should not only give pause as to the actual consequencesof such programs, it should also call into question the veryassumption on which affirmative action is based. That assump-tion is that an uneven distribution of income and of desirablejobs indicates discriminatory intentions toward the less fortu-nate, which must be counteracted by preferential policies ontheir behalf. But when those well-intentioned policies show thevery same skewed pattern as the presumed ill intentions theyare supposed to counteract, then it is hard to avoid the conclu-sion that something other than intentions must be involved.
the past and the future ∞Ω∑
Nor can behavioral and other differences among the variouspopulations themselves be arbitrarily banished from discussionby some such pat phrases as ‘‘stereotypes’’ or ‘‘blaming thevictim.’’ Causation is not blame and whether they are victims ornot is precisely the question.
Are the Malay majority ‘‘victims’’ of the Chinese minority inMalaysia, the northern Nigerian majority victims of the Ibominority, the Sinhalese majority victims of the Tamil minorityin Sri Lanka, and numerous local majorities victims of the Chet-tiar or Marwari minorities in various parts of India? Are thewhite majorities in Canada and the United States victims ofJapanese minorities? Or do these minorities simply performmore successfully in the competition of the marketplace andeducational institutions? The dogma that statistical disparitiesdemonstrate discrimination assumes an equality of perfor-mance that is virtually impossible to find in the real world.
Indeed, some of the same groups that are said to be discrim-inated against, on the basis of statistical disparities, show thesame patterns of statistical dominance over the majority popu-lation in such fields as sports and entertainment—fields inwhich individual talents and efforts can produce success with-out the kind of cultural prerequisites, such as higher educa-tion, required in many other fields. Yet no one seriously be-lieves that Maoris can keep white New Zealanders off thatcountry’s sports teams, except by outperforming them on thefield. Nor can black baseball players in the United States keepwhite players from hitting home runs, even though four of thetop five totals of career home runs were hit by black players.Statistical disparities prove nothing about discrimination be-cause they are common even in situations where those who arestatistically dominant have no way to discriminate.
The very modest benefits of affirmative action, concen-trated on those already more fortunate, with little or no bene-fits to those who are truly disadvantaged, have often beenblamed on insufficient zeal, or even bad faith, on the part of
∞Ω∏ the past and the future
those administering affirmative action programs. Thus thefailures or inadequacies of such programs can be taken as rea-sons for reforms, rather than as symptoms of more fundamen-tal misconceptions that could be reasons for ending the pro-grams. While this argument might seem plausible to somewhen discussing whites administering programs for blacks inthe United States, it loses even the appearance of plausibil-ity when Malays are administering preferential programs forMalays in Malaysia or when Sinhalese have administered suchprograms for Sinhalese in Sri Lanka. Even in the United States,the particular officials heading civil rights agencies such as theEqual Employment Opportunity Commission have almost allbeen black, as have many or most administrators of affirmativeaction programs in private industry and in the academic world.
Despite a tendency to think of group preferences and quo-tas as transfers of benefits—a zero-sum process—there are infact many ways in which these transfers can be negative-sumprocesses, in which what is lost by one group exceeds what isgained by another, making the society as a whole worse off. ForexampIe, when a group in which 80 percent of the studentsadmitted to college succeed in graduating loses admissions to agoup in which only 40 percent of the students graduate, thenthe first group must lose 800 graduates in order for the secondgroup to gain 400 graduates. Moreover, it has been common invarious countries around the world for groups whose studentshave lower qualifications to specialize in easier and less re-munerative fields, as well as performing less well academic-ally.∑∞ Therefore the first group may lose 800 graduates, largelyconcentrated in mathematics, science, and engineering, whilethe second group gains 400 graduates largely concentrated insociology, education, and ethnic studies.
This does not even take into account the intergroup po-larization which group preferences and quotas provoke, andwhich can take many forms, including lethal riots, as in India,or outright civil war, as in Sri Lanka. By contrast, the gains
the past and the future ∞Ωπ
made by less fortunate groups as a result of becoming bettereducated and better equipped with skills can be not only a netbenefit to society as a whole, but also a source of greater respectfor the group by others who see them as becoming more pro-ductive contributing members of society. In the case of blacksin the United States, much of their advancement has been ofthis sort, but the existence of affirmative action and of particu-lar horror stories growing out of it, has meant that blacks’ ac-tual achievements have often been under-estimated or dis-regarded. Affirmative action has meant almost a moratoriumon recognition of the achievements of those designated as itsbeneficiaries, however little tangible benefits these groups mayin fact have received.
Another way in which affirmative action can be a negative-sun process is by a withdrawal of members of non-preferredgroups and the loss of their contributions to the society atlarge. A study of preferential policies in Malaysia reports the‘‘emigration of non-Bumiputera professionals and the outflowof Chinese capital.’’∑≤ In post-apartheid South Africa, with affir-mative action for blacks, many white government workers havetaken early retirement and thousands of whites have emigratedannually.∑≥ Those on the wrong side of preferential policieshave likewise emigrated from Fiji, from Soviet Central Asia,from East Africa, and from other places where the skills andexperience of these emigrants were sorely needed.
The empirical consequences of affirmative action prefer-ences and quotas have been paid remarkably little attention—with hard data being sparse to non-existent in some coun-tries—while controversies surrounding these policies havebeen discussed in terms of the vision and the rationale be-hind them and the counter-vision and counter-rationales ofcritics. Vague, emotional, confused and dishonest words, whichare incidental aspects of many controversial issues, are centralto discussions of affirmative action in countries around theworld. Few such programs could stand on the basis of their
∞Ω∫ the past and the future
actual empirical consequences. Nor are their moral bases anymore solid.
Some groups in some countries imagine themselves en-titled to preferences and quotas just because they are indige-nous ‘‘sons of the soil’’—even when they are in fact not indige-nous, as the Sinhalese in Sri Lanka and the Malays in Malaysiaare not. Yet indigenousness has acquired a moral aura, not onlyamong those claiming such status, but among observers andscholars as well. Why an accident of history and geographyshould have moral implications that last for centuries is a ques-tion seldom raised, much less answered.
Even when serious moral questions surround the past orpresent mistreatment of groups such as the untouchables inIndia or blacks in the United States, the remedies proposedrapidly spread far beyond redress of the misfortunes used tojustify those remedies. Not only has the internal distribution ofcompensatory benefits borne little relationship—or even aninverse relationship—to the degree of misfortune within theaffected groups, such benefits have spread to other groups farbeyond the scope of the moral rationale and far exceeding insize the intended beneficiary groups.
Innumerable principles, theories, assumptions and asser-tions have been used to justify affirmative action programs —some common around the world and some peculiar to particu-lar countries or communities. What is remarkable is how sel-dom these notions have been tested empirically, or have evenbeen defined clearly or examined logically, much less weighedagainst the large and often painful costs they entail. Despitesweeping claims made for affirmative action programs, an ex-amination of their actual consequences makes it hard to sup-port those claims, or even to say that these programs have beenbeneficial on net balance—unless one is prepared to say thatany amount of social redress, however small, is worth anyamount of costs and dangers, however large.
Notes
PREFACE
1. Donald R. Snodgrass, Inequality and Economic Development in
Malaysia (Kuala Lumpur: Oxford University Press, 1980), p. 10.
chapter 1: AN INTERNATIONAL PERSPECTIVE
1. See, for example, Rita Jalai and Seymour Martin Lipset, ‘‘Ra-cial and Ethnic Conflicts: A Global Perspective,’’ Political Science Quar-
terly, Vol. No. 4 (Winter 1992–1993), p. 603; Robert Klitgaard, Elitism
and Meritocracy in Developing Countries (Baltimore: Johns Hopkins Uni-versity Press, 1986), pp. 25, 45; Terry Martin, The Affirmative Action
Empire: Nations and Nationalism in the Soviet Union, 1923–1939 (Ithaca:Cornell University Press, 2001); Dorothy J. Solinger, ‘‘Minority Na-tionalities in China’s Yunnan Province: Assimilation, Power, and Pol-icy in a Socialist State,’’ World Politics, Vol. 30, No. 1 (October 1977),pp. 1–23; Miriam Jordan, ‘‘Quotas for Blacks in Brazil Cause Hub-bub,’’ Wall Street Journal, December 27, 2001, p. A6; Priscilla QolisayaPauamau, ‘‘A Post-colonial Reading of Affirmative Action in Edu-cation in Fiji,’’ Race, Ethnicity and Education, Vol. 4, No. 2 (2001),pp. 109–123; Matthew Hoddie, ‘‘Preferential Policies and the Blur-ring of Ethnic Boundaries: The Case of Aboriginal Australians in the1980s,’’ Political Studies, Vol. 50 (2002), pp. 293–312; MohammedWaseem, ‘‘Affirmative Action Policies in Pakistan,’’ Ethnic Studies Re-
port (Sri Lanka), Vol. XV, No. 2 ( July 1997), pp. 223–244; ‘‘NewZealand: Landmark Decisions,’’ The Economist, November 20, 1993,
≤≠≠ notes to pages 3 – 6
p. 93; Rainer Knopff, ‘‘The Statistical Protection of Minorities: Affir-mative Action in Canada,’’ Minorities and the Canadian State, edited byNeil Nevitte and Alan Kornberg (Cincinnati: Mosaic Press, 1985),pp. 87–106.
2. A. K. Vakil, Reservation Policy and Scheduled Castes in India (NewDelhi: Ashish Publishing House, 1985), p. 127.
3. Sham Satish Chandra Misra, Preferential Treatment in Public
Employment and Equality of Opportunity (Lucknow: Eastern Book Com-pany, 1979), p. 83.
4. Shri Prakash, ‘‘Reservations Policy for Other BackwardClasses: Problems and Perspectives,’’ The Politics of Backwardness: Reser-
vation Policy in India (New Delhi: Konark Publishers, Pvt. Ltd., 1997),pp. 44–45.
5. Gordon P. Means, ‘‘Ethnic Preference Policies in Malaysia,’’Ethnic Preference and Public Policy in Developing States, edited by NeilNevitte and Charles H. Kennedy (Boulder: Lynne Reinner Publishers,Inc., 1986), p. 108.
6. Nancy Lubin, Labour and Nationality in Soviet Central Asia: An
Uneasy Compromise (Princeton: Princeton University Press, 1984),p. 162.
7. David Riesman, On Higher Education: The Academic Enterprise in
an Age of Rising Student Consumerism (San Francisco: Jossey-Bass Pub-lishers, 1980), pp. 80–81. See also Thomas Sowell, Black Education:
Myths and Tragedies (New York: David McKay, 1972), pp. 131–132,140.
8. Editorial, ‘‘Reservations and the OBCs,’’ The Hindu (India),April 4, 2000.
9. Executive Order No. 10,925.10. Charles H. Kennedy, ‘‘Policies of Redistributional Preference
in Pakistan,’’ Ethnic Preference and Public Policy in Developing States, ed-ited by Neil Nevitte and Charles H. Kennedy, p. 69.
11. Donald L. Horowitz, Ethnic Groups in Conflict, p. 242.12. Mohammed Waseem, ‘‘Affirmative Action Policies in Paki-
stan,’’ Ethnic Studies Report (Sri Lanka), Vol. XV, No. 2 ( July 1997),pp. 226, 228–229.
13. Quoted in Alan Little and Diana Robbins, ‘Loading the Law’
(London: Commission for Racial Equality, 1982), p. 6.14. Donald L. Horowitz, Ethnic Groups in Conflict, p. 677.15. Myron Weiner, ‘‘The Pursuit of Ethnic Inequalities Through
Preferential Policies: A Comparative Public Policy Perspective,’’ From
Independence to Statehood: Managing Ethnic Conflict in Five African and

notes to pages 6 – 10 ≤≠∞
Asian States, edited by Robert B. Goldmann and A. Jeyaratnam Wilson(London: Frances Pinter, 1984), p. 64.
16. Cynthia H. Enloe, Police, Military and Ethnicity: Foundations of
State Power (New Brunswick: Transaction Books, 1980), p. 143.17. Ibid., p. 75.18. Ingeborg Fleischauer, ‘‘The Germans’ Role in Tsarist Russia:
A Reappraisal,’’ The Soviet Germans, edited by Edith Rogovin Frankel,pp. 17–18.
19. Numerous documented examples can be found in just twobooks of mine: Conquests and Cultures (Basic Books, 1998), pp. 43,124, 125, 168, 221–222; Migrations and Cultures (Basic Books, 1996),pp. 4, 17, 30, 31, 118, 121, 122–123, 126, 130, 135, 152, 154, 157,158, 162, 164, 167, 176, 177, 179, 182, 193, 196, 201, 211, 212, 213,215, 224, 226, 251, 258, 264, 265, 275, 277, 278, 289, 290, 297, 298,300, 305, 306, 310, 313, 314, 318, 320, 323–324, 337, 342, 345,353–354, 354–355, 355, 356, 358, 363, 366, 372–373. Extendingthe search for intergroup statistical disparities to the writings of oth-ers would of course increase the number of examples exponentially.
20. Bernard Grofman and Michael Migalski, ‘‘The Return of theNative: The Supply Elasticity of the American Indian Population1960–1980,’’ Public Choice, Vol. 57 (1988), p. 86.
21. Matthew Hoddie, ‘‘Preferential Policies and the Blurring ofEthnic Boundaries: The Case of Aboriginal Australians in the 1980s,’’Political Studies, vol. 50 (2002), p. 299.
22. Wolfgang Kasper, Building Prosperity: Australia’s Future as a
Global Player (St. Leonard’s, NSW: The Centre for Independent Stud-ies, 2002), p. 45.
23. Barry Sautman, ‘‘Ethnic Law and Minority Rights in China:Progress and Constraints,’’ Law & Policy, Vol. 21, No. 3 ( July 3, 1999),p. 294.
24. ‘‘Chinese Rush to Reclaim Minority Status,’’ Agence France
Presse, May 17, 1993.25. See, for example, ‘‘Indians: In the Red,’’ The Economist, Feb-
ruary 25, 1989, pp. 25–26; Bob Zelnick, Backfire: A Reporter Looks at
Affirmative Action (Washington, D.C.: Regner Publishing Inc., 1996),pp. 301–303.
26. Celia S. Heller, On the Edge of Destruction: Jews of Poland Between
the Two World Wars (New York: Columbia University Press, 1987),p. 102.
27. Maria S. Muller, ‘‘The National Policy of Kenyanisation: ItsImpact on a Town in Kenya,’’ Canadian Journal of African Studies, Vol.
≤≠≤ notes to pages 11 – 15
15, No. 2 (1981), p. 298; H. L. van der Laan, The Lebanese Traders in
Sierra Leone (The Hague: Mouton & Co., 1975), pp. 141, 171.28. ‘‘Indian Eunuchs Demand Government Job Quotas,’’ Agence
France Presse, October 22, 1997. See also David Orr, ‘‘Eunuchs TestTheir Political Potency,’’ The Times (London), February 17, 2000,downloaded from the Internet: http://www.the-times.co.uk/pages/tim/2000/02/17/timfgnasi01001.html?1123027.
29. Marc Galanter, Competing Equalities: Law and the Backward
Classes in India (Berkeley: University of California Press, 1984), p. 64.30. Human Rights Watch, Broken People: Caste Violence Against In-
dia’s ‘‘Untouchables’’ (New York: Human Rights Watch, 1999), p. 39.31. ‘‘Rajasthan’s ‘Original Backwards’ Rally for Justice,’’ The
Hindu, May 28, 2001. (on-line)32. ‘‘India: Mayawati Expels Three Leaders,’’ The Hindu, July 22,
2001. (on-line)33. Marc Galanter, Competing Equalities, p. 469.34. Ozay Mehmet, ‘‘An Empirical Evaluation of Government
Scholarship Policy in Malaysia,’’ Higher Education (The Netherlands),April 1985, p. 202.
35. Chandra Richard de Silva, ‘‘Sinhala-Tamil Relations in SriLanka: The University Admissions Issue—The First Phase, 1971–1977,’’ From Independence to Statehood, edited by Robert B. Goldmannand A. Jeyaratnam Wilson, p. 133.
36. Rep. David Dreir, ‘‘ ‘Disadvantaged’ Contractors’ Unfair Ad-vantage,’’ Wall Street Journal, February 21, 1989, p. A18.
37. Marc Galanter, Competing Equalities, p. 552.38. Myron Weiner, Sons of the Soil: Migration and Ethnic Conflict in
India (Princeton: Princeton University Press), p. 250.39. John A. A. Ayoade, ‘‘Ethnic Management of the 1979 Nige-
rian Constitution,’’ Canadian Review of Studies in Nationalism, Spring1987, p. 127.
40. Donald L. Horowitz, Ethnic Groups in Conflict, p. 670.41. Daniel C. Thompson, Private Black Colleges at the Crossroads
(Westport, Connecticut: Greenwood Press, 1973), p. 88.42. Carol S. Holzbery, Minorities and Power in a Black Society: The
Jewish Community of Jamaica (Lanham, Maryland: The North-SouthPublishing Co., Inc., 1987), p. 420.
43. See, for example, William Moore, Jr., and Lonnie H. Wagstaff,Black Educators in White Colleges (San Francisco: Jossey-Bass PublishingCo., 1974), pp. 130–131, 198.
44. Bob Zelnick, Backfire, p. 113.
notes to pages 17 – 20 ≤≠≥
45. Lelah Dushkin, ‘‘Backward Class Benefits and Social Class inIndia, 1920–1970,’’ Economic and Political Weekly, April 7, 1979, p. 666.Although the example is hypothetical, it is not out of line with whathas actually occurred: ‘‘Although 18% of the places in each of the twoservices were reserved for Scheduled Castes, there was just one suc-cessful SC candidate, who had scored 105th on the examination.’’Marc Galanter, Competing Equalities, p. 425.
46. Barbara R. Joshi, ‘‘Whose Law, Whose Order: ‘Untouchables’Social Violence and the State in India,’’ Asian Survey, July 1982,pp. 680, 682.
47. A. K. Vakil, Reservation Policy and Scheduled Castes in India,
p. 67; Ghagat Ram Goyal, Educating Harijans (Gurgaon, Haryana: TheAcademic Press, 1981), p. 21.
48. Suma Chitnis, ‘‘Positive Discrimination in India with Refer-ence to Education,’’ From Independence to Statehood, edited by Robert B.Goldmann and A. Jeyaratram Wilson, p. 37; Padma RamkrishnaVelaskar, ‘‘Inequality in Higher Education: A Study of ScheduledCaste Students in Medical Colleges of Bombay,’’ Ph.D. Dissertation,Tata Institute of Social Sciences, Bombay, 1986, pp. 234, 236.
49. Myron Weiner and Mary Fainsod Katzenstein, India’s Preferen-
tial Policies: Migrants, The Middle Classes, and Ethnic Equality (Chicago,University of Chicago Press, 1981), p. 54.
50. Ibid., pp. 54, 55.51. Harold Crouch, Government and Society in Malaysia (Ithaca:
Cornell University Press, 1996), p. 186.52. K. M. de Silva, Sri Lanka: Ethnic Conflict, Management and Reso-
lution (Kandy, Sri Lanka: International Centre for Ethnic Studies,1996), p. 21.
53. Celia Heller, On the Edge of Destruction: Jews of Poland Between the
Two World Wars (New York: Columbia University Press, 1987), pp. 16,17, 107, 123–128; Ezra Mendelsohn, The Jews of East Central Europe
Between the World Wars (Bloomington: Indiana University Press, 1983),pp. 99, 105, 167, 232, 236–237.
54. Larry Diamond, ‘‘Class, Ethnicity, and the Democratic State:Nigeria, 1950–1966,’’ Comparative Studies in Social History, July 1983,pp. 462, 473.
55. Donald L. Horowitz, Ethnic Groups in Conflict, pp. 221–226;Myron Weiner and Mary Fainsod Katzenstein, India’s Preferential Pol-
icies, pp. 4–5, 132; Myron Weiner, ‘‘The Pursuit of Ethnic EqualityThrough Preferential Policies: A Comparative Public Policy Perspec-tive,’’ From Independence to Statehood, edited by Robert B. Goldmann
≤≠∂ notes to pages 20 – 25
and A. Jeyaratram Wilson, p. 78; K. M. de Silva, ‘‘University Ad-missions and Ethnic Tensions in Sri Lanka,’’ Ibid., pp. 125–126;Donald V. Smiley, ‘‘French-English Relations in Canada and Con-sociational Democracy,’’ Ethnic Conflict in the Western World, edited byMilton J. Esman (Ithaca: Cornell University Press, 1977), pp. 186–188.
56. U.S. Bureau of the Census, Historical Statistics of the United
States: Colonial Times to 1970 (Washington: Government Printing Of-fice, 1975), p. 380.
57. Daniel P. Moynihan, ‘‘Employment, Income, and the Ordealof the Negro Family,’’ Daedalus, Fall 1965, p. 752.
58. Stephan Thernstrom and Abigail Thernstrom, America in
Black and White: One Nation, Indivisible (New York: Simon and Schuster,1997), p. 232.
59. Ibid., p. 50.
chapter 2: AFFIRMATIVE ACTION IN INDIA
1. See, for example, Lelah Dushkin, ‘‘Backward Class Benefitsand Social Class in India, 1920–1970,’’ Economic and Political Weekly,
April 7, 1979, p. 661; Marc Galanter, Competing Equalities: Law and
the Backward Classes in India (Berkeley: University of California Press,1984), Chapter 2.
2. Kanti Bajpai, ‘‘Diversity, Democracy, and Devolution in In-dia,’’ Government Policies and Ethnic Relations in Asia and the Pacific,
edited by Michael E. Brown and Sumit Ganguly (Cambridge, Mas-sachusetts: MIT Press, 1997), pp. 53–54; John Echeverri-Gent, ‘‘Gov-ernment and Politics,’’ India: A Country Study, edited by James Heitz-man and Robert L. Worden (Washington: U.S. Government PrintingOffice, 1996), pp. 437–438.
3. Partha S. Ghosh, ‘‘Positive Discrimination in India: A PoliticalAnalysis,’’ Ethnic Studies Report (Sri Lanka), Vol. XV, No. 2 ( July 1997),p. 145.
4. Partap C. Aggarwal and Mohd. Siddig Ashraf, Equality Through
Privilege: A Study of Special Privileges of Scheduled Castes in Haryana (NewDelhi: Shri Ram Centre for Industrial Relations and Human Re-sources, 1976), p. 4; Richard F. Nyrop et al., Area Handbook for India
(Washington: Government Printing Office, 1975), p. 51.5. Keesing’s Contemporary Archives, December 8, 1978, p. 29351.6. Report of the Commission for Scheduled Castes and Scheduled Tribes
(April 1979–March 1980), Second Report (New Delhi, 1981), p. 297.
notes to pages 26 – 30 ≤≠∑
7. Human Rights Watch, Broken People: Caste Violence Against In-
dia’s Untouchables (New York: Human Rights Watch, 1999).8. ‘‘Caste and The Durban Conference,’’ The Hindu, August 31,
2001.9. Doranne Jacobson, ‘‘Social Systems,’’ India: A Country Study,
edited by James Heitzman and Robert L. Worden (Washington: U.S.Government Printing Office, 1996), p. 273.
10. Partha S. Ghosh, ‘‘Positive Discrimination in India: A PoliticalAnalysis,’’ Ethnic Studies Report (Sri Lanka), Vol. XV, No. 2 ( July 1997),p. 146.
11. Partha S. Ghosh, ‘‘Language Policy and National Integra-tion,’’ Ethnic Studies Report (Sri Lanka), Vol. XIV, No. 1 ( January 1996),144; ‘‘Still Untouchable,’’ The Economist (US edition), June 16, 2001.
12. John R. Wood, ‘‘Reservations in Doubt: The Backlash againstAffirmative Action in Gujarat, India,’’ Pacific Affairs, Vol. 60, No. 3(Autumn 1987), p. 413.
13. Partha S. Ghosh, ‘‘Language Policy and National Integra-tion,’’ Ethnic Studies Report (Sri Lanka), Vol. XIV, No. 1 ( January1996), pp. 159, 160.
14. Michael E. Brown and Sumit Ganguly, editors, Government
Policies and Ethnic Relations in Asia and the Pacific, p. 54.15. Partap C. Aggarwal and Mohd. Siddig Ashraf, Equality Through
Privilege, p. 49. A 1981 study reported: ‘‘When asked to state if theythemselves or any of their close relatives have ever suffered from ill-treatment due to their caste status, the overwhelming majority of bothschool (78%) and college (71%) students reply in the negative.’’Suma Chitnis, A Long Way to Go, p. 147.
16. Human Rights Watch, Broken People, p. 31.17. ‘‘Reservation Policy Not Implemented in Full,’’ The Hindu
(India), November 18, 2001. (on-line)18. Dennis Austin, Democracy and Violence in India and Sri Lanka
(London: Pinter Publishers, 1994), p. 41.19. Partap C. Aggarwal and Mohd. Siddig Ashraf, Equality Through
Privilege, p. 31.20. K. M. de Silva, Managing Ethnic Tensions in Multi-Ethnic So-
cieties: Sri Lanka, 1880–1985 (Lanham, Maryland: University Press ofAmerica, 1986), p. 39.
21. Marc Galanter, Competing Equalities, p. 26n.22. Partha S. Ghosh, ‘‘Language Policy and National Integra-
tion,’’ Ethnic Studies Report (Sri Lanka), Vol. XIV, No. 1 ( January1996), p. 139.
≤≠∏ notes to pages 30 – 33
23. Kusum K. Premi, ‘‘Educational Opportunities for the Sched-uled Castes: Role of Protective Discrimination in Equalisation,’’ Eco-
nomic and Political Weekly, November 9, 1974, p. 1907.24. Suma Chitnis, ‘‘Positive Discrimination in India with Refer-
ence to Education,’’ From Independence to Statehood: Managing Ethnic
Conflict in Five African and Asian States, edited by Robert B. Goldmannand A. Jeyaratnam Wilson (London: Francis Pinter, 1984), pp. 36–37.
25. See Suma Chitnis, ‘‘Positive Discrimination in India with Ref-erence to Education,’’ From Independence to Statehood, edited by Rob-ert B. Goldmann and A. Jeyaratnam Wilson, p. 37; Padma RamkrishnaVelaskar, ‘‘Inequality in Higher Education: A Study of ScheduledCaste Students in Medical Colleges of Bombay,’’ Ph.D. Dissertation,Tata Institute of Social Sciences, Bombay, 1986, p. 234.
26. P. R. Velaskar, op. cit., p. 236.27. Partha S. Ghosh, ‘‘Language Policy and National Integra-
tion,’’ Ethnic Studies Report (Sri Lanka), Vol. XIV, No. 1 ( January1996), p. 142.
28. P. Sunderarajan, ‘‘India: Medical Colleges, Varsities Told toFollow UGC Norms,’’ The Hindu, September 14, 2001. (on-line)
29. Partha S. Ghosh, ‘‘Language Policy and National Integra-tion,’’ Ethnic Studies Report (Sri Lanka), Vol. XIV, No. 1 ( January 1996),p. 158; Padma Ramkrishna Velaskar, ‘‘Inequality in Higher Education:A Study of Scheduled Caste Students in Medical Colleges of Bombay,’’Ph.D. dissertation, Tata Institute of Social Sciences, Bombay, 1986,pp. 253, 335, 336; Marc Galanter, Competing Equalities, pp. 63–64.
30. Suma Chitnis, ‘‘Measuring up to Reserved Admissions,’’ Reser-
vation: Policy, Programmes and Issues, edited by Vimal P. Shah andBinod C. Agrawal ( Jaipur, India: Rawat Publications, 1986), pp. 37–42.
31. Partha S. Ghosh, ‘‘Language Policy and National Integra-tion,’’ Ethnic Studies Report (Sri Lanka), Vol. XIV, No. 1 ( January1996), p. 140.
32. Marc Galanter, Competing Equalities, p. 425.33. Partha S. Ghosh, ‘‘Language Policy and National Integra-
tion,’’ Ethnic Studies Report (Sri Lanka), Vol. XIV, No. 1 ( January1996), p. 142; Michael E. Brown and Sumit Ganguly, editors, Govern-
ment Policies and Ethnic Relations in Asia and the Pacific, p. 54.34. Partha S. Ghosh, ‘‘Language Policy and National Integra-
tion,’’ Ethnic Studies Report (Sri Lanka), Vol. XIV, No. 1 ( January1996), p. 142.
35. Marc Galanter, Competing Equalities, pp. 64–65.
notes to pages 33 – 35 ≤≠π
36. P. R. Velaskar, ‘‘Inequality in Higher Education,’’ p. 263.37. Suma Chitnis, A Long Way To Go . . . (New Delhi: Allied Pub-
lishers, Pvt. Ltd., 1981), p. 19.38. Ibid., p. 264.39. Report of the Commission for Scheduled Castes and Scheduled Tribes
( July 1978–March 1979), First Report, p. 188. See also Suma Chitnis,A Long Way to Go . . . , p. 16.
40. Suma Chitnis, A Long Way To Go . . . , p. 16.41. Ibid., pp. 16, 320.42. Pradeep Kumar, ‘‘Reservations within Reservations,’’ Eco-
nomic and Political Weekly, September 15, 2001, p. 3505.43. ‘‘UP Announces Ordinance on Quota,’’ The Statesman (In-
dia), September 16, 2001 (downloaded from the Internet).44. ‘‘Quota-Within-Quota Move Motivated,’’ The Hindu, Janu-
ary 26, 2002 (downloaded from the Internet).45. Marc Galanter, Competing Equalities, pp. 468, 469.46. Ratna Murdia, ‘‘Issues in Positive Discrimination Policies for
Disadvantaged Groups,’’ The Indian Journal of Social Work, January1983, p. 437; Suma Chitnis, ‘‘Education for Equality: Case of Sched-uled Castes in Higher Education,’’ Economic and Political Weekly,
August 1972, p. 1676; Oliver Mendelsohn, ‘‘A Harijan Elite? TheLives of Some Untouchable Politicians,’’ Economic and Political Weekly,
March 22, 1986, p. 504; Suma Chitnis, A Long Way To Go . . . ,
pp. 16–18.47. Upendra Baxi, ‘‘Legislative Reservations for Social Justice:
Some Thoughts on India’s Unique Experiment,’’ From Independence to
Statehood, edited by Robert B. Goldmann and A. Jeyaratnam Wilson,pp. 215–216. See also M. Satyanarayana and Rao and G. SrinivasReddy, ‘‘Political Representation: National, State and Local,’’ Reserva-
tion Policy in India, edited by B. A. V. Sharma and K. MadhusudhanReddy (New Delhi: Light & Life Publishers, 1982), pp. 365–367;Pradeep Kumar, ‘‘Reservations within Reservations,’’ Economic and Po-
litical Weekly, September 15, 2001.48. B. Sivaramayya, ‘‘Affirmative Action: The Scheduled Castes
and the Scheduled Tribes,’’ International Conference on AffirmativeAction, Bellagio Conference Center, Bellagio, Italy, August 16–20,1982, p. 2.
49. Marc Galanter, Competing Equalities, p. 338.50. Ibid., pp. 44, 46; Michael E. Brown and Sumit Garguly, edi-
tors, Government Policies and Ethnic Relations in Asia and the Pacific,
pp. 53, 54.
≤≠∫ notes to pages 35 – 43
51. See, for example, Myron Weiner, Sons of the Soil: Migration and
Ethnic Conflict in India (Princeton: Princeton University Press, 1978);Mary Fainsod Katzenstein, Ethnicity and Equality: The Shiv Sena Party
and Preferential Policies in Bombay (Ithaca: Cornell University Press,1979); Myron Weiner and Mary Fainsod Katzenstein, India’s Preferen-
tial Policies: Migrants, the Middle Classes and Ethnic Equality (Chicago:University of Chicago Press, 1981).
52. Myron Weiner and Mary Fainsod Katzenstein, India’s Preferen-
tial Policies, p. 102.53. Myron Weiner, Sons of the Soil, pp. 235–243.54. Ibid., p. 250.55. T. M. Joseph and S. N. Sangita, ‘‘Preferential Policies and
‘Sons-of-the-Soil’ Demands: The Indian Experience,’’ Ethnic Studies
Report (Sri Lanka), Vol. XVI, No. 1 ( January 1998), p. 86.56. Myron Weiner and Mary Fainsod Katzenstein, India’s Preferen-
tial Policies, p. 68.57. Allen W. Thrasher, ‘‘Language, Ethnicity, and Regionalism,’’
India: A Country Study, edited by Louis R. Mortimer (Washington: U.S.Government Printing Office, 1996), pp. 215–216.
58. Myron Weiner, Sons of the Soil, pp. 225–229; Myron Weinerand Mary Fainsod Katzenstein, India’s Preferential Policies, pp. 74–75.
59. Myron Weiner, Sons of the Soil, pp. 88–89; Amalendo Guha,‘‘Colonisation of Assam: Second Phase 1840–1859,’’ The Indian Eco-
nomic and Social History Review, December 1961, p. 292.60. Myron Weiner, Sons of the Soil, p. 78.61. Ibid., pp. 128–129.62. Ibid., pp. 92, 105.63. Ibid., pp. 103–104.64. Ibid., p. 107.65. Ibid., p. 109.66. Ibid., pp. 118–119.67. Myron Weiner, ‘‘The Political Demography of Assam’s Anti-
Immigrant Movement,’’ Population and Development Review, Vol. 9, No.2 ( January 1983), p. 279.
68. Mary Fainsod Katzenstein, Ethnicity and Equality, p. 142.69. Ibid., p. 28.70. Myron Weiner and Mary Fainsod Katzenstein, India’s Preferen-
tial Policies, p. 52.71. Ibid., p. 48.72. Mary Fainsod Katzenstein, Ethnicity and Equality, pp. 48–49.73. Ibid., pp. 69, 106, 142.
notes to pages 44 – 55 ≤≠Ω
74. ‘‘The Fire of India’s Religions,’’ The Economist, January 16,1993, p. 2.
75. ‘‘Devils and Enemies,’’ Far Eastern Economic Review, July 7,1994.
76. ‘‘Demagogue of Hate,’’ Asiaweek, December 22, 1995, p. 52.77. ‘‘A Hindu Hero Feels the Heat,’’ Time, International edition,
Tokyo, February 24, 1997, p. 15.78. ‘‘Bombay has Spun out of Control,’’ Businessweek, October 19,
1998, p. 2.79. ‘‘Ugly Intolerance,’’ The Hindu, May 8, 2001, downloaded
from the Internet.80. ‘‘What is ‘Indian’?’’ The Hindu, March 11, 2001, downloaded
from the Internet.81. Dennis Austin, Democracy and Violence in India and Sri Lanka,
p. 43.82. Ibid., 42.83. ‘‘Singh Faces Revolt Over Caste Scheme: The Indian Govern-
ment Has Been Rocked by the Violent Response to Increased JobQuotas for Backward Castes,’’ The Independent (London), Septem-ber 11, 1990, p. 12.
84. The ‘‘other backward classes’’ alone are 52 percent of India’spopulation, the untouchables 16 percent and tribal peoples 8 percent.
85. Marc Galanter, Competing Equalities, p. 64.86. John R. Wood, ‘‘Reservations in Doubt: The Backlash against
Affirmative Action in Gujarat, India,’’ Pacific Affairs, Vol. 60, No. 3(Autumn 1987), p. 408.
87. Marc Galanter, Competing Equalities, p. 451.88. Ibid., p. 451n.89. A. K. Vakil, Reservation Policy and Scheduled Castes in India (New
Delhi: Ashish Publishing House, 1985), p. 147.90. C. L. Sharma, Social Mobility Among Scheduled Castes (New
Delhi: M. D. Publications, 1996), pp. 105–107.
chapter 3: AFFIRMATIVE ACTION IN MALAYSIA
1. Computed from Buku Tahunan Peranghaan: Yearbook of Statis-
tics Malaysia 2001 (Ketua Perangkawan, Malaysia: Department of Sta-tistics, 2001), pp. 20, 28, 29.
2. Lennox A. Mills, Southeast Asia: Illusion and Reality in Politics
and Economics (Minneapolis: University of Minnesota Press, 1964).3. The Economist Intelligence Unit, Malaysia, Brunei, p. 14.
≤∞≠ notes to pages 56 – 61
4. Computed from Buku Perangkaan, 28.5. See the classic study by Victor Purcell, The Overseas Chinese in
Southeast Asia, 2nd edition (Kuala Lumpur: Oxford University Press,1980).
6. P. T. Bauer, Reality and Rhetoric: Studies in the Economics of Devel-
opment (Cambridge, Massachusetts: Harvard University Press, 1984),p. 7.
7. Victor Simpao Limlingan, Overseas Chinese in ASEAN: Business
Strategies and Management Practices (Pasig, Metro Manila, Philippines:Vita Development Corp., 1986), p. 29.
8. Ibid., p. 30.9. Donald R. Snodgrass, Inequality and Economic Development in
Malaysia (Kuala Lumpur: Oxford University Press, 1980), p. 38.10. D. G. E. Hall, The History of Southeast Asia (London: The Mac-
millan Company, Ltd., 1981), p. 835.11. Buku Perangkaan, 42; K. S. Jomo, ‘‘Whither Malaysia’s New
Economic Policy?’’ Pacific Affairs, Vol. 63, No. 4 (Winter, 1990–1991),p. 475.
12. Victor Purcell, The Chinese in Southeast Asia, second edition,p. 283n.
13. Yuan-li Wu and Chu-hsi Wu, Economic Development in Southeast
Asia (Stanford: Hoover Institution Press, 1980), p. 51.14. Donald R. Snodgrass, Inequality and Economic Development in
Malaysia, 242.15. Ibid., p. 8.16. Mohamed Suffian bin Hashim, ‘‘Problems and Issues of
Higher Education Development in Malaysia,’’ Development of Higher
Education in Southeast Asia, edited by Yip Yat Hoong, Table 8, pp. 63,64.
17. Gordon P. Means, ‘‘Ethnic Preference Policies in Malaysia,’’Ethnic Preference and Public Policy in Developing States, edited by NeilNevitte and Charles H. Kennedy (Boulder: Lynne Reinner Publishers,Inc., 1986), p. 105.
18. Michael E. Brown and Sumit Ganguly, editors, Government
Policies and Ethnic Relations in Asia and the Pacific (Cambridge, Mas-sachusetts: MIT Press, 1997), p. 254.
19. Mid-Term Review of the Second Malaysia Plan, 1971–75 (KualaLumpur: The Government Press, 1973), pp. 76, 78.
20. Sumit Ganguly, ‘‘Ethnic Policies and Political Quiescence inMalaysia and Singapore,’’ Government Policies and Ethnic Relations in
notes to pages 61 – 65 ≤∞∞
Asia and the Pacific, edited by Michael E. Brown and Sumit Ganguly,pp. 260–262.
21. Eighth Malaysia Plan, 2001–2005 (Kuala Lumpur: EconomicPlanning Unit, 2001), p. 64.
22. Harold A. Crouch, Government and Society in Malaysia (Ithaca:Cornell University Press, 1996), pp. 37–38.
23. Ibid., p. 39.24. Ibid., pp. 36–43.25. Ibid., pp. 40, 41.26. Ibid., p. 202.27. Ibid., p. 39.28. K. S. Jomo, ‘‘Whither Malaysia’s New Economic Policy,’’ Pa-
cific Affairs, Vol. 63, No. 4 (Winter, 1990–1991), pp. 469–499.29. Bee-lan Chan Wang, ‘‘Governmental Intervention in Ethnic
Stratification: Effects of the Distribution of Students Among Fields ofStudy,’’ Comparative Education Review, February 1977, p. 110.
30. Donald R. Snodgrass, Inequality and Economic Development in
Malaysia, pp. 249–250.31. Firdaus Hj. Abdullah, ‘‘Affirmative Action Policy in Malaysia:
To Restructure Society, to Eradicate Poverty,’’ Ethnic Studies Report (SriLanka), Vol. XV, No. 2 ( July 1997), p. 209.
32. Mohamed Suffian bin Hashim, ‘‘Problems and Issues ofHigher Education Development in Malaysia,’’ Development of Higher
Education in Southeast Asia, edited by Yip Yat Hoong, Table 8, pp. 63, 64.33. Mid-Term Review of the Second Malaysia Plan, 1971–1975, p. 85.34. Tai Yoke Lin, ‘‘Inter-Ethnic Restructuring in Malaysia, 1970–
1980: The Employment Perspective,’’ From Independence to Statehood:
Managing Ethnic Conflict in Five African and Asian States, edited byRobert B. Goldmann and A. Jeyaratnam Wilson (London: FrancesPitner, Ltd., 1984), p. 50.
35. Ibid., p. 349.36. Ibid., p. 352.37. Ibid., p. 349.38. Michael E. Brown and Sumit Ganguly, editors, Government
Policies and Ethnic Relations in Asia and the Pacific, p. 259.39. Fourth Malaysia Plan, 1981–85 (Kuala Lumpur: National
Printing Department, 1981), p. 350.40. Ibid., pp. 490–491.41. Ibid., p. 489.42. K. S. Jomo, ‘‘Whither Malaysia’s New Economic Policy,’’ Pa-
cific Affairs, Vol. 63, No. 4 (Winter, 1990–1991), p. 475.
≤∞≤ notes to pages 65 – 71
43. Michael E. Brown and Sumit Ganguly, editors, Government
Policies and Ethnic Relations in Asia and the Pacific, pp. 257–258.44. In defending his change in policy, Prime Minister Mahathir
said, ‘‘We can’t let the efficiency and capability of our people be lowerthan those of other countries,’’ Deutsche Presse-Agentur, June 20, 1995on-line, which also reported ‘‘declining levels of attainment in scienceand technology’’ and that ‘‘many employers now prefer graduates withforeign degrees. At the very least, these youngsters usually have a goodcommand in English.’’ The Financial Times of London likewise re-ported that ‘‘a lack of skilled labour is identified by foreign investors’’as ‘‘the single biggest problem in an otherwise attractive businessenvironment’’ in Malaysia, and that foreign businesses were payingsubstantial pay increases to get and retain skilled engineers. Financial
Times, June 19, 1996, on-line.45. The Economist Intelligence Unit, Malaysia, Brunei, p. 15.46. Ishak Shari, ‘‘Economic Growth and Income Inequality in
Malaysia, 1971–1995,’’ Journal of Asia Pacific Economy, Vol. 5, No. 1(2000), p. 113.
47. Ibid., pp. 119, 120.48. Ishak Shari, ‘‘Economic Growth and Income Inequality in Ma-
laysia, 1971–95,’’ Journal of Asia Pacific Economy, Vol. 5, No. 1 (2000),114; Edmund Terence Gomez, Chinese Business in Malaysia: Accumula-
tion, Accommodation and Ascendance (Honolulu: University of HawaiiPress, 1999), p. 69.
49. Edmund Terence Gomez, Chinese Business in Malaysia, p. 70.50. Harold A. Crouch, Government and Society in Malaysia, p. 186.51. Mavis Puthucheary, ‘‘Public Policies Relating to Business and
Land, and the Impact on Ethnic Relations in Peninsular Malaysia,’’From Independence to Statehood, edited by Robert B. Goldmann andA. Jeyaratnam Wilson, p. 163.
52. Ibid., p. 164.53. Mahathir bin Mohamad, The Malay Dilemma (Singapore: Asia
Pacific Press, 1970), p. 44.54. Eighth Malaysia Plan 2001–2005 (Kuala Lumpur, Malaysia:
Economic Planning Unit, 2001), p. 84.55. Seventh Malaysia Plan 1996–2000 (Kuala Lumpur: Economic
Planning Unit, 1996), p. 86.56. Donald R. Snodgrass, Inequality and Economic Development in
Malaysia, p. 107.57. Gordon P. Means, ‘‘Ethnic Preference Policies in Malaysia,’’
notes to pages 71 – 81 ≤∞≥
Ethnic Preference and Public Policy in Developing States, edited by NeilNevitte and Charles H. Kennedy, p. 105.
58. Tai Yoke Lin, ‘‘Ethnic Restructuring in Malaysia, 1979–80:The Employment Perspective,’’ From Independence to Statehood, editedby Robert B. Goldmann and A. Jeyaratnam Wilson, p. 48.
59. Ibid., p. 50.60. Fourth Malaysia Plan, 1981–1985, p. 349.61. Michael E. Brown and Sumit Ganguly, editors, Government
Policies and Ethnic Relations in Asia and the Pacific, p. 234.62. Tania Li, Malays in Singapore: Culture, Economy, and Ideology
(Singapore: Oxford University Press, 1989), p. 115.63. Ibid., p. 134.64. Ibid.
65. ‘‘Our Malays are Happier Than Yours,’’ The Economist, Febru-ary 3, 2001, p. 43.
66. Donald L. Horowitz, Ethnic Groups in Conflict, p. 670.67. ‘‘Not One But Two New Malay Dilemmas,’’ Straits Times
(Singapore), August 1, 2002, downloaded from the Internet.68. ‘‘Mahathir’s Change of Heart?’’ Business Week (International
editions), July 29, 2002, p. 20.69. Government of Malaysia, The Sixth Malaysia Plan 1991–1995
(Kuala Lumpur: National Printing Department of Malaysia, 1991),p. 3; Seventh Malaysia Plan 1996–2000 (Kuala Lumpur: PercetakanNasional Malaysia Berhad, 1996), p. 69.
70. Gordon P. Means, ‘‘Ethnic Preference Policies in Malaysia,’’Ethnic Preference and Public Policy in Developing States, edited by NeilNevitte and Charles H. Kennedy, p. 114.
71. ‘‘Discriminating Policies,’’ Wall Street Journal, September 11,2000, p. A44.
72. ‘‘Race-based Awarding of Contracts Hurting Malaysia,’’ The
Straits Times (Singapore), January 8, 2002, p. 14 (on-line).
chapter 4: AFFIRMATIVE ACTION IN SRI LANKA
1. One riot between Muslims and Hindus in 1915 was the onlyblemish on this record in the first half of the twentieth century.
2. K. M. de Silva, ‘‘Historical Survey,’’ Sri Lanka: A Survey, editedby K. M. de Silva (Honolulu: The University Press of Hawaii, 1977),p. 84.
3. S. J. Tambiah, ‘‘Ethnic Representation in Ceylon’s Higher
≤∞∂ notes to pages 82 – 85
Administrative Service, 1870–1946,’’ University of Ceylon Review,
April–July 1955, pp. 127, 128.4. Ibid., p. 130.5. K. No. O. Dharmadasa, Language, Religion, and Ethnic Asser-
tiveness: The Growth of Sinhalese Nationalism in Sri Lanka (Ann Arbor:University of Michigan Press, 1992), p. 228.
6. S. J. Tambiah, ‘‘Ethnic Representation in Ceylon’s HigherAdministrative Services, 1870–1946,’’ University of Ceylon Review, Vol.13 (1955), p. 130.
7. W. Ivor Jennings, ‘‘Race, Religion and Economic Opportu-nity in the University of Ceylon,’’ University of Ceylon Review, November1944, p. 2.
8. S. J. Tambiah, ‘‘Ethnic Representation in Ceylon’s Higher Ad-ministrative Service, 1870–1946,’’ University of Ceylon Review, April–July 1955, pp. 125–136.
9. K. No. O. Dharmadasa, Language, Religion, and Ethnic Asser-
tiveness, p. 242.10. Chandra Richard de Silva, ‘‘Sinhala-Tamil Ethnic Rivalry:
The Background,’’ From Independence to Statehood: Managing Ethnic Con-
flict in Five African and Asian States, edited by Robert B. Goldmann andA. Jeyaratnam Wilson (London: Frances Pinter, Ltd., 1984), p. 116.See also Chandra Richard de Silva, ‘‘Sinhala-Tamil Relations and Edu-cation in Sri Lanka: University Admissions Issue—The First Phase,’’Ibid., p. 136.
11. S. W. R. de A. Samarasinghe, ‘‘Ethnic Representation in Cen-tral Government Employment and Sinhala-Tamil Relations in SriLanka: 1948–81,’’ Ibid., p. 176.
12. Ibid., p. 177.13. C. Kondapi, Indians Overseas 1838–1949 (New Delhi: Oxford
University Press, 1951), p. 344.14. H. P. Chattopadhyaya, Indians in Sri Lanka: A Historical Study
(Calcutta: O.P.S. Publishers, Pvt., Ltd., 1979), pp. 143, 144, 146.15. C. Kondapi, Indians Overseas 1838–1949, pp. 344–347.16. Walter Schwarz, Tamils of Sri Lanka (London: Minority Rights
Group, 1983), p. 5.17. Robert N. Kearney, Communalism and Language in the Politics of
Ceylon (Durham: Duke University Press, 1967), pp. 70–72.18. Robert N. Kearney, ‘‘Sinhalese Nationalism and Social Con-
flict in Ceylon,’’ Pacific Affairs, Summer 1964, pp. 125–128.19. Robert N. Kearney, Communalism and Language in the Poli-
tics of Ceylon, pp. 80–81; William McGowan, Only Man is Vile: The
notes to pages 86 – 90 ≤∞∑
Tragedy of Sri Lanka (New York: Farrar, Straus and Giroux, 1992),pp. 149–58.
20. William McGowan, Only Man is Vile, pp. 158–161.21. Chandra Richard de Silva, ‘‘Sinhala-Tamil Relations and Edu-
cation in Sri Lanka: The University Admissions Issue—The FirstPhase, 1971–7,’’ From Independence to Statehood, edited by Robert B.Goldmann and A. Jeyaratnam Wilson, p. 138. See also p. 127.
22. Robert N. Kearney, ‘‘Sinhalese Nationalism and Social Con-flict in Ceylon,’’ Pacific Affairs, Summer 1964, p. 130.
23. K. M. de Silva, ‘‘University Admissions and Ethnic Tension inSri Lanka, 1977–82,’’ From Independence to Statehood, edited by Rob-ert B. Goldmannn and A. Jeyaratnam Wilson, p. 98.
24. Robert N. Kearney, ‘‘Sinhalese Nationalism and Social Con-flict in Ceylon,’’ Pacific Affairs, Summer 1964, p. 135.
25. Chandra Richard de Silva, ‘‘Sinhala-Tamil Ethnic Rivalry:The Background,’’ From Independence to Statehood, edited by Robert B.Goldmann and A. Jeyaratnam Wilson, p. 121.
26. Robert N. Kearney, Communalism and Language in the Politics of
Sri Lanka, pp. 84–86.27. K. M. de Silva, ‘‘University Admissions and Ethnic Tension in
Sri Lanka, 1977–82,’’ From Independence to Statehood; edited by Rob-ert B. Goldmann and A. Jeyaratnam Wilson, pp. 100–101.
28. Chandra Richard de Silva, ‘‘Sinhala-Tamil Relations and Edu-cation in Sri Lanka: The University Admissions Issue—the FirstPhase, 1971–7,’’ Ibid., pp. 128–131.
29. Walter Schwarz, The Tamils of Sri Lanka, p. 6.30. S. J. Tambiah, Sri Lanka: Ethnic Fratricide and the Dismantling of
Democracy (Delhi: Oxford University Press, 1986), pp. 20–21, 26.31. Ibid., p. 20.32. William McGowan, Only Man is Vile, p. 97.33. Ibid., p. 98.34. ‘‘Sri Lanka Confirms Report of Army Slayings,’’ New York
Times, August 7, 1983, Section 1, p. 5.35. ‘‘The Unloveliness of Civil War,’’ The Economist, August 18,
1984, p. 27.36. ‘‘India and the Tamils,’’ The Economist, January 19, 1985,
p. 35.37. K. M. de Silva, Sri Lanka: Ethnic Conflict, Management and Reso-
lution (Kandy, Sri Lanka: International Centre for Ethnic Studies,1996), p. 22.
38. Ibid., p. 43.
≤∞∏ notes to pages 91 – 99
39. Mervyn De Silva, ‘‘Sri Lanka rebels defy Indian force, media-tion,’’ The Christian Science Monitor, July 21, 1988, p. 9.
40. D. John Grove, ‘‘Restructuring the Cultural Division of Laborin Malaysia and Sri Lanka,’’ Comparative Political Studies, July 1986,pp. 190–193.
41. Celia W. Dugger, ‘‘Endless War Again Laps at Sri LankanCity,’’ New York Times, September 16, 2000, p. A1.
42. Chari Lata Joshi, ‘‘Try Again,’’ Far Eastern Economic Review,
December 20, 2001, p. 24.43. Barbara Crossette, ‘‘The War on Terror Points a Country To-
ward Peace,’’ New York Times, March 3, 2002, Section 4, p. 4.44. ‘‘Tamil Rebels Yield in Talks with Sri Lanka,’’ New York Times,
November 4, 2002, p. A9.
chapter 5: AFFIRMATIVE ACTION IN NIGERIA
1. Larry Diamond, Class, Ethnicity and Democracy in Nigeria: The
Failure of the First Republic (Syracuse: Syracuse University Press, 1988),p. 22. These data are based on the censuses taken by colonial authori-ties in the decade preceding independence, rather than on the 1963census, which was challenged and has been embroiled in controversyever since. No subsequent census was held, due to the interethnicpolarization. See Ibid., Chapter 5.
2. Olatunde Bayo Lawuyi, ‘‘Ethnicity, Political Leadership andthe Search for a Stable Nigerian Society,’’ Scandinavian Journal of De-
velopment Alternatives, September–December 1992, p. 131.3. William Easterly and Ross Levine, ‘‘Africa’s Growth Tragedy:
Policies and Ethnic Divisions,’’ Quarterly Journal of Economics, Novem-ber 1997, p. 1224.
4. Harold D. Nelson, Nigeria: A Country Study (Washington: U.S.Government Printing Office, 1982), p. 4.
5. P. T. Bauer, West African Trade: A Study of Competition, Oligopoly
and Monopoly in a Changing Economy (Cambridge: Cambridge Univer-sity Press, 1954), p. 7.
6. ‘‘The Ibo, who today play an important part in Nigerian trade,were in an almost savage state as recently as 1910.’’ P. T. Bauer, West
African Trade: A Study of Competition, Oligopoly and Monopoly in a Chang-
ing Economy (Cambridge: Cambridge University Press, 1954), p. 7. Inearlier centuries, the Ibos were often enslaved by other tribes. RobertReinhart, ‘‘Historical Setting,’’ Nigeria: A Country Study, edited byHarold D. Nelson (Washington: Government Printing Office), p. 16.
notes to pages 99 – 105 ≤∞π
7. Larry Diamond, Class, Ethnicity and Democracy in Nigeria, p. 26.8. James S. Coleman, Nigeria: Background to Nationalism (Los An-
geles: University of California Press, 1971), p. 142.9. Donald L. Horowitz, Ethnic Groups in Conflict (Berkeley: Uni-
versity of California Press, 1985), pp. 448, 451.10. Northern Nigeria, Statistical Yearbook 1965 (Kaduna: Ministry
of Economic Planning, 1965), pp. 40–41.11. Robert Nelson and Howard Wolpe, Nigeria: Modernization and
Politics of Communalism (East Lansing: Michigan State University,1971), p. 127; Bernard Nkemdirim, ‘‘Social Change and the Genesisof Conflict in Nigeria,’’ Civilizations, Vol. 25, Nos. 1–2 (1975), p. 94;Okwudiba Nnoli, Ethnic Politics in Nigeria (Enugu, Nigeria: FourthDimension Publishers, 1978), p. 64.
12. J. A. A. Ayoade, ‘‘The Federal Character Principle and theSearch for National Integration,’’ Federalism and Political Restructuring
in Nigeria (Ibadan, Nigeria: Spectrum Books, 1999), p. 111.13. Larry Diamond, Class, Ethnicity and Democracy in Nigeria, p. 50.14. Kunlke Amuwo et al., Federalism and Political Restructuring in
Nigeria (Ibadan, Nigeria: Spectrum Books, 1999), p. 53.15. Ibid., 52.16. John A. A. Ayoade, ‘‘Ethnic Management of the 1979 Ni-
gerian Constitution,’’ Canadian Review of Studies in Nationalism, Spring1987, p. 127.
17. Kunlke Amuwo et al., Federalism and Political Restructuring in
Nigeria, p. 54.18. Sarah Kenyon Lischer, ‘‘Causes of Communal War: Fear and
Feasibility,’’ Studies in Conflict & Terrorism, Vol. 22 (1999), p. 340.19. Kunlke Amuwo et al., Federalism and Political Restructuring in
Nigeria, pp. 58–59.20. David Lamb, The African (New York: Random House, 1982),
p. 308.21. Ibid., p. 309.22. John A. A. Ayoade, ‘‘Ethnic Management in the 1979 Ni-
gerian Constitution,’’ Canadian Review of Studies in Nationalism, Spring1987, p. 140.
23. Barbara Crossette, ‘‘Survey Ranks Nigeria as Most CorruptNation,’’ New York Times, August 3, 1997, International Section, p. 3.
24. Larry Diamond, Class, Ethnicity and Democracy in Nigeria,
p. 311; John Kraus, ‘‘Economic Adjustment and Regime Creation inNigeria,’’ Current History, May 1999, p. 234.
25. A. Bamisaiye, ‘‘Ethnic Politics as an Instrument of Unequal
≤∞∫ notes to pages 106 – 116
Socio-Economic Development in Nigeria’s First Republic,’’ African
Notes (Nigeria), Vol. 6, No. 2, 1970–71, p. 99.26. Okwudiba Nnoli, ‘‘Ethnic and Regional Balancing in Nige-
rian Federalism,’’ Foundations of Nigerian Federalism: 1960–1995, ed-ited by J. Isawa Elaigwu and R. A. Akindele (Abuja, Nigeria: NationalCouncil on Intergovernmental Relations, 1996), p. 234.
27. Ibid., p. 235.28. Ibid., pp. 235–236.29. Kola Olugbade, ‘‘The Nigerian State and the Quest for a Sta-
ble Polity,’’ Comparative Politics, April 1992, p. 299.30. Obi Igwara, ‘‘Dominance and Difference: Rival Visions of
Ethnicity in Nigeria,’’ Ethnic and Racial Studies, January 2001, p. 90.31. Sarah Kenyon Lischer, ‘‘Causes of Communal War: Fear and
Feasibility,’’ Studies in Conflict & Terrorism, Vol. 22 (1999), pp. 6, 340.32. Obi Igwara, ‘‘Dominance and Difference: Rival Visions of
Ethnicity in Nigeria,’’ Ethnic and Racial Studies, Vol. 24, No. 1 ( January2001), p. 88.
33. Quoted in Ibid., p. 87.34. ‘‘Nigeria: Government to Set Up National Security Commis-
sion,’’ Africa News Service, October 1, 2001.35. ‘‘Thousands Flee Ethnic Blood-letting,’’ The Australian, Feb-
ruary 6, 2002, p. 10.36. ‘‘Country Report: Nigeria,’’ The Economist Intelligence Unit
(London, 2002), p. 13.37. ‘‘Country Report Nigeria,’’ The Economist Intelligence Unit
London: The Economist Intelligence Unit, 2002), p. 14.38. Okwudiba Nnoli, Ethnic Politics in Nigeria, p. 245.39. See, for example, Ibid., pp. 224–227.40. Okwudiba Nnoli, ‘‘Ethnic and Regional Balancing in Nige-
rian Federalism,’’ Foundations of Nigerian Federalism: 1960–1995, ed-ited by J. Isawa Elaigwu and R. A. Akindele, pp. 227–228.
41. Eghosa E. Osaghac, ‘‘Managing Multiple Minority Problemsin a Divided Society,’’ Journal of Modern African Studies, Vol. 36, No. 1(1998), p. 11.
chapter 6: AFFIRMATIVE ACTION IN THE UNITED STATES
1. See, for example, Peter Schmidt, ‘‘How Michigan Won Cor-porate Backing for Its Defense of Affirmative Action,’’ Chronicle of
Higher Education, November 24, 2000, pp. A21–22.2. Steven J. Novak, ‘‘The Real Takeover of the BIA: The Prefer-
notes to pages 117 – 124 ≤∞Ω
ential Hiring of Indians,’’ Journal of Economic History, Vol. L, No. 3(September 1990), pp. 639–654.
3. U.S. Bureau of the Census, Historical Statistics of the United
States: Colonial Times to 1970 (Washington, D.C.: U.S. GovernmentPrinting Office, 1975), p. 133; U.S. Bureau of the Census, ‘‘MaritalStatus and Living Arrangements: March 1992,’’ Current Population Re-
ports, Series P-20, No. 468 (Washington: Government Printing Office,1993) pp. 1, 2.
4. U.S. Bureau of the Census, Historical Statistics of the United
States: Colonial Times to 1970, p. 381.5. Stephan Thernstrom and Abigail Thernstrom, America in
Black and White: One Nation, Indivisible (New York: Simon & Schuster,1997), p. 233.
6. Ibid., p. 79.7. Daniel P. Moynihan, ‘‘Employment, Income, and the Ordeal
of the Negro Family,’’ Daedalus, Fall 1965, p. 752.8. Stephan Thernstrom and Abigail Thernstrom, America in
Black and White, p. 233.9. Jonathan J. Bean, Big Government and Affirmative Action: The
Scandalous History of the Small Business Administration (Lexington: Uni-versity of Kentucky Press, 2001), p. 79; Terry Eastland, Ending Affirma-
tive Action: The Case for Colorblind Justice (New York: Basic Books, 1996),pp. 139, 177–178.
10. William G. Bowen and Derek Bok, The Shape of the River: Long-
Term Consequences of Considering Race in College and University Admissions
(Princeton: Princeton University Press, 1998), p. 11.11. Terry Eastland, Ending Affirmative Action, pp. 17–18, 139.12. Bob Zelnick, Backfire: A Reporter’s Look at Affirmative Action
(Washington: Regnery Publishing, 1996), pp. 299–300.13. George R. La Noue, ‘‘Discrimination in Public Contracting,’’
Beyond the Color Line, edited by Abigail Thernstrom and StephanThernstrom (Stanford: Hoover Institution Press, 2002), pp. 209–210.
14. Donald L. Bartlett and James B. Steele, ‘‘Wheel of Fortune,’’Time, December 16, 2002, p. 47.
15. U.S. Equal Employment Opportunity Commission, Legislative
History of Titles VII and XI of Civil Rights Act of 1964 (Washington: U.S.Government Printing Office, no date), p. 3006.
16. Ibid., p. 3005.17. Ibid.
18. The present writer conducted the first summer program to
≤≤≠ notes to pages 125 – 134
prepare black college students for postgraduate study in economicsback in 1968. This was affirmative action only in the generic sense, forthe end-results were assessed by administering standardized tests thatwere in general use for testing others who were seeking to do post-graduate work in economics.
19. Nathan Glazer, Affirmative Discrimination (New York: BasicBooks, 1975), p. 49.
20. U.S. Equal Employment Opportunity Commission, Legislative
History of Titles VII and XI of Civil Rights Act of 1964, pp. 3133–3134.21. Ibid., pp. 3130, 3131.22. Ibid., pp. 3136, 3160, 3161.23. Quoted in Hugh Davis Graham, The Civil Rights Era: Origins
and Development of National Policy 1960–1972 (New York: Oxford Uni-versity Press, 1990), p. 387.
24. See, for example, Nathan Glazer, Affirmative Discrimination:
Ethnic Inequality and Public Policy (New York: Basic Books, 1975), p. 57.25. United Steelworkers of America v. Weber, 443 U.S. 193 (1979), at
207n7, 222.26. Harry Holzer and David Neumark, ‘‘Assessing Affirmative Ac-
tion,’’ Journal of Economic Literature, Vol. XXXVII (September 2000),p. 487.
27. Dinesh D’Souza, The End of Racism: Principles for a Multiracial
Society (New York: The Free Press, 1995), pp. 306–307.28. Ron Nissimov, ‘‘Students Run into ‘Top 10 Percent Law,’ ’’
Houston Chronicle, June 4, 2000, pp. A1 ff.29. See, for example, Daniel Golden, ‘‘To Get Into UCLA, It
Helps to Face ‘Life Challenges,’ ’’ Wall Street Journal, July 12, 2002,pp. 1ff.
30. John B. Parrish, ‘‘Professional Womanpower as a NationalResource,’’ Quarterly Review of Economics and Business, February 1961,p. 58.
31. Beverly L. Johnson, ‘‘Marital and Family Characteristics of theLabor Force, March 1979,’’ Monthly Labor Review, April 1980, p. 51.
32. Diana Furchtgott-Roth and Christine Stolba, Women’s Figures:
An Illustrated Guide to the Economic Progress of Women in America (Wash-ington: American Enterprise Institute, 1999), pp. 85, 86.
33. U.S. Bureau of the Census, Current Population Reports, SeriesP-60, No. 133 (Washington, D.C.: U.S. Government Printing Office,1982), p. 3.
34. Diana Furchtgott-Roth and Christine Stolba, Women’s Figures
(1999 edition), p. 86.

notes to pages 134 – 139 ≤≤∞
35. John B. Parrish, ‘‘Professional Womanpower as a Soviet Re-source,’’ Quarterly Review of Economics and Business, Autumn 1964,p. 60. See also Diana Furchtgott-Roth and Christine Stolba, Women’s
Figures, p. 57.36. Helen S. Astin, ‘‘Career Profiles of Women Doctorates,’’ Aca-
demic Women on the Move, edited by Alice S. Rossi and Anne Calder-wood (New York: Russell Sage Foundation, 1973), p. 153.
37. U.S. Bureau of the Census, Historical Statistics of the United
States, Colonial Times to 1970 (Washington, D.C.: U.S. GovernmentPrinting Office, 1976), p. 49.
38. ‘‘The Economic Role of Women,’’ The Economic Report of the
President, 1973 (Washington, D.C.: U.S. Government Printing Office,1973), p. 103.
39. Thomas Sowell, Affirmative Action Reconsidered (Washington,D.C.: American Enterprise Institute, 1975), pp. 32, 33.
40. John M. McDowell, ‘‘Obsolescence of Knowledge and CareerPublication Profiles: Some Evidence of Differences Among Fields inCosts of Interrupted Careers,’’ American Economic Review, Vol. 72, No.4 (September 1982), p. 761.
41. Diana Furchtgott-Roth and Christine Stolba, Women’s Figures,
p. 33.42. See, for example, the data in Thomas Sowell, The Vision of the
Anointed: Self-Congratulation as a Basis for Social Policy (New York: BasicBooks, 1995), pp. 38–40; idem, Civil Rights, pp. 91–108; ChinhuiJuhn, Relative Wage Trends, Women’s Work, and Family Income (Wash-ington: American Enterprise Institute, 1996).
43. See U.S. Bureau of the Census, Income, Poverty, and Wealth in
the United States: A Chart Book, Current Population Reports, SeriesP-60, No. 179 (Washington: U.S. Government Printing Office, 1992),p. 8.
44. Diana Furchtgott-Roth and Christine Stolba, Women’s Figures,
p. 92.45. U.S. Bureau of the Census, Income, Poverty, and Wealth in the
United States: A Chart Book, Current Population Reports, Series P-60,No. 179 (Washington: U.S. Government Printing Office, 1992), p. 8.
46. Bob Zelnick, Backfire, p. 300.47. Ibid., pp. 301–302.48. Bernard E. Anderson, The Negro in the Public Utilities (Phila-
delphia: University of Pennsylvania Press, 1970), pp. 65, 76–77, 78.49. Ibid., pp. 92, 96.50. Ibid., pp. 88, 96.
≤≤≤ notes to pages 139 – 143
51. Ibid., pp. 105–106.52. Ibid., pp. 97–99.53. Ibid., p. 195.54. Michael R. Winston, ‘‘Through the Back Door, Academic
Racism and the Negro Scholar in Historical Perspective,’’ Daedalus,
Vol. 100, No. 3 (Summer 1971), pp. 695, 705.55. As late as the 1960s, I can recall being interviewed for aca-
demic appointments that would have made me the first black pro-fessor at American University in Washington and at the University ofVirginia in Charlottesville—and actually being appointed as the firstblack professional at the U.S. Bureau of the Budget, forerunner oftoday’s Office of Management and Budget.
56. Bob Zelnick, Backfire, pp. 58–60.57. Peter Schmidt, ‘‘How Michigan Won Corporate Backing for
Its Defense of Affirmative Action,’’ The Chronicle of Higher Education,
November 24, 2000, p. A21.58. See, for example, Robert Klitgaard, Choosing Elites: Selecting the
‘‘Best and the Brightest’’ at Top Universities and Elsewhere (New York: BasicBooks, 1985), pp. 104–115; Richard J. Herrnstein and Charles Mur-ray, The Bell Curve: Intelligence and Class Structure in American Life (NewYork: The Free Press, 1994), pp. 280–281; Arthur R. Jensen, ‘‘Selec-tion of Minority Students in Higher Education,’’ University of ToledoLaw Review, Spring–Summer 1970, pp. 440, 443; Donald A. Rock,‘‘Motivation, Moderators, and Test Bias,’’ Ibid., pp. 536, 537; Ron-ald L. Flaugher, Testing Practices, Minority Groups and Higher Education:
A Review and Discussion of the Research (Princeton: Educational TestingService, 1970), p. 11; Arthur R. Jensen, Bias in Mental Testing (NewYork: The Free Press, 1980), pp. 479–490.
59. Iham Kim and Anthony R. Miles, ‘‘Why Affirmative ActionWorks at Michigan,’’ The Chronicle of Higher Education, April 20, 2001,pp. B13–B14.
60. Mary Gibson Hundley, The Dunbar Story (1875–1955) (NewYork: Vantage Press, 1965), p. 75.
61. John H. McWhorter, Losing the Race: Self-Sabotage in Black Amer-
ica (New York: The Free Press, 2000), Chapters 3, 4. A later empiricalstudy which seems to confirm McWhorter’s thesis is John Ogbu, Black
American Students in an Affluent Suburb: A Study of Academic Disengage-
ment (Mahwah, NJ: Lawrence Erlbaum Associates, 2003).62. Eric A. Hanushek, et al., ‘‘New Evidence About Brown v.
Board of Education: The Complex Effects of School Racial Compo-sition on Achievement,’’ National Bureau of Economic Research,
notes to pages 143 – 149 ≤≤≥
Working Paper 8741 (Cambridge, Massachusetts: National Bureau ofEconomic Research, 2002), Abstract.
63. Ellis B. Page and Timothy Z. Keith, ‘‘The Elephant in theClassroom: Ability Grouping and the Gifted,’’ Intellectual Talent: Psycho-
metric and Social Issues, edited by Camilla Persson Benbow and DavidLubinski (Baltimore: The Johns Hopkins University Press, 1996),p. 208.
64. Robert Lerner and Althea K. Nagai, Racial Preferences in Colo-
rado Higher Education: Racial Preferences in Undergraduate Admissions at
the Public Colleges and Universities of Colorado, (Washington: Center forEqual Opportunity, no date), p. 9.
65. Stephen Cole and Elinor Barber, Increasing Faculty Diversity:
The Occupational Choices of High-Achieving Minority Students (Cam-bridge, Massachusetts: Harvard University Press, 2003), p. 169.
66. See Clyde W. Summers, ‘‘Admission Policies of LaborUnions,’’ Quarterly Journal of Economics, November 1946, pp. 66–107.
67. Clyde Summers, ‘‘Preferential Admissions: An Unreal Solu-tion to a Real Problem,’’ University of Toledo Law Review, Vol. 1970, Nos.2 & 3 (Spring/Summer 1970), p. 380.
68. Ibid., p. 384.69. John H. Bunzel, ‘‘Affirmative Action Admissions: How it
‘‘Works’ at Berkeley,’’ The Public Interest, Fall 1988, pp. 124, 125.70. Arthur Hu, ‘‘Minorities Need More Support,’’ The Tech
(M.I.T.), March 7, 1987, p. 8.71. Charles J. Sykes, The Hollow Men: Politics and Corruption in
Higher Education (Washington, D.C.: Regnery Gateway, 1990), p. 47n.72. Robin Wilson, ‘‘Article Critical of Black Students’ Qualifica-
tions Rails Georgetown U. Law Center,’’ The Chronicle of Higher Educa-
tion, April 24, 1991, pp. A33, A35.73. Shelby Steele, The Content of Our Character: A New Vision of Race
in America (New York: St. Martin’s Press, 1990), p. 138.74. See my Inside American Education: The Decline, the Deception, the
Dogmas (New York: The Free Press, 1993), pp. 155–158, 162–163.75. See, for example, ‘‘Racism, Cynicism, Musical Chairs,’’ The
Economist, June 25, 1988, pp. 30 ff.76. Thomas Sowell, Inside American Education, p. 144.77. See, for example, William Moore, Jr., and Lonnie H. Wagstaff,
Black Educators in White Colleges (San Francisco: Jossey-Bass PublishingCo., 1974), pp. 130–131, 198.
78. Thomas Sowell, Inside American Education, pp. 132–133.79. Thomas Sowell, ‘‘Affirmative Action Reconsidered,’’ Educa-

≤≤∂ notes to pages 149 – 153
tion: Assumptions versus History—Collected Papers (Stanford: Hoover In-stitution Press, 1986), pp. 83, 85–87.
80. Robert Klitgaard, Choosing Elites, p. 175.81. Stephan Thernstrom and Abigail Thernstrom, ‘‘Reflections
on the Shape of the River,’’ UCLA Law Review, Vol. 46, No. 5 ( June1999), p. 1610n.
82. Bob Zelnick, Backfire, p. 125. See also Lino A. Graglia, ‘‘Pro-fessor Loewy’s ‘Diversity’ Defense of Racial Preference: Defining Dis-crimination Away,’’ North Carolina Law Review, April 1999, pp. 1513–1515.
83. Robert Klitgaard, Choosing Elites, p. 162.84. Stephan Thernstrom and Abigail Thernstrom, ‘‘Reflections
on the Shape of the River,’’ UCLA Law Review, Vol. 46, No. 5 ( June1999), pp. 1586, 1611–1612.
85. This implicitly assumes that blacks are, or should be, repre-sented by doctors, lawyers, etc., of their own race, when there is noevidence that blacks themselves want to limit their own access to pro-fessionals in this way.
86. Jeff Jacoby, ‘‘How Affirmative Action Can Be Fatal,’’ San Fran-
cisco Chronicle, August 20, 1997, p. A21. See also Ron Joseph v. Patrick
Davis, Before the Medical Board of California, Department of Con-sumer Affairs, State of California, Case No. 06-97-73596, OAH No.1997050498 ( June 17, 1997).
87. Julie Marquis, ‘‘Doctor Becomes Symbol in Affirmative Ac-tion Debate,’’ Los Angeles Times, September 2, 1997, pp. 1 ff; Jeff Jac-oby, ‘‘How Affirmative Action Can be Fatal,’’ San Francisco Chronicle,
August 20, 1997, p. A21.88. Julie Marquis, ‘‘Liposuction Doctor Has License Revoked,’’
Los Angeles Times, August 26, 1998, p. A21.89. Thomas Sowell, Black Education: Myths and Tragedies (New
York: David McKay, 1972), pp. 92–94.90. Merill Sheils et al., ‘‘Minority Report Card,’’ Newsweek, July 12,
1976, p. 74.91. Lani Guinier, ‘‘College Should Take ‘Confirmative Action’ in
Admissions,’’ The Chronicle of Higher Education, December 14, 2001,p. B12.
92. See, for example, the praise cited in Stephan Thernstromand Abigail Thernstrom, ‘‘Reflections on the Shape of the River,’’UCLA Law Review, Vol. 46, No. 5 ( June 1999), p. 1586, note 12.
93. Ibid., p. 1589.94. Ibid., pp. 1594, 1595.
notes to pages 153 – 160 ≤≤∑
95. Ibid., p. 1603.96. William G. Bowen and Derek Bok, The Shape of the River,
p. xxx.97. Ibid., p. 61. See also p. 259.98. Ibid., p. 21.99. Bob Zelnick, Backfire, p. 132.100. Robert Lerner and Althea K. Nagai, Racial Preferences in Colo-
rado Higher Education, pp. 6, 11.101. Robert Lerner and Althea K. Nagai, Racial Preferences in Med-
ical Education: Racial and Ethnic Preferences in Admissions at Five Public
Medical Schools (Washington: Center for Equal Opportunity, no date),pp. 12–35.
102. Sally Satel, ‘‘Health and Medical Care,’’ Beyond the Color Line:
New Perspectives on Race and Ethnicity in America, edited by AbigailThernstrom and Stephan Thernstrom (Stanford: Hoover InstitutionPress, 2002), p. 143.
103. William G. Bowen and Derek Bok, The Shape of the River,
p. 259.104. John Perazzo, The Myths That Divide Us: How Lies Have Poi-
soned American Race Relations (Briarcliff Manor: World Studies Books,1998), pp. 183–184.
105. Alexander W. Astin, What Matters in College? Four Critical Years
Revisited (San Francisco: Jossey-Bass, Inc., 1993), p. 326.106. Tany Schevitz, ‘‘ ‘Little Fish in a Big Pond,’ ’’ San Francisco
Chronicle, May 6, 2001, p. A17.107. William G. Bowen and Derek Bok, The Shape of gthe River,
p. 259.108. See examples in Thomas Sowell, Inside American Education,
pp. 106–108.109. Tamar Jacoby ‘‘Color Bind,’’ New Republic, March 29, 1999,
p. 25.110. Stephan Thernstrom and Abigail Thernstrom, ‘‘Reflections
on the Shape of the River,’’ UCLA Law Review, Vol. 46, No. 5 ( June1999), p. 1619.
111. Jonathan Peterson, ‘‘Clinton Calls for ‘National Effort’ toEnd Racism,’’ Los Angeles Times, June 15, 1997, p. 1A.
112. Timm Herdt, ‘‘4,000 Rally to Protest Proposition 209,’’ Ven-
tura County Star, October 28, 1997, p. A3.113. George F. Will, ‘‘Jesse Jackson Has It Backward,’’ Washington
Post, September 7, 1997, p. C7.114. The California State University system enrolls roughly twice
≤≤∏ notes to pages 160 – 167
as many students on its 23 campuses as the University of Californiasystem enrolls on its eight campuses.
115. UC Office of the President, Student Academic Services,OA&SA, REG004/006 and campus reports, Apr0f023/flowfrc 9402.See also Peter Schmidt, ‘‘U. of California Ends Affirmative Action,’’The Chronicle of Higher Education, May 25, 2001, p. A24; ‘‘Sweat, NotBlood,’’ The Economist, April 20, 2002, p. 30.
116. Downloaded from Internet. Web address: http://www.calstate.edu/AS/stat reports/1996–1997/
117. Reporting Package for the Board of Regents, February 2001,downloaded from the Internet.
118. The College Board, SAT Scores for Each Ethnic Group by Highest
Level of Parental Education, 1994 (Princeton), p. 16.119. See James R. Flynn, Asian Americans: Achievement Beyond IQ
(Hillsdale, NJ: Lawrence Erlbaum Associates, 1991).120. See, for examples of such schools, Lance T. Izumi et al., They
Have Overcome: High-Poverty, High Performing Schools in California (SanFrancisco: Pacific Research Institute, 2002), p. 9; Samuel Casey Car-ter, No Excuses: Lessons from 21 High-Performing, High-Poverty Schools
(Washington: The Heritage Foundation, 2000), pp. 43–44; ThomasSowell, ‘‘Patterns of Black Excellence,’’ The Public Interest, Spring1976, pp. 26–58.
121. For comparisons of Harlem and lower east side schools, seedata cited in Thomas Sowell, ‘‘Assumptions versus History in EthnicEducation,’’ Education: Assumptions versus History, p. 41. For the his-tory of the black Washington high school which scored higher onstandardized tests than two of the three white high schools in 1899,see Henry S. Robinson, ‘‘The M Street School,’’ Records of the Columbia
Historical Society of Washington, D.C., Vol. LI (1984), p. 122. The iden-tity of the schools involved is established in Report of the Board of Trustees
of Public Schools of the District of Columbia to the Commissioners of the District
of Columbia: 1898–1899 (Washington: Government Printing Office,1900), pp. 7, 11.
122. See, for example, Jonathan D. Glater, ‘‘Law Firms Are Slowin Promoting Minority Lawyers to Partner Role,’’ New York Times,
August 7, 2001, pp. 1ff.
chapter 7: THE PAST AND THE FUTURE
1. Judith Warner, ‘‘France Goes Nutty for Parity: Same Differ-ence,’’ New Republic, March 28, 2001, p. 16.
notes to pages 167 – 173 ≤≤π
2. Charles H. Kennedy, ‘‘Policies of Redistributional Preferencein Pakistan,’’ Ethnic Preference and Public Policy in Developing States, ed-ited by Neil Nevitte and Charles H. Kennedy (Boulder, Colorado:Lynne Rienner Publishers, Inc., 1986), p. 79.
3. ‘‘A Sigh is Just a Sigh,’’ Editor & Publisher, April 15, 2002, p. 8.4. Charles H. Kennedy, ‘‘Policies of Redistributional Preference
in Pakistan,’’ p. 81.5. Myron Weiner and Mary Fainsod Katzenstein, India’s Preferen-
tial Policies: Migrants, the Middle Classes, and Ethnic Equality (Chicago:University of Chicago Press, 1981), p. 52.
6. Edmund Terrence Gomez, Chinese Business in Malaysia: Ac-
cumulation, Ascendance, Accommodation (Honolulu: University of Ha-waii Press, 1999), p. 71.
7. Robert Klitgaard, Elitism and Meritocracy in Developing Coun-
tries: Selection Policies for Higher Education (Baltimore: Johns HopkinsUniversity Press, 1986), pp. 19, 77; The College Board, SAT Scores for
Each Ethnic Group by Highest Level of Parental Education, 1994 (Prince-ton), p. 16.
8. Robert Klitgaard, Elitism and Meritocracy in Developing Coun-
tries, p. 77, 118; Charles H. Kennedy, ‘‘Policies of RedistributionalPreference in Pakistan,’’ Ethnic Preference and Public Policy in Developing
States, edited by Neil Nevitte and Charles H. Kennedy, p. 78; RobertObserst, ‘‘Policies of Ethnic Preference in Sri Lanka,’’ Ibid., p. 146.
9. Otto Klineberg, Negro Intelligence and Selective Migration (West-port, Ct.: Greenwood Press, 1974), p. 2.
10. James R. Flynn, ‘‘IQ Gains Over Time: Toward Finding theCauses,’’ The Rising Curve: Long-Time Gains in IQ and Related Measures
(Washington: American Psychological Association, 1998), pp. 25–66.11. Donald R. Snodgrass, Inequality and Economic Development in
Malaysia (Kuala Lumpur: Oxford University Press, 1980), p. 4.12. Amy L. Freedman, ‘‘The Effect of Government Policy and
Institutions on Chinese Overseas Acculturation: The Case of Malay-sia,’’ Modern Asian Studies, Vol. 35, No. 2 (2001), p. 416.
13. Martin Woollacott, ‘‘Malaysia’s Elite Tips Scale Too Far in itsOwn Favor,’’ The Guardian, March 2, 1995, p. 22 (on line).
14. Sumit Ganguly, ‘‘Ethnic Policies and Political Quiescence inMalaysia and Singapore,’’ Government Policies and Ethnic Relations in
Asia and the Pacific, edited by Michael E. Brown and Sumit Ganguly(Cambridge, Mass.: MIT Press, 1997), p. 262.
15. ‘‘As Economy Slows, ‘Subprime Lending Looks Even Riskier,’’Wall Street Journal, August 16, 2001, p. A1.
≤≤∫ notes to pages 174 – 176
16. Compare Eric Woodrum et al., ‘‘Japanese American Behav-ior: Its Types, Determinants and Consequences,’’ Social Forces, June1980, pp. 1237, 1238, and Daniel O. Price, Changing Characteristics of
the Negro Population (Washington, D.C.: U.S. Government Printing Of-fice, 1969), p. 45.
17. Herbert Barriner, Robert W. Gardner and Michael J. Levin,Asian and Pacific Islanders in the United States (New York: Russell SageFoundation, 1995), p. 235.
18. See, for example, Paulette Thomas, ‘‘Blacks Can Face a Hostof Trying Conditions in Getting Mortgages,’’ Wall Street Journal, No-vember 30, 1992, p. A8.
19. Rochelle Sharpe, ‘‘Losing Ground: In Latest Recession,Only Blacks Suffered Net Employment Loss,’’ Wall Street Journal, Sep-tember 14, 1993, p. 14.
20. John H. Bunzel, ‘‘Affirmative-Action Admission: How it‘Works’ at U.C. Berkeley,’’ The Public Interest, Fall 1988, p. 122.
21. National Center for Health Statistics, Health, United States,
1990 (Hyattsville, Maryland: U.S. Public Health Service, 1991), p. 41.22. Compare U.S. Bureau of the Census, 1990 Census of Popula-
tion, Asians and Pacific Islanders (1990 CP-3-05), Table 5; U.S. Bureauof the Census, 1990 Census of Population, Social and Economic Charac-
teristics: United States (1990 CP-2-1), Table 6. As of the year 2000, eventhe omnibus category ‘‘Asian and Pacific Islanders’’ had medianhousehold incomes about one fourth higher than that of whites. U.S.Bureau of the Census, Current Population Reports, Money Income in
the United States: 2000 (P60-213), p. 4. However, none of these datadirectly confronts the issue of group discrimination, since it is individ-uals who are either hired or not hired, promoted or not promoted,fired or not fired. Since households differ in size from one group toanother, household income data do not even provide an accuraterelative ranking of groups in personal income or per capita income.For example, Hispanics have higher household incomes than blacksbut lower per capita incomes, (Ibid., pp. 2, 4), indicating that His-panic households contain more people.
23. Roger Sandall, The Culture Cult: Designer Tribalism and Other
Essays (Boulder: Westview Press, 2001), p. 128.24. Michael Ornstein, Ethno-Racial Inequality in the City of Toronto:
An Analysis of the 1996 Census (Toronto: City Administrator’s Office,2002), p. 97.
25. Ibid., pp. 88–90.26. Ibid., p. ii.
notes to pages 176 – 186 ≤≤Ω
27. Tomoko Makabe, ‘‘The Theory of the Split Labor Market: AComparison of the Japanese Experiment in Brazil and Canada,’’ Social
Forces, March 1981, p. 807.28. Michael Ornstein, Ethno-Racial Inequality in the City of Toronto,
p. 5.29. Ibid., pp. 92, 93.30. See, for example, Marc Galanter, Competing Equalities: Law
and the Backward Classes in India (Berkeley: University of CaliforniaPress, 1984), p. xiv; Kunlke Amuwo et al., Federalism and Political
Restructuring in Nigeria (Ibadan, Nigeria: Spectrum Books, 1999),pp. 108, 109, 115, 124; Government of Malaysia, The Sixth Malaysia
Plan 1991–1995 (Kuala Lumpur: National Printing Department ofMalaysia, 1991), p. 3; Seventh Malaysia Plan 1996–2000 (Kuala Lum-pur: Economic Planning Unit, 1996), p. 69.
31. G. Y. H. Peiris, ‘‘Poverty, Development and Inter-Group Con-flict in South Asia: Covariance and Causal Connections,’’ Ethnic Stud-
ies Report (Sri Lanka), Vol. XVIII, No. 1 ( January 2000), p. 24.32. Charles H. Kennedy, ‘‘Policies of Redistributional Preference
in Pakistan,’’ Ethnic Preference and Public Policy in Developing States, ed-ited by Neil Nevitte and Charles H. Kennedy, p. 87.
33. Marc Galanter, Competing Equalities, p. 562.34. Ibid., p. 367.35. Roger Silverman, ‘‘Devils and Enemies,’’ Far Eastern Economic
Review, July 7, 1994, p. 13.36. Stephan Thernstrom and Abigail Thernstrom, ‘‘Reflections
on the Shape of the River,’’ UCLA Law Review, Vol. 46, No. 5 ( June1999), p. 1622. See also Terry Eastland, Ending Affirmative Action: The
Case for Colorblind Justice (New York: Basic Books, 1996), p. 87.37. See, for example, Eastland, Thomas Sowell, Inside American
Education: The Decline, The Deception, The Dogmas (New York: The FreePress, 1993) pp. 132–133.
38. Marc Galanter, Competing Equalities, p. 367.39. David McLoughlin, ‘‘Lessons We Could All Learn,’’ The Do-
minion (Wellington, New Zealand), November 22, 2000, p. 13.40. Data from the College Board.41. See, for example, John Ogbu, Black American Students in an
Affluent Suburb: A Study of Academic Disengagement (Mahwah, NJ: Law-rence Erlbaum Associates, 2003); John McWhorter, Losing the Race:
Self-Sabotage in Black America (New York: The Free Press, 2001).42. As a scholarly study has put it: ‘‘Since varnas are taxonomic
categories rather than functional groups, attempts to enumerate
≤≥≠ notes to pages 186 – 197
their members have been unavailing.’’ Marc Galanter, Competing
Equalities, p. 11n.43. Thomas Sowell, ‘‘Three Black Histories,’’ Essays and Data on
American Ethnic Group, edited by Thomas Sowell (Washington: TheUrban Institute, 1978), pp. 7–64.
44. Robert Klitgaard, Elitism and Meritocracy in Developing Coun-
tries, pp. 102, 104.45. David Karen, ‘‘Who Gets into Harvard? Selection and Exclu-
sion at an Elite College,’’ Ph.D. dissertation in sociology, HarvardUniversity, 1985, pp. 139, 158a.
46. Marc Galanter, Competing Equalities, p. 448.47. Ibid., p. 447.48. Keith Windschuttle, ‘‘The Fabrication of Aboriginal History,’’
The New Criterion, Vol. 20, No. 1 (September 2001), pp. 41–49.49. See, for example, ‘‘A Hard Lesson in Diversity: Chinese Ameri-
cans Fight Lowell’s Admissions Policy,’’ San Francisco Chronicle, June 19,1995, pp. A1ff.
50. Carl Brigham, A Study of American Intelligence (Princeton:Princeton University Press, 1923), p. 190.
51. See, for example, Suma Chitnis, ‘‘Positive Discrimination inIndia with Reference to Education,’’ From Independence to Statehood:
Managing Ethnic Conflict in Five African and Asian States, edited by ed.Robert B. Goldmann and A. Jeyaratnam Wilson (London: FrancesPinter, 1984), p. 36; Nancy Lubin Labour and Nationalism in Soviet
Central Asia: An Uneasy Compromise (Princeton: Princeton UniversityPress, 1984), pp. 120–121; Mohamed Suffian bin Hashim, ‘‘Problemsand Issues of Higher Education Development in Malaysia,’’ Develop-
ment of Higher Education in Southeast Asia: Problems and Issues, edited byYip Yat Hoong (Singapore: Regional Institute of Higher Educationand Development, 1973), pp. 70–71; Chandra Richard de Silva,‘‘Sinhala-Tamil Relations and Education in Sri Lanka: The UniversityAdmissions Issue—The First Phase, 1971–7,’’ From Independence to
Statehood, edited by Robert B. Goldmann and A. Jeyaratnam Wilson,pp. 125–146; Sammy Smooha and Yochanan Peres, ‘‘The Dynamicsof Ethnic Equality: The Case of Israel,’’ Studies of Israeli Society, editedby Ernest Krausz (New Brunswick: Transaction Books, 1980), p. 173;Thomas Sowell, ‘‘Ethnicity in a Changing America,’’ Daedalus, Winter1978, pp. 231–232; Thomas Sowell, The Economics and Politics of Race,
pp. 139–140.52. Tai Yoke Lin, ‘‘Inter-Ethnic Restructuring in Malaysia, 1970–
1980,’’ From Independence to Statehood, edited by Robert B. Goldmann
notes to page 197 ≤≥∞
and A. Jeyaratnam Wilson, p. 57. See also Gordon P. Means, ‘‘EthnicPreference Policies in Malaysia,’’ Ethnic Preference and Public Policy in
Developing States, edited by Neil Nevitte and Charles H. Kennedy,p. 114.
53. Kanya Adam, ‘‘The Politics of Redress: South African StyleAffirmative Action,’’ Journal of African Studies, Vol. 35, No. 2 (1997),p. 232.

Index
Academic Preferences and Quotas, 3–4, 11, 12–13, 53, 128–129, 141–163
Affirmative Actionequivalent terms: 2, 23, 24, 37, 38,
51, 88, 106, 107, 108, 110, 113,131, 154
generic vs. specific: 123, 124, 128,219–220 (note 18)
history of the term: 3, 4–5, 123–125Africans, 10, 95, 97, 98African Americans (see Blacks)Air India, 43, 181‘‘Ali-Baba’’ Enterprises, 10, 74, 137Alliance Party, 59Ambedkar, B. A., 28, 29American Indians, 8–9, 116, 121–122,
136, 141American Society of Newspaper Edi-
tors, 167American Telephone & Telegraph
Company, 138–140Amherst College, 143, 144Andhra Pradesh, 11, 34, 35, 36, 37–
38, 51, 58Andhras, 37–38‘‘Angry White Males,’’ 16, 162Armenians, 170, 179
Aryans, 184Asian Americans, 16, 18, 121, 131,
121, 131, 141, 147, 153, 161–162, 163, 175, 184
Asian Indiansin Fiji: 171, 179in Malaysia: 55, 56–70, 76in Singapore: 72in Sri Lanka: 83in the United States: 118
Asian Minorities, 174–177in Africa: 10in Britain: 176in Canada: 176–177in New Zealand: 176in the United States: 11, 16, 21, 116,
118, 162, 174–175, 184 Assam, 11, 35, 39–41, 42, 51, 58Australia, 90, 192Australian Aborigines, 9, 192
Bakke, Alan, 17–18, 150, 168Bandaranaike, Solomon, 85–67Bangladesh, 108Barbadians, 118Beneficiaries, 11–13, 15, 16, 26–27,
30–31, 32, 33, 34, 43, 46, 47, 48,49, 50, 51, 52, 61, 62, 63, 69–71,
≤≥∂ index
Beneficiaries (continued)74, 75–76, 88, 107, 116, 120–122, 129–138, 165, 166, 167–168, 184, 186–187, 188, 189–190, 194, 195, 196, 198
Bengalis, 5, 35, 40–41Bharatiya Janata Party (BJP), 43, 46Biafra, 104, 109Birmingham, 140Blacks, 8, 11, 12, 15, 16, 20, 21, 115–
116, 117–121, 127, 130–132,137, 138, 141, 142–145, 147–150, 152–165, 170, 174–175,178, 180, 182, 183, 185, 186, 188,197
Bok, Derek, 152–159Bombay, 42, 43, 44, 45Bowen, William, 152–195Brennan, William J., 127Britain, 29, 90, 176The British
in India: 29, 39, 40in Malaysia: 55in Nigeria: 97–98, 102in Sri Lanka: 80, 81
Brock, Lou, 120Buddhists, 79, 84, 85Bumiputeras, 56, 57, 64, 66, 67, 70,
71, 77Bureau of Indian Affairs, 116Burghers, 80, 81, 82Business, 5, 10 13, 36, 40, 41, 42, 44–
45, 56, 57, 61, 74–75, 78, 81, 85,89, 103, 121, 132, 137, 138–141
California Institute of Technology, 162California State University System, 160Canada, 2, 20, 176, 195Capital, 56, 58, 61, 68, 70, 71, 197Castes, 3, 10, 11, 28, 29, 81Central Asians, 15Ceylon (see Sri Lanka)Ceylon University College, 82Ceylonese, 80, 84Chamars, 33, 186
Chavis, Patrick, 150–151, 152Cherokee Indians, 137Chettiars, 83Chicago, 16China, 2, 7, 9, 56, 57, 182Chinese, 6, 9, 10, 15
in India: 39in Malaysia: 55, 56–71, 76, 77, 168,
172, 173, 195in Singapore: 39, 72–73in the United States: 116, 118, 174,
175, 192, 193Christians, 79, 84, 97, 180Civil Rights Act of 1964, 16, 20, 21,
115, 119, 122–123, 125–127, 129Civil Rights Act of 1991, 131Civil War, 19, 108, 112–113, 167, 179Clinton, William Jefferson, 159Colombo, 89Columbia University, 28Complementary Factors, 13, 14, 30,
31–32, 33, 47, 49, 51–52, 187Constitutions, 10, 23, 24, 58, 59, 115,
190Control, 6, 7, 87, 92, 167Courts, 15, 23–24, 38, 49, 50, 127‘‘Creamy Layer,’’ 34, 49‘‘Critical Mass,’’ 142–144Cuba, 121Culture, 35–36, 37, 49, 51, 52, 53, 57,
72–73, 80–82, 84, 96, 97, 98,108–109, 143–144, 162, 172, 195
Czechoslovakia, 20
Dalits (see Untouchables)Dallas, 140Davis, Bernard, 151Demographics, 24, 55, 56, 57, 59, 72,
78, 95–96Designation and Redesignation, 8–13,
34, 74, 137, 190Detroit, 139Discrimination, 15, 24–30, 43, 115,
117, 118, 122, 126, 128, 129–132, 137–138, 163, 170, 171,
index ≤≥∑
172, 176, 183, 184, 190, 191, 194,205 (note 15)
Disparate Impact (see StatisticalDisparities)
‘‘Diversity,’’ 115, 128, 142, 154, 177,178, 191
Duke University, 146, 155Dunbar High School, 142–143, 144Dutch, 80, 81
Economist Intelligence Unit of Lon-don, 111
Edinburgh, 96Education, 3, 4, 6, 9, 10, 11, 12–13,
15, 16, 17–18, 19–20, 24, 27, 28,30–32, 33, 34, 35, 37, 38, 40, 46–47, 48, 50, 51, 52, 53–54, 56, 58,60, 63–65, 68–69, 72–73, 74, 75,77, 80, 81–82, 84, 85, 86, 87, 88,92, 98, 99–100, 102, 106, 107,108, 118–119, 133, 170, 172,173–174, 182, 184, 188, 190,191, 195
Emigration, 15, 65, 68, 75, 90, 197Empirical Evidence, ix, 2, 21, 48, 49,
52, 69, 152–163, 167, 168, 171,177, 178, 179, 184–190, 197, 198
Employment, 3, 6, 7, 11, 12–13, 14,17, 20, 32, 38, 44–45, 56, 61, 63,70–71, 81, 85, 86, 87, 101, 103
Equal Employment Opportunity Com-mission, 130, 196
Equality of results, 6, 7, 17, 53, 169Erving, Julius, 120Eskimo, 136Ethnic Studies, 4Europe, 15, 95, 136Expansions of Preferences and Quotas,
2, 3–4, 4–5, 6, 11–12, 23, 30, 37,46, 47, 49, 51, 129–138, 167, 180
Fanjul Family, 121Fiji, 2, 15, 76, 172, 179, 197France, 15, 167Fulani (see Hausa-Fulani)
Gandhi, Mohandas K., 25, 29, 87Gandhi, Rajiv, 91Generic vs. Specific Affirmative Action,
123, 124, 128, 219–220 (note 18)Georgetown University Law School,
147Germans, 6, 7, 170, 179, 182Gibson, Josh, 184Government, 21, 35, 40, 59, 60, 63,
98, 111jobs: 11, 30, 32, 33, 37, 38, 40, 41,
46, 47, 63, 70–71, 81, 82, 83, 84,85, 98, 100–101, 103, 106, 108,116, 130
policies: 38–39, 60–61, 101, 105Griggs vs. Duke Power Company, 126, 129Grutter v. Bollinger, 128–129Gujarat, 42, 50Gujaratis, 83, 168
Harijans (see Untouchables)Harvard University, 145, 148, 152,
155, 189Harvard University Medical School,
151Hausa-Fulani, 95–96, 99, 100, 105,
113Hindus, 25, 40, 48, 79Hispanics, 21, 48, 121, 141, 153,
185Hitler, Adolf, 43, 120Holocaust, 76Honors, 14, 15Huguenots, 15Human Rights Watch, 26, 27Humphrey, Hubert, 122, 126, 129Hyderabad, 14
Ibos, 96, 97, 99, 100, 102, 103–104,109, 113
Incentives, 13, 14–15, 21, 53–54,166–167
Income, 6, 12, 20–21, 46, 57–58, 61,66–68, 69, 70–71, 92, 99, 117,118, 119–120, 135, 170
≤≥∏ index
India, 1, 3, 4, 10, 11, 12, 13, 14, 17, 18,23–54, 58, 74, 75, 76, 78, 85, 87,90, 92, 108, 113, 120, 131, 167,177, 178, 180–181, 183, 185–186, 187, 191, 195, 196, 198
Andhra Pradesh: 11, 34, 35–36, 37–39, 51, 58
Assam: 11, 35, 39–41, 42, 51, 58Bangalore: 45Bengalis: 35, 40–41Bihar: 27, 33Bombay: 19, 42, 43, 45, 168castes: 3, 10, 11, 28, 29, 81eunuchs: 11Gujarat: 28, 42, 46, 50Haryana: 33Hyderabad: 14, 37, 38, 45Karnataka: 36Kerala: 49Madras: 45, 191Maharashtra: 19, 33, 35, 36, 42–46,
51, 168Marwaris: 35, 39–40, 41Mysore: 191Orissa: 32‘‘other backward classes’’: 10–11,
12, 24, 46–49, 50, 51, 187‘‘quota within quota’’: 12, 33, 34Rajasthan: 12, 34, 40Tamil Nadu: 12, 34untouchables: 1, 3, 10, 17, 18, 24–
30, 31–32, 33, 34, 50, 53, 74,183
Uttar Pradesh: 33, 46Indonesia, 2, 10, 55, 137, 170Inequality (see Statistical Disparities)Intergroup Relations, 15, 16–19, 21,
22, 24–29, 32, 44, 48, 59–60, 63,73, 76, 78–79, 86, 87, 89, 91, 92–93, 96, 99, 101–102, 103, 104,107–108, 109, 110, 111–113,148–149, 163, 164, 167, 178,179–182, 187, 188, 216 (note 1)
Israel, 2Ivy League institutions, 140, 149, 162
Jackson, Jesse, 159Jaffna, 88, 93, 170Jaffna College, 80Jamaica, 14Japanese American, 116, 118, 144–
145, 170, 174–175, 176Jayawardence, Junius R., 86, 89, 91Jews, 7, 10, 15, 20, 76, 140, 171, 179,
182, 193Johnson, Lyndon B., 5, 124, 178
Kaiser Aluminum, 127Kandyan Region, 81, 88Katafs, 113Kennedy, Edward, 150Kennedy, John F., 4, 124King, Martin Luther, Jr., 16
Lagos, 102, 107, 110Language, 23, 35–36, 37, 39, 40–41,
57, 64–65, 72, 78, 84–87, 91, 95,98
Latin America, 11, 136, 163Lawyers Committee for Civil Rights,
150Lebanese, 10, 170, 178, 182Limited Scope of Affirmative Action,
3–5Loans, 62, 83, 173London, 102
Maharashtra, 11, 33, 35, 36, 42–46,51, 58, 186
Maharashtrians, 35–36Mahatir bin Mohamad, 69, 74–75, 76,
77Malaya, 57Malayan Chinese Association, 59Malayan Indian Congress, 59Malays
in Malaysia: 4, 12–13, 14, 15, 55–71,74, 77
in Singapore: 72–72Malaysia, 2, 3, 10, 12, 14, 19, 48, 53,
55–71, 72, 73, 74–75, 86, 112,
index ≤≥π
120, 137, 168, 170, 171–172,173, 177, 178, 186, 195, 197, 198
Manhattan, 164Manila, 170Maoris, 1, 4, 176, 184, 195Marwaris, 35, 39, 40, 41, 195Massachusetts Institute of Technology,
147, 148McWhorter, John H., 143, 144Media, 43Medical Board of California, 150Medical College Admission Test, 155–
156Mexican Americans (see Hispanics)Military Forces, 6–7, 60, 71, 89, 90–
91, 97, 100, 103, 104, 105, 167Mismatching, 53, 145–148, 154Mohamad, Mahathir bin, 69, 74–75,
76, 77Motorola, 125–126Mumbai (see Bombay)Muslims, 29, 40, 43, 44, 45, 180
in India: 79in Nigeria:104, 112in Sri Lanka: 79
Mussolini, Benito, 43
National Bureau of EconomicResearch, 143
National Commission for ScheduledCastes and Scheduled Tribes, 31
National Development Policy (Malay-sia), 63
National Labor Relations Act of 1935,123
‘‘National Unity,’’ 75, 106, 108, 109,113, 177–178, 180
Nazis, 75, 76Negroes (see Blacks)New Economic Policy (Malaysia), 60–
63, 64, 66, 68–70, 171New York City, 139New Zealand, 1, 2, 4, 176, 184, 195Nigeria, 2, 20, 95–114, 177, 184, 195Nixon, Richard M., 5, 124–125, 178
Occupations, 6–7, 11, 20, 32, 38, 46,56, 57, 58, 63, 65, 68, 69–71, 73,75, 77, 80, 81–83, 92, 100, 109,119, 150
Ottoman Empire, 7
Paige, Satchel, 184Pakistan, 2, 5, 43, 108, 170, 179, 181Pennsylvania State University, 157Philippines, 170, 189Poland, 10, 20Political Factors, 21, 29–30, 34–35,
36, 39, 41, 43, 45–46, 49, 50, 51,52, 53, 56, 59–60, 61, 62, 63, 74,76–77, 79, 84–86, 87, 88, 92, 93,94, 101–105, 108, 109, 110, 111–113
Portugal, 121Princeton University, 152, 157
Qualifications, 14, 18, 20, 36, 37, 38,39–40, 42, 47, 50–51, 60, 63, 64,76, 77, 101, 102, 130, 146, 147,153–159, 171–172, 184–185,196
Rangel, Charles, 120Rationales, ix, 1–2, 11, 14, 21, 24, 35,
51, 163, 165, 192, 197Reagan Administration, 141, 179Representation (see Statistical
Disparities)Rice University, 155Riesman, David, 148Robinson, Jackie, 183‘‘Role Models,’’ 144–145Russia, 6Russians, 15Rutgers University, 146Rwanda, 76
Samoans, 175San Francisco, 139San Jose State University, 157, 162Scarman, Lord, 5
≤≥∫ index
Senanayake, D. S., 84Scheduled Castes (see Untouchables)The Shape of the River, 152–159Shiv Sena, 42, 43, 44, 45, 180, 181Sierra Leone, 10Simpson, O. J., 120Singapore, 4, 39, 55, 56, 59, 72–73,
112Sinhalese, 19, 78–94, 131, 170, 180,
195, 196, 198Small Business Administration, 120,
121‘‘Sons of the Soil’’ (see Bumiputeras)South Africa, 53, 75Soviet Union, 2, 3, 4, 108Spain, 7Sri Lanka, 2, 13, 18, 19, 28, 48, 76,
78–94, 108, 111, 112, 113, 131,167, 170, 178, 187–188, 195,196, 198
Standards, 50–51, 53, 86, 131–132,141, 142, 148, 150–159, 163–164, 189, 190, 191
Stanford University, 157, 162State University of New York at Brook-
lyn, 155–156Statistical Disparities, 6, 7, 12–13, 31,
32, 33–34, 36, 43, 49, 63, 77, 79,81, 82–83, 86, 92, 98, 99–101,105, 114, 118–119, 120, 125,129, 130, 134, 149–150, 155,170, 177, 179, 183, 184, 194, 195,201 (note 19)
Summers, Clyde W., 145, 147–148Supreme Court of India, 34, 38, 49Supreme Court of the United States,
17, 126–130, 150
Tamils, 18, 56, 131, 170, 172, 180, 195Ceylon Tamils: 78–94, 113Indian Tamils: 81, 83
Tamil Tigers, 89, 90, 94Taxes, 45, 52, 60, 105Telanganans, 37–39‘‘Temporary’’ Preferences and Quotas,
2, 3, 5–6, 7, 23, 34–35, 49, 63, 74,126
Tests, 15, 32, 35, 65, 125–127, 141–142, 147, 170, 175, 184–185
Thackerary, Bal, 43, 45Tower, John, 126Trends, 19–21
United Malay Nationalist Organization(UMNO), 59, 60, 61, 62
United States, 1, 2, 3, 4, 7, 8, 10, 11,12, 14, 16, 17, 19, 21, 23, 48, 53,93, 112, 115–165, 166, 170, 173,176, 178, 181–188, 190, 191,193, 195–198
United States Department of Labor,124
United States Employment Service,131
United States Federal Communica-tions Commission, 120, 139
United States Medical Licensing Exam-ination, 156
United States Office of Federal Con-tract Compliance, 124
University of California, 17, 128, 131,159, 161
at Berkeley: 143, 146, 147, 157, 160at Davis: 150at Los Angeles: 160
University of Chicago, 162University of Colorado, 155University of Ibadan, 100University of Illinois, 146University of Malaysia, 64, 77University of Michigan, 141, 157, 159University of North Carolina, 157University of the Philippines, 189University of Texas, 131, 146, 147, 159University of Washington, 155, 156Untouchables, 1, 3, 10, 11, 17, 18, 24–
30, 31–32, 33, 34, 50, 53, 74, 183
Vanderbilt University, 146Viacom, 120
index ≤≥Ω
Verbal Evasions, 168–174Vietnamese, 175, 182Violence, 12, 18, 25–26, 27, 28, 35,
38, 39, 41, 42, 44, 45, 47, 50, 60,75, 76, 79, 87, 89, 90, 91, 92, 93–94, 103–104, 110, 111, 113, 148,167, 178–179, 180, 181, 183,187, 196, 213 (note 1)
Voting Rights Act of 1965, 16
Washington, D.C., 121, 140, 143,164
Weber Case, 127, 128, 165West Indians, 48
Women, 11, 12, 121, 129–136, 138,163–164
World Bank, 63World War I, 10, 20, 170, 193World War II, 10, 20, 33, 76, 91, 140,
144, 174, 176
Yale University, 145, 157, 158–159Yugoslavia, 108Yorubas, 96, 97, 99, 100, 102, 105,
110, 113
Zero-sum processes, 14–15, 18, 19, 47,109, 194, 196