Embed Size (px)
Citation preview
AFFIDAVIT OF JOHNS. KORENV
NOVEMBER 11, 2008
In the Matter of the Petition for Delivery Call of A&B Irrigation District for Delivery of Ground Water and for the Creation of a Ground Water Management Area
I, John S. Koreny, reside at 6815 21 st Avenue NE, Seattle, Washington 98115. I am employed by HOR, Inc. and my business address is 500-108th Avenue NE, Bellevue, Washington 98004. I have served as the Project Manager for HDR's investigations and reports prepared for this matter. My experience and qualifications are summarized in the direct testimony submitted on July 16, 2008.
The purpose of this testimony is to rebut information in the Pocatello Rebuttal Report dated August 27, 2008 and information in the Pocatello Sur-Rebuttal Report dated September 16, 2008 concerning the Unit B inigation diversion requirement calculations. Both reports were prepared by Mr. Greg Sullivan of Spronk Water Engineers, Inc.
The well pumping capacity at most Unit B wells is insufficient to meet the irrigation diversion requirements.
The Pocatello Rebuttal Report by Mr. Greg Sullivan dated August 27, 2008 criticizes the irrigation diversion requirements analysis in the A&B Expert Report. Mr. Sullivan criticized the fact that the full well pumping capacity was not used when comparing supply and demand to evaluate Unit B shortages. Mr. Sullivan concludes that the A&B Experts shortage estimate is too large because the full well pumping capacity requirements were not assumed to be available. (See pages 16 to 17 of Sullivan Rebuttal Report).
Mr. Sullivan is inconect for two reasons. First, most Unit B wells do not have sufficient pumping capacity to meet the peak irrigation diversion requirements. Figure 1 compares the cunent well pumping capacity to the average peak (July) irrigation diversion requirement rate of 0.89 miner's-inch/acre computed in the A&B Expert Report (A&B Expert Report, July, 17, 2008, Table 4-13, pg. 4-47). Figure 1 compares the most-recent Unit B well pumping capacity1
to the 0.89 miner's-inch/acre irrigation diversion requirement rate computed in the A&B Expert Report. Figure 1 shows that about 110 Unit B well systems ( or about 76 percent of all Unit B well systems) can not meet the A&B Expert's irrigation diversion requirement of 0.89 miner'sinch/acre. This shows that Unit B well pumping capacity is insufficient to meet the inigation di version requirement.
1 The Unit B well pumping capacity data was compiled from the Unit B Annual Reports under the Lowest Verified Allotment column in Part I of the report. This is the correct statistic to evaluate well capacity because it reports on the capacity of wells to pump during the middle of the irrigation season when ground water levels are lowest and irrigation demand is highest.
Affidavit of John S. Koreny Rebuttal to Sullivan Rebuttal Report and Sur-Rebuttal Report
November 11, 2008 Page 1
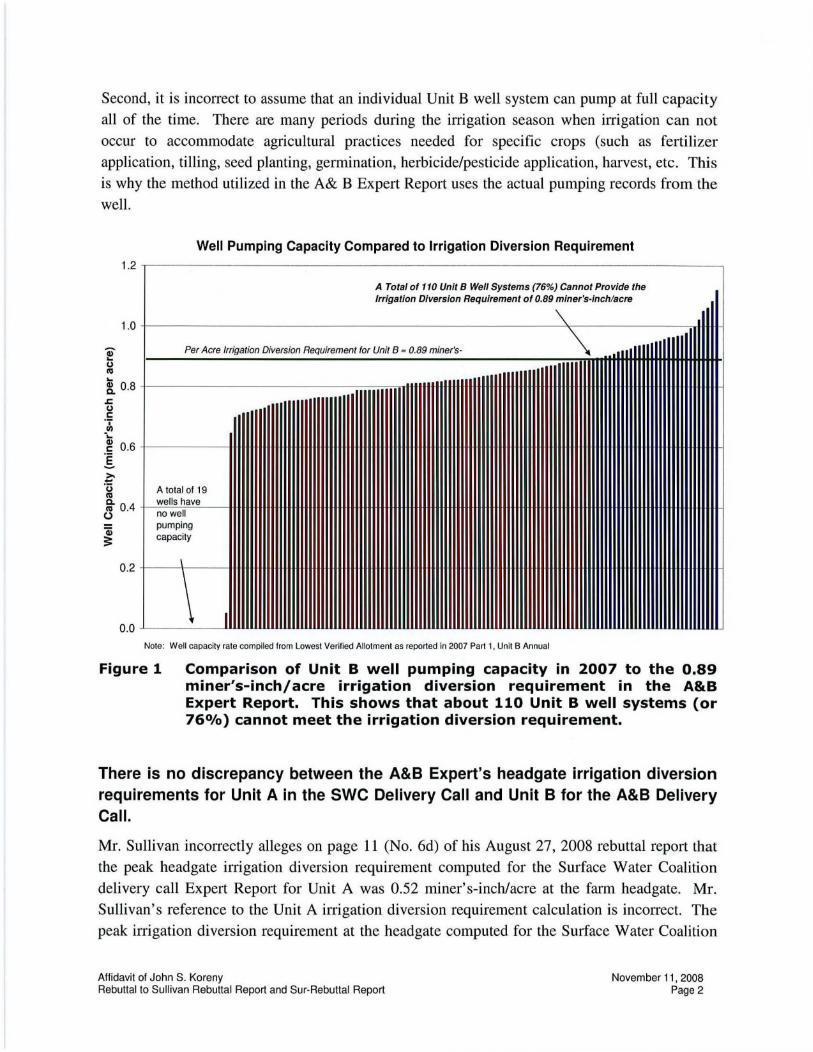
Second, it is incorrect to assume that an individual Unit B well system can pump at full capacity all of the time. There are many periods during the irrigation season when irrigation can not
occur to accommodate agricultural practices needed for specific crops (such as fertilizer application, tilling, seed planting, gennination, herbicide/pesticide application, harvest, etc. This is why the method utilized in the A& B Expert Report uses the actual pumping records from the well.
I (.) Ill
1.2
1.0
8_ 0.8 .r. (.) C 'T (II .... ~ 0.6
I >, -·u Ill
g- 0.4 0
~
0.2
0.0
-
Well Pumping Capacity Compared to Irrigation Diversion Requirement
A Total of 110 Unit B Well Systems (76%) Cannot Provide the Irrigation Diversion Requirement of 0.89 miner's-inch/acre
\
Per Acre Irrigation Diversion Requirement for Unit B = 0.89 miner's- \
A total of 19 wells have no well pumping capacity
\
\ I Note: Well capacity rate compiled from Lowest Verified Allotment as reported in 2007 Part 1, Unit B Annual
Figure 1 Comparison of Unit B well pumping capacity in 2007 to the 0.89 miner's-inch/acre irrigation diversion requirement in the A&B Expert Report. This shows that about 110 Unit B well systems (or 76%) cannot meet the irrigation diversion requirement.
There is no discrepancy between the A&B Expert's headgate irrigation diversion requirements for Unit A in the SWC Delivery Call and Unit B for the A&B Delivery Call.
Mr. Sullivan incorrectly alleges on page 11 (No. 6d) of his August 27, 2008 rebuttal report that the peak headgate irrigation diversion requirement computed for the Surface Water Coalition
delivery call Expert Repott for Unit A was 0.52 miner's-inch/acre at the farm headgate. Mr.
Sullivan's reference to the Unit A in-igation diversion requirement calculation is incorrect. The peak irrigation diversion requirement at the headgate computed for the Surface Water Coalition
Affidavit of John S. Koreny Rebuttal to Sullivan Rebuttal Report and Sur-Rebuttal Report
November 11 , 2008 Page 2
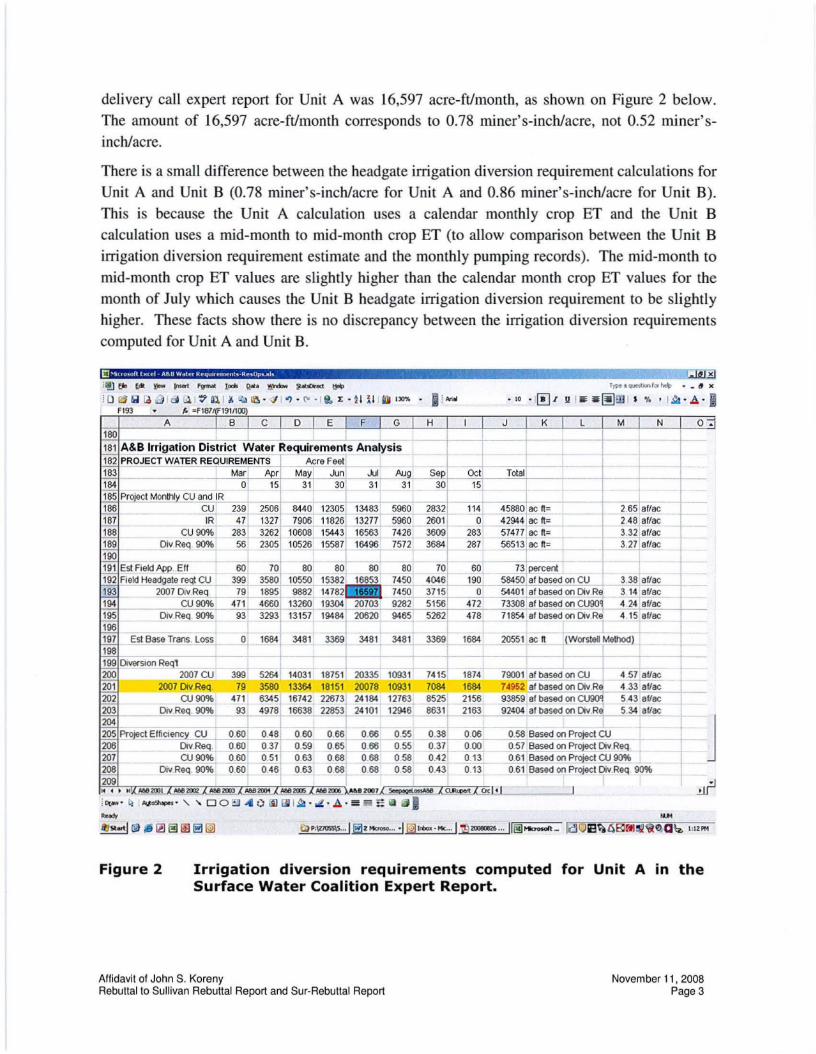
delivery call expert report for Unit A was 16,597 acre-ft/month, as shown on Figure 2 below.
The amount of 16,597 acre-ft/month corresponds to 0.78 miner's-inch/acre, not 0.52 miner' sinch/acre.
There i a small difference between the headgate irrigation diversion requirement calculations for Unit A and Unit B (0.78 miner' s-inch/acre for Unit A and 0.86 miner's-inch/acre for Unit B).
This is because the Unit A calculation u es a calendar monthly crop ET and the Unit B calculation uses a mid-month to mid-month crop ET (to allow comparison between the Unit B
irrigation diversion requirement estimate and the monthly pumping records). The mid-month to
mid-month crop ET values are slightly higher than the calendar month crop ET values for the
month of July which causes the Unit B headgate irrigation diversion requirement to be slightly higher. These facts show there is no discrepancy between the irrigation diversion requirements
computed for Unit A and Unit B.
• - ii X
:I!] Bo t <R l!leW tns«t Fgmat Iocls Qai• ~ ~ect l!oll>
Q lA I ei I~ Ol I l'> "'-I ~ · <1 1-, • <" • I :i: • H i i 111111-F193 fl, =F1871 1911100)
A B C D E F G
t
---" -r Jul Aug 31 31
_ se-,-L-t-__ O~ct+-_T_ot_al+---+---+---+----t--30 ~
239 2506 8440 12305 13483 5960 47 1327 7906 11826 13277 5960 ,
283 3262 10608 15443 16563 7426 56 2305 10526 15587 16496 7572
2832 114 45880 ac It= 2601 O 4 2944 ac It= 3609 283 57477 ac ft= 1-3684 287 56513 ac ft= I
2.65 ,af/ac 2.48 af/ac 3.32 af/ac 3.27iaflac ~----< 1-------
~ = ~---r------'6'-=--/0 70 80 80 80 80 70 60 73 ercent
Div Req 90%
Est Base Tran~
2007 Div Req CU90%
Div.Re 90%
205 _Erojecl Efficienc CU 206 Div.Req. 207 CU 90% 208 Div.Req. 90% 209
399 3580 10550 15382 7 450 4046 190 58450. af based on CU 3.38 af/ac 79 1895 9882 14 782
471 4660 13260 19304 7450 _37_1_5,____~o,__~544~ 01 afE_ased on Div Re 9282 5156 472 73308 af based on CU90
3_._14aUac 4.24 af/ac
93 3293 13157
__ 0_ 1_684--+-f 3481
19484 20620 9465 5262 478 71854 af based on Div.Re 4 15 af/ac
3369 3481
--j 3481 3369t
I
399 5264 14031 18751 20335 10931 79 3580 13364 18151 20078 10931 7084
471 93
6345 16742 22673 24184 12763 8525 4978 16638 22853 , 24101 12946 8631 1
0.60 0.48 0.60 0.60 0.37 , 0.59 0.60 ~ 0.63 0.60 0.46 0.63
0.66 0.65 0.68 0.68
0.66 ~ 0.38 0.66 0.55 0.37 0.68 0.58 0.42 0.68 0.58 0.43,
1 1684 20551 ac ft !Worstell Method)
1874 1684
2163
79001 af based on CU 4 57 af/ac 7 4952 af based on Div.Re 4 .33 af/ac 9385.ll._ af based on CU90° 5 43 af/ac 92404 af based on Div.Re 5.34 af/ac _L__
0.06 0.58 Based on Pro· cu j 0.00 0.57 Based on Pro_·ect Div.Req. -J--
_ 0._13 __ 0_.6_1_,_B_as_ed on Project CU 90% _ i 0.13 0.61 Based on Project Div.Req. 90%
K 4 lo H AM 2001 Me 2£1'.JZ AM 2003 AM 2004 AM 2005 MB 2CU Atd 2007 "' . ( C!.M " Alto5NpH • '- " DO ~ .C O la! . I ~ · ;I!. · A ·= §l :;
Figure 2 Irrigation diversion requirements computed for Unit A in the Surface Water Coalition Expert Report.
Affidavit of John S. Koreny Rebuttal to Sullivan Rebuttal Report and Sur-Rebuttal Report
November 11, 2008 Page 3
Crops being planted on Unit B can not withstand the soil moisture deficits that Mr. Sullivan assumes in his analysis without suffering crop stress, decreased crop quality and reduced crop yield.
Mr. Sullivan's Sur-Rebuttal Report states that the, "A&B Rebuttal Report states that the soil
moisture in the crop root zone cannot be significantly depleted without causing stress to the
crop. This is contrary to the irrigation literature which reports that the average water holding
capacity of the soil can typically be depleted by 50 percent ( +/- depending on the crop) without
causing significant crop stress. Appendix A contains several examples from the literature of
suggested allowable root zone depletions" (pg. 3).
Mr. Sullivan makes the following assumptions in his estimate of crop irrigation requirements:
+ Water is taken out of the soil moisture column to make up for irrigation shortages incurred by Mr. Sullivan's reduced irrigation rate. This occurs from June 11 throu¥h mid-August or about 30 to 60 days after planting assuming an early May planting date.
+ All crops grown on Unit B can withstand 57 percent soil moisture depletion without . 3 causmg crop stress.
+ All crops have a 3.4 ft rooting depth.4
Table 1 below summarizes Mr. Sullivan's soil moisture assumptions as compared to the standard
criteria presented in Appendix A of his Sur-Rebuttal Report. This information shows that these assumptions are not appropriate for many of the crops grown in Unit B, such as sugar beets,
alfalfa, beans and potatoes, and will result in crop stress and reduced yield. For example, for
potatoes the maximum rooting depth is usually 1-2 feet, and Mr. Sullivan assumed a maximum
rooting depth of 3.4 feet, nearly twice as much. Potatoes don't reach maximum rooting depth until after 80 days, well after Mr. Sullivan withdraws water from the soil moisture column to
make up for a decreased irrigation rate. Thus potatoes will have even less soil moisture to draw
upon because their roots can not fully use the soil moisture column of 3.4 feet assigned by Mr.
Sullivan during the time that the plants must use it because his reduced irrigation rate can not keep up with the crop demand. Mr. Sullivan assumes that potatoes can withstand 57 percent soil moisture depletion with a 3.4 foot rooting depth, when the criteria referenced in Appendix A of
the Sur-Rebuttal report lists the recommended soil moisture depletion at 25 to 50 percent (for a 1-2 foot rooting depth). Also, the maximum soil moisture depletion of 50 percent for potatoes is
as the crop matures after the peak demand period. The lower allowable moisture depletion is
applicable to the peak demand period when Mr. Sullivan proposes to deplete moisture from the soil column to make up for reduced irrigation diversion rates. Therefore, for potatoes, the soil moisture depletion as used in Mr. Sullivan's method would be close to 100 percent, rather than
2 Assuming a typical planting date of May 15 and following the Sullivan's method that the soil moisture reservoir is depleted from June 11 to "mid-August" (Sur-Rebuttal Report, page 5, last paragraph, page 6, 1 •1 and 2"d paragraphs).
3 Page 6 of Sullivan Sur-Rebuttal Report, 1•1 and 41h paragraph. 4 Rooting depth of 3.4 feet is shown on Mr. Sullivan's spreadsheet Gen_rootdepth.xls, Sheet 1, cell B46.
Affidavit of John S. Koreny Rebuttal to Sullivan Rebuttal Report and Sur-Rebuttal Report
November 11, 2008 Page 4
the 57 percent shown in his Sur-Rebuttal report. Potato crop yield and quantity would be significantly reduced under these conditions. The potato crop is about 12 percent of the Unit B crop distribution based on the 2002 Conservation Plan, so this would be a significant impact to overall crop yield.
Similar problems occur for other crops. The assumption Mr. Sullivan is using for the allowable soil depletion for sugar beets, beans and alfalfa is also 57 percent, which is above or at the very maximum of the criteria presented on Appendix A in the Sur-Rebuttal Report. For sugar beets, the maximum rooting depth is 3 to 4 feet and it takes about 110 days for roots to reach this depth, which is well after the period in June and July when the peak irrigation demand and soil moisture deficit Mr. Sullivan is advocating would occur. The maximum allowable soil depletion for sugar beets is 60 percent, and with a correction for actual root depth that would occur during June and July when the soil moisture zone would be depleted, the maximum soil depletion under Mr. Sullivan's method would be much larger than 60 percent. The sugar beet crop yield and quantity would be significantly reduced under these conditions. Sugar beets comprise about 24 percent of the A&B crop distribution, so this would be a very significant impact.
For alfalfa, the allowable depletion is 30 to 55 percent and Mr. Sullivan is assuming that 57 percent would not stress the crop, even though it is above the maximum amount of allowable depletion. If alfalfa is grown as a rotation crop (as is often done on Unit B) then these soil moisture amounts would be less because the root zone would be less in the first year of the rotation than the 3.4 ft root zone depth assumed by Mr. Sullivan during the period soil moisture depletion would occur. Alfalfa is about 7 percent of the Unit B crop distribution and is an important rotation crop to assist in soil nitrification.
For beans, the rooting depth ranges from 2 to 3 feet, and it takes about 50 days to reach mature rooting depth. During the period from June to July when Mr. Sullivan recommends shorting the irrigation rate and relying on soil moisture, beans would not have reached full rooting depth and never will reach the average rooting depth of 3.4 feet used in Mr. Sullivan's method. Also, the 57 percent soil depletion used by Mr. Sullivan is at the top of the range that is recommended for the plant. Because Mr. Sullivan has over-estimated the rooting depth of these crops, the actual soil depletion would be much greater than 57 percent which would cause crop yield and quantity impacts. Beans are about 6 percent of the Unit B crop distribution and are an important crop for some Unit B farmers. Another problem with Mr. Sullivan's methodology for beans is that during the early growth period, beans are sensitive to over irrigation and attempts to fill the soil profile in anticipation of the peak demand period could cause crop damage from too much irrigation water at the wrong time.
This information shows that the criteria for soil moisture depletion, root zone depths and time to reach maximum root depth in Appendix A of the Sur-Rebuttal Report is inconsistent with the assumptions used in Mr. Sullivan's soil moisture deficit methodology when computing acceptable irrigation requirements for many of the crops grown on Unit B. This shows that Mr. Sullivan's method of shorting the itTigation rate and depending on withdrawals from soil
Affidavit of John S. Koreny Rebuttal to Sullivan Rebuttal Report and Sur-Rebuttal Report
November 11, 2008 Page 5
moisture will cause crop stress and will reduce yields and quality for these crops. The four crops described above (sugar beets, alfalfa, potatoes and beans) comprise 49 percent of the crop distribution on A&B, so shortages incurred to these crops would cause significant injury. A&B is required to supply and to maintain well capacity for the crops that are grown by farmers, including crops that can not tolerate extended periods of soil moisture deficit for crops that have relatively shallow roots in June and July and early August when Mr. Sullivan is advocating decreasing the irrigation rate below the actual demand. It is clear from the data described above and presented in Appendix A of Mr. Sullivan's Sur-Rebuttal Report that a major portion of the Unit B crops will not have roots deep enough to withdraw moisture from the entire soil moisture column assumed by Mr. Sullivan and will not be able to tolerate the soil moisture depletions that would occur if the decreased irrigation rate of 0.65 miner's-inch/acre that Mr. Sullivan is advocating were to be implemented. A&B farmers should not be required to bear the risk associated with reducing irrigation rates and depending on soil moisture when such irrigation practices will not provide the water needed to fully meet the crop demand and would result in crop stress and reduced yields.
Affidavit of John S. Koreny Rebuttal to Sullivan Rebuttal Report and Sur-Rebuttal Report
November 11, 2008 Page 6
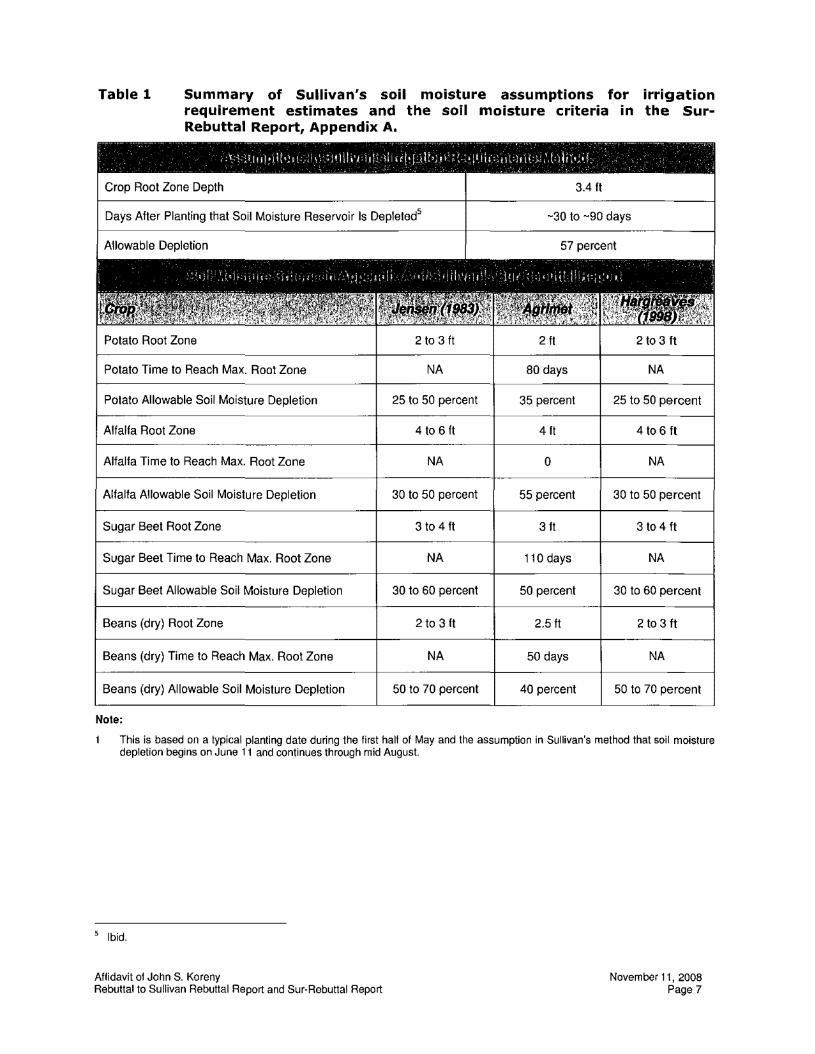
Table 1 Summary of Sullivan's soil moisture assumptions for irrigation requirement estimates and the soil moisture criteria in the SurRebuttal Report, Appendix A,
~ - - - - - - - - ' - -- - - -- • , ' ~ -~- - ---T C
, ·l.'.,i111l'IH,111 .. 1,· :;!1'.l,·1-11F-1: ,i[•plr,;n·,: .. ,1d,c;,1:'inu:i.t-:lit,;d . t - - C J C _;, • i _ :..__'-.i _ cJ " • • _ ."
Crop Root Zone Depth 3.4 ft
Days After Planting that Soil Moisture Reservoir Is Dep1eted5 -30 to -90 days
Allowable Depletion 57 percent
Potato Root Zone 2 to 3 ft 2 ft 2 to 3 ft
Potato Time to Reach Max. Root Zone NA 80 days NA
Potato Allowable Soil Moisture Depletion 25 to 50 percent 35 percent 25 to 50 percent
Alfalfa Root Zone 4 to 6 ft 4 ft 4 to 6 ft
Alfalfa Time to Reach Max. Root Zone NA 0 NA
Alfalfa Allowable Soil Moisture Depletion 30 lo 50 percent 55 percent 30 to 50 percent
SugarBeetRootZone 3 to 4 ft 3 ft 3 to 4 ft
Sugar Beet Time to Reach Max. Root Zone NA 110 days NA
Sugar Beet Allowable Soil Moisture Depletion 30 to 60 percent 50 percent 30 to 60 percent
Beans (dry) Root Zone 2 to 3 ft 2.5 ft 2 to 3 ft
Beans (dry) Time to Reach Max. Root Zone NA 50 days NA
Beans (dry) Allowable Soil Moisture Depletion 50 to 70 percent 40 percent 50 to 70 percent
Note:
This is based on a typical planting date during the first hatt of May and the assumption in Sullivan's method that soil moisture depletion begins on June 11 and continues through mid August.
5 Ibid.
Affidavit of John S. Koreny Rebuttal to Sullivan Rebuttal Report and Sur-Rebuttal Report
November 11, 2008 Page 7
Dated this~ day of November, 2008.
SUBSCRIBED and SWORN to before me this Rth day of November, 2008.
Notary PubllC . State of Wostilngton
DIANE l.Ml!ISTER My Appolntrnent E>epJ,es Aug 9, 2009
Affidavit of John S. Koreny Rebuttal to Sullivan Rebuttal Report and Sur-Rebuttal Report
~~ NOTARYPUBLIC FOR ~ ~ Residing at:,~ - ~ My CommissionExpires:~, ZlJ<fj
November 11, 2008 Page 8


![KM 364e-20150909175922 - Department of Foreign Affairs€¦ · · 2017-08-30Maiden / Single name of Mother: Citizenship Acquired By: C] ... Affidavit to Explain Mutilation/Damage/Discrepancy,](https://img.pdfslide.us/doc/110x75/5af6f8cc7f8b9a5b1e8fd2e7/km-364e-20150909175922-department-of-foreign-2017-08-30maiden-single-name.jpg)


![KM 364e-20150909175922 · GENDER/ MALE a FEMALE C] ... Affidavit to Explain Mutilation/Damage/Discrepancy, with payment Of](https://img.pdfslide.us/doc/110x75/5b6ef5f77f8b9a46538bf42e/km-364e-gender-male-a-female-c-affidavit-to-explain-mutilationdamagediscrepancy.jpg)