Embed Size (px)
Citation preview

A Feasibility Report for a Food HUB Serving a 14 County Region of Northwest Michigan
Presented to: The McBain LDFA and Marilyn Knak
Prepared by: Development Economics LLC Peter Cambier, Principal
October 30, 2013

i
AUTHORIZATION This Feasibility Report has been compiled and is presented by Development Economics, a Michigan corporation, and it has been conducted under the authority of the Tax Increment Finance Authority of the City of McBain and Marilyn Knak. It was supported in part by a grant from USDA Rural Development.
DISCLAIMER All representations made in this Report are made by Development Economics, LLC, which takes full responsibility for the contents herein, and any errors or omissions found in this Report are the sole and exclusive responsibility of its author.
RECOGNITIONS The author wishes to thank the following persons and organizations who offered generous assistance with this document: The Michigan Field Office of the National Agricultural Statistics Service, Patty Cantrell of Regional Food Solutions, LLC, Colleen Matts and her research staff at the Center for Regional Food Systems at Michigan State University, Evan Smith of Cherry Capital Foods, Dawn Paulin of DP Computer Consulting, Marilyn Knak and the Tax Increment Finance Authority of the City of McBain.
ii
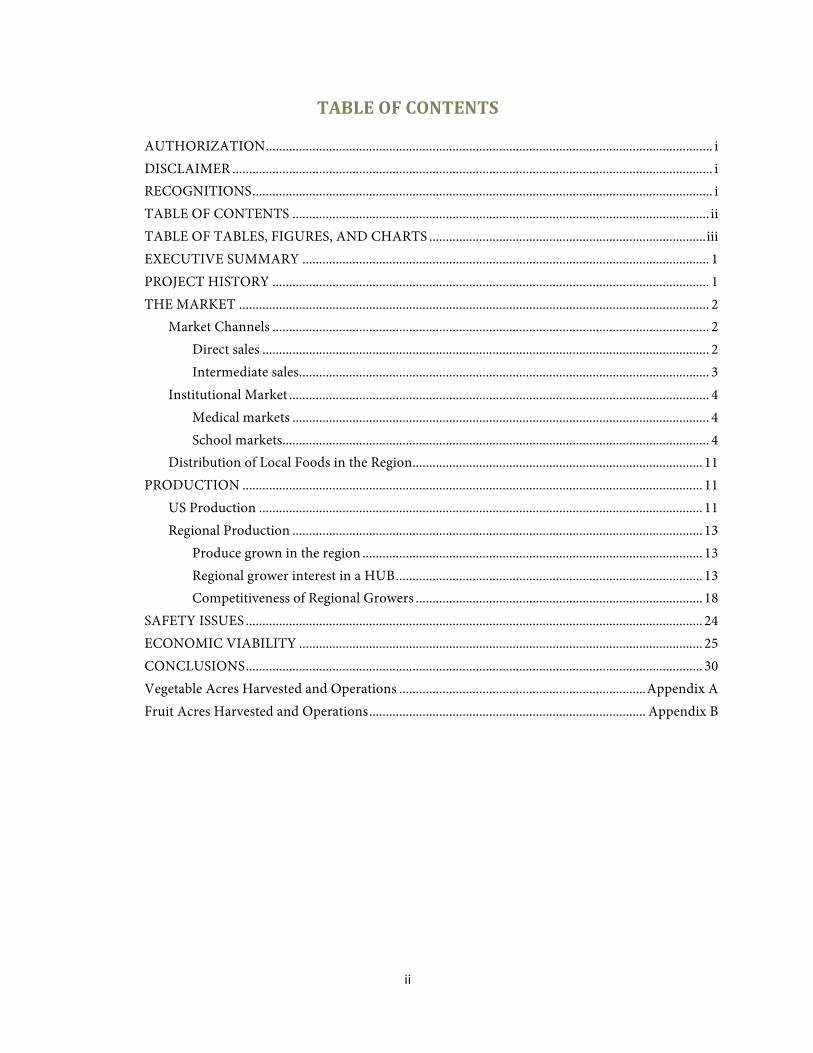
TABLE OF CONTENTS
AUTHORIZATION ...................................................................................................................................... i DISCLAIMER ................................................................................................................................................ i RECOGNITIONS .......................................................................................................................................... i TABLE OF CONTENTS ............................................................................................................................. ii TABLE OF TABLES, FIGURES, AND CHARTS ................................................................................... iii EXECUTIVE SUMMARY .......................................................................................................................... 1 PROJECT HISTORY ................................................................................................................................... 1 THE MARKET ............................................................................................................................................. 2
Market Channels ................................................................................................................................... 2 Direct sales ...................................................................................................................................... 2 Intermediate sales ........................................................................................................................... 3
Institutional Market .............................................................................................................................. 4 Medical markets ............................................................................................................................. 4 School markets ................................................................................................................................ 4
Distribution of Local Foods in the Region ....................................................................................... 11 PRODUCTION .......................................................................................................................................... 11
US Production ..................................................................................................................................... 11 Regional Production ........................................................................................................................... 13
Produce grown in the region ...................................................................................................... 13 Regional grower interest in a HUB ............................................................................................ 13 Competitiveness of Regional Growers ...................................................................................... 18
SAFETY ISSUES ......................................................................................................................................... 24 ECONOMIC VIABILITY ......................................................................................................................... 25 CONCLUSIONS ......................................................................................................................................... 30 Vegetable Acres Harvested and Operations .......................................................................... Appendix A Fruit Acres Harvested and Operations ................................................................................... Appendix B
iii
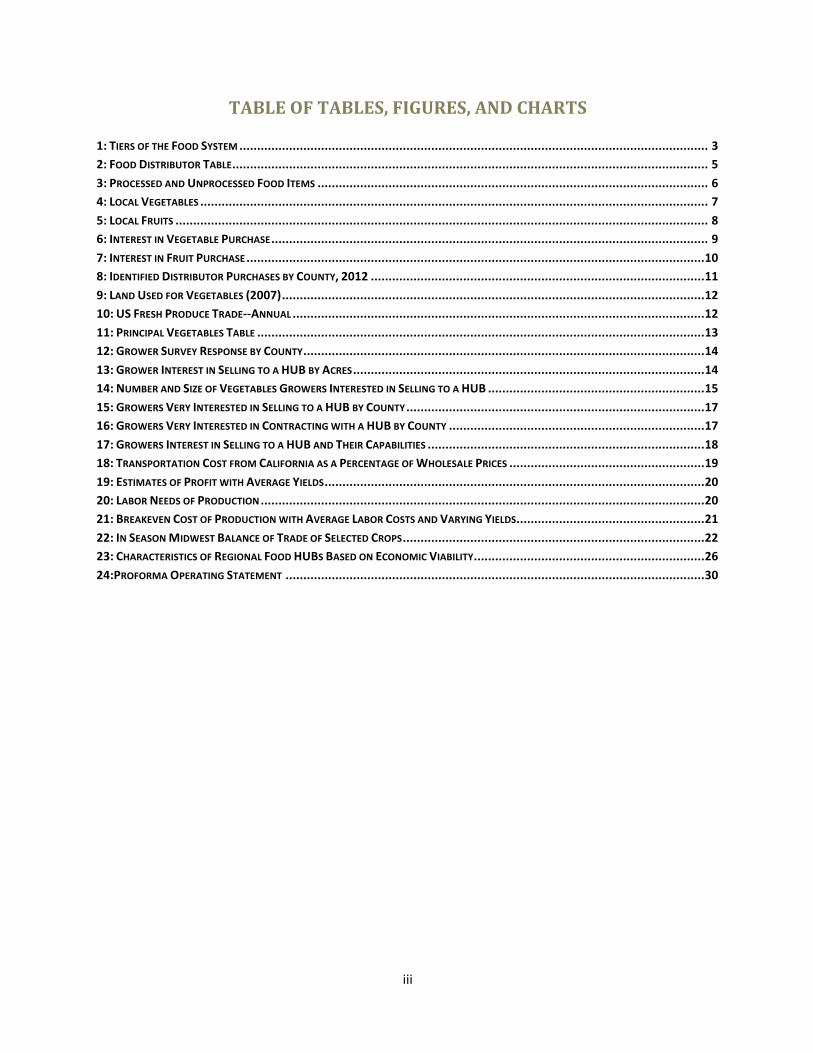
TABLE OF TABLES, FIGURES, AND CHARTS
1: TIERS OF THE FOOD SYSTEM .................................................................................................................................... 3 2: FOOD DISTRIBUTOR TABLE ...................................................................................................................................... 5 3: PROCESSED AND UNPROCESSED FOOD ITEMS .............................................................................................................. 6 4: LOCAL VEGETABLES ............................................................................................................................................... 7 5: LOCAL FRUITS ...................................................................................................................................................... 8 6: INTEREST IN VEGETABLE PURCHASE ........................................................................................................................... 9 7: INTEREST IN FRUIT PURCHASE ................................................................................................................................. 10 8: IDENTIFIED DISTRIBUTOR PURCHASES BY COUNTY, 2012 .............................................................................................. 11 9: LAND USED FOR VEGETABLES (2007) ....................................................................................................................... 12 10: US FRESH PRODUCE TRADE-‐-‐ANNUAL .................................................................................................................... 12 11: PRINCIPAL VEGETABLES TABLE .............................................................................................................................. 13 12: GROWER SURVEY RESPONSE BY COUNTY ................................................................................................................. 14 13: GROWER INTEREST IN SELLING TO A HUB BY ACRES ................................................................................................... 14 14: NUMBER AND SIZE OF VEGETABLES GROWERS INTERESTED IN SELLING TO A HUB ............................................................. 15 15: GROWERS VERY INTERESTED IN SELLING TO A HUB BY COUNTY .................................................................................... 17 16: GROWERS VERY INTERESTED IN CONTRACTING WITH A HUB BY COUNTY ........................................................................ 17 17: GROWERS INTEREST IN SELLING TO A HUB AND THEIR CAPABILITIES .............................................................................. 18 18: TRANSPORTATION COST FROM CALIFORNIA AS A PERCENTAGE OF WHOLESALE PRICES ....................................................... 19 19: ESTIMATES OF PROFIT WITH AVERAGE YIELDS ........................................................................................................... 20 20: LABOR NEEDS OF PRODUCTION ............................................................................................................................. 20 21: BREAKEVEN COST OF PRODUCTION WITH AVERAGE LABOR COSTS AND VARYING YIELDS ..................................................... 21 22: IN SEASON MIDWEST BALANCE OF TRADE OF SELECTED CROPS ..................................................................................... 22 23: CHARACTERISTICS OF REGIONAL FOOD HUBS BASED ON ECONOMIC VIABILITY ................................................................. 26 24:PROFORMA OPERATING STATEMENT ...................................................................................................................... 30

Page 1 of 31
EXECUTIVE SUMMARY This report seeks to answer the question of the feasibility of a specific type of food HUB in Northwest Michigan. Specifically, is there a viable for-‐profit business model for infrastructure that would aggregate the production of the existing farms in the region for the intermediate/wholesale market, i.e. distributors, institutions, retail outlets and restaurants?
It is the finding of this analysis of the potential for a food HUB that two things are necessary before any substantial increase in the consumption of local produce can be realized. The local production of produce must increase dramatically and new infrastructure must be built, or rebuilt, to move that produce into local market channels. A food HUB to aggregate that produce is not feasible at this time given the production of produce in the region, its quantity but more important the way in which it is produced.
PROJECT HISTORY There are few concepts in agricultural innovation as popular today as that of the food HUB. HUBs of various types have sprouted across the United States in recent years. They range from virtual entities that seek only to match producers with appropriate market opportunities to HUBs that take physical possession of agricultural products, process, repack and distribute those products. HUBs have been organized as co-‐ops, non-‐profit and for-‐profit organizations.
The Regional Resource Food HUB Guide” (the Guide) published in April, 2012 by the USDA Agricultural Marketing Service defines a food HUB as follows. “A regional food hub is a business or organization that actively manages the aggregation, distribution, and marketing of source-‐identified food products primarily from local and regional producers to strengthen their ability to satisfy wholesale, retail, and institutional demand.”
According to the Guide:
“Regional food hubs are defined less by a particular business or legal structure, and more by how their functions and outcomes affect producers and the wider communities they serve. Defining characteristics of a regional food hub include:
• Carries out or coordinates the aggregation, distribution, and marketing of primarily locally/regionally produced foods from multiple producers to multiple markets.
• Considers producers as valued business partners instead of interchangeable suppliers and is committed to buying from small to mid-sized local producers whenever possible.
• Works closely with producers, particularly small-scale operations, to ensure they can meet buyer requirements by either providing technical assistance or findings partners that can provide this technical assistance.
• Uses product differentiation strategies to ensure that producers get a good price for their products. Examples of product differentiation strategies include identity preservation (knowing who produced it and where it comes from), group branding, specialty product

Page 2 of 31
attributes (such as heirloom or unusual varieties), and sustainable production practices (such as certified organic, minimum pesticides, or “naturally” grown or raised).
• Aims to be financially viable while also having positive economic, social, and environmental impacts within their communities, as demonstrated by carrying out certain production, community, or environmental services and activities.
The surveys done for the USDA Guide found that the legal structures used by HUBs were fairly equally divided between for-‐profit entities, co-‐ops and non-‐profits. The most common activity of a HUB was distribution followed by aggregation.
The original intent of this feasibility study was to examine the feasibility of a for-‐profit business that would aggregate produce in Northwest Michigan and provide “light” processing as needed to meet market demand. There was and continues to be in many quarters the assumption that growers are handicapped in their efforts to market produce by the lack of the infrastructure needed to 1) aggregate their produce to achieve the volumes desired by the market and 2) accomplish the processing necessary to move that volume effectively in the market (including the conjecture that regional IQF or “individually quick frozen” capacity is needed). This study indicates that, in fact, the major hurdle to increasing the amount of local produce being sold in the region is lack of production.
For the purposes of this feasibility study the term “local” is used to refer to the 14 county region bounded on its four corners by Mason and Clare on the south and Leelanau and Crawford on the north. Although this is the general description of the area from which produce might be aggregated due to the efficiencies of aggregation, the “local” area which might be served by the sales of a HUB in this region would include the sales territory of any distributor that might buy from the HUB, which might reasonably be expected to include much of Michigan.
THE MARKET
Market Channels
Direct sales The demand for locally grown food has seen a rapid increase in recent years. In their report titled “Local Food Systems Concepts, Impacts, and Issues. The US Department of Agriculture Economic Research Service, (Economic Research Report No. (ERR-‐97) 87 pp, May 2010) reported that direct grower to consumer sales of edible farm production almost doubled between 1997 and 2007 from $5.51 million to $11.2 million. However this same study reported that these sales accounted of only .8% of the sales of edible farm products. The USDA Food HUB Guide reference above estimates that the total “local” food consumption through all market channels grew from $4.8 billion in 2008 to$7 billion in 2011. This growth has occurred at a time when our country’s source for fresh produce has become increasingly international in origin as the national supply infrastructure has declined.
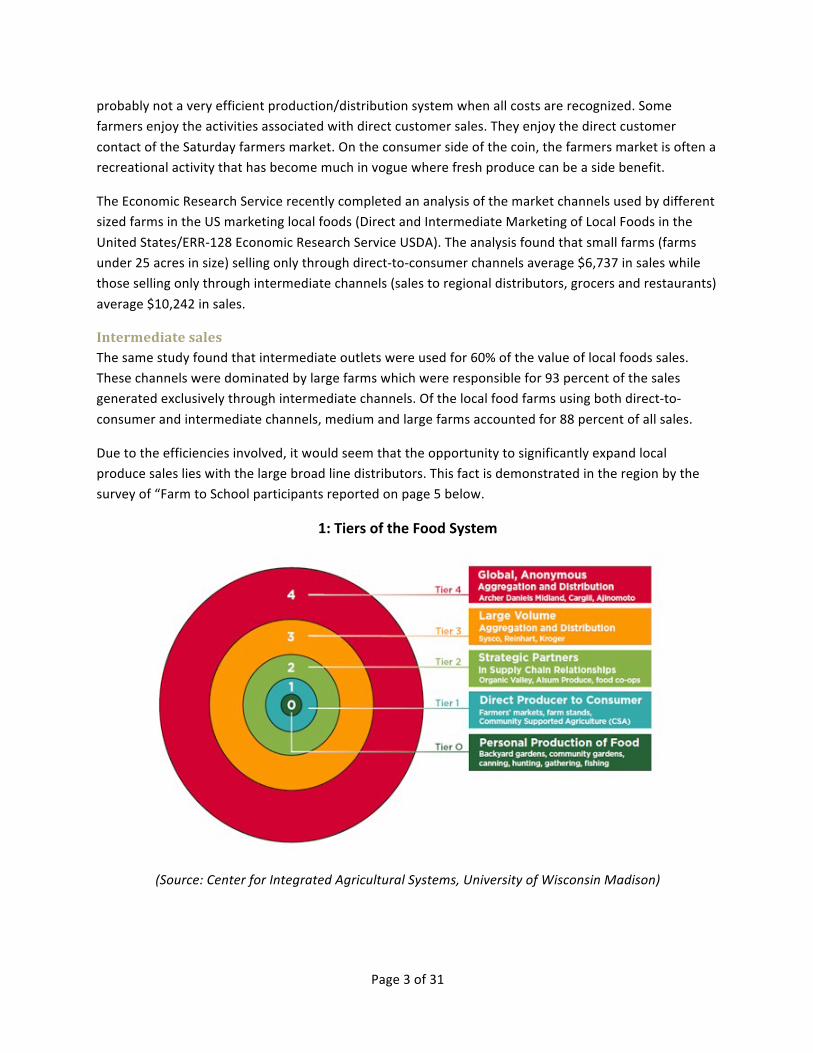
In the diagram of our food systems provided below this activity is shown as the tier one food system activity. There is a good deal of anecdotal evidence that this rate of growth will not continue. It is
Page 3 of 31
probably not a very efficient production/distribution system when all costs are recognized. Some farmers enjoy the activities associated with direct customer sales. They enjoy the direct customer contact of the Saturday farmers market. On the consumer side of the coin, the farmers market is often a recreational activity that has become much in vogue where fresh produce can be a side benefit.
The Economic Research Service recently completed an analysis of the market channels used by different sized farms in the US marketing local foods (Direct and Intermediate Marketing of Local Foods in the United States/ERR-‐128 Economic Research Service USDA). The analysis found that small farms (farms under 25 acres in size) selling only through direct-‐to-‐consumer channels average $6,737 in sales while those selling only through intermediate channels (sales to regional distributors, grocers and restaurants) average $10,242 in sales.
Intermediate sales The same study found that intermediate outlets were used for 60% of the value of local foods sales. These channels were dominated by large farms which were responsible for 93 percent of the sales generated exclusively through intermediate channels. Of the local food farms using both direct-‐to-‐consumer and intermediate channels, medium and large farms accounted for 88 percent of all sales.
Due to the efficiencies involved, it would seem that the opportunity to significantly expand local produce sales lies with the large broad line distributors. This fact is demonstrated in the region by the survey of “Farm to School participants reported on page 5 below.
1: Tiers of the Food System
(Source: Center for Integrated Agricultural Systems, University of Wisconsin Madison)
Page 4 of 31
Institutional Market Institutional markets have been an attractive market for farmers interested in expanding sales of produce for several reasons. They provide larger volume sales than can generally be found at farmers markets or road side stands. Their purchasing policies are usually locally controlled (with the exception of those institutions that contract out their food service operations). However farmers in Michigan have not been very successful in entering this market. A survey of farmers by the MSU Center for Regional Food Systems (MSU CRFS) found that only 7% of the respondents were selling to institutions and that three quarters of those were selling less than $5,000 of food to those institutions annually.
Medical markets The Michigan Health and Hospital Association has initiated its Healthy Foods program which recommends that hospitals sign the Michigan Good Foods Charter which commits the institution to the purchase of 20% of its food from Michigan grown and produced sources by 2020. As of December of 2012, 114 of Michigan’s nearly 150 hospitals had signed on to this pledge according to the MSU Center for Regional Food Systems.
The hospital initiative has had a slow start in the 14 county region. Although several hospitals have started using fresh produce in their cafeterias only one is known to be using local produce in meals served to patients, the MidMichigan Health Center in Clare. MidMichigan serves 300 to 400 meals per day and purchases $5,000 to $6,000 annually from Cherry Capital Foods. They include the local farm source of food on their patient menu daily. It also purchases local foods from GFS. They estimate that they spend from 15% to 20% more for the locally produced foods that they buy. However, in their judgment, their local foods are fresher and of better quality. The major obstacle to growing their local food purchases is the lack of seasonal availability. They would like to have a locally sourced frozen vegetable product available to them. MidMichigan interpretation of the Michigan Food code requires that they purchase food from a third party certified source, thus they do not purchase any foods directly from the farm.
School markets Nationally there is the Farm to School movement that supports and encourages schools to purchase local foods and in Michigan nearly 90% of schools report that they are purchasing local foods or are interested in doing so according to surveys conducted by the MSU Center for Regional Food Systems (CRFS). These schools report purchasing local food through their broad line distributor in most instances, rather than directly from farmers or specialty distributors. Schools report the most interest in purchasing local fresh whole produce rather than dairy, meats etc.
Center for Regional Food Systems completed a survey of school food system directors in February of 2012. The 14 counties covered by this study were broken out as a subset of those returns. Twenty one out of 48 schools in the region responded to the survey.
Sixteen respondents reported self-‐managed food service and 5 reported contracted food service. Fourteen represented a public school system; 6 represented a private or parochial school; 1 did not respond. Total student enrollment reported by all respondents was 32, 318.

Page 5 of 31
Respondents reported using about equal amounts of scratch cooking, partially prepared and heat and serve preparation methods. They reported spending an average of 48% of the food service budget to purchase food and 49% for operations. The food portion of the typical meal is about $1 with 17 to 20 cents of that spent on produce.
When asked what food distributors they used, respondents reported those in the following table:
2: Food Distributor Table
Number Name 13 Gordon Food Service 9 Prairie Farms Dairy 8 Aunt Millie 4 Sysco 3 Country Fresh Dairy 2 Van Eerden, Cedar Crest Dairy, Sarah Lee/Earth Grains
1 Tyson, Pierre, Schwanns, Cherry Capital Foods, Coke, Millers Farm, Lutz Farm, McDonald’s Bakery, Pepsi, McKee Baking, National Food Group
It is clear from this response that the broad line provider, Gordon Food Service, along with Sysco to a much lesser extent serves most of the schools in the region.
Provided with a list of 20 processed (i.e. cut, bagged, dried, frozen, etc.) produce items and 20 unprocessed, fresh, whole produce items, respondents were asked to select and rank the five processed and five fresh items that were most popular during school year 2010-‐2011. The following table displays the entire list of processed and unprocessed produce items and the number of respondents that selected each item. There was no distinction draw in this question between “local” and “non-‐local” sourced produce.

Page 6 of 31
3: Processed and Unprocessed Food Items
Processed Produce Respondents Selecting Item Unprocessed Produce Respondents
Selecting Item
Number Percent Number Percent Carrot sticks/baby carrots 14 66.7 Apples 18 85.1 Apple slices 9 42.9 Bananas 13 61.9 Lettuce -‐ chopped/shredded 9 42.9 Oranges 12 57.1 Potatoes -‐ diced/fries 8 38.1 Grapes 11 52.4 Salad mix 7 33.3 Cucumbers 6 28.6 Pears 5 23.8 Lettuce 5 23.8 Celery sticks 5 23.8 Pears 5 23.8 Strawberries -‐ frozen 5 23.8 Carrots 3 14.3 Tomatoes -‐ sliced/diced 5 23.8 Tomatoes 3 14.3 Broccoli florets/chopped 4 19.0 Onions 3 14.3 Orange wedges 4 19.0 Watermelon 3 14.3 Green beans -‐ frozen 3 14.3 Potatoes 2 9.5 Blueberries -‐ frozen 3 14.3 Broccoli 1 4.8 Cherries -‐ dried 2 9.5 Celery 1 4.8 Cucumbers -‐ sliced 2 9.5 Peppers, bell 1 4.8 Raisins -‐ boxed 2 9.5 Pineapple 1 4.8 Peas -‐ frozen 1 4.8 Spinach 1 4.8 Cole slaw mix 0 0 Cantaloupe 0 0 Cauliflower florets/chopped 0 0 Cauliflower 0 0 Peppers, bell -‐ sliced 0 0 Greens, cooking 0 0
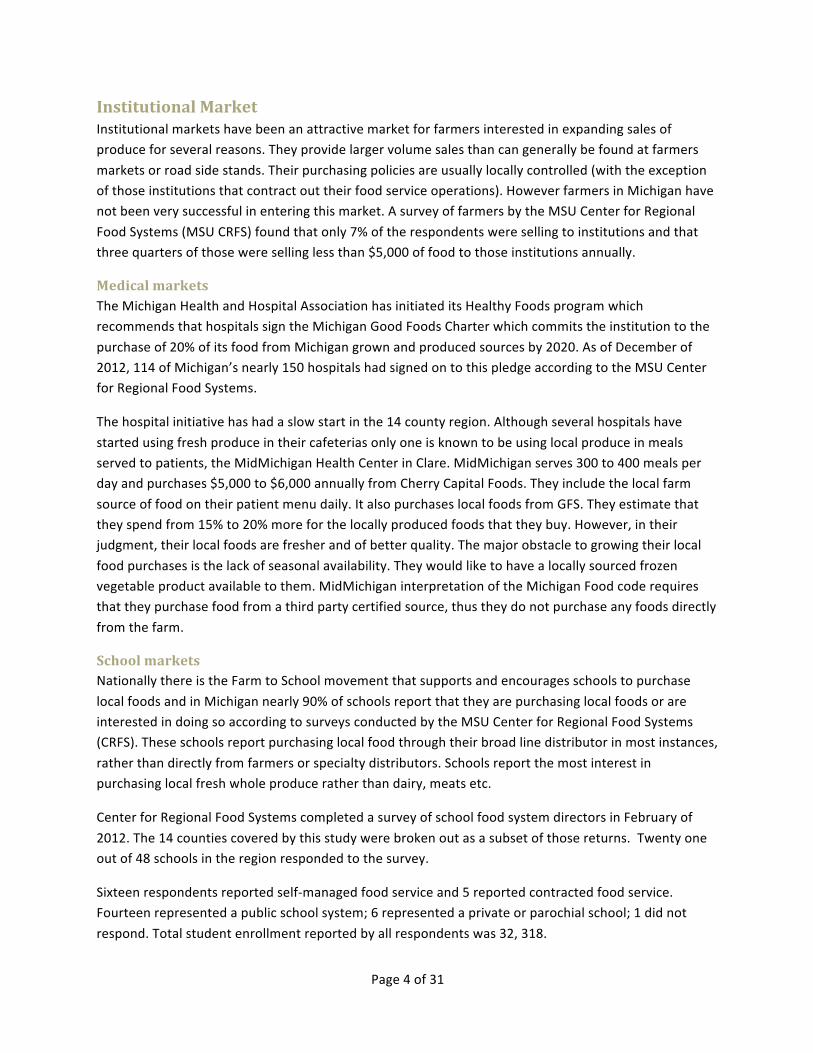
Respondents were provided lists of vegetables fruits, meat products, dairy products, grain products and beans/legumes and were asked to check the ones that they had purchased locally in any form during the 2010-‐2011 school year. The following tables display the number and percent of respondents who reported purchasing each listed item.
Page 7 of 31
4: Local Vegetables
Local Vegetables Number that Purchased
Percent that Purchased
Cucumbers 10 47.6 Tomatoes, slicing 9 42.9 Asparagus 9 42.9 Tomatoes, cherry or grape 8 38.1 Onions 8 38.1 Cauliflower 8 38.1 Carrots 7 33.3 Broccoli 7 33.3 Peppers 7 33.3 Salad greens 7 33.3 Corn 6 28.6 Beans, green 6 28.6 Cabbage, green or red 6 28.6 Potatoes 5 23.8 Radishes 4 19.0 Spinach 3 14.3 Greens, cooking (collards, kale, etc.) 2 9.5 Pumpkins 2 9.5 Peas 2 9.5 Herbs (basil, dill, etc. 2 9.5 Sweet potatoes 2 9.5 Squash, winter 2 9.5 Chard 2 9.5 Rutabaga 2 9.5 Lettuce 1 4.8 Mushrooms 1 4.8 Beets 1 4.8 Parsnips 1 4.8 Turnips 1 4.8 Edamame 1 4.8 Kohlrabi 1 4.8 Brussel Sprouts 0 0 Eggplant 0 0
Page 8 of 31
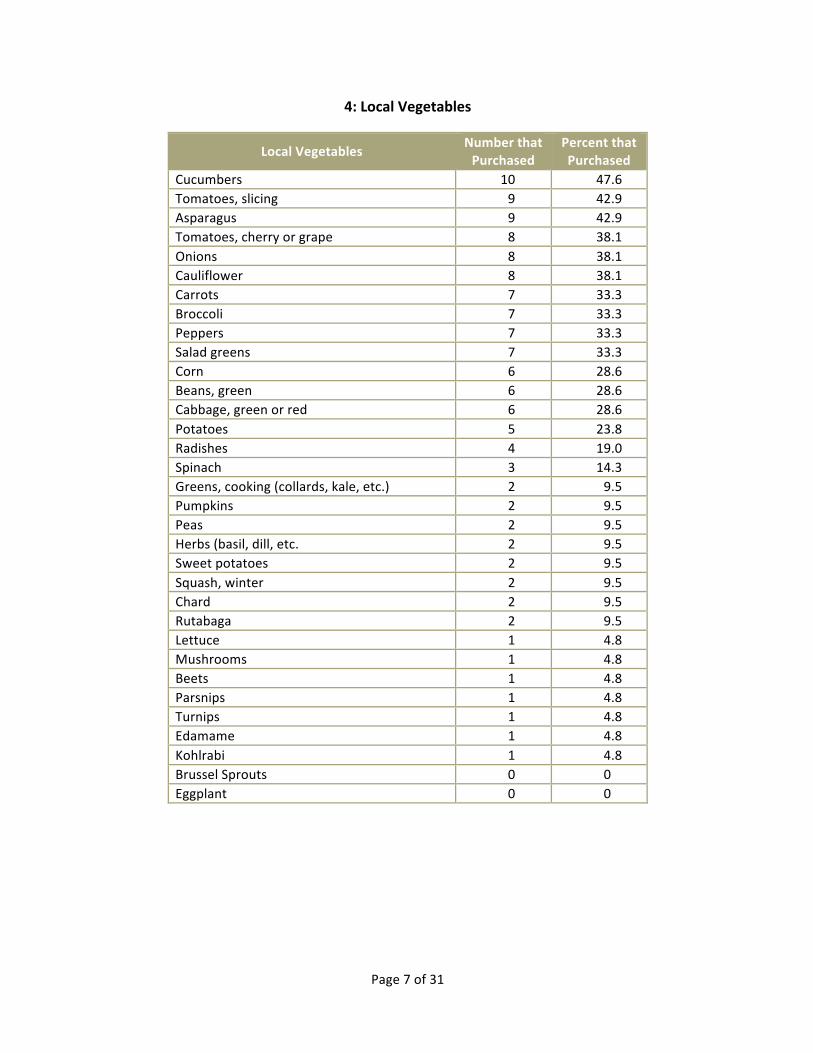
5: Local Fruits
Local Fruits Number that Purchased
Percent that Purchased
Apples 12 57.1 Peaches 8 38.1 Watermelon 7 33.3 Blueberries 6 28.6 Strawberries 6 28.6 Cherries 5 23.8 Plums 5 23.8 Raspberries 4 19.0 Grapes 4 19.0 Cantaloupe 3 14.3 Blackberries 1 4.8 Rhubarb 1 4.8
Respondents were provided lists of vegetables fruits, meat products, dairy products, grain products and beans/legumes in various forms and were asked to check any items that they would be interested in purchasing locally in the future. The strongest interest in purchasing local foods was for vegetables and fruit. The following tables display the number of respondents interested in purchasing each listed item.

Page 9 of 31
6: Interest in Vegetable Purchase
Fresh and Whole Vegetables
Interest in Purchasing Locally
Processed Vegetables
Interest in Purchasing Locally
Frozen Vegetables
Interested in Purchasing Locally
Num
ber
Percen
t
Num
ber
Percen
t
Num
ber
Percen
t
Cucumbers 12 57.1 Carrots 7 33.3 Beans, green 7 33.3 Tomatoes, cherry or grape 12 57.1 Salad greens 6 28.6 Corn 6 28.6
Peppers 8 38.1 Cabbage, Green or red 6 28.6 Broccoli 6 28.6
Potatoes 8 31.8 Spinach 5 23.8 Peas 5 23.8 Asparagus 8 31.8 Cauliflower 4 19.0 Asparagus 5 23.8 Lettuce 8 38.1 Lettuce 4 19.0 Cauliflower 5 23.8 Tomatoes, slicing 7 33.3 Sweet potatoes 4 19.0 Carrots 4 19.0 Carrots 7 33.3 Broccoli 4 19.0 Sweet potatoes 3 14.3
Onions 6 28.6 Herbs (basil, dill, etc.) 4 19.0 Onions 2 9.5
Sweet potatoes 6 28.6 Tomatoes, cherry or grape 3 14.3 Chard 2 9.5
Spinach 6 28.6 Potatoes 3 14.3 Edamame 1 4.8 Squash, winter 6 28.6 Tomatoes, slicing 2 9.5 Lettuce 1 4.8 Beans, green 5 23.8 Beans, green 2 9.5 Pumpkins 1 4.8 Cabbage, green or red 5 23.8 Onions 2 9.5 Potatoes 1 4.8
Cauliflower 5 23.8 Peppers 2 9.5 Spinach 1 4.8
Salad greens 5 23.8 Mushrooms 2 9.5 Greens, cooking (collards, kale, etc.) 1 4.8
Herbs (basil, dill, etc.) 5 23.8 Squash, winter 2 9.5 Brussel Sprouts 0 0
Radishes 5 23.8 Peas 2 9.5 Squash, winter 0 0 Broccoli 4 19.0 Corn 1 4.8 Peppers 0 0
Mushrooms 4 19.1 Greens, cooking (collards, kale, etc.) 1 4.8 Cucumbers 0 0
Corn 3 14.3 Radishes 1 4.8 Beets 0 0
Rutabaga 3 14.3 Brussel Sprouts 1 4.8 Cabbage, green or red 0 0
Peas 2 9.5 Pumpkins 1 4.8 Tomatoes, cherry or grape 0 0
Pumpkins 2 9.5 Asparagus 0 0 Mushrooms 0 0 Edamame 1 4.8 Cucumbers 0 0 Parsnips 0 0 Brussel Sprouts 1 4.8 Beets 0 0 Rutabaga 0 0 Beets 1 4.8 Eggplant 0 0 Tomatoes, slicing 0 0 Kohlrabi 1 4.8 Parsnips 0 0 Eggplant 0 0 Greens, cooking (collards, kale, etc.) 1 4.8 Edamame 0 0 Herbs
(basil, dill, etc.) 0 0
Chard 1 4.8 Kohlrabi 0 0 Kohlrabi 0 0 Parsnips 1 4.8 Chard 0 0 Radishes 0 0 Turnips 0 0 Turnips 0 0 Salad greens 0 0 Eggplant 0 0 Rutabaga 0 0 Turnips 0 0

Page 10 of 31
7: Interest in Fruit Purchase
Fresh and Whole Fruit
Interest in Purchasing Locally
Processed Fruit (chopped, sliced, shredded, etc.)
Interest in Purchasing Locally
Frozen Fruit Interest in Purchasing Locally
Num
ber
Percen
t
Num
ber
Percen
t
Num
ber
Percen
t
Apples 9 42.9 Apples 4 19.0 Strawberries 5 23.8 Strawberries 9 42.9 Cantaloupe 2 9.5 Blueberries 3 14.3 Watermelon 9 42.9 Cherries 1 4.8 Cherries 3 14.3 Peaches 9 42.9 Peaches 1 4.8 Peaches 2 9.5 Cantaloupe 8 38.1 Strawberries 1 4.8 Blackberries 2 9.5 Blueberries 8 38.1 Watermelon 1 4.8 Grapes 1 4.8 Cherries 7 33.3 Grapes 0 0 Apples 0 0 Blackberries 7 33.3 Blueberries 0 0 Plums 0 0 Raspberries 7 33.3 Raspberries 0 0 Cantaloupe 0 0 Plums 6 28.6 Rhubarb 0 0 Rhubarb 0 0 Rhubarb 4 19.0 Plums 0 0 Watermelon 0 0
It is apparent from these tables that there is substantially more interest in whole fresh fruits and vegetables (than frozen or processed) on the part of schools in the region. There is apparently more interest in processed vegetables than in frozen and just the opposite when considering fruit.
Respondents were provided with a list of possible motivators to serve locally grown or processed food in their school/district and each was asked to select the top three motivators for him/herself. The top motivators reported were an interest in supporting local farms, supporting the local economy and the quality of the food to be purchased. The most important barriers identified by the respondents proved to be the lack of availability of foods during the school year, food safety concerns and budget restrictions. Also of lesser concern were state and federal procurement policies, the lack of local producers, and the inconvenience of purchasing from local sources.
Respondents were provided with a list of possible logistical challenges to serve locally grown or processed food in their school/district and each was asked to select the top three logistical challenges motivators for him/herself. The most commonly noted challenges were the lack of a distribution method to get local food to the school, lack of labor to prepare the food and lack of the proper equipment to prepare the food.
A number of things are evident in this survey data. If it can be assumed that the roughly half of the schools surveyed that responded were those most interested in local foods, Gordon Food Service is by far the most important distributor in reaching those schools. Secondly the greatest interest is in “fresh whole” fruits and vegetables. This is consistent with comments from distributors that suggest that processing and freezing makes little sense until they are able to procure enough fresh produce to satisfy
Page 11 of 31
that market segment. Both high quality and food safety are important concerns to food service directors. They think they get a fresher, higher quality product with local produce but they are also concerned with food safety. Of course availability during the school year is a problem in serving this market.
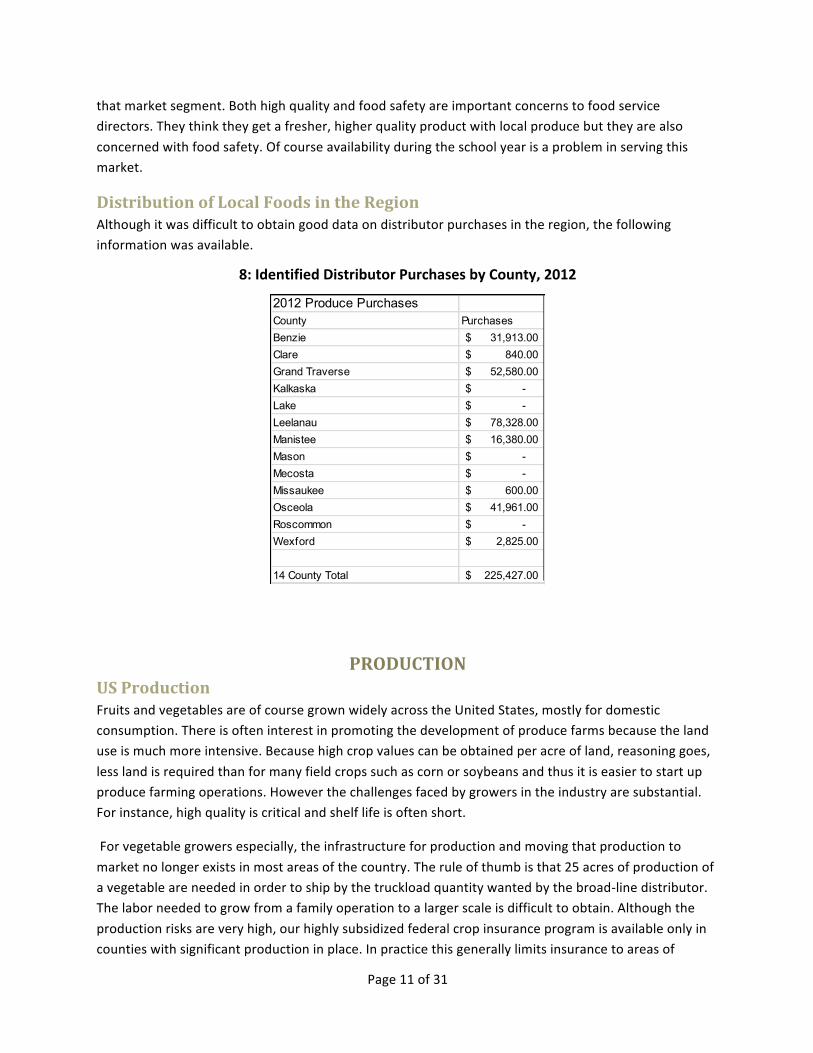
Distribution of Local Foods in the Region Although it was difficult to obtain good data on distributor purchases in the region, the following information was available.
8: Identified Distributor Purchases by County, 2012
PRODUCTION US Production Fruits and vegetables are of course grown widely across the United States, mostly for domestic consumption. There is often interest in promoting the development of produce farms because the land use is much more intensive. Because high crop values can be obtained per acre of land, reasoning goes, less land is required than for many field crops such as corn or soybeans and thus it is easier to start up produce farming operations. However the challenges faced by growers in the industry are substantial. For instance, high quality is critical and shelf life is often short.
For vegetable growers especially, the infrastructure for production and moving that production to market no longer exists in most areas of the country. The rule of thumb is that 25 acres of production of a vegetable are needed in order to ship by the truckload quantity wanted by the broad-‐line distributor. The labor needed to grow from a family operation to a larger scale is difficult to obtain. Although the production risks are very high, our highly subsidized federal crop insurance program is available only in counties with significant production in place. In practice this generally limits insurance to areas of
2012 Produce PurchasesCounty PurchasesBenzie 31,913.00$ Clare 840.00$ Grand Traverse 52,580.00$ Kalkaska -$ Lake -$ Leelanau 78,328.00$ Manistee 16,380.00$ Mason -$ Mecosta -$ Missaukee 600.00$ Osceola 41,961.00$ Roscommon -$ Wexford 2,825.00$
14 County Total 225,427.00$
Page 12 of 31
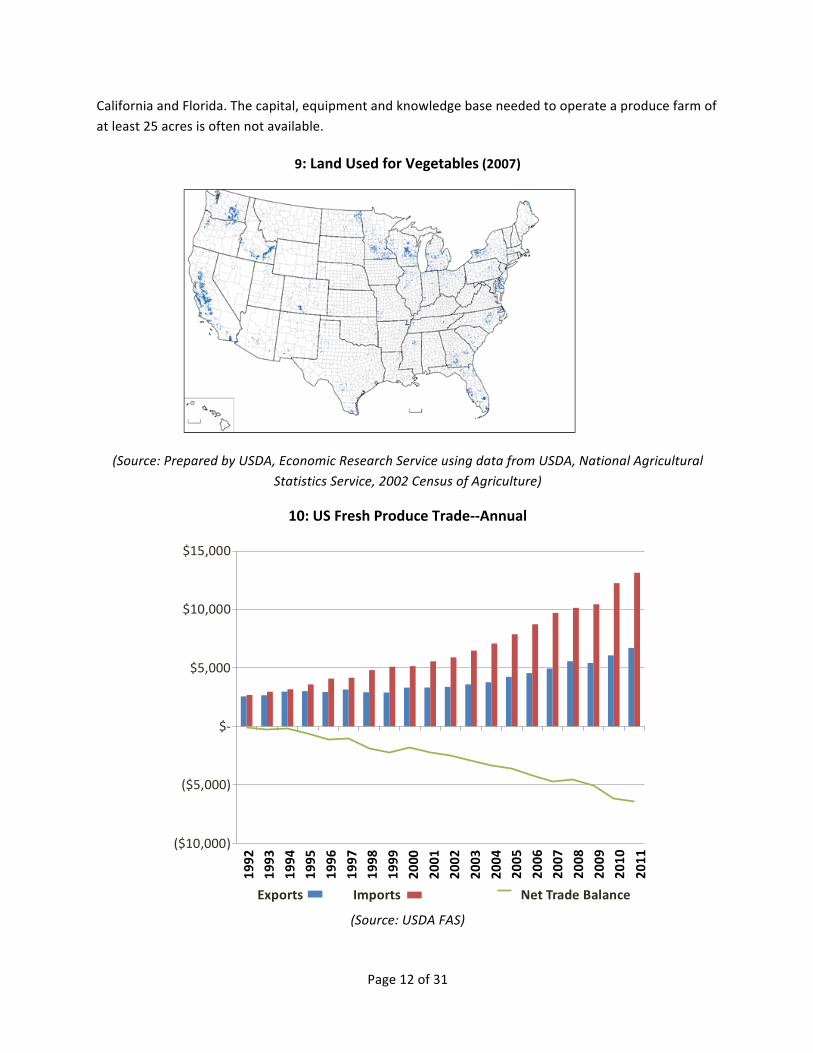
California and Florida. The capital, equipment and knowledge base needed to operate a produce farm of at least 25 acres is often not available.
9: Land Used for Vegetables (2007)
(Source: Prepared by USDA, Economic Research Service using data from USDA, National Agricultural Statistics Service, 2002 Census of Agriculture)
10: US Fresh Produce Trade-‐-‐Annual
(Source: USDA FAS)
Exports Imports Net Trade Balance
$15,000
$10,000
$5,000
$-‐
($5,000)
($10,000)

Page 13 of 31
11: Principal Vegetables Table
Principal vegetables, fresh market: Acres, production, and value, 2008-‐2012 1
Year Planted Harvested Production Value Acres Acres 1,000 cwt 1,000 dollars
2008 2009 2010 2011 2012
56,700 57,500 57,500 55,800 53,200
53,800 54,500 55,200 52,700 49,200
8,396 9,100 8,390 8,082 7,916
169,990 171,540 174,700 170,667 175,883
1 Includes dual purpose vegetables.
Principal vegetables, processing: Acres, production, and value, 2008-‐2012 1
Year Planted Harvested Production Value Acres Acres Tons 1,000 dollars
2008 2009 2 2010 2 2011 2 2012 2
52,700 53,500 50,300 51,800 51,300
51,600 52,400 49,300 50,700 50,000
413,350 386,280 372,810 334,520 348,680
69,240 77,936 75,288 71,201 68,123
1 Excludes dual purpose vegetables. 2 Processing carrots excluded to avoid disclosure of individual operations.
(Source: Michigan Agricultural Statistics, 2012-‐2013, USDA National Agricultural Statistics Service)
Fresh market vegetables included in this table include snap beans, cabbage, carrots, sweet corn, cucumbers, onions and tomatoes. Dual purpose vegetables include asparagus, celery, bell peppers, pumpkins and squash. As indicated by these numbers the “farm gate” average value for these common vegetables in 2012 was $3,574 per acre harvested. Averaging the value of Michigan fruit in the years 2010 and 2011 provides a value of $3,470 per acre.
Regional Production
Produce grown in the region The 2007 census of agriculture revealed that the 14 county region harvested 6,629 acres of vegetables other than potatoes in 2007. Using the average Michigan farm gate value of those vegetables of $1,916 per acre results in an approximate value of the region’s vegetable harvest at $12.7 million. In 2010 NASS estimated that 27,547 acres of fruit was harvested in the region for a value of $76.6 million. These numbers are low because of the NASS practice of withholding information when that information would compromise the confidentiality of any one farm. The Appendices contain the acres harvested and number of operations by fruit and vegetable item by county in the region.
Regional grower interest in a HUB In December 2012 a survey was conducted by the National Agricultural Statistics Service Michigan Field Office (NASS) for this feasibility study. Of the 656 farmers engaged in either fruit or vegetable farming in the 14 county region according to census data, 165 (25.2%) reported that they were either no longer farming or not farming either fruit of vegetables. Those farming one or the other crop and completing at
Page 14 of 31
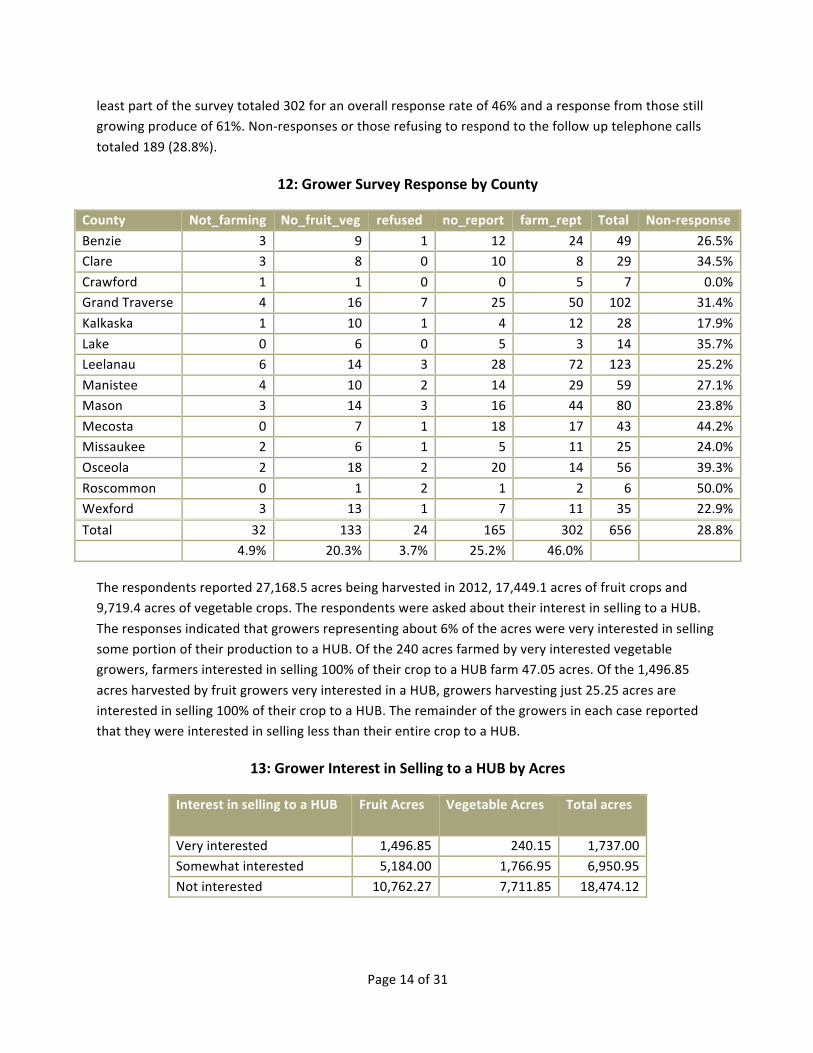
least part of the survey totaled 302 for an overall response rate of 46% and a response from those still growing produce of 61%. Non-‐responses or those refusing to respond to the follow up telephone calls totaled 189 (28.8%).
12: Grower Survey Response by County
County Not_farming No_fruit_veg refused no_report farm_rept Total Non-‐response Benzie 3 9 1 12 24 49 26.5% Clare 3 8 0 10 8 29 34.5% Crawford 1 1 0 0 5 7 0.0% Grand Traverse 4 16 7 25 50 102 31.4% Kalkaska 1 10 1 4 12 28 17.9% Lake 0 6 0 5 3 14 35.7% Leelanau 6 14 3 28 72 123 25.2% Manistee 4 10 2 14 29 59 27.1% Mason 3 14 3 16 44 80 23.8% Mecosta 0 7 1 18 17 43 44.2% Missaukee 2 6 1 5 11 25 24.0% Osceola 2 18 2 20 14 56 39.3% Roscommon 0 1 2 1 2 6 50.0% Wexford 3 13 1 7 11 35 22.9% Total 32 133 24 165 302 656 28.8%
4.9% 20.3% 3.7% 25.2% 46.0%
The respondents reported 27,168.5 acres being harvested in 2012, 17,449.1 acres of fruit crops and 9,719.4 acres of vegetable crops. The respondents were asked about their interest in selling to a HUB. The responses indicated that growers representing about 6% of the acres were very interested in selling some portion of their production to a HUB. Of the 240 acres farmed by very interested vegetable growers, farmers interested in selling 100% of their crop to a HUB farm 47.05 acres. Of the 1,496.85 acres harvested by fruit growers very interested in a HUB, growers harvesting just 25.25 acres are interested in selling 100% of their crop to a HUB. The remainder of the growers in each case reported that they were interested in selling less than their entire crop to a HUB.
13: Grower Interest in Selling to a HUB by Acres
Interest in selling to a HUB Fruit Acres Vegetable Acres Total acres
Very interested 1,496.85 240.15 1,737.00 Somewhat interested 5,184.00 1,766.95 6,950.95 Not interested 10,762.27 7,711.85 18,474.12

Page 15 of 31
14: Number and Size of Vegetables Growers Interested in Selling to a HUB
Vegetable Acres Farmed
Total Number of Farms of this
Size
Somewhat Interested in
Selling to a HUB
Not at all Interested in
Selling to a HUB
Very Interested in Selling to a
HUB
121 37 71 11 0.00 2 1 1 0.10 3 2 1 0.25 5 3 2 0.30 1 1 0.40 1 1 0.50 23 8 12 2 0.75 2 1 1 1.00 36 11 14 11 1.50 5 2 1 2 1.70 1 1 2.00 18 5 5 8 2.50 1 1 3.00 10 4 4 2 4.00 12 5 1 6 4.50 1 1 5.00 3 1 1 1 6.00 6 2 2 2 7.00 3 3 8.00 2 1 1
10.00 8 4 2 2 12.00 1 1 13.00 1 1 14.00 2 2 18.00 1 1 25.00 2 2 27.00 1 1 30.00 2 1 1 35.00 1 1 40.00 3 2 1 45.00 1 1 50.00 2 2 60.00 1 1 80.00 2 2 82.00 1 1 85.00 2 1 1
110.00 1 1

Page 16 of 31
112.00 1 1 168.00 1 1 177.00 1 1 200.00 1 1 370.00 1 1 400.00 1 1 465.00 1 1 500.00 1 1 640.00 1 1 750.00 1 1
4,500.00 1 1
The farms that report that they are very interested in selling to a HUB are clustered in size between 1 and 4 acres. In fact 70% of the farms of this size expressed some level of interest in doing business with a HUB while only 47% of farms over 25 acres had any interest. Farms between 1 and 4 acres are probably of a size where selling all of their production direct to the consumer is getting to be untenable while at the same time they are not large enough to sell to a processor, thus their interest in aggregation in order to find new market channels. When asked to comment on the concept of a food HUB for aggregation, the most common concern is about price/profitability with labor concerns being the second most common response. Many farms of this size are probably caught in the difficult position of wanting/needing retail prices for their production while at the same time having outgrown their ability to move all of that production at those prices. From the perspective of time and skills there is too much labor involved and too many hats to wear (i.e. marketing, selling, washing, culling, packaging etc.) for the operator. The NASS estimate for Michigan 2012 average farm gate value for the common vegetables is $3,574 per acre (see above).
The one Michigan example of a profitable for-‐profit aggregator/distributor for which sales and the number of suppliers are available is Walsma & Lyons. As discussed below this company reports $20 million in sales and only 15 Michigan suppliers. The company supplements its Michigan sources with off season suppliers out of state, although to a unknown extent. However, if all of their supply came from Michigan farms those farms would average about 370 acres each. This size is in stark contrast to the size of farms expressing interest in selling to a HUB in this survey. It also suggests that farms successful in selling into a wholesale channel are larger than those expressing interest in selling to a HUB in this survey.

Page 17 of 31
15: Growers Very Interested in Selling to a HUB by County
County Number of Vegetable Growers Acres Number of
Fruit Growers Acres
Benzie 0 0.00 1 4.00 Clare 2 2.50 1 0.25 Crawford 2 3.00 0 0.00 Grand Traverse 8 23.50 7 402.15 Kalkaska 2 2.00 2 2.00 Lake 1 1.00 0 0.00 Leelanau 9 38.30 11 877.75 Manistee 4 89.00 5 158.10 Mason 3 43.00 1 50.00 Mecosta 1 5.00 0 0.00 Missaukee 2 8.00 2 1.10 Osceola 3 8.75 0 0.00 Wexford 5 16.00 2 1.50 Total 42 240.05 32 1496.85
16: Growers Very Interested in Contracting with a HUB by County
County Number of Vegetable Growers Acres Number of
Fruit Growers Acres
Benzie 0 0.00 1 4.00 Clare 2 2.50 1 0.25 Crawford 2 3.00 0 0.00 Grand Traverse 4 14.00 4 307.75 Kalkaska 1 1.50 1 0.50 Lake 1 1.00 0 0.00 Leelanau 4 10.00 6 699.25 Manistee 1 0.10 2 6.10 Mason 2 3.00 1 50.00 Mecosta 1 5.00 0 0.00 Missaukee 2 5.00 2 8.00 Osceola 3 8.75 0 0.00 Wexford 3 14.00 1 1.00
Total 26 67.85 19 1076.85

Page 18 of 31
17: Growers Interest in Selling to a HUB and Their Capabilities
Growers with seasonal extension capability, packing facility or refrigerated trucking
Grower Interest in Selling to a HUB
Season Extend Pack Facility Refrig Truck # of
respondents Not at all Somewhat Very
yes yes yes 1 1 yes yes no 21 6 10 5 yes no yes 1 1 yes no no 40 11 15 14 no yes yes 3 1 2 no yes no 10 4 4 2 no no yes 4 1 3 no no no 218 121 67 27
Of those growers who are very interested in selling to a HUB, 4 are GAP certified and 5 are Michigan Safe Food certified. Of those only somewhat interested 11 are GAP certified and 7 are Michigan Safe Food Certified.
Preserving what is called the “cold chain” is critical to preserving high quality in the industry. There are various methods used to cool the product after harvest including hydro coolers and refrigeration, but removing the heat from the field and then maintaining that temperature until the product is in the hands of the consumer is critical to quality. Different products require different temperature ranges requiring that an aggregation facility have refrigeration capacity in three different ranges to handle a wide range of produce.
When growers were asked in the survey if they had refrigeration capacity, 40 of the fruit growers either who were either “very” or “somewhat” interested in selling to a HUB harvesting 2,922 acres reported that they had a combined 94,718 cubic feet of capacity. Of the vegetable growers 51 reporting the same level of interest farming 344 acres reported cooling capacity of 81,198 cubic feet. Many of these growers were producing both vegetables and fruit so the total cooling capacity is not the combination of these two numbers. In fact just 3 producers growing both fruits and vegetables reported a total of 52,000 cf of that cooling capacity.
When growers with interest in selling to a HUB were asked for any additional comments or concerns about a HUB, the most common concern was for price. Despite the description of a HUB that was provided some were interested in selling only if they could get a retail price. The second most common concern was the difficulty obtaining adequate farm labor.
Competitiveness of Regional Growers Transportation costs make up most of the margin between California farm gate prices and Midwest terminal or wholesale prices. A refrigerated shipment from the west costs about $6,000 or 15 cents per pound. Because this cost is the same for any produce, a grower in the

Page 19 of 31
Midwest has a greater competitive advantage with lower value produce. This is because the shipping cost is a greater portion of the wholesale value. The following table provides the portion of wholesale price attributable to the cost of transportation from California.
18: Transportation Cost from California as a Percentage of Wholesale Prices
(Source: AMS Trucking Rate Report, AMS Terminal Market Price Report)
2% 3% 5% 6% 8% 9%
11% 13% 13% 14% 14% 14% 14% 17% 19% 20%
30% 31% 35% 36%
40% 43% 48% 48%
0%
10%
20%
30%
40%
50%
60%
Blue
berries
Blackberrie
s
Green Pe
as
Strawbe
rries
Asparagus
Tomatoe
s
Spinach
Broccoli
Romaine
Lel
uce
Cauliflow
er
Green Leaf Lel
uce
Eggplant
Beans
Bell Pe
ppers
Summer Squ
ash
Hone
ydew
s
Winter S
quash
Carrots
Onion
s
Celery
Cucumbe
rs
Chinese Cabb
age
Watermellons
Cabb
age

Page 20 of 31
$s
19: Estimates of Profit with Average Yields
(Source: University of Wisconsin Madison-‐Extension, Iowa State University, North Carolina State University, University of California-‐Davis, University of California-‐Berkeley, and USDA ERS)
20: Labor Needs of Production
Labor Needs Hours Labor (25 Acres)
Full Time Equivalent (2,000 Hours Per Unit)
Part Time Equivalent (600 Hours Per Unit)
Winter Squash 2,921 2 5 Fresh Cucumbers 4,319 3 8 Leafy Greens 4,650 3 8 Broccoli 5,553 3 10 Cauliflower 5,731 3 10 Tomatoes 6,313 4 11 Eggplant 6,635 4 12 Bell Peppers 8,162 5 14 Labor Needs for Select Crops (25 acre production)
(Source: University of Wisconsin Madison-‐Extension, Iowa State University, North Carolina State University, University of California-‐Davis, University of California-‐Berkeley, USDA ERS)
Leafy Green
s
Summer Squ
ash
Garlic
Broccoli
Winter S
quash
Tomatoe
s
Eggplant
Snap
Beans
Cauliflow
er
Carrots
Fresh Cu
cumbe
rs
Strawbe
rries
Celery
Bell Pe
ppers
Aspa
ragus
Corn
Soybeans
$14,000
$12,000
$10,000
$8,000
$6,000
$4,000
$2,000
$0

Page 21 of 31
21: Breakeven Cost of Production with Average Labor Costs and Varying Yields
Low Yield, $/Lb. Average Yield, $/Lb. High Yield, $/Lb. Average Chicago Wholesale (In Season) Price, $/lb
(Sources: University of Wisconsin Madison-‐Ext., Iowa State University, North Carolina State University, University of California-‐Davis, University of California-‐Berkeley, USDA ERS) Reprinted from the Local Food
Prospectus for the Tri-‐State Region
As we have seen, the local food system in the region is typified by small producers that focus on retail market channels. The “buy local” movement has provided additional market opportunities for local growers as well as potentially premium prices. However, local growers are failing to take advantage of their market opportunity by failing to gain access to the traditional distribution system where the vast majority of produce is moved to market. The industry faces significant challenges to exploiting these market opportunities. Although the cost of shipping produce from the west coast is easily apparent, the inefficiencies of the typical “local food” distribution system can be just as great. Food produced in relatively small amounts in scattered locations is expensive to accumulate. It is also difficult to manage such things as quality and production schedules among many independent operators. Traditional broad-‐line
distributors are accustomed to handling truck load shipments from the west coast. It has been
The authors of the study “Local Food Prospectus for the Tri-‐State Region” (an analysis of the prospects of increasing local produce production in the Wisconsin/Illinois/Iowa/region) looked in some detail at the efficiencies of the current national and increasingly international food distribution system as compared to the common “local” food system in this country. It was their finding that the inefficiencies of moving 200 pounds of local food 20 miles are equivalent to moving 30,000 pounds 3000 miles.
$2.00
$1.80
$1.60
$1.40
$1.20
$1.00
$0.80
$0.60
$0.40
$0.20
$0.00

Page 22 of 31
estimated that for many produce items it requires 25 acres of production to provide that level of volume. Getting than 25 acres from a number of sources increases the logistical challenge faced by the local food system.
22: In Season Midwest Balance of Trade of Selected Crops
(Source: USDA AMS and USDA ERS)
Table 22 shows the fresh market crops that are in shortage in the Midwest during the seasonal production periods. There is a stark correlation between produce that is in shortage and wholesale price changes since 2003. Crops in shortage have had an average price increase of 46% from 2003 to 2012 compared to 17% for crops produced region-‐ ally.17 The vast majority of this difference is attributable to rising transportation costs for refrigerated long-‐haul freight.
Researchers at Ohio State published a report in 2011 (Scaling-‐up: Connections between Regional Ohio Specialty Crop Producers and Local Markets: Distribution as the Missing Link, August 1, 2011, Jill K. Clark, Shoshanah Inwood, Jeff S. Shar, The Ohio State University) that was the product of substantial surveys of both retailers and distributors in the State. Their findings are probably instructive for neighboring Midwest States such as Michigan.
Their retailer surveys revealed the following:
• As retailers grow in size, distribution becomes increasingly formalized and vertically integrated. As a result, the opportunities for small and medium-‐sized Ohio farmers to service large-‐scale retailers are reduced.

Page 23 of 31
• The regional and national chains we interviewed have longstanding direct relationships with larger farms, grower-‐ shippers, and co-‐ops, able to supply the quantity and quality products desired.
• Among the retailers we interviewed who were committed to purchasing from local growers and supporting the local community, the challenge of purchasing from multiple farmers and managing too many vendor accounts is a potential limitation and frustration.
• Retailers emphasized the desire to have a relationship and know the farmers they are purchasing from, but have a consistent and efficient ordering and distribution system.
• While food safety is a concern for all retailers, the larger retailers seek formalized certifications, especially those purchasing from large-‐scale farmers or companies not in close proximity. The greater physical and social distance from the actual producers creates the need for extra security, often achieved via third-‐party certification.
• Many of the retailers interviewed are slowly embracing the trend of identity preservation of local produce by not only marketing “local” but also creating signage that identifies the specific farm on which the food was grown.
The distributor survey completed as part of that study revealed the following:
• Thirty-‐nine fruit and vegetable distributors responded to the survey. These distributors represent 219 distribution facilities in Ohio and employ 753 full-‐time and 37,620 part-‐time workers.
• Many of the distributor respondents are distributing more than just fruits and vegetables, often carrying dairy and eggs.
• Almost all respondents are supplying produce to supermarkets that focus on general line food, followed by convenience or corner stores and greenmarket or specialty produce stores. Only about a quarter of surveyed distributors are supplying discount supermarkets and supercenters, superstores, and warehouse clubs, which follows the dominant model where these types of stores rely on their own distribution capacity.
• The majority of all surveyed distributors agreed that their transportation costs are lowered by using Ohio produce.
• All respondents reported similar requirements for food safety, traceability, and inventory management.
• Many of the surveyed distributors are interested in partnering with growers and agencies to develop infrastructure that would increase the flow of Ohio-‐grown produce.
• Creating relationships of trust between distributors and producers is key to expanding market opportunities for Ohio-‐grown fruits and vegetables.
• All large distributors surveyed require third-‐party food safety certification. Certification requirements were more variable with other sized distributors.
• To a small degree, desire to source produce from a central aggregation center declined with firm size, although the majority of all distributors, no matter what type, were interested.
• Motivations for purchasing Ohio produce varied by the size of distributor.

Page 24 of 31
• Large distributors reported a desire to purchase Ohio because they feel their customers care that produce is raised in Ohio. Yet these same distributors were less likely themselves to believe Ohio produce is inherently a better product.
• The rest of distributors believe that Ohio produce is fresher in season. Furthermore, they are more committed to purchasing Ohio produce.
• Distributors indicated they do not use farmer directories to source new products.
SAFETY ISSUES There are three standards that are important in the industry, they are “Good Agricultural Practices referred to as GAP”, “Current Good Manufacturing Practices or CGMP” and a “Hazard Analysis and Critical Control Point (HACCP)” system. The GAP standards establish good practices for growers while the CGMPs establish practices for processors who manufacture, process, pack, or hold processed food. HAACP is a “prevention-‐based food safety system designed to prevent, reduce to acceptable levels, or eliminate the microbial, chemical, and physical hazards associated with food production. One strength of HACCP is its proactive approach to prevent food contamination rather than trying to identify and control contamination after it has occurred.” (Guide to Minimize Microbial Food Safety Hazards of Fresh-‐cut Fruits and Vegetables, Feb 25, 2008, FDA)
The Food and Drug Administration has published a document entitled a “Guide to Minimize Microbial Food Safety Hazards of Fresh-‐cut Fruits and Vegetables”. The guide distinguishes between “whole fresh” or raw agricultural commodities (RAC) and “fresh cut” in how it advises the industry on HAACP/CGMP
The FDA defines whole fresh as ‘fresh produce that is likely to be sold to consumers in an unprocessed (i.e., raw) form. Fresh produce may be intact, such as whole strawberries, carrots, radishes, or tomatoes, or cut from roots or stems during harvesting, such as celery, broccoli, lettuce, or cauliflower.”
It defines fresh-‐cut fruits and vegetables as having “been minimally processed (e.g., no lethal kill step), and altered in form, by peeling, slicing, chopping, shredding, coring, or trimming, with or without washing or other treatment, prior to being packaged for use by the consumer or a retail establishment.” A raw agricultural commodity (RAC) on the other hand is defined as a “fresh produce that is likely to be sold to consumers in an unprocessed (i.e., raw) form. Fresh produce may be intact, such as whole strawberries, carrots, radishes, or tomatoes, or cut from roots or stems during harvesting, such as celery, broccoli, lettuce, or cauliflower.”
Fresh cut produce must follow the requirements of CGMP as stipulated by the FDA while a RAC does not. The HAACP process is encouraged by the FDA and is becoming a standard practice in the industry. The HAACP process is more prevention oriented than the CGMP and is designed to reduce to acceptable levels, or eliminate the microbial, chemical, and physical hazards associated with food production.
Thus a produce aggregation facility need not legally comply with either CGMP or HAACP protocol to the extent that it only handles fresh whole produce or raw agricultural commodities. The local distributor on which the facility might rely for most of its distribution handles only fresh whole at this time. However

Page 25 of 31
that distributor is currently third party certified for its CGMP compliance (it’s more aggressive “eat local” customers require certification, especially in the health care industry) and would expect any aggregator to be thus certified and to use HAACP procedures to safeguard its operations. In the event that the aggregation facility were to supply a broad line distributor such as Sysco third party CGMP certification would be required.
In January the FDA published proposed new rules to update the 1986 rules for Current Good Manufacturing Practices, regulations regarding the manufacturing, processing, packing, or holding of food for human consumption. For the first time these proposed rules would require a HACCP like plan for facilities required to register as a food facility under the Food Safety Modernization Act (FSMA). Facilities would have to have a food safety plan prepared by a qualified individual, the facility would have to perform a hazard analysis and institute preventive controls for the mitigation of hazards. Facilities would have to monitor those controls and maintain documentation to demonstrate that the controls are effective and to record corrective actions. The application of preventive controls would be required only in instances where the facility determines that hazards are likely to occur.
The proposed rule includes exemptions that could, if adopted, exempt a start-‐up food HUB.
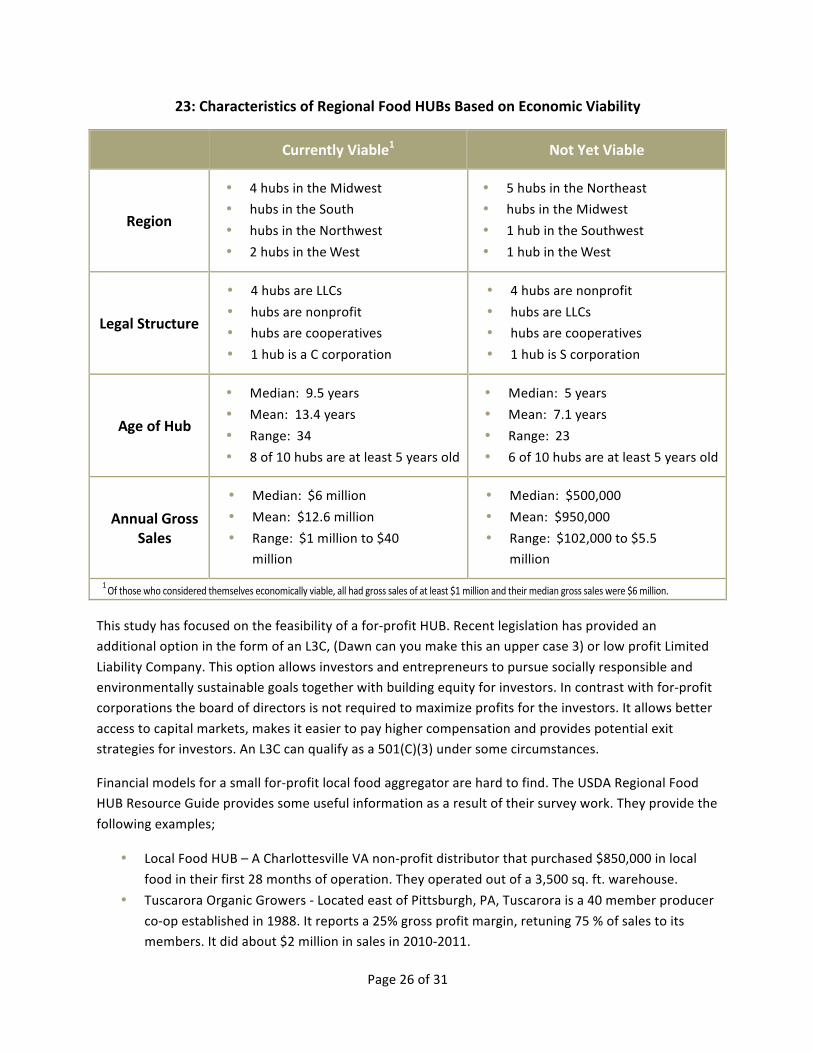
ECONOMIC VIABILITY In 2011, the USDA Agricultural Marketing Service completed telephone interviews of 20 more mature established Food HUBs (diverse in organizational structure and geographical location) in the preparation of their Regional Food HUB Resource Guide. Of the 20 interviewed, 10 identified themselves loosely as economically viable, that is, revenue generated from sales covered costs associated with aggregating, distributing and marketing or were on track to cover those costs (it should be recognized that such a definition is fairly subjective and that even these 10 may not be close to true profitability). The following figure compares those who describe themselves as viable and those who were not. Predictably the significant differentiating factors were longevity and the level of gross sales.
Page 26 of 31
23: Characteristics of Regional Food HUBs Based on Economic Viability
Currently Viable1 Not Yet Viable
Region
• 4 hubs in the Midwest • hubs in the South • hubs in the Northwest • 2 hubs in the West
• 5 hubs in the Northeast • hubs in the Midwest • 1 hub in the Southwest • 1 hub in the West
Legal Structure
• 4 hubs are LLCs • hubs are nonprofit • hubs are cooperatives • 1 hub is a C corporation
• 4 hubs are nonprofit • hubs are LLCs • hubs are cooperatives • 1 hub is S corporation
Age of Hub
• Median: 9.5 years • Mean: 13.4 years • Range: 34 • 8 of 10 hubs are at least 5 years old
• Median: 5 years • Mean: 7.1 years • Range: 23 • 6 of 10 hubs are at least 5 years old
Annual Gross Sales
• Median: $6 million • Mean: $12.6 million • Range: $1 million to $40
million
• Median: $500,000 • Mean: $950,000 • Range: $102,000 to $5.5
million
1 Of those who considered themselves economically viable, all had gross sales of at least $1 million and their median gross sales were $6 million.
This study has focused on the feasibility of a for-‐profit HUB. Recent legislation has provided an additional option in the form of an L3C, (Dawn can you make this an upper case 3) or low profit Limited Liability Company. This option allows investors and entrepreneurs to pursue socially responsible and environmentally sustainable goals together with building equity for investors. In contrast with for-‐profit corporations the board of directors is not required to maximize profits for the investors. It allows better access to capital markets, makes it easier to pay higher compensation and provides potential exit strategies for investors. An L3C can qualify as a 501(C)(3) under some circumstances.
Financial models for a small for-‐profit local food aggregator are hard to find. The USDA Regional Food HUB Resource Guide provides some useful information as a result of their survey work. They provide the following examples;
• Local Food HUB – A Charlottesville VA non-‐profit distributor that purchased $850,000 in local food in their first 28 months of operation. They operated out of a 3,500 sq. ft. warehouse.
• Tuscarora Organic Growers -‐ Located east of Pittsburgh, PA, Tuscarora is a 40 member producer co-‐op established in 1988. It reports a 25% gross profit margin, retuning 75 % of sales to its members. It did about $2 million in sales in 2010-‐2011.

Page 27 of 31
• Intervale – A Burlington VT non-‐profit, the distributor/CSA works with 22 farmers with gross sales in 2010 of $300,000. It reported a 15% gross profit margin on its distribution sales, returning 85% of sales to its growers.
• Walsma & Lyons – A for-‐profit fresh produce aggregator/distributor located in the Grand Rapids area, they are privately held. Established in 1979 they report $20 million in sales. They sell to broad-‐line distributors as well as major retailers in the Great Lakes Region. They supplement their long term relationships with 15 growers with off season produce from southern and western states. They repack to provide smaller orders for institutional food service customers, preserve regional identity and provide their growers with liability insurance coverage. They assure their growers meet GAP standards.
While in practice the revenues of a NW Michigan food HUB would be divided between produce purchased from the farm and produce cross docked, that is produce that would continue to be owned by the farmer but on which the HUB would earn a commission for its collection, storage, and distribution or delivery to another distributor. Produced packed on the farm would be purchased outright from the grower. Produce packed by the HUB would be “on consignment” and the HUB would earn a packing fee and commission when it is sold. Currently the produce that moves to distributors is generally packed on the farm given the lack of available packing facilities in the region.
Identified purchases by distributors from growers in the region in 2012 were in excess of $225,000. Theoretically a HUB engaged in aggregation/packing only and not distribution could capture those sales by agreement with distributors. In addition an aggregator engaged in packing activities could grow this volume by providing the following services for growers not currently available:
• Grading, washing, chopping, etc. • Separation of produce into grades appropriate for specific markets (for example produce not
appropriate for retail shelves (with cosmetic imperfections) can be used by food service operations as “ingredients”
• Repacking into delivery sizes appropriate for individual customers (many food service customers cannot utilize a full case at one time)
• At the point at which the fresh retail market is satisfied individual quick freeze technology could be engaged
There are not many examples of for-‐profit aggregator/distributors in the marketplace. Those that have demonstrated an ability to survive long term have, like the example of Walsma & Lyons above, done so through substantial volume. None of them in the USDA Agricultural Marketing service survey results described above had sales of under $1 million with median sales of $6 million. The volumes of produce entering the wholesale distribution market in the 14 county region appear to be substantially below this threshold at this time.
The region’s distributor specializing in local foods, Cherry Capital Foods, regards itself as a matchmaker and not an aggregator. They would like to see the development of an aggregator in the region because they believe one could make more local food available for distribution. As the financial analysis included

Page 28 of 31
below suggests a good deal more local produce would have to be grown inI the region to make aggregation feasible unless it was highly subsidized.
Most of the examples of for-‐profit aggregators in the marketplace would also suggest that that substantial increase in produce production would need to be concentrated geographically and in a relatively small number of farms in order to control transportation costs.
The Marketing Services Division of the Agricultural Marketing Service, USDA, published a paper in March of 2012 (Moving Food Along the Value Chain: Innovations in Regional Food Distribution) of the results of a series of case studies they wrote looking at various food HUB initiatives. The HUBs they looked at represented a range of organizations driven by both retail and producer interests. They included eight non-‐profits and co-‐op business models. Although no for-‐profit organizations were included in the paper, there appear to be a number of lessons learned from these case studies that are instructive to this present analysis. They include:
• Informal networks of farmers can be effective in meeting the needs of both growers and the marketplace. Farmers can benefit from being part of a network that does not require them to sell all of their production into one market channel, i.e. the food HUB aggregator/distributor. The HUB can be more flexible in meeting the needs of its market if it is not committed to purchase all of their member’s production, especially when a wide variety of products are being traded..
• Non-‐profits especially have tended to make heavy and inappropriate investments in infrastructure. As a result a number of these distributors have had to convert their operations to facilitation of trading activity rather than physically operating warehouses and trucking fleets.
• The New North Florida Cooperative which associates itself strongly with small farmers has demonstrated that a HUB need not necessarily engage in a high level of specific farmer identification.
Sysco and Cherry Capital Foods have voiced a desire to work with an aggregator in the region. In the case of Sysco, they require GAP certification on the part of the farmer or at least the prospective of certification within a year’s time. Those distributors foresee a growing market for local foods and want to develop the supply chain to meet that demand. The disconnect comes in the current market place where:
• Most customers are not willing to pay a premium for local produce • The local food infrastructure is generally inefficient and thus costly • The local farm business model is largely not oriented to wholesale production • A local farm business model designed to compete in the international produce market is not
likely to be developed until the infrastructure is developed to serve them. This infrastructure would include such things as a labor force, crop insurance, investment capital, the experience and skills base needed to operate the necessary farm business model, a regulatory climate that makes relatively small farms cost effective, and of course aggregation and distribution.

Page 29 of 31
The development of this infrastructure is likely to be slow in developing given that both the growers and the infrastructure to support those growers will have to be developed simultaneously. Apparently the market side of the equation seems to be out in front of the development of the supply side.
The feasibility of a food HUB in the region begs the question of what a pro forma profit and loss statement might look like given the current circumstances identified in this report. Although such a P&L is largely conjecture at this point without a specific business plan, some inputs are known or can be reasonably estimated. The best available financial survey information comes from a survey of 15 HUBs across the country recently made available by the National Good Food Network (NGFN). The National Good Food Network Food Hub Benchmarking Study team included the Farm Credit Council, Farm Credit East, Morse Marketing Connections, and the Wallace Center at Winrock International.
Although it is the most useful data available, the survey has some obvious weakness for the purposes of this study. It was of a small sample size of both for-‐profit and non-‐profit HUBs. These organizations survey had the following characteristics:
• The average age of the HUBs was 11 years • They operated an average of 301 days a year • Their average revenues were $1.65 million • Average facility size was 9,018 sq. ft. • Twenty percent were strictly organic • Seventy three percent took ownership of the product they handled • They were about evenly divided between for-‐profit and non-‐profit companies • Their average food shed was 521 miles and they traveled an average of 54,000 miles a year for
pick-‐ups and deliveries • They had little in-‐house processing or value added sales • Thirty three percent of their vendors had some sort of third party food safety certification • They were primarily distributors while a smaller portion reported that they also aggregated • Their 10 largest vendors supplied 50% of their product • Product mix included meat and dairy as well as produce • All reported using some volunteer labor
In short, these HUBs look a lot like the existing regional distributor identified in this report. They do not look like the aggregator envisioned in this report whose costs will be greater for in house packing activities. While these shortcomings are recognized, the financial metrics identified in the NGFN network were used for a proforma breakeven P&L.
They financial metrics gathered in that survey included the following:
• Their gross margins averaged 21.3% for a mark-‐up multiple of 1.24%, fairly good numbers for a distribution business
• Overhead averaged 24.3 % of sales, a comparatively high number • Labor averaged 17.4% of sales and sales per FTE averaged $286,788

Page 30 of 31
In the development of a projected break-‐even P&L the following assumptions were used;
• Breakeven sales were estimated just over $700,000. This is substantially more than the current sales of regional produce identified as being moved through distributors
• A facility in the neighborhood of 5,000 sq. ft. would be needed • The assumption is made that a turnkey facility can be leased. No interest or amortization are
included.
24:Proforma Operating Statement
Sales 718,000 718,000 Cost of Goods 488,240 Cost of Sales Pick-‐up/Delivery Vehicle Cost 12,926
Warehouse/Packing Labor 2FTE @ $11 22,440 Collection 2 FTE @ $13 26,520 Fringe Benefits 5,385 Supplies 9,700 Other 2,000 Total Cost of Sales 78,971 Total Direct Costs 567,211 Gross Margin 150,79 Indirect Costs Manager/Sales $20/1530 hours 30,600 Office/IT $15/1020 hours 15,300 Fringe Benefits 5,049 Lease 17,496 Utilities 67,500 Office Supplies 104 Insurance 2,400 Shrinkage at 2% 12,340 Total Indirect Cost 150,789 150,789 Profit/Loss 0
CONCLUSIONS The financial model used in the table above would suggest that annual sales of at least $.7 million would be needed to break even (this is probably a very conservative estimate). Data collected as part of this study indicate that a volume of less than $250,000 is currently being purchased by distributors in the region. This breakeven would require about 250 acres harvested for the HUB if a HUB were supplied

Page 31 of 31
solely from the region’s growers. This 250 acres would also be about 15% of the acres harvested by growers identified as “very interested” in selling to a HUB. For the most part these growers are now selling into the retail market and are probably not prepared to sell to a HUB. Furthermore these growers are not generally GAP certified, which would be required for sales to grow significantly beyond current levels.
Schools are a good market but limited due to the school year and price sensitivity. It would appear that most school purchases of local foods occurs through the broad line distributors, a market channel that requires GAP certification.
Hospitals are probably less price sensitive than schools but are still reluctant to buy local due to food safety among other issues. In most cases hospitals that so buy local only serve that food in their cafeterias.
A produce aggregation HUB selling only local produce cannot be operated profitably in the region under current conditions. Substantially more produce will have to be grown or a much wider produce supply shed will have to be used. A wider produce supply shed will work to defeat the economics of a HUB because it will increase either its operating costs or the transportation costs of its grower suppliers.
A HUB that procures its produce outside the region during the off season to become a year round supplier could improve the economics of its operation. However one would question whether Northern Michigan would be a reasonable location for such an operation because of distance from broad line distribution centers. A southern Michigan location might prove to be a more advantageous location for a year round operation. A seasonal operation as a satellite facility of one of the established houses, i.e. Wilsma and Lyons, might make sense. Such an operation could be used to funnel northern Michigan local foods into the larger market. It could also control some of its costs by sharing such things as sales, software and management with a larger operation.
The collective acreage volume, skill, equipment, investment and business model will have to be assembled to allow growers to prosper in a wholesale market.

Page 1 of 13
Appendix A
Vegetable Acres Harvested and Operations County Data Item Value
for County
Total for Category
All Counties
KALKASKA ASPARAGUS -‐ ACRES HARVESTED (D) MANISTEE ASPARAGUS -‐ ACRES HARVESTED 175 LAKE ASPARAGUS -‐ ACRES HARVESTED (D) MECOSTA ASPARAGUS -‐ ACRES HARVESTED (D) BENZIE ASPARAGUS -‐ ACRES HARVESTED (D) MASON ASPARAGUS -‐ ACRES HARVESTED 1,714 1889 MASON ASPARAGUS -‐ OPERATIONS WITH AREA HARVESTED 32 MECOSTA ASPARAGUS -‐ OPERATIONS WITH AREA HARVESTED 3 BENZIE ASPARAGUS -‐ OPERATIONS WITH AREA HARVESTED 3 KALKASKA ASPARAGUS -‐ OPERATIONS WITH AREA HARVESTED 1 OSCEOLA ASPARAGUS -‐ OPERATIONS WITH AREA HARVESTED 1 LAKE ASPARAGUS -‐ OPERATIONS WITH AREA HARVESTED 1 41 MECOSTA BEANS, GREEN, LIMA -‐ ACRES HARVESTED (D) MECOSTA BEANS, GREEN, LIMA -‐ OPERATIONS WITH AREA
HARVESTED 2 2
GRAND TRAVERSE BEANS, SNAP -‐ ACRES HARVESTED 776 CLARE BEANS, SNAP -‐ ACRES HARVESTED (Z) OSCEOLA BEANS, SNAP -‐ ACRES HARVESTED (D) KALKASKA BEANS, SNAP -‐ ACRES HARVESTED (D) BENZIE BEANS, SNAP -‐ ACRES HARVESTED (Z) MECOSTA BEANS, SNAP -‐ ACRES HARVESTED 2 MISSAUKEE BEANS, SNAP -‐ ACRES HARVESTED 344 ROSCOMMON BEANS, SNAP -‐ ACRES HARVESTED (D) MANISTEE BEANS, SNAP -‐ ACRES HARVESTED 3 WEXFORD BEANS, SNAP -‐ ACRES HARVESTED 1 LEELANAU BEANS, SNAP -‐ ACRES HARVESTED 1 MASON BEANS, SNAP -‐ ACRES HARVESTED 1,688 2815 MASON BEANS, SNAP -‐ OPERATIONS WITH AREA HARVESTED 19 LEELANAU BEANS, SNAP -‐ OPERATIONS WITH AREA HARVESTED 9 MISSAUKEE BEANS, SNAP -‐ OPERATIONS WITH AREA HARVESTED 5 BENZIE BEANS, SNAP -‐ OPERATIONS WITH AREA HARVESTED 3 OSCEOLA BEANS, SNAP -‐ OPERATIONS WITH AREA HARVESTED 8 GRAND TRAVERSE BEANS, SNAP -‐ OPERATIONS WITH AREA HARVESTED 15

Page 2 of 13
MECOSTA BEANS, SNAP -‐ OPERATIONS WITH AREA HARVESTED 14 CLARE BEANS, SNAP -‐ OPERATIONS WITH AREA HARVESTED 3 KALKASKA BEANS, SNAP -‐ OPERATIONS WITH AREA HARVESTED 8 ROSCOMMON BEANS, SNAP -‐ OPERATIONS WITH AREA HARVESTED 2 MANISTEE BEANS, SNAP -‐ OPERATIONS WITH AREA HARVESTED 7 WEXFORD BEANS, SNAP -‐ OPERATIONS WITH AREA HARVESTED 9 102 WEXFORD BEETS -‐ ACRES HARVESTED (D) CLARE BEETS -‐ ACRES HARVESTED (D) MANISTEE BEETS -‐ ACRES HARVESTED (Z) MECOSTA BEETS -‐ ACRES HARVESTED 2 LEELANAU BEETS -‐ ACRES HARVESTED 1 3 LEELANAU BEETS -‐ OPERATIONS WITH AREA HARVESTED 5 MANISTEE BEETS -‐ OPERATIONS WITH AREA HARVESTED 3 WEXFORD BEETS -‐ OPERATIONS WITH AREA HARVESTED 2 CLARE BEETS -‐ OPERATIONS WITH AREA HARVESTED 1 MECOSTA BEETS -‐ OPERATIONS WITH AREA HARVESTED 10 21 MANISTEE BROCCOLI -‐ ACRES HARVESTED 1 ROSCOMMON BROCCOLI -‐ ACRES HARVESTED (D) MISSAUKEE BROCCOLI -‐ ACRES HARVESTED (D) GRAND TRAVERSE BROCCOLI -‐ ACRES HARVESTED (D) MECOSTA BROCCOLI -‐ ACRES HARVESTED (D) WEXFORD BROCCOLI -‐ ACRES HARVESTED (D) MANISTEE BROCCOLI -‐ ACRES HARVESTED 1 MISSAUKEE BROCCOLI -‐ ACRES HARVESTED (D) LEELANAU BROCCOLI -‐ ACRES HARVESTED 1 2 LEELANAU BROCCOLI -‐ OPERATIONS WITH AREA HARVESTED 5 MANISTEE BROCCOLI -‐ OPERATIONS WITH AREA HARVESTED 5 WEXFORD BROCCOLI -‐ OPERATIONS WITH AREA HARVESTED 1 MISSAUKEE BROCCOLI -‐ OPERATIONS WITH AREA HARVESTED 1 GRAND TRAVERSE BROCCOLI -‐ OPERATIONS WITH AREA HARVESTED 2 14 KALKASKA BRUSSELS SPROUTS -‐ ACRES HARVESTED (D) LEELANAU BRUSSELS SPROUTS -‐ ACRES HARVESTED (D) LEELANAU BRUSSELS SPROUTS -‐ OPERATIONS WITH AREA HARVESTED 1 KALKASKA BRUSSELS SPROUTS -‐ OPERATIONS WITH AREA HARVESTED 2 3 LEELANAU CABBAGE, CHINESE -‐ ACRES HARVESTED (D) LEELANAU CABBAGE, CHINESE -‐ OPERATIONS WITH AREA HARVESTED 1 1 MISSAUKEE CABBAGE, HEAD -‐ ACRES HARVESTED (D) MANISTEE CABBAGE, HEAD -‐ ACRES HARVESTED (D) BENZIE CABBAGE, HEAD -‐ ACRES HARVESTED (Z) KALKASKA CABBAGE, HEAD -‐ ACRES HARVESTED (D)

Page 3 of 13
LEELANAU CABBAGE, HEAD -‐ ACRES HARVESTED (Z) MASON CABBAGE, HEAD -‐ ACRES HARVESTED 6 6 MASON CABBAGE, HEAD -‐ OPERATIONS WITH AREA HARVESTED 3 LEELANAU CABBAGE, HEAD -‐ OPERATIONS WITH AREA HARVESTED 3 BENZIE CABBAGE, HEAD -‐ OPERATIONS WITH AREA HARVESTED 3 MISSAUKEE CABBAGE, HEAD -‐ OPERATIONS WITH AREA HARVESTED 1 MANISTEE CABBAGE, HEAD -‐ OPERATIONS WITH AREA HARVESTED 1 KALKASKA CABBAGE, HEAD -‐ OPERATIONS WITH AREA HARVESTED 1 12 KALKASKA CARROTS -‐ ACRES HARVESTED (D) WEXFORD CARROTS -‐ ACRES HARVESTED 1 MANISTEE CARROTS -‐ ACRES HARVESTED 1 GRAND TRAVERSE CARROTS -‐ ACRES HARVESTED (D) MISSAUKEE CARROTS -‐ ACRES HARVESTED (Z) LEELANAU CARROTS, ACRES HARVESTED 1 MASON CARROTS -‐ ACRES HARVESTED 194 197 LEELANAU CARROTS, OPERATIONS WITH AREA HARVESTED 5 LEELANAU CARROTS, OPERATIONS WITH AREA HARVESTED 5 MASON CARROTS -‐ OPERATIONS WITH AREA HARVESTED 3 MANISTEE CARROTS -‐ OPERATIONS WITH AREA HARVESTED 3 MISSAUKEE CARROTS -‐ OPERATIONS WITH AREA HARVESTED 3 KALKASKA CARROTS -‐ OPERATIONS WITH AREA HARVESTED 2 WEXFORD CARROTS -‐ OPERATIONS WITH AREA HARVESTED 3 GRAND TRAVERSE CARROTS -‐ OPERATIONS WITH AREA HARVESTED 2 26 MANISTEE CAULIFLOWER -‐ ACRES HARVESTED (D) MISSAUKEE CAULIFLOWER -‐ ACRES HARVESTED (D) LEELANAU CAULIFLOWER -‐ ACRES HARVESTED (D) LEELANAU CAULIFLOWER -‐ OPERATIONS WITH AREA HARVESTED 1 MANISTEE CAULIFLOWER -‐ OPERATIONS WITH AREA HARVESTED 1 MISSAUKEE CAULIFLOWER -‐ OPERATIONS WITH AREA HARVESTED 1 3 LEELANAU CELERY -‐ ACRES HARVESTED (D) LEELANAU CELERY -‐ OPERATIONS WITH AREA HARVESTED 1 1 MANISTEE CUCUMBERS -‐ ACRES HARVESTED 189 MISSAUKEE CUCUMBERS -‐ ACRES HARVESTED (D) KALKASKA CUCUMBERS -‐ ACRES HARVESTED 1 WEXFORD CUCUMBERS -‐ ACRES HARVESTED 1 GRAND TRAVERSE CUCUMBERS -‐ ACRES HARVESTED 1 BENZIE CUCUMBERS -‐ ACRES HARVESTED 1 LEELANAU CUCUMBERS -‐ ACRES HARVESTED 1 194 LEELANAU CUCUMBERS -‐ OPERATIONS WITH AREA HARVESTED 3 BENZIE CUCUMBERS -‐ OPERATIONS WITH AREA HARVESTED 4

Page 4 of 13
GRAND TRAVERSE CUCUMBERS -‐ OPERATIONS WITH AREA HARVESTED 6 KALKASKA CUCUMBERS -‐ OPERATIONS WITH AREA HARVESTED 8 WEXFORD CUCUMBERS -‐ OPERATIONS WITH AREA HARVESTED 3 MISSAUKEE CUCUMBERS -‐ OPERATIONS WITH AREA HARVESTED 1 MANISTEE CUCUMBERS -‐ OPERATIONS WITH AREA HARVESTED 12 37 MISSAUKEE EGGPLANT -‐ ACRES HARVESTED (D) LEELANAU EGGPLANT -‐ ACRES HARVESTED (D) LEELANAU EGGPLANT -‐ OPERATIONS WITH AREA HARVESTED 1 MISSAUKEE EGGPLANT -‐ OPERATIONS WITH AREA HARVESTED 2 3 BENZIE GARLIC -‐ ACRES HARVESTED (D) MANISTEE GARLIC -‐ ACRES HARVESTED (D) WEXFORD GARLIC -‐ ACRES HARVESTED (D) GRAND TRAVERSE GARLIC -‐ ACRES HARVESTED 2 LEELANAU GARLIC -‐ ACRES HARVESTED (D) 2 LEELANAU GARLIC -‐ OPERATIONS WITH AREA HARVESTED 1 BENZIE GARLIC -‐ OPERATIONS WITH AREA HARVESTED 2 MANISTEE GARLIC -‐ OPERATIONS WITH AREA HARVESTED 1 GRAND TRAVERSE GARLIC -‐ OPERATIONS WITH AREA HARVESTED 3 WEXFORD GARLIC -‐ OPERATIONS WITH AREA HARVESTED 1 8 LEELANAU GREENS, COLLARD -‐ ACRES HARVESTED (D) LEELANAU GREENS, COLLARD -‐ OPERATIONS WITH AREA HARVESTED 1 1 BENZIE GREENS, KALE -‐ ACRES HARVESTED (D) LEELANAU GREENS, KALE -‐ ACRES HARVESTED (D) LEELANAU GREENS, KALE -‐ OPERATIONS WITH AREA HARVESTED 1 BENZIE GREENS, KALE -‐ OPERATIONS WITH AREA HARVESTED 2 3 BENZIE HERBS, FRESH CUT, IN THE OPEN -‐ ACRES HARVESTED (Z) GRAND TRAVERSE HERBS, FRESH CUT, IN THE OPEN -‐ ACRES HARVESTED (D) WEXFORD HERBS, FRESH CUT, IN THE OPEN -‐ ACRES HARVESTED (Z) BENZIE HERBS, FRESH CUT, IN THE OPEN -‐ OPERATIONS WITH AREA
HARVESTED 3
GRAND TRAVERSE HERBS, FRESH CUT, IN THE OPEN -‐ OPERATIONS WITH AREA HARVESTED
1
WEXFORD HERBS, FRESH CUT, IN THE OPEN -‐ OPERATIONS WITH AREA HARVESTED
3 7
WEXFORD LETTUCE -‐ ACRES HARVESTED (D) GRAND TRAVERSE LETTUCE -‐ ACRES HARVESTED (D) MANISTEE LETTUCE -‐ ACRES HARVESTED 1 KALKASKA LETTUCE -‐ ACRES HARVESTED (D) LEELANAU LETTUCE -‐ ACRES HARVESTED 1 2 LEELANAU LETTUCE -‐ OPERATIONS WITH AREA HARVESTED 4 MANISTEE LETTUCE -‐ OPERATIONS WITH AREA HARVESTED 3

Page 5 of 13
GRAND TRAVERSE LETTUCE -‐ OPERATIONS WITH AREA HARVESTED 3 KALKASKA LETTUCE -‐ OPERATIONS WITH AREA HARVESTED 1 WEXFORD LETTUCE -‐ OPERATIONS WITH AREA HARVESTED 3 14 GRAND TRAVERSE LETTUCE, HEAD -‐ ACRES HARVESTED (D) LEELANAU LETTUCE, HEAD -‐ ACRES HARVESTED (D) LEELANAU LETTUCE, HEAD -‐ OPERATIONS WITH AREA HARVESTED 2 GRAND TRAVERSE LETTUCE, HEAD -‐ OPERATIONS WITH AREA HARVESTED 2 4 KALKASKA LETTUCE, LEAF -‐ ACRES HARVESTED (D) WEXFORD LETTUCE, LEAF -‐ ACRES HARVESTED (D) GRAND TRAVERSE LETTUCE, LEAF -‐ ACRES HARVESTED (D) MANISTEE LETTUCE, LEAF -‐ ACRES HARVESTED 1 LEELANAU LETTUCE, LEAF -‐ ACRES HARVESTED (D) 1 LEELANAU LETTUCE, LEAF -‐ OPERATIONS WITH AREA HARVESTED 3 GRAND TRAVERSE LETTUCE, LEAF -‐ OPERATIONS WITH AREA HARVESTED 1 WEXFORD LETTUCE, LEAF -‐ OPERATIONS WITH AREA HARVESTED 2 KALKASKA LETTUCE, LEAF -‐ OPERATIONS WITH AREA HARVESTED 1 MANISTEE LETTUCE, LEAF -‐ OPERATIONS WITH AREA HARVESTED 3 10 WEXFORD LETTUCE, ROMAINE -‐ ACRES HARVESTED (D) LEELANAU LETTUCE, ROMAINE -‐ ACRES HARVESTED (D) LEELANAU LETTUCE, ROMAINE -‐ OPERATIONS WITH AREA HARVESTED 1 WEXFORD LETTUCE, ROMAINE -‐ OPERATIONS WITH AREA HARVESTED 1 2 GRAND TRAVERSE MELONS, CANTALOUP -‐ ACRES HARVESTED 1 MANISTEE MELONS, CANTALOUP -‐ ACRES HARVESTED (D) KALKASKA MELONS, CANTALOUP -‐ ACRES HARVESTED (D) GRAND TRAVERSE MELONS, CANTALOUP -‐ ACRES HARVESTED 1 KALKASKA MELONS, CANTALOUP -‐ ACRES HARVESTED (D) MANISTEE MELONS, CANTALOUP -‐ ACRES HARVESTED (D) ROSCOMMON MELONS, CANTALOUP -‐ ACRES HARVESTED (D) LEELANAU MELONS, CANTALOUP -‐ ACRES HARVESTED (D) 2 LEELANAU MELONS, CANTALOUP -‐ OPERATIONS WITH AREA
HARVESTED 1
KALKASKA MELONS, CANTALOUP -‐ OPERATIONS WITH AREA HARVESTED
1
MECOSTA MELONS, CANTALOUP -‐ OPERATIONS WITH AREA HARVESTED
8
GRAND TRAVERSE MELONS, CANTALOUP -‐ OPERATIONS WITH AREA HARVESTED
4
ROSCOMMON MELONS, CANTALOUP -‐ OPERATIONS WITH AREA HARVESTED
2
MANISTEE MELONS, CANTALOUP -‐ OPERATIONS WITH AREA HARVESTED
2 18

Page 6 of 13
MANISTEE MELONS, WATERMELON -‐ ACRES HARVESTED 1 GRAND TRAVERSE MELONS, WATERMELON -‐ ACRES HARVESTED (D) KALKASKA MELONS, WATERMELON -‐ ACRES HARVESTED (D) MECOSTA MELONS, WATERMELON -‐ ACRES HARVESTED 2 MISSAUKEE MELONS, WATERMELON -‐ ACRES HARVESTED (D) LEELANAU MELONS, WATERMELON -‐ ACRES HARVESTED 1 4 LEELANAU MELONS, WATERMELON -‐ OPERATIONS WITH AREA
HARVESTED 3
CRAWFORD MELONS, WATERMELON -‐ OPERATIONS WITH AREA HARVESTED
-‐
GRAND TRAVERSE MELONS, WATERMELON -‐ OPERATIONS WITH AREA HARVESTED
2
KALKASKA MELONS, WATERMELON -‐ OPERATIONS WITH AREA HARVESTED
1
MANISTEE MELONS, WATERMELON -‐ OPERATIONS WITH AREA HARVESTED
3
MECOSTA MELONS, WATERMELON -‐ OPERATIONS WITH AREA HARVESTED
10
MISSAUKEE MELONS, WATERMELON -‐ OPERATIONS WITH AREA HARVESTED
1
CLARE MELONS, WATERMELON -‐ OPERATIONS WITH AREA HARVESTED
-‐ 25
WEXFORD ONIONS, DRY -‐ ACRES HARVESTED (Z) GRAND TRAVERSE ONIONS, DRY -‐ ACRES HARVESTED (Z) KALKASKA ONIONS, DRY -‐ ACRES HARVESTED (D) MECOSTA ONIONS, DRY -‐ ACRES HARVESTED 1 LEELANAU ONIONS, DRY -‐ ACRES HARVESTED 1 2 LEELANAU ONIONS, DRY -‐ OPERATIONS WITH AREA HARVESTED 3 KALKASKA ONIONS, DRY -‐ OPERATIONS WITH AREA HARVESTED 2 GRAND TRAVERSE ONIONS, DRY -‐ OPERATIONS WITH AREA HARVESTED 3 WEXFORD ONIONS, DRY -‐ OPERATIONS WITH AREA HARVESTED 3 MECOSTA ONIONS, DRY -‐ OPERATIONS WITH AREA HARVESTED 10 21 MECOSTA ONIONS, GREEN -‐ ACRES HARVESTED 1 LEELANAU ONIONS, GREEN -‐ ACRES HARVESTED 1 2 LEELANAU ONIONS, GREEN -‐ OPERATIONS WITH AREA HARVESTED 3 MECOSTA ONIONS, GREEN -‐ OPERATIONS WITH AREA HARVESTED 6 9 MANISTEE PARSLEY -‐ ACRES HARVESTED (D) MANISTEE PARSLEY -‐ OPERATIONS WITH AREA HARVESTED 2 2 MECOSTA PEAS, CHINESE (SUGAR & SNOW) -‐ ACRES HARVESTED (D) LEELANAU PEAS, CHINESE (SUGAR & SNOW) -‐ ACRES HARVESTED (D) LEELANAU PEAS, CHINESE (SUGAR & SNOW) -‐ OPERATIONS WITH AREA
HARVESTED 1

Page 7 of 13
MECOSTA PEAS, CHINESE (SUGAR & SNOW) -‐ OPERATIONS WITH AREA HARVESTED
2 3
MANISTEE PEAS, GREEN (EXCL SOUTHERN) -‐ ACRES HARVESTED (D) MECOSTA PEAS, GREEN (EXCL SOUTHERN) -‐ ACRES HARVESTED (D) BENZIE PEAS, GREEN (EXCL SOUTHERN) -‐ ACRES HARVESTED (D) LEELANAU PEAS, GREEN (EXCL SOUTHERN) -‐ ACRES HARVESTED 1 1 LEELANAU PEAS, GREEN (EXCL SOUTHERN) -‐ OPERATIONS WITH AREA
HARVESTED 3
BENZIE PEAS, GREEN (EXCL SOUTHERN) -‐ OPERATIONS WITH AREA HARVESTED
2
MANISTEE PEAS, GREEN (EXCL SOUTHERN) -‐ OPERATIONS WITH AREA HARVESTED
1
MECOSTA PEAS, GREEN (EXCL SOUTHERN) -‐ OPERATIONS WITH AREA HARVESTED
3 9
MISSAUKEE PEPPERS, BELL -‐ ACRES HARVESTED 2 BENZIE PEPPERS, BELL -‐ ACRES HARVESTED 1 CLARE PEPPERS, BELL -‐ ACRES HARVESTED (Z) WEXFORD PEPPERS, BELL -‐ ACRES HARVESTED 1 MANISTEE PEPPERS, BELL -‐ ACRES HARVESTED 2 MECOSTA PEPPERS, BELL -‐ ACRES HARVESTED 1 KALKASKA PEPPERS, BELL -‐ ACRES HARVESTED 1 GRAND TRAVERSE PEPPERS, BELL -‐ ACRES HARVESTED 2 ROSCOMMON PEPPERS, BELL -‐ ACRES HARVESTED (D) OSCEOLA PEPPERS, BELL -‐ ACRES HARVESTED 2 LEELANAU PEPPERS, BELL -‐ ACRES HARVESTED 3 MASON PEPPERS, BELL -‐ ACRES HARVESTED (D) 15 MASON PEPPERS, BELL -‐ OPERATIONS WITH AREA HARVESTED 2 LEELANAU PEPPERS, BELL -‐ OPERATIONS WITH AREA HARVESTED 10 WEXFORD PEPPERS, BELL -‐ OPERATIONS WITH AREA HARVESTED 7 GRAND TRAVERSE PEPPERS, BELL -‐ OPERATIONS WITH AREA HARVESTED 8 OSCEOLA PEPPERS, BELL -‐ OPERATIONS WITH AREA HARVESTED 4 MANISTEE PEPPERS, BELL -‐ OPERATIONS WITH AREA HARVESTED 6 CLARE PEPPERS, BELL -‐ OPERATIONS WITH AREA HARVESTED 3 MECOSTA PEPPERS, BELL -‐ OPERATIONS WITH AREA HARVESTED 6 BENZIE PEPPERS, BELL -‐ OPERATIONS WITH AREA HARVESTED 5 ROSCOMMON PEPPERS, BELL -‐ OPERATIONS WITH AREA HARVESTED 2 MISSAUKEE PEPPERS, BELL -‐ OPERATIONS WITH AREA HARVESTED 3 KALKASKA PEPPERS, BELL -‐ OPERATIONS WITH AREA HARVESTED 9 65 OSCEOLA PEPPERS, CHILE -‐ ACRES HARVESTED (D) GRAND TRAVERSE PEPPERS, CHILE -‐ ACRES HARVESTED 2 CLARE PEPPERS, CHILE -‐ ACRES HARVESTED (D)

Page 8 of 13
BENZIE PEPPERS, CHILE -‐ ACRES HARVESTED 1 MISSAUKEE PEPPERS, CHILE -‐ ACRES HARVESTED (D) MANISTEE PEPPERS, CHILE -‐ ACRES HARVESTED 3 WEXFORD PEPPERS, CHILE -‐ ACRES HARVESTED 1 KALKASKA PEPPERS, CHILE -‐ ACRES HARVESTED 1 LEELANAU PEPPERS, CHILE -‐ ACRES HARVESTED 1 9 LEELANAU PEPPERS, CHILE -‐ OPERATIONS WITH AREA HARVESTED 6 MANISTEE PEPPERS, CHILE -‐ OPERATIONS WITH AREA HARVESTED 9 CLARE PEPPERS, CHILE -‐ OPERATIONS WITH AREA HARVESTED 1 WEXFORD PEPPERS, CHILE -‐ OPERATIONS WITH AREA HARVESTED 5 BENZIE PEPPERS, CHILE -‐ OPERATIONS WITH AREA HARVESTED 5 KALKASKA PEPPERS, CHILE -‐ OPERATIONS WITH AREA HARVESTED 6 GRAND TRAVERSE PEPPERS, CHILE -‐ OPERATIONS WITH AREA HARVESTED 4 OSCEOLA PEPPERS, CHILE -‐ OPERATIONS WITH AREA HARVESTED 1 MISSAUKEE PEPPERS, CHILE -‐ OPERATIONS WITH AREA HARVESTED 1 38 CLARE POTATOES -‐ ACRES HARVESTED (Z) MECOSTA POTATOES -‐ ACRES HARVESTED (D) OSCEOLA POTATOES -‐ ACRES HARVESTED (D) BENZIE POTATOES -‐ ACRES HARVESTED 1 GRAND TRAVERSE POTATOES -‐ ACRES HARVESTED 4 KALKASKA POTATOES -‐ ACRES HARVESTED 1,256 LEELANAU POTATOES -‐ ACRES HARVESTED 8 MANISTEE POTATOES -‐ ACRES HARVESTED 12 MISSAUKEE POTATOES -‐ ACRES HARVESTED 10 WEXFORD POTATOES -‐ ACRES HARVESTED 3 MASON POTATOES -‐ ACRES HARVESTED 8 1302 WEXFORD POTATOES -‐ OPERATIONS WITH AREA HARVESTED 2 MISSAUKEE POTATOES -‐ OPERATIONS WITH AREA HARVESTED (D) MANISTEE POTATOES -‐ OPERATIONS WITH AREA HARVESTED 2 LEELANAU POTATOES -‐ OPERATIONS WITH AREA HARVESTED (D) KALKASKA POTATOES -‐ OPERATIONS WITH AREA HARVESTED (D) GRAND TRAVERSE POTATOES -‐ OPERATIONS WITH AREA HARVESTED 9 BENZIE POTATOES -‐ OPERATIONS WITH AREA HARVESTED 4 OSCEOLA POTATOES -‐ OPERATIONS WITH AREA HARVESTED 6 MECOSTA POTATOES -‐ OPERATIONS WITH AREA HARVESTED 15 CLARE POTATOES -‐ OPERATIONS WITH AREA HARVESTED 3 MASON POTATOES -‐ OPERATIONS WITH AREA HARVESTED 2 43 WEXFORD PUMPKINS -‐ ACRES HARVESTED 7 CRAWFORD PUMPKINS -‐ ACRES HARVESTED (D) MECOSTA PUMPKINS -‐ ACRES HARVESTED 7

Page 9 of 13
MISSAUKEE PUMPKINS -‐ ACRES HARVESTED 9 OSCEOLA PUMPKINS -‐ ACRES HARVESTED (D) CLARE PUMPKINS -‐ ACRES HARVESTED 5 GRAND TRAVERSE PUMPKINS -‐ ACRES HARVESTED 38 BENZIE PUMPKINS -‐ ACRES HARVESTED (D) KALKASKA PUMPKINS -‐ ACRES HARVESTED 1 MANISTEE PUMPKINS -‐ ACRES HARVESTED 12 LEELANAU PUMPKINS -‐ ACRES HARVESTED 23 MASON PUMPKINS -‐ ACRES HARVESTED 58 153 MASON PUMPKINS -‐ OPERATIONS WITH AREA HARVESTED 8 LEELANAU PUMPKINS -‐ OPERATIONS WITH AREA HARVESTED 11 CLARE PUMPKINS -‐ OPERATIONS WITH AREA HARVESTED 4 CRAWFORD PUMPKINS -‐ OPERATIONS WITH AREA HARVESTED 2 OSCEOLA PUMPKINS -‐ OPERATIONS WITH AREA HARVESTED 4 MISSAUKEE PUMPKINS -‐ OPERATIONS WITH AREA HARVESTED 3 WEXFORD PUMPKINS -‐ OPERATIONS WITH AREA HARVESTED 6 MANISTEE PUMPKINS -‐ OPERATIONS WITH AREA HARVESTED 9 MECOSTA PUMPKINS -‐ OPERATIONS WITH AREA HARVESTED 8 BENZIE PUMPKINS -‐ OPERATIONS WITH AREA HARVESTED 4 GRAND TRAVERSE PUMPKINS -‐ OPERATIONS WITH AREA HARVESTED 19 KALKASKA PUMPKINS -‐ OPERATIONS WITH AREA HARVESTED 5 83 MECOSTA RADISHES -‐ ACRES HARVESTED (D) KALKASKA RADISHES -‐ ACRES HARVESTED (D) GRAND TRAVERSE RADISHES -‐ ACRES HARVESTED (D) LEELANAU RADISHES -‐ ACRES HARVESTED (D) LEELANAU RADISHES -‐ OPERATIONS WITH AREA HARVESTED 1 MECOSTA RADISHES -‐ OPERATIONS WITH AREA HARVESTED 2 GRAND TRAVERSE RADISHES -‐ OPERATIONS WITH AREA HARVESTED 1 KALKASKA RADISHES -‐ OPERATIONS WITH AREA HARVESTED 2 6 BENZIE RHUBARB -‐ ACRES HARVESTED (D) KALKASKA RHUBARB -‐ ACRES HARVESTED (D) MECOSTA RHUBARB -‐ ACRES HARVESTED (D) LEELANAU RHUBARB -‐ ACRES HARVESTED (D) LEELANAU RHUBARB -‐ OPERATIONS WITH AREA HARVESTED 1 BENZIE RHUBARB -‐ OPERATIONS WITH AREA HARVESTED 2 MECOSTA RHUBARB -‐ OPERATIONS WITH AREA HARVESTED 2 KALKASKA RHUBARB -‐ OPERATIONS WITH AREA HARVESTED 2 7 MECOSTA SPINACH -‐ ACRES HARVESTED (D) LEELANAU SPINACH -‐ ACRES HARVESTED (D) LEELANAU SPINACH -‐ OPERATIONS WITH AREA HARVESTED 1

Page 10 of 13
MECOSTA SPINACH -‐ OPERATIONS WITH AREA HARVESTED 2 3 CLARE SQUASH -‐ ACRES HARVESTED (D) MISSAUKEE SQUASH -‐ ACRES HARVESTED (D) BENZIE SQUASH -‐ ACRES HARVESTED (D) WEXFORD SQUASH -‐ ACRES HARVESTED 1 OSCEOLA SQUASH -‐ ACRES HARVESTED (D) MANISTEE SQUASH -‐ ACRES HARVESTED (D) ROSCOMMON SQUASH -‐ ACRES HARVESTED (D) KALKASKA SQUASH -‐ ACRES HARVESTED (D) GRAND TRAVERSE SQUASH -‐ ACRES HARVESTED 5 MECOSTA SQUASH -‐ ACRES HARVESTED 4 LEELANAU SQUASH -‐ ACRES HARVESTED (D) MASON SQUASH -‐ ACRES HARVESTED 862 872 MASON SQUASH -‐ OPERATIONS WITH AREA HARVESTED 13 LEELANAU SQUASH -‐ OPERATIONS WITH AREA HARVESTED 5 GRAND TRAVERSE SQUASH -‐ OPERATIONS WITH AREA HARVESTED 5 KALKASKA SQUASH -‐ OPERATIONS WITH AREA HARVESTED 1 ROSCOMMON SQUASH -‐ OPERATIONS WITH AREA HARVESTED 2 MECOSTA SQUASH -‐ OPERATIONS WITH AREA HARVESTED 14 WEXFORD SQUASH -‐ OPERATIONS WITH AREA HARVESTED 3 MANISTEE SQUASH -‐ OPERATIONS WITH AREA HARVESTED 1 CLARE SQUASH -‐ OPERATIONS WITH AREA HARVESTED 1 OSCEOLA SQUASH -‐ OPERATIONS WITH AREA HARVESTED 2 MISSAUKEE SQUASH -‐ OPERATIONS WITH AREA HARVESTED 1 BENZIE SQUASH -‐ OPERATIONS WITH AREA HARVESTED 4 52 BENZIE SQUASH, SUMMER -‐ ACRES HARVESTED (D) MISSAUKEE SQUASH, SUMMER -‐ ACRES HARVESTED (D) MANISTEE SQUASH, SUMMER -‐ ACRES HARVESTED (D) WEXFORD SQUASH, SUMMER -‐ ACRES HARVESTED (D) ROSCOMMON SQUASH, SUMMER -‐ ACRES HARVESTED (D) CLARE SQUASH, SUMMER -‐ ACRES HARVESTED (D) GRAND TRAVERSE SQUASH, SUMMER -‐ ACRES HARVESTED (D) MECOSTA SQUASH, SUMMER -‐ ACRES HARVESTED 2 OSCEOLA SQUASH, SUMMER -‐ ACRES HARVESTED (D) LEELANAU SQUASH, SUMMER -‐ ACRES HARVESTED (D) MASON SQUASH, SUMMER -‐ ACRES HARVESTED (D) 2 MASON SQUASH, SUMMER -‐ OPERATIONS WITH AREA HARVESTED 3 LEELANAU SQUASH, SUMMER -‐ OPERATIONS WITH AREA HARVESTED 2 MECOSTA SQUASH, SUMMER -‐ OPERATIONS WITH AREA HARVESTED 14 OSCEOLA SQUASH, SUMMER -‐ OPERATIONS WITH AREA HARVESTED 2

Page 11 of 13
MANISTEE SQUASH, SUMMER -‐ OPERATIONS WITH AREA HARVESTED 1 CLARE SQUASH, SUMMER -‐ OPERATIONS WITH AREA HARVESTED 1 MISSAUKEE SQUASH, SUMMER -‐ OPERATIONS WITH AREA HARVESTED 1 GRAND TRAVERSE SQUASH, SUMMER -‐ OPERATIONS WITH AREA HARVESTED 4 WEXFORD SQUASH, SUMMER -‐ OPERATIONS WITH AREA HARVESTED 1 ROSCOMMON SQUASH, SUMMER -‐ OPERATIONS WITH AREA HARVESTED 2 BENZIE SQUASH, SUMMER -‐ OPERATIONS WITH AREA HARVESTED 3 34 KALKASKA SQUASH, WINTER -‐ ACRES HARVESTED (D) GRAND TRAVERSE SQUASH, WINTER -‐ ACRES HARVESTED (D) MECOSTA SQUASH, WINTER -‐ ACRES HARVESTED 2 MANISTEE SQUASH, WINTER -‐ ACRES HARVESTED (D) BENZIE SQUASH, WINTER -‐ ACRES HARVESTED (D) WEXFORD SQUASH, WINTER -‐ ACRES HARVESTED (D) LEELANAU SQUASH, WINTER -‐ ACRES HARVESTED (D) MASON SQUASH, WINTER -‐ ACRES HARVESTED (D) 2 MASON SQUASH, WINTER -‐ OPERATIONS WITH AREA HARVESTED 13 LEELANAU SQUASH, WINTER -‐ OPERATIONS WITH AREA HARVESTED 4 MECOSTA SQUASH, WINTER -‐ OPERATIONS WITH AREA HARVESTED 10 KALKASKA SQUASH, WINTER -‐ OPERATIONS WITH AREA HARVESTED 1 MANISTEE SQUASH, WINTER -‐ OPERATIONS WITH AREA HARVESTED 1 WEXFORD SQUASH, WINTER -‐ OPERATIONS WITH AREA HARVESTED 3 GRAND TRAVERSE SQUASH, WINTER -‐ OPERATIONS WITH AREA HARVESTED 1 BENZIE SQUASH, WINTER -‐ OPERATIONS WITH AREA HARVESTED 1 34 KALKASKA SWEET CORN -‐ ACRES HARVESTED 1 MECOSTA SWEET CORN -‐ ACRES HARVESTED 75 ROSCOMMON SWEET CORN -‐ ACRES HARVESTED (D) CRAWFORD SWEET CORN -‐ ACRES HARVESTED (D) MANISTEE SWEET CORN -‐ ACRES HARVESTED 42 WEXFORD SWEET CORN -‐ ACRES HARVESTED 12 OSCEOLA SWEET CORN -‐ ACRES HARVESTED 15 BENZIE SWEET CORN -‐ ACRES HARVESTED (D) MISSAUKEE SWEET CORN -‐ ACRES HARVESTED (D) CLARE SWEET CORN -‐ ACRES HARVESTED 25 GRAND TRAVERSE SWEET CORN -‐ ACRES HARVESTED 106 LEELANAU SWEET CORN -‐ ACRES HARVESTED 46 MASON SWEET CORN -‐ ACRES HARVESTED (D) 322 MASON SWEET CORN -‐ OPERATIONS WITH AREA HARVESTED 5 LEELANAU SWEET CORN -‐ OPERATIONS WITH AREA HARVESTED 11 MISSAUKEE SWEET CORN -‐ OPERATIONS WITH AREA HARVESTED 1 MANISTEE SWEET CORN -‐ OPERATIONS WITH AREA HARVESTED 11
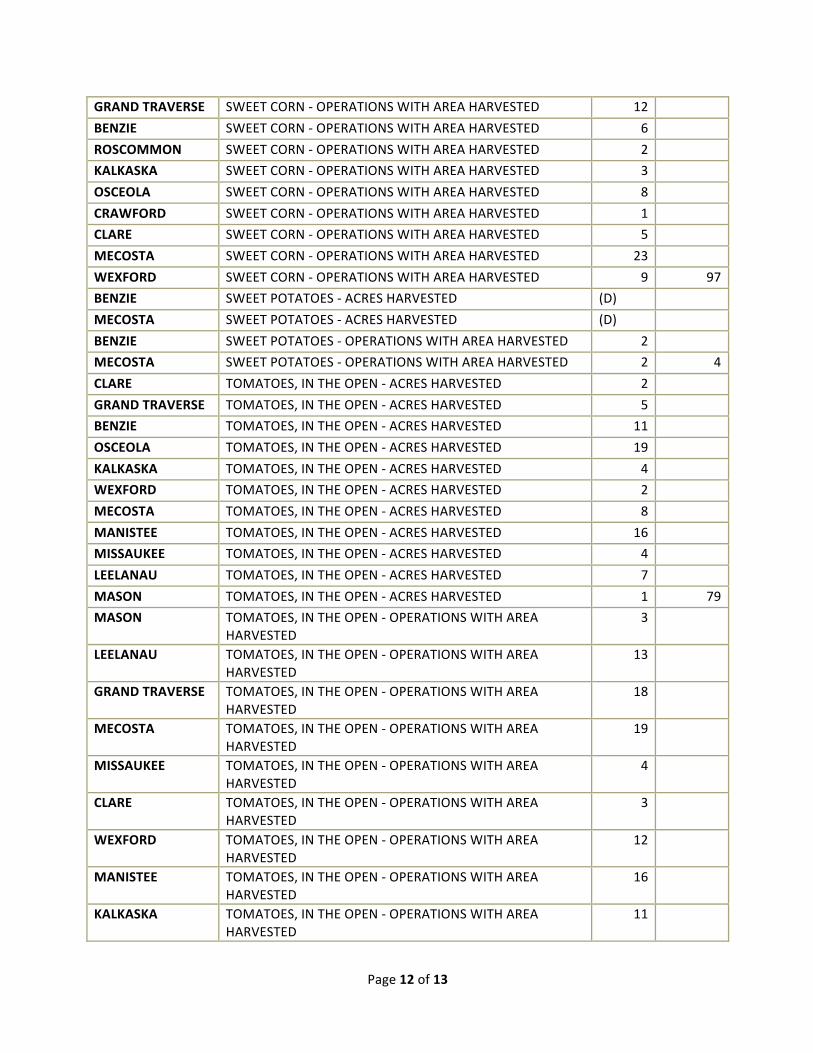
Page 12 of 13
GRAND TRAVERSE SWEET CORN -‐ OPERATIONS WITH AREA HARVESTED 12 BENZIE SWEET CORN -‐ OPERATIONS WITH AREA HARVESTED 6 ROSCOMMON SWEET CORN -‐ OPERATIONS WITH AREA HARVESTED 2 KALKASKA SWEET CORN -‐ OPERATIONS WITH AREA HARVESTED 3 OSCEOLA SWEET CORN -‐ OPERATIONS WITH AREA HARVESTED 8 CRAWFORD SWEET CORN -‐ OPERATIONS WITH AREA HARVESTED 1 CLARE SWEET CORN -‐ OPERATIONS WITH AREA HARVESTED 5 MECOSTA SWEET CORN -‐ OPERATIONS WITH AREA HARVESTED 23 WEXFORD SWEET CORN -‐ OPERATIONS WITH AREA HARVESTED 9 97 BENZIE SWEET POTATOES -‐ ACRES HARVESTED (D) MECOSTA SWEET POTATOES -‐ ACRES HARVESTED (D) BENZIE SWEET POTATOES -‐ OPERATIONS WITH AREA HARVESTED 2 MECOSTA SWEET POTATOES -‐ OPERATIONS WITH AREA HARVESTED 2 4 CLARE TOMATOES, IN THE OPEN -‐ ACRES HARVESTED 2 GRAND TRAVERSE TOMATOES, IN THE OPEN -‐ ACRES HARVESTED 5 BENZIE TOMATOES, IN THE OPEN -‐ ACRES HARVESTED 11 OSCEOLA TOMATOES, IN THE OPEN -‐ ACRES HARVESTED 19 KALKASKA TOMATOES, IN THE OPEN -‐ ACRES HARVESTED 4 WEXFORD TOMATOES, IN THE OPEN -‐ ACRES HARVESTED 2 MECOSTA TOMATOES, IN THE OPEN -‐ ACRES HARVESTED 8 MANISTEE TOMATOES, IN THE OPEN -‐ ACRES HARVESTED 16 MISSAUKEE TOMATOES, IN THE OPEN -‐ ACRES HARVESTED 4 LEELANAU TOMATOES, IN THE OPEN -‐ ACRES HARVESTED 7 MASON TOMATOES, IN THE OPEN -‐ ACRES HARVESTED 1 79 MASON TOMATOES, IN THE OPEN -‐ OPERATIONS WITH AREA
HARVESTED 3
LEELANAU TOMATOES, IN THE OPEN -‐ OPERATIONS WITH AREA HARVESTED
13
GRAND TRAVERSE TOMATOES, IN THE OPEN -‐ OPERATIONS WITH AREA HARVESTED
18
MECOSTA TOMATOES, IN THE OPEN -‐ OPERATIONS WITH AREA HARVESTED
19
MISSAUKEE TOMATOES, IN THE OPEN -‐ OPERATIONS WITH AREA HARVESTED
4
CLARE TOMATOES, IN THE OPEN -‐ OPERATIONS WITH AREA HARVESTED
3
WEXFORD TOMATOES, IN THE OPEN -‐ OPERATIONS WITH AREA HARVESTED
12
MANISTEE TOMATOES, IN THE OPEN -‐ OPERATIONS WITH AREA HARVESTED
16
KALKASKA TOMATOES, IN THE OPEN -‐ OPERATIONS WITH AREA HARVESTED
11

Page 13 of 13
OSCEOLA TOMATOES, IN THE OPEN -‐ OPERATIONS WITH AREA HARVESTED
10
BENZIE TOMATOES, IN THE OPEN -‐ OPERATIONS WITH AREA HARVESTED
13 122
MECOSTA TURNIPS -‐ ACRES HARVESTED (D) KALKASKA TURNIPS -‐ ACRES HARVESTED (D) LEELANAU TURNIPS -‐ ACRES HARVESTED (D) LEELANAU TURNIPS -‐ OPERATIONS WITH AREA HARVESTED 1 MECOSTA TURNIPS -‐ OPERATIONS WITH AREA HARVESTED 2 KALKASKA TURNIPS -‐ OPERATIONS WITH AREA HARVESTED 2 5
“D” Data withheld to avoid disclosing data for individual farms
“Z” Less than half of the unit shown
“X” Not applicable

Page 1 of 4
Appendix B
Fruit Acres Harvested and Operations County Data Item Value
for County
Total for Category
all Counties
CLARE APPLES -‐ ACRES BEARING (D) MECOSTA APPLES -‐ ACRES BEARING (D) OSCEOLA APPLES -‐ ACRES BEARING 36 ROSCOMMON APPLES -‐ ACRES BEARING 3 BENZIE APPLES -‐ ACRES BEARING 754 GRAND TRAVERSE APPLES -‐ ACRES BEARING 789 KALKASKA APPLES -‐ ACRES BEARING (D) MANISTEE APPLES -‐ ACRES BEARING 644 WEXFORD APPLES -‐ ACRES BEARING 12 LAKE APPLES -‐ ACRES BEARING (D) LEELANAU APPLES -‐ ACRES BEARING 1,421 MASON APPLES -‐ ACRES BEARING 1,356 5015 MASON APPLES -‐ OPERATIONS WITH AREA BEARING 27 LEELANAU APPLES -‐ OPERATIONS WITH AREA BEARING 84 CLARE APPLES -‐ OPERATIONS WITH AREA BEARING 2 MECOSTA APPLES -‐ OPERATIONS WITH AREA BEARING 8 OSCEOLA APPLES -‐ OPERATIONS WITH AREA BEARING 23 ROSCOMMON APPLES -‐ OPERATIONS WITH AREA BEARING 3 BENZIE APPLES -‐ OPERATIONS WITH AREA BEARING 34 GRAND TRAVERSE APPLES -‐ OPERATIONS WITH AREA BEARING 52 KALKASKA APPLES -‐ OPERATIONS WITH AREA BEARING 2 MANISTEE APPLES -‐ OPERATIONS WITH AREA BEARING 35 WEXFORD APPLES -‐ OPERATIONS WITH AREA BEARING 6 LAKE APPLES -‐ OPERATIONS WITH AREA BEARING 276 OSCEOLA APRICOTS -‐ ACRES BEARING (D) BENZIE APRICOTS -‐ ACRES BEARING (D) GRAND TRAVERSE APRICOTS -‐ ACRES BEARING (D) MANISTEE APRICOTS -‐ ACRES BEARING (D) LEELANAU APRICOTS -‐ ACRES BEARING (D) MASON APRICOTS -‐ ACRES 3 3 MASON APRICOTS -‐ NUMBER OF OPERATIONS 6 LEELANAU APRICOTS -‐ OPERATIONS WITH AREA BEARING 7
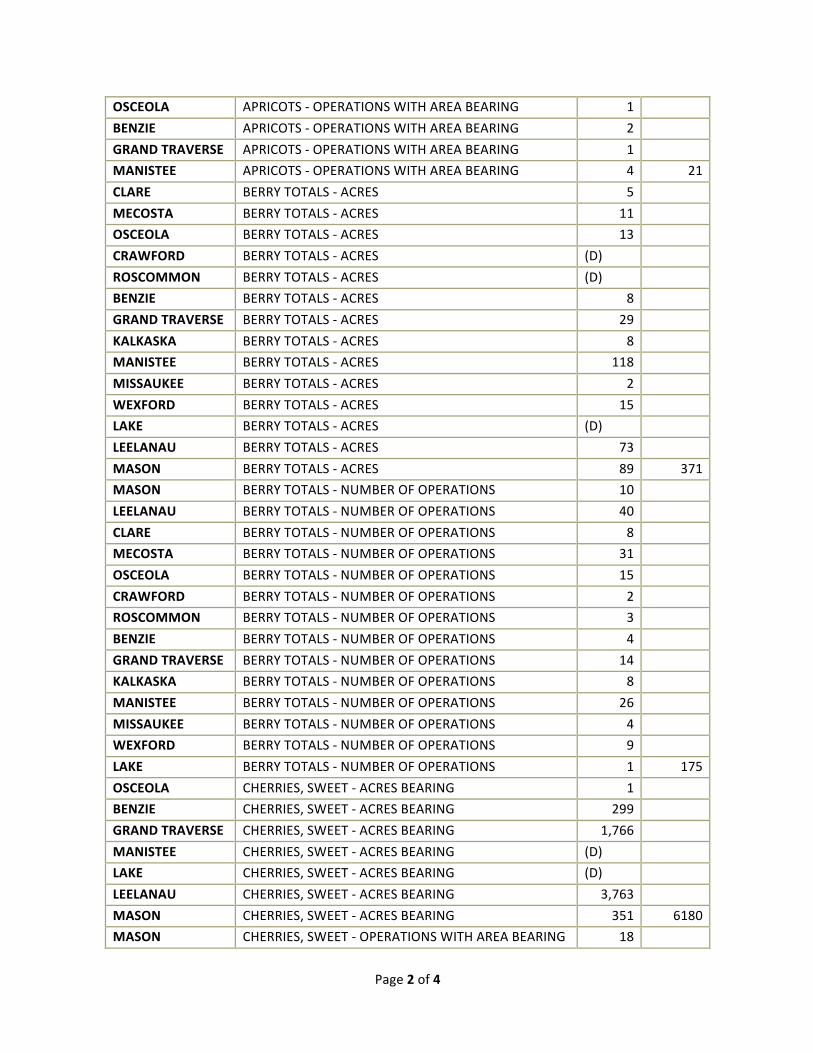
Page 2 of 4
OSCEOLA APRICOTS -‐ OPERATIONS WITH AREA BEARING 1 BENZIE APRICOTS -‐ OPERATIONS WITH AREA BEARING 2 GRAND TRAVERSE APRICOTS -‐ OPERATIONS WITH AREA BEARING 1 MANISTEE APRICOTS -‐ OPERATIONS WITH AREA BEARING 4 21 CLARE BERRY TOTALS -‐ ACRES 5 MECOSTA BERRY TOTALS -‐ ACRES 11 OSCEOLA BERRY TOTALS -‐ ACRES 13 CRAWFORD BERRY TOTALS -‐ ACRES (D) ROSCOMMON BERRY TOTALS -‐ ACRES (D) BENZIE BERRY TOTALS -‐ ACRES 8 GRAND TRAVERSE BERRY TOTALS -‐ ACRES 29 KALKASKA BERRY TOTALS -‐ ACRES 8 MANISTEE BERRY TOTALS -‐ ACRES 118 MISSAUKEE BERRY TOTALS -‐ ACRES 2 WEXFORD BERRY TOTALS -‐ ACRES 15 LAKE BERRY TOTALS -‐ ACRES (D) LEELANAU BERRY TOTALS -‐ ACRES 73 MASON BERRY TOTALS -‐ ACRES 89 371 MASON BERRY TOTALS -‐ NUMBER OF OPERATIONS 10 LEELANAU BERRY TOTALS -‐ NUMBER OF OPERATIONS 40 CLARE BERRY TOTALS -‐ NUMBER OF OPERATIONS 8 MECOSTA BERRY TOTALS -‐ NUMBER OF OPERATIONS 31 OSCEOLA BERRY TOTALS -‐ NUMBER OF OPERATIONS 15 CRAWFORD BERRY TOTALS -‐ NUMBER OF OPERATIONS 2 ROSCOMMON BERRY TOTALS -‐ NUMBER OF OPERATIONS 3 BENZIE BERRY TOTALS -‐ NUMBER OF OPERATIONS 4 GRAND TRAVERSE BERRY TOTALS -‐ NUMBER OF OPERATIONS 14 KALKASKA BERRY TOTALS -‐ NUMBER OF OPERATIONS 8 MANISTEE BERRY TOTALS -‐ NUMBER OF OPERATIONS 26 MISSAUKEE BERRY TOTALS -‐ NUMBER OF OPERATIONS 4 WEXFORD BERRY TOTALS -‐ NUMBER OF OPERATIONS 9 LAKE BERRY TOTALS -‐ NUMBER OF OPERATIONS 1 175 OSCEOLA CHERRIES, SWEET -‐ ACRES BEARING 1 BENZIE CHERRIES, SWEET -‐ ACRES BEARING 299 GRAND TRAVERSE CHERRIES, SWEET -‐ ACRES BEARING 1,766 MANISTEE CHERRIES, SWEET -‐ ACRES BEARING (D) LAKE CHERRIES, SWEET -‐ ACRES BEARING (D) LEELANAU CHERRIES, SWEET -‐ ACRES BEARING 3,763 MASON CHERRIES, SWEET -‐ ACRES BEARING 351 6180 MASON CHERRIES, SWEET -‐ OPERATIONS WITH AREA BEARING 18
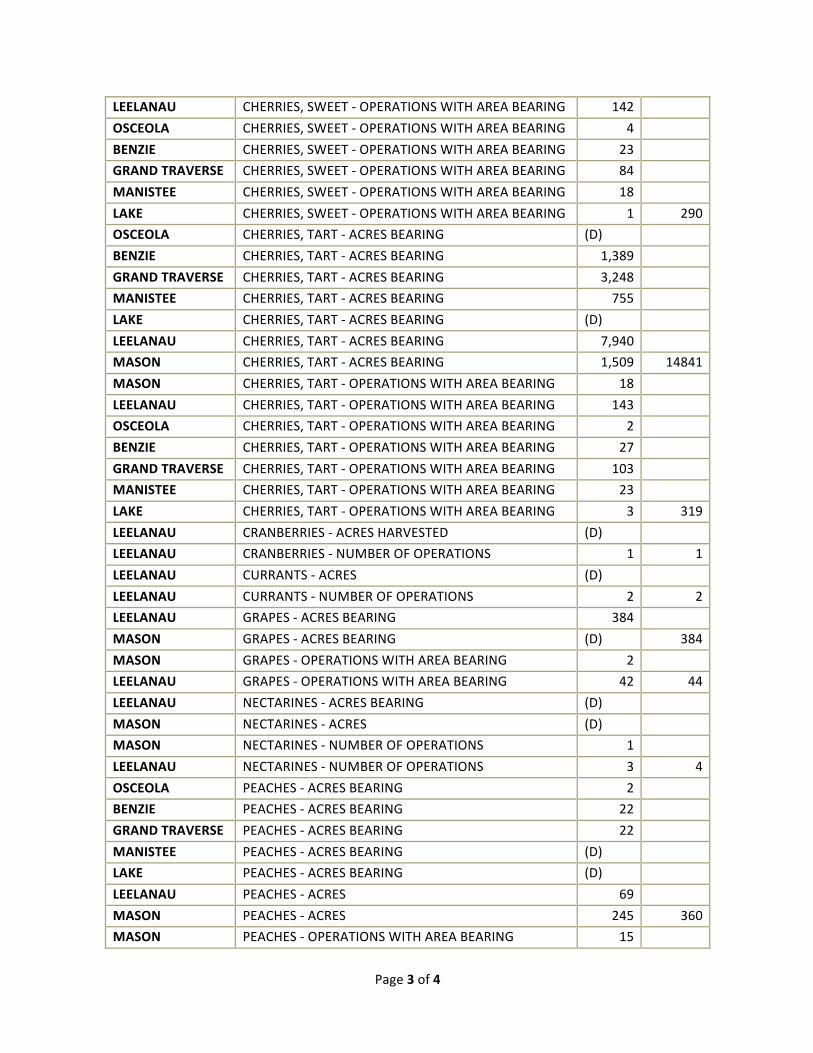
Page 3 of 4
LEELANAU CHERRIES, SWEET -‐ OPERATIONS WITH AREA BEARING 142 OSCEOLA CHERRIES, SWEET -‐ OPERATIONS WITH AREA BEARING 4 BENZIE CHERRIES, SWEET -‐ OPERATIONS WITH AREA BEARING 23 GRAND TRAVERSE CHERRIES, SWEET -‐ OPERATIONS WITH AREA BEARING 84 MANISTEE CHERRIES, SWEET -‐ OPERATIONS WITH AREA BEARING 18 LAKE CHERRIES, SWEET -‐ OPERATIONS WITH AREA BEARING 1 290 OSCEOLA CHERRIES, TART -‐ ACRES BEARING (D) BENZIE CHERRIES, TART -‐ ACRES BEARING 1,389 GRAND TRAVERSE CHERRIES, TART -‐ ACRES BEARING 3,248 MANISTEE CHERRIES, TART -‐ ACRES BEARING 755 LAKE CHERRIES, TART -‐ ACRES BEARING (D) LEELANAU CHERRIES, TART -‐ ACRES BEARING 7,940 MASON CHERRIES, TART -‐ ACRES BEARING 1,509 14841 MASON CHERRIES, TART -‐ OPERATIONS WITH AREA BEARING 18 LEELANAU CHERRIES, TART -‐ OPERATIONS WITH AREA BEARING 143 OSCEOLA CHERRIES, TART -‐ OPERATIONS WITH AREA BEARING 2 BENZIE CHERRIES, TART -‐ OPERATIONS WITH AREA BEARING 27 GRAND TRAVERSE CHERRIES, TART -‐ OPERATIONS WITH AREA BEARING 103 MANISTEE CHERRIES, TART -‐ OPERATIONS WITH AREA BEARING 23 LAKE CHERRIES, TART -‐ OPERATIONS WITH AREA BEARING 3 319 LEELANAU CRANBERRIES -‐ ACRES HARVESTED (D) LEELANAU CRANBERRIES -‐ NUMBER OF OPERATIONS 1 1 LEELANAU CURRANTS -‐ ACRES (D) LEELANAU CURRANTS -‐ NUMBER OF OPERATIONS 2 2 LEELANAU GRAPES -‐ ACRES BEARING 384 MASON GRAPES -‐ ACRES BEARING (D) 384 MASON GRAPES -‐ OPERATIONS WITH AREA BEARING 2 LEELANAU GRAPES -‐ OPERATIONS WITH AREA BEARING 42 44 LEELANAU NECTARINES -‐ ACRES BEARING (D) MASON NECTARINES -‐ ACRES (D) MASON NECTARINES -‐ NUMBER OF OPERATIONS 1 LEELANAU NECTARINES -‐ NUMBER OF OPERATIONS 3 4 OSCEOLA PEACHES -‐ ACRES BEARING 2 BENZIE PEACHES -‐ ACRES BEARING 22 GRAND TRAVERSE PEACHES -‐ ACRES BEARING 22 MANISTEE PEACHES -‐ ACRES BEARING (D) LAKE PEACHES -‐ ACRES BEARING (D) LEELANAU PEACHES -‐ ACRES 69 MASON PEACHES -‐ ACRES 245 360 MASON PEACHES -‐ OPERATIONS WITH AREA BEARING 15

Page 4 of 4
LEELANAU PEACHES -‐ OPERATIONS WITH AREA BEARING 31 OSCEOLA PEACHES -‐ OPERATIONS WITH AREA BEARING 7 BENZIE PEACHES -‐ OPERATIONS WITH AREA BEARING 10 GRAND TRAVERSE PEACHES -‐ OPERATIONS WITH AREA BEARING 17 MANISTEE PEACHES -‐ OPERATIONS WITH AREA BEARING 22 LAKE PEACHES -‐ OPERATIONS WITH AREA BEARING 3 105 OSCEOLA PEARS -‐ ACRES BEARING (D) BENZIE PEARS -‐ ACRES BEARING (D) GRAND TRAVERSE PEARS -‐ ACRES BEARING (D) MANISTEE PEARS -‐ ACRES BEARING (D) WEXFORD PEARS -‐ ACRES BEARING (D) LAKE PEARS -‐ ACRES BEARING (D) LEELANAU PEARS -‐ ACRES BEARING 41 MASON PEARS -‐ ACRES 91 132 MASON PEARS -‐ OPERATIONS WITH AREA BEARING 10 LEELANAU PEARS -‐ OPERATIONS WITH AREA BEARING 13 OSCEOLA PEARS -‐ OPERATIONS WITH AREA BEARING 8 BENZIE PEARS -‐ OPERATIONS WITH AREA BEARING 7 GRAND TRAVERSE PEARS -‐ OPERATIONS WITH AREA BEARING 7 MANISTEE PEARS -‐ OPERATIONS WITH AREA BEARING 6 WEXFORD PEARS -‐ OPERATIONS WITH AREA BEARING 3 LAKE PEARS -‐ OPERATIONS WITH AREA BEARING 3 57 LEELANAU PLUMS & PRUNES -‐ ACRES BEARING 145 MASON PLUMS & PRUNES -‐ ACRES 63 208 MASON PLUMS & PRUNES -‐ NUMBER OF OPERATIONS 7 LEELANAU PLUMS & PRUNES -‐ NUMBER OF OPERATIONS 22 29 LEELANAU RASPBERRIES -‐ ACRES 20 MASON RASPBERRIES -‐ ACRES (Z) 20 MASON RASPBERRIES -‐ OPERATIONS WITH AREA HARVESTED 3 LEELANAU RASPBERRIES -‐ OPERATIONS WITH AREA HARVESTED 20 23 LEELANAU STRAWBERRIES -‐ ACRES HARVESTED 33 MASON STRAWBERRIES -‐ ACRES HARVESTED (D) 33 MASON STRAWBERRIES -‐ NUMBER OF OPERATIONS 2 LEELANAU STRAWBERRIES -‐ NUMBER OF OPERATIONS 20 22
“D” Data withheld to avoid disclosing data for individual farms
“Z” Less than half of the unit shown
“X” Not applicable