Embed Size (px)
Citation preview

May 2014 | LOS aNGELES, ORaNGE, SaNTa BaRBaRa, & MONTEREy COUNTIES
luxury real estate market snapshots
marketintelligence
rivierafinancial.comrivierafinancial.com

r i v i e r a f i n a n c i a l . c o m
Riviera Financial dba Mortgage Capital Partners, Inc. NMLS#239902 California Real Estate #00931610
Navigating Solutions.At Riviera Financial, the business of real estate finance is about much more than loans. It is about offering diverse and competitive products; advising borrowers to make informed choices to support and protect their security; providing extraordinarily thorough customer care; and navigating solutions. Our customers expect and deserve the highest level of service and performance in all of their borrowing activities.
When it comes to dedicated, comprehensive real estate finance, Riviera Financial delivers.
Get the full lending experience at rivierafinancial.com or contact a loan professional by calling 424.203.1850
4 Locations to Serve You | Beverly Hills, Brentwood, Newport Beach & Pasadena

Reading the Report
“Each Micro Market area contains an analysis of current conditions and past trends. In order to take the most away from this
report, it is important to understand how to read each micro market.
The Data presents statistical information about past and current conditions, comparing the previous year’s month to the current
month. Each statistic is compiled from sales data during the month of the respective year. It is then analyzed by Percent Change,
which is calculated by taking Current Value minus Past Value and then divided by Past Value.
The Numbers is a compilation of important take-away statistics for each area to gain a quick understanding of market conditions.
Median Sales Price and Days on market are 12 month averages for the period ending in the current month. The values for
Properties for Sale and Shadow Inventory are presented in both text and graphical form to show the relationship of Shadow to
Active Inventory.
The Yearly Trend presents the Median Sales Prices for each month during the past year in graphical format to easily visualize the
changes and help identify any trends in sales for that micro market.
MEDIAN PRICE:
A value that separates the upper half
of prices from the lower half of prices.
It can be interpreted like an average,
however the extreme prices (high and
low) don’t hold undue influence.
AVERAGE PRICE PER SQUARE FOOT:
The price of each property divided by
their respective square footage then
averaged across all properties sold in
the area for a given time period.
PROPERTIES SOLD:
The number of property transactions
that closed and transferred ownership.
PROPERTIES PENDING SALE:
The number of properties that entered
escrow in preparation for sale.
PROPERTIES FOR SALE:
The number of properties on the
market and seeking buyers.
DAYS OF MARKET (PENDING SALE):
The number of days that properties
currently in escrow were on the market.
MONTH’S SUPPLY OF INVENTORY:
The number of months it would take
to sell all the properties listed for sale at
the current pace of sales and if no new
listings entered the market.
PERCENT UNDER CONTRACT:
The ratio of properties for sale to
properties pending sale.
AVERAGE MEDIAN PRICE FOR LAST 12:
The Average Median Price for the Last
12 Months is sales data from 12 months
ending in the identified month.

County: LOS ANGELES
Area: 4,752 SQ MILES
Founded: 1850
Los Angeles County
rivierafinancial.comrivierafinancial.com
Los Angeles County Macro
Bel Air - Holmby Hills
Beverly Center - Miracle Mile
Beverly Hills
Beverly Hills P.O.
Beverlywood
Brentwood
Cheviot Hills - Rancho Park
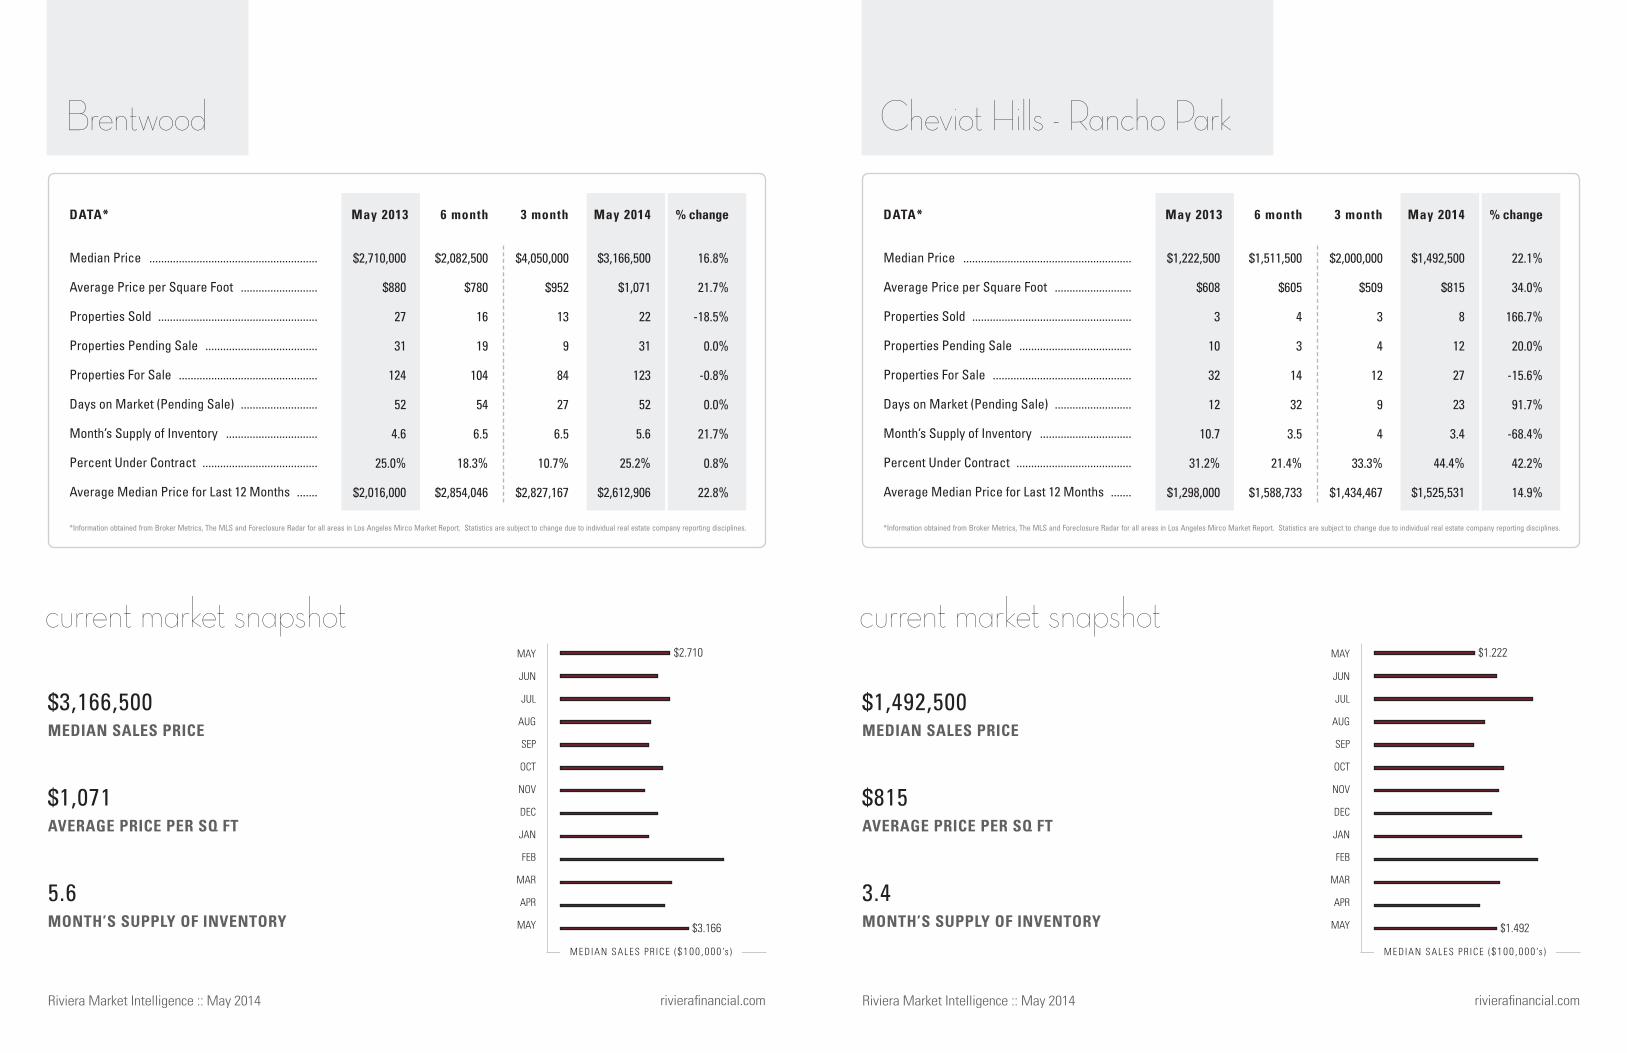
Culver City
Hancock Park - Wilshire
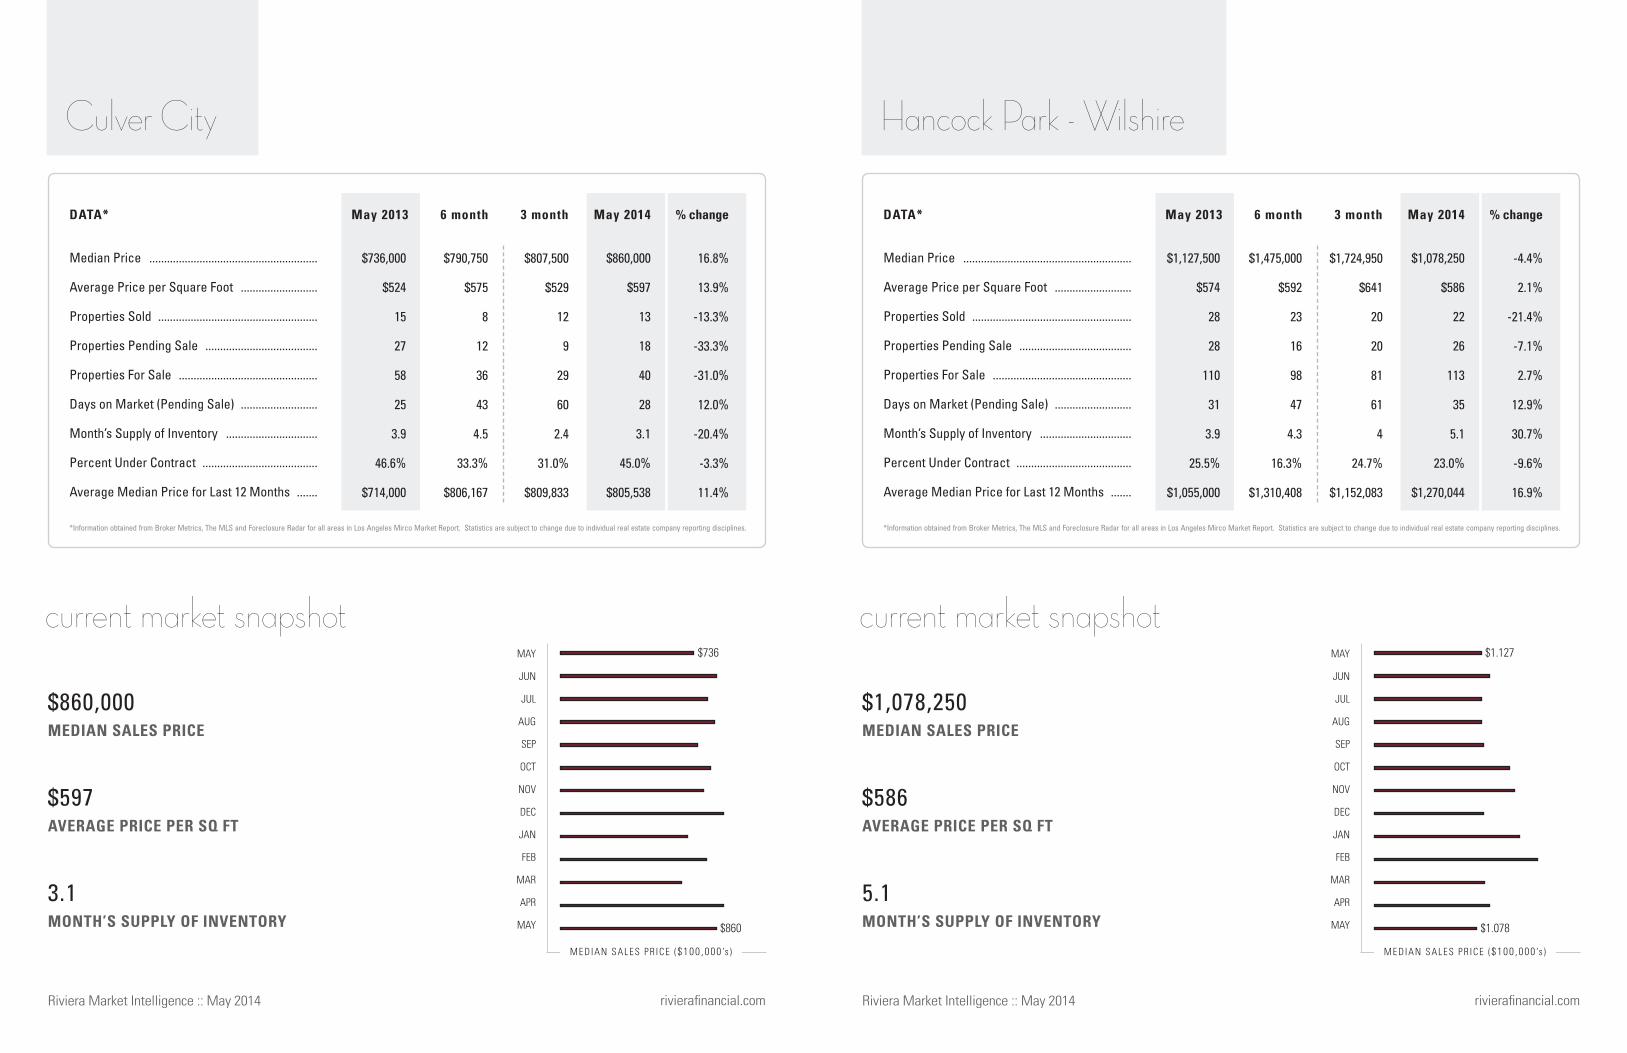
Hollywood
Hollywood Hills East
Laurel Canyon
Los Feliz
Malibu
Malibu Beach
Marina del Rey
Mid Los Angeles
Mid Wilshire
Pacific Palisades
Palms - Mar Vista
Playa del Rey
Playa Vista
Santa Monica
Sunset Strip - Hollywood Hills West
Venice
West Hollywood
West Los Angeles
Westchester
Westwood - Century City
South Bay Macro
El Segundo
Manhattan Beach
Palos Verdes Estates
Rancho Palos Verdes
Redondo Beach
Rolling Hills
Rolling Hills Estates
San Pedro
Torrance
San Fernando Macro
Burbank
Encino
Glendale
La Crescenta
North Hollywood
Shadow Hills
Sherman Oaks
Studio City
Sun Valley
Sunland - Tujunga
Tarzana
Toluca Lake
Valley Village
Woodland Hills
San Gabriel Valley Macro
Altadena
Arcadia
Duarte
Eagle Rock
La Canada Flintridge
Monrovia
Pasadena
San Gabriel
San Marino
Sierra Madre
South Pasadena
Riviera Market Intelligence :: May 2014Riviera Market Intelligence :: May 2014

MEDIAN SALES PRICE
AVERAGE PRICE PER SQ FT
MONTH’S SUPPLY OF INVENTORY
Median Price .........................................................
Average Price per Square Foot ..........................
Properties Sold ......................................................
Properties Pending Sale ......................................
Properties For Sale ...............................................
Days on Market (Pending Sale) ..........................
Month’s Supply of Inventory ...............................
Percent Under Contract .......................................
Average Median Price for Last 12 Months .......
May 2013 May 2013May 2014 May 20146 month 6 month3 month 3 month% change % changeDATA* DATA*
current market snapshot
M E DIAN SALE S P R ICE ($100 ,000 ’s ) MEDIAN SALES PR ICE ($100 ,000 ’s )
rivierafinancial.com rivierafinancial.com
MEDIAN SALES PRICE
AVERAGE PRICE PER SQ FT
MONTH’S SUPPLY OF INVENTORY
current market snapshot
Riviera Market Intelligence :: May 2014Riviera Market Intelligence :: May 2014
MAY
JUN
JUL
AUG
SEP
OCT
NOV
DEC
JAN
FEB
MAR
APR
MAY
7.5
$947
$3,408,794
*Information obtained from Broker Metrics, The MLS and Foreclosure Radar for all areas in Los Angeles Mirco Market Report. Statistics are subject to change due to individual real estate company reporting disciplines.
80.8%
14.5%
66.7%
-16.7%
-8.9%
-11.9%
-45.4%
-8.5%
26.1%
$1,645,000
$1,079
8
16
104
156
13
15.4%
$4,266,265
$2,249,500
$736
15
12
121
93
8.1
9.9%
$3,022,049
$3,408,794
$947
15
15
112
59
7.5
13.4%
$2,543,715
$1,885,000
$827
9
18
123
67
13.7
14.6%
$1,881,000
Bel-Air Holmby Hills
MAY
JUN
JUL
AUG
SEP
OCT
NOV
DEC
JAN
FEB
MAR
APR
MAY
*Information obtained from Broker Metrics, The MLS and Foreclosure Radar for all areas in Los Angeles Mirco Market Report. Statistics are subject to change due to individual real estate company reporting disciplines.
5.9%
11.2%
-1.4%
-9.2%
9.7%
0.0%
11.2%
-17.3%
21.3%
$886,250
$659
498
701
3,141
55
6.3
22.3%
$898,500
$837,500
$555
640
678
3,425
56
5.4
19.8%
$879,292
$900,500
$633
800
885
3,817
44
4.8
23.2%
$865,750
$850,000
$569
811
975
3,479
44
4.3
28.0%
$681,000
Los Angeles County
4.8
$633
$900,500
$850
$900
$1.885
$3.408

MEDIAN SALES PRICE
AVERAGE PRICE PER SQ FT
MONTH’S SUPPLY OF INVENTORY
Median Price .........................................................
Average Price per Square Foot ..........................
Properties Sold ......................................................
Properties Pending Sale ......................................
Properties For Sale ...............................................
Days on Market (Pending Sale) ..........................
Month’s Supply of Inventory ...............................
Percent Under Contract .......................................
Average Median Price for Last 12 Months .......
May 2013 May 2013May 2014 May 20146 month 6 month3 month 3 month% change % changeDATA* DATA*
current market snapshot
M E DIAN SALE S P R ICE ($100 ,000 ’s ) MEDIAN SALES PR ICE ($100 ,000 ’s )
rivierafinancial.com rivierafinancial.com
MEDIAN SALES PRICE
AVERAGE PRICE PER SQ FT
MONTH’S SUPPLY OF INVENTORY
current market snapshot
Riviera Market Intelligence :: May 2014Riviera Market Intelligence :: May 2014
MAY
JUN
JUL
AUG
SEP
OCT
NOV
DEC
JAN
FEB
MAR
APR
MAY
6.8
$1,456
$6,350,000
*Information obtained from Broker Metrics, The MLS and Foreclosure Radar for all areas in Los Angeles Mirco Market Report. Statistics are subject to change due to individual real estate company reporting disciplines.
38.8%
32.1%
-17.6%
-36.8%
-12.0%
-29.2%
6.8%
-28.2%
10.7%
$5,600,000
$1,410
10
18
89
64
8.9
20.2%
$5,052,333
$4,797,500
$1,225
10
12
98
137
9.8
12.2%
$5,362,567
$6,350,000
$1,456
14
12
95
51
6.8
12.6%
$4,894,262
$4,575,000
$1,102
17
19
108
72
6.4
17.6%
$4,372,000
Beverly Hills
MAY
JUN
JUL
AUG
SEP
OCT
NOV
DEC
JAN
FEB
MAR
APR
MAY
*Information obtained from Broker Metrics, The MLS and Foreclosure Radar for all areas in Los Angeles Mirco Market Report. Statistics are subject to change due to individual real estate company reporting disciplines.
10.1%
15.8%
-30.0%
-16.0%
0.0%
19.4%
42.9%
-16.0%
20.1%
$1,401,250
$626
12
16
66
34
5.5
24.2%
$1,215,000
$1,607,500
$588
8
13
57
51
7.1
22.8%
$1,263,542
$1,230,000
$632
21
21
67
37
3.2
31.3%
$1,259,996
$1,117,500
$546
30
25
67
31
2.2
37.3%
$1,007,000
Beverly Center - Miracle Mile
3.2
$632
$1,230,000
$1.117
$1.230
$4.575
$6.350

MEDIAN SALES PRICE
AVERAGE PRICE PER SQ FT
MONTH’S SUPPLY OF INVENTORY
Median Price .........................................................
Average Price per Square Foot ..........................
Properties Sold ......................................................
Properties Pending Sale ......................................
Properties For Sale ...............................................
Days on Market (Pending Sale) ..........................
Month’s Supply of Inventory ...............................
Percent Under Contract .......................................
Average Median Price for Last 12 Months .......
May 2013 May 2013May 2014 May 20146 month 6 month3 month 3 month% change % changeDATA* DATA*
current market snapshot
M E DIAN SALE S P R ICE ($100 ,000 ’s ) MEDIAN SALES PR ICE ($100 ,000 ’s )
rivierafinancial.com rivierafinancial.com
MEDIAN SALES PRICE
AVERAGE PRICE PER SQ FT
MONTH’S SUPPLY OF INVENTORY
current market snapshot
Riviera Market Intelligence :: May 2014Riviera Market Intelligence :: May 2014
MAY
JUN
JUL
AUG
SEP
OCT
NOV
DEC
JAN
FEB
MAR
APR
MAY
3.9
$542
$865,000
*Information obtained from Broker Metrics, The MLS and Foreclosure Radar for all areas in Los Angeles Mirco Market Report. Statistics are subject to change due to individual real estate company reporting disciplines.
1.5%
-4.2%
112.5%
31.2%
61.0%
-18.2%
-24.2%
-18.5%
17.1%
$846,000
$545
8
21
57
36
7.1
36.8%
$948,333
$849,000
$533
14
14
56
31
4
25.0%
$981,417
$865,000
$542
17
21
66
27
3.9
31.8%
$937,447
$852,310
$566
8
16
41
33
5.1
39.0%
$777,000
Beverlywood
MAY
JUN
JUL
AUG
SEP
OCT
NOV
DEC
JAN
FEB
MAR
APR
MAY
*Information obtained from Broker Metrics, The MLS and Foreclosure Radar for all areas in Los Angeles Mirco Market Report. Statistics are subject to change due to individual real estate company reporting disciplines.
-9.0%
-13.3%
0.0%
38.5%
20.4%
121.4%
20.4%
15.0%
8.3%
$2,225,000
$637
9
7
107
88
11.9
6.5%
$2,485,000
$1,679,000
$740
12
12
116
64
9.7
10.3%
$2,315,417
$2,065,000
$664
12
18
124
93
10.3
14.5%
$2,174,206
$2,268,000
$766
12
13
103
42
8.6
12.6%
$1,993,000
Beverly Hills- Post Office
10.3
$664
$2,065,000
$2.268
$2.065
$852
$865
MEDIAN SALES PRICE
AVERAGE PRICE PER SQ FT
MONTH’S SUPPLY OF INVENTORY
Median Price .........................................................
Average Price per Square Foot ..........................
Properties Sold ......................................................
Properties Pending Sale ......................................
Properties For Sale ...............................................
Days on Market (Pending Sale) ..........................
Month’s Supply of Inventory ...............................
Percent Under Contract .......................................
Average Median Price for Last 12 Months .......
May 2013 May 2013May 2014 May 20146 month 6 month3 month 3 month% change % changeDATA* DATA*
current market snapshot
M E DIAN SALE S P R ICE ($100 ,000 ’s ) MEDIAN SALES PR ICE ($100 ,000 ’s )
rivierafinancial.com rivierafinancial.com
MEDIAN SALES PRICE
AVERAGE PRICE PER SQ FT
MONTH’S SUPPLY OF INVENTORY
current market snapshot
Riviera Market Intelligence :: May 2014Riviera Market Intelligence :: May 2014
MAY
JUN
JUL
AUG
SEP
OCT
NOV
DEC
JAN
FEB
MAR
APR
MAY
3.4
$815
$1,492,500
*Information obtained from Broker Metrics, The MLS and Foreclosure Radar for all areas in Los Angeles Mirco Market Report. Statistics are subject to change due to individual real estate company reporting disciplines.
22.1%
34.0%
166.7%
20.0%
-15.6%
91.7%
-68.4%
42.2%
14.9%
$2,000,000
$509
3
4
12
9
4
33.3%
$1,434,467
$1,511,500
$605
4
3
14
32
3.5
21.4%
$1,588,733
$1,492,500
$815
8
12
27
23
3.4
44.4%
$1,525,531
$1,222,500
$608
3
10
32
12
10.7
31.2%
$1,298,000
Cheviot Hills - Rancho Park
MAY
JUN
JUL
AUG
SEP
OCT
NOV
DEC
JAN
FEB
MAR
APR
MAY
*Information obtained from Broker Metrics, The MLS and Foreclosure Radar for all areas in Los Angeles Mirco Market Report. Statistics are subject to change due to individual real estate company reporting disciplines.
16.8%
21.7%
-18.5%
0.0%
-0.8%
0.0%
21.7%
0.8%
22.8%
$4,050,000
$952
13
9
84
27
6.5
10.7%
$2,827,167
$2,082,500
$780
16
19
104
54
6.5
18.3%
$2,854,046
$3,166,500
$1,071
22
31
123
52
5.6
25.2%
$2,612,906
$2,710,000
$880
27
31
124
52
4.6
25.0%
$2,016,000
Brentwood
5.6
$1,071
$3,166,500
$2.710
$3.166
$1.222
$1.492
MEDIAN SALES PRICE
AVERAGE PRICE PER SQ FT
MONTH’S SUPPLY OF INVENTORY
Median Price .........................................................
Average Price per Square Foot ..........................
Properties Sold ......................................................
Properties Pending Sale ......................................
Properties For Sale ...............................................
Days on Market (Pending Sale) ..........................
Month’s Supply of Inventory ...............................
Percent Under Contract .......................................
Average Median Price for Last 12 Months .......
May 2013 May 2013May 2014 May 20146 month 6 month3 month 3 month% change % changeDATA* DATA*
current market snapshot
M E DIAN SALE S P R ICE ($100 ,000 ’s ) MEDIAN SALES PR ICE ($100 ,000 ’s )
rivierafinancial.com rivierafinancial.com
MEDIAN SALES PRICE
AVERAGE PRICE PER SQ FT
MONTH’S SUPPLY OF INVENTORY
current market snapshot
Riviera Market Intelligence :: May 2014Riviera Market Intelligence :: May 2014
MAY
JUN
JUL
AUG
SEP
OCT
NOV
DEC
JAN
FEB
MAR
APR
MAY
5.1
$586
$1,078,250
*Information obtained from Broker Metrics, The MLS and Foreclosure Radar for all areas in Los Angeles Mirco Market Report. Statistics are subject to change due to individual real estate company reporting disciplines.
-4.4%
2.1%
-21.4%
-7.1%
2.7%
12.9%
30.7%
-9.6%
16.9%
$1,724,950
$641
20
20
81
61
4
24.7%
$1,152,083
$1,475,000
$592
23
16
98
47
4.3
16.3%
$1,310,408
$1,078,250
$586
22
26
113
35
5.1
23.0%
$1,270,044
$1,127,500
$574
28
28
110
31
3.9
25.5%
$1,055,000
Hancock Park - Wilshire
MAY
JUN
JUL
AUG
SEP
OCT
NOV
DEC
JAN
FEB
MAR
APR
MAY
*Information obtained from Broker Metrics, The MLS and Foreclosure Radar for all areas in Los Angeles Mirco Market Report. Statistics are subject to change due to individual real estate company reporting disciplines.
16.8%
13.9%
-13.3%
-33.3%
-31.0%
12.0%
-20.4%
-3.3%
11.4%
$807,500
$529
12
9
29
60
2.4
31.0%
$809,833
$790,750
$575
8
12
36
43
4.5
33.3%
$806,167
$860,000
$597
13
18
40
28
3.1
45.0%
$805,538
$736,000
$524
15
27
58
25
3.9
46.6%
$714,000
Culver City
3.1
$597
$860,000
$736
$860
$1.127
$1.078
MEDIAN SALES PRICE
AVERAGE PRICE PER SQ FT
MONTH’S SUPPLY OF INVENTORY
Median Price .........................................................
Average Price per Square Foot ..........................
Properties Sold ......................................................
Properties Pending Sale ......................................
Properties For Sale ...............................................
Days on Market (Pending Sale) ..........................
Month’s Supply of Inventory ...............................
Percent Under Contract .......................................
Average Median Price for Last 12 Months .......
May 2013 May 2013May 2014 May 20146 month 6 month3 month 3 month% change % changeDATA* DATA*
current market snapshot
M E DIAN SALE S P R ICE ($100 ,000 ’s ) MEDIAN SALES PR ICE ($100 ,000 ’s )
rivierafinancial.com rivierafinancial.com
MEDIAN SALES PRICE
AVERAGE PRICE PER SQ FT
MONTH’S SUPPLY OF INVENTORY
current market snapshot
Riviera Market Intelligence :: May 2014Riviera Market Intelligence :: May 2014
MAY
JUN
JUL
AUG
SEP
OCT
NOV
DEC
JAN
FEB
MAR
APR
MAY
5.6
$549
$965,000
*Information obtained from Broker Metrics, The MLS and Foreclosure Radar for all areas in Los Angeles Mirco Market Report. Statistics are subject to change due to individual real estate company reporting disciplines.
6.6%
20.1%
-26.7%
-36.8%
-11.4%
-46.0%
53.0%
-28.7%
17.0%
$1,597,000
$583
7
7
46
73
6.6
15.2%
$1,039,500
$1,041,000
$518
10
4
45
29
11.2
8.9%
$1,259,417
$965,000
$549
11
12
62
34
5.6
19.4%
$1,137,758
$905,000
$457
15
19
70
63
3.7
27.1%
$944,000
Hollywood Hills East
MAY
JUN
JUL
AUG
SEP
OCT
NOV
DEC
JAN
FEB
MAR
APR
MAY
*Information obtained from Broker Metrics, The MLS and Foreclosure Radar for all areas in Los Angeles Mirco Market Report. Statistics are subject to change due to individual real estate company reporting disciplines.
116.5%
-1.1%
0.0%
66.7%
39.1%
138.5%
39.1%
19.8%
19.4%
$2,200,000
$639
1
4
17
99
17
23.5%
$920,833
$618,000
$423
5
3
16
58
3.2
18.8%
$1,090,400
$1,325,000
$553
5
10
32
62
6.4
31.2%
$810,958
$612,000
$559
5
6
23
26
4.6
26.1%
$654,000
Hollywood
6.4
$553
$1,325,000
$612
$1.325
$905
$965
MEDIAN SALES PRICE
AVERAGE PRICE PER SQ FT
MONTH’S SUPPLY OF INVENTORY
Median Price .........................................................
Average Price per Square Foot ..........................
Properties Sold ......................................................
Properties Pending Sale ......................................
Properties For Sale ...............................................
Days on Market (Pending Sale) ..........................
Month’s Supply of Inventory ...............................
Percent Under Contract .......................................
Average Median Price for Last 12 Months .......
May 2013 May 2013May 2014 May 20146 month 6 month3 month 3 month% change % changeDATA* DATA*
current market snapshot
M E DIAN SALE S P R ICE ($100 ,000 ’s ) MEDIAN SALES PR ICE ($100 ,000 ’s )
rivierafinancial.com rivierafinancial.com
MEDIAN SALES PRICE
AVERAGE PRICE PER SQ FT
MONTH’S SUPPLY OF INVENTORY
current market snapshot
Riviera Market Intelligence :: May 2014Riviera Market Intelligence :: May 2014
MAY
JUN
JUL
AUG
SEP
OCT
NOV
DEC
JAN
FEB
MAR
APR
MAY
4.5
$693
$1,180,000
*Information obtained from Broker Metrics, The MLS and Foreclosure Radar for all areas in Los Angeles Mirco Market Report. Statistics are subject to change due to individual real estate company reporting disciplines.
-1.7%
13.4%
0.0%
-30.0%
2.2%
0.0%
46.0%
-31.5%
19.2%
$1,150,000
$567
15
18
77
39
4.3
23.4%
$1,274,167
$1,097,000
$540
12
12
72
52
6
16.7%
$1,271,583
$1,180,000
$693
21
21
94
38
4.5
22.3%
$1,262,363
$1,200,000
$611
21
30
92
38
3.1
32.6%
$1,020,000
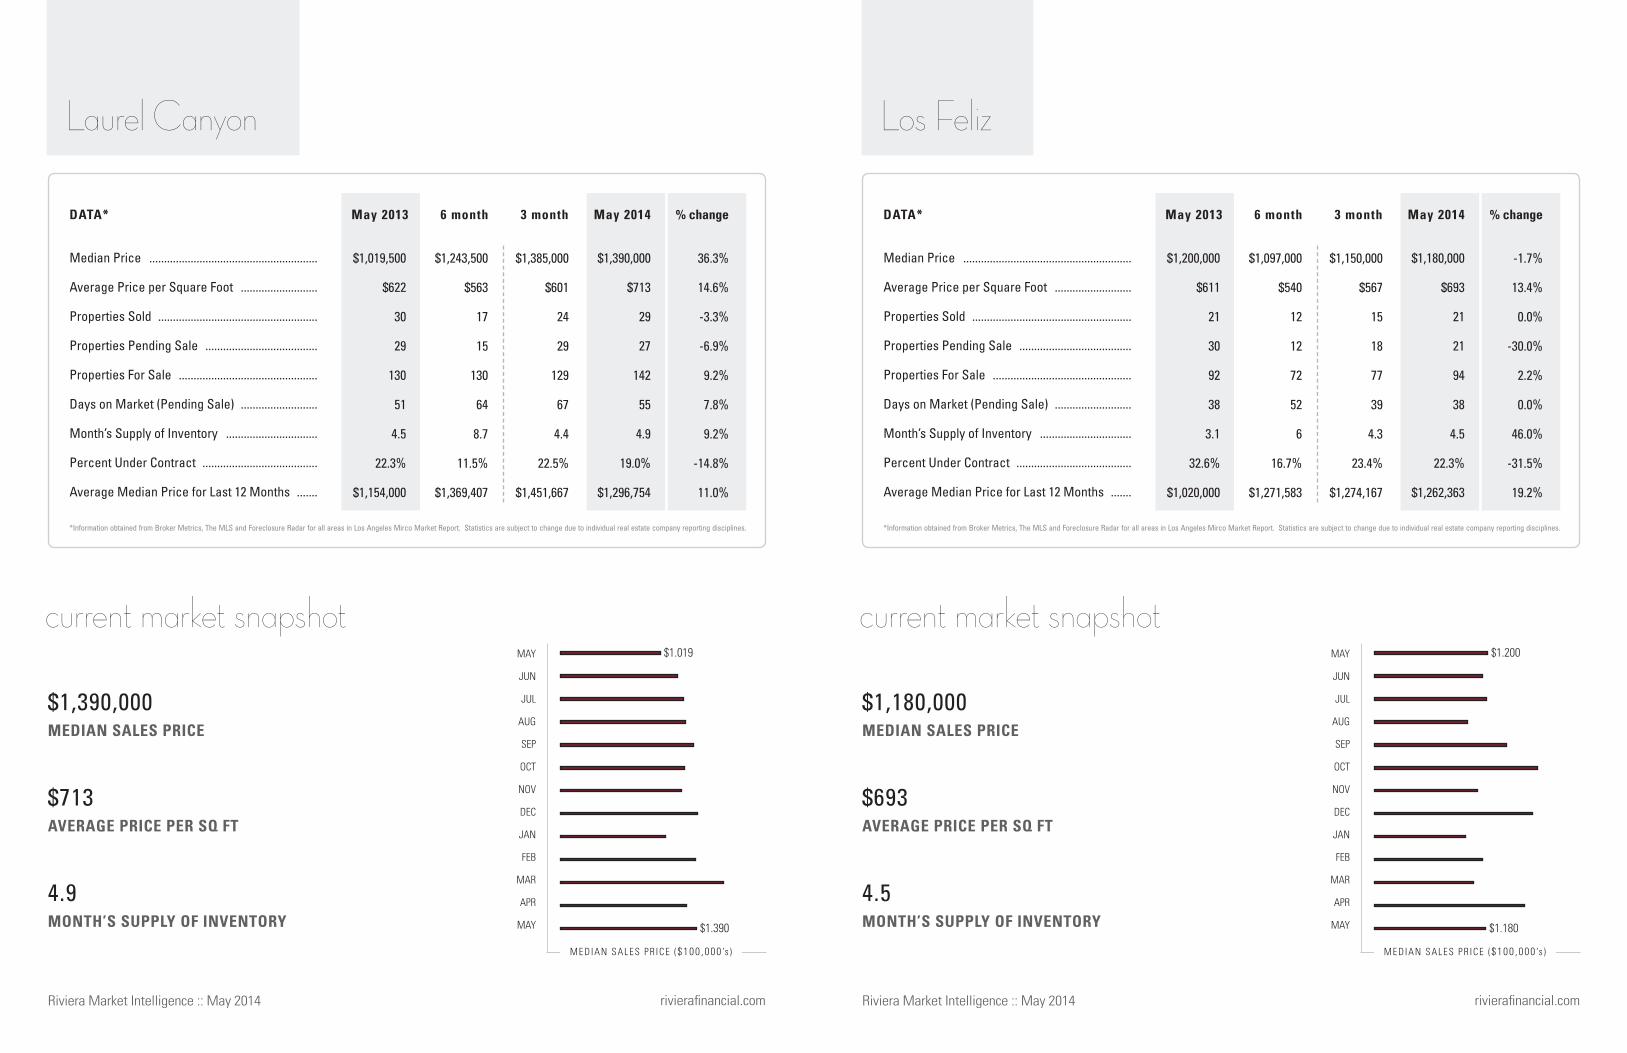
Los Feliz
MAY
JUN
JUL
AUG
SEP
OCT
NOV
DEC
JAN
FEB
MAR
APR
MAY
*Information obtained from Broker Metrics, The MLS and Foreclosure Radar for all areas in Los Angeles Mirco Market Report. Statistics are subject to change due to individual real estate company reporting disciplines.
36.3%
14.6%
-3.3%
-6.9%
9.2%
7.8%
9.2%
-14.8%
11.0%
$1,385,000
$601
24
29
129
67
4.4
22.5%
$1,451,667
$1,243,500
$563
17
15
130
64
8.7
11.5%
$1,369,407
$1,390,000
$713
29
27
142
55
4.9
19.0%
$1,296,754
$1,019,500
$622
30
29
130
51
4.5
22.3%
$1,154,000
Laurel Canyon
4.9
$713
$1,390,000
$1.019
$1.390
$1.200
$1.180

MEDIAN SALES PRICE
AVERAGE PRICE PER SQ FT
MONTH’S SUPPLY OF INVENTORY
Median Price .........................................................
Average Price per Square Foot ..........................
Properties Sold ......................................................
Properties Pending Sale ......................................
Properties For Sale ...............................................
Days on Market (Pending Sale) ..........................
Month’s Supply of Inventory ...............................
Percent Under Contract .......................................
Average Median Price for Last 12 Months .......
May 2013 May 2013May 2014 May 20146 month 6 month3 month 3 month% change % changeDATA* DATA*
current market snapshot
M E DIAN SALE S P R ICE ($100 ,000 ’s ) MEDIAN SALES PR ICE ($100 ,000 ’s )
rivierafinancial.com rivierafinancial.com
MEDIAN SALES PRICE
AVERAGE PRICE PER SQ FT
MONTH’S SUPPLY OF INVENTORY
current market snapshot
Riviera Market Intelligence :: May 2014Riviera Market Intelligence :: May 2014
MAY
JUN
JUL
AUG
SEP
OCT
NOV
DEC
JAN
FEB
MAR
APR
MAY
80
$2,422
$9,930,000
*Information obtained from Broker Metrics, The MLS and Foreclosure Radar for all areas in Los Angeles Mirco Market Report. Statistics are subject to change due to individual real estate company reporting disciplines.
341.3%
101.8%
-66.7%
-33.3%
-7.0%
-38.5%
179.1%
-28.3%
-3.9%
$6,662,500
$2,630
4
3
61
77
15.2
4.9%
$6,619,208
$5,075,000
$1,443
2
11
70
178
35
15.7%
$5,922,729
$9,930,000
$2,422
1
2
80
72
80
2.5%
$5,957,538
$2,250,000
$1,200
3
3
86
117
28.7
3.5%
$6,189,000
Malibu Beach
MAY
JUN
JUL
AUG
SEP
OCT
NOV
DEC
JAN
FEB
MAR
APR
MAY
*Information obtained from Broker Metrics, The MLS and Foreclosure Radar for all areas in Los Angeles Mirco Market Report. Statistics are subject to change due to individual real estate company reporting disciplines.
13.8%
4.2%
183.3%
-5.6%
-3.4%
-16.0%
-65.9%
-2.3%
18.2%
$2,091,959
$671
14
14
173
197
12.4
8.1%
$2,281,667
$1,837,500
$808
18
15
182
114
10.1
8.2%
$2,421,993
$2,775,000
$792
17
17
201
136
11.8
8.5%
$2,213,016
$2,437,500
$760
6
18
208
162
34.7
8.7%
$1,811,000
Malibu
11.8
$792
$2,775,000
$2.437
$2.775
$2.250
$9.930

MEDIAN SALES PRICE
AVERAGE PRICE PER SQ FT
MONTH’S SUPPLY OF INVENTORY
Median Price .........................................................
Average Price per Square Foot ..........................
Properties Sold ......................................................
Properties Pending Sale ......................................
Properties For Sale ...............................................
Days on Market (Pending Sale) ..........................
Month’s Supply of Inventory ...............................
Percent Under Contract .......................................
Average Median Price for Last 12 Months .......
May 2013 May 2013May 2014 May 20146 month 6 month3 month 3 month% change % changeDATA* DATA*
current market snapshot
M E DIAN SALE S P R ICE ($100 ,000 ’s ) MEDIAN SALES PR ICE ($100 ,000 ’s )
rivierafinancial.com rivierafinancial.com
MEDIAN SALES PRICE
AVERAGE PRICE PER SQ FT
MONTH’S SUPPLY OF INVENTORY
current market snapshot
Riviera Market Intelligence :: May 2014Riviera Market Intelligence :: May 2014
MAY
JUN
JUL
AUG
SEP
OCT
NOV
DEC
JAN
FEB
MAR
APR
MAY
4.2
$353
$625,000
*Information obtained from Broker Metrics, The MLS and Foreclosure Radar for all areas in Los Angeles Mirco Market Report. Statistics are subject to change due to individual real estate company reporting disciplines.
25.0%
14.2%
-43.5%
-25.0%
3.8%
39.3%
83.6%
-27.7%
28.4%
$461,562
$338
16
19
60
46
3.8
31.7%
$540,833
$490,000
$295
17
22
71
42
4.2
31.0%
$505,677
$625,000
$353
13
12
55
39
4.2
21.8%
$490,005
$500,000
$309
23
16
53
28
2.3
30.2%
$351,000
Mid Los Angeles
MAY
JUN
JUL
AUG
SEP
OCT
NOV
DEC
JAN
FEB
MAR
APR
MAY
*Information obtained from Broker Metrics, The MLS and Foreclosure Radar for all areas in Los Angeles Mirco Market Report. Statistics are subject to change due to individual real estate company reporting disciplines.
-14.5%
9.4%
350.0%
0.0%
21.1%
13.0%
-73.1%
-17.4%
6.3%
$1,715,000
$522
5
7
26
30
5.2
26.9%
$1,415,000
$1,900,000
$544
3
2
24
37
8
8.3%
$1,617,500
$1,735,000
$631
9
5
23
52
2.6
21.7%
$1,544,418
$2,030,178
$577
2
5
19
46
9.5
26.3%
$1,447,000
Marina Del Rey
2.6
$631
$1,735,000
$2.030
$1.735
$500
$625
MEDIAN SALES PRICE
AVERAGE PRICE PER SQ FT
MONTH’S SUPPLY OF INVENTORY
Median Price .........................................................
Average Price per Square Foot ..........................
Properties Sold ......................................................
Properties Pending Sale ......................................
Properties For Sale ...............................................
Days on Market (Pending Sale) ..........................
Month’s Supply of Inventory ...............................
Percent Under Contract .......................................
Average Median Price for Last 12 Months .......
May 2013 May 2013May 2014 May 20146 month 6 month3 month 3 month% change % changeDATA* DATA*
current market snapshot
M E DIAN SALE S P R ICE ($100 ,000 ’s ) MEDIAN SALES PR ICE ($100 ,000 ’s )
rivierafinancial.com rivierafinancial.com
MEDIAN SALES PRICE
AVERAGE PRICE PER SQ FT
MONTH’S SUPPLY OF INVENTORY
current market snapshot
Riviera Market Intelligence :: May 2014Riviera Market Intelligence :: May 2014
MAY
JUN
JUL
AUG
SEP
OCT
NOV
DEC
JAN
FEB
MAR
APR
MAY
4.5
$929
$3,010,000
*Information obtained from Broker Metrics, The MLS and Foreclosure Radar for all areas in Los Angeles Mirco Market Report. Statistics are subject to change due to individual real estate company reporting disciplines.
51.4%
36.6%
-14.7%
18.9%
-5.1%
-18.5%
11.3%
25.3%
14.1%
$2,935,000
$948
16
26
110
50
6.9
23.6%
$2,777,500
$2,275,000
$909
14
20
120
57
8.6
16.7%
$2,760,750
$3,010,000
$929
29
44
131
53
4.5
33.6%
$2,460,999
$1,987,500
$680
34
37
138
65
4.1
26.8%
$2,114,000
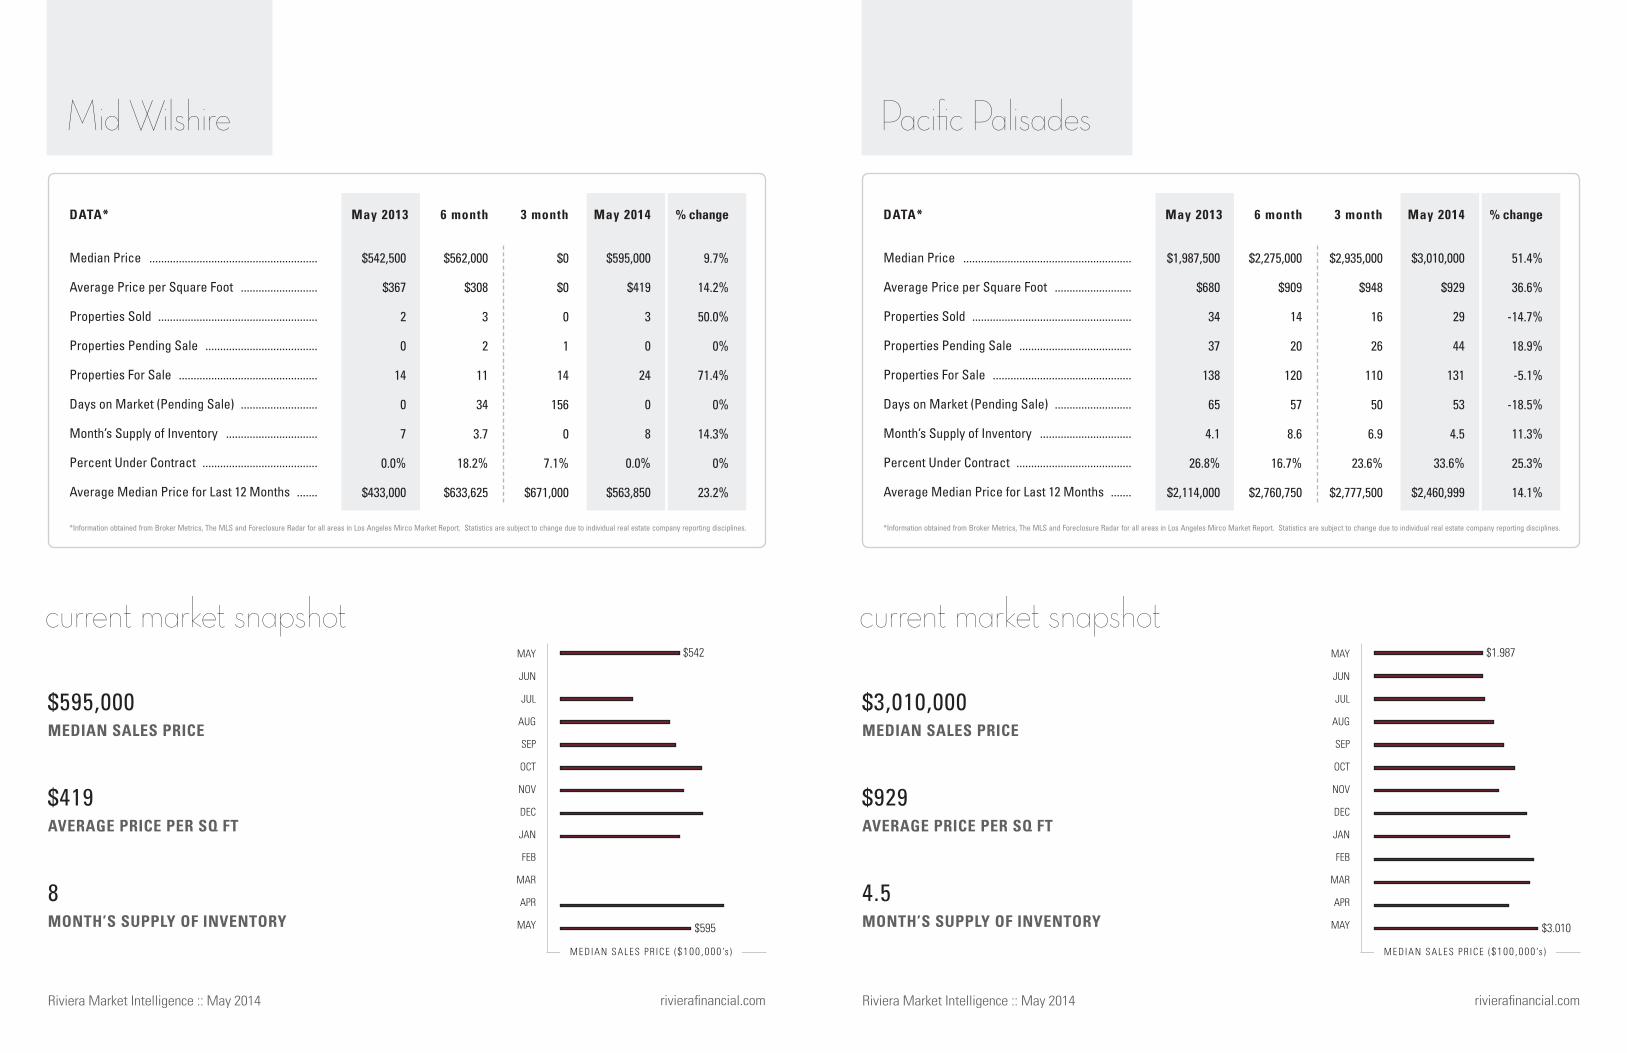
Pacific Palisades
MAY
JUN
JUL
AUG
SEP
OCT
NOV
DEC
JAN
FEB
MAR
APR
MAY
*Information obtained from Broker Metrics, The MLS and Foreclosure Radar for all areas in Los Angeles Mirco Market Report. Statistics are subject to change due to individual real estate company reporting disciplines.
9.7%
14.2%
50.0%
0%
71.4%
0%
14.3%
0%
23.2%
$0
$0
0
1
14
156
0
7.1%
$671,000
$562,000
$308
3
2
11
34
3.7
18.2%
$633,625
$595,000
$419
3
0
24
0
8
0.0%
$563,850
$542,500
$367
2
0
14
0
7
0.0%
$433,000
Mid Wilshire
8
$419
$595,000
$542
$595
$1.987
$3.010

MEDIAN SALES PRICE
AVERAGE PRICE PER SQ FT
MONTH’S SUPPLY OF INVENTORY
Median Price .........................................................
Average Price per Square Foot ..........................
Properties Sold ......................................................
Properties Pending Sale ......................................
Properties For Sale ...............................................
Days on Market (Pending Sale) ..........................
Month’s Supply of Inventory ...............................
Percent Under Contract .......................................
Average Median Price for Last 12 Months .......
May 2013 May 2013May 2014 May 20146 month 6 month3 month 3 month% change % changeDATA* DATA*
current market snapshot
M E DIAN SALE S P R ICE ($100 ,000 ’s ) MEDIAN SALES PR ICE ($100 ,000 ’s )
rivierafinancial.com rivierafinancial.com
MEDIAN SALES PRICE
AVERAGE PRICE PER SQ FT
MONTH’S SUPPLY OF INVENTORY
current market snapshot
Riviera Market Intelligence :: May 2014Riviera Market Intelligence :: May 2014
MAY
JUN
JUL
AUG
SEP
OCT
NOV
DEC
JAN
FEB
MAR
APR
MAY
5.3
$532
$1,268,000
*Information obtained from Broker Metrics, The MLS and Foreclosure Radar for all areas in Los Angeles Mirco Market Report. Statistics are subject to change due to individual real estate company reporting disciplines.
5.7%
16.9%
-40.0%
100.0%
33.3%
-27.7%
122.2%
50.0%
18.2%
$1,186,046
$491
4
3
11
39
2.8
27.3%
$1,432,000
$1,036,000
$707
5
1
11
49
2.2
9.1%
$1,263,293
$1,268,000
$532
3
4
16
34
5.3
25.0%
$1,275,789
$1,200,000
$455
5
2
12
47
2.4
16.7%
$1,044,000
Playa Del Rey
MAY
JUN
JUL
AUG
SEP
OCT
NOV
DEC
JAN
FEB
MAR
APR
MAY
*Information obtained from Broker Metrics, The MLS and Foreclosure Radar for all areas in Los Angeles Mirco Market Report. Statistics are subject to change due to individual real estate company reporting disciplines.
4.3%
18.7%
4.3%
-14.8%
0.0%
-19.2%
-4.2%
-14.8%
19.6%
$1,120,000
$580
13
20
56
38
4.3
35.7%
$1,142,167
$1,121,000
$617
26
21
58
40
2.2
36.2%
$1,059,417
$989,000
$661
24
23
74
21
3.1
31.1%
$1,003,581
$948,500
$557
23
27
74
26
3.2
36.5%
$807,000
Palms - Mar Vista
3.1
$661
$989,000
$948
$989
$1.200
$1.268

MEDIAN SALES PRICE
AVERAGE PRICE PER SQ FT
MONTH’S SUPPLY OF INVENTORY
Median Price .........................................................
Average Price per Square Foot ..........................
Properties Sold ......................................................
Properties Pending Sale ......................................
Properties For Sale ...............................................
Days on Market (Pending Sale) ..........................
Month’s Supply of Inventory ...............................
Percent Under Contract .......................................
Average Median Price for Last 12 Months .......
May 2013 May 2013May 2014 May 20146 month 6 month3 month 3 month% change % changeDATA* DATA*
current market snapshot
M E DIAN SALE S P R ICE ($100 ,000 ’s ) MEDIAN SALES PR ICE ($100 ,000 ’s )
rivierafinancial.com rivierafinancial.com
MEDIAN SALES PRICE
AVERAGE PRICE PER SQ FT
MONTH’S SUPPLY OF INVENTORY
current market snapshot
Riviera Market Intelligence :: May 2014Riviera Market Intelligence :: May 2014
MAY
JUN
JUL
AUG
SEP
OCT
NOV
DEC
JAN
FEB
MAR
APR
MAY
5.2
$945
$1,575,000
*Information obtained from Broker Metrics, The MLS and Foreclosure Radar for all areas in Los Angeles Mirco Market Report. Statistics are subject to change due to individual real estate company reporting disciplines.
-5.3%
20.5%
-39.3%
-11.5%
3.5%
15.0%
70.5%
-14.5%
0.1%
$1,896,000
$862
13
16
68
57
5.2
23.5%
$2,037,500
$2,085,750
$794
19
15
79
40
4.2
19.0%
$1,834,417
$1,575,000
$945
17
23
89
46
5.2
25.8%
$1,939,096
$1,662,500
$784
28
26
86
40
3.1
30.2%
$1,938,000
Santa Monica
MAY
JUN
JUL
AUG
SEP
OCT
NOV
DEC
JAN
FEB
MAR
APR
MAY
*Information obtained from Broker Metrics, The MLS and Foreclosure Radar for all areas in Los Angeles Mirco Market Report. Statistics are subject to change due to individual real estate company reporting disciplines.
-100.0%
-100.0%
-100.0%
0.0%
66.7%
-59.8%
0%
-40.0%
10.2%
$1,134,995
$478
1
1
9
440
9
11.1%
$1,000,000
$0
$0
0
1
5
6
0
20.0%
$1,198,332
$0
$0
0
1
10
33
0
10.0%
$1,272,356
$1,250,000
$450
1
1
6
82
6
16.7%
$1,143,000
Playa Vista
No sales
No sales
No sales
$1.250 $1.662
$1.575
MEDIAN SALES PRICE
AVERAGE PRICE PER SQ FT
MONTH’S SUPPLY OF INVENTORY
Median Price .........................................................
Average Price per Square Foot ..........................
Properties Sold ......................................................
Properties Pending Sale ......................................
Properties For Sale ...............................................
Days on Market (Pending Sale) ..........................
Month’s Supply of Inventory ...............................
Percent Under Contract .......................................
Average Median Price for Last 12 Months .......
May 2013 May 2013May 2014 May 20146 month 6 month3 month 3 month% change % changeDATA* DATA*
current market snapshot
M E DIAN SALE S P R ICE ($100 ,000 ’s ) MEDIAN SALES PR ICE ($100 ,000 ’s )
rivierafinancial.com rivierafinancial.com
MEDIAN SALES PRICE
AVERAGE PRICE PER SQ FT
MONTH’S SUPPLY OF INVENTORY
current market snapshot
Riviera Market Intelligence :: May 2014Riviera Market Intelligence :: May 2014
MAY
JUN
JUL
AUG
SEP
OCT
NOV
DEC
JAN
FEB
MAR
APR
MAY
2.4
$947
$1,427,500
*Information obtained from Broker Metrics, The MLS and Foreclosure Radar for all areas in Los Angeles Mirco Market Report. Statistics are subject to change due to individual real estate company reporting disciplines.
-5.6%
19.6%
62.5%
-36.7%
-20.5%
-23.1%
-51.1%
-20.3%
14.1%
$1,425,000
$1,030
9
15
57
24
6.3
26.3%
$1,610,933
$1,175,000
$878
17
12
53
75
3.1
22.6%
$1,520,050
$1,427,500
$947
26
19
62
30
2.4
30.6%
$1,434,062
$1,512,500
$792
16
30
78
39
4.9
38.5%
$1,257,000
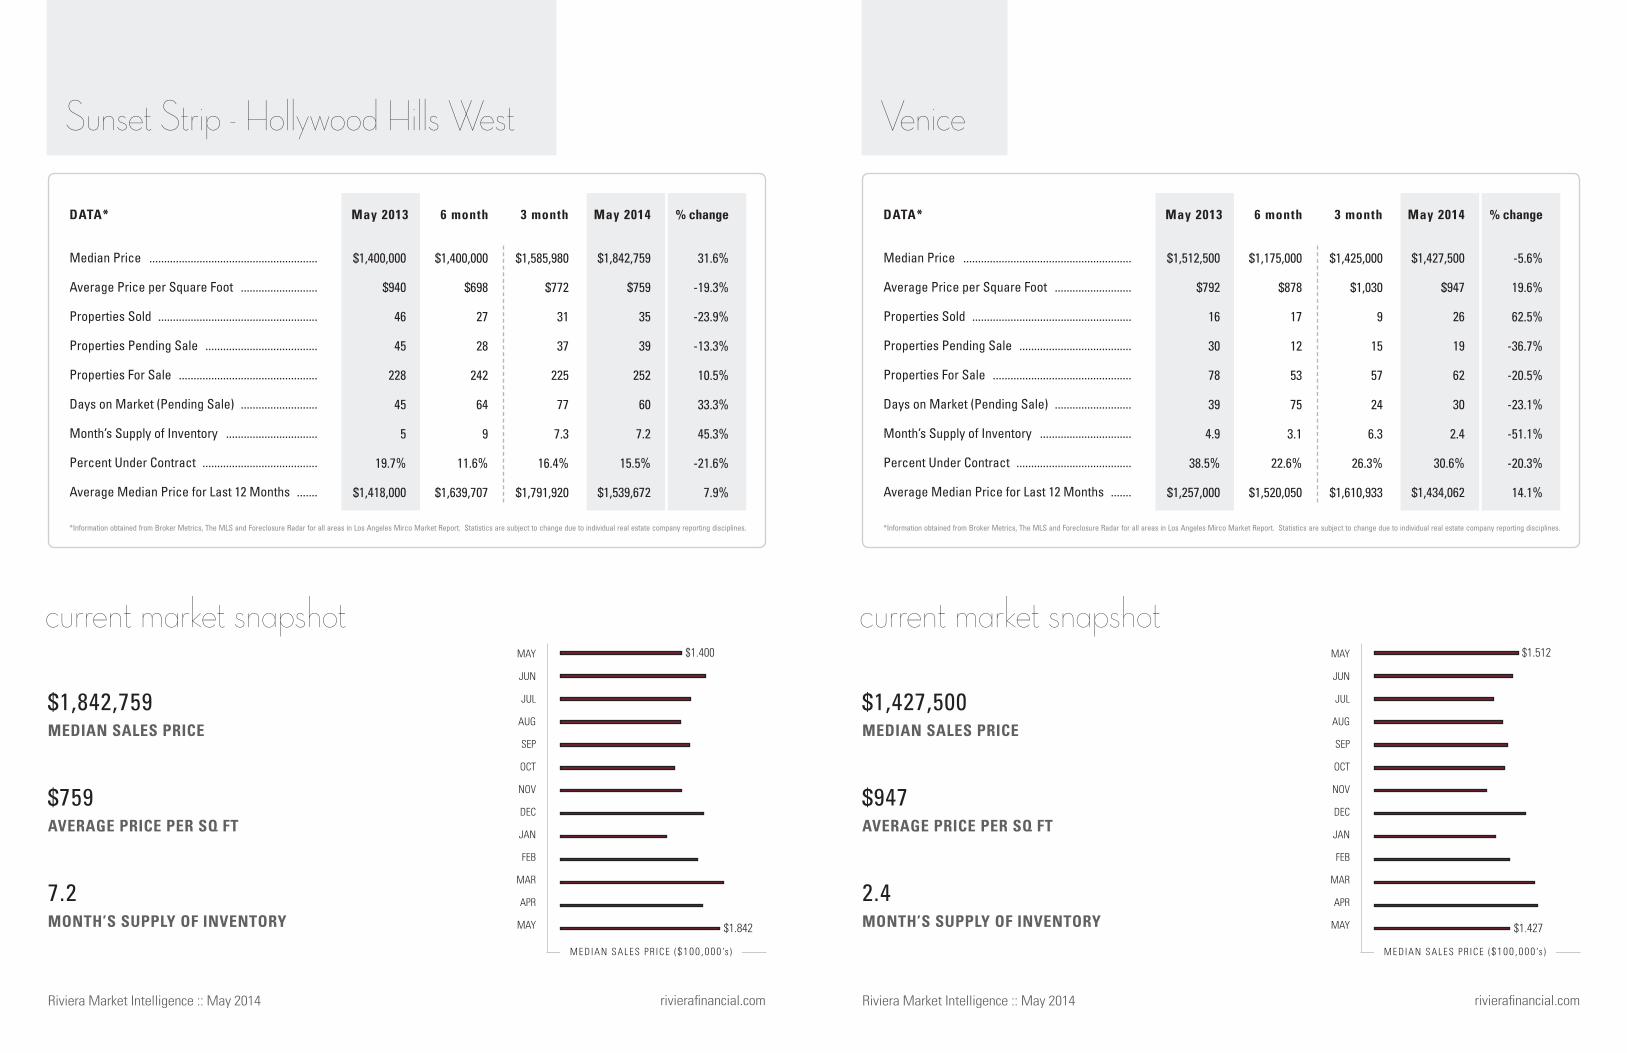
Venice
MAY
JUN
JUL
AUG
SEP
OCT
NOV
DEC
JAN
FEB
MAR
APR
MAY
*Information obtained from Broker Metrics, The MLS and Foreclosure Radar for all areas in Los Angeles Mirco Market Report. Statistics are subject to change due to individual real estate company reporting disciplines.
31.6%
-19.3%
-23.9%
-13.3%
10.5%
33.3%
45.3%
-21.6%
7.9%
$1,585,980
$772
31
37
225
77
7.3
16.4%
$1,791,920
$1,400,000
$698
27
28
242
64
9
11.6%
$1,639,707
$1,842,759
$759
35
39
252
60
7.2
15.5%
$1,539,672
$1,400,000
$940
46
45
228
45
5
19.7%
$1,418,000
Sunset Strip - Hollywood Hills West
7.2
$759
$1,842,759
$1.400
$1.842
$1.512
$1.427
MEDIAN SALES PRICE
AVERAGE PRICE PER SQ FT
MONTH’S SUPPLY OF INVENTORY
Median Price .........................................................
Average Price per Square Foot ..........................
Properties Sold ......................................................
Properties Pending Sale ......................................
Properties For Sale ...............................................
Days on Market (Pending Sale) ..........................
Month’s Supply of Inventory ...............................
Percent Under Contract .......................................
Average Median Price for Last 12 Months .......
May 2013 May 2013May 2014 May 20146 month 6 month3 month 3 month% change % changeDATA* DATA*
current market snapshot
M E DIAN SALE S P R ICE ($100 ,000 ’s ) MEDIAN SALES PR ICE ($100 ,000 ’s )
rivierafinancial.com rivierafinancial.com
MEDIAN SALES PRICE
AVERAGE PRICE PER SQ FT
MONTH’S SUPPLY OF INVENTORY
current market snapshot
Riviera Market Intelligence :: May 2014Riviera Market Intelligence :: May 2014
MAY
JUN
JUL
AUG
SEP
OCT
NOV
DEC
JAN
FEB
MAR
APR
MAY
4.2
$582
$908,250
*Information obtained from Broker Metrics, The MLS and Foreclosure Radar for all areas in Los Angeles Mirco Market Report. Statistics are subject to change due to individual real estate company reporting disciplines.
4.7%
-4.3%
33.3%
100.0%
161.5%
116.7%
96.2%
-23.5%
25.4%
$788,000
$641
5
4
14
13
2.8
28.6%
$892,250
$845,000
$692
7
7
20
50
2.9
35.0%
$850,875
$908,250
$582
8
10
34
26
4.2
29.4%
$836,256
$867,425
$608
6
5
13
12
2.2
38.5%
$667,000
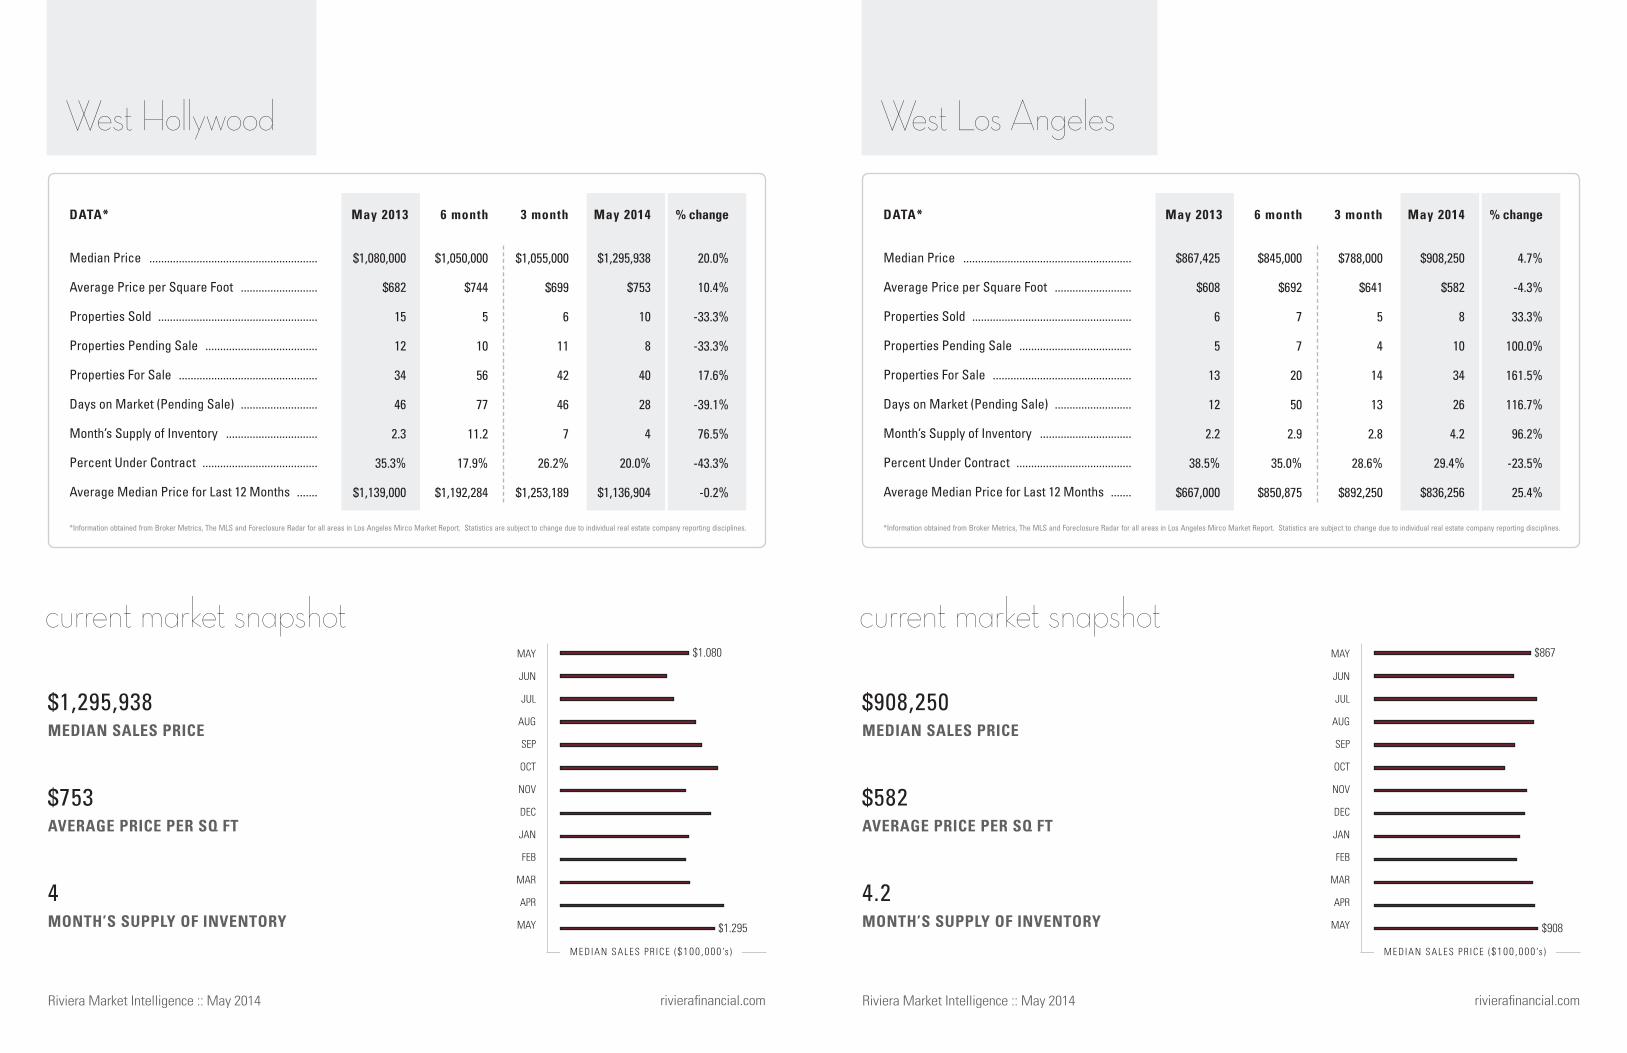
West Los Angeles
MAY
JUN
JUL
AUG
SEP
OCT
NOV
DEC
JAN
FEB
MAR
APR
MAY
*Information obtained from Broker Metrics, The MLS and Foreclosure Radar for all areas in Los Angeles Mirco Market Report. Statistics are subject to change due to individual real estate company reporting disciplines.
20.0%
10.4%
-33.3%
-33.3%
17.6%
-39.1%
76.5%
-43.3%
-0.2%
$1,055,000
$699
6
11
42
46
7
26.2%
$1,253,189
$1,050,000
$744
5
10
56
77
11.2
17.9%
$1,192,284
$1,295,938
$753
10
8
40
28
4
20.0%
$1,136,904
$1,080,000
$682
15
12
34
46
2.3
35.3%
$1,139,000
West Hollywood
4
$753
$1,295,938
$1.080
$1.295
$867
$908
MEDIAN SALES PRICE
AVERAGE PRICE PER SQ FT
MONTH’S SUPPLY OF INVENTORY
Median Price .........................................................
Average Price per Square Foot ..........................
Properties Sold ......................................................
Properties Pending Sale ......................................
Properties For Sale ...............................................
Days on Market (Pending Sale) ..........................
Month’s Supply of Inventory ...............................
Percent Under Contract .......................................
Average Median Price for Last 12 Months .......
May 2013 May 2013May 2014 May 20146 month 6 month3 month 3 month% change % changeDATA* DATA*
current market snapshot
M E DIAN SALE S P R ICE ($100 ,000 ’s ) MEDIAN SALES PR ICE ($100 ,000 ’s )
rivierafinancial.com rivierafinancial.com
MEDIAN SALES PRICE
AVERAGE PRICE PER SQ FT
MONTH’S SUPPLY OF INVENTORY
current market snapshot
Riviera Market Intelligence :: May 2014Riviera Market Intelligence :: May 2014
MAY
JUN
JUL
AUG
SEP
OCT
NOV
DEC
JAN
FEB
MAR
APR
MAY
4.6
$760
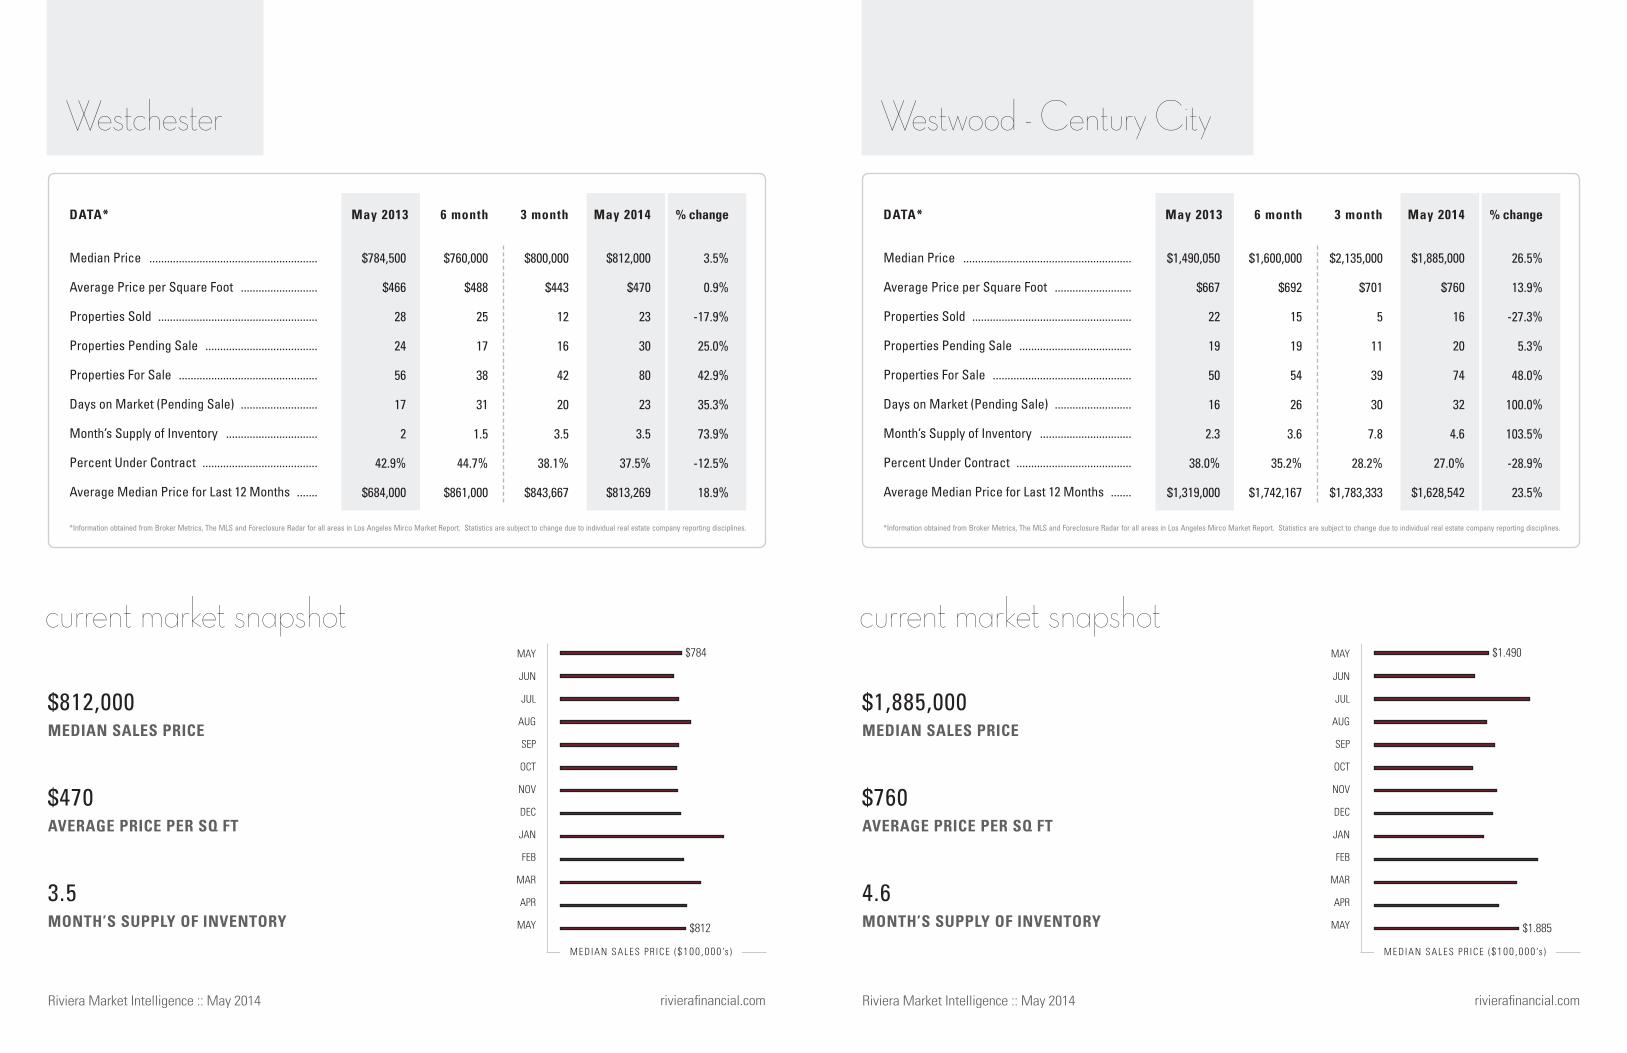
$1,885,000
*Information obtained from Broker Metrics, The MLS and Foreclosure Radar for all areas in Los Angeles Mirco Market Report. Statistics are subject to change due to individual real estate company reporting disciplines.
26.5%
13.9%
-27.3%
5.3%
48.0%
100.0%
103.5%
-28.9%
23.5%
$2,135,000
$701
5
11
39
30
7.8
28.2%
$1,783,333
$1,600,000
$692
15
19
54
26
3.6
35.2%
$1,742,167
$1,885,000
$760
16
20
74
32
4.6
27.0%
$1,628,542
$1,490,050
$667
22
19
50
16
2.3
38.0%
$1,319,000
Westwood - Century City
MAY
JUN
JUL
AUG
SEP
OCT
NOV
DEC
JAN
FEB
MAR
APR
MAY
*Information obtained from Broker Metrics, The MLS and Foreclosure Radar for all areas in Los Angeles Mirco Market Report. Statistics are subject to change due to individual real estate company reporting disciplines.
3.5%
0.9%
-17.9%
25.0%
42.9%
35.3%
73.9%
-12.5%
18.9%
$800,000
$443
12
16
42
20
3.5
38.1%
$843,667
$760,000
$488
25
17
38
31
1.5
44.7%
$861,000
$812,000
$470
23
30
80
23
3.5
37.5%
$813,269
$784,500
$466
28
24
56
17
2
42.9%
$684,000
Westchester
3.5
$470
$812,000
$784
$812
$1.490
$1.885

MEDIAN SALES PRICE
AVERAGE PRICE PER SQ FT
MONTH’S SUPPLY OF INVENTORY
Median Price .........................................................
Average Price per Square Foot ..........................
Properties Sold ......................................................
Properties Pending Sale ......................................
Properties For Sale ...............................................
Days on Market (Pending Sale) ..........................
Month’s Supply of Inventory ...............................
Percent Under Contract .......................................
Average Median Price for Last 12 Months .......
May 2013 May 2013May 2014 May 20146 month 6 month3 month 3 month% change % changeDATA* DATA*
current market snapshot
M E DIAN SALE S P R ICE ($100 ,000 ’s ) MEDIAN SALES PR ICE ($100 ,000 ’s )
rivierafinancial.com rivierafinancial.com
MEDIAN SALES PRICE
AVERAGE PRICE PER SQ FT
MONTH’S SUPPLY OF INVENTORY
current market snapshot
Riviera Market Intelligence :: May 2014Riviera Market Intelligence :: May 2014
MAY
JUN
JUL
AUG
SEP
OCT
NOV
DEC
JAN
FEB
MAR
APR
MAY
2.9
$430
$898,000
*Information obtained from Broker Metrics, The MLS and Foreclosure Radar for all areas in Los Angeles Mirco Market Report. Statistics are subject to change due to individual real estate company reporting disciplines.
3.8%
-10.4%
14.3%
0.0%
-20.7%
-43.8%
-30.6%
26.1%
5.5%
$952,000
$572
1
7
19
69
19
36.8%
$858,500
$820,000
$521
3
4
13
61
4.3
30.8%
$864,375
$898,000
$430
8
10
23
18
2.9
43.5%
$867,365
$865,000
$480
7
10
29
32
4.1
34.5%
$822,000
El Segundo
MAY
JUN
JUL
AUG
SEP
OCT
NOV
DEC
JAN
FEB
MAR
APR
MAY
*Information obtained from Broker Metrics, The MLS and Foreclosure Radar for all areas in Los Angeles Mirco Market Report. Statistics are subject to change due to individual real estate company reporting disciplines.
6.9%
7.8%
-10.6%
-14.2%
0.6%
10.1%
12.5%
-14.7%
10.9%
$1,072,875
$566
117
174
549
60
4.7
31.7%
$1,217,478
$1,082,625
$518
154
179
593
83
3.9
30.2%
$1,244,093
$1,299,398
$538
202
211
683
57
3.4
30.9%
$1,305,188
$1,215,278
$499
226
246
679
52
3
36.2%
$1,176,778
South Bay Macro Market
3.4
$538
$1,299,398
$1.215
$1.299
$865
$898

MEDIAN SALES PRICE
AVERAGE PRICE PER SQ FT
MONTH’S SUPPLY OF INVENTORY
Median Price .........................................................
Average Price per Square Foot ..........................
Properties Sold ......................................................
Properties Pending Sale ......................................
Properties For Sale ...............................................
Days on Market (Pending Sale) ..........................
Month’s Supply of Inventory ...............................
Percent Under Contract .......................................
Average Median Price for Last 12 Months .......
May 2013 May 2013May 2014 May 20146 month 6 month3 month 3 month% change % changeDATA* DATA*
current market snapshot
M E DIAN SALE S P R ICE ($100 ,000 ’s ) MEDIAN SALES PR ICE ($100 ,000 ’s )
rivierafinancial.com rivierafinancial.com
MEDIAN SALES PRICE
AVERAGE PRICE PER SQ FT
MONTH’S SUPPLY OF INVENTORY
current market snapshot
Riviera Market Intelligence :: May 2014Riviera Market Intelligence :: May 2014
MAY
JUN
JUL
AUG
SEP
OCT
NOV
DEC
JAN
FEB
MAR
APR
MAY
6.4
$630
$1,440,000
*Information obtained from Broker Metrics, The MLS and Foreclosure Radar for all areas in Los Angeles Mirco Market Report. Statistics are subject to change due to individual real estate company reporting disciplines.
-10.0%
12.5%
-26.7%
-18.8%
0.0%
16.2%
36.4%
-18.8%
-2.4%
$1,387,500
$616
8
11
54
64
6.8
20.4%
$1,569,167
$1,500,000
$563
13
11
52
121
4
21.2%
$1,578,000
$1,440,000
$630
11
13
70
43
6.4
18.6%
$1,549,000
$1,600,000
$560
15
16
70
37
4.7
22.9%
$1,587,000
Palos Verdes Estates
MAY
JUN
JUL
AUG
SEP
OCT
NOV
DEC
JAN
FEB
MAR
APR
MAY
*Information obtained from Broker Metrics, The MLS and Foreclosure Radar for all areas in Los Angeles Mirco Market Report. Statistics are subject to change due to individual real estate company reporting disciplines.
-4.0%
12.0%
-5.1%
62.1%
14.9%
26.7%
21.2%
41.0%
15.4%
$1,900,000
$1,025
21
28
67
24
3.2
41.8%
$1,856,500
$1,989,500
$762
20
23
59
55
3
39.0%
$1,873,167
$2,015,000
$800
37
47
100
38
2.7
47.0%
$1,833,308
$2,100,000
$714
39
29
87
30
2.2
33.3%
$1,589,000
Manhattan Beach
2.7
$800
$2,015,000
$2.100
$2.015
$1.600
$1.440
MEDIAN SALES PRICE
AVERAGE PRICE PER SQ FT
MONTH’S SUPPLY OF INVENTORY
Median Price .........................................................
Average Price per Square Foot ..........................
Properties Sold ......................................................
Properties Pending Sale ......................................
Properties For Sale ...............................................
Days on Market (Pending Sale) ..........................
Month’s Supply of Inventory ...............................
Percent Under Contract .......................................
Average Median Price for Last 12 Months .......
May 2013 May 2013May 2014 May 20146 month 6 month3 month 3 month% change % changeDATA* DATA*
current market snapshot
M E DIAN SALE S P R ICE ($100 ,000 ’s ) MEDIAN SALES PR ICE ($100 ,000 ’s )
rivierafinancial.com rivierafinancial.com
MEDIAN SALES PRICE
AVERAGE PRICE PER SQ FT
MONTH’S SUPPLY OF INVENTORY
current market snapshot
Riviera Market Intelligence :: May 2014Riviera Market Intelligence :: May 2014
MAY
JUN
JUL
AUG
SEP
OCT
NOV
DEC
JAN
FEB
MAR
APR
MAY
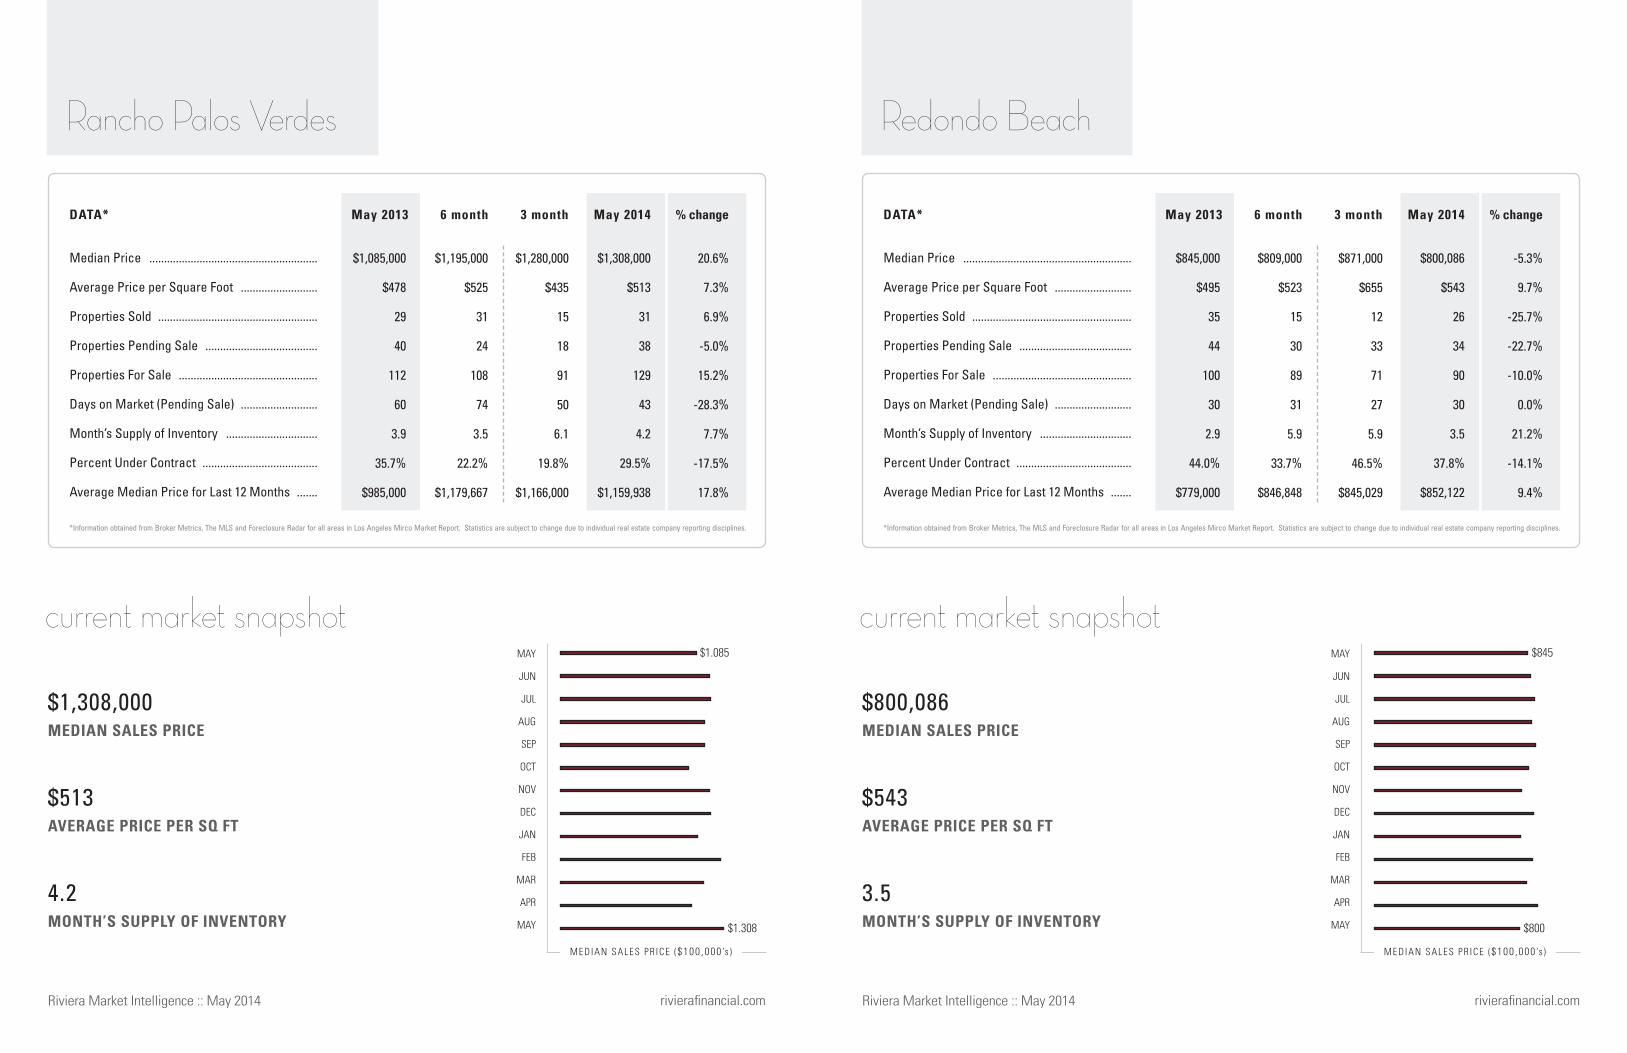
3.5
$543
$800,086
*Information obtained from Broker Metrics, The MLS and Foreclosure Radar for all areas in Los Angeles Mirco Market Report. Statistics are subject to change due to individual real estate company reporting disciplines.
-5.3%
9.7%
-25.7%
-22.7%
-10.0%
0.0%
21.2%
-14.1%
9.4%
$871,000
$655
12
33
71
27
5.9
46.5%
$845,029
$809,000
$523
15
30
89
31
5.9
33.7%
$846,848
$800,086
$543
26
34
90
30
3.5
37.8%
$852,122
$845,000
$495
35
44
100
30
2.9
44.0%
$779,000
Redondo Beach
MAY
JUN
JUL
AUG
SEP
OCT
NOV
DEC
JAN
FEB
MAR
APR
MAY
*Information obtained from Broker Metrics, The MLS and Foreclosure Radar for all areas in Los Angeles Mirco Market Report. Statistics are subject to change due to individual real estate company reporting disciplines.
20.6%
7.3%
6.9%
-5.0%
15.2%
-28.3%
7.7%
-17.5%
17.8%
$1,280,000
$435
15
18
91
50
6.1
19.8%
$1,166,000
$1,195,000
$525
31
24
108
74
3.5
22.2%
$1,179,667
$1,308,000
$513
31
38
129
43
4.2
29.5%
$1,159,938
$1,085,000
$478
29
40
112
60
3.9
35.7%
$985,000
Rancho Palos Verdes
4.2
$513
$1,308,000
$1.085
$1.308
$845
$800
MEDIAN SALES PRICE
AVERAGE PRICE PER SQ FT
MONTH’S SUPPLY OF INVENTORY
Median Price .........................................................
Average Price per Square Foot ..........................
Properties Sold ......................................................
Properties Pending Sale ......................................
Properties For Sale ...............................................
Days on Market (Pending Sale) ..........................
Month’s Supply of Inventory ...............................
Percent Under Contract .......................................
Average Median Price for Last 12 Months .......
May 2013 May 2013May 2014 May 20146 month 6 month3 month 3 month% change % changeDATA* DATA*
current market snapshot
M E DIAN SALE S P R ICE ($100 ,000 ’s ) MEDIAN SALES PR ICE ($100 ,000 ’s )
rivierafinancial.com rivierafinancial.com
MEDIAN SALES PRICE
AVERAGE PRICE PER SQ FT
MONTH’S SUPPLY OF INVENTORY
current market snapshot
Riviera Market Intelligence :: May 2014Riviera Market Intelligence :: May 2014
MAY
JUN
JUL
AUG
SEP
OCT
NOV
DEC
JAN
FEB
MAR
APR
MAY
1.9
$542
$1,580,000
*Information obtained from Broker Metrics, The MLS and Foreclosure Radar for all areas in Los Angeles Mirco Market Report. Statistics are subject to change due to individual real estate company reporting disciplines.
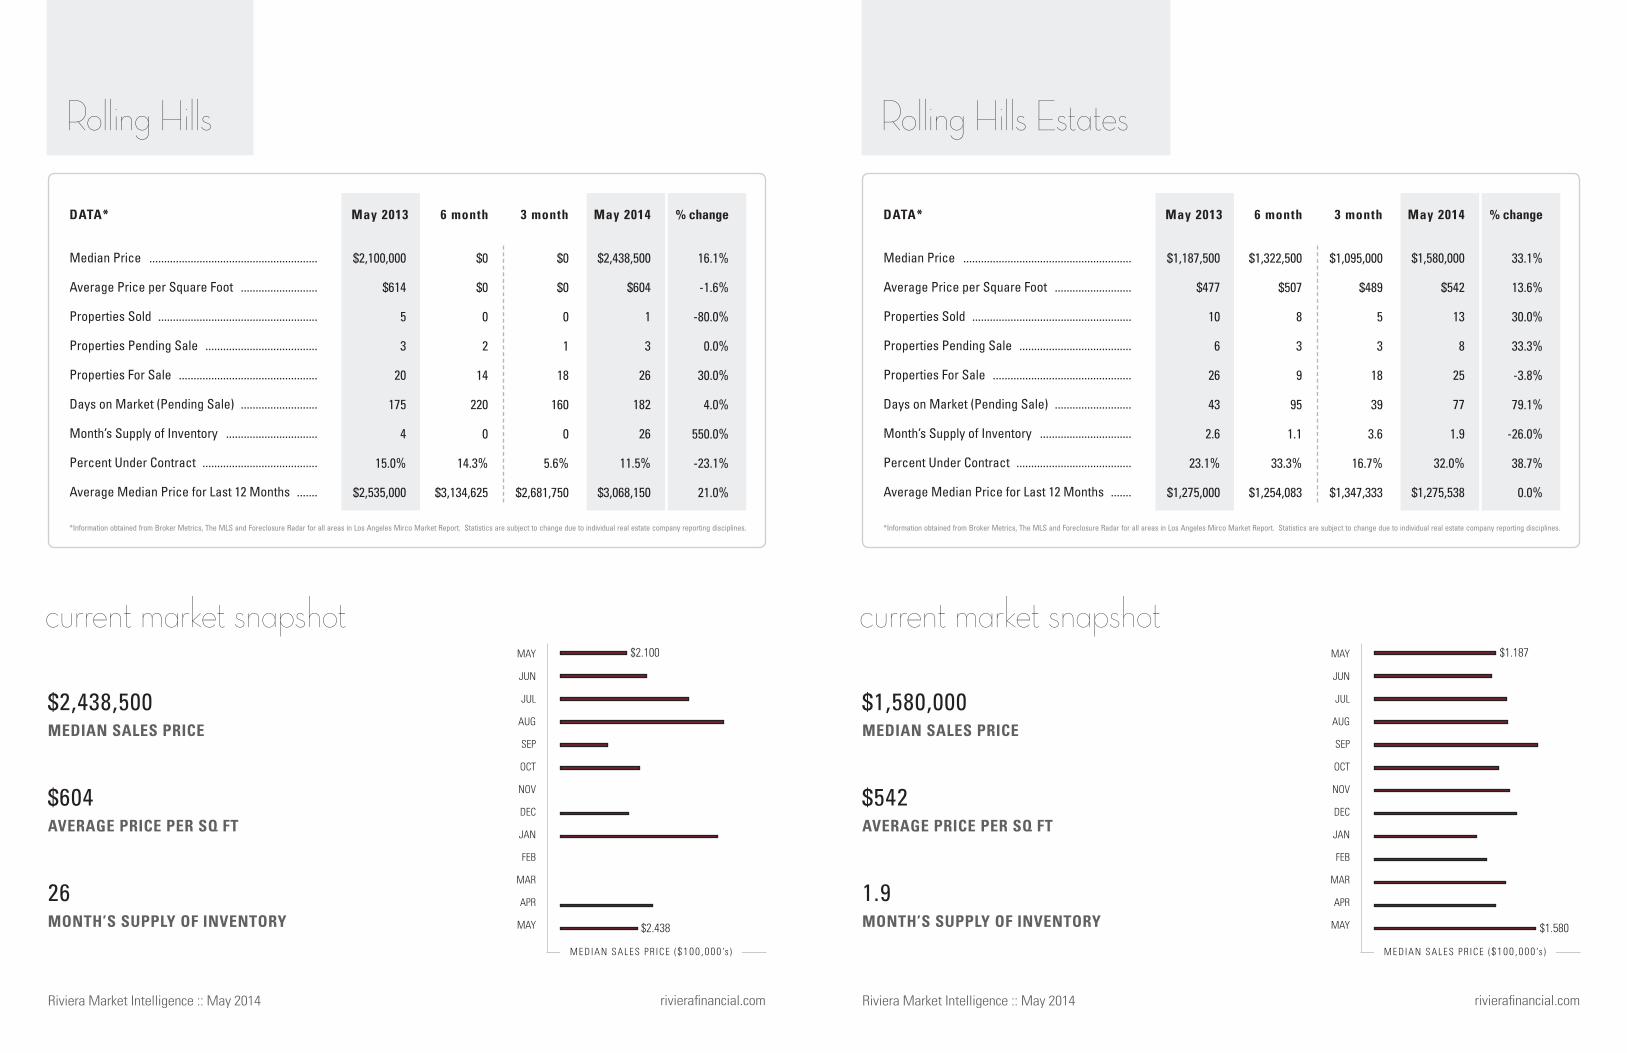
33.1%
13.6%
30.0%
33.3%
-3.8%
79.1%
-26.0%
38.7%
0.0%
$1,095,000
$489
5
3
18
39
3.6
16.7%
$1,347,333
$1,322,500
$507
8
3
9
95
1.1
33.3%
$1,254,083
$1,580,000
$542
13
8
25
77
1.9
32.0%
$1,275,538
$1,187,500
$477
10
6
26
43
2.6
23.1%
$1,275,000
Rolling Hills Estates
MAY
JUN
JUL
AUG
SEP
OCT
NOV
DEC
JAN
FEB
MAR
APR
MAY
*Information obtained from Broker Metrics, The MLS and Foreclosure Radar for all areas in Los Angeles Mirco Market Report. Statistics are subject to change due to individual real estate company reporting disciplines.
16.1%
-1.6%
-80.0%
0.0%
30.0%
4.0%
550.0%
-23.1%
21.0%
$0
$0
0
1
18
160
0
5.6%
$2,681,750
$0
$0
0
2
14
220
0
14.3%
$3,134,625
$2,438,500
$604
1
3
26
182
26
11.5%
$3,068,150
$2,100,000
$614
5
3
20
175
4
15.0%
$2,535,000
Rolling Hills
26
$604
$2,438,500
$2.100
$2.438
$1.187
$1.580
MEDIAN SALES PRICE
AVERAGE PRICE PER SQ FT
MONTH’S SUPPLY OF INVENTORY
Median Price .........................................................
Average Price per Square Foot ..........................
Properties Sold ......................................................
Properties Pending Sale ......................................
Properties For Sale ...............................................
Days on Market (Pending Sale) ..........................
Month’s Supply of Inventory ...............................
Percent Under Contract .......................................
Average Median Price for Last 12 Months .......
May 2013 May 2013May 2014 May 20146 month 6 month3 month 3 month% change % changeDATA* DATA*
current market snapshot
M E DIAN SALE S P R ICE ($100 ,000 ’s ) MEDIAN SALES PR ICE ($100 ,000 ’s )
rivierafinancial.com rivierafinancial.com
MEDIAN SALES PRICE
AVERAGE PRICE PER SQ FT
MONTH’S SUPPLY OF INVENTORY
current market snapshot
Riviera Market Intelligence :: May 2014Riviera Market Intelligence :: May 2014
MAY
JUN
JUL
AUG
SEP
OCT
NOV
DEC
JAN
FEB
MAR
APR
MAY
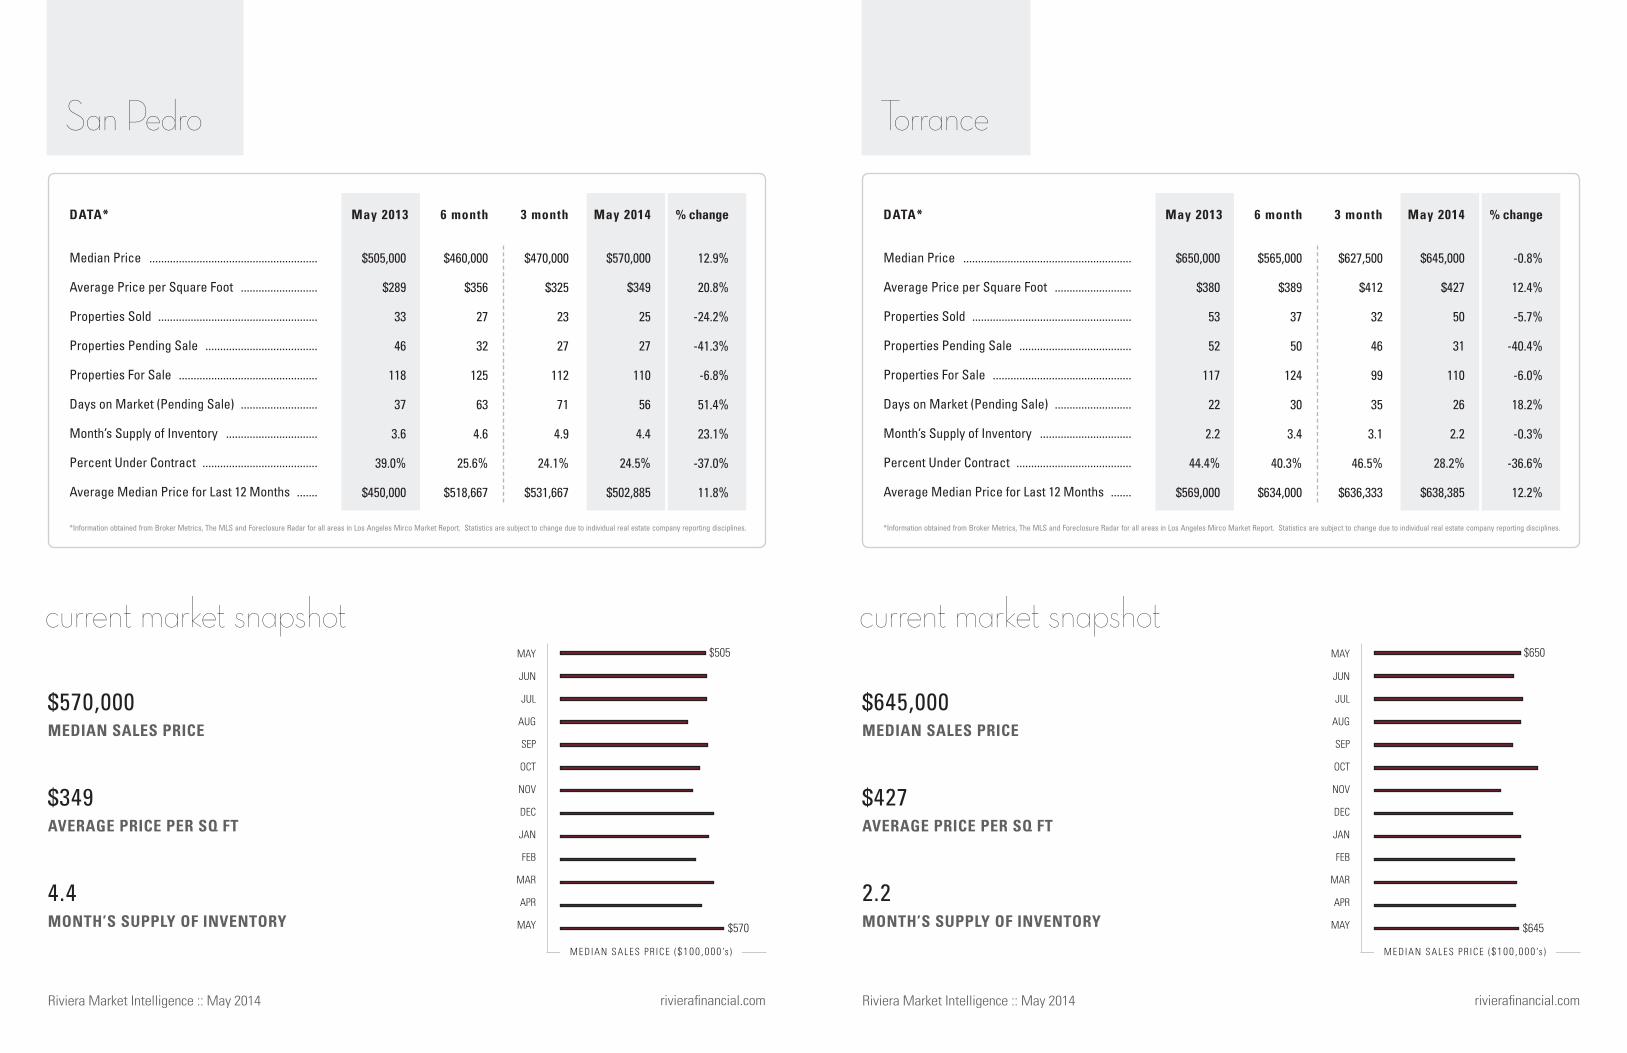
2.2
$427
$645,000
*Information obtained from Broker Metrics, The MLS and Foreclosure Radar for all areas in Los Angeles Mirco Market Report. Statistics are subject to change due to individual real estate company reporting disciplines.
-0.8%
12.4%
-5.7%
-40.4%
-6.0%
18.2%
-0.3%
-36.6%
12.2%
$627,500
$412
32
46
99
35
3.1
46.5%
$636,333
$565,000
$389
37
50
124
30
3.4
40.3%
$634,000
$645,000
$427
50
31
110
26
2.2
28.2%
$638,385
$650,000
$380
53
52
117
22
2.2
44.4%
$569,000
Torrance
MAY
JUN
JUL
AUG
SEP
OCT
NOV
DEC
JAN
FEB
MAR
APR
MAY
*Information obtained from Broker Metrics, The MLS and Foreclosure Radar for all areas in Los Angeles Mirco Market Report. Statistics are subject to change due to individual real estate company reporting disciplines.
12.9%
20.8%
-24.2%
-41.3%
-6.8%
51.4%
23.1%
-37.0%
11.8%
$470,000
$325
23
27
112
71
4.9
24.1%
$531,667
$460,000
$356
27
32
125
63
4.6
25.6%
$518,667
$570,000
$349
25
27
110
56
4.4
24.5%
$502,885
$505,000
$289
33
46
118
37
3.6
39.0%
$450,000
San Pedro
4.4
$349
$570,000
$505
$570
$650
$645

MEDIAN SALES PRICE
AVERAGE PRICE PER SQ FT
MONTH’S SUPPLY OF INVENTORY
Median Price .........................................................
Average Price per Square Foot ..........................
Properties Sold ......................................................
Properties Pending Sale ......................................
Properties For Sale ...............................................
Days on Market (Pending Sale) ..........................
Month’s Supply of Inventory ...............................
Percent Under Contract .......................................
Average Median Price for Last 12 Months .......
May 2013 May 2013May 2014 May 20146 month 6 month3 month 3 month% change % changeDATA* DATA*
current market snapshot
M E DIAN SALE S P R ICE ($100 ,000 ’s ) MEDIAN SALES PR ICE ($100 ,000 ’s )
rivierafinancial.com rivierafinancial.com
MEDIAN SALES PRICE
AVERAGE PRICE PER SQ FT
MONTH’S SUPPLY OF INVENTORY
current market snapshot
Riviera Market Intelligence :: May 2014Riviera Market Intelligence :: May 2014
MAY
JUN
JUL
AUG
SEP
OCT
NOV
DEC
JAN
FEB
MAR
APR
MAY
1.9
$415
$650,000
*Information obtained from Broker Metrics, The MLS and Foreclosure Radar for all areas in Los Angeles Mirco Market Report. Statistics are subject to change due to individual real estate company reporting disciplines.
1.9%
11.6%
-30.8%
-17.5%
7.7%
25.0%
55.6%
-23.4%
16.9%
$655,000
$412
39
56
77
50
2
72.7%
$631,667
$607,000
$378
46
50
77
43
1.7
64.9%
$626,667
$650,000
$415
36
52
70
45
1.9
74.3%
$616,846
$638,000
$372
52
63
65
36
1.2
96.9%
$527,538
Burbank
MAY
JUN
JUL
AUG
SEP
OCT
NOV
DEC
JAN
FEB
MAR
APR
MAY
*Information obtained from Broker Metrics, The MLS and Foreclosure Radar for all areas in Los Angeles Mirco Market Report. Statistics are subject to change due to individual real estate company reporting disciplines.
11.2%
8.5%
-8.9%
-9.1%
36.2%
3.6%
49.5%
-33.3%
15.9%
$746,071
$361
277
411
821
57
3
50.1%
$756,214
$675,000
$361
429
485
917
56
2.1
52.9%
$749,024
$750,286
$388
462
558
1,027
52
2.2
54.3%
$719,110
$674,429
$358
507
614
754
50
1.5
81.4%
$620,451
San Fernando Valley Macro Market
2.2
$388
$750,286
$674
$750
$638
$650
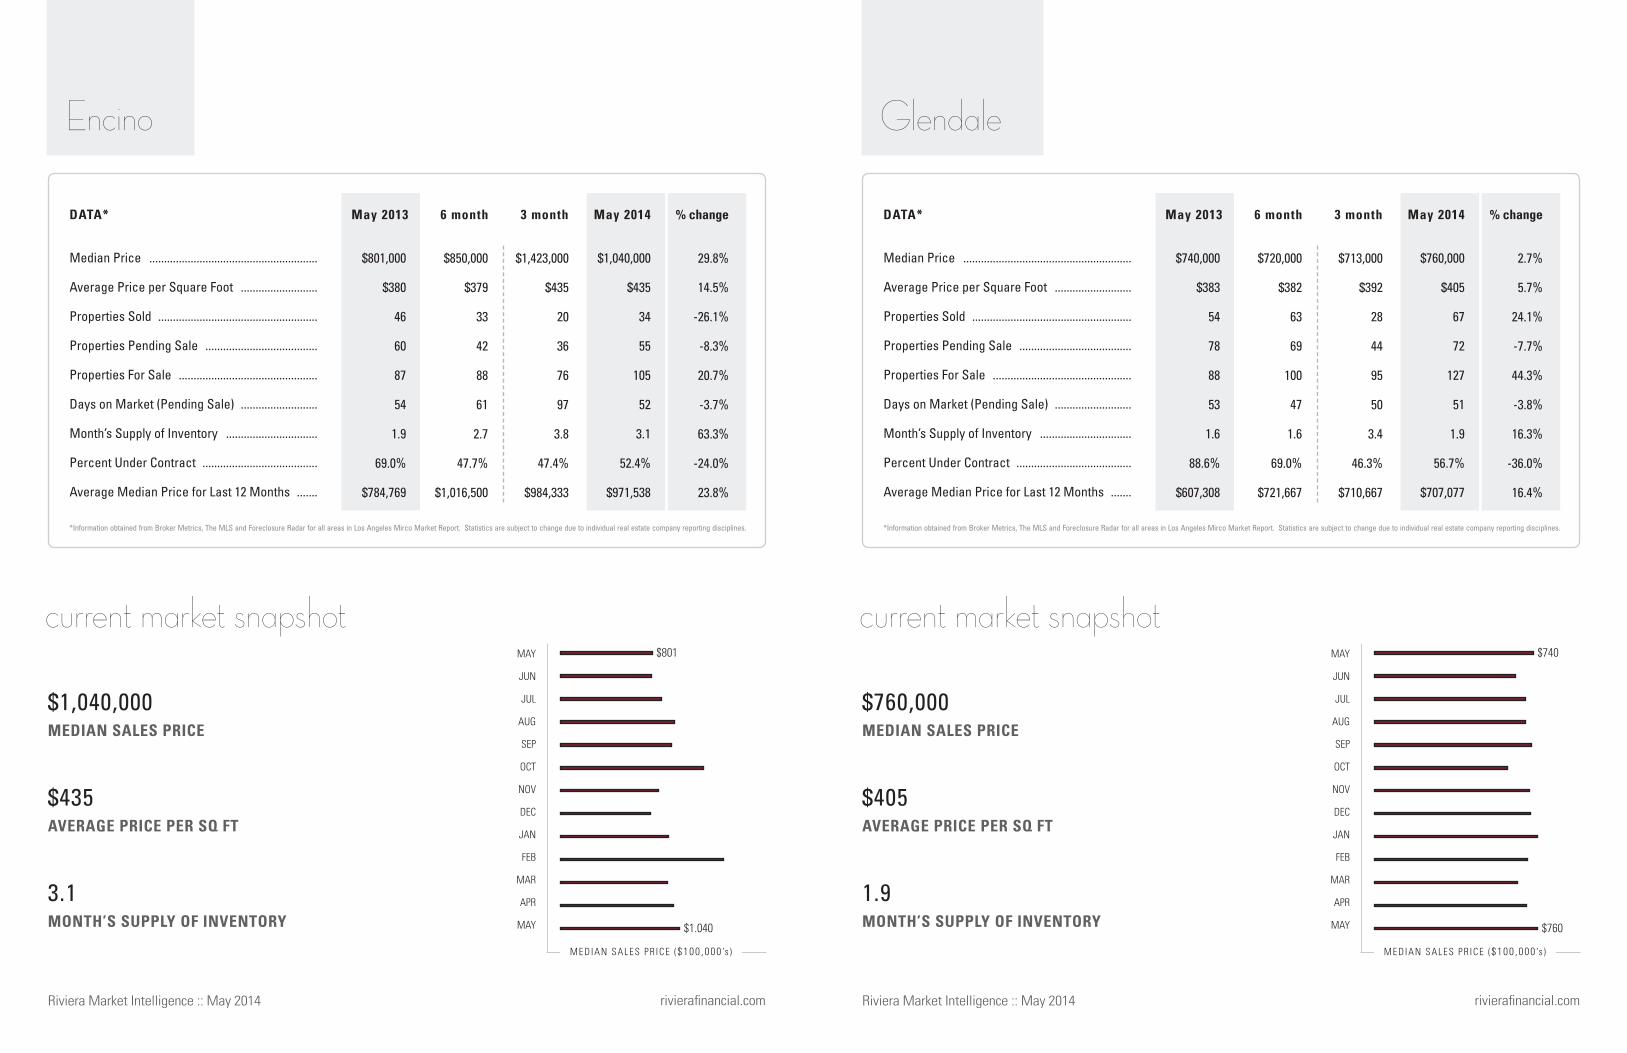
MEDIAN SALES PRICE
AVERAGE PRICE PER SQ FT
MONTH’S SUPPLY OF INVENTORY
Median Price .........................................................
Average Price per Square Foot ..........................
Properties Sold ......................................................
Properties Pending Sale ......................................
Properties For Sale ...............................................
Days on Market (Pending Sale) ..........................
Month’s Supply of Inventory ...............................
Percent Under Contract .......................................
Average Median Price for Last 12 Months .......
May 2013 May 2013May 2014 May 20146 month 6 month3 month 3 month% change % changeDATA* DATA*
current market snapshot
M E DIAN SALE S P R ICE ($100 ,000 ’s ) MEDIAN SALES PR ICE ($100 ,000 ’s )
rivierafinancial.com rivierafinancial.com
MEDIAN SALES PRICE
AVERAGE PRICE PER SQ FT
MONTH’S SUPPLY OF INVENTORY
current market snapshot
Riviera Market Intelligence :: May 2014Riviera Market Intelligence :: May 2014
MAY
JUN
JUL
AUG
SEP
OCT
NOV
DEC
JAN
FEB
MAR
APR
MAY
1.9
$405
$760,000
*Information obtained from Broker Metrics, The MLS and Foreclosure Radar for all areas in Los Angeles Mirco Market Report. Statistics are subject to change due to individual real estate company reporting disciplines.
2.7%
5.7%
24.1%
-7.7%
44.3%
-3.8%
16.3%
-36.0%
16.4%
$713,000
$392
28
44
95
50
3.4
46.3%
$710,667
$720,000
$382
63
69
100
47
1.6
69.0%
$721,667
$760,000
$405
67
72
127
51
1.9
56.7%
$707,077
$740,000
$383
54
78
88
53
1.6
88.6%
$607,308
Glendale
MAY
JUN
JUL
AUG
SEP
OCT
NOV
DEC
JAN
FEB
MAR
APR
MAY
*Information obtained from Broker Metrics, The MLS and Foreclosure Radar for all areas in Los Angeles Mirco Market Report. Statistics are subject to change due to individual real estate company reporting disciplines.
29.8%
14.5%
-26.1%
-8.3%
20.7%
-3.7%
63.3%
-24.0%
23.8%
$1,423,000
$435
20
36
76
97
3.8
47.4%
$984,333
$850,000
$379
33
42
88
61
2.7
47.7%
$1,016,500
$1,040,000
$435
34
55
105
52
3.1
52.4%
$971,538
$801,000
$380
46
60
87
54
1.9
69.0%
$784,769
Encino
3.1
$435
$1,040,000
$801
$1.040
$740
$760

MEDIAN SALES PRICE
AVERAGE PRICE PER SQ FT
MONTH’S SUPPLY OF INVENTORY
Median Price .........................................................
Average Price per Square Foot ..........................
Properties Sold ......................................................
Properties Pending Sale ......................................
Properties For Sale ...............................................
Days on Market (Pending Sale) ..........................
Month’s Supply of Inventory ...............................
Percent Under Contract .......................................
Average Median Price for Last 12 Months .......
May 2013 May 2013May 2014 May 20146 month 6 month3 month 3 month% change % changeDATA* DATA*
current market snapshot
M E DIAN SALE S P R ICE ($100 ,000 ’s ) MEDIAN SALES PR ICE ($100 ,000 ’s )
rivierafinancial.com rivierafinancial.com
MEDIAN SALES PRICE
AVERAGE PRICE PER SQ FT
MONTH’S SUPPLY OF INVENTORY
current market snapshot
Riviera Market Intelligence :: May 2014Riviera Market Intelligence :: May 2014
MAY
JUN
JUL
AUG
SEP
OCT
NOV
DEC
JAN
FEB
MAR
APR
MAY
1.6
$310
$411,000
*Information obtained from Broker Metrics, The MLS and Foreclosure Radar for all areas in Los Angeles Mirco Market Report. Statistics are subject to change due to individual real estate company reporting disciplines.
0.5%
-2.8%
-25.0%
7.5%
67.6%
-2.0%
123.5%
-35.8%
25.2%
$435,000
$294
31
36
75
47
2.4
48.0%
$438,000
$409,000
$331
48
45
68
50
1.4
66.2%
$424,167
$411,000
$310
36
57
57
50
1.6
100.0%
$412,615
$409,000
$319
48
53
34
51
0.7
155.9%
$329,462
North Hollywood
MAY
JUN
JUL
AUG
SEP
OCT
NOV
DEC
JAN
FEB
MAR
APR
MAY
*Information obtained from Broker Metrics, The MLS and Foreclosure Radar for all areas in Los Angeles Mirco Market Report. Statistics are subject to change due to individual real estate company reporting disciplines.
-0.1%
6.4%
16.7%
-9.5%
54.5%
-1.9%
32.5%
-41.5%
14.5%
$658,000
$407
11
14
24
48
2.2
58.3%
$736,333
$532,000
$383
18
20
27
59
1.5
74.1%
$698,500
$695,000
$398
21
19
34
52
1.6
55.9%
$670,308
$696,000
$374
18
21
22
53
1.2
95.5%
$585,462
La Crescenta
1.6
$398
$695,000
$696
$695
$409
$411

MEDIAN SALES PRICE
AVERAGE PRICE PER SQ FT
MONTH’S SUPPLY OF INVENTORY
Median Price .........................................................
Average Price per Square Foot ..........................
Properties Sold ......................................................
Properties Pending Sale ......................................
Properties For Sale ...............................................
Days on Market (Pending Sale) ..........................
Month’s Supply of Inventory ...............................
Percent Under Contract .......................................
Average Median Price for Last 12 Months .......
May 2013 May 2013May 2014 May 20146 month 6 month3 month 3 month% change % changeDATA* DATA*
current market snapshot
M E DIAN SALE S P R ICE ($100 ,000 ’s ) MEDIAN SALES PR ICE ($100 ,000 ’s )
rivierafinancial.com rivierafinancial.com
MEDIAN SALES PRICE
AVERAGE PRICE PER SQ FT
MONTH’S SUPPLY OF INVENTORY
current market snapshot
Riviera Market Intelligence :: May 2014Riviera Market Intelligence :: May 2014
MAY
JUN
JUL
AUG
SEP
OCT
NOV
DEC
JAN
FEB
MAR
APR
MAY
2.1
$449
$985,000
*Information obtained from Broker Metrics, The MLS and Foreclosure Radar for all areas in Los Angeles Mirco Market Report. Statistics are subject to change due to individual real estate company reporting disciplines.
20.9%
4.2%
-1.5%
-13.2%
32.7%
2.0%
34.7%
-34.5%
17.6%
$925,000
$436
38
54
101
61
2.7
53.5%
$909,333
$750,000
$407
53
59
125
56
2.4
47.2%
$921,000
$985,000
$449
65
66
134
52
2.1
49.3%
$857,462
$815,000
$431
66
76
101
51
1.5
75.2%
$729,077
Sherman Oaks
MAY
JUN
JUL
AUG
SEP
OCT
NOV
DEC
JAN
FEB
MAR
APR
MAY
*Information obtained from Broker Metrics, The MLS and Foreclosure Radar for all areas in Los Angeles Mirco Market Report. Statistics are subject to change due to individual real estate company reporting disciplines.
1.9%
1.3%
0.0%
500.0%
-40.0%
-7.4%
-40.0%
900.0%
15.0%
$945,000
$278
1
4
7
2
7
57.1%
$714,333
$542,000
$279
2
2
13
76
6.5
15.4%
$790,167
$640,000
$311
4
6
12
50
3
50.0%
$720,308
$628,000
$307
4
1
20
54
5
5.0%
$626,462
Shadow Hills
3
$311
$640,000
$628
$640
$815
$985
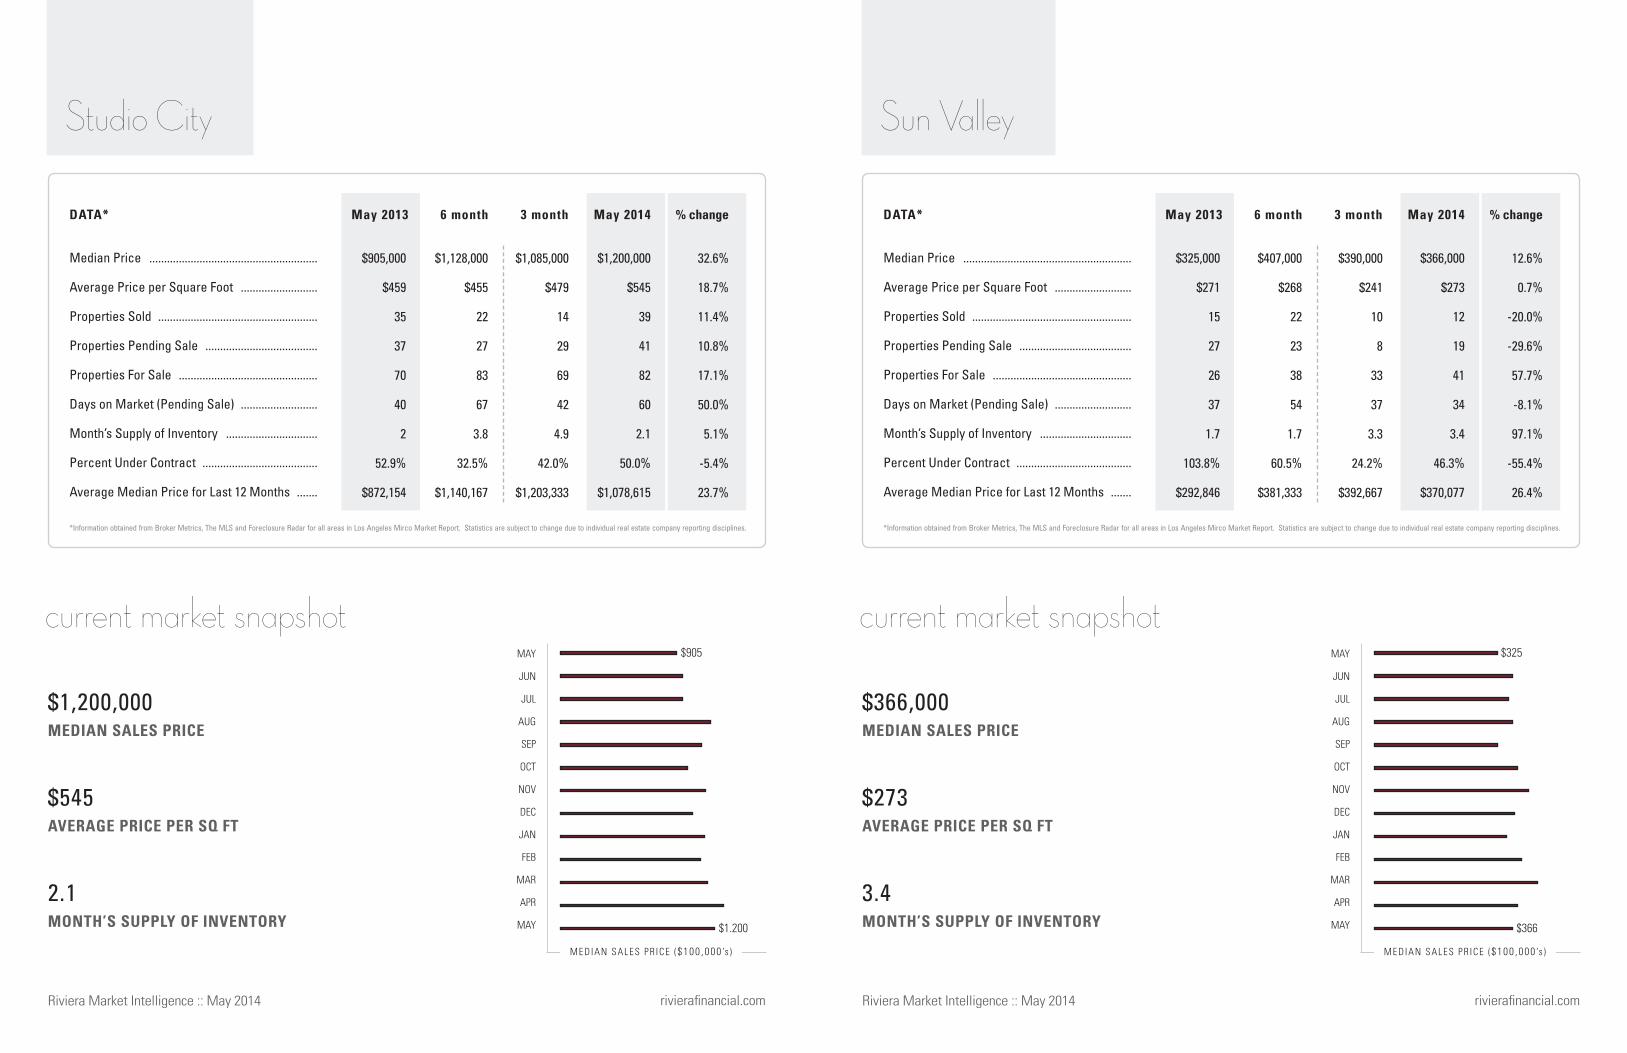
MEDIAN SALES PRICE
AVERAGE PRICE PER SQ FT
MONTH’S SUPPLY OF INVENTORY
Median Price .........................................................
Average Price per Square Foot ..........................
Properties Sold ......................................................
Properties Pending Sale ......................................
Properties For Sale ...............................................
Days on Market (Pending Sale) ..........................
Month’s Supply of Inventory ...............................
Percent Under Contract .......................................
Average Median Price for Last 12 Months .......
May 2013 May 2013May 2014 May 20146 month 6 month3 month 3 month% change % changeDATA* DATA*
current market snapshot
M E DIAN SALE S P R ICE ($100 ,000 ’s ) MEDIAN SALES PR ICE ($100 ,000 ’s )
rivierafinancial.com rivierafinancial.com
MEDIAN SALES PRICE
AVERAGE PRICE PER SQ FT
MONTH’S SUPPLY OF INVENTORY
current market snapshot
Riviera Market Intelligence :: May 2014Riviera Market Intelligence :: May 2014
MAY
JUN
JUL
AUG
SEP
OCT
NOV
DEC
JAN
FEB
MAR
APR
MAY
3.4
$273
$366,000
*Information obtained from Broker Metrics, The MLS and Foreclosure Radar for all areas in Los Angeles Mirco Market Report. Statistics are subject to change due to individual real estate company reporting disciplines.
12.6%
0.7%
-20.0%
-29.6%
57.7%
-8.1%
97.1%
-55.4%
26.4%
$390,000
$241
10
8
33
37
3.3
24.2%
$392,667
$407,000
$268
22
23
38
54
1.7
60.5%
$381,333
$366,000
$273
12
19
41
34
3.4
46.3%
$370,077
$325,000
$271
15
27
26
37
1.7
103.8%
$292,846
Sun Valley
MAY
JUN
JUL
AUG
SEP
OCT
NOV
DEC
JAN
FEB
MAR
APR
MAY
*Information obtained from Broker Metrics, The MLS and Foreclosure Radar for all areas in Los Angeles Mirco Market Report. Statistics are subject to change due to individual real estate company reporting disciplines.
32.6%
18.7%
11.4%
10.8%
17.1%
50.0%
5.1%
-5.4%
23.7%
$1,085,000
$479
14
29
69
42
4.9
42.0%
$1,203,333
$1,128,000
$455
22
27
83
67
3.8
32.5%
$1,140,167
$1,200,000
$545
39
41
82
60
2.1
50.0%
$1,078,615
$905,000
$459
35
37
70
40
2
52.9%
$872,154
Studio City
2.1
$545
$1,200,000
$905
$1.200
$325
$366

MEDIAN SALES PRICE
AVERAGE PRICE PER SQ FT
MONTH’S SUPPLY OF INVENTORY
Median Price .........................................................
Average Price per Square Foot ..........................
Properties Sold ......................................................
Properties Pending Sale ......................................
Properties For Sale ...............................................
Days on Market (Pending Sale) ..........................
Month’s Supply of Inventory ...............................
Percent Under Contract .......................................
Average Median Price for Last 12 Months .......
May 2013 May 2013May 2014 May 20146 month 6 month3 month 3 month% change % changeDATA* DATA*
current market snapshot
M E DIAN SALE S P R ICE ($100 ,000 ’s ) MEDIAN SALES PR ICE ($100 ,000 ’s )
rivierafinancial.com rivierafinancial.com
MEDIAN SALES PRICE
AVERAGE PRICE PER SQ FT
MONTH’S SUPPLY OF INVENTORY
current market snapshot
Riviera Market Intelligence :: May 2014Riviera Market Intelligence :: May 2014
MAY
JUN
JUL
AUG
SEP
OCT
NOV
DEC
JAN
FEB
MAR
APR
MAY
3.1
$330
$968,000
*Information obtained from Broker Metrics, The MLS and Foreclosure Radar for all areas in Los Angeles Mirco Market Report. Statistics are subject to change due to individual real estate company reporting disciplines.
5.4%
-0.6%
-16.1%
-39.6%
80.0%
-7.7%
114.6%
-66.4%
16.4%
$705,000
$323
18
23
65
64
3.6
35.4%
$941,333
$660,000
$325
19
26
72
58
3.8
36.1%
$857,500
$968,000
$330
26
29
81
48
3.1
35.8%
$827,615
$918,000
$332
31
48
45
52
1.5
106.7%
$711,000
Tarzana
MAY
JUN
JUL
AUG
SEP
OCT
NOV
DEC
JAN
FEB
MAR
APR
MAY
*Information obtained from Broker Metrics, The MLS and Foreclosure Radar for all areas in Los Angeles Mirco Market Report. Statistics are subject to change due to individual real estate company reporting disciplines.
8.4%
16.4%
4.8%
4.3%
123.7%
0.0%
113.5%
-53.4%
17.0%
$446,000
$314
22
28
45
62
2
62.2%
$433,000
$446,000
$289
34
40
65
50
1.9
61.5%
$430,167
$437,000
$312
44
49
85
52
1.9
57.6%
$420,077
$403,000
$268
42
47
38
52
0.9
123.7%
$359,000
Sunland/Tujunga
1.9
$312
$437,000
$403
$437
$918
$968

MEDIAN SALES PRICE
AVERAGE PRICE PER SQ FT
MONTH’S SUPPLY OF INVENTORY
Median Price .........................................................
Average Price per Square Foot ..........................
Properties Sold ......................................................
Properties Pending Sale ......................................
Properties For Sale ...............................................
Days on Market (Pending Sale) ..........................
Month’s Supply of Inventory ...............................
Percent Under Contract .......................................
Average Median Price for Last 12 Months .......
May 2013 May 2013May 2014 May 20146 month 6 month3 month 3 month% change % changeDATA* DATA*
current market snapshot
M E DIAN SALE S P R ICE ($100 ,000 ’s ) MEDIAN SALES PR ICE ($100 ,000 ’s )
rivierafinancial.com rivierafinancial.com
MEDIAN SALES PRICE
AVERAGE PRICE PER SQ FT
MONTH’S SUPPLY OF INVENTORY
current market snapshot
Riviera Market Intelligence :: May 2014Riviera Market Intelligence :: May 2014
MAY
JUN
JUL
AUG
SEP
OCT
NOV
DEC
JAN
FEB
MAR
APR
MAY
5.4
$409
$728,000
*Information obtained from Broker Metrics, The MLS and Foreclosure Radar for all areas in Los Angeles Mirco Market Report. Statistics are subject to change due to individual real estate company reporting disciplines.
11.7%
11.4%
-50.0%
-27.8%
-6.9%
-28.4%
86.2%
-22.4%
14.7%
$660,000
$357
6
10
12
120
2
83.3%
$740,667
$895,000
$444
9
15
30
62
3.3
50.0%
$726,333
$728,000
$409
5
13
27
63
5.4
48.1%
$744,308
$652,000
$367
10
18
29
88
2.9
62.1%
$648,692
Valley Village
MAY
JUN
JUL
AUG
SEP
OCT
NOV
DEC
JAN
FEB
MAR
APR
MAY
*Information obtained from Broker Metrics, The MLS and Foreclosure Radar for all areas in Los Angeles Mirco Market Report. Statistics are subject to change due to individual real estate company reporting disciplines.
6.3%
19.6%
-60.0%
-100.0%
-11.8%
27.8%
120.6%
-100.0%
-4.2%
$740,000
$382
4
11
11
41
2.8
100.0%
$1,076,333
$849,000
$438
7
4
11
50
1.6
36.4%
$1,086,167
$944,000
$530
4
0
15
46
3.8
0.0%
$1,011,308
$888,000
$443
10
4
17
36
1.7
23.5%
$1,056,000
Toluca Lake
3.8
$530
$944,000
$888
$944
$652
$728
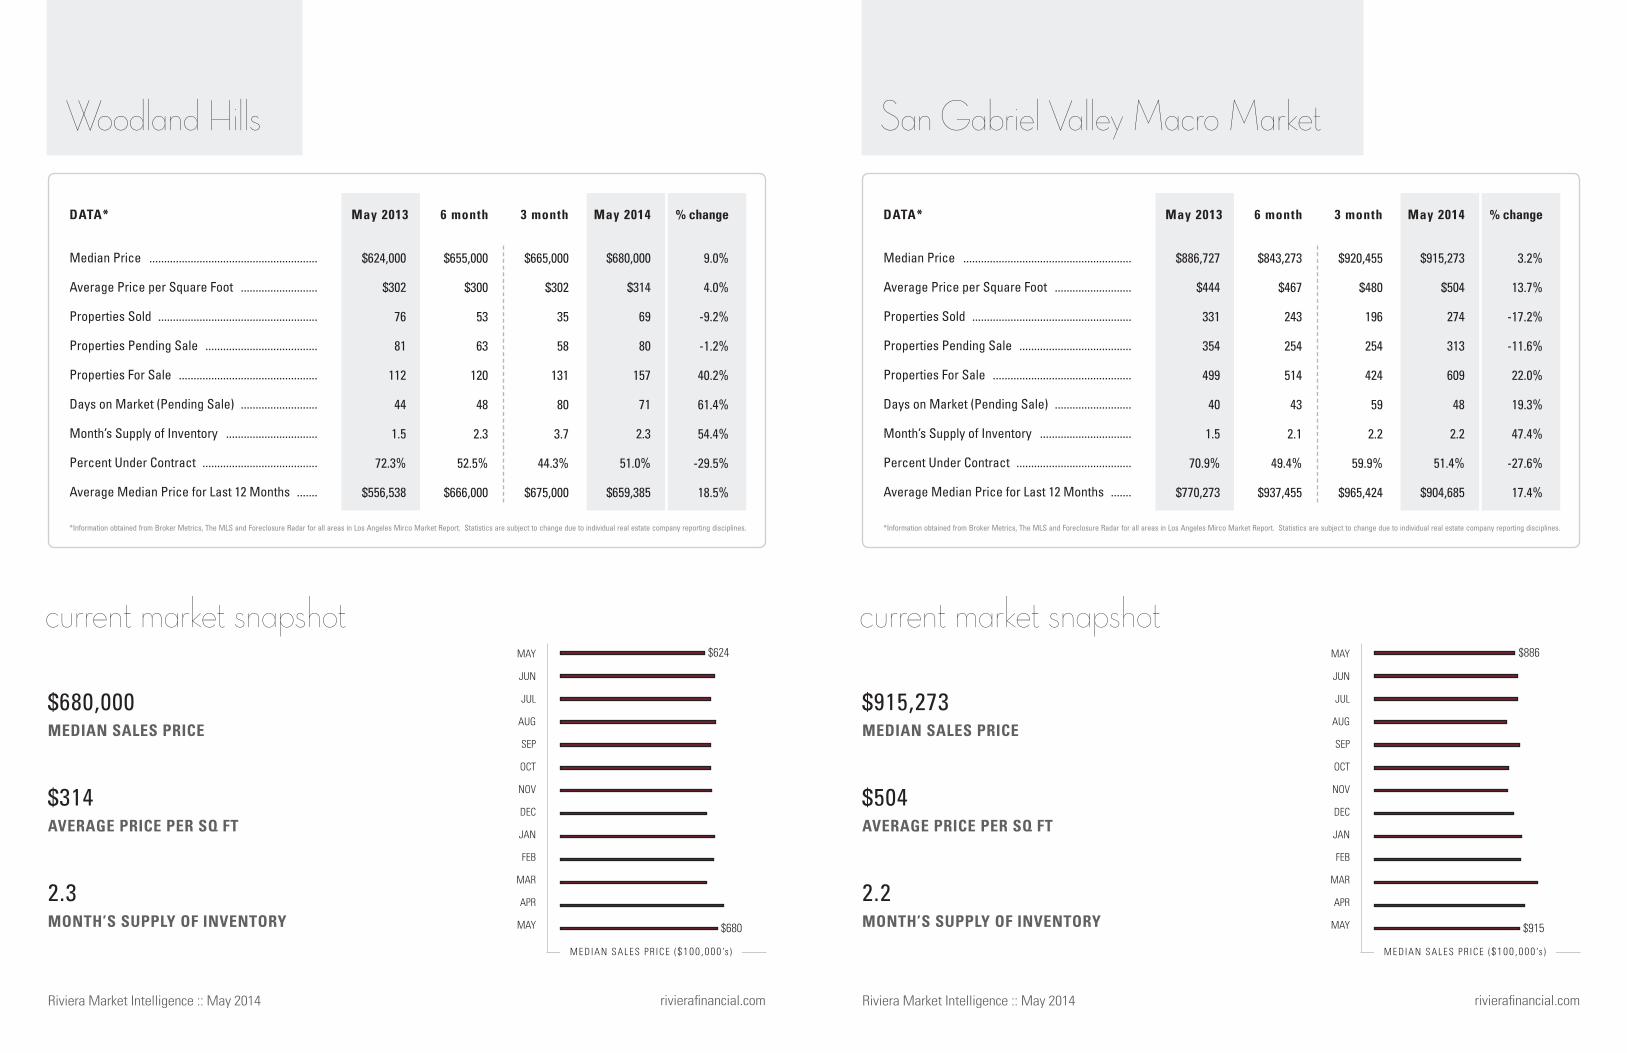
MEDIAN SALES PRICE
AVERAGE PRICE PER SQ FT
MONTH’S SUPPLY OF INVENTORY
Median Price .........................................................
Average Price per Square Foot ..........................
Properties Sold ......................................................
Properties Pending Sale ......................................
Properties For Sale ...............................................
Days on Market (Pending Sale) ..........................
Month’s Supply of Inventory ...............................
Percent Under Contract .......................................
Average Median Price for Last 12 Months .......
May 2013 May 2013May 2014 May 20146 month 6 month3 month 3 month% change % changeDATA* DATA*
current market snapshot
M E DIAN SALE S P R ICE ($100 ,000 ’s ) MEDIAN SALES PR ICE ($100 ,000 ’s )
rivierafinancial.com rivierafinancial.com
MEDIAN SALES PRICE
AVERAGE PRICE PER SQ FT
MONTH’S SUPPLY OF INVENTORY
current market snapshot
Riviera Market Intelligence :: May 2014Riviera Market Intelligence :: May 2014
MAY
JUN
JUL
AUG
SEP
OCT
NOV
DEC
JAN
FEB
MAR
APR
MAY
2.2
$504
$915,273
*Information obtained from Broker Metrics, The MLS and Foreclosure Radar for all areas in Los Angeles Mirco Market Report. Statistics are subject to change due to individual real estate company reporting disciplines.
3.2%
13.7%
-17.2%
-11.6%
22.0%
19.3%
47.4%
-27.6%
17.4%
$920,455
$480
196
254
424
59
2.2
59.9%
$965,424
$843,273
$467
243
254
514
43
2.1
49.4%
$937,455
$915,273
$504
274
313
609
48
2.2
51.4%
$904,685
$886,727
$444
331
354
499
40
1.5
70.9%
$770,273
San Gabriel Valley Macro Market
MAY
JUN
JUL
AUG
SEP
OCT
NOV
DEC
JAN
FEB
MAR
APR
MAY
*Information obtained from Broker Metrics, The MLS and Foreclosure Radar for all areas in Los Angeles Mirco Market Report. Statistics are subject to change due to individual real estate company reporting disciplines.
9.0%
4.0%
-9.2%
-1.2%
40.2%
61.4%
54.4%
-29.5%
18.5%
$665,000
$302
35
58
131
80
3.7
44.3%
$675,000
$655,000
$300
53
63
120
48
2.3
52.5%
$666,000
$680,000
$314
69
80
157
71
2.3
51.0%
$659,385
$624,000
$302
76
81
112
44
1.5
72.3%
$556,538
Woodland Hills
2.3
$314
$680,000
$624
$680
$886
$915
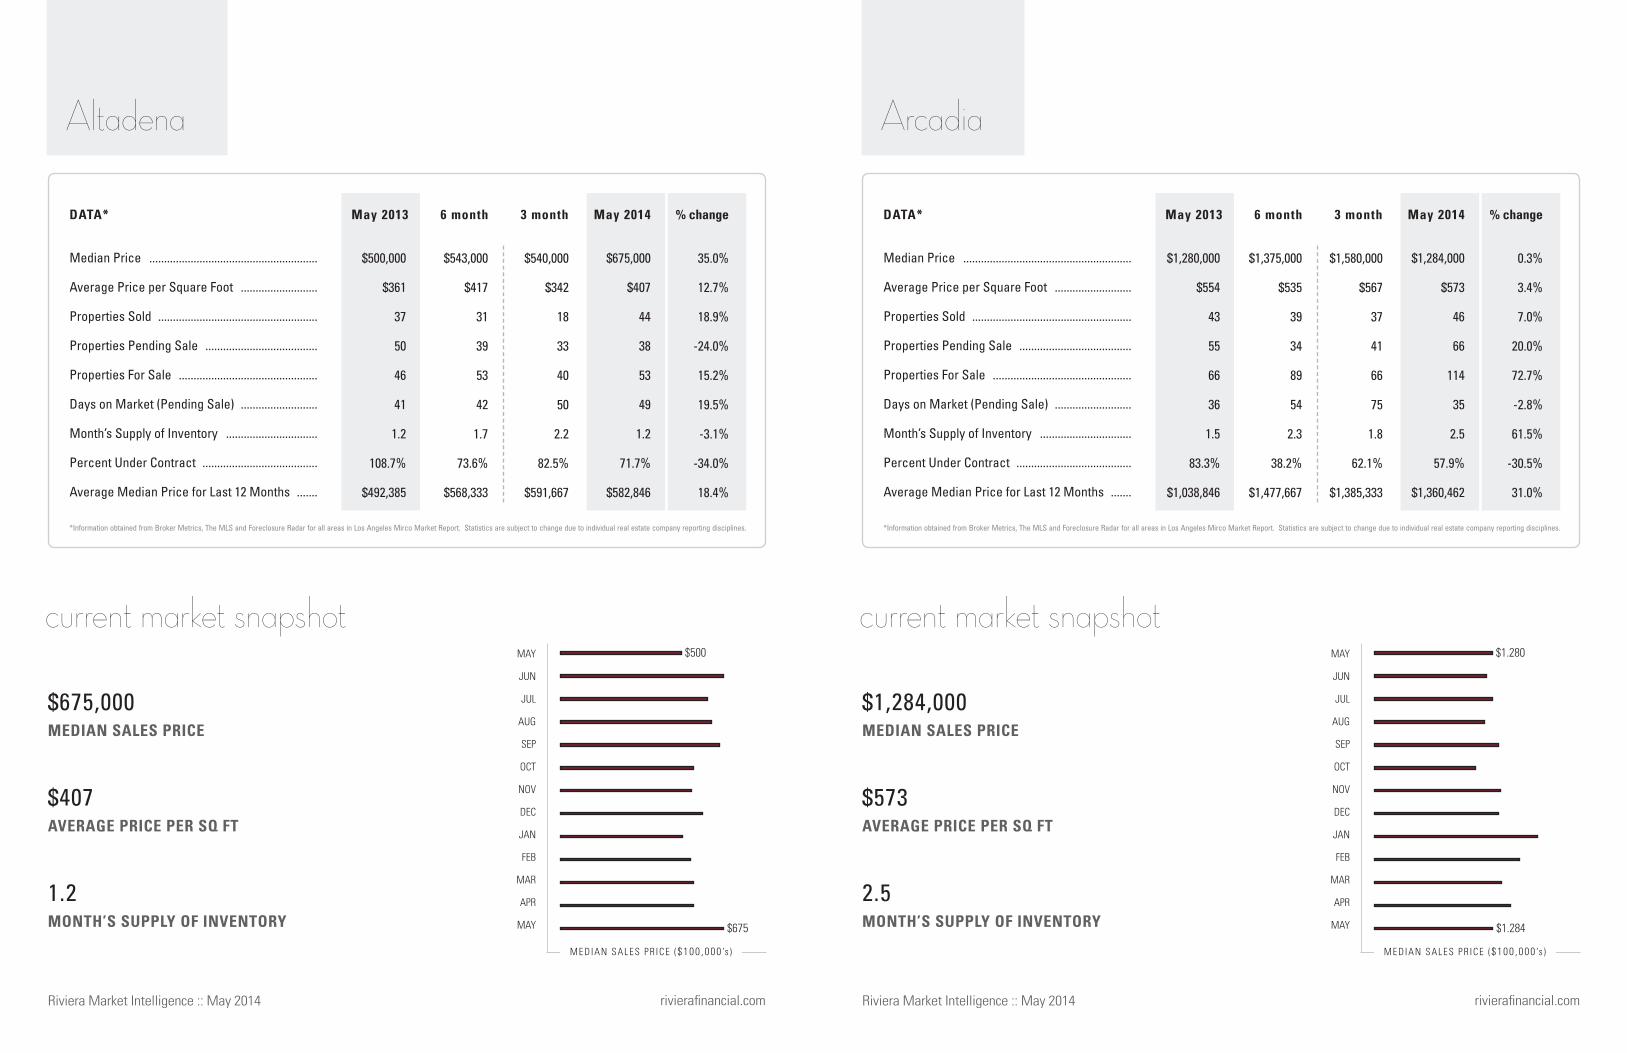
MEDIAN SALES PRICE
AVERAGE PRICE PER SQ FT
MONTH’S SUPPLY OF INVENTORY
Median Price .........................................................
Average Price per Square Foot ..........................
Properties Sold ......................................................
Properties Pending Sale ......................................
Properties For Sale ...............................................
Days on Market (Pending Sale) ..........................
Month’s Supply of Inventory ...............................
Percent Under Contract .......................................
Average Median Price for Last 12 Months .......
May 2013 May 2013May 2014 May 20146 month 6 month3 month 3 month% change % changeDATA* DATA*
current market snapshot
M E DIAN SALE S P R ICE ($100 ,000 ’s ) MEDIAN SALES PR ICE ($100 ,000 ’s )
rivierafinancial.com rivierafinancial.com
MEDIAN SALES PRICE
AVERAGE PRICE PER SQ FT
MONTH’S SUPPLY OF INVENTORY
current market snapshot
Riviera Market Intelligence :: May 2014Riviera Market Intelligence :: May 2014
MAY
JUN
JUL
AUG
SEP
OCT
NOV
DEC
JAN
FEB
MAR
APR
MAY
2.5
$573
$1,284,000
*Information obtained from Broker Metrics, The MLS and Foreclosure Radar for all areas in Los Angeles Mirco Market Report. Statistics are subject to change due to individual real estate company reporting disciplines.
0.3%
3.4%
7.0%
20.0%
72.7%
-2.8%
61.5%
-30.5%
31.0%
$1,580,000
$567
37
41
66
75
1.8
62.1%
$1,385,333
$1,375,000
$535
39
34
89
54
2.3
38.2%
$1,477,667
$1,284,000
$573
46
66
114
35
2.5
57.9%
$1,360,462
$1,280,000
$554
43
55
66
36
1.5
83.3%
$1,038,846
Arcadia
MAY
JUN
JUL
AUG
SEP
OCT
NOV
DEC
JAN
FEB
MAR
APR
MAY
*Information obtained from Broker Metrics, The MLS and Foreclosure Radar for all areas in Los Angeles Mirco Market Report. Statistics are subject to change due to individual real estate company reporting disciplines.
35.0%
12.7%
18.9%
-24.0%
15.2%
19.5%
-3.1%
-34.0%
18.4%
$540,000
$342
18
33
40
50
2.2
82.5%
$591,667
$543,000
$417
31
39
53
42
1.7
73.6%
$568,333
$675,000
$407
44
38
53
49
1.2
71.7%
$582,846
$500,000
$361
37
50
46
41
1.2
108.7%
$492,385
Altadena
1.2
$407
$675,000
$500
$675
$1.280
$1.284

MEDIAN SALES PRICE
AVERAGE PRICE PER SQ FT
MONTH’S SUPPLY OF INVENTORY
Median Price .........................................................
Average Price per Square Foot ..........................
Properties Sold ......................................................
Properties Pending Sale ......................................
Properties For Sale ...............................................
Days on Market (Pending Sale) ..........................
Month’s Supply of Inventory ...............................
Percent Under Contract .......................................
Average Median Price for Last 12 Months .......
May 2013 May 2013May 2014 May 20146 month 6 month3 month 3 month% change % changeDATA* DATA*
current market snapshot
M E DIAN SALE S P R ICE ($100 ,000 ’s ) MEDIAN SALES PR ICE ($100 ,000 ’s )
rivierafinancial.com rivierafinancial.com
MEDIAN SALES PRICE
AVERAGE PRICE PER SQ FT
MONTH’S SUPPLY OF INVENTORY
current market snapshot
Riviera Market Intelligence :: May 2014Riviera Market Intelligence :: May 2014
MAY
JUN
JUL
AUG
SEP
OCT
NOV
DEC
JAN
FEB
MAR
APR
MAY
2.8
$450
$673,000
*Information obtained from Broker Metrics, The MLS and Foreclosure Radar for all areas in Los Angeles Mirco Market Report. Statistics are subject to change due to individual real estate company reporting disciplines.
27.0%
14.8%
-78.9%
-72.7%
-47.6%
76.9%
148.8%
-47.9%
21.5%
$599,000
$374
7
4
12
25
1.7
33.3%
$705,000
$550,000
$383
3
7
2
41
0.7
350.0%
$642,333
$673,000
$450
4
3
11
46
2.8
27.3%
$606,385
$530,000
$392
19
11
21
26
1.1
52.4%
$499,077
Eagle Rock
MAY
JUN
JUL
AUG
SEP
OCT
NOV
DEC
JAN
FEB
MAR
APR
MAY
*Information obtained from Broker Metrics, The MLS and Foreclosure Radar for all areas in Los Angeles Mirco Market Report. Statistics are subject to change due to individual real estate company reporting disciplines.
13.0%
25.2%
-47.1%
-7.7%
52.6%
12.5%
188.3%
-39.5%
20.5%
$383,000
$285
16
12
17
73
1.1
70.6%
$449,667
$436,000
$316
4
10
20
31
5
50.0%
$403,667
$435,000
$323
9
12
29
54
3.2
41.4%
$400,846
$385,000
$258
17
13
19
48
1.1
68.4%
$332,769
Duarte
3.2
$323
$435,000
$385
$435
$530
$673
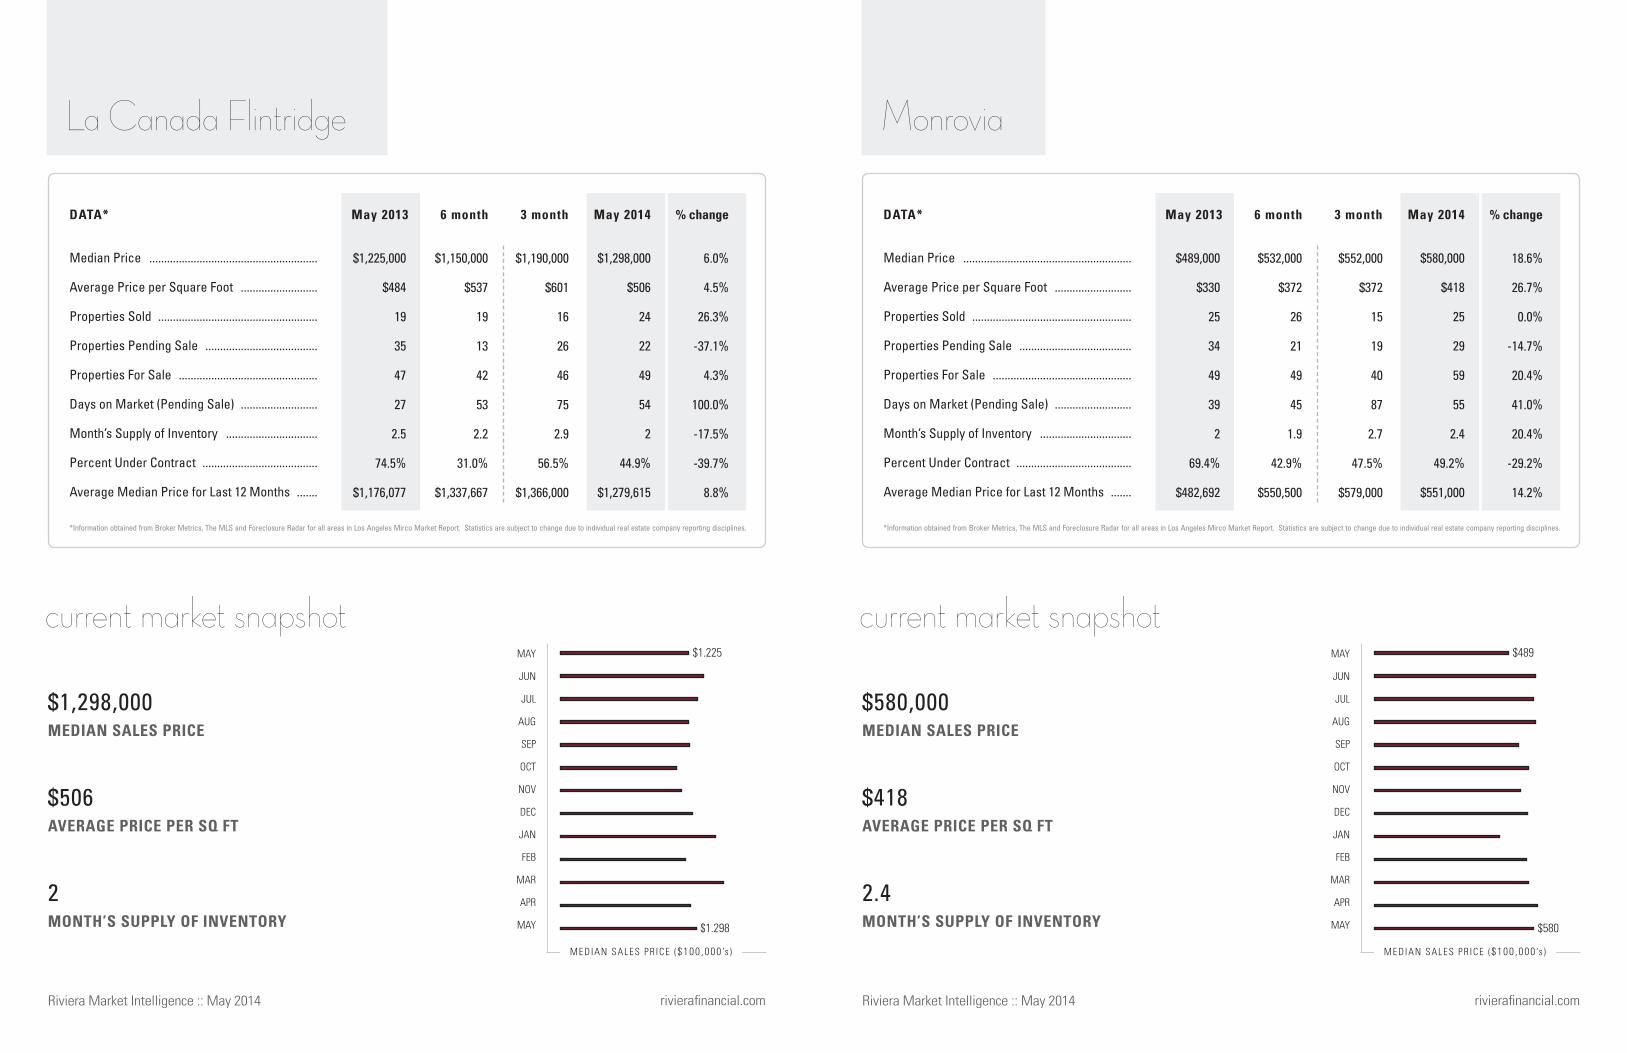
MEDIAN SALES PRICE
AVERAGE PRICE PER SQ FT
MONTH’S SUPPLY OF INVENTORY
Median Price .........................................................
Average Price per Square Foot ..........................
Properties Sold ......................................................
Properties Pending Sale ......................................
Properties For Sale ...............................................
Days on Market (Pending Sale) ..........................
Month’s Supply of Inventory ...............................
Percent Under Contract .......................................
Average Median Price for Last 12 Months .......
May 2013 May 2013May 2014 May 20146 month 6 month3 month 3 month% change % changeDATA* DATA*
current market snapshot
M E DIAN SALE S P R ICE ($100 ,000 ’s ) MEDIAN SALES PR ICE ($100 ,000 ’s )
rivierafinancial.com rivierafinancial.com
MEDIAN SALES PRICE
AVERAGE PRICE PER SQ FT
MONTH’S SUPPLY OF INVENTORY
current market snapshot
Riviera Market Intelligence :: May 2014Riviera Market Intelligence :: May 2014
MAY
JUN
JUL
AUG
SEP
OCT
NOV
DEC
JAN
FEB
MAR
APR
MAY
2.4
$418
$580,000
*Information obtained from Broker Metrics, The MLS and Foreclosure Radar for all areas in Los Angeles Mirco Market Report. Statistics are subject to change due to individual real estate company reporting disciplines.
18.6%
26.7%
0.0%
-14.7%
20.4%
41.0%
20.4%
-29.2%
14.2%
$552,000
$372
15
19
40
87
2.7
47.5%
$579,000
$532,000
$372
26
21
49
45
1.9
42.9%
$550,500
$580,000
$418
25
29
59
55
2.4
49.2%
$551,000
$489,000
$330
25
34
49
39
2
69.4%
$482,692
Monrovia
MAY
JUN
JUL
AUG
SEP
OCT
NOV
DEC
JAN
FEB
MAR
APR
MAY
*Information obtained from Broker Metrics, The MLS and Foreclosure Radar for all areas in Los Angeles Mirco Market Report. Statistics are subject to change due to individual real estate company reporting disciplines.
6.0%
4.5%
26.3%
-37.1%
4.3%
100.0%
-17.5%
-39.7%
8.8%
$1,190,000
$601
16
26
46
75
2.9
56.5%
$1,366,000
$1,150,000
$537
19
13
42
53
2.2
31.0%
$1,337,667
$1,298,000
$506
24
22
49
54
2
44.9%
$1,279,615
$1,225,000
$484
19
35
47
27
2.5
74.5%
$1,176,077
La Canada Flintridge
2
$506
$1,298,000
$1.225
$1.298
$489
$580
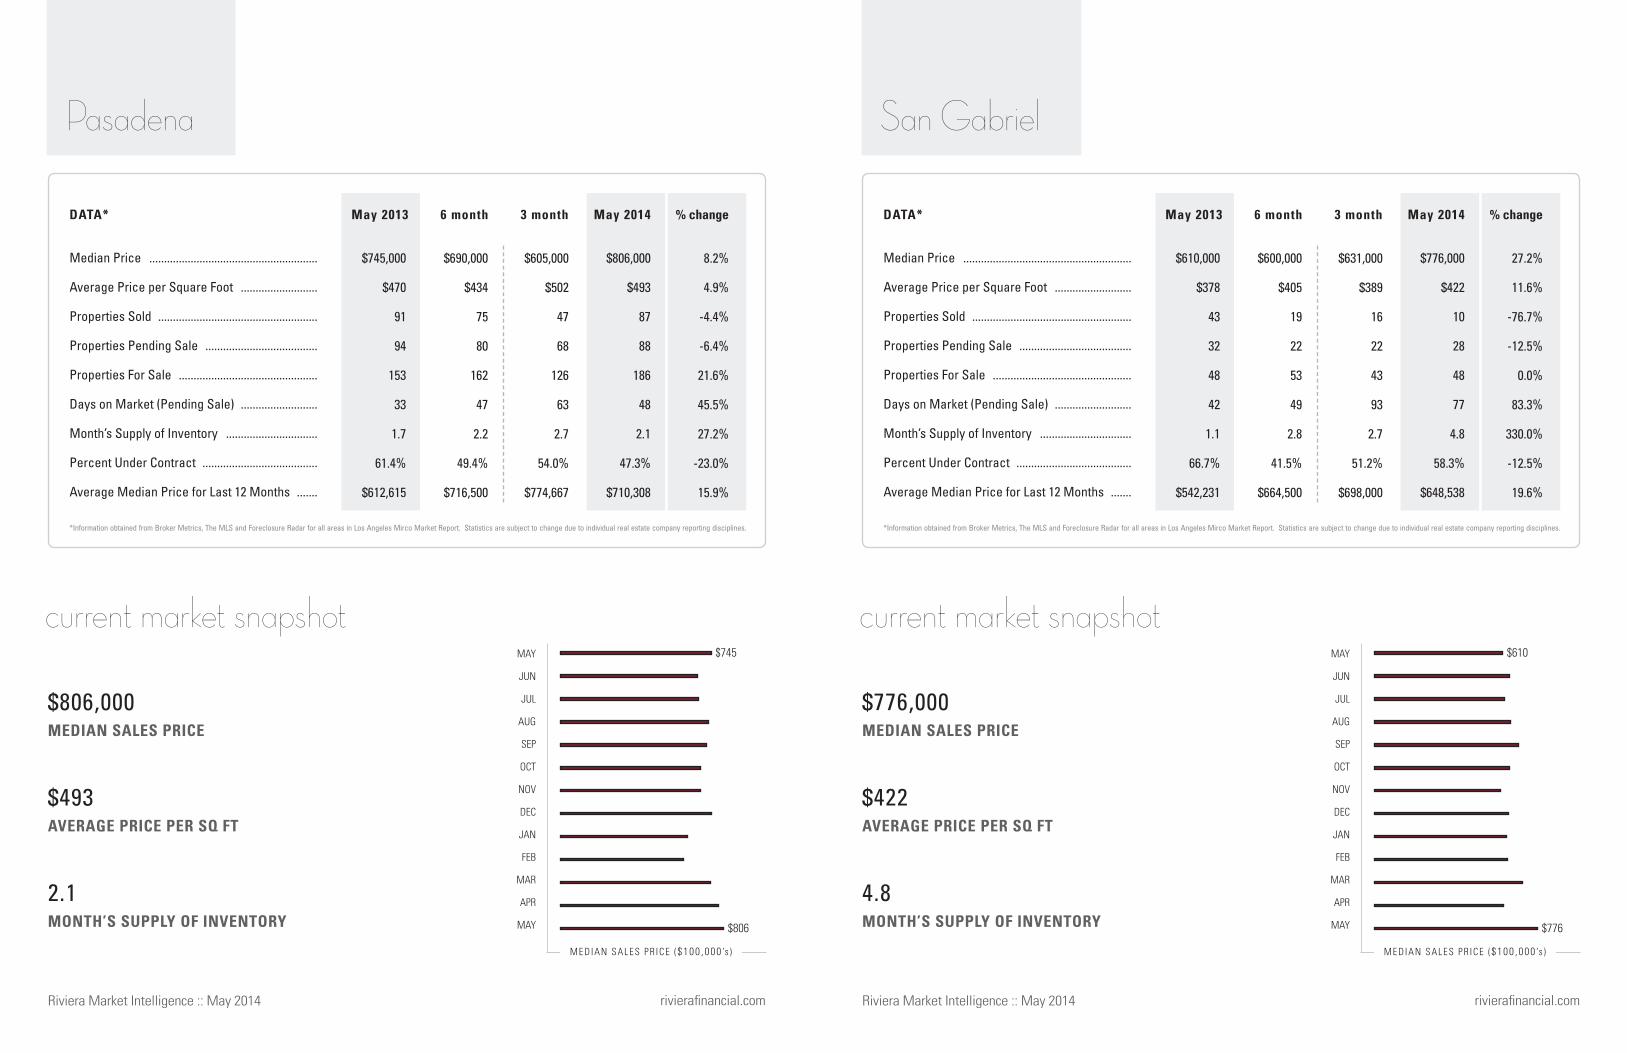
MEDIAN SALES PRICE
AVERAGE PRICE PER SQ FT
MONTH’S SUPPLY OF INVENTORY
Median Price .........................................................
Average Price per Square Foot ..........................
Properties Sold ......................................................
Properties Pending Sale ......................................
Properties For Sale ...............................................
Days on Market (Pending Sale) ..........................
Month’s Supply of Inventory ...............................
Percent Under Contract .......................................
Average Median Price for Last 12 Months .......
May 2013 May 2013May 2014 May 20146 month 6 month3 month 3 month% change % changeDATA* DATA*
current market snapshot
M E DIAN SALE S P R ICE ($100 ,000 ’s ) MEDIAN SALES PR ICE ($100 ,000 ’s )
rivierafinancial.com rivierafinancial.com
MEDIAN SALES PRICE
AVERAGE PRICE PER SQ FT
MONTH’S SUPPLY OF INVENTORY
current market snapshot
Riviera Market Intelligence :: May 2014Riviera Market Intelligence :: May 2014
MAY
JUN
JUL
AUG
SEP
OCT
NOV
DEC
JAN
FEB
MAR
APR
MAY
4.8
$422
$776,000
*Information obtained from Broker Metrics, The MLS and Foreclosure Radar for all areas in Los Angeles Mirco Market Report. Statistics are subject to change due to individual real estate company reporting disciplines.
27.2%
11.6%
-76.7%
-12.5%
0.0%
83.3%
330.0%
-12.5%
19.6%
$631,000
$389
16
22
43
93
2.7
51.2%
$698,000
$600,000
$405
19
22
53
49
2.8
41.5%
$664,500
$776,000
$422
10
28
48
77
4.8
58.3%
$648,538
$610,000
$378
43
32
48
42
1.1
66.7%
$542,231
San Gabriel
MAY
JUN
JUL
AUG
SEP
OCT
NOV
DEC
JAN
FEB
MAR
APR
MAY
*Information obtained from Broker Metrics, The MLS and Foreclosure Radar for all areas in Los Angeles Mirco Market Report. Statistics are subject to change due to individual real estate company reporting disciplines.
8.2%
4.9%
-4.4%
-6.4%
21.6%
45.5%
27.2%
-23.0%
15.9%
$605,000
$502
47
68
126
63
2.7
54.0%
$774,667
$690,000
$434
75
80
162
47
2.2
49.4%
$716,500
$806,000
$493
87
88
186
48
2.1
47.3%
$710,308
$745,000
$470
91
94
153
33
1.7
61.4%
$612,615
Pasadena
2.1
$493
$806,000
$745
$806
$610
$776

MEDIAN SALES PRICE
AVERAGE PRICE PER SQ FT
MONTH’S SUPPLY OF INVENTORY
Median Price .........................................................
Average Price per Square Foot ..........................
Properties Sold ......................................................
Properties Pending Sale ......................................
Properties For Sale ...............................................
Days on Market (Pending Sale) ..........................
Month’s Supply of Inventory ...............................
Percent Under Contract .......................................
Average Median Price for Last 12 Months .......
May 2013 May 2013May 2014 May 20146 month 6 month3 month 3 month% change % changeDATA* DATA*
current market snapshot
M E DIAN SALE S P R ICE ($100 ,000 ’s ) MEDIAN SALES PR ICE ($100 ,000 ’s )
rivierafinancial.com rivierafinancial.com
MEDIAN SALES PRICE
AVERAGE PRICE PER SQ FT
MONTH’S SUPPLY OF INVENTORY
current market snapshot
Riviera Market Intelligence :: May 2014Riviera Market Intelligence :: May 2014
MAY
JUN
JUL
AUG
SEP
OCT
NOV
DEC
JAN
FEB
MAR
APR
MAY
2.6
$434
$846,000
*Information obtained from Broker Metrics, The MLS and Foreclosure Radar for all areas in Los Angeles Mirco Market Report. Statistics are subject to change due to individual real estate company reporting disciplines.
8.5%
12.7%
-9.1%
-30.8%
73.3%
-21.0%
90.7%
-60.1%
18.9%
$840,000
$457
6
9
17
32
2.8
52.9%
$869,333
$835,000
$429
13
9
17
62
1.3
52.9%
$860,000
$846,000
$434
10
9
26
49
2.6
34.6%
$848,154
$780,000
$385
11
13
15
62
1.4
86.7%
$713,615
Sierra Madre
MAY
JUN
JUL
AUG
SEP
OCT
NOV
DEC
JAN
FEB
MAR
APR
MAY
*Information obtained from Broker Metrics, The MLS and Foreclosure Radar for all areas in Los Angeles Mirco Market Report. Statistics are subject to change due to individual real estate company reporting disciplines.
-16.3%
9.7%
-7.7%
0.0%
-15.0%
-6.2%
-7.9%
17.6%
20.9%
$2,280,000
$821
7
10
8
40
1.1
125.0%
$2,207,333
$1,650,000
$670
11
13
12
43
1.1
108.3%
$2,172,000
$1,925,000
$837
12
9
17
30
1.4
52.9%
$2,002,538
$2,300,000
$763
13
9
20
32
1.5
45.0%
$1,655,923
San Marino
1.4
$837
$1,925,000
$2.300
$1.925
$780
$846
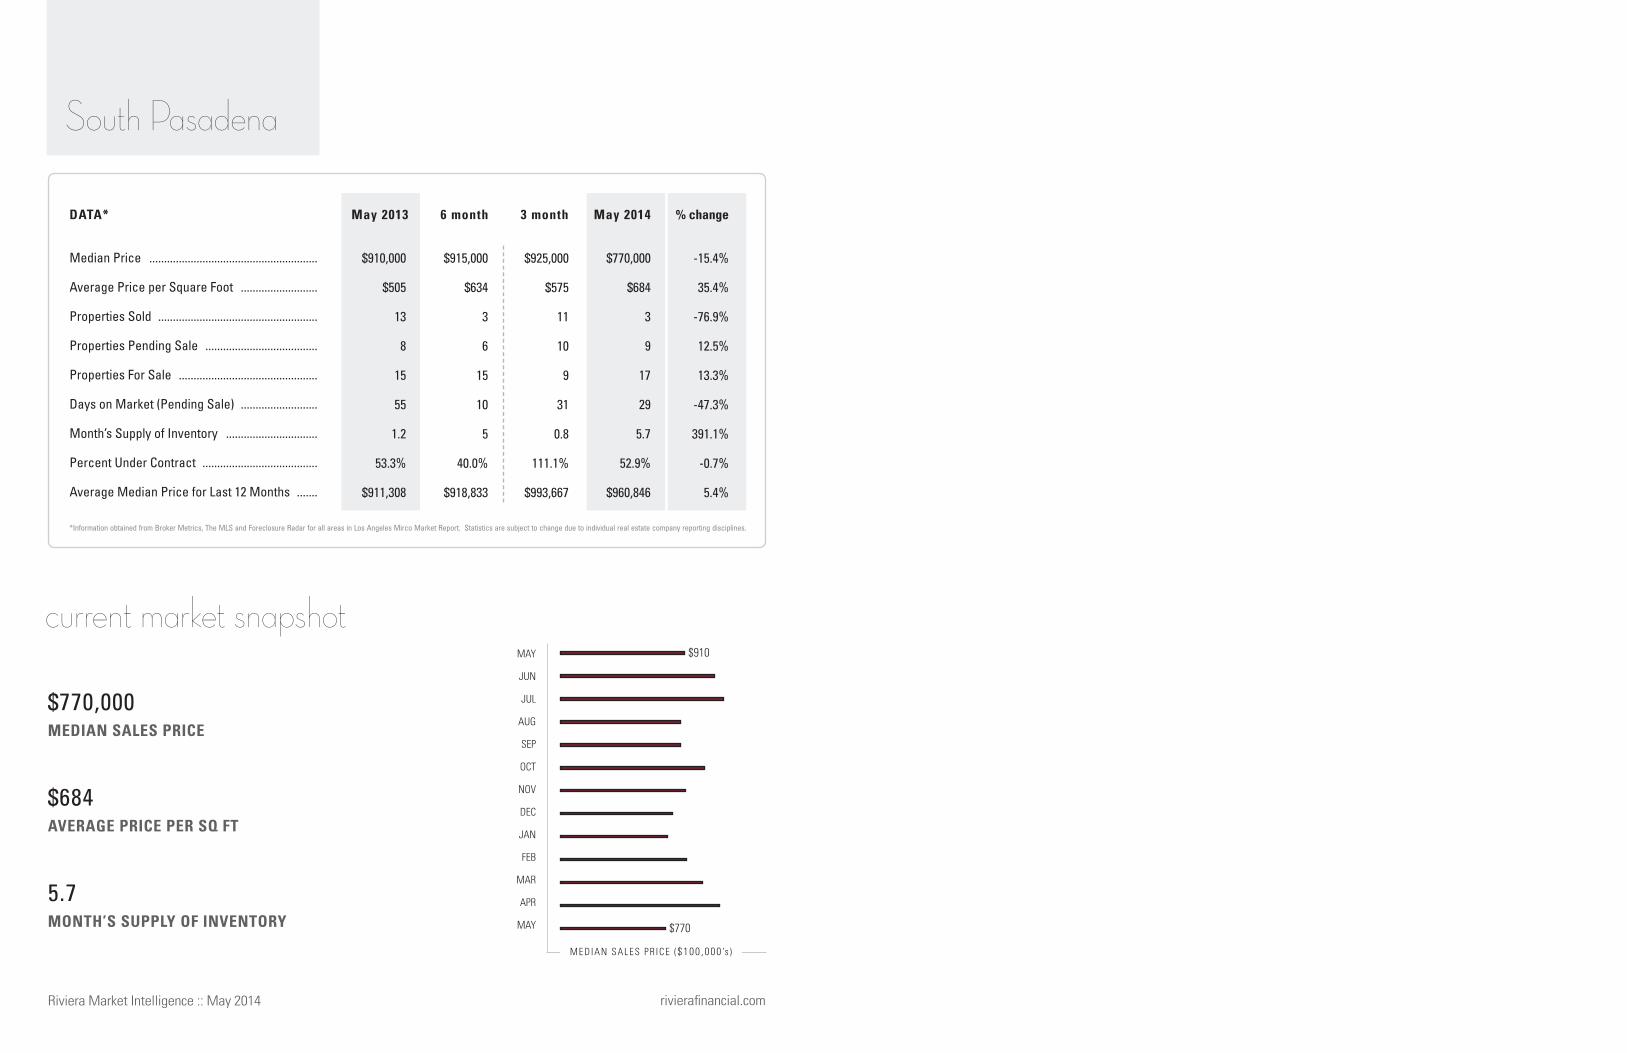
MEDIAN SALES PRICE
AVERAGE PRICE PER SQ FT
MONTH’S SUPPLY OF INVENTORY
Median Price .........................................................
Average Price per Square Foot ..........................
Properties Sold ......................................................
Properties Pending Sale ......................................
Properties For Sale ...............................................
Days on Market (Pending Sale) ..........................
Month’s Supply of Inventory ...............................
Percent Under Contract .......................................
Average Median Price for Last 12 Months .......
May 2013 May 20146 month 3 month % changeDATA*
current market snapshot
M E DIAN SALE S P R ICE ($100 ,000 ’s )
rivierafinancial.comRiviera Market Intelligence :: May 2014
MAY
JUN
JUL
AUG
SEP
OCT
NOV
DEC
JAN
FEB
MAR
APR
MAY
*Information obtained from Broker Metrics, The MLS and Foreclosure Radar for all areas in Los Angeles Mirco Market Report. Statistics are subject to change due to individual real estate company reporting disciplines.
-15.4%
35.4%
-76.9%
12.5%
13.3%
-47.3%
391.1%
-0.7%
5.4%
$925,000
$575
11
10
9
31
0.8
111.1%
$993,667
$915,000
$634
3
6
15
10
5
40.0%
$918,833
$770,000
$684
3
9
17
29
5.7
52.9%
$960,846
$910,000
$505
13
8
15
55
1.2
53.3%
$911,308
South Pasadena
5.7
$684
$770,000
$910
$770

County: ORANGE
Area: 948 SQ MILES
Founded: 1889
Orange County
rivierafinancial.comrivierafinancial.com
Orange County Macro
Aliso Viejo
Balboa Peninsula
Corona del Mar - Spyglass
Coto de Caza
Crystal Cove
Dana Point
East Bluff - Harbor View
East Costa Mesa
Fountain Valley
Huntington Beach
Irvine
Ladera Ranch
Laguna Beach
Laguna Hills
Laguna Niguel
Laguna Woods
Long Beach
Lower Newport Bay - Balboa Island
Mission Viejo
Newport Beach
Newport Coast
Newport Heights
Rancho Santa Margarita
San Clemente
San Juan Capistrano
Shady Canyon
Turtle Ridge
Turtle Rock
West Bay - Santa Ana Heights
West Newport - Lido
Westminster
Riviera Market Intelligence :: May 2014Riviera Market Intelligence :: May 2014

MEDIAN SALES PRICE
AVERAGE PRICE PER SQ FT
MONTH’S SUPPLY OF INVENTORY
Median Price .........................................................
Average Price per Square Foot ..........................
Properties Sold ......................................................
Properties Pending Sale ......................................
Properties For Sale ...............................................
Days on Market (Pending Sale) ..........................
Month’s Supply of Inventory ...............................
Percent Under Contract .......................................
Average Median Price for Last 12 Months .......
May 2013 May 2013May 2014 May 20146 month 6 month3 month 3 month% change % changeDATA* DATA*
current market snapshot
M E DIAN SALE S P R ICE ($100 ,000 ’s ) MEDIAN SALES PR ICE ($100 ,000 ’s )
rivierafinancial.com rivierafinancial.com
MEDIAN SALES PRICE
AVERAGE PRICE PER SQ FT
MONTH’S SUPPLY OF INVENTORY
current market snapshot
Riviera Market Intelligence :: May 2014Riviera Market Intelligence :: May 2014
MAY
JUN
JUL
AUG
SEP
OCT
NOV
DEC
JAN
FEB
MAR
APR
MAY
2.7
$351
$715,000
*Information obtained from Broker Metrics, The MLS and Foreclosure Radar for all areas in Los Angeles Mirco Market Report. Statistics are subject to change due to individual real estate company reporting disciplines.
6.7%
10.0%
63.2%
9.1%
37.7%
34.2%
-15.6%
-20.8%
14.1%
$740,000
$348
9
18
72
77
8
25.0%
$697,000
$718,000
$347
11
11
67
70
6.1
16.4%
$722,667
$715,000
$351
31
24
84
51
2.7
28.6%
$701,838
$670,000
$319
19
22
61
38
3.2
36.1%
$615,000
Aliso Viejo
MAY
JUN
JUL
AUG
SEP
OCT
NOV
DEC
JAN
FEB
MAR
APR
MAY
*Information obtained from Broker Metrics, The MLS and Foreclosure Radar for all areas in Los Angeles Mirco Market Report. Statistics are subject to change due to individual real estate company reporting disciplines.
7.3%
7.4%
-12.6%
-3.4%
11.2%
-1.9%
27.2%
-13.1%
17.2%
$664,500
$411
1030
1374
6,174
68
6
22.3%
$667,000
$649,000
$382
1334
1253
6,600
72
4.9
19.0%
$661,033
$676,000
$405
1701
1820
7,189
51
4.2
25.3%
$651,762
$630,000
$377
1946
1885
6,467
52
3.3
29.1%
$556,000
Orange County
4.2
$405
$676,000
$630
$676
$670
$715
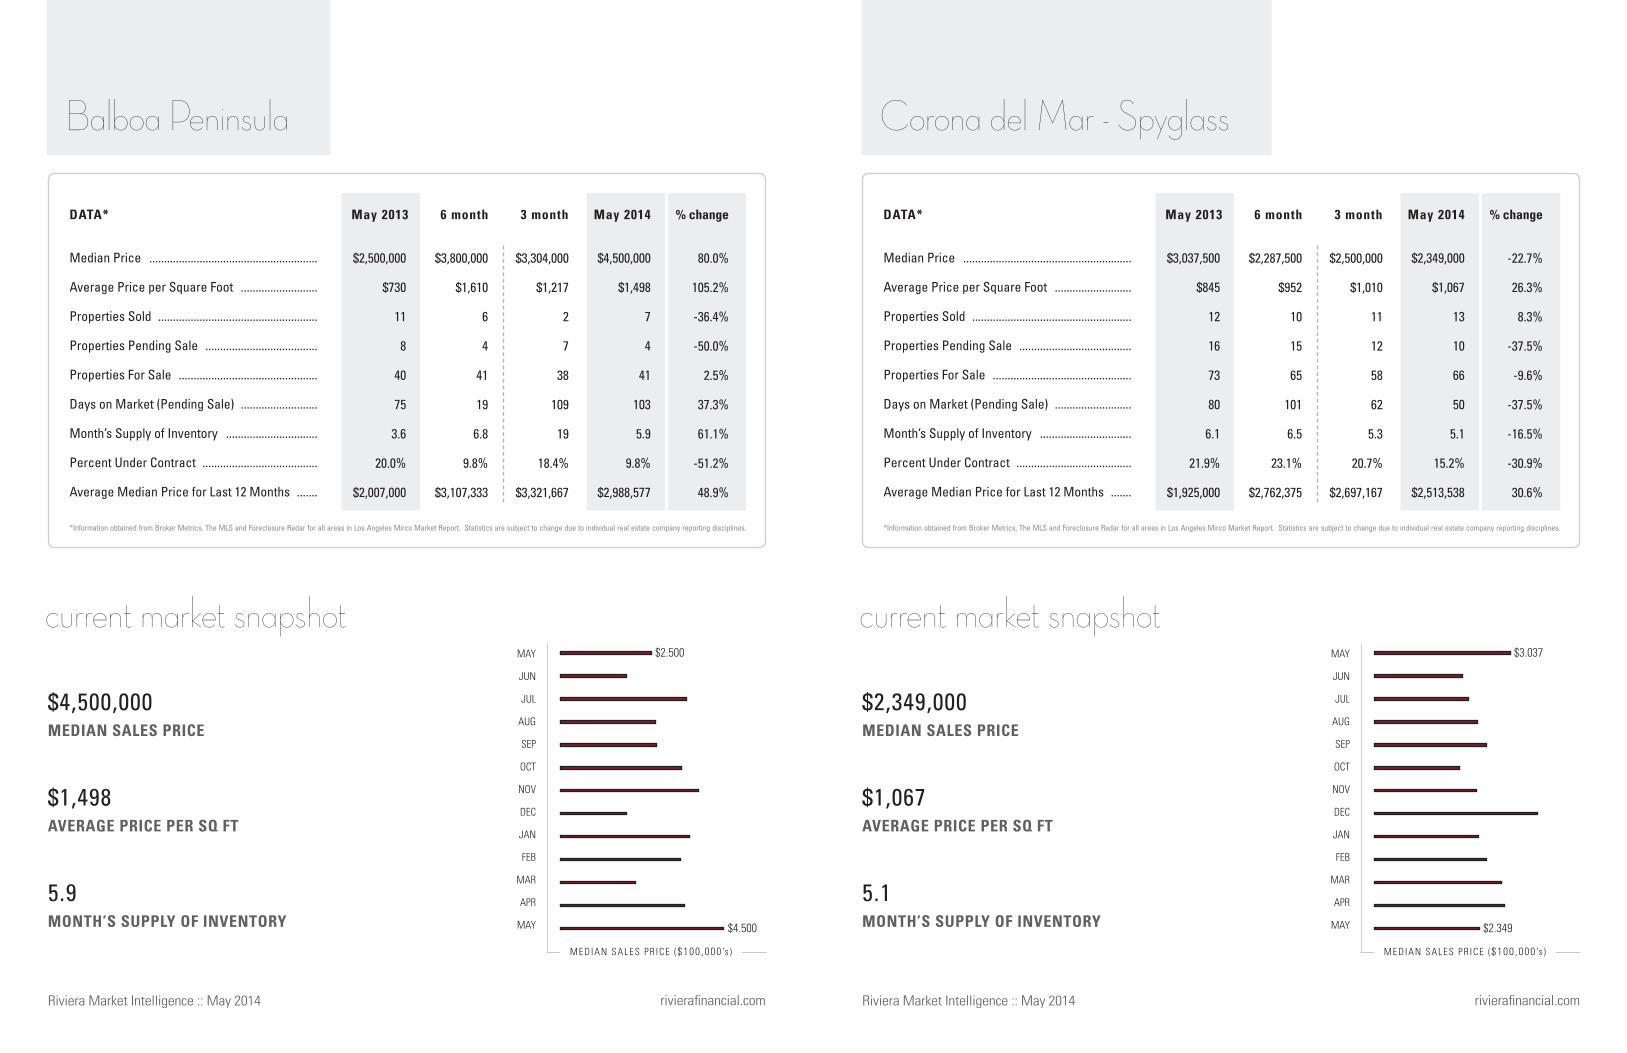
MEDIAN SALES PRICE
AVERAGE PRICE PER SQ FT
MONTH’S SUPPLY OF INVENTORY
Median Price .........................................................
Average Price per Square Foot ..........................
Properties Sold ......................................................
Properties Pending Sale ......................................
Properties For Sale ...............................................
Days on Market (Pending Sale) ..........................
Month’s Supply of Inventory ...............................
Percent Under Contract .......................................
Average Median Price for Last 12 Months .......
May 2013 May 2013May 2014 May 20146 month 6 month3 month 3 month% change % changeDATA* DATA*
current market snapshot
M E DIAN SALE S P R ICE ($100 ,000 ’s ) MEDIAN SALES PR ICE ($100 ,000 ’s )
rivierafinancial.com rivierafinancial.com
MEDIAN SALES PRICE
AVERAGE PRICE PER SQ FT
MONTH’S SUPPLY OF INVENTORY
current market snapshot
Riviera Market Intelligence :: May 2014Riviera Market Intelligence :: May 2014
MAY
JUN
JUL
AUG
SEP
OCT
NOV
DEC
JAN
FEB
MAR
APR
MAY
5.1
$1,067
$2,349,000
*Information obtained from Broker Metrics, The MLS and Foreclosure Radar for all areas in Los Angeles Mirco Market Report. Statistics are subject to change due to individual real estate company reporting disciplines.
-22.7%
26.3%
8.3%
-37.5%
-9.6%
-37.5%
-16.5%
-30.9%
30.6%
$2,500,000
$1,010
11
12
58
62
5.3
20.7%
$2,697,167
$2,287,500
$952
10
15
65
101
6.5
23.1%
$2,762,375
$2,349,000
$1,067
13
10
66
50
5.1
15.2%
$2,513,538
$3,037,500
$845
12
16
73
80
6.1
21.9%
$1,925,000
Corona del Mar - Spyglass
MAY
JUN
JUL
AUG
SEP
OCT
NOV
DEC
JAN
FEB
MAR
APR
MAY
*Information obtained from Broker Metrics, The MLS and Foreclosure Radar for all areas in Los Angeles Mirco Market Report. Statistics are subject to change due to individual real estate company reporting disciplines.
80.0%
105.2%
-36.4%
-50.0%
2.5%
37.3%
61.1%
-51.2%
48.9%
$3,304,000
$1,217
2
7
38
109
19
18.4%
$3,321,667
$3,800,000
$1,610
6
4
41
19
6.8
9.8%
$3,107,333
$4,500,000
$1,498
7
4
41
103
5.9
9.8%
$2,988,577
$2,500,000
$730
11
8
40
75
3.6
20.0%
$2,007,000
Balboa Peninsula
5.9
$1,498
$4,500,000
$2.500
$4.500
$3.037
$2.349
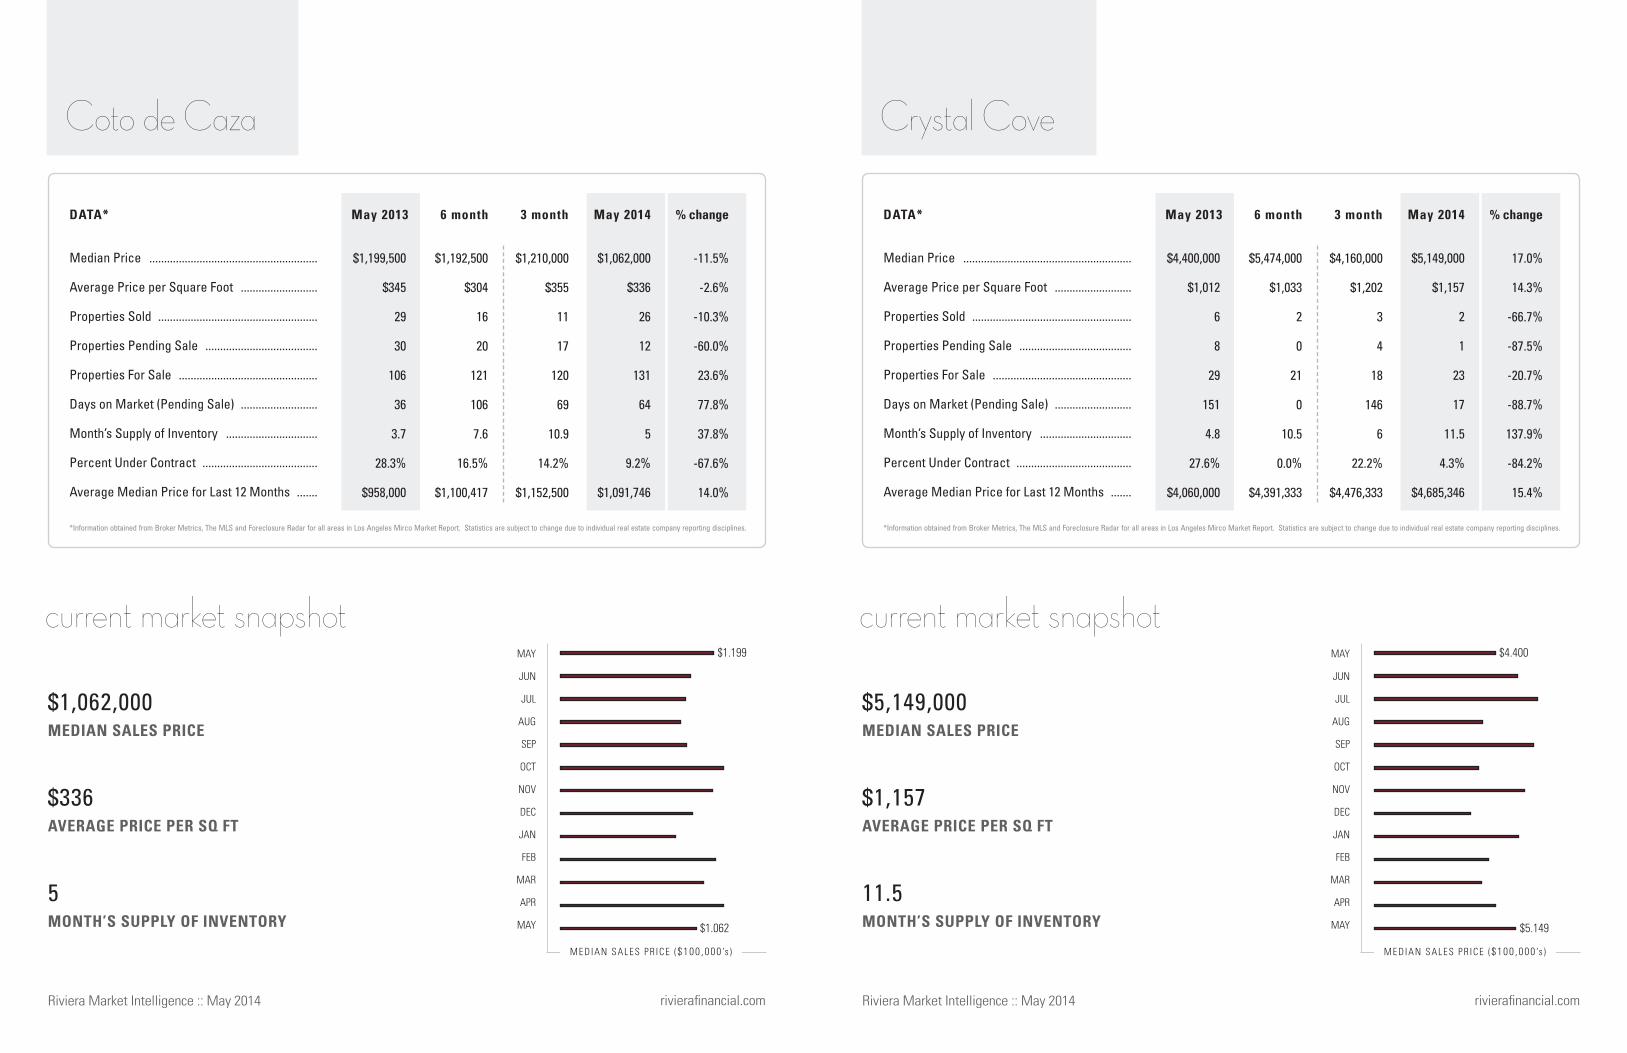
MEDIAN SALES PRICE
AVERAGE PRICE PER SQ FT
MONTH’S SUPPLY OF INVENTORY
Median Price .........................................................
Average Price per Square Foot ..........................
Properties Sold ......................................................
Properties Pending Sale ......................................
Properties For Sale ...............................................
Days on Market (Pending Sale) ..........................
Month’s Supply of Inventory ...............................
Percent Under Contract .......................................
Average Median Price for Last 12 Months .......
May 2013 May 2013May 2014 May 20146 month 6 month3 month 3 month% change % changeDATA* DATA*
current market snapshot
M E DIAN SALE S P R ICE ($100 ,000 ’s ) MEDIAN SALES PR ICE ($100 ,000 ’s )
rivierafinancial.com rivierafinancial.com
MEDIAN SALES PRICE
AVERAGE PRICE PER SQ FT
MONTH’S SUPPLY OF INVENTORY
current market snapshot
Riviera Market Intelligence :: May 2014Riviera Market Intelligence :: May 2014
MAY
JUN
JUL
AUG
SEP
OCT
NOV
DEC
JAN
FEB
MAR
APR
MAY
11.5
$1,157
$5,149,000
*Information obtained from Broker Metrics, The MLS and Foreclosure Radar for all areas in Los Angeles Mirco Market Report. Statistics are subject to change due to individual real estate company reporting disciplines.
17.0%
14.3%
-66.7%
-87.5%
-20.7%
-88.7%
137.9%
-84.2%
15.4%
$4,160,000
$1,202
3
4
18
146
6
22.2%
$4,476,333
$5,474,000
$1,033
2
0
21
0
10.5
0.0%
$4,391,333
$5,149,000
$1,157
2
1
23
17
11.5
4.3%
$4,685,346
$4,400,000
$1,012
6
8
29
151
4.8
27.6%
$4,060,000
Crystal Cove
MAY
JUN
JUL
AUG
SEP
OCT
NOV
DEC
JAN
FEB
MAR
APR
MAY
*Information obtained from Broker Metrics, The MLS and Foreclosure Radar for all areas in Los Angeles Mirco Market Report. Statistics are subject to change due to individual real estate company reporting disciplines.
-11.5%
-2.6%
-10.3%
-60.0%
23.6%
77.8%
37.8%
-67.6%
14.0%
$1,210,000
$355
11
17
120
69
10.9
14.2%
$1,152,500
$1,192,500
$304
16
20
121
106
7.6
16.5%
$1,100,417
$1,062,000
$336
26
12
131
64
5
9.2%
$1,091,746
$1,199,500
$345
29
30
106
36
3.7
28.3%
$958,000
Coto de Caza
5
$336
$1,062,000
$1.199
$1.062
$4.400
$5.149

MEDIAN SALES PRICE
AVERAGE PRICE PER SQ FT
MONTH’S SUPPLY OF INVENTORY
Median Price .........................................................
Average Price per Square Foot ..........................
Properties Sold ......................................................
Properties Pending Sale ......................................
Properties For Sale ...............................................
Days on Market (Pending Sale) ..........................
Month’s Supply of Inventory ...............................
Percent Under Contract .......................................
Average Median Price for Last 12 Months .......
May 2013 May 2013May 2014 May 20146 month 6 month3 month 3 month% change % changeDATA* DATA*
current market snapshot
M E DIAN SALE S P R ICE ($100 ,000 ’s ) MEDIAN SALES PR ICE ($100 ,000 ’s )
rivierafinancial.com rivierafinancial.com
MEDIAN SALES PRICE
AVERAGE PRICE PER SQ FT
MONTH’S SUPPLY OF INVENTORY
current market snapshot
Riviera Market Intelligence :: May 2014Riviera Market Intelligence :: May 2014
MAY
JUN
JUL
AUG
SEP
OCT
NOV
DEC
JAN
FEB
MAR
APR
MAY
6.3
$667
$1,925,000
*Information obtained from Broker Metrics, The MLS and Foreclosure Radar for all areas in Los Angeles Mirco Market Report. Statistics are subject to change due to individual real estate company reporting disciplines.
1.0%
16.2%
-24.0%
-12.0%
54.5%
-2.0%
103.3%
-43.1%
24.1%
$1,675,000
$631
18
10
77
35
4.3
13.0%
$1,767,333
$1,860,500
$602
16
20
77
61
4.8
26.0%
$1,702,250
$1,925,000
$667
19
22
119
49
6.3
18.5%
$1,752,135
$1,905,000
$574
25
25
77
50
3.1
32.5%
$1,412,000
East Bluff - Harbor View
MAY
JUN
JUL
AUG
SEP
OCT
NOV
DEC
JAN
FEB
MAR
APR
MAY
*Information obtained from Broker Metrics, The MLS and Foreclosure Radar for all areas in Los Angeles Mirco Market Report. Statistics are subject to change due to individual real estate company reporting disciplines.
-17.6%
14.1%
-31.8%
-15.6%
11.5%
-4.5%
63.6%
-24.3%
18.9%
$914,500
$708
25
27
142
86
5.7
19.0%
$907,317
$827,500
$440
34
31
176
57
5.2
17.6%
$882,742
$832,000
$541
30
38
213
64
7.1
17.8%
$910,765
$1,010,000
$474
44
45
191
67
4.3
23.6%
$766,000
Dana Point
7.1
$541
$832,000
$1.010
$832
$1.905
$1.925

MEDIAN SALES PRICE
AVERAGE PRICE PER SQ FT
MONTH’S SUPPLY OF INVENTORY
Median Price .........................................................
Average Price per Square Foot ..........................
Properties Sold ......................................................
Properties Pending Sale ......................................
Properties For Sale ...............................................
Days on Market (Pending Sale) ..........................
Month’s Supply of Inventory ...............................
Percent Under Contract .......................................
Average Median Price for Last 12 Months .......
May 2013 May 2013May 2014 May 20146 month 6 month3 month 3 month% change % changeDATA* DATA*
current market snapshot
M E DIAN SALE S P R ICE ($100 ,000 ’s ) MEDIAN SALES PR ICE ($100 ,000 ’s )
rivierafinancial.com rivierafinancial.com
MEDIAN SALES PRICE
AVERAGE PRICE PER SQ FT
MONTH’S SUPPLY OF INVENTORY
current market snapshot
Riviera Market Intelligence :: May 2014Riviera Market Intelligence :: May 2014
MAY
JUN
JUL
AUG
SEP
OCT
NOV
DEC
JAN
FEB
MAR
APR
MAY
3.5
$353
$699,900
*Information obtained from Broker Metrics, The MLS and Foreclosure Radar for all areas in Los Angeles Mirco Market Report. Statistics are subject to change due to individual real estate company reporting disciplines.
12.0%
11.7%
-19.4%
-50.0%
10.1%
-2.9%
36.6%
-54.6%
12.6%
$647,000
$338
20
32
78
28
3.9
41.0%
$679,667
$670,000
$330
20
17
75
24
3.8
22.7%
$665,167
$699,900
$353
25
17
87
33
3.5
19.5%
$658,500
$625,000
$316
31
34
79
34
2.5
43.0%
$585,000
Fountain Valley
MAY
JUN
JUL
AUG
SEP
OCT
NOV
DEC
JAN
FEB
MAR
APR
MAY
*Information obtained from Broker Metrics, The MLS and Foreclosure Radar for all areas in Los Angeles Mirco Market Report. Statistics are subject to change due to individual real estate company reporting disciplines.
11.0%
27.2%
25.0%
5.6%
32.7%
131.0%
6.2%
-20.5%
17.0%
$737,000
$499
12
21
71
50
5.9
29.6%
$899,065
$846,600
$424
13
10
59
51
4.5
16.9%
$863,199
$962,694
$543
20
19
73
67
3.6
26.0%
$861,426
$867,500
$427
16
18
55
29
3.4
32.7%
$736,000
East Costa Mesa
3.6
$543
$962,694
$867
$962
$625
$699

MEDIAN SALES PRICE
AVERAGE PRICE PER SQ FT
MONTH’S SUPPLY OF INVENTORY
Median Price .........................................................
Average Price per Square Foot ..........................
Properties Sold ......................................................
Properties Pending Sale ......................................
Properties For Sale ...............................................
Days on Market (Pending Sale) ..........................
Month’s Supply of Inventory ...............................
Percent Under Contract .......................................
Average Median Price for Last 12 Months .......
May 2013 May 2013May 2014 May 20146 month 6 month3 month 3 month% change % changeDATA* DATA*
current market snapshot
M E DIAN SALE S P R ICE ($100 ,000 ’s ) MEDIAN SALES PR ICE ($100 ,000 ’s )
rivierafinancial.com rivierafinancial.com
MEDIAN SALES PRICE
AVERAGE PRICE PER SQ FT
MONTH’S SUPPLY OF INVENTORY
current market snapshot
Riviera Market Intelligence :: May 2014Riviera Market Intelligence :: May 2014
MAY
JUN
JUL
AUG
SEP
OCT
NOV
DEC
JAN
FEB
MAR
APR
MAY
4.7
$474
$895,000
*Information obtained from Broker Metrics, The MLS and Foreclosure Radar for all areas in Los Angeles Mirco Market Report. Statistics are subject to change due to individual real estate company reporting disciplines.
-4.3%
4.2%
-3.1%
0.0%
50.7%
62.5%
55.5%
-33.6%
11.3%
$940,000
$476
53
82
307
52
5.8
26.7%
$905,833
$825,000
$453
79
71
321
55
4.1
22.1%
$899,865
$895,000
$474
94
100
443
52
4.7
22.6%
$897,322
$935,000
$455
97
100
294
32
3
34.0%
$806,000
Irvine
MAY
JUN
JUL
AUG
SEP
OCT
NOV
DEC
JAN
FEB
MAR
APR
MAY
*Information obtained from Broker Metrics, The MLS and Foreclosure Radar for all areas in Los Angeles Mirco Market Report. Statistics are subject to change due to individual real estate company reporting disciplines.
5.0%
6.2%
-19.8%
-11.3%
23.1%
78.4%
53.5%
-27.9%
14.0%
$774,500
$420
56
100
346
49
6.2
28.9%
$740,117
$710,000
$398
91
97
367
61
4
26.4%
$737,975
$730,000
$427
105
110
427
66
4.1
25.8%
$728,527
$695,000
$402
131
124
347
37
2.6
35.7%
$639,000
Huntington Beach
4.1
$427
$730,000
$695
$730
$935
$895
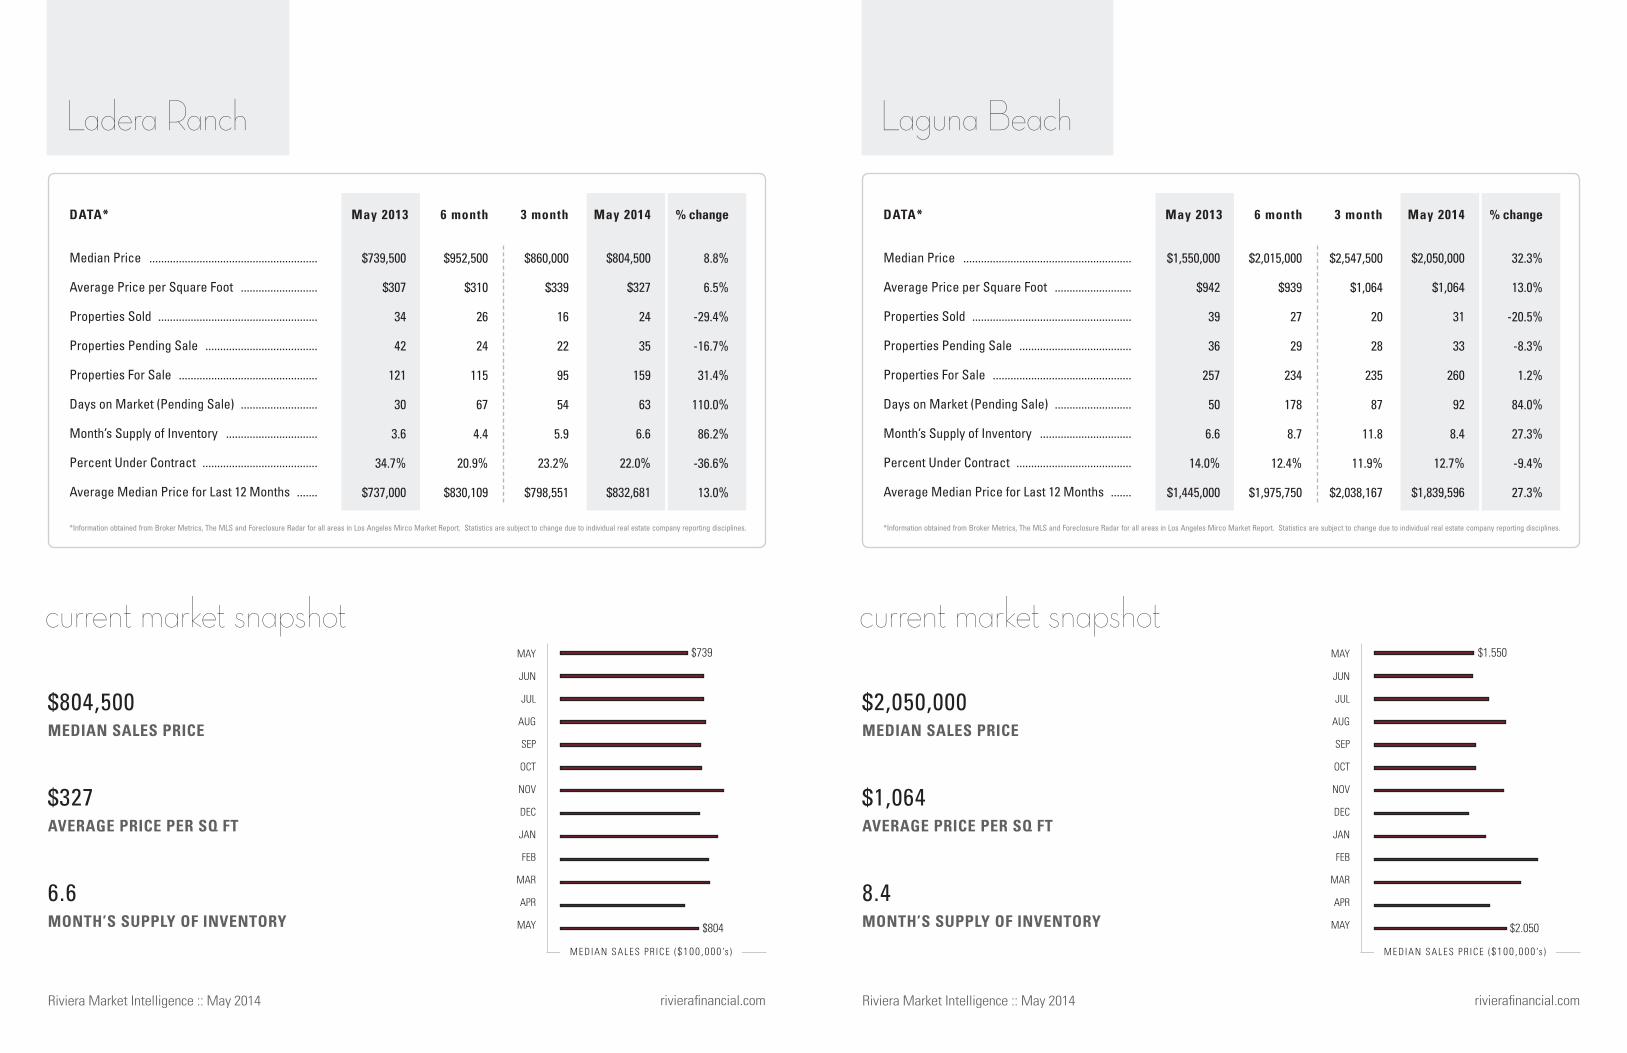
MEDIAN SALES PRICE
AVERAGE PRICE PER SQ FT
MONTH’S SUPPLY OF INVENTORY
Median Price .........................................................
Average Price per Square Foot ..........................
Properties Sold ......................................................
Properties Pending Sale ......................................
Properties For Sale ...............................................
Days on Market (Pending Sale) ..........................
Month’s Supply of Inventory ...............................
Percent Under Contract .......................................
Average Median Price for Last 12 Months .......
May 2013 May 2013May 2014 May 20146 month 6 month3 month 3 month% change % changeDATA* DATA*
current market snapshot
M E DIAN SALE S P R ICE ($100 ,000 ’s ) MEDIAN SALES PR ICE ($100 ,000 ’s )
rivierafinancial.com rivierafinancial.com
MEDIAN SALES PRICE
AVERAGE PRICE PER SQ FT
MONTH’S SUPPLY OF INVENTORY
current market snapshot
Riviera Market Intelligence :: May 2014Riviera Market Intelligence :: May 2014
MAY
JUN
JUL
AUG
SEP
OCT
NOV
DEC
JAN
FEB
MAR
APR
MAY
8.4
$1,064
$2,050,000
*Information obtained from Broker Metrics, The MLS and Foreclosure Radar for all areas in Los Angeles Mirco Market Report. Statistics are subject to change due to individual real estate company reporting disciplines.
32.3%
13.0%
-20.5%
-8.3%
1.2%
84.0%
27.3%
-9.4%
27.3%
$2,547,500
$1,064
20
28
235
87
11.8
11.9%
$2,038,167
$2,015,000
$939
27
29
234
178
8.7
12.4%
$1,975,750
$2,050,000
$1,064
31
33
260
92
8.4
12.7%
$1,839,596
$1,550,000
$942
39
36
257
50
6.6
14.0%
$1,445,000
Laguna Beach
MAY
JUN
JUL
AUG
SEP
OCT
NOV
DEC
JAN
FEB
MAR
APR
MAY
*Information obtained from Broker Metrics, The MLS and Foreclosure Radar for all areas in Los Angeles Mirco Market Report. Statistics are subject to change due to individual real estate company reporting disciplines.
8.8%
6.5%
-29.4%
-16.7%
31.4%
110.0%
86.2%
-36.6%
13.0%
$860,000
$339
16
22
95
54
5.9
23.2%
$798,551
$952,500
$310
26
24
115
67
4.4
20.9%
$830,109
$804,500
$327
24
35
159
63
6.6
22.0%
$832,681
$739,500
$307
34
42
121
30
3.6
34.7%
$737,000
Ladera Ranch
6.6
$327
$804,500
$739
$804
$1.550
$2.050
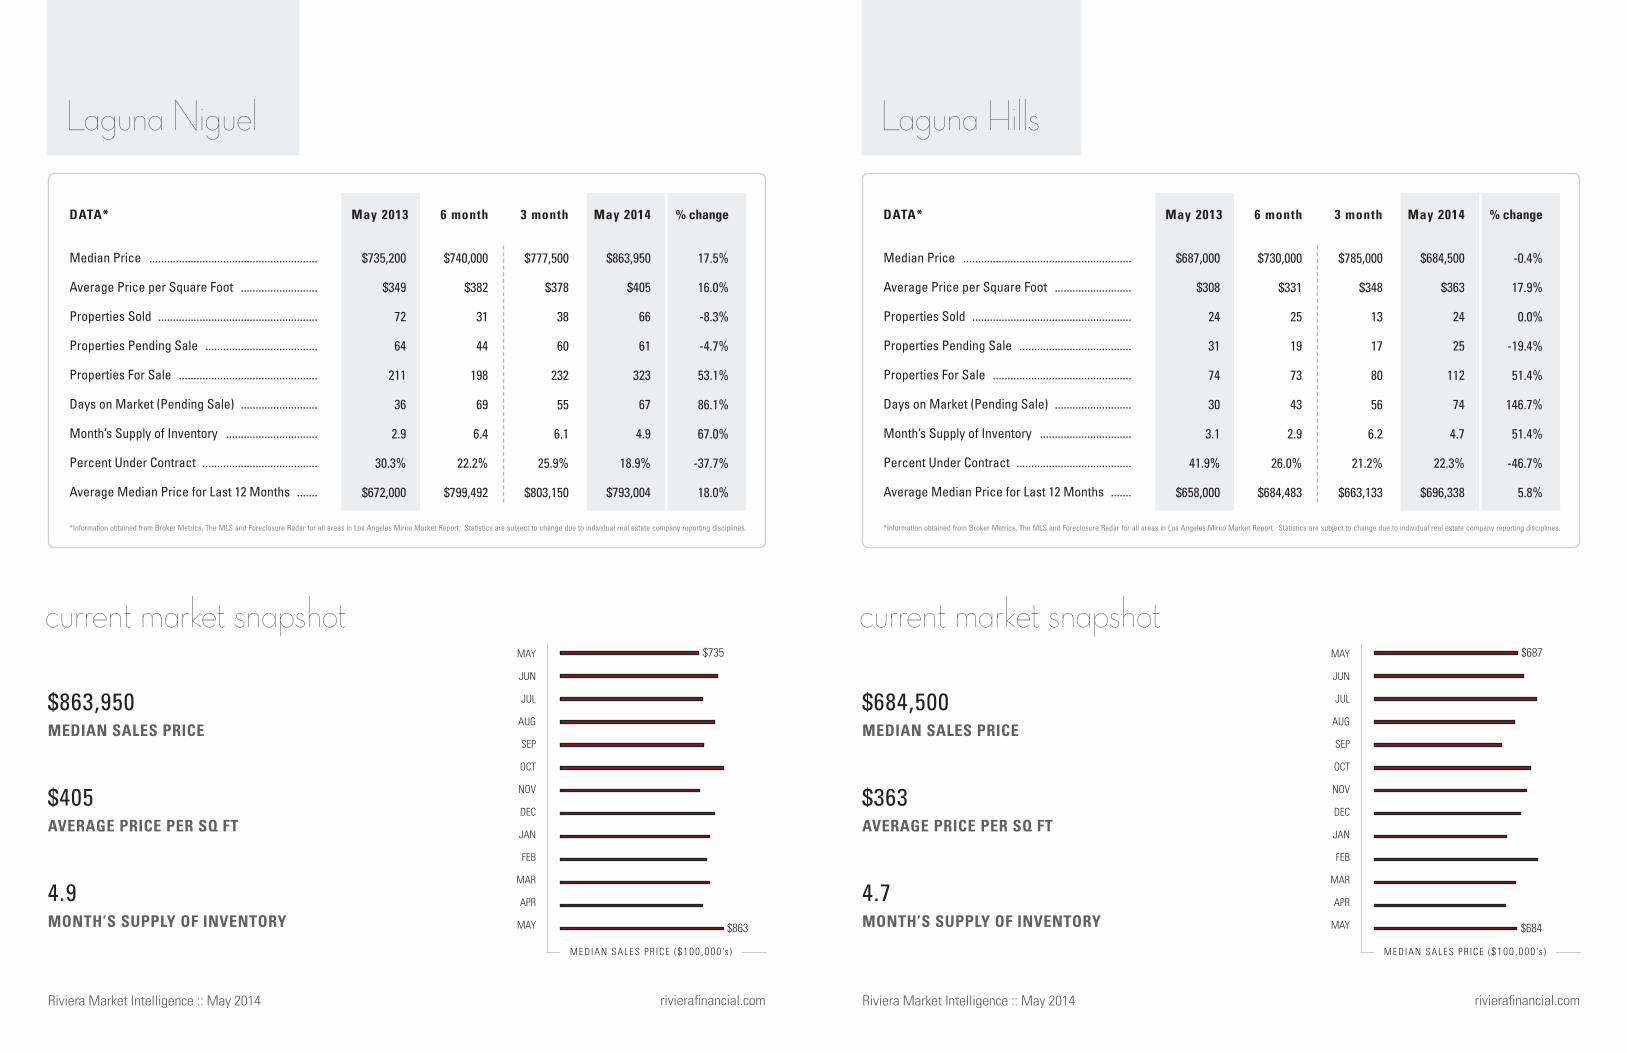
MEDIAN SALES PRICE
AVERAGE PRICE PER SQ FT
MONTH’S SUPPLY OF INVENTORY
Median Price .........................................................
Average Price per Square Foot ..........................
Properties Sold ......................................................
Properties Pending Sale ......................................
Properties For Sale ...............................................
Days on Market (Pending Sale) ..........................
Month’s Supply of Inventory ...............................
Percent Under Contract .......................................
Average Median Price for Last 12 Months .......
May 2013 May 2013May 2014 May 20146 month 6 month3 month 3 month% change % changeDATA* DATA*
current market snapshot
M E DIAN SALE S P R ICE ($100 ,000 ’s ) MEDIAN SALES PR ICE ($100 ,000 ’s )
rivierafinancial.com rivierafinancial.com
MEDIAN SALES PRICE
AVERAGE PRICE PER SQ FT
MONTH’S SUPPLY OF INVENTORY
current market snapshot
Riviera Market Intelligence :: May 2014Riviera Market Intelligence :: May 2014
MAY
JUN
JUL
AUG
SEP
OCT
NOV
DEC
JAN
FEB
MAR
APR
MAY
4.7
$363
$684,500
*Information obtained from Broker Metrics, The MLS and Foreclosure Radar for all areas in Los Angeles Mirco Market Report. Statistics are subject to change due to individual real estate company reporting disciplines.
-0.4%
17.9%
0.0%
-19.4%
51.4%
146.7%
51.4%
-46.7%
5.8%
$785,000
$348
13
17
80
56
6.2
21.2%
$663,133
$730,000
$331
25
19
73
43
2.9
26.0%
$684,483
$684,500
$363
24
25
112
74
4.7
22.3%
$696,338
$687,000
$308
24
31
74
30
3.1
41.9%
$658,000
Laguna Hills
MAY
JUN
JUL
AUG
SEP
OCT
NOV
DEC
JAN
FEB
MAR
APR
MAY
*Information obtained from Broker Metrics, The MLS and Foreclosure Radar for all areas in Los Angeles Mirco Market Report. Statistics are subject to change due to individual real estate company reporting disciplines.
17.5%
16.0%
-8.3%
-4.7%
53.1%
86.1%
67.0%
-37.7%
18.0%
$777,500
$378
38
60
232
55
6.1
25.9%
$803,150
$740,000
$382
31
44
198
69
6.4
22.2%
$799,492
$863,950
$405
66
61
323
67
4.9
18.9%
$793,004
$735,200
$349
72
64
211
36
2.9
30.3%
$672,000
Laguna Niguel
4.9
$405
$863,950
$735
$863
$687
$684

MEDIAN SALES PRICE
AVERAGE PRICE PER SQ FT
MONTH’S SUPPLY OF INVENTORY
Median Price .........................................................
Average Price per Square Foot ..........................
Properties Sold ......................................................
Properties Pending Sale ......................................
Properties For Sale ...............................................
Days on Market (Pending Sale) ..........................
Month’s Supply of Inventory ...............................
Percent Under Contract .......................................
Average Median Price for Last 12 Months .......
May 2013 May 2013May 2014 May 20146 month 6 month3 month 3 month% change % changeDATA* DATA*
current market snapshot
M E DIAN SALE S P R ICE ($100 ,000 ’s ) MEDIAN SALES PR ICE ($100 ,000 ’s )
rivierafinancial.com rivierafinancial.com
MEDIAN SALES PRICE
AVERAGE PRICE PER SQ FT
MONTH’S SUPPLY OF INVENTORY
current market snapshot
Riviera Market Intelligence :: May 2014Riviera Market Intelligence :: May 2014
MAY
JUN
JUL
AUG
SEP
OCT
NOV
DEC
JAN
FEB
MAR
APR
MAY
4.1
$1,026
$1,955,100
*Information obtained from Broker Metrics, The MLS and Foreclosure Radar for all areas in Los Angeles Mirco Market Report. Statistics are subject to change due to individual real estate company reporting disciplines.
39.6%
11.6%
42.9%
0.0%
20.6%
-23.1%
-15.6%
-17.1%
24.1%
$2,762,500
$1,563
4
2
41
74
10.2
4.9%
$3,385,033
$2,150,000
$955
5
4
38
36
7.6
10.5%
$2,957,058
$1,955,100
$1,026
10
4
41
60
4.1
9.8%
$2,832,681
$1,400,000
$919
7
4
34
78
4.9
11.8%
$2,282,000
Lower Newport Bay - Balboa Island
MAY
JUN
JUL
AUG
SEP
OCT
NOV
DEC
JAN
FEB
MAR
APR
MAY
*Information obtained from Broker Metrics, The MLS and Foreclosure Radar for all areas in Los Angeles Mirco Market Report. Statistics are subject to change due to individual real estate company reporting disciplines.
0%
0%
0%
-50.0%
-50.0%
215.4%
0%
0.0%
6.7%
$0
$0
0
0
0
0
0
0%
$772,000
$687,000
$382
1
0
2
0
2
0.0%
$627,500
$0
$0
0
1
2
41
0
50.0%
$621,250
$0
$0
0
2
4
13
0
50.0%
$582,000
Laguna Woods
No sales
No sales
No sales
$1.400
$1.955
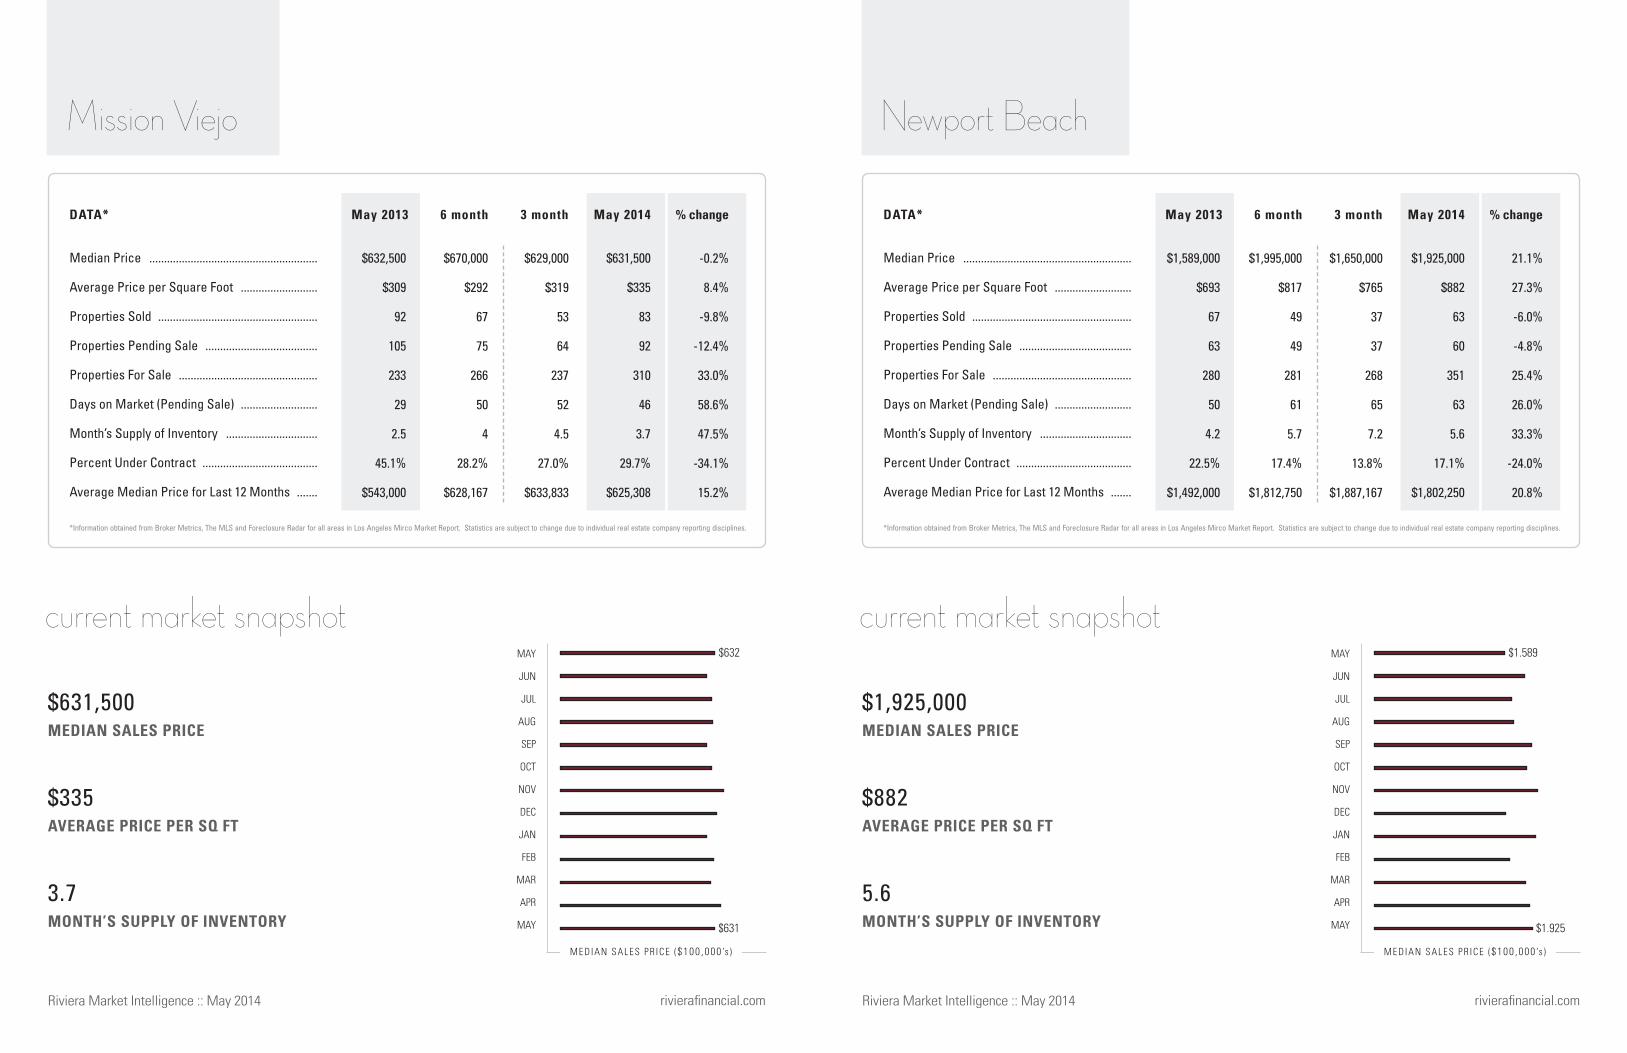
MEDIAN SALES PRICE
AVERAGE PRICE PER SQ FT
MONTH’S SUPPLY OF INVENTORY
Median Price .........................................................
Average Price per Square Foot ..........................
Properties Sold ......................................................
Properties Pending Sale ......................................
Properties For Sale ...............................................
Days on Market (Pending Sale) ..........................
Month’s Supply of Inventory ...............................
Percent Under Contract .......................................
Average Median Price for Last 12 Months .......
May 2013 May 2013May 2014 May 20146 month 6 month3 month 3 month% change % changeDATA* DATA*
current market snapshot
M E DIAN SALE S P R ICE ($100 ,000 ’s ) MEDIAN SALES PR ICE ($100 ,000 ’s )
rivierafinancial.com rivierafinancial.com
MEDIAN SALES PRICE
AVERAGE PRICE PER SQ FT
MONTH’S SUPPLY OF INVENTORY
current market snapshot
Riviera Market Intelligence :: May 2014Riviera Market Intelligence :: May 2014
MAY
JUN
JUL
AUG
SEP
OCT
NOV
DEC
JAN
FEB
MAR
APR
MAY
5.6
$882
$1,925,000
*Information obtained from Broker Metrics, The MLS and Foreclosure Radar for all areas in Los Angeles Mirco Market Report. Statistics are subject to change due to individual real estate company reporting disciplines.
21.1%
27.3%
-6.0%
-4.8%
25.4%
26.0%
33.3%
-24.0%
20.8%
$1,650,000
$765
37
37
268
65
7.2
13.8%
$1,887,167
$1,995,000
$817
49
49
281
61
5.7
17.4%
$1,812,750
$1,925,000
$882
63
60
351
63
5.6
17.1%
$1,802,250
$1,589,000
$693
67
63
280
50
4.2
22.5%
$1,492,000
Newport Beach
MAY
JUN
JUL
AUG
SEP
OCT
NOV
DEC
JAN
FEB
MAR
APR
MAY
*Information obtained from Broker Metrics, The MLS and Foreclosure Radar for all areas in Los Angeles Mirco Market Report. Statistics are subject to change due to individual real estate company reporting disciplines.
-0.2%
8.4%
-9.8%
-12.4%
33.0%
58.6%
47.5%
-34.1%
15.2%
$629,000
$319
53
64
237
52
4.5
27.0%
$633,833
$670,000
$292
67
75
266
50
4
28.2%
$628,167
$631,500
$335
83
92
310
46
3.7
29.7%
$625,308
$632,500
$309
92
105
233
29
2.5
45.1%
$543,000
Mission Viejo
3.7
$335
$631,500
$632
$631
$1.589
$1.925

MEDIAN SALES PRICE
AVERAGE PRICE PER SQ FT
MONTH’S SUPPLY OF INVENTORY
Median Price .........................................................
Average Price per Square Foot ..........................
Properties Sold ......................................................
Properties Pending Sale ......................................
Properties For Sale ...............................................
Days on Market (Pending Sale) ..........................
Month’s Supply of Inventory ...............................
Percent Under Contract .......................................
Average Median Price for Last 12 Months .......
Median Price .........................................................
Average Price per Square Foot ..........................
Properties Sold ......................................................
Properties Pending Sale ......................................
Properties For Sale ...............................................
Days on Market (Pending Sale) ..........................
Month’s Supply of Inventory ...............................
Percent Under Contract .......................................
Average Median Price for Last 12 Months .......
May 2013 May 2013May 2014 May 20146 month 6 month3 month 3 month% change % changeDATA* DATA*
current market snapshot
M E DIAN SALE S P R ICE ($100 ,000 ’s ) MEDIAN SALES PR ICE ($100 ,000 ’s )
rivierafinancial.com rivierafinancial.com
MEDIAN SALES PRICE
AVERAGE PRICE PER SQ FT
MONTH’S SUPPLY OF INVENTORY
current market snapshot
Riviera Market Intelligence :: May 2014Riviera Market Intelligence :: May 2014
MAY
JUN
JUL
AUG
SEP
OCT
NOV
DEC
JAN
FEB
MAR
APR
MAY
3.1
$652
$2,416,366
*Information obtained from Broker Metrics, The MLS and Foreclosure Radar for all areas in Los Angeles Mirco Market Report. Statistics are subject to change due to individual real estate company reporting disciplines.
124.8%
6.9%
60.0%
-42.9%
-26.5%
217.6%
-54.0%
-22.3%
14.6%
$1,300,000
$582
3
3
32
84
10.7
9.4%
$2,035,455
$1,315,000
$657
5
3
28
72
5.6
10.7%
$1,895,946
$2,416,366
$652
8
4
25
108
3.1
16.0%
$1,631,398
$1,075,000
$610
5
7
34
34
6.8
20.6%
$1,424,000
Newport Heights
MAY
JUN
JUL
AUG
SEP
OCT
NOV
DEC
JAN
FEB
MAR
APR
MAY
*Information obtained from Broker Metrics, The MLS and Foreclosure Radar for all areas in Los Angeles Mirco Market Report. Statistics are subject to change due to individual real estate company reporting disciplines.
-32.0%
-3.3%
-57.7%
-47.6%
32.5%
52.5%
213.3%
-60.5%
13.4%
$2,650,000
$960
7
11
76
113
10.9
14.5%
$2,803,917
$2,875,000
$793
9
10
82
85
9.1
12.2%
$2,859,042
$1,814,250
$785
11
11
110
151
10
10.0%
$2,814,519
$2,667,500
$812
26
21
83
99
3.2
25.3%
$2,482,000
Newport Coast
10
$785
$1,814,250
$2.667
$1.814
$1.075
$2.416
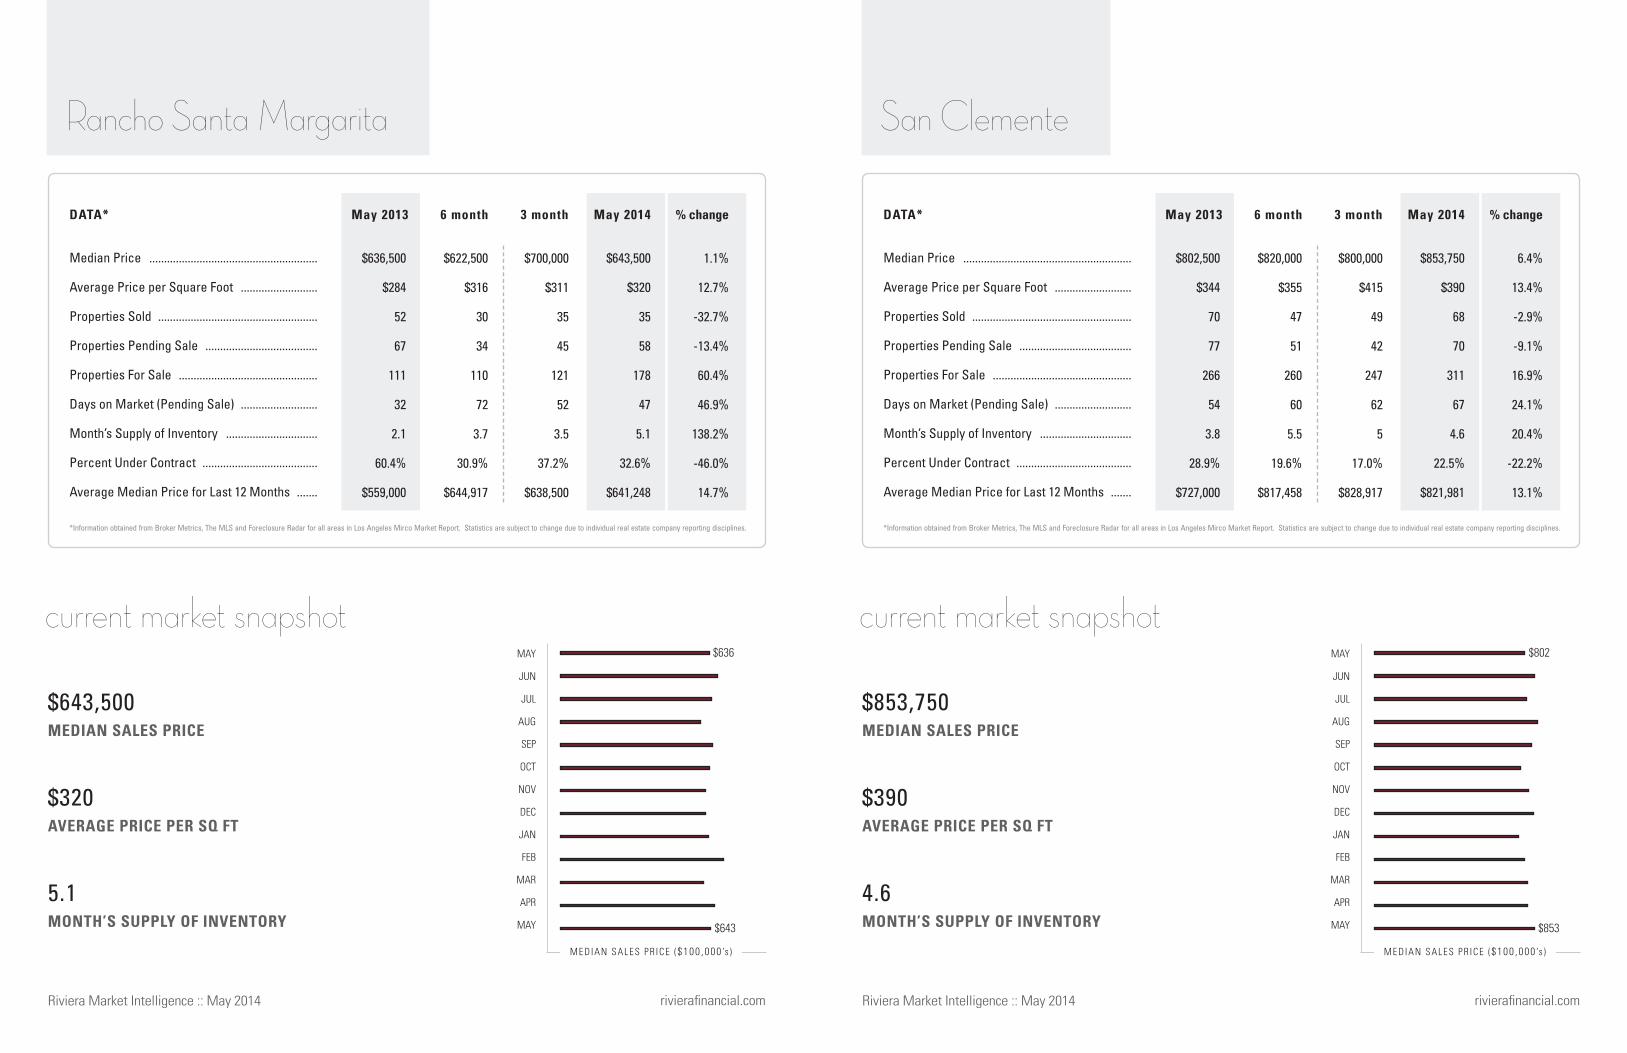
MEDIAN SALES PRICE
AVERAGE PRICE PER SQ FT
MONTH’S SUPPLY OF INVENTORY
Median Price .........................................................
Average Price per Square Foot ..........................
Properties Sold ......................................................
Properties Pending Sale ......................................
Properties For Sale ...............................................
Days on Market (Pending Sale) ..........................
Month’s Supply of Inventory ...............................
Percent Under Contract .......................................
Average Median Price for Last 12 Months .......
May 2013 May 2013May 2014 May 20146 month 6 month3 month 3 month% change % changeDATA* DATA*
current market snapshot
M E DIAN SALE S P R ICE ($100 ,000 ’s ) MEDIAN SALES PR ICE ($100 ,000 ’s )
rivierafinancial.com rivierafinancial.com
MEDIAN SALES PRICE
AVERAGE PRICE PER SQ FT
MONTH’S SUPPLY OF INVENTORY
current market snapshot
Riviera Market Intelligence :: May 2014Riviera Market Intelligence :: May 2014
MAY
JUN
JUL
AUG
SEP
OCT
NOV
DEC
JAN
FEB
MAR
APR
MAY
4.6
$390
$853,750
*Information obtained from Broker Metrics, The MLS and Foreclosure Radar for all areas in Los Angeles Mirco Market Report. Statistics are subject to change due to individual real estate company reporting disciplines.
6.4%
13.4%
-2.9%
-9.1%
16.9%
24.1%
20.4%
-22.2%
13.1%
$800,000
$415
49
42
247
62
5
17.0%
$828,917
$820,000
$355
47
51
260
60
5.5
19.6%
$817,458
$853,750
$390
68
70
311
67
4.6
22.5%
$821,981
$802,500
$344
70
77
266
54
3.8
28.9%
$727,000
San Clemente
MAY
JUN
JUL
AUG
SEP
OCT
NOV
DEC
JAN
FEB
MAR
APR
MAY
*Information obtained from Broker Metrics, The MLS and Foreclosure Radar for all areas in Los Angeles Mirco Market Report. Statistics are subject to change due to individual real estate company reporting disciplines.
1.1%
12.7%
-32.7%
-13.4%
60.4%
46.9%
138.2%
-46.0%
14.7%
$700,000
$311
35
45
121
52
3.5
37.2%
$638,500
$622,500
$316
30
34
110
72
3.7
30.9%
$644,917
$643,500
$320
35
58
178
47
5.1
32.6%
$641,248
$636,500
$284
52
67
111
32
2.1
60.4%
$559,000
Rancho Santa Margarita
5.1
$320
$643,500
$636
$643
$802
$853
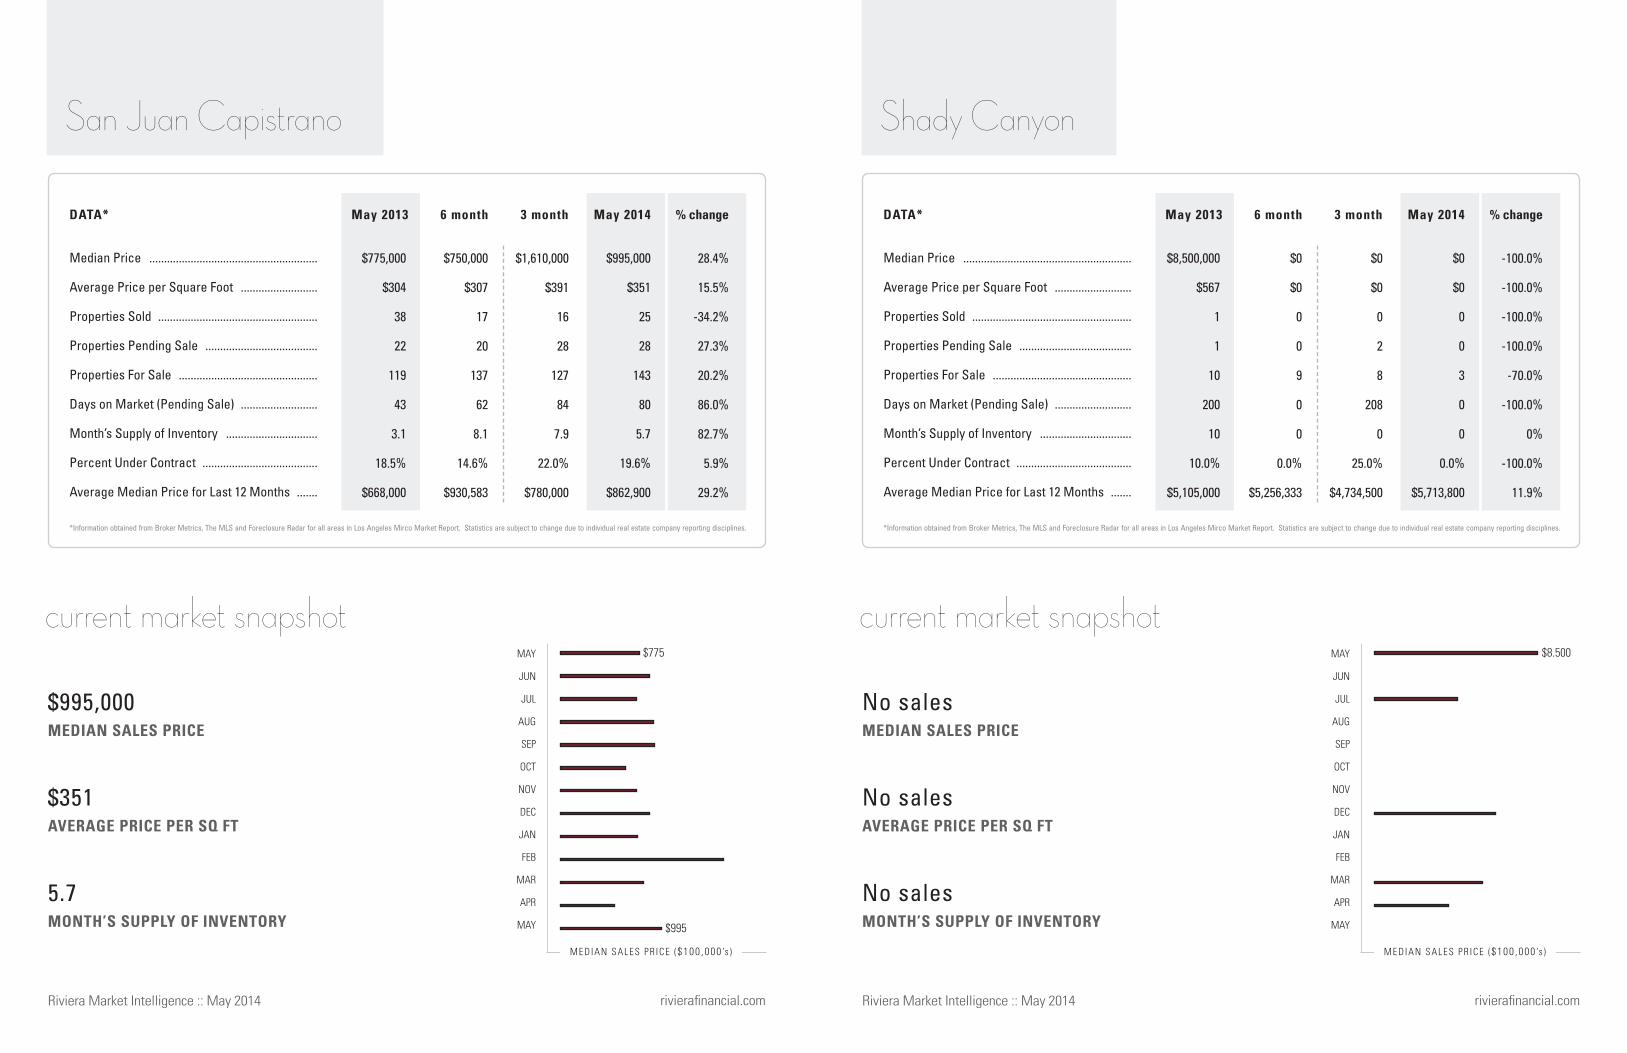
MEDIAN SALES PRICE
AVERAGE PRICE PER SQ FT
MONTH’S SUPPLY OF INVENTORY
Median Price .........................................................
Average Price per Square Foot ..........................
Properties Sold ......................................................
Properties Pending Sale ......................................
Properties For Sale ...............................................
Days on Market (Pending Sale) ..........................
Month’s Supply of Inventory ...............................
Percent Under Contract .......................................
Average Median Price for Last 12 Months .......
May 2013 May 2013May 2014 May 20146 month 6 month3 month 3 month% change % changeDATA* DATA*
current market snapshot
M E DIAN SALE S P R ICE ($100 ,000 ’s ) MEDIAN SALES PR ICE ($100 ,000 ’s )
rivierafinancial.com rivierafinancial.com
MEDIAN SALES PRICE
AVERAGE PRICE PER SQ FT
MONTH’S SUPPLY OF INVENTORY
current market snapshot
Riviera Market Intelligence :: May 2014Riviera Market Intelligence :: May 2014
MAY
JUN
JUL
AUG
SEP
OCT
NOV
DEC
JAN
FEB
MAR
APR
MAY
No sales
No sales
No sales
*Information obtained from Broker Metrics, The MLS and Foreclosure Radar for all areas in Los Angeles Mirco Market Report. Statistics are subject to change due to individual real estate company reporting disciplines.
-100.0%
-100.0%
-100.0%
-100.0%
-70.0%
-100.0%
0%
-100.0%
11.9%
$0
$0
0
2
8
208
0
25.0%
$4,734,500
$0
$0
0
0
9
0
0
0.0%
$5,256,333
$0
$0
0
0
3
0
0
0.0%
$5,713,800
$8,500,000
$567
1
1
10
200
10
10.0%
$5,105,000
Shady Canyon
MAY
JUN
JUL
AUG
SEP
OCT
NOV
DEC
JAN
FEB
MAR
APR
MAY
*Information obtained from Broker Metrics, The MLS and Foreclosure Radar for all areas in Los Angeles Mirco Market Report. Statistics are subject to change due to individual real estate company reporting disciplines.
28.4%
15.5%
-34.2%
27.3%
20.2%
86.0%
82.7%
5.9%
29.2%
$1,610,000
$391
16
28
127
84
7.9
22.0%
$780,000
$750,000
$307
17
20
137
62
8.1
14.6%
$930,583
$995,000
$351
25
28
143
80
5.7
19.6%
$862,900
$775,000
$304
38
22
119
43
3.1
18.5%
$668,000
San Juan Capistrano
5.7
$351
$995,000
$775
$995
$8.500
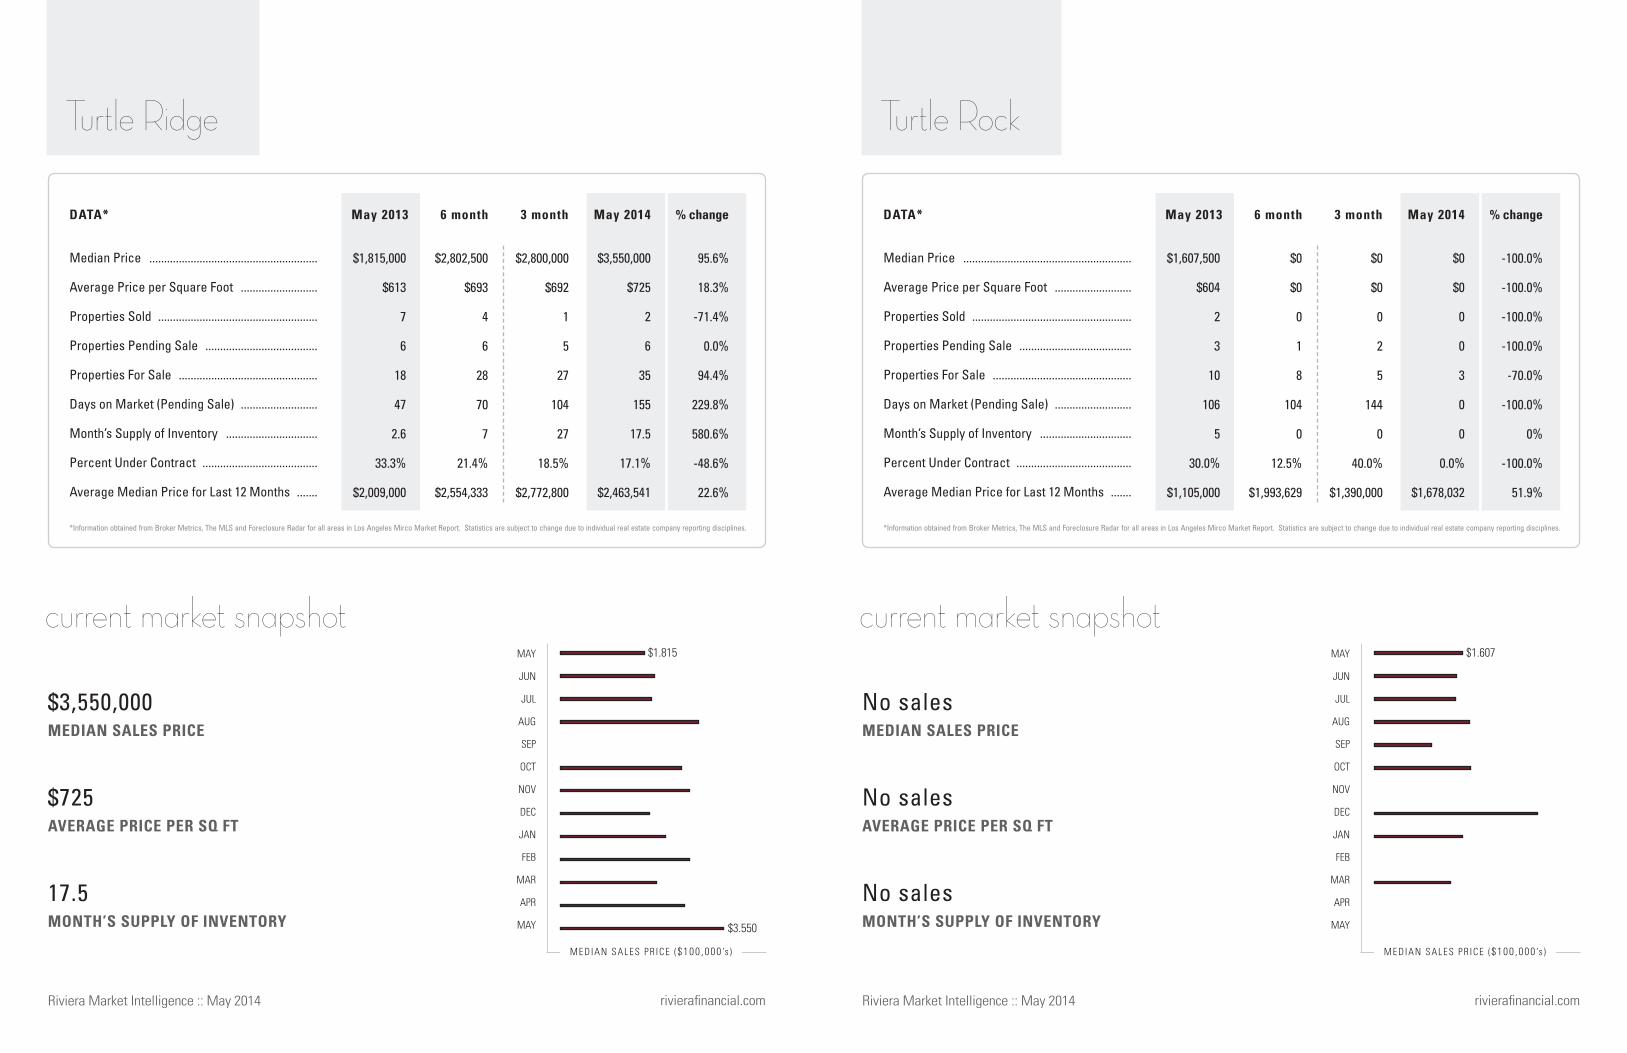
MEDIAN SALES PRICE
AVERAGE PRICE PER SQ FT
MONTH’S SUPPLY OF INVENTORY
Median Price .........................................................
Average Price per Square Foot ..........................
Properties Sold ......................................................
Properties Pending Sale ......................................
Properties For Sale ...............................................
Days on Market (Pending Sale) ..........................
Month’s Supply of Inventory ...............................
Percent Under Contract .......................................
Average Median Price for Last 12 Months .......
May 2013 May 2013May 2014 May 20146 month 6 month3 month 3 month% change % changeDATA* DATA*
current market snapshot
M E DIAN SALE S P R ICE ($100 ,000 ’s ) MEDIAN SALES PR ICE ($100 ,000 ’s )
rivierafinancial.com rivierafinancial.com
MEDIAN SALES PRICE
AVERAGE PRICE PER SQ FT
MONTH’S SUPPLY OF INVENTORY
current market snapshot
Riviera Market Intelligence :: May 2014Riviera Market Intelligence :: May 2014
MAY
JUN
JUL
AUG
SEP
OCT
NOV
DEC
JAN
FEB
MAR
APR
MAY
No sales
No sales
No sales
*Information obtained from Broker Metrics, The MLS and Foreclosure Radar for all areas in Los Angeles Mirco Market Report. Statistics are subject to change due to individual real estate company reporting disciplines.
-100.0%
-100.0%
-100.0%
-100.0%
-70.0%
-100.0%
0%
-100.0%
51.9%
$0
$0
0
2
5
144
0
40.0%
$1,390,000
$0
$0
0
1
8
104
0
12.5%
$1,993,629
$0
$0
0
0
3
0
0
0.0%
$1,678,032
$1,607,500
$604
2
3
10
106
5
30.0%
$1,105,000
Turtle Rock
MAY
JUN
JUL
AUG
SEP
OCT
NOV
DEC
JAN
FEB
MAR
APR
MAY
*Information obtained from Broker Metrics, The MLS and Foreclosure Radar for all areas in Los Angeles Mirco Market Report. Statistics are subject to change due to individual real estate company reporting disciplines.
95.6%
18.3%
-71.4%
0.0%
94.4%
229.8%
580.6%
-48.6%
22.6%
$2,800,000
$692
1
5
27
104
27
18.5%
$2,772,800
$2,802,500
$693
4
6
28
70
7
21.4%
$2,554,333
$3,550,000
$725
2
6
35
155
17.5
17.1%
$2,463,541
$1,815,000
$613
7
6
18
47
2.6
33.3%
$2,009,000
Turtle Ridge
17.5
$725
$3,550,000
$1.815
$3.550
$1.607
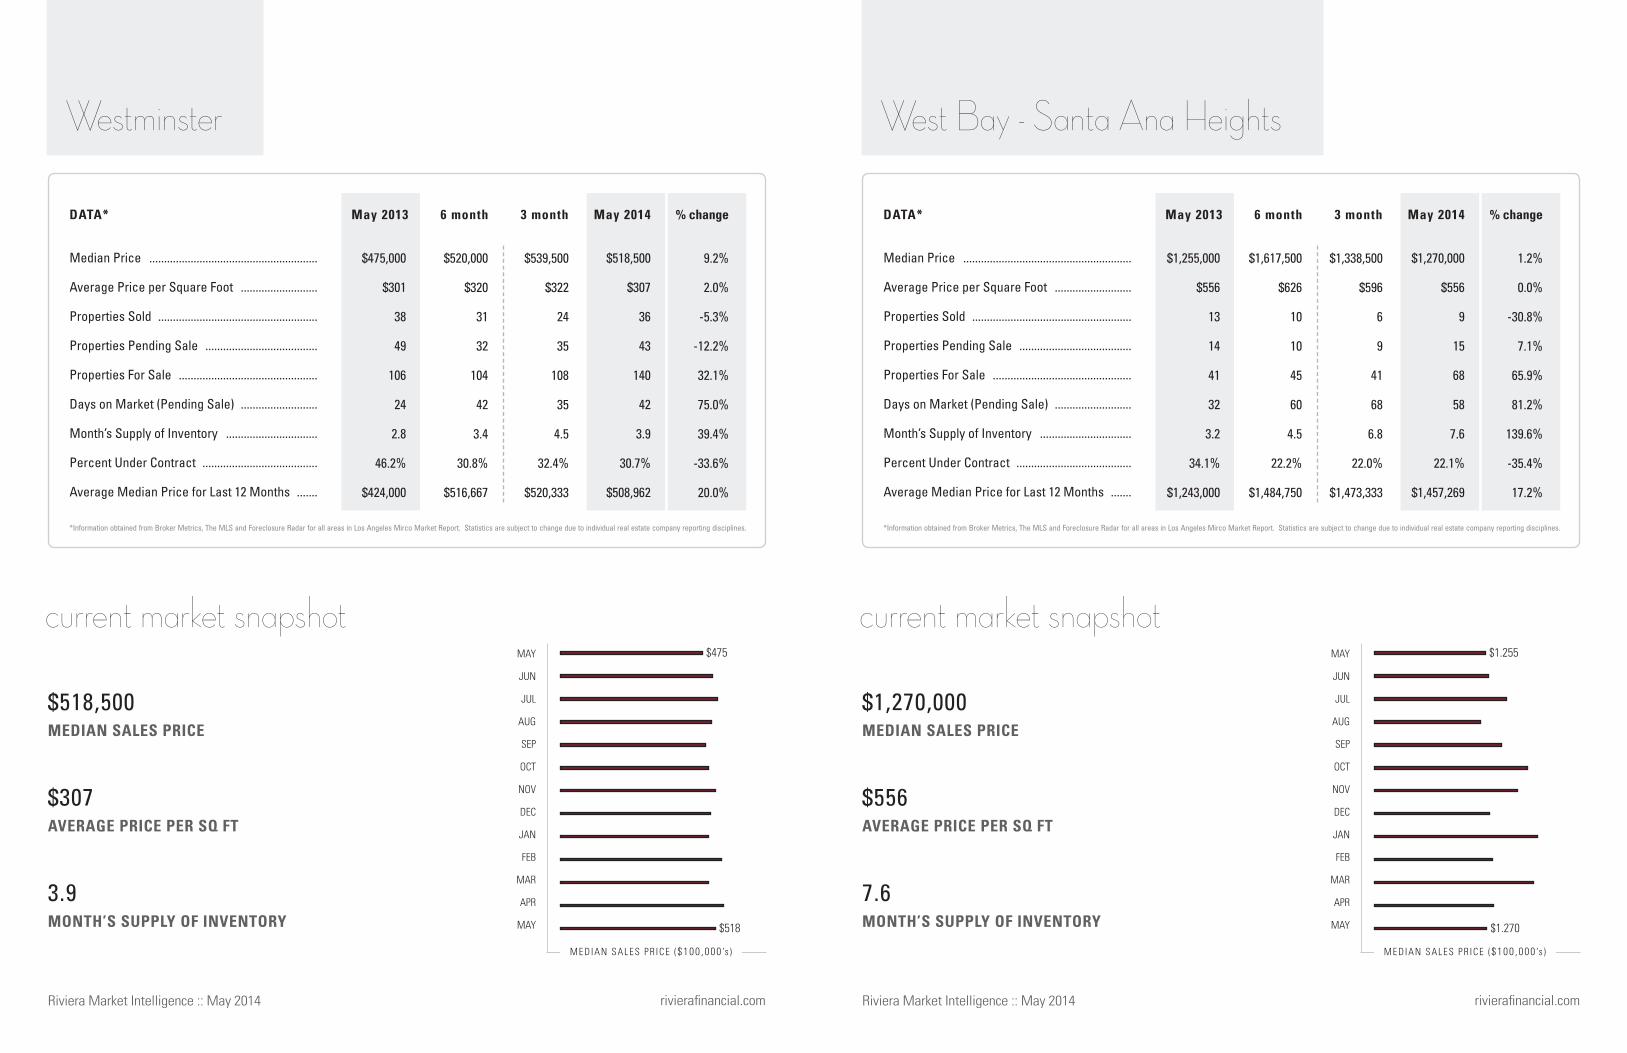
MEDIAN SALES PRICE
AVERAGE PRICE PER SQ FT
MONTH’S SUPPLY OF INVENTORY
Median Price .........................................................
Average Price per Square Foot ..........................
Properties Sold ......................................................
Properties Pending Sale ......................................
Properties For Sale ...............................................
Days on Market (Pending Sale) ..........................
Month’s Supply of Inventory ...............................
Percent Under Contract .......................................
Average Median Price for Last 12 Months .......
May 2013 May 2013May 2014 May 20146 month 6 month3 month 3 month% change % changeDATA* DATA*
current market snapshot
M E DIAN SALE S P R ICE ($100 ,000 ’s ) MEDIAN SALES PR ICE ($100 ,000 ’s )
rivierafinancial.com rivierafinancial.com
MEDIAN SALES PRICE
AVERAGE PRICE PER SQ FT
MONTH’S SUPPLY OF INVENTORY
current market snapshot
Riviera Market Intelligence :: May 2014Riviera Market Intelligence :: May 2014
MAY
JUN
JUL
AUG
SEP
OCT
NOV
DEC
JAN
FEB
MAR
APR
MAY
7.6
$556
$1,270,000
*Information obtained from Broker Metrics, The MLS and Foreclosure Radar for all areas in Los Angeles Mirco Market Report. Statistics are subject to change due to individual real estate company reporting disciplines.
1.2%
0.0%
-30.8%
7.1%
65.9%
81.2%
139.6%
-35.4%
17.2%
$1,338,500
$596
6
9
41
68
6.8
22.0%
$1,473,333
$1,617,500
$626
10
10
45
60
4.5
22.2%
$1,484,750
$1,270,000
$556
9
15
68
58
7.6
22.1%
$1,457,269
$1,255,000
$556
13
14
41
32
3.2
34.1%
$1,243,000
West Bay - Santa Ana Heights
MAY
JUN
JUL
AUG
SEP
OCT
NOV
DEC
JAN
FEB
MAR
APR
MAY
*Information obtained from Broker Metrics, The MLS and Foreclosure Radar for all areas in Los Angeles Mirco Market Report. Statistics are subject to change due to individual real estate company reporting disciplines.
9.2%
2.0%
-5.3%
-12.2%
32.1%
75.0%
39.4%
-33.6%
20.0%
$539,500
$322
24
35
108
35
4.5
32.4%
$520,333
$520,000
$320
31
32
104
42
3.4
30.8%
$516,667
$518,500
$307
36
43
140
42
3.9
30.7%
$508,962
$475,000
$301
38
49
106
24
2.8
46.2%
$424,000
Westminster
3.9
$307
$518,500
$475
$518
$1.255
$1.270

MEDIAN SALES PRICE
AVERAGE PRICE PER SQ FT
MONTH’S SUPPLY OF INVENTORY
Median Price .........................................................
Average Price per Square Foot ..........................
Properties Sold ......................................................
Properties Pending Sale ......................................
Properties For Sale ...............................................
Days on Market (Pending Sale) ..........................
Month’s Supply of Inventory ...............................
Percent Under Contract .......................................
Average Median Price for Last 12 Months .......
May 2013 May 20146 month 3 month % changeDATA*
current market snapshot
M E DIAN SALE S P R ICE ($100 ,000 ’s )
rivierafinancial.comRiviera Market Intelligence :: May 2014
MAY
JUN
JUL
AUG
SEP
OCT
NOV
DEC
JAN
FEB
MAR
APR
MAY
*Information obtained from Broker Metrics, The MLS and Foreclosure Radar for all areas in Los Angeles Mirco Market Report. Statistics are subject to change due to individual real estate company reporting disciplines.
72.7%
-9.6%
66.7%
120.0%
5.6%
11.9%
-36.7%
108.4%
16.6%
$1,525,000
$836
4
6
39
47
9.8
15.4%
$2,794,833
$1,600,000
$1,129
7
8
52
93
7.4
15.4%
$2,221,525
$2,850,000
$1,191
10
11
57
66
5.7
19.3%
$2,084,319
$1,650,000
$1,318
6
5
54
59
9
9.3%
$1,788,000
West Newport - Lido
5.7
$1,191
$2,850,000
$1.650
$2.850

rivierafinancial.comrivierafinancial.com
Carpinteria
Goleta
Hope Ranch
Montecito
Santa Barbara East of State
Santa Barbara West of State
Santa Ynez
County: SANTA BARBARA
Area: 3,789 SQ MILES
Founded: 1850
Santa Barbara County
Riviera Market Intelligence :: May 2014Riviera Market Intelligence :: May 2014

MEDIAN SALES PRICE
AVERAGE PRICE PER SQ FT
MONTH’S SUPPLY OF INVENTORY
Median Price .........................................................
Average Price per Square Foot ..........................
Properties Sold ......................................................
Properties Pending Sale ......................................
Properties For Sale ...............................................
Days on Market (Pending Sale) ..........................
Month’s Supply of Inventory ...............................
Percent Under Contract .......................................
Average Median Price for Last 12 Months .......
May 2013 May 2013May 2014 May 20146 month 6 month3 month 3 month% change % changeDATA* DATA*
current market snapshot
M E DIAN SALE S P R ICE ($100 ,000 ’s ) MEDIAN SALES PR ICE ($100 ,000 ’s )
rivierafinancial.com rivierafinancial.com
MEDIAN SALES PRICE
AVERAGE PRICE PER SQ FT
MONTH’S SUPPLY OF INVENTORY
current market snapshot
Riviera Market Intelligence :: May 2014Riviera Market Intelligence :: May 2014
MAY
JUN
JUL
AUG
SEP
OCT
NOV
DEC
JAN
FEB
MAR
APR
MAY
2.2
$443
$780,000
*Information obtained from Broker Metrics, The MLS and Foreclosure Radar for all areas in Los Angeles Mirco Market Report. Statistics are subject to change due to individual real estate company reporting disciplines.
13.2%
-8.5%
-20.0%
-64.3%
-47.1%
-31.6%
-33.8%
-32.5%
12.8%
$870,000
$560
5
8
27
16
5.4
29.6%
$755,000
$802,500
$419
10
6
26
27
2.6
23.1%
$794,833
$780,000
$443
8
5
18
13
2.2
27.8%
$771,817
$689,125
$484
10
14
34
19
3.4
41.2%
$684,000
Goleta
MAY
JUN
JUL
AUG
SEP
OCT
NOV
DEC
JAN
FEB
MAR
APR
MAY
*Information obtained from Broker Metrics, The MLS and Foreclosure Radar for all areas in Los Angeles Mirco Market Report. Statistics are subject to change due to individual real estate company reporting disciplines.
-16.7%
15.0%
-40.0%
-60.0%
-27.5%
625.0%
20.9%
-44.9%
11.2%
$2,875,000
$963
3
2
38
264
12.7
5.3%
$818,083
$2,200,000
$532
5
5
38
33
7.6
13.2%
$1,173,163
$708,250
$521
6
2
37
87
6.2
5.4%
$1,085,611
$850,500
$453
10
5
51
12
5.1
9.8%
$976,000
Carpinteria
6.2
$521
$708,250
$850
$708
$689
$780
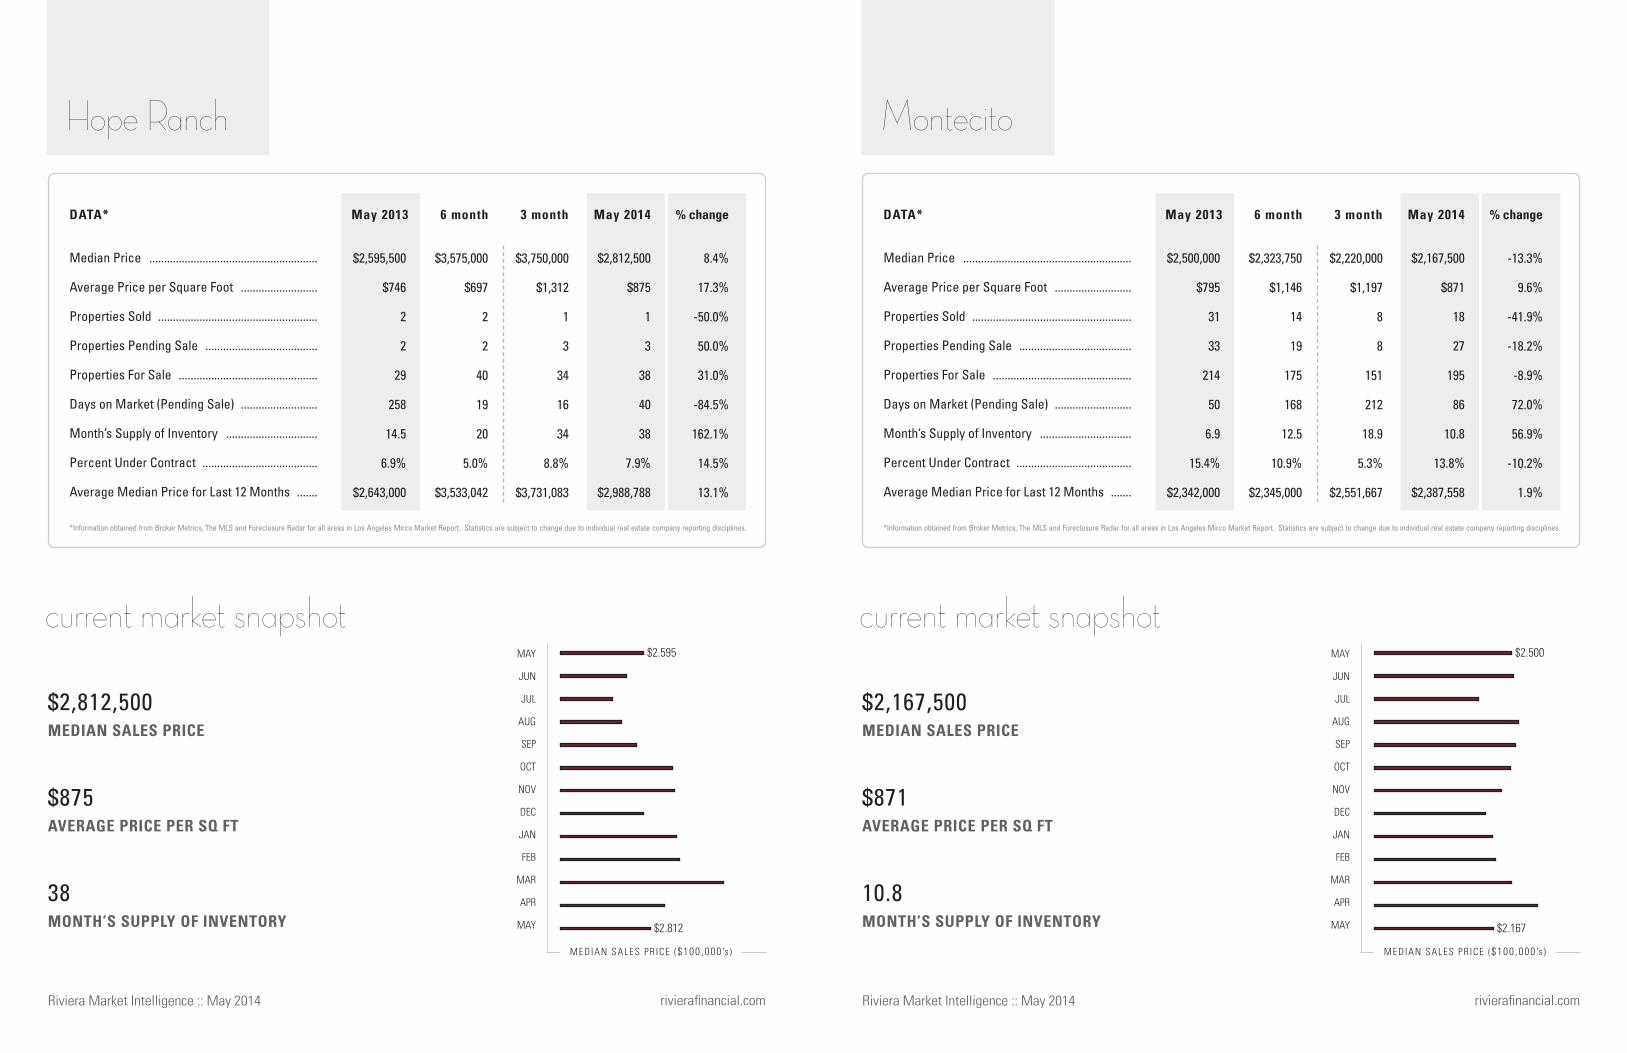
MEDIAN SALES PRICE
AVERAGE PRICE PER SQ FT
MONTH’S SUPPLY OF INVENTORY
Median Price .........................................................
Average Price per Square Foot ..........................
Properties Sold ......................................................
Properties Pending Sale ......................................
Properties For Sale ...............................................
Days on Market (Pending Sale) ..........................
Month’s Supply of Inventory ...............................
Percent Under Contract .......................................
Average Median Price for Last 12 Months .......
May 2013 May 2013May 2014 May 20146 month 6 month3 month 3 month% change % changeDATA* DATA*
current market snapshot
M E DIAN SALE S P R ICE ($100 ,000 ’s ) MEDIAN SALES PR ICE ($100 ,000 ’s )
rivierafinancial.com rivierafinancial.com
MEDIAN SALES PRICE
AVERAGE PRICE PER SQ FT
MONTH’S SUPPLY OF INVENTORY
current market snapshot
Riviera Market Intelligence :: May 2014Riviera Market Intelligence :: May 2014
MAY
JUN
JUL
AUG
SEP
OCT
NOV
DEC
JAN
FEB
MAR
APR
MAY
10.8
$871
$2,167,500
*Information obtained from Broker Metrics, The MLS and Foreclosure Radar for all areas in Los Angeles Mirco Market Report. Statistics are subject to change due to individual real estate company reporting disciplines.
-13.3%
9.6%
-41.9%
-18.2%
-8.9%
72.0%
56.9%
-10.2%
1.9%
$2,220,000
$1,197
8
8
151
212
18.9
5.3%
$2,551,667
$2,323,750
$1,146
14
19
175
168
12.5
10.9%
$2,345,000
$2,167,500
$871
18
27
195
86
10.8
13.8%
$2,387,558
$2,500,000
$795
31
33
214
50
6.9
15.4%
$2,342,000
Montecito
MAY
JUN
JUL
AUG
SEP
OCT
NOV
DEC
JAN
FEB
MAR
APR
MAY
*Information obtained from Broker Metrics, The MLS and Foreclosure Radar for all areas in Los Angeles Mirco Market Report. Statistics are subject to change due to individual real estate company reporting disciplines.
8.4%
17.3%
-50.0%
50.0%
31.0%
-84.5%
162.1%
14.5%
13.1%
$3,750,000
$1,312
1
3
34
16
34
8.8%
$3,731,083
$3,575,000
$697
2
2
40
19
20
5.0%
$3,533,042
$2,812,500
$875
1
3
38
40
38
7.9%
$2,988,788
$2,595,500
$746
2
2
29
258
14.5
6.9%
$2,643,000
Hope Ranch
38
$875
$2,812,500
$2.595
$2.812
$2.500
$2.167

MEDIAN SALES PRICE
AVERAGE PRICE PER SQ FT
MONTH’S SUPPLY OF INVENTORY
Median Price .........................................................
Average Price per Square Foot ..........................
Properties Sold ......................................................
Properties Pending Sale ......................................
Properties For Sale ...............................................
Days on Market (Pending Sale) ..........................
Month’s Supply of Inventory ...............................
Percent Under Contract .......................................
Average Median Price for Last 12 Months .......
May 2013 May 2013May 2014 May 20146 month 6 month3 month 3 month% change % changeDATA* DATA*
current market snapshot
M E DIAN SALE S P R ICE ($100 ,000 ’s ) MEDIAN SALES PR ICE ($100 ,000 ’s )
rivierafinancial.com rivierafinancial.com
MEDIAN SALES PRICE
AVERAGE PRICE PER SQ FT
MONTH’S SUPPLY OF INVENTORY
current market snapshot
Riviera Market Intelligence :: May 2014Riviera Market Intelligence :: May 2014
MAY
JUN
JUL
AUG
SEP
OCT
NOV
DEC
JAN
FEB
MAR
APR
MAY
2.6
$500
$950,000
*Information obtained from Broker Metrics, The MLS and Foreclosure Radar for all areas in Los Angeles Mirco Market Report. Statistics are subject to change due to individual real estate company reporting disciplines.
8.0%
-6.4%
-20.6%
-23.1%
-12.7%
-20.0%
10.0%
-11.9%
30.9%
$905,000
$565
13
18
63
55
4.8
28.6%
$955,833
$850,000
$613
19
20
67
35
3.5
29.9%
$947,583
$950,000
$500
27
20
69
24
2.6
29.0%
$922,846
$879,500
$534
34
26
79
30
2.3
32.9%
$705,000
Santa Barbara West of State
MAY
JUN
JUL
AUG
SEP
OCT
NOV
DEC
JAN
FEB
MAR
APR
MAY
*Information obtained from Broker Metrics, The MLS and Foreclosure Radar for all areas in Los Angeles Mirco Market Report. Statistics are subject to change due to individual real estate company reporting disciplines.
65.3%
13.6%
20.6%
-40.0%
-8.5%
-35.5%
-24.1%
-34.5%
25.0%
$1,203,000
$536
18
22
99
28
5.5
22.2%
$1,311,667
$925,000
$592
21
25
124
71
5.9
20.2%
$1,250,083
$1,425,000
$659
41
21
119
40
2.9
17.6%
$1,130,145
$862,000
$580
34
35
130
62
3.8
26.9%
$904,000
Santa Barbara East of State
2.9
$659
$1,425,000
$862
$1.425
$879
$950

MEDIAN SALES PRICE
AVERAGE PRICE PER SQ FT
MONTH’S SUPPLY OF INVENTORY
Median Price .........................................................
Average Price per Square Foot ..........................
Properties Sold ......................................................
Properties Pending Sale ......................................
Properties For Sale ...............................................
Days on Market (Pending Sale) ..........................
Month’s Supply of Inventory ...............................
Percent Under Contract .......................................
Average Median Price for Last 12 Months .......
May 2013 May 20146 month 3 month % changeDATA*
current market snapshot
M E DIAN SALE S P R ICE ($100 ,000 ’s )
rivierafinancial.comRiviera Market Intelligence :: May 2014
MAY
JUN
JUL
AUG
SEP
OCT
NOV
DEC
JAN
FEB
MAR
APR
MAY
*Information obtained from Broker Metrics, The MLS and Foreclosure Radar for all areas in Los Angeles Mirco Market Report. Statistics are subject to change due to individual real estate company reporting disciplines.
-7.6%
43.3%
10.0%
62.5%
37.0%
43.8%
24.5%
18.7%
-6.4%
$785,000
$328
5
11
106
223
21.2
10.4%
$590,833
$618,000
$301
7
9
113
36
16.1
8.0%
$691,667
$600,000
$463
11
13
126
92
11.5
10.3%
$660,731
$649,500
$323
10
8
92
64
9.2
8.7%
$706,000
Santa Ynez
11.5
$463
$600,000
$649
$600
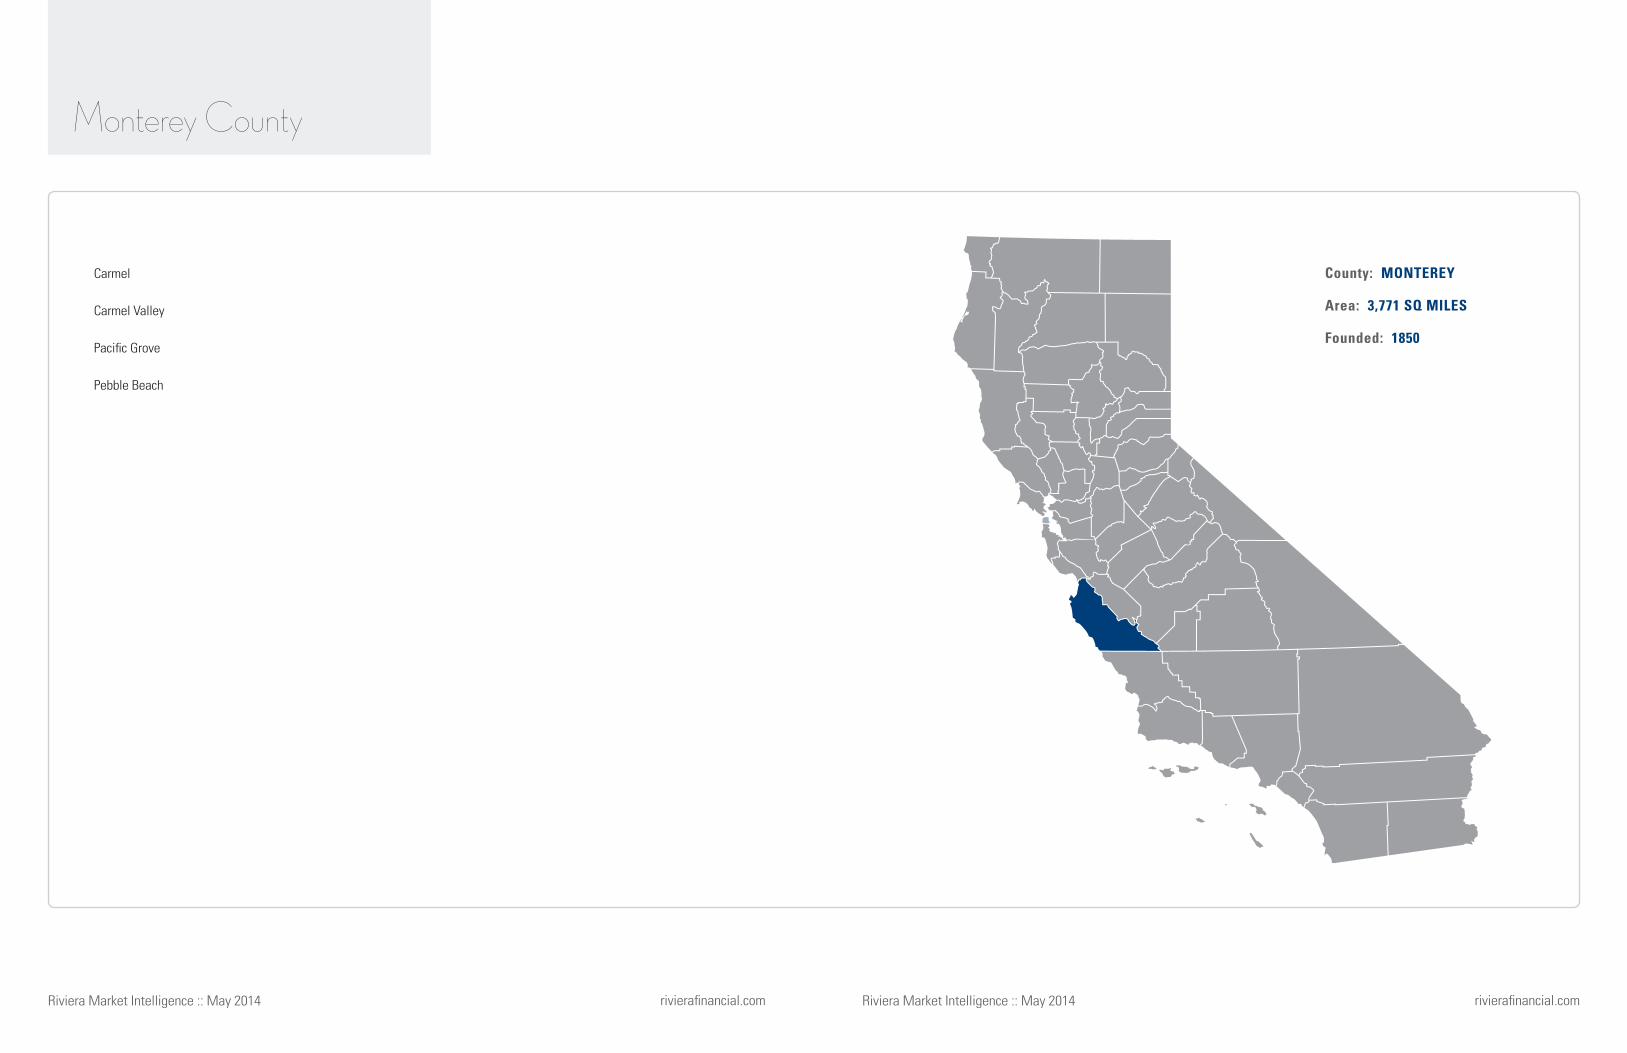
rivierafinancial.comrivierafinancial.com
Carmel
Carmel Valley
Pacific Grove
Pebble Beach
County: MONTEREY
Area: 3,771 SQ MILES
Founded: 1850
Monterey County
Riviera Market Intelligence :: May 2014Riviera Market Intelligence :: May 2014

MEDIAN SALES PRICE
AVERAGE PRICE PER SQ FT
MONTH’S SUPPLY OF INVENTORY
Median Price .........................................................
Average Price per Square Foot ..........................
Properties Sold ......................................................
Properties Pending Sale ......................................
Properties For Sale ...............................................
Days on Market (Pending Sale) ..........................
Month’s Supply of Inventory ...............................
Percent Under Contract .......................................
Average Median Price for Last 12 Months .......
May 2013 May 2013May 2014 May 20146 month 6 month3 month 3 month% change % changeDATA* DATA*
current market snapshot
M E DIAN SALE S P R ICE ($100 ,000 ’s ) MEDIAN SALES PR ICE ($100 ,000 ’s )
rivierafinancial.com rivierafinancial.com
MEDIAN SALES PRICE
AVERAGE PRICE PER SQ FT
MONTH’S SUPPLY OF INVENTORY
current market snapshot
Riviera Market Intelligence :: May 2014Riviera Market Intelligence :: May 2014
MAY
JUN
JUL
AUG
SEP
OCT
NOV
DEC
JAN
FEB
MAR
APR
MAY
5.8
$445
$1,039,000
*Information obtained from Broker Metrics, The MLS and Foreclosure Radar for all areas in Los Angeles Mirco Market Report. Statistics are subject to change due to individual real estate company reporting disciplines.
29.9%
12.1%
0.0%
54.5%
-4.8%
1.5%
-4.8%
62.4%
18.9%
$1,317,500
$431
10
8
85
64
8.5
9.4%
$988,250
$1,200,000
$630
7
12
111
103
15.9
10.8%
$1,099,542
$1,039,000
$445
17
17
99
66
5.8
17.2%
$1,006,942
$800,000
$397
17
11
104
65
6.1
10.6%
$847,000
Carmel Valley
MAY
JUN
JUL
AUG
SEP
OCT
NOV
DEC
JAN
FEB
MAR
APR
MAY
*Information obtained from Broker Metrics, The MLS and Foreclosure Radar for all areas in Los Angeles Mirco Market Report. Statistics are subject to change due to individual real estate company reporting disciplines.
-15.0%
2.7%
7.1%
16.0%
-3.2%
-27.7%
-9.6%
19.8%
6.3%
$1,587,500
$807
22
25
149
103
6.8
16.8%
$1,239,167
$1,462,500
$937
14
22
149
109
10.6
14.8%
$1,404,063
$1,072,500
$729
30
29
153
102
5.1
19.0%
$1,296,317
$1,262,500
$710
28
25
158
141
5.6
15.8%
$1,220,000
Carmel
5.1
$729
$1,072,500
$1.262
$1.072
$800
$1.039
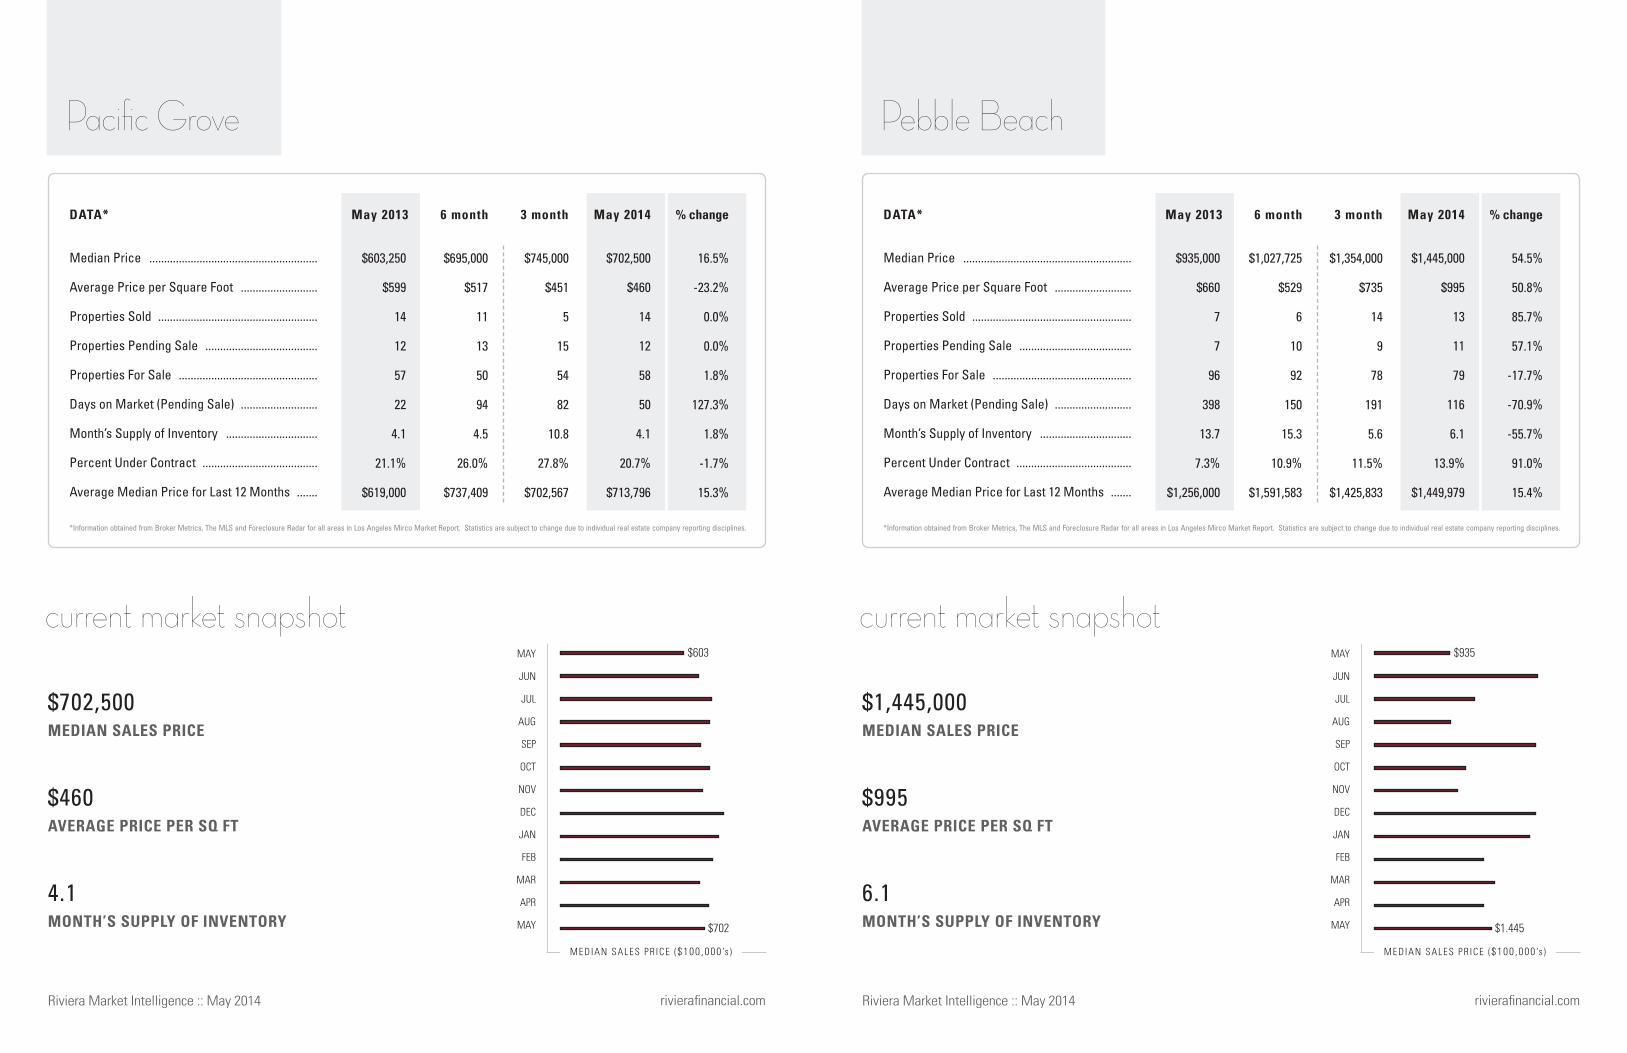
MEDIAN SALES PRICE
AVERAGE PRICE PER SQ FT
MONTH’S SUPPLY OF INVENTORY
Median Price .........................................................
Average Price per Square Foot ..........................
Properties Sold ......................................................
Properties Pending Sale ......................................
Properties For Sale ...............................................
Days on Market (Pending Sale) ..........................
Month’s Supply of Inventory ...............................
Percent Under Contract .......................................
Average Median Price for Last 12 Months .......
May 2013 May 2013May 2014 May 20146 month 6 month3 month 3 month% change % changeDATA* DATA*
current market snapshot
M E DIAN SALE S P R ICE ($100 ,000 ’s ) MEDIAN SALES PR ICE ($100 ,000 ’s )
rivierafinancial.com rivierafinancial.com
MEDIAN SALES PRICE
AVERAGE PRICE PER SQ FT
MONTH’S SUPPLY OF INVENTORY
current market snapshot
Riviera Market Intelligence :: May 2014Riviera Market Intelligence :: May 2014
MAY
JUN
JUL
AUG
SEP
OCT
NOV
DEC
JAN
FEB
MAR
APR
MAY
6.1
$995
$1,445,000
*Information obtained from Broker Metrics, The MLS and Foreclosure Radar for all areas in Los Angeles Mirco Market Report. Statistics are subject to change due to individual real estate company reporting disciplines.
54.5%
50.8%
85.7%
57.1%
-17.7%
-70.9%
-55.7%
91.0%
15.4%
$1,354,000
$735
14
9
78
191
5.6
11.5%
$1,425,833
$1,027,725
$529
6
10
92
150
15.3
10.9%
$1,591,583
$1,445,000
$995
13
11
79
116
6.1
13.9%
$1,449,979
$935,000
$660
7
7
96
398
13.7
7.3%
$1,256,000
Pebble Beach
MAY
JUN
JUL
AUG
SEP
OCT
NOV
DEC
JAN
FEB
MAR
APR
MAY
*Information obtained from Broker Metrics, The MLS and Foreclosure Radar for all areas in Los Angeles Mirco Market Report. Statistics are subject to change due to individual real estate company reporting disciplines.
16.5%
-23.2%
0.0%
0.0%
1.8%
127.3%
1.8%
-1.7%
15.3%
$745,000
$451
5
15
54
82
10.8
27.8%
$702,567
$695,000
$517
11
13
50
94
4.5
26.0%
$737,409
$702,500
$460
14
12
58
50
4.1
20.7%
$713,796
$603,250
$599
14
12
57
22
4.1
21.1%
$619,000
Pacific Grove
4.1
$460
$702,500
$603
$702
$935
$1.445
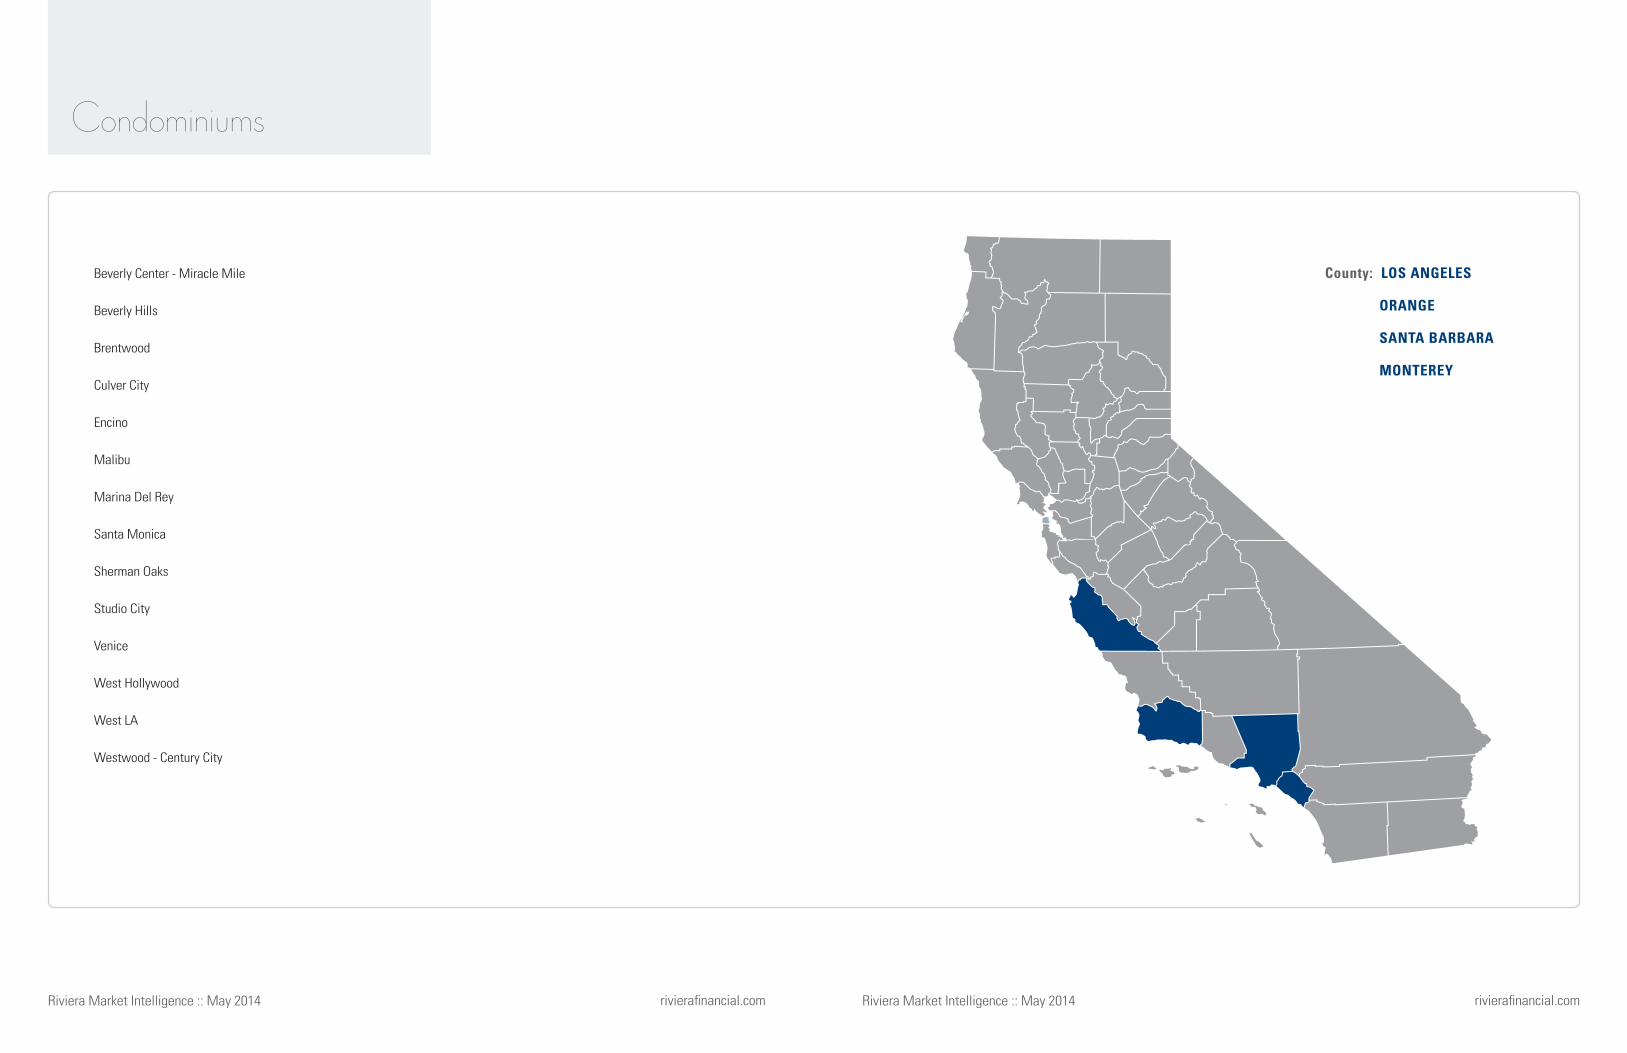
Beverly Center - Miracle Mile
Beverly Hills
Brentwood
Culver City
Encino
Malibu
Marina Del Rey
Santa Monica
Sherman Oaks
Studio City
Venice
West Hollywood
West LA
Westwood - Century City
County: LOS ANGELES
ORANGE
SANTA BARBARA
MONTEREY
Condominiums
rivierafinancial.comrivierafinancial.com Riviera Market Intelligence :: May 2014Riviera Market Intelligence :: May 2014

MEDIAN SALES PRICE
AVERAGE PRICE PER SQ FT
MONTH’S SUPPLY OF INVENTORY
Median Price .........................................................
Average Price per Square Foot ..........................
Properties Sold ......................................................
Properties Pending Sale ......................................
Properties For Sale ...............................................
Days on Market (Pending Sale) ..........................
Month’s Supply of Inventory ...............................
Percent Under Contract .......................................
Average Median Price for Last 12 Months .......
May 2013 May 2013May 2014 May 20146 month 6 month3 month 3 month% change % changeDATA* DATA*
current market snapshot
M E DIAN SALE S P R ICE ($100 ,000 ’s ) MEDIAN SALES PR ICE ($100 ,000 ’s )
rivierafinancial.com rivierafinancial.com
MEDIAN SALES PRICE
AVERAGE PRICE PER SQ FT
MONTH’S SUPPLY OF INVENTORY
current market snapshot
Riviera Market Intelligence :: May 2014Riviera Market Intelligence :: May 2014
MAY
JUN
JUL
AUG
SEP
OCT
NOV
DEC
JAN
FEB
MAR
APR
MAY
4.7
$716
$1,152,500
*Information obtained from Broker Metrics, The MLS and Foreclosure Radar for all areas in Los Angeles Mirco Market Report. Statistics are subject to change due to individual real estate company reporting disciplines.
19.1%
-14.3%
-7.7%
10.0%
30.2%
-45.5%
41.1%
-15.5%
11.5%
$1,288,000
$612
10
8
49
83
4.9
16.3%
$1,005,833
$905,000
$573
4
8
49
37
12.2
16.3%
$1,078,000
$1,152,500
$716
12
11
56
42
4.7
19.6%
$983,846
$968,000
$835
13
10
43
77
3.3
23.3%
$882,000
Beverly Hills
MAY
JUN
JUL
AUG
SEP
OCT
NOV
DEC
JAN
FEB
MAR
APR
MAY
*Information obtained from Broker Metrics, The MLS and Foreclosure Radar for all areas in Los Angeles Mirco Market Report. Statistics are subject to change due to individual real estate company reporting disciplines.
29.7%
3.3%
100.0%
150.0%
50.0%
3.8%
-25.0%
66.7%
27.9%
$769,500
$605
4
11
24
56
6
45.8%
$673,500
$747,500
$538
12
14
37
61
3.1
37.8%
$685,000
$645,500
$504
8
15
39
27
4.9
38.5%
$671,577
$497,500
$488
4
6
26
26
6.5
23.1%
$525,000
Beverly Center - Miracle Mile
4.9
$504
$645,500
$497
$645
$968
$1.152

MEDIAN SALES PRICE
AVERAGE PRICE PER SQ FT
MONTH’S SUPPLY OF INVENTORY
Median Price .........................................................
Average Price per Square Foot ..........................
Properties Sold ......................................................
Properties Pending Sale ......................................
Properties For Sale ...............................................
Days on Market (Pending Sale) ..........................
Month’s Supply of Inventory ...............................
Percent Under Contract .......................................
Average Median Price for Last 12 Months .......
May 2013 May 2013May 2014 May 20146 month 6 month3 month 3 month% change % changeDATA* DATA*
current market snapshot
M E DIAN SALE S P R ICE ($100 ,000 ’s ) MEDIAN SALES PR ICE ($100 ,000 ’s )
rivierafinancial.com rivierafinancial.com
MEDIAN SALES PRICE
AVERAGE PRICE PER SQ FT
MONTH’S SUPPLY OF INVENTORY
current market snapshot
Riviera Market Intelligence :: May 2014Riviera Market Intelligence :: May 2014
MAY
JUN
JUL
AUG
SEP
OCT
NOV
DEC
JAN
FEB
MAR
APR
MAY
3.2
$415
$410,000
*Information obtained from Broker Metrics, The MLS and Foreclosure Radar for all areas in Los Angeles Mirco Market Report. Statistics are subject to change due to individual real estate company reporting disciplines.
6.5%
16.2%
-5.9%
-18.5%
23.8%
33.3%
31.5%
-34.2%
23.2%
$392,500
$354
10
16
44
41
4.4
36.4%
$413,000
$466,500
$369
10
10
34
22
3.4
29.4%
$401,833
$410,000
$415
16
22
52
28
3.2
42.3%
$405,274
$385,000
$357
17
27
42
21
2.5
64.3%
$329,000
Culver City
MAY
JUN
JUL
AUG
SEP
OCT
NOV
DEC
JAN
FEB
MAR
APR
MAY
*Information obtained from Broker Metrics, The MLS and Foreclosure Radar for all areas in Los Angeles Mirco Market Report. Statistics are subject to change due to individual real estate company reporting disciplines.
5.1%
-1.5%
-9.1%
-20.0%
2.4%
5.7%
12.6%
-21.9%
8.0%
$747,000
$466
9
13
66
46
7.3
19.7%
$772,333
$600,000
$441
9
15
68
33
7.6
22.1%
$775,000
$672,500
$513
20
20
86
37
4.3
23.3%
$722,573
$639,950
$521
22
25
84
35
3.8
29.8%
$669,000
Brentwood
4.3
$513
$672,500
$639
$672
$385
$410

MEDIAN SALES PRICE
AVERAGE PRICE PER SQ FT
MONTH’S SUPPLY OF INVENTORY
Median Price .........................................................
Average Price per Square Foot ..........................
Properties Sold ......................................................
Properties Pending Sale ......................................
Properties For Sale ...............................................
Days on Market (Pending Sale) ..........................
Month’s Supply of Inventory ...............................
Percent Under Contract .......................................
Average Median Price for Last 12 Months .......
May 2013 May 2013May 2014 May 20146 month 6 month3 month 3 month% change % changeDATA* DATA*
current market snapshot
M E DIAN SALE S P R ICE ($100 ,000 ’s ) MEDIAN SALES PR ICE ($100 ,000 ’s )
rivierafinancial.com rivierafinancial.com
MEDIAN SALES PRICE
AVERAGE PRICE PER SQ FT
MONTH’S SUPPLY OF INVENTORY
current market snapshot
Riviera Market Intelligence :: May 2014Riviera Market Intelligence :: May 2014
MAY
JUN
JUL
AUG
SEP
OCT
NOV
DEC
JAN
FEB
MAR
APR
MAY
5.7
$480
$1,025,000
*Information obtained from Broker Metrics, The MLS and Foreclosure Radar for all areas in Los Angeles Mirco Market Report. Statistics are subject to change due to individual real estate company reporting disciplines.
131.1%
4.8%
-25.0%
-50.0%
-10.5%
-89.4%
19.3%
-44.1%
19.1%
$817,500
$478
2
2
22
32
11
9.1%
$895,333
$0
$0
0
2
24
23
0
8.3%
$792,667
$1,025,000
$480
3
1
17
15
5.7
5.9%
$768,136
$443,500
$458
4
2
19
142
4.8
10.5%
$645,000
Malibu
MAY
JUN
JUL
AUG
SEP
OCT
NOV
DEC
JAN
FEB
MAR
APR
MAY
*Information obtained from Broker Metrics, The MLS and Foreclosure Radar for all areas in Los Angeles Mirco Market Report. Statistics are subject to change due to individual real estate company reporting disciplines.
20.3%
8.1%
-37.5%
33.3%
90.5%
31.1%
204.8%
-30.0%
29.0%
$377,000
$288
12
17
33
57
2.8
51.5%
$310,667
$280,000
$229
7
13
37
44
5.3
35.1%
$311,167
$320,000
$267
15
24
40
59
2.7
60.0%
$296,538
$266,000
$247
24
18
21
45
0.9
85.7%
$229,923
Encino
2.7
$267
$320,000
$266
$320
$443
$1.025
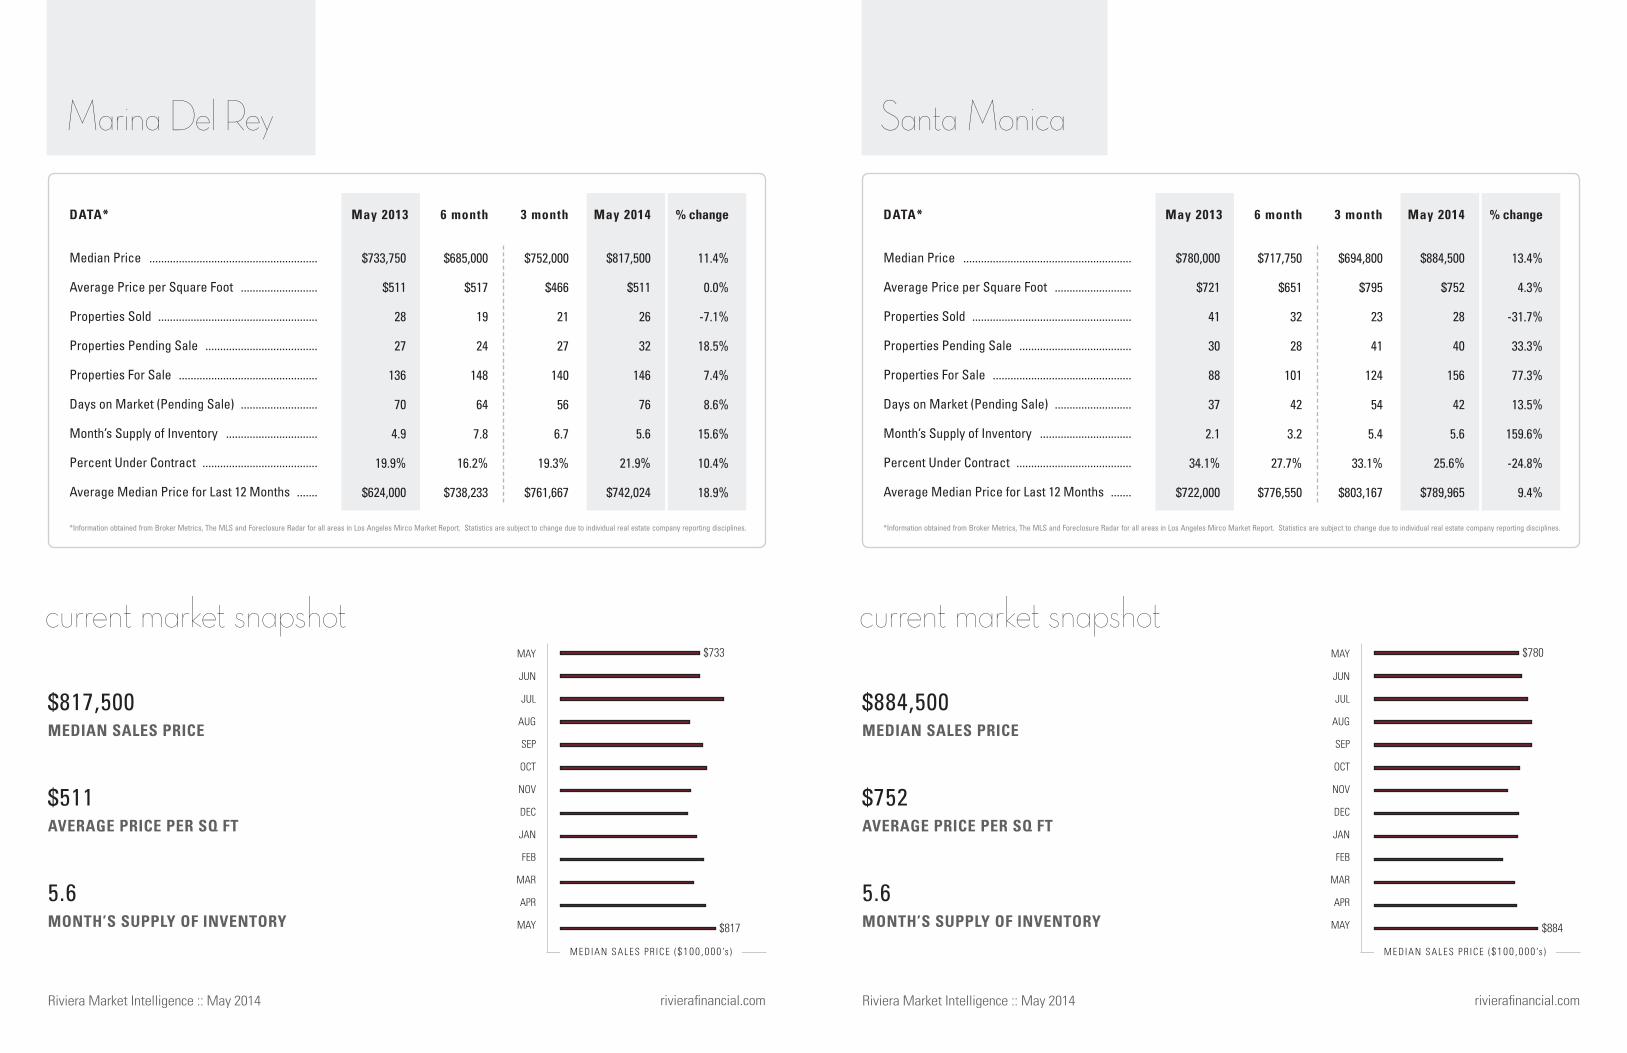
MEDIAN SALES PRICE
AVERAGE PRICE PER SQ FT
MONTH’S SUPPLY OF INVENTORY
Median Price .........................................................
Average Price per Square Foot ..........................
Properties Sold ......................................................
Properties Pending Sale ......................................
Properties For Sale ...............................................
Days on Market (Pending Sale) ..........................
Month’s Supply of Inventory ...............................
Percent Under Contract .......................................
Average Median Price for Last 12 Months .......
May 2013 May 2013May 2014 May 20146 month 6 month3 month 3 month% change % changeDATA* DATA*
current market snapshot
M E DIAN SALE S P R ICE ($100 ,000 ’s ) MEDIAN SALES PR ICE ($100 ,000 ’s )
rivierafinancial.com rivierafinancial.com
MEDIAN SALES PRICE
AVERAGE PRICE PER SQ FT
MONTH’S SUPPLY OF INVENTORY
current market snapshot
Riviera Market Intelligence :: May 2014Riviera Market Intelligence :: May 2014
MAY
JUN
JUL
AUG
SEP
OCT
NOV
DEC
JAN
FEB
MAR
APR
MAY
5.6
$752
$884,500
*Information obtained from Broker Metrics, The MLS and Foreclosure Radar for all areas in Los Angeles Mirco Market Report. Statistics are subject to change due to individual real estate company reporting disciplines.
13.4%
4.3%
-31.7%
33.3%
77.3%
13.5%
159.6%
-24.8%
9.4%
$694,800
$795
23
41
124
54
5.4
33.1%
$803,167
$717,750
$651
32
28
101
42
3.2
27.7%
$776,550
$884,500
$752
28
40
156
42
5.6
25.6%
$789,965
$780,000
$721
41
30
88
37
2.1
34.1%
$722,000
Santa Monica
MAY
JUN
JUL
AUG
SEP
OCT
NOV
DEC
JAN
FEB
MAR
APR
MAY
*Information obtained from Broker Metrics, The MLS and Foreclosure Radar for all areas in Los Angeles Mirco Market Report. Statistics are subject to change due to individual real estate company reporting disciplines.
11.4%
0.0%
-7.1%
18.5%
7.4%
8.6%
15.6%
10.4%
18.9%
$752,000
$466
21
27
140
56
6.7
19.3%
$761,667
$685,000
$517
19
24
148
64
7.8
16.2%
$738,233
$817,500
$511
26
32
146
76
5.6
21.9%
$742,024
$733,750
$511
28
27
136
70
4.9
19.9%
$624,000
Marina Del Rey
5.6
$511
$817,500
$733
$817
$780
$884

MEDIAN SALES PRICE
AVERAGE PRICE PER SQ FT
MONTH’S SUPPLY OF INVENTORY
Median Price .........................................................
Average Price per Square Foot ..........................
Properties Sold ......................................................
Properties Pending Sale ......................................
Properties For Sale ...............................................
Days on Market (Pending Sale) ..........................
Month’s Supply of Inventory ...............................
Percent Under Contract .......................................
Average Median Price for Last 12 Months .......
May 2013 May 2013May 2014 May 20146 month 6 month3 month 3 month% change % changeDATA* DATA*
current market snapshot
M E DIAN SALE S P R ICE ($100 ,000 ’s ) MEDIAN SALES PR ICE ($100 ,000 ’s )
rivierafinancial.com rivierafinancial.com
MEDIAN SALES PRICE
AVERAGE PRICE PER SQ FT
MONTH’S SUPPLY OF INVENTORY
current market snapshot
Riviera Market Intelligence :: May 2014Riviera Market Intelligence :: May 2014
MAY
JUN
JUL
AUG
SEP
OCT
NOV
DEC
JAN
FEB
MAR
APR
MAY
5.3
$340
$540,000
*Information obtained from Broker Metrics, The MLS and Foreclosure Radar for all areas in Los Angeles Mirco Market Report. Statistics are subject to change due to individual real estate company reporting disciplines.
4.7%
-3.7%
-58.8%
-65.2%
117.6%
162.2%
428.6%
-84.0%
12.0%
$439,000
$396
9
10
29
47
3.2
34.5%
$486,667
$380,000
$359
6
12
29
63
4.8
41.4%
$488,500
$540,000
$340
7
8
37
97
5.3
21.6%
$470,538
$516,000
$353
17
23
17
37
1
135.3%
$420,308
Studio City
MAY
JUN
JUL
AUG
SEP
OCT
NOV
DEC
JAN
FEB
MAR
APR
MAY
*Information obtained from Broker Metrics, The MLS and Foreclosure Radar for all areas in Los Angeles Mirco Market Report. Statistics are subject to change due to individual real estate company reporting disciplines.
21.5%
8.7%
-8.7%
-30.4%
211.8%
7.1%
241.5%
-77.7%
25.4%
$381,000
$293
12
18
35
53
2.9
51.4%
$396,333
$380,000
$313
18
21
35
45
1.9
60.0%
$402,333
$413,000
$313
21
16
53
60
2.5
30.2%
$385,154
$340,000
$288
23
23
17
56
0.7
135.3%
$307,077
Sherman Oaks
2.5
$313
$413,000
$340
$413
$516
$540
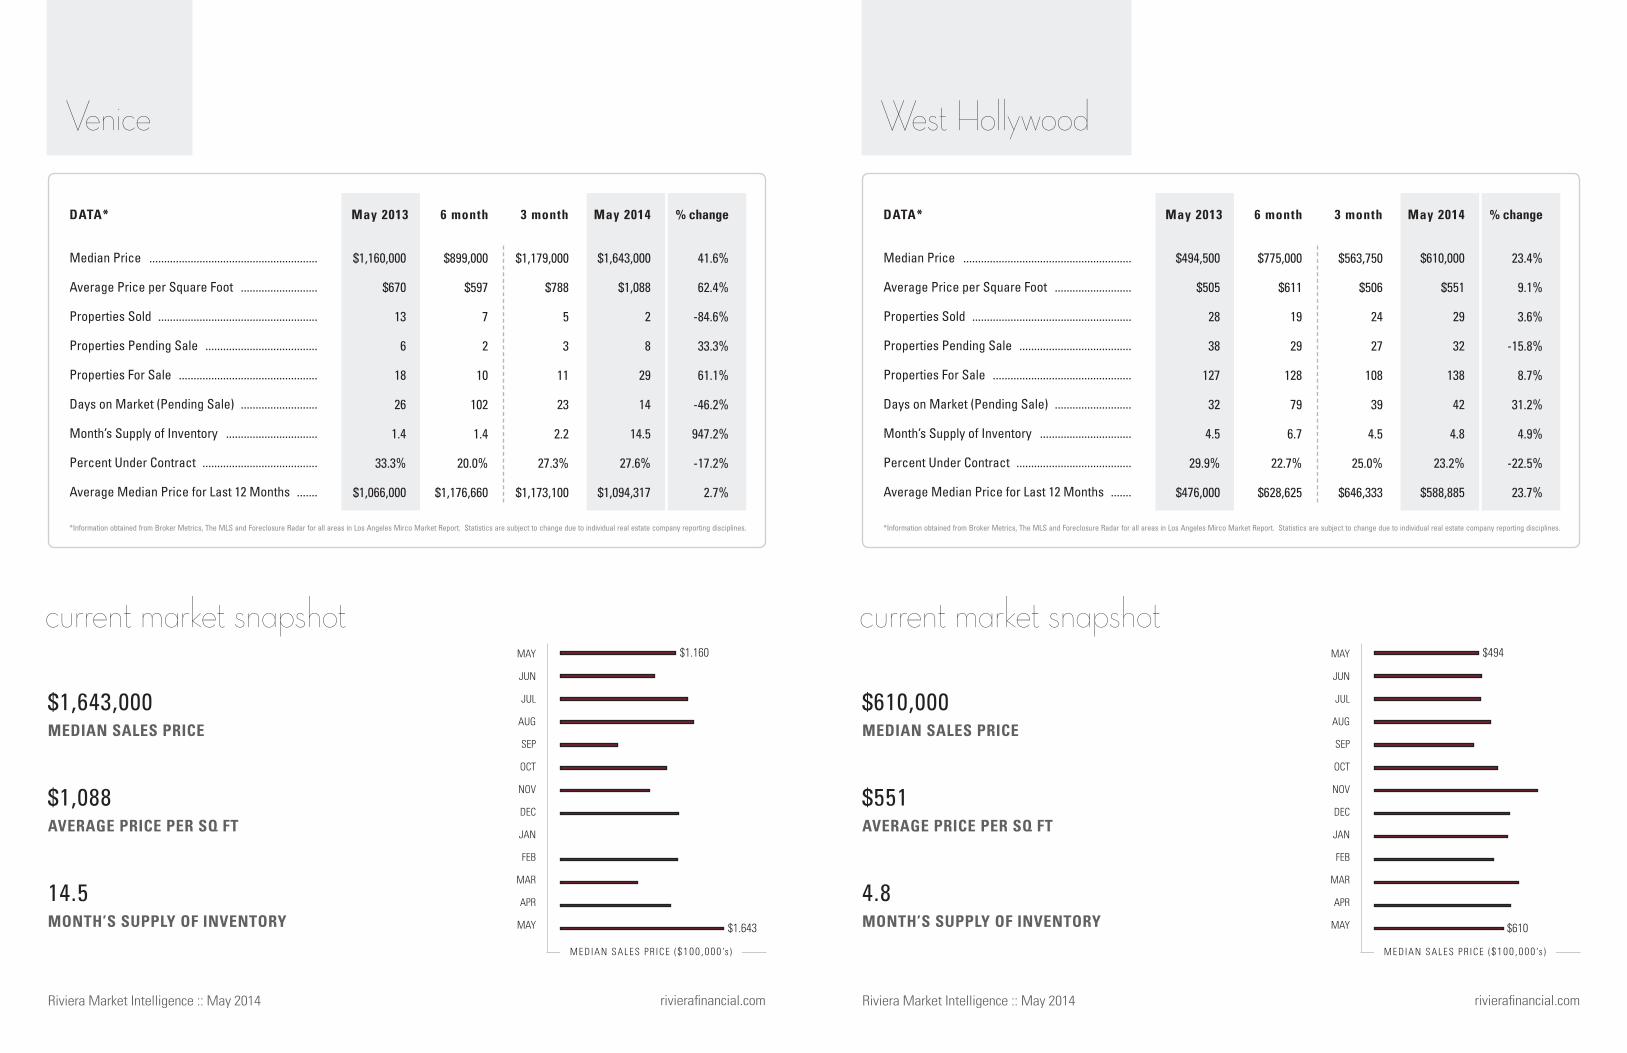
MEDIAN SALES PRICE
AVERAGE PRICE PER SQ FT
MONTH’S SUPPLY OF INVENTORY
Median Price .........................................................
Average Price per Square Foot ..........................
Properties Sold ......................................................
Properties Pending Sale ......................................
Properties For Sale ...............................................
Days on Market (Pending Sale) ..........................
Month’s Supply of Inventory ...............................
Percent Under Contract .......................................
Average Median Price for Last 12 Months .......
May 2013 May 2013May 2014 May 20146 month 6 month3 month 3 month% change % changeDATA* DATA*
current market snapshot
M E DIAN SALE S P R ICE ($100 ,000 ’s ) MEDIAN SALES PR ICE ($100 ,000 ’s )
rivierafinancial.com rivierafinancial.com
MEDIAN SALES PRICE
AVERAGE PRICE PER SQ FT
MONTH’S SUPPLY OF INVENTORY
current market snapshot
Riviera Market Intelligence :: May 2014Riviera Market Intelligence :: May 2014
MAY
JUN
JUL
AUG
SEP
OCT
NOV
DEC
JAN
FEB
MAR
APR
MAY
4.8
$551
$610,000
*Information obtained from Broker Metrics, The MLS and Foreclosure Radar for all areas in Los Angeles Mirco Market Report. Statistics are subject to change due to individual real estate company reporting disciplines.
23.4%
9.1%
3.6%
-15.8%
8.7%
31.2%
4.9%
-22.5%
23.7%
$563,750
$506
24
27
108
39
4.5
25.0%
$646,333
$775,000
$611
19
29
128
79
6.7
22.7%
$628,625
$610,000
$551
29
32
138
42
4.8
23.2%
$588,885
$494,500
$505
28
38
127
32
4.5
29.9%
$476,000
West Hollywood
MAY
JUN
JUL
AUG
SEP
OCT
NOV
DEC
JAN
FEB
MAR
APR
MAY
*Information obtained from Broker Metrics, The MLS and Foreclosure Radar for all areas in Los Angeles Mirco Market Report. Statistics are subject to change due to individual real estate company reporting disciplines.
41.6%
62.4%
-84.6%
33.3%
61.1%
-46.2%
947.2%
-17.2%
2.7%
$1,179,000
$788
5
3
11
23
2.2
27.3%
$1,173,100
$899,000
$597
7
2
10
102
1.4
20.0%
$1,176,660
$1,643,000
$1,088
2
8
29
14
14.5
27.6%
$1,094,317
$1,160,000
$670
13
6
18
26
1.4
33.3%
$1,066,000
Venice
14.5
$1,088
$1,643,000
$1.160
$1.643
$494
$610
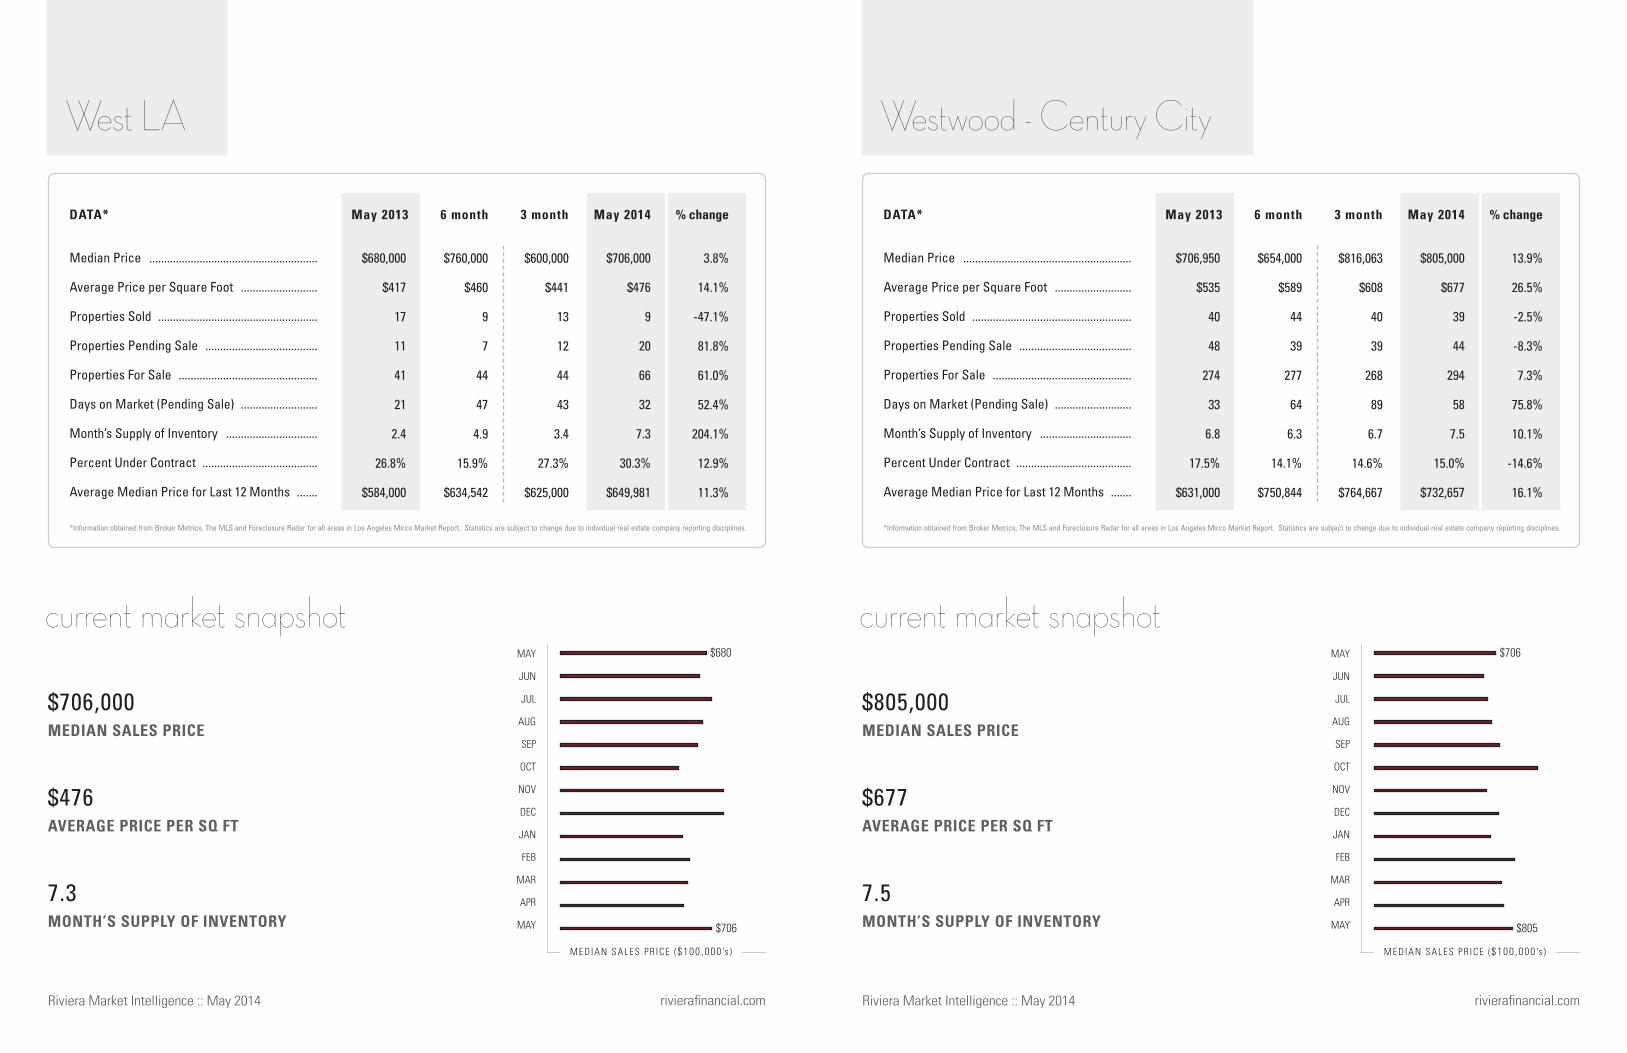
MEDIAN SALES PRICE
AVERAGE PRICE PER SQ FT
MONTH’S SUPPLY OF INVENTORY
Median Price .........................................................
Average Price per Square Foot ..........................
Properties Sold ......................................................
Properties Pending Sale ......................................
Properties For Sale ...............................................
Days on Market (Pending Sale) ..........................
Month’s Supply of Inventory ...............................
Percent Under Contract .......................................
Average Median Price for Last 12 Months .......
May 2013 May 2013May 2014 May 20146 month 6 month3 month 3 month% change % changeDATA* DATA*
current market snapshot
M E DIAN SALE S P R ICE ($100 ,000 ’s ) MEDIAN SALES PR ICE ($100 ,000 ’s )
rivierafinancial.com rivierafinancial.com
MEDIAN SALES PRICE
AVERAGE PRICE PER SQ FT
MONTH’S SUPPLY OF INVENTORY
current market snapshot
Riviera Market Intelligence :: May 2014Riviera Market Intelligence :: May 2014
MAY
JUN
JUL
AUG
SEP
OCT
NOV
DEC
JAN
FEB
MAR
APR
MAY
7.5
$677
$805,000
*Information obtained from Broker Metrics, The MLS and Foreclosure Radar for all areas in Los Angeles Mirco Market Report. Statistics are subject to change due to individual real estate company reporting disciplines.
13.9%
26.5%
-2.5%
-8.3%
7.3%
75.8%
10.1%
-14.6%
16.1%
$816,063
$608
40
39
268
89
6.7
14.6%
$764,667
$654,000
$589
44
39
277
64
6.3
14.1%
$750,844
$805,000
$677
39
44
294
58
7.5
15.0%
$732,657
$706,950
$535
40
48
274
33
6.8
17.5%
$631,000
Westwood - Century City
MAY
JUN
JUL
AUG
SEP
OCT
NOV
DEC
JAN
FEB
MAR
APR
MAY
*Information obtained from Broker Metrics, The MLS and Foreclosure Radar for all areas in Los Angeles Mirco Market Report. Statistics are subject to change due to individual real estate company reporting disciplines.
3.8%
14.1%
-47.1%
81.8%
61.0%
52.4%
204.1%
12.9%
11.3%
$600,000
$441
13
12
44
43
3.4
27.3%
$625,000
$760,000
$460
9
7
44
47
4.9
15.9%
$634,542
$706,000
$476
9
20
66
32
7.3
30.3%
$649,981
$680,000
$417
17
11
41
21
2.4
26.8%
$584,000
West LA
7.3
$476
$706,000
$680
$706
$706
$805

Financial security, expert staffi ng, advanced technology
and personalized service. Portfolio Escrow, Inc. is driven
to be a leading force in the escrow industry.
4 2 4 .2 0 3 .1 8 4 1
por t fo l ioescr ow.com
> por t fo l ioescr ow.com>
Effi cient
© 2011 Portfolio Escrow, Inc. All Rights Reserved

May 2014 | LOS aNGELES, ORaNGE, SaNTa BaRBaRa, & MONTEREy COUNTIES
©2014 Riviera Financial, Inc. Teles Properties is a registered trademark.
rivierafinancial.com