Embed Size (px)
Citation preview

AES/GE/10-14 Small and medium scale direct shear test of the Bremanger sandstone rockfill
July-2010 Xiaoshan Sun

Title : Small and medium scale direct shear test of the
Bremanger sandstone rockfill Author(s) : Xiaoshan Sun Date : July 2010 Professor(s) : dr.ir. D.J.M. Ngan-Tillard Supervisor(s) : dr.ir. D.J.M. Ngan-Tillard TA Report number : AES/GE/10-14 Postal Address : Section for Geo-engineering Department of Applied Earth Sciences Delft University of Technology P.O. Box 5028 The Netherlands Telephone : (31) 15 2781328 (secretary) Telefax : (31) 15 2781189 Copyright ©2010 Section for Geo-engineering All rights reserved. No parts of this publication may be reproduced, Stored in a retrieval system, or transmitted, In any form or by any means, electronic, Mechanical, photocopying, recording, or otherwise, Without the prior written permission of the Section for Geo-engineering
Acknowledgement
First, I greatly appreciate the help of my supervisor dr. ir. D. Ngan-Tillard (CiTG)
who advised and encouraged me during the compilation of this thesis.
I would like to thank dr. R.B.J.Brinkgreve for providing Plaxis 10 Beta version
software to me. I would also like to thank A. Mulder and H. de Visser for helping me
install the experimental equipments and M. van der Linden for conducting the
medium size shear box tests with me. It was a very enjoyable experience working
with all of you.
Last but not least, I would like to thank my parents, my family, my boyfriend, all of
my friends for everything they have done for me, especially for their support during
my study.

2
Table of content 1 Introduction ........................................................................................................... 12
2 Literature review ................................................................................................... 14
2.1 Factors affecting the shear strength of rockfill ........................................... 14
2.1.1 The direct shear test ......................................................................... 14
2.1.2 Factors affecting shear strength ....................................................... 15
2.2 Scale effects, determination of the maximum particle size ........................ 18
2.2.1 Scale effect ....................................................................................... 18
2.2.2 Determination of the maximum particle size ................................... 19
2.2.3 Shear strength models ...................................................................... 19
3 Apparatus, material and test procedure ................................................................. 30
3.1 Experiment apparatus ................................................................................. 30
3.1.1 Small size shear box (100mm*100mm*40mm) .............................. 30
3.1.2 Medium size shear box (500mm*500mm*400mm) ........................ 31
3.2 Rockfill material ......................................................................................... 33
3.3 Experiment procedure ................................................................................ 34
3.3.1 Small size shear box experiment procedure ..................................... 34
3.3.2 Medium size shear box experiment procedure ................................ 35
3.4 Overview of experiments ........................................................................... 36
4 Experimental results and discussion ..................................................................... 38
4.1 Small size direct shear box experiment results .......................................... 38
4.1.1 General trends .................................................................................. 38
4.1.2 Secant friction angle and dilatancy angle ........................................ 40
4.1.3 Strain at failure ................................................................................. 41
4.1.4 Factors affecting shear behavior ...................................................... 42
4.1.5 Stress-dilatancy ................................................................................ 45
4.1.6 Particle breakage .............................................................................. 47
4.1.7 Repeatability .................................................................................... 48
4.2 Medium size direct shear box experiment results ...................................... 49
4.2.1 General trends .................................................................................. 49

3
4.2.2 Secant friction angle and dilatancy angle ........................................ 49
4.2.3 Strain at failure ................................................................................. 51
4.2.4 Factors affecting shear behavior ...................................................... 52
4.2.5 Particle breakage .............................................................................. 53
4.2.6 Repeatability .................................................................................... 54
4.3 Comparison and discussion ........................................................................ 54
4.3.1 The general trend ............................................................................. 54
4.3.2 Secant friction angle and dilatancy angle at failure ......................... 54
4.3.3 Factors affecting shear behavior ...................................................... 55
5 Rockfill shear strength model ............................................................................... 57
5.1 Introduction ................................................................................................ 57
5.2 Mohr-Coulomb Model ................................................................................ 57
5.2.1 Introduction ...................................................................................... 57
5.2.2 Data Process Method ....................................................................... 58
5.2.3 Result ............................................................................................... 58
5.3 Power Curve Strength Model ..................................................................... 61
5.3.1 Introduction ...................................................................................... 61
5.3.2 Data process method ........................................................................ 61
5.3.3 Result ............................................................................................... 61
5.4 Hoek -Brown Model ................................................................................... 63
5.4.1 Introduction ...................................................................................... 63
5.4.2 Data process method ........................................................................ 63
5.4.3 Result ............................................................................................... 65
5.5 Barton Model .............................................................................................. 67
5.5.1 Introduction ...................................................................................... 67
5.5.2 Data process method ........................................................................ 68
5.5.3 Result ............................................................................................... 71
5.6 Comparison and conclusion of modeling results ....................................... 74
6 Plaxis modeling of the crane walk-way ................................................................ 75
6.1 Introduction ................................................................................................ 75
6.2 Method ........................................................................................................ 76

4
6.3 Result .......................................................................................................... 78
7 Conclusions and recommendations ....................................................................... 81
7.1 Conclusions ................................................................................................ 81
7.2 Recommendations ...................................................................................... 82
8 Reference .............................................................................................................. 83
9 Appendix ............................................................................................................... 87
9.1 AppendixⅠ: Hoek-Brown criterion detail curve fitting information ........ 87

5
Table of tables Table 2.1: The comparison between the direct shear test and the triaxial test ............. 15
Table 2.2: Summary of factors affecting the friction angle (Douglas, 2002) .............. 18
Table 2.3: Various shear strength model for rockfill (Douglas, 2002). In addition to
Douglas‟ models, the Hoek Brown model and Lee‟s model are also included. ........... 19
Table 2.4: Shear strength of heavily compacted sample of rockfill at low normal stress
(Charles & Watts, 1980) ............................................................................................... 22
Table 2.5: Shear strength parameters for some fills when using power curve strength
model (Charles, 1991). ID is the rockfill relative density ............................................. 23
Table 2.6: Shear strength parameters for some fills when using power curve strength
model (Estaire & Olalla, 2005) .................................................................................... 23
Table 3.1: Properties of the Bremanger sandstone ....................................................... 34
Table 3.2: The category name, category symbol, test detailed information of the small
and medium shear box tests ......................................................................................... 37
Table 4.1: The internal friction angle of six categories when using three low normal
stress and all six normal stress of the small size shear box test. .................................. 43
Table 4.2: The uniformity coefficient of category NB, MS and MB ........................... 44
Table 4.3: The influence of particle size, normal stress, density and uniformity
coefficient on shear strength, friction angle and dilatancy of the small shear box test 45
Table 4.4: The internal friction angle of the medium size shear box test .................... 52
Table 4.5: The influence of particle size and density on shear strength, internal friction
angle and volume expansion of the medium size shear box test ................................. 53
Table 4.6: The influence of particle size, density and normal stress on shear strength,
internal friction angle and volume expansion of both the small and medium size shear
box test ......................................................................................................................... 56
Table 5.1: The overview of four model application condition ..................................... 57
Table 5.2: The value A, B and R^2 when using the parabolic expression modeling ... 62
Table 5.3: The influence of UCS, density and maximum particle size on value A ..... 62
Table 5.4: The UCS, mi and D for the Bremanger sandstone rockfill. ........................ 63
Table 5.5: The best fit GSI and corresponding friction angle and cohesion calculated
by RocData ................................................................................................................... 66
Table 5.6: The influence of maximum particle size and density on GSI value ........... 67
Table 5.7: The calculated R, B and R2 value from the experimental result ................. 71

6
Table 5.8: The d50 and estimated S value from Barton's figure ................................... 73
Table 5.9: The general comment on the models .......................................................... 74
Table 6.1: Detailed input data for the dense sand and the Bremanger sandstone rockfill
material property .......................................................................................................... 76
Table 6.2: The safety factor and total displacement of the design ............................... 78
7
Table of figures Figure 1.1: The layout of the crane walk-way design (Krane, 2010) .......................... 12
Figure 2.1: Estimated variation of ‟ under toe and beneath downstream slope of dam
(Barton & Kjaernsli, 1981). The triangular shape of the slope is associated to a
triangular distribution of the vertical stress due to self-weight. ................................... 16
Figure 2.2: The explanation of normal stress, shear stress and displacement ............. 21
Figure 2.3: Estimate of Geological Index GSI based on geological descriptions (Hoek
& Brown, 1997). .......................................................................................................... 24
Figure 2.4: Selection of Geological Strength Index (Marinos et al., 2006) ................. 25
Figure 2.5: Method of estimating equivalent roughness (R) based on porosity of
rockfill (Barton & Kjaernsli, 1981) ............................................................................. 27
Figure 2.6: Method of estimating equivalent strength (S) of rockfill based on uniaxial
compression strength and d50 particle size (Barton & Kjaernsli, 1981) ...................... 27
Figure 2.7: Principle of tilt test for rock fill (Barton, 2008). Note the expression of R,
the equivalent roughness for the rock fill in 5 derived by applying the Barton‟s model
to the tilt test conditions. is the tilt angle and σ‟no, the normal stress on the sliding
surface. ......................................................................................................................... 28
Figure 3.1:The small size shear box at laboratory of Geo-engineering department of
TU Delft (Left: 4.5 kN loading ring; Right: 20 kN load cell) ...................................... 30
Figure 3.2: General arrangement of small shear box apparatus (Mulder & Verwaal,
2006) ............................................................................................................................ 31
Figure 3.3: The TU Delft medium size shear box. ....................................................... 32
Figure 3.4: Sketch of the medium size shear box (van der Linden, 2010) .................. 32
Figure 3.5: Movement of the upper box caused by particle trapped between the box.
Problem solved by inserting wooden blocks between the upper shear box and the steel
frame. ........................................................................................................................... 33
Figure 3.6: Tilted dead weight ..................................................................................... 33
Figure 3.7: Manual compaction in the medium scale shear box .................................. 36
Figure 4.1: Horizontal displacement vs. corrected shear stress of small shear box test
...................................................................................................................................... 39
Figure 4.2: Horizontal displacement vs. vertical displacement of small shear box test
...................................................................................................................................... 40
Figure 4.3: Correct normal stress vs. the secant friction angle at failure ..................... 41
Figure 4.4: Corrected normal stress vs. dilatancy angle at failure ............................... 41

8
Figure 4.5: Corrected normal stress vs. strain at failure .............................................. 42
Figure 4.6: Dilatancy vs. stress ratio of the small shear box test ................................. 47
Figure 4.7: Particle breakage at different normal stress ............................................... 48
Figure 4.8: The stress-strain and dilatancy figure of three specimens under the same
test condition. ............................................................................................................... 48
Figure 4.9: The stress-strain, vertical - horizontal displacement, dilatancy-stress ratio
figures for the medium size shear box test ................................................................... 50
Figure 4.10: Corrected normal stress vs. the secant friction angle at failure of the
medium size shear box test. ......................................................................................... 51
Figure 4.11: Corrected normal stress vs. dilatancy angle at failure of the medium size
shear box test ................................................................................................................ 51
Figure 4.12: Corrected normal stress vs. strain at failure ............................................ 52
Figure 4.13: Particle breakage of the medium size shear box (left: the position where
the rock was caught; right: the broken rock) ............................................................... 53
Figure 4.14: Corrected normal stress vs. the secant friction angle at failure ............... 54
Figure 4.15: Corrected normal stress vs. the dilatancy angle at failure ....................... 55
Figure 4.16: The internal friction angle of category NS, NB and M2 ......................... 55
Figure 5.1: The shear and normal stress relationship and the internal friction angle of
the small shear box test ................................................................................................ 59
Figure 5.2: The shear and normal stress relationship and the internal friction angle of
the medium size shear box test .................................................................................... 60
Figure 5.3: The relationship between the GSI value and maximum particle size
(category NS, NB and M2) .......................................................................................... 66
Figure 5.4: Corrected normal stress vs. basic friction angle at failure ........................ 69
Figure 5.5: Pictures of the small shear box (left: 3.35<P<6.30 mm; right:
3.35<P<6.30mm) ......................................................................................................... 70
Figure 5.6: Pictures of the medium shear box (left: 31.5<P<50 mm; right: 31.5<P<80
mm) .............................................................................................................................. 70
Figure 5.7:Estimating the equivalent roughness R (blue line for small shear box; red
line for medium size shear box) (Barton & Kjaernsli, 1981) ...................................... 72
Figure 5.8: Estimating S/UCS reduction factors for estimating S (Barton & Kjaernsli,
1981) ............................................................................................................................ 72
Figure 6.1: The layout of the crane walk-way design .................................................. 75
Figure 6.2: The dimension and detailed information of the design ............................. 75

9
Figure 6.3: GSI value vs. safety factor of the crane walk-way design ........................ 79
Figure 6.4: The total displacement when the normal load is in the middle and GSI
equal to 38 .................................................................................................................... 79
Figure 6.5: The vertical effective stress when the normal load is in the middle and GSI
equal to 38 .................................................................................................................... 79
Figure 6.6: The total displacement when the normal load is at the outer edge and GSI
equal to 38 .................................................................................................................... 80
Figure 6.7: The vertical effective stress when the normal load is at the outer edge and
GSI equal to 38 ............................................................................................................ 80
Figure 9.1: The power trend line curve of normal-shear strength value from category
NS test data .................................................................................................................. 87
Figure 9.2: The best fit curve with category NS test data when using Hoek-Brown
criterion ........................................................................................................................ 87
Figure 9.3: The power trend line curve of normal-shear strength value from category
NB test data .................................................................................................................. 88
Figure 9.4: The best fit curve with category NB test data when using Hoek-Brown
criterion ........................................................................................................................ 88
Figure 9.5: The power trend line curve of normal-shear strength value from category
HS test data .................................................................................................................. 89
Figure 9.6: The best fit curve with category HS test data when using Hoek-Brown
criterion ........................................................................................................................ 89
Figure 9.7: The power trend line curve of normal-shear strength value from category
HB test data .................................................................................................................. 90
Figure 9.8: The best fit curve with category HB test data when using Hoek-Brown
criterion ........................................................................................................................ 90
Figure 9.9: The power trend line curve of normal-shear strength value from category
MS test data .................................................................................................................. 91
Figure 9.10: The best fit curve with category MS test data when using Hoek-Brown
criterion ........................................................................................................................ 91
Figure 9.11: The power trend line curve of normal-shear strength value from category
MB test data ................................................................................................................. 92
Figure 9.12: The best fit curve with category MB test data when using Hoek-Brown
criterion ........................................................................................................................ 92
Figure 9.13: The power trend line curve of normal-shear strength value from category
M1 test data .................................................................................................................. 93

10
Figure 9.14: The best fit curve with category M1 test data when using Hoek-Brown
criterion ........................................................................................................................ 93
Figure 9.15: The power trend line curve of normal-shear strength value from category
M2 test data .................................................................................................................. 94
Figure 9.16: The best fit curve with category M2 test data when using Hoek-Brown
criterion ........................................................................................................................ 94
Figure 9.17: The power trend line curve of normal-shear strength value from category
M3 test data .................................................................................................................. 95
Figure 9.18: The best fit curve with category M3 test data when using Hoek-Brown
criterion ........................................................................................................................ 95

11
Abstract
This study focuses on the shear strength of the Bremanger sandstone used as rockfill
for a crane walkway. The rockfill was tested in a small (100*100*40mm) and a
medium scale (500*500*400mm) direct shear boxes to quantify the effect of particle
size, packing density and uniformity, specimen size, and normal stress on shear
strength. The laboratory data were fitted with four different models (Mohr-Coulomb
Model, Power Curve Strength Model, Hoek-Brown Model and Barton Model). The
Hoek-Brown model, initially developed for rock masses, was found to be suitable for
rockfills. Finally, a crane walk-way was simulated with Plaxis 10 Beta version to
assess its stability.

12
1 Introduction
Rockfill is generally produced at quarries and increasingly used as a fill or base
material for offshore structures, dams, road embankment and foundation for buildings
(Lee et al., 2009; Charles, 1991). Therefore, it is indispensable to make precise
research on the behavior of rockfill materials. The two most important factors
influencing the design of a rockfill structure are the shear strength and the
compressibility of the rockfill material (Marachi et al., 1972). However, it is difficult
to conduct shear tests on rockfill material mostly because it requires using large-scale
equipments and applying high stresses to cause failure in the specimen. As a result,
the small or medium size equipments are generally used. There are two major
problems that should be considered: 1) determination of the maximum particle size,
and 2) the scale-effect of the equipment (Asadzadeh & Soroush, 2009).
Previous studies indicated that the behavior of rockfill materials depends on factors
such as normal effective stress, particle size, density, uniformity coefficient,
maximum particle size, particle roughness, particle crushing strength, particle shape
and moisture content.
Figure 1.1: The layout of the crane walk-way design (Krane, 2010)
In this study, a small size shear box (100mm*100mm*40mm) and a medium size
shear box (500mm*500mm*400mm) were employed to determine the shear strength
properties of crushed sandstone from Dyrstad, Bremanger in Norway for constructing
a cobble beach and a crane walk way in the Maasvlaakte 2 project (MV2)of the
Netherlands (Figure 1.1). The cobble beach will form a transition between the soft
dunes and the rigid seawater breaker protecting the MV2 and the crane is used to put
in place the 40 tonne armourstones of the sea water breaker (Loman, 2009). This

13
project is constructed by the PUMA consortium, a joint venture of Boskalis and Van
Oord.
The main targets of this study are as follow:
Understand the shear strength behavior of the Bremanger sandstone rockfill;
Find out the influence of the particle size, density, uniformity and specimen size
on the direct shear test results;
Select a proper modeling method for this rockfill material;
Construct a rough 2D Plaxis (Plaxis bv, 2010) model for visualizing the
deformation and the distribution of stresses.

14
2 Literature review
2.1 Factors affecting the shear strength of rockfill
2.1.1 The direct shear test
The vast application of rockfill materials in geotechnical engineering makes the study
of the behaviour of these materials indispensable. However, due to the difficulties of
conducting shear tests on rockfill, the study results are limited. This chapter presents a
summary of the main factors affecting rockfill shear strength from the literature.
It is evident from existing research that triaxial, plane strain and direct shear have
been employed for studying the shear behaviour of rockfill materials. In this study, the
focus is on the direct shear tests. The direct shear test has been used in geotechnical
engineering over 50 years because of its simplicity and repeatability (Cerato &
Lutenegger, 2006). A direct shear test is a laboratory test used by geotechnical
engineers to find the shear strength parameters. The U.S. and U.K. standards defining
how the test should be performed are ASTM D 3080 and BS 1377-7:1990 respectively.
During the test, a specimen is placed in a shear box which has two stacked rings to
hold the sample; the contact between the two rings is at approximately the mid-height
of the sample. A confining stress is applied vertically to the specimen, and the upper
ring is pulled laterally until the sample fails, or through a specified strain. The load
applied and the strain induced is recorded at frequent intervals to determine a
stress-strain curve for the confining stress.
In this study, the friction angle ( ) is the main focus of the analysis, because cohesion
in rockfill is normally less of a concern in the design practice for civil structures (Lee
et al., 2009). Many test results have shown that the friction angle of rockfill in direct
shear test is higher than that of triaxial test (Ghanbari et al., 2008; Yan, 2004). As a
result, it is necessary to consider a higher safety factor when using the friction angle
estimated from direct shear test.
There are two different friction angle concepts used in this study, secant friction angle
and internal friction angle. Secant friction angle ( ) is the arctangent of the shear
strength over the normal stress at failure (
). A different secant
friction angle is derived from each specimen. Internal friction angle ( ) is
determined from Mohr-Coulomb linear failure envelopes constructed as best-fit lines.
A different internal friction angle is derived from each test category.
.

15
Table 2.1: The comparison between the direct shear test and the triaxial test
The direct shear test The triaxial test
Failure surface The failure surface is
predetermined
The failure surface is not fixed
Friction angle Higher Lower
Advantages Simple, low cost The test result is much more close to reality, but
the test procedure is more complex
2.1.2 Factors affecting shear strength
According to previous research, the main factors affecting the behaviour of rockfill
material are: normal effective stress, density, particle size, particle roughness, particle
shape, uniformity coefficient and moisture content.
Marsal (1973) performed tests on the shear strength and found out the strength of
rockfill is positively correlated -with normal effective stress, dry density, particle
roughness, particle crushing strength and inversely with grain size, uniformity of
grading, and particle shape. The failure envelops of rockfill material are usually
non-linear and stress dependent (Marsal, 1973; Asadzadeh & Soroush, 2009; Lee et al.,
2009). The friction angle is the most important parameter regarding the shear strength
property.
2.1.2.1 Normal stress and low normal stress
The results of previous research on shear tests demonstrated that the shear
stress-strain curve for rockfill is non-linear, particularly at low normal pressure
(Marachi et al., 1969; Leps, 1970; Bertacchi & Bellotti, 1970; Penman et al., 1982;
Indraratna et al., 1993; Anagnosti & Popovic, 1982; Al-Hussaini, 1983).
Indraratna (1994) indicated that the frictional angle decrease with the increase of
normal stress. This can be explained by the theory that as normal stress is increased,
dilation is suppressed, therefore shear strength increase is reduced (Douglas, 2002).
This curved strength envelop of rockfill has a large impact on the stability analysis of
rockfill dam due to the fact that a lower safety factor will be produced for the shallow
slip surface when using constant friction angle (Indraratna, 1994; Douglas, 2002;
Barton & Kjaernsli, 1981). In other words, the high friction angles associated to low
normal stresses are favourable to resistance against ravelling (Barton & Kjaernsli,
1981), at the slope toe and close to the downstream face of the slope (Figure 2.1).

16
Figure 2.1: Estimated variation of ’ under toe and beneath downstream slope of dam (Barton &
Kjaernsli, 1981). The triangular shape of the slope is associated to a triangular distribution of the
vertical stress due to self-weight.
2.1.2.2 Maximum Particle size
Different researches obtain contradictory results in terms of the effect of particle size
on shear strength (Douglas, 2002). Most results indicate that the shear strength
decreases with particle size (Marachi et al., 1972; Marsal, 1973), while some studies
show the opposite effect (Anagnosti & Popovic, 1982) or no effect at all (Charles &
Watts, 1980).
2.1.2.3 Density
It is generally accepted that the shear strength of rockfill increases with a higher
relative density (Leps, 1970; Marsal, 1973). Douglas (2002) indicated that the shape
of Mohr-Coulomb failure envelope is affected by this factor. The dense rockfill
specimens show a marked curvature on the stress-strain curve, which shows a distinct
drop in the friction angle while the loose rockfill specimens shows minimal curvature
and drop in friction because the loose material require less dilation as particle have
more freedom to move or rotate during shearing (Douglas, 2002).
Cerato & Lutenegger (2006) used five sands with different properties to test in three
square shear boxes of varying size, each at three densities: dense, medium and loose.
The result turned out to be that the friction angle increases with increasing relative
density in each of the three boxes.

17
2.1.2.4 Uniformity coefficient
Douglas (2002) concluded that a poorly-graded rockfill, which is with low uniformity
coefficient, would have a higher strength than a well-graded rockfill because
well-graded material would be more likely to reduce the amount of dilatancy due to
the fact that the gaps in rockfill are being filled with small particles. The impact of
type of grading on the friction angle is about 2 to 3 degrees (Ghanbari et al., 2008).
Brauns (1968) found that in well graded material the percentage of crushed rock is
less and the friction angle will be higher (Ghanbari et al., 2008). Marachi et al (1969)
found out that if both rockfills were compacted to their maximum density then the
well graded material could be expected to be stronger as it would have the greater
density. However, Douglas (2002) indicated that a poorly-graded rockfill would have
a higher strength than a well-graded material assuming a constant void ratio for both
because a well-graded material would be more likely to reduce the amount of dilation
required due to the gaps in the gravel matrix being filled with smaller particles.
2.1.2.5 Particle breakage
The particle breakage generally increases when the stress level increases. However,
the breakage, which is dependent on the particle property, can happen even at low
normal stress. Furthermore, there are several factors influencing particle breakage,
apart from stress level, such as uniaxial compressive strength, particle size, particle
angularity, uniformity, relative density, stress path, water content, etc (Lee et al., 2009;
Asadzadeh & Soroush, 2009; Marachi et al., 1969).
2.1.2.6 Summary
Douglas (2002) summarized the factors affecting the friction angle and pointed out
that the most significant effects on the friction angle are caused by normal pressures,
density and maximum particle size (Table 2.2).

18
Table 2.2: Summary of factors affecting the friction angle (Douglas, 2002)
Parameter
Effect on
with
increase in
parameter
Comment
Normal pressure Decrease
Significant effect. The rate of decrease in
will drop with increasing normal pressure
Unconfined compressive strength
of intact rock Increase
Effect will depend on the ratio of confining
stress to compressive strength
Uniformity coefficient Decrease
Minor effect and may reverse if samples are
compacted to their maximum density
Density Increase
Maximum particle size (assuming
the ratio of maximum particle size
to sample diameter is constant)
No
consensus
reached
Ratio of maximum particle size to
sample diameter Increase
Angularity Increase
The effect will be most noticeable with highly
angular material
Percent finer than gravel size in
sample Decrease
The effect will not be significant at low
percentages. At higher percentages, strength
will approach that of the finer material
2.2 Scale effects, determination of the maximum particle size
2.2.1 Scale effect
The effect of the apparatus size on direct shear test is a very important issue because a
lot of small shear box tests are used to determine the friction angle of content material.
It is still questionable that whether the current practice of using small shear boxes to
find the friction angle is appropriate (Cerato & Lutenegger, 2006).
Cerato & Lutenegger (2006) found that the friction angle of well-graded, angular
sands decreases as direct shear box size increase. The friction angle should be

19
determined using the largest box size. On the other hand, the and
ratios, where H is the height of the box, W is the width of the box and dmax is the
maximum particle size, need to be taken into consideration. If the material cannot
meet the ASTM Standard 3080-90, then the friction angle should be reduced by 10%
to ensure an accurate strength parameter.
2.2.2 Determination of the maximum particle size
In the experimental apparatus, the maximum particle size is determined by the
minimum dimension of the apparatus. There are several different standard systems to
determine the maximum allowable particle size for a shear box test.
The first one is the Japanese standard, where the maximum allowable particle size
for a large shear box test is 1/10-1/5 of the box length, 1/7-1/5 of the box height
and 1/9-1/5 of the smaller of the box length or height (Lee et al., 2009).
The second one is the ASTM D 3080-90 standard. It requires a minimum
specimen thickness of six times the maximum particle diameter and a minimum
specimen width of 10 times the maximum particle diameter in determining what
size shear box should be used for testing sands. A minimum specimen width to
thickness ratio 2:1 is required.
The second set of standards will be used in this study.
2.2.3 Shear strength models
There are a number of different models for describing the strength of rockfill
materials. Table 2.3 shows the shear strength model for rockfill as summarized by
Douglas (2002).
Table 2.3: Various shear strength model for rockfill (Douglas, 2002). In addition to Douglas’
models, the Hoek Brown model and Lee’s model are also included.

20
Reference Equation Parameters
De Mello (1977)
Charles & Watts (1980)
A,B=4.4,0.81 (Sandy gravel);
A,B=4.2,0.75 (Soft rockfill);
A,B=1.4,0.90 (Soft rockfill);
Indraratna et al (1993)
Indraratna (1994)
a,b=0.25,0.83 (lower bound, ) =0.1-1 MPa;
a,b=0.71,0.84 (upper bound, ) =0.1-1 MPa;
a,b=0.75,0.98 (lower bound, ) =1-7 MPa;
a,b=1.80,0.99 (upper bound, ) =1-7 MPa;
Sarac & Popovic (1985)
A increase with
;
B increase with
;
Indraratna et al (1993)
Indraratna (1994)
;
;
;
;
Indraratna et al (1998)
a,b = 84.98, -0.49 (gradation A)
a,b = 125.17, -0.56 (gradation B)
Doruk (1991)
m, a
Barton &
Kjaernsli(1981)
;
R – equivalent roughness; S – equivalent
strength;
Charles (1991)
;
;
Gonzalez (1985)
;
- standard crushing grain strength;
Hoek Brown (1997,
2002)
and
are the major and minor effective
principal stresses at failure; is the uniaxial
compressive strength of the intact rock
material; s and a are constants for the rock
mass
Lee (2009)
UCS is the uniaxial compressive strength of the
parent rock in MPa, is the internal friction
angle in degrees

21
= Normal stress;
= Unconfined compressive strength of the intact rock pieces;
= Coefficient of uniformity;
= Unit weight;
= Particle diameter at which 50% of the material is finer;
In this study, the four most widely used and accepted strength models for soil and
rock (Mohr-Coulomb model, Power Curve strength model, Hoek & Brown model and
Barton‟s model) are used to analyse the direct shear tests data. The basic concept of
these models is explained below.
2.2.3.1 Mohr-Coulomb Model
Mohr-Coulomb model is the most common failure criterion encountered in
geotechnical engineering. This model describes a linear relationship between normal
and shear stresses (or maximum and minimum principal stresses) at failure
(Rocscience Inc., 2004). The direct shear formulation of this criterion can be
represented by the equation:
Where τ is peak shear stress;
is peak normal stress;
is the angle of friction;
c is the cohesive strength;
Figure 2.2: The explanation of normal stress, shear stress and displacement
Failure occurs according to Mohr Coulomb criterion of failure when the applied shear
stress less the frictional resistance related to the normal stress on the failure plane
becomes equal to the rock cohesion.
The model will be analyzed under two hypotheses. One is assuming without cohesion
(hypothesis 1) and the other is assuming an apparent cohesion (hypothesis 2):

22
Where τ is the peak shear stress;
is the peak normal stress;
is the angle of friction;
c is the cohesive strength;
2.2.3.2 Power Curve Strength Model
Large amount of experimental evidence suggests that the failure envelopes of many
geotechnical materials are not linear, particularly in the range of small normal stresses.
The relationship between shear and normal stresses of curved envelopes can be
described with the Power Curve model (Rocscience Inc., 2004):
where a, b and d are the parameters of the model.
For rockfill material, various power curve strength criteria have been found (Charles
& Watts, 1980; Charles, 1991; Indraratna, 1994; Estaire & Olalla, 2005). In this study,
the parabolic expression is chosen for fitting the direct shear box test result:
The interpretation using parabolic expression has been performed by several authors.
De Mello (1977) interpreted tests performed by Marsal (1973) and indicated that the
parabolic expression is suitable for the curved rockfill strength envelope and obtained
value B between 0.81 and 0.88. Matsumoto & Wanatabe (1987) fitted 49 triaxial tests
and indicated that value B ranges from 0.77 to 0.97 with an average value of 0.85.
Charles & Watts (1980) also used the parabolic expression to analyze the shear
strength of rockfill from large size triaxial data (Table 2.4). Furthermore, Charles
(1991) suggested value A and B for different rockfill (Table 2.5).
Table 2.4: Shear strength of heavily compacted sample of rockfill at low normal stress (Charles &
Watts, 1980)
Rock type A B
Sandstone 6.8 0.67
Slate 5.3 0.75
Slate 3.0 0.77
Basalt 4.4 0.81

23
Table 2.5: Shear strength parameters for some fills when using power curve strength model
(Charles, 1991). ID is the rockfill relative density
Rock type ID A B
Sandy gravel 0.95 4.4 0.81
Soft rockfill 0.95 4.2 0.75
Soft rockfill 0.70 1.4 0.90
Estaire & Olalla (2005) conducted 1 m3 direct shear box tests on armourstone and
found value A and B for both poured armourstone and compacted armourstone.
Table 2.6: Shear strength parameters for some fills when using power curve strength model
(Estaire & Olalla, 2005)
Rock Type Density
(Mg/m3)
A B R2
Poured armourstone 1.75 2.4 0.87 0.99
Compacted armourstone 2.0 6.05 0.75 0.98
Asadzadeh & Soroush (2009) worked on direct shear box of limestone rockfill, which
has a UCS value of 84 MPa, and found that the A value was around 3.4-3.72 and the B
value was around 0.821-0.824.
2.2.3.3 Hoek -Brown Model
Hoek-Brown model is an empirical failure criterion that establishes the strength of
rock in terms of major and minor principal stresses. It predicts strength envelops that
agree well with values determined from experimental triaxial test of intact rock, and
from observed failures in jointed rock masses (Rocscience Inc., 2004).
The generalized Hoek-Brown failure criterion is expressed as:
Where and
are the major and minor effective principal stresses at failure;
is the uniaxial compressive strength of the intact rock material;
s and a are constants for the rock mass given by the following relationships:

24
s is the strength reduction factor, i.e. the ratio of the uniaxial compressive strength of
the rock mass and rock material.
is a reduced value of the material constant . It represents the degree of
interlocking of the rock mass and quality of discontinuity walls and is given by
mb and s are rock constants while mi is a material constant for intact rock that plays
the role of friction angle for a curved failure envelop.
GSI, known as the Geological Strength Index, relates the failure criterion to visual
geological observations in the field. Its value ranges from 100 for fully intact rock
down to 0 for very poor and laminated / sheared rock sections. The GSI parameter can
be selected on the basis of the well-known charts as depicted in Figure 2.3.
D is a factor which depends upon the degree of disturbance to which the rock mass
has been subjected by blast damage and stress relaxation. It varies from 0 for
undisturbed in situ rock masses to 1 for very disturbed rock masses.
Figure 2.3: Estimate of Geological Index GSI based on geological descriptions (Hoek & Brown,
1997).
25
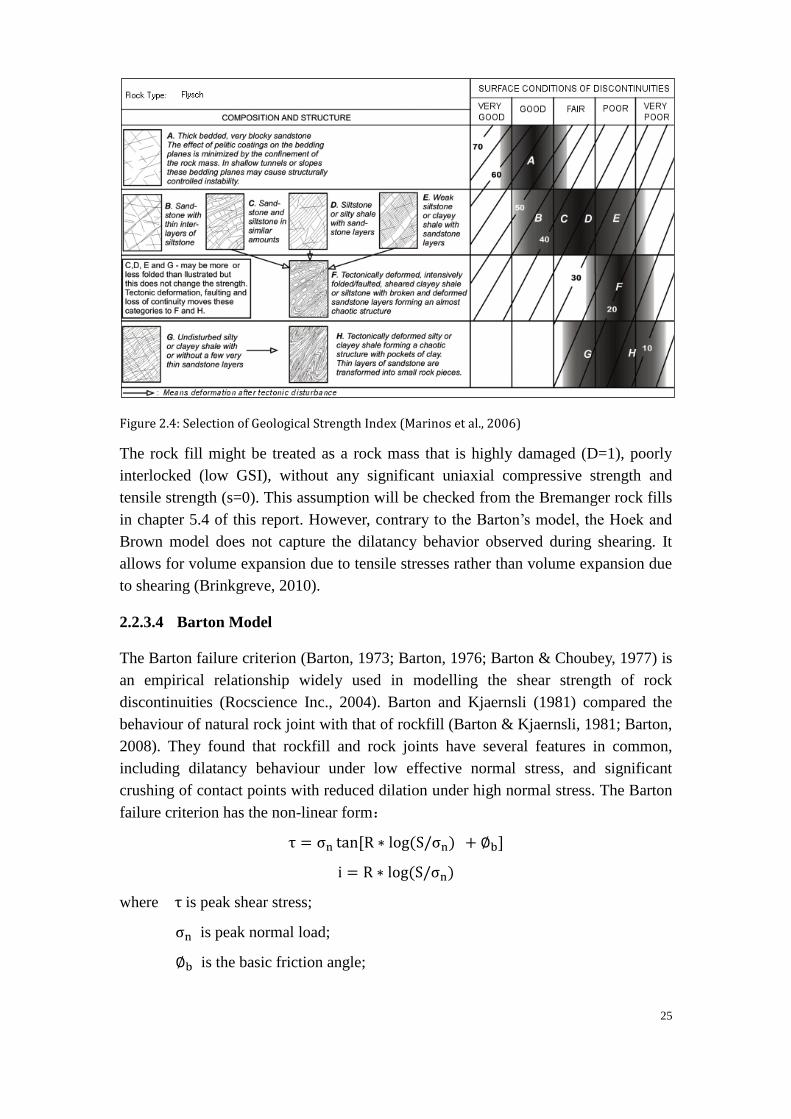
Figure 2.4: Selection of Geological Strength Index (Marinos et al., 2006)
The rock fill might be treated as a rock mass that is highly damaged (D=1), poorly
interlocked (low GSI), without any significant uniaxial compressive strength and
tensile strength (s=0). This assumption will be checked from the Bremanger rock fills
in chapter 5.4 of this report. However, contrary to the Barton‟s model, the Hoek and
Brown model does not capture the dilatancy behavior observed during shearing. It
allows for volume expansion due to tensile stresses rather than volume expansion due
to shearing (Brinkgreve, 2010).
2.2.3.4 Barton Model
The Barton failure criterion (Barton, 1973; Barton, 1976; Barton & Choubey, 1977) is
an empirical relationship widely used in modelling the shear strength of rock
discontinuities (Rocscience Inc., 2004). Barton and Kjaernsli (1981) compared the
behaviour of natural rock joint with that of rockfill (Barton & Kjaernsli, 1981; Barton,
2008). They found that rockfill and rock joints have several features in common,
including dilatancy behaviour under low effective normal stress, and significant
crushing of contact points with reduced dilation under high normal stress. The Barton
failure criterion has the non-linear form:
where is peak shear stress;
is peak normal load;
is the basic friction angle;

26
R is equivalent roughness of rockfill;
S is equivalent strength of rockfill particles;
i is the structural component of strength;
reflects the texture of the rock material; it depends on the mineralogy and grain
size of the rock material. can be obtained by carrying out direct shear box tests or
tilt tests on smooth saw cut or sand blasted discontinuities. Alternatively, it can be
derived from a table in which Barton summarized values of the basic friction angle
values published in the 1960‟ies and early 1970‟ies for a number of rock types
(Barton, 1973). It is probable that values derived from sand blasted surface are low
estimates of the basic friction angle. Damage cracks have been found at a distance of
0.1 mm behind the sand blasted surface (Verhoef, 1987). These cracks are likely to
cause an early grain failure during shearing (Verhoef, 2010).
R and S values can be estimated using empirical charts. R is a function of porosity of
the rockfill and particle origin, roundedness and smoothness (Figure 2.5).
S can be estimated empirically by the S/UCS reduction factors once the mean particle
size is known (Figure 2.6). Barton and Kjaernsli (1981) explains that the S-shape of
the curve is probably due to the fact that large rock samples contain many
micro-cracks and sand grains, none. The reduction of particle strength with decreasing
mean particle size is stronger in triaxial than in plane strain conditions. It reaches up
to 70% when the mean particle diameter varies between 5 and 20 mm in triaxial
conditions and, up to only 30 % when the mean particle diameter varies between 3
and 15 mm in plane strain conditions. According to Barton‟s model, an increase in
mean particle size will result in a decrease in rock fill strength. Any difference in
grading is captured in the achieved porosity, and therefore in the equivalent roughness
parameter.

27
Figure 2.5: Method of estimating equivalent roughness (R) based on porosity of rockfill (Barton &
Kjaernsli, 1981)
Figure 2.6: Method of estimating equivalent strength (S) of rockfill based on uniaxial compression
strength and d50 particle size (Barton & Kjaernsli, 1981)

28
Figure 2.7: Principle of tilt test for rock fill (Barton, 2008). Note the expression of R, the
equivalent roughness for the rock fill in 5 derived by applying the Barton’s model to the tilt test
conditions. is the tilt angle and σ’no, the normal stress on the sliding surface. Once S and b are known, it is possible to back-calculate R from a tilt test as
explained in Figure 2.7.
R and S are used to estimate i, the structural component of strength. i corresponds to
an increase of strength due to interlocking of rock fill particles. It is the equivalent for
rock discontinuities of the contribution of interlocked asperities. For discontinuities,
the structural component of strength is related to discontinuity dilatancy. When
shearing causes slight damage of discontinuity walls, they are equal (Barton &
Choubey, 1977). In a similar way, for rock fills made of strong rocks with respect to
applied stresses, one can expect that the structural component of strength is equal to
the dilatancy at failure.
i = Ψ
with Ψ, the rock fill dilatancy at failure.
Dilatancy is strongly stress dependent which explains partly the non-linearity of the
failure envelop of rock fills. As stress increases towards the equivalent particle
strength, crushing at contact points between particles becomes dominant and i
decreases.
By measuring shear strength and dilatancy during direct shear box shearing under
different normal stresses, the parameters of the Barton‟s model might be derived. This
assumption is checked in chapter 5.5 of this report. The obtained values (in case of a

29
reasonable fit) can be compared to values either derived using the table proposed by
Barton for the basic friction angle and the charts developed to estimate the equivalent
particle strength and roughness or back-calculated from tilt test results.
Barton (1973) indicated that at low values of normal stress, a maximum value of
secant friction angle of 70 degree seems to occur with some frequency on rock joint
although it is quite possible for rough, continuous joints to have friction angle up to
80 degree at extremely low normal stresses.
Leps (1970) assembled a significant number of large-scale triaxial shear test data for
rockfills of various types. Barton (1981) used these data to fit in the Barton‟s model
and suggest that R ranges from 5 to 10 and S ranges from 10 to 100 MPa.

30
3 Apparatus, material and test procedure
3.1 Experiment apparatus
3.1.1 Small size shear box (100mm*100mm*40mm)
The small direct shear test apparatus consists of a direct shear box of dimensions W=
100 mm, L=100mm, H=40mm, a steel frame, a thyristor controlled drive unit, a
loading ring, weight hanger, loading yoke and a data acquisition system. The vertical
load is applied by the yoke which is placed on the loading cap and by putting weight
on the weight hanger. For greater normal load, the slotted weights can put on the
hanger from the level. In this case, the applied weight is multiplied by a factor of 11
because of the length of the beam (Figure 3.1).
The lower shear box is fixed to a carriage. The shearing load is applied to the carriage
as well as the lower shear box while the upper shear box is fixed (Figure 3.2). The
maximum load of the loading ring is around 4.5 kN, so a 20 kN load cell was replaced
for higher normal load tests (normal load: 555.98 kg and 885.98 kg). The dial gauges
and the force transducers are connected to the data acquisition system WINCLISP
program v4.51.
Figure 3.1:The small size shear box at laboratory of Geo-engineering department of TU Delft (Left:
4.5 kN loading ring; Right: 20 kN load cell)

31
3.1.2 Medium size shear box (500mm*500mm*400mm)
The medium size shear test apparatus consists of a direct shear box that is 500 mm
wide and long and 400 mm high, vertical and shearing loading units, a steel frame,
force and displacement measuring devices, and a data acquisition system. The vertical
load is exerted on the specimen with a loading plate with steel dead weight on top. As
a result, it is low. At the maximum, 800 kg of steel plates are applied onto the top
plate which corresponds to a normal stress of 32 kPa. The plates are prevented from
toppling down by safety straps hanging loosely onto the portal crane. The shearing
load is applied by an electric motor with a worm wheel and reduction gear to the
lower shear box while the upper shear box is onto the steel frame. The load cells
placed between the steel frame and the upper box record the horizontal force applied
by the content of the lower box being sheared against the material contained in the
upper box. The capacity of each load cells is 50 kN so that the maximum shear
strength that can be generated during testing is 500 kPa at 20% horizontal strain. The
friction between the upper and lower box is less than 85 N. It was measured by
conducting shear tests with empty boxes. The range of the horizontal displacement is
20 cm while the maximum allowable horizontal displacement is 10 cm, which
corresponds to 20% horizontal strain. The range of the vertical displacement is only 2
cm so that the transducer needs to be re-set during testing when testing strongly
dilatant materials. The dial gauges and the force transducers are connected to the data
acquisition system mp3, an in-house software developed at TU Delft. Shearing is
conducted at a rate of 10 mm per min. To prevent rocks from getting trapped in
between the edges of the boxes during shearing (Figure 3.3), the vertical movement of
the top shear box was restricted by inserting wooden blocks between the top shear box
and the steel frame. As the aggregates tend to lift up the upper box when they dilate,
friction between the steel surfaces of the upper and lower boxes is not increased after
Figure 3.2: General arrangement of small shear box apparatus (Mulder & Verwaal, 2006)

32
the insertion of the wooden blocks. The lateral movement of the boxes is not
prevented. During shearing, the horizontal forces measured by both load cells can
differ. In this report, they are averaged. During shearing, the top plate that transmits
the dead weight provided by the steel plates to the aggregates, is tilted when the
aggregates are sheared and dilate. As a result, the dead weight applies both a normal
and shear load component onto the aggregates (van der Linden, 2010).
Figure 3.3: The TU Delft medium size shear box.
Figure 3.4: Sketch of the medium size shear box (van der Linden, 2010)

33
Figure 3.5: Movement of the upper box caused by particle trapped between the box. Problem
solved by inserting wooden blocks between the upper shear box and the steel frame.
Figure 3.6: Tilted dead weight
3.2 Rockfill material
The rockfill used in this research is the Bremanger sandstone, which is used to create
a cobble beach as well as a walk way for a crane in the Maasvlaakte 2 project (MV2)
(the seaward extension of the Port of Rotterdam) of the Netherlands.
The Bremanger sandstone is a dark colored rock with alternating black, grey and
white layers. As it has sustained some metamorphism, it is a meta-sandstone rather

34
than sandstone. This sandstone is mined in an open pit operation situated on a
mountain plateau 400-500 meters at Dyrstad, in Norway then shipped to the Yangtze
harbor in Rotterdam.
Preliminary physical tests were carried out to identify the basic properties of this
sandstone (Alnaes et al., 1999) (Table 3.1). The uniaxial compressive strength of the
intact rock pieces is high, 188 MPa in average. The density of this material ranges
from 2.67 to 2.74 Mg/m^3. The shape of rock used in the rockfill is elongated and
angular.
Table 3.1: Properties of the Bremanger sandstone
Parameter Name Average Value Unit
Modulus of Elasticity 93.5 GPa
Poisson’s ratio 0.31
Uniaxial compressive strength 188.7 MPa
Sonic velocity 5664 m/s
Bulk density 2.747 Mg/m^3
3.3 Experiment procedure
3.3.1 Small size shear box experiment procedure
Sieving
Four sieves (1.18mm, 3.35mm, 6.3mm, 10mm) are used to separate the Bremanger
sandstone into three categories (1.18mm<P<3.35mm, 3.35mm<P<6.3mm,
6.3mm<P<10mm). ASTM D 3080-90 requires a minimum specimen thickness of six
times the maximum particle diameter and a minimum specimen width of 10 times the
maximum particle diameter and the specimen used in this direct shear test is
100*100*40 mm. In this case, only two categories (1.18mm<P<3.35mm,
3.35mm<P<6.3mm) were used in the test. The dmax/W is 1/15.8 and dmax/H is 1/6.3,
so the Japanese standard has been fulfilled as well.
Preparation of specimen
From each specimen, the material is weighed before being placed inside the shear box
and the mass was determined to 0.01 gram. A layer of sandstone aggregates is placed
into the shear box, and compacted with a hammer. The surface layer is loosened
before adding more sandstone to avoid forming separate layers. These steps are

35
repeated until the shear box is filled. Then the unused sandstone is weighted and the
initial mass of the specimen is determined. For the high density specimen, the above
steps are conducted in a vibration equipment to achieve a better compaction.
Preparation of test
After placing the compacted specimen in the shear box, the horizontal displacement,
the vertical displacement and shear force measurement gauges are installed. The
shearing speed is fixed to 1mm/min (Mulder & Verwaal, 2006). The data record
software is opened, the test parameters set-up and the initial conditions are entered.
Recording data
The motor is started and readings are taken on the measuring devices at regular
intervals (5 seconds) until the vertical displacement is around 11 mm (around 10%
shear strain).
Particle breakage data
For category NB and HB, particle breakage data was measured. Each specimen was
sieved after the direct shear test and the weight of each size category was recorded.
3.3.2 Medium size shear box experiment procedure
The test procedure for the medium size shear box was similar with that of the small
shear box. The differences are listed as follows:
Sieving
Three sieves (31.5mm, 50mm, 80mm) are used to separate the Bremanger sandstone
into two categories (31.5<P<50mm, 31.5<P<80mm).
Shear box calibration
The friction between the upper box and the lower box was calibrated by running the
testing device several times without any material in the shear box and any load on the
shear box. A friction of 83.8 N was measured and applied to all testing series for
correction.
Shear speed
These tests were conducted at the same speed (10 mm/min). This speed was
determined by running several calibration tests and comparing the results with the
testing speed of the small shear box test.
Shear strain
Following the small shear box test, a 10% shear strain was insufficient; therefore a 20%
shear strain was used for the medium size shear box.
Compacting high density specimen
For “normal density tests”, the box was filled in by pouring buckets of material in the

36
shear box, without physical compaction. For “high density tests”, the material was
divided in four parts. After pouring a part, compaction with a tamping rammer
weighting 90 N took place (Figure 3.7). Each layer was around ten centimeter high
after compaction.
Figure 3.7: Manual compaction in the medium scale shear box
3.4 Overview of experiments
In this research, 48 direct shear tests were performed, in which 36 tests were
performed in the small shear box and 12 tests were performed in the medium size
shear box. The small shear box tests can be subdivided into six different categories
while the medium size shear box test can be classified into three categories (Table
3.2).
The porosity can be calculated by the following equations
where n is the porosity;
e is the pore index;
is the specific weight of the rock mass material;
is the specific weight of the “in situ” rockfill;

37
W is the moisture content of the rockfill.
The specific weight of the Bremanger sandstone is 2.7 Mg/m^3, the specific weight of
the “in situ” rockfill is known. The moisture content of the rockfill is assumed to 0%;
The pore index can be calculated, and then the porosity can be calculated. The
porosity of the Bremanger sandstone is between 36.67-39.63%;
Table 3.2: The category name, category symbol, test detailed information of the small and
medium shear box tests
Category Full Name Category
Symbol Tests
Density
(Mg/m3)
Porosity
(%)
Small
Shear
Box
Normal density
(1.18mm<P<3.35mm) NS
Six tests (5.98 kg, 55.98
kg, 115.98 kg, 280.98 kg,
555.98 kg and 885.98 kg)
1.63 39.63
Normal density
(3.35mm<P<6.30mm) NB Six tests (the same as NS) 1.65 38.89
High density
(1.18mm<P<3.35mm) HS Six tests (the same as NS) 1.71 36.67
High density
(3.35mm<P<6.30mm) HB Six tests (the same as NS) 1.71 36.67
Mixture
(70%small, 30% big) MS Six tests (the same as NS) 1.65 38.89
Mixture
(30%small, 70% big) MB Six tests (the same as NS) 1.65 38.89
Medium
Size
Shear
Box
Normal density
(31.5mm<P<50mm) M1
Three tests (34.12 kg,
495.97 kg, 806.9 kg) 1.40 48.15
High density
(31.5mm<P<50mm) M2
Three tests (34.12 kg,
495.97 kg, 806.9 kg) 1.56 42.22
Normal density
(31.5mm<P<80mm) M3
Six tests (two 34.12 kg,
two 466.27 kg, two 777.2
kg)
1.40 48.15

38
4 Experimental results and discussion
4.1 Small size direct shear box experiment results
4.1.1 General trends
The general shear characteristics of the Bremanger sandstone rockfill from the small
shear box tests are summarized as follows:
The shear stress-strain behavior of the Bremanger sandstone rockfill is nonlinear
and stress dependent.
An increase in normal stress is associated with a decrease of volume expansion
and an increase in shear strength.
Typical mixed behavior is observed in the relation between volume change and
shear-strain. At low normal pressure, this rockfill behaves as dense materials,
while at high normal pressure it behaves as loose materials. (1) Under high
normal stress (544.85 kPa and 868.26 kPa), most specimen stay strain hardening
when horizontal displacement is 10 mm (the shear strain is 10%). Volume
expansion is not very large, starting with a significant compression then followed
by dilation. (2) Under intermediate normal stress (275.36 kPa), slight strain
softening occurs and the volume expansion is more obvious, starting from a slight
initial compression followed by a significant dilation. (3) Under low normal stress,
strain softening or shearing at constant shear stress occurs. A pronounced peak is
not observed in the stress-strain curves. Volume expansion is significant.

39
Figure 4.1: Horizontal displacement vs. corrected shear stress of small shear box test

40
Figure 4.2: Horizontal displacement vs. vertical displacement of small shear box test
4.1.2 Secant friction angle and dilatancy angle
Failure is defined at the maximum stress ratio. The secant friction angle at failure is
the arctangent of the shear stress at failure over the normal stress at failure (
). The secant friction angle at failure is derived for each specimen.
According to Figure 4.3, the secant friction angle at failure decreases with an increase
in normal stress. The relationship between friction angle and normal stress is
non-linear with a quick decrease when normal stress is between 0-100 kPa and
comparatively slower when normal stress is higher than 100 kPa. The friction angle
varies between 65 and 78 degree at the lowest normal stress and between 42 and 50

41
degree when the normal stress is 1 MPa (Figure 4.3).
The same as the friction angle, the dilatancy angle decreases from 30 to 8 degrees as
the normal stress increases from 0 to 1000 kPa, however, the rate of decrease is more
even (Figure 4.4). Category HB and NB have the highest secant friction angle as well
as dilatancy angle while category MS and NS have the lowest friction angle and
dilatancy angle.
Figure 4.3: Correct normal stress vs. the secant friction angle at failure
Figure 4.4: Corrected normal stress vs. dilatancy angle at failure
4.1.3 Strain at failure
The strain at failure varies from 4.0 to 11.8%. The shear strain at failure increases as
the normal stress increases, however there are some points that does not follow the
trend. Higher density categories have a much lower strain at failure value than that of
normal density category.

42
Figure 4.5: Corrected normal stress vs. strain at failure
4.1.4 Factors affecting shear behavior
4.1.4.1 Normal stress
In this section, the internal friction angle is used for discussion. The internal friction
angle is determined from Mohr-Coulomb‟s linear failure envelopes constructed as
best-fit lines. The internal friction angle is derived for each category.
The normal stress is a very important factor on the internal friction angle. According
to Table 4.1, the higher the normal stress the lower the internal friction angle. When
only using three low normal stress data, the average internal friction angle is 57.03
degree. When using all six normal stress data, the average internal friction angle is
45.92 degree, which is around 11 degree lower than that of the low normal stress.
Similar results were found in previous studies (Douglas, 2002; Asadzadeh & Soroush,
2009).

43
Table 4.1: The internal friction angle of six categories when using three low normal stress and all
six normal stress of the small size shear box test.
Normal stress
5.86-868.26 kPa
Normal stress
5.86-113.66 kPa
Category Internal friction angle
(degree)
Internal friction angle
(degree)
Friction angle difference
(degree)
Hypothesis 1 (without cohesion)
NS 44.25 53.51 9.26
NB 49.70 60.93 11.23
HS 46.32 57.83 11.51
HB 50.47 62.54 12.07
MS 44.54 57.51 12.97
MB 47.54 58.36 10.82
Hypothesis 2 (with cohesion)
NS 42.30 51.52 9.22
NB 47.15 57.19 10.04
HS 44.16 56.00 11.84
HB 47.47 59.58 12.11
MS 42.05 55.41 13.36
MB 45.11 53.97 8.86
Average 45.92 57.03 11.11
4.1.4.2 Maximum particle size
Big particle categories have higher shear strength and larger volume expansion than
small particle categories (Figure 4.2). The internal friction angle of big particle
categories is around 4 degree higher than that of small particle categories (Table 4.1).
Big particle categories approach the peak shear stress value later than the small
particle categories. Strain hardening is observed for most big particle categories
experiments while most small particle categories approach the peak shear value while
horizontal displacement is 4-8 cm (Figure 4.1).
4.1.4.3 Density
The shear strength and the volume expansion of the high density categories are
slightly higher than the normal density categories. The internal friction angle of the
high density categories is about 2 degree higher than that of the normal density
categories (Table 4.1).
The stress-strain curves of the high density categories (1.71 Mg/m^3) show a marked
curvature and a distinct drop after failure while that of the normal density categories
(1.63 and 1.65 Mg/m^3) show minimal curvature and less drop in the friction angle.
In other words, a slightly higher strain softening occurs in the high density categories.

44
The same trend was found in previous research (Douglas, 2002; Lee et al., 2009). This
can be explained by the dense material requiring more dilation to fail as particles have
less room to move during shearing which cause a distinct drop in the friction angle
after failure.
The compression stage of the high density categories when under high normal stress is
much shorter than the normal density categories. This is because the pressure on the
high density specimen is lower due to a larger contact area between particles.
4.1.4.4 Uniformity coefficient
The uniformity coefficient can be calculated by the following equation:
Where, d60 is the particle size for which 60% is finer;
d10 is the particle size for which 10% is finer.
Assuming the grade distribution in each particle category (1.18<P<3.35 mm and
3.35<P<6.30 mm) is evenly distributed, the uniformity coefficient calculation results
list as follow:
Table 4.2: The uniformity coefficient of category NB, MS and MB
Category Full Name Category
symbol
Density
(Mg/m3)
d10
(mm)
d60
(mm)
Normal density (3.35mm<P<6.30mm) NB 1.65 3.65 5.12 1.40
Mixture (70%small, 30% big) MS 1.65 1.49 3.04 2.04
Mixture (30%small, 70% big) MB 1.65 1.90 4.61 2.43
Category NB, MS and MB have the same value (6.30 mm) and density, but
different uniformity coefficient. The shear strength, internal friction angle and volume
expansion of these three categories follow the same trend, category NB shows the
highest values, followed by category MB then MS. However, the trend of uniformity
coefficient of these three categories is different, category MB is the least uniform,
followed by category MS than NB. This result shows that uniformity coefficient has a
complicated effect on the shear strength and further research is required. The same
result was found in most of the previous researches.
4.1.4.5 Summary
Table 4.3 sums up the influence of factors affecting shear strength, friction angle and
volume expansion on the small size shear box test:

45
Table 4.3: The influence of particle size, normal stress, density and uniformity coefficient on shear
strength, friction angle and dilatancy of the small shear box test
Effect factors Shear strength Friction angle Dilatancy
Particle size
Normal stress
Density
Uniformity coefficient Unknown Unknown Unknown
4.1.5 Stress-dilatancy
The energy-based theory accounts for the added stress associated with volumetric
dilation as follows (Lee et al., 2009; Wood, 1990; Taylor, 1948):
Where is the normal stress;
the shear stress;
the friction coefficient of the particles sliding against each other;
the horizontal displacement;
the vertical displacement;
the secant friction angle and
the dilatancy angle;
The stress ratio-dilatancy figure can combine the strain-stress-volume information
into a single graphical representation. As a result, the shearing process (compression,
expansion, failure and softening/hardening) can be easily explained (Lee et al., 2009):
For most experiments (except for those under low normal pressure), the stress
ratio increases up to the peak stress ratio while the dilatancy changes from
compression to expansion in the experiment.
For categories NS, NB, HS, HB, the dilatancy-stress ratio relationship of all
specimens for the intermediate normal stresses is nearly delineated as a unique
straight relation until the stress reaches its peak value. Therefore, it can be
concluded that the dilatancy-stress ratio relationship of crushed rock is only
slightly influenced by the level of normal stress up to the peak behavior in that

46
intermediate normal stress range.
The dilatancy-stress ratio relationship of category MS and MB is not as
delineated as a unique straight relation as category NS, NB, HS, HB. It might be
caused by a lower uniformity in these categories.
Both the stress ratio at failure and dilatancy at failure follow a similar trend. They
both decrease with increasing normal stress. This can be explained by the fact that
shearing under low normal load is resisted by interlocking of particles rather than
crushing of particles and causes dilatancy. This leads to an increase in the friction
angle.
By comparing the six categories‟ dilatancy-stress relationship, big particle
categories have higher peak stress ratio and corresponding peak dilatancy than
small particle categories. The post peak behavior of big particle categories has
more strain hardening behavior than small particle categories.
High density categories have higher magnitude of stress ratio and dilatancy than
corresponding normal density categories (NS and NB).
Maximum dilatancy does not always correspond to maximum stress ratio. This
result was not observed by (Lee et al., 2009)
The post peak behavior is different at different normal stress level. When the
normal stress is low (5.86 kPa, 54.86 kPa, 113.66 kPa) strain softening took place
while at high normal stress (275.36 kPa, 544.86 kPa and 868.26 kPa) strain
hardening occurred for most specimens.
Most curves (except those recorded under high normal stress) show a reversal
trend around the peak area. After the turning point, as dilatancy decreases, the
stress ratio decreases faster than it has increased with increasing dilatancy before
the turning point. As a result, extrapolating the curves for the Bremanger
sandstone to zero dilatancy would lead to a negative stress ratio at critical state. .
This trend was not observed by Lee and his co-workers. The observation made on
the Bremanger sandstone might be due to the fact that strain localization occurred
in a dilatant shear band that did not affect the whole sample thickness. A dilatancy
averaged over material within and outside the shear was measured. If the shear
band did affect the whole sample thickness, it is possible that the smooth interface
between the gravels and the top and bottom shear box surfaces affected the
measured vertical displacement.

47
Figure 4.6: Dilatancy vs. stress ratio of the small shear box test
4.1.6 Particle breakage
The particle breakage is measured by sieving the specimen after the direct shear box
test and weighing the particles under 3.35 mm. However, the splitting of particles that
led to changes in grain size between 3.35 mm and 6.30 mm was not captured in this
analysis of particle breakage. Only category NB and HB specimens are employed to
test the particle breakage. The test result shows that the particle breakage increases
rapidly with the normal stress for both categories HB and NB (Figure 4.7). The
particle breakage of category HB is slightly higher than category NB. It can be
concluded that the normal stress has a significant effect on the particle breakage,
while the density has a limited effect on it.

48
Figure 4.7: Particle breakage at different normal stress
4.1.7 Repeatability
Test april 28-1, test april 28-2 and test april 10-1 specimens were under the same
testing conditions (normal stress: 275.36 kPa; density: 1.71 Mg/m^3; particle size:
3.35<P<6.30 mm). The general trend of the three tests are similar, however small
variation occurred in both stress-strain and dilatancy figures. It is advisable to conduct
at least two parallel tests in the future tests.
Figure 4.8: The stress-strain and dilatancy figure of three specimens under the same test
condition.

49
4.2 Medium size direct shear box experiment results
4.2.1 General trends
The general shear characteristics of the Bremanger sandstone rockfill from the
medium size shear box tests are summarized as follows:
The stress-strain behavior of the Bremanger sandstone rockfill is nonlinear, stress
dependent.
The behavior of shear strength is similar for all specimens. An increase in normal
stress is associated with an increase in shear strength.
Since all specimens are under very low normal stress (1.34 kPa-31.63 kPa), the
change in vertical displacement is significant.
For a given test category, dilatancy increases after the peak stress linearly as
function of the horizontal displacement. Whatever the normal stress is, the
dilatancy is the same.
The observations mentioned above can be derived from the stress ratio- dilatancy
graphs instead of considering in parallel the stress-strain curves and the vertical
displacement- horizontal curves.
4.2.2 Secant friction angle and dilatancy angle
For all three categories, the secant friction angle decreases with an increase in normal
stress. The secant friction angle of the medium size shear box test varies from 70 to 87
degree (Figure 4.10), which is around 25 degree higher that of small shear box test.
The dilatancy angle of the medium size shear box test varies from 17 to 30 degree,
which is comparable to that of small shear box test.
Category M2 (medium size particles, high density) has the highest friction angle as
well as dilatancy angle. Category M1 (medium size particles, low density) has the
lowest friction angle and category M3 (bigger particles) has the lowest dilatancy angle.
This last result is surprising. Test duplication shows that a high spreading of dilatancy
results.

50
Figure 4.9: The stress-strain, vertical - horizontal displacement, dilatancy-stress ratio figures for
the medium size shear box test

51
Figure 4.10: Corrected normal stress vs. the secant friction angle at failure of the medium size
shear box test.
Figure 4.11: Corrected normal stress vs. dilatancy angle at failure of the medium size shear box
test
4.2.3 Strain at failure
The strain at failure varies from 6.0 to 18%. Most of the points have a higher strain at
failure than that of small shear box. The strain at failure does not increase with the
normal stress, which might be due to the low normal stress as well as the short normal
stress range.
Higher density specimens (Category M2) has a much lower strain at failure value than
that of normal density specimens (Category M1), the same trend was observed in the
small shear box test.

52
Figure 4.12: Corrected normal stress vs. strain at failure
4.2.4 Factors affecting shear behavior
4.2.4.1 Maximum particle size
The big particle category (category M3) has higher shear resistance than the small
particle category (category M1), the same trend was observed in the small shear box
test results. The internal friction angle of category M3 is around 4 degrees higher than
category M1. The dilatancy angle is similar for both categories (Figure 4.11,Table
4.4).
Table 4.4: The internal friction angle of the medium size shear box test
Category Full Name Category
Symbol
Hypothesis 1
(without cohesion)
Hypothesis 2
(with cohesion)
Cohesion
(kPa)
Internal
Friction
Angle
(deg.)
Cohesion
(kPa)
Internal
Friction
Angle
(deg.)
Normal density
(31.5mm<P<50mm) M1 0 74.02 0.658 26.27 69.06 0.792
High density
(31.5mm<P<50mm) M2 0 79.10 0.766 36.46 75.63 0.917
Normal density
(31.5mm<P<80mm) M3 0 78.19 0.891 20.28 76.22 0.933

53
4.2.4.2 Density
High density category (Category M2) has a larger shear strength and larger volume
expansion than normal density category (Category M1). Category M2 has a friction
angle 5 degree higher than that of category M1. In addition, category M2 approaches
the peak shear stress value earlier, showing a much more marked curvature and a
distinct drop after failure. The same trend is found in the small shear box test.
4.2.4.3 Summary
The following table sums up the influence of effect factors on the medium size shear
box test:
Table 4.5: The influence of particle size and density on shear strength, internal friction angle and
volume expansion of the medium size shear box test
Effect factors Shear strength Friction angle Dilatancy
Particle size similar
Density
4.2.5 Particle breakage
Generally, particle breakage should not occur at such low normal stress. However,
particle breakage of category M3 occurred because some big rocks were caught
between the top and the lower shear box (the yellow point) and caused a big variation
in the stress-strain data. According to this, it can be concluded that a maximum
particle size of 80 mm is too big for the medium size shear box. A maximum particle
size 50 mm should be employed for future tests.
Figure 4.13: Particle breakage of the medium size shear box (left: the position where the rock was
caught; right: the broken rock)

54
4.2.6 Repeatability
The repeatability can be easily observed from the experiment data of category M3.
The variation between two specimens under the same experimental conditions is
bigger than that of the small shear box test. It is advisable to conduct a few tests under
the same experimental conditions and use the average value for further analysis in
future studies.
4.3 Comparison and discussion
4.3.1 The general trend
The stress-strain behavior of the 48 direct shear box tests is similar, which is nonlinear,
inelastic and stress dependent. The stress-strain curves of the small shear box tests
contain less variation.
4.3.2 Secant friction angle and dilatancy angle at failure
The secant friction angle (
) of the medium size shear box test is around
10 degree higher than that of the small size shear box test. The dilatancy angle at
failure for the medium size shear box test is similar with that of the small size shear
box test. Contrary to the small shear box tests, no reduction of dilatancy is observed in
the medium scale shear box tests. This might be due to a limitation of the medium
scale set-up.
Figure 4.14: Corrected normal stress vs. the secant friction angle at failure

55
Figure 4.15: Corrected normal stress vs. the dilatancy angle at failure
4.3.3 Factors affecting shear behavior
4.3.3.1 Maximum particle size
The internal friction angles of category NS, NB and M2 were compared because they
have similar density (NS:1.63 Mg/m^3; NB: 1.65 Mg/m^3; M2: 1.56 Mg/m^3).
Figure 4.16 shows that the internal friction angle increases with the maximum particle
size. The result is in contrast with some previous researches. Further research is
recommended to find out whether this is due to material property or the difference in
the two equipment properties.
Figure 4.16: The internal friction angle of category NS, NB and M2
4.3.3.2 Density
The same trend was found in both the small shear box test and the medium size shear
box test, the higher density, the higher shear strength and dilatancy are. The
stress-strain curves of the high density categories show a much more marked

56
curvature and a distinct drop after failure than the normal density category.
4.3.3.3 Summary
To sum up, the influence of particle size, density and normal stress on the shear
strength, friction angle and dilatancy is concluded in Table 4.6. Further study is
suggested to conduct for verifying this conclusion.
Table 4.6: The influence of particle size, density and normal stress on shear strength, internal
friction angle and volume expansion of both the small and medium size shear box test
Effect factors Shear strength Friction angle Dilatancy
Particle size unknown
Density
Normal stress

57
5 Rockfill shear strength model
5.1 Introduction
There are a number of rockfill shear strength model from literature. In this chapter,
four different empirical models (Mohr-Coulomb Model, Power Curve Strength Model,
Barton Model and Hoek-Brown Model) will be compared to find the most appropriate
model for the Bremanger sandstone rockfill.
Table 5.1: The overview of four model application condition
Model Name Small shear box test Medium size shear box test
Mohr-Coulomb Model
Power Curve Strength Model
Hoek -Brown Model
Barton Model
5.2 Mohr-Coulomb Model
5.2.1 Introduction
The first way to interpret the experimental results is by using the Mohr-Coulomb
model, which is the most widely used model in geotechnical engineering. The
Mohr-Coulomb model criterion describes a linear relationship between normal stress
and shear stress at failure. However, this model is not accurate for this study since the
non-linear relationship between the shear stress and normal stress at failure can be
easily observed from the two shear box test data.
The model will be analyzed under two hypotheses. One is assuming no cohesion
(hypothesis 1) and the other is assuming an apparent cohesion (hypothesis 2):
Where τ is the peak shear stress;
is the peak normal stress;
is the angle of friction;

58
c is the cohesive strength;
5.2.2 Data Process Method
Step 1: Plot the shear stress and corresponding normal stress at failure for each
experimental category, the shear stress is plotted on the y axis while the normal stress
is plotted on the x axis;
Step 2: For hypothesis 1, add a linear trend (intercept =0) for points of each category
and get an equation of the linear trend (y=Ax), so A is equal to .
Step 3: For hypothesis 2, Add a linear trend (intercept ≠0) for points of each
category and get an equation of this linear trend (y=Ax+B), so A is equal to , B
is equal to the cohesive strength.
5.2.3 Result
5.2.3.1 Small shear box test
The general trend for both hypothesis 1 and 2 is similar, the model underestimated the
shear strength value when the normal stress is lower than 600 kPa and overestimated
the shear strength value when the normal stress is higher than 600 kPa.
The regression coefficient of hypothesis 2 is higher than that of hypothesis 1.
However, since apparent cohesion in rockfill is normally less of a concern; as
hypothesis 1 is more widely used in practice. The following discussion will be based
on modeling results of hypothesis 1.
In hypothesis 1, friction angles range from 44.3 degree to 50.5 degree. Big particle
categories (Category NB, HB and MB) have higher friction angle than small particle
categories (Category NS, HS and MS). High density categories (HS and HB) are
around 2°higher than corresponding normal density categories (NS and NB). The
friction angles of categories MS and MB are higher than category NS and lower than
category NB. Category MS is much closer to category NS (only 0.3°difference)
while category MB is much closer to category NB (2.16°difference). The largest
friction angles are obtained with high density and big particle size.
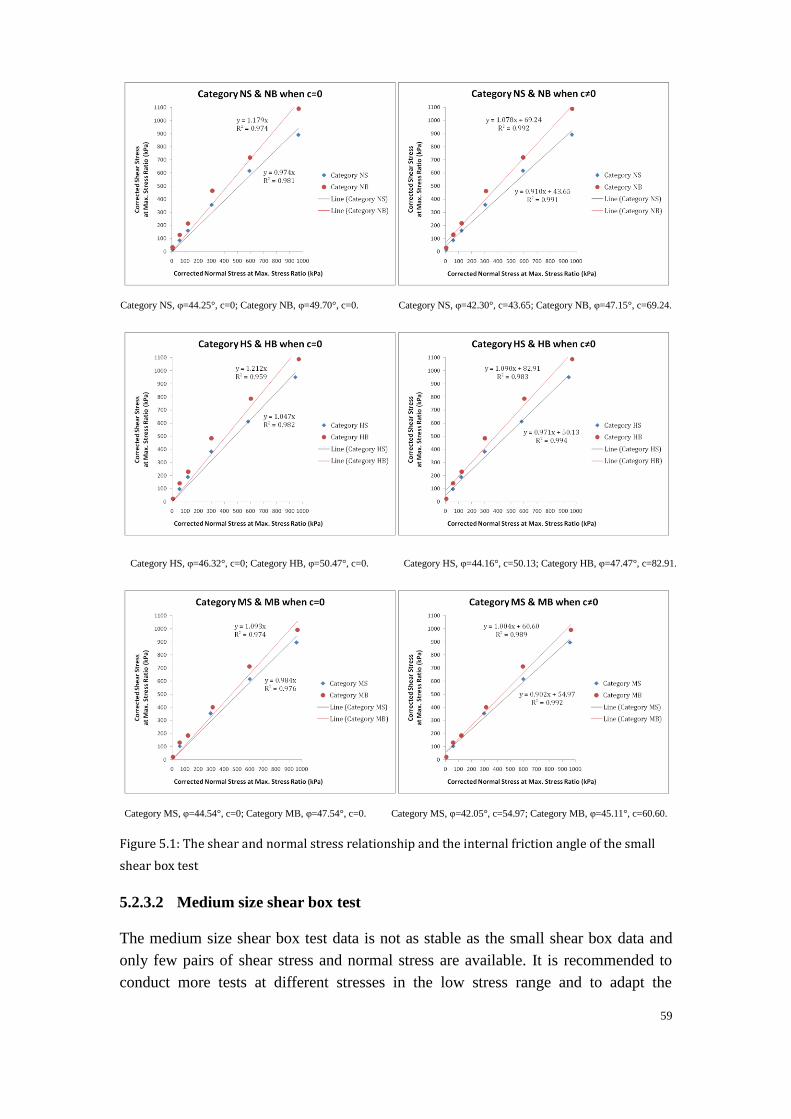
59
Category NS, φ=44.25°, c=0; Category NB, φ=49.70°, c=0. Category NS, φ=42.30°, c=43.65; Category NB, φ=47.15°, c=69.24.
Category HS, φ=46.32°, c=0; Category HB, φ=50.47°, c=0. Category HS, φ=44.16°, c=50.13; Category HB, φ=47.47°, c=82.91.
Category MS, φ=44.54°, c=0; Category MB, φ=47.54°, c=0. Category MS, φ=42.05°, c=54.97; Category MB, φ=45.11°, c=60.60.
Figure 5.1: The shear and normal stress relationship and the internal friction angle of the small
shear box test
5.2.3.2 Medium size shear box test
The medium size shear box test data is not as stable as the small shear box data and
only few pairs of shear stress and normal stress are available. It is recommended to
conduct more tests at different stresses in the low stress range and to adapt the
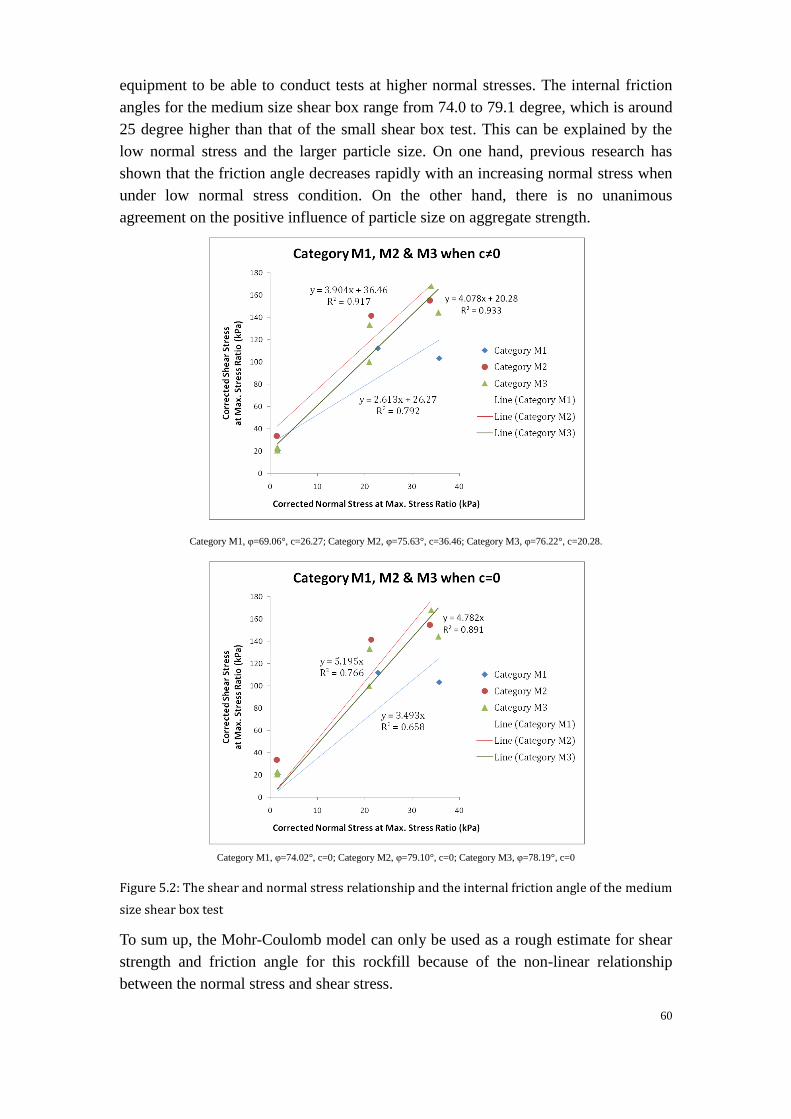
60
equipment to be able to conduct tests at higher normal stresses. The internal friction
angles for the medium size shear box range from 74.0 to 79.1 degree, which is around
25 degree higher than that of the small shear box test. This can be explained by the
low normal stress and the larger particle size. On one hand, previous research has
shown that the friction angle decreases rapidly with an increasing normal stress when
under low normal stress condition. On the other hand, there is no unanimous
agreement on the positive influence of particle size on aggregate strength.
Category M1, φ=69.06°, c=26.27; Category M2, φ=75.63°, c=36.46; Category M3, φ=76.22°, c=20.28.
Category M1, φ=74.02°, c=0; Category M2, φ=79.10°, c=0; Category M3, φ=78.19°, c=0
Figure 5.2: The shear and normal stress relationship and the internal friction angle of the medium
size shear box test
To sum up, the Mohr-Coulomb model can only be used as a rough estimate for shear
strength and friction angle for this rockfill because of the non-linear relationship
between the normal stress and shear stress.

61
5.3 Power Curve Strength Model
5.3.1 Introduction
A number of previous studies suggest that a parabolic expression can be used to
analyze the shear strength of rockfill (Charles & Watts, 1980; Charles, 1991; De
Mello, 1977; Matsumoto & Wanatabe, 1987). De Mello (1977) indicated that the
following equation is suitable for representing the curved strength of rockfill.
Where A and B are empirical values, dependant on the type of material.
5.3.2 Data process method
Step 1: Plot the shear stress and corresponding normal stress for different normal
stresses of each experimental category, the shear stress is plotted on the y axis while
the normal stress is plotted on the x axis;
Step 2: Add a power trend to each category and get an equation of this power trend
( ), so A, B and values for each category can be read directly from the
equation.
5.3.3 Result
The regression coefficients of these parabolic curves are higher than the ones
corresponding to the linear curves, which indicate a non-linear shear stress behavior at
failure of the Bremanger sandstone rockfill. The fitting result is listed in Table 5.2.
The modeling result of the medium size shear test will not be discussed due to the fact
that the very low normal stress and big variation in the test results. For the small shear
box test, value B is stable and ranges from 0.71 to 0.81 while value A varies from
3.317 to 7.634. This result is comparable with Charles‟ result (1991), where sandy
gravel has value of A equal to 4.4 and value B equal to 0.81. However, Charles‟
research was based on the large scale triaxial test, the difference caused by the
difference of triaxial test and direct shear box test on A and B value is unknown. By
comparing the results of previous research, high regression coefficients (bigger than
0.9) and similar values of B (around 0.8) were found for sandstone rockfill.
Value B determines the basic shape of curve. From all the rockfill research data, value
B is comparatively stable around 0.8, which indicates the fact that the shear strength
of rockfill increases rapidly under low normal stress and slowly under high normal
stress. By comparing the modeling results and the previous research results, a value of
B ranged from 0.77-0.81 is recommended for the Bremanger sandstone rockfill in
future applications. This value should be verified by high normal stress medium scale
tests in the future.

62
Table 5.2: The value A, B and R^2 when using the parabolic expression modeling
Category Full Name Category
Symbol
A B
Normal density (1.18mm<P<3.35mm) NS 3.317 0.814 0.999
Normal density (3.35mm<P<6.30mm) NB 7.634 0.710 0.996
High density (1.18mm<P<3.35mm) HS 4.456 0.777 0.999
High density (3.35mm<P<6.30mm) HB 5.96 0.762 0.999
Mixture (70%small, 30% big) MS 4.284 0.778 0.999
Mixture (30%small, 70% big) MB 4.953 0.771 0.997
Normal density (31.5mm<P<50mm) M1 15.97 0.565 0.968
High density (31.5mm<P<50mm) M2 28.24 0.501 0.993
Normal density (31.5mm<P<80mm) M3 16.46 0.622 0.992
Since value B is determined, value A is the only parameter left to be determined when
using the parabolic expression model. However, it is difficult to quantitatively
estimate value A. The influence of different factors on the value A will be discussed.
From the modeling results, the big particle categories have higher value A than that of
the small particle categories. By summing up previous research result (Charles, 1991;
Charles & Watts, 1980; De Mello, 1977; Asadzadeh & Soroush, 2009; Estaire &
Olalla, 2005), the influence of the effective factors (the UCS, density, particle size) on
the value A are listed in Table 5.3. Value A around 4.4 is suggested for further
application of the Bremanger sandstone rockfill.
Table 5.3: The influence of UCS, density and maximum particle size on value A
Effective Factor Value A
UCS
Desity
Maximum particle size
To sum up, regression coefficient of this parabolic curve model is high, however the
variation of value B is uncertain and it is hard to quantitatively analyze value A.
Further research is required for this model fitting.

63
5.4 Hoek -Brown Model
5.4.1 Introduction
The main principle of this method is to find the best-fit normal - shear stress curve,
which is made by using the RocData software (Rocscience Inc., 2004), with the
parabolic curve from the lab data.
RocData is a software for determining soil and rock mass strength parameters through
analysis of laboratory or field triaxial or direct shear data. The program can fit the
linear Mohr-Coulomb strength criterion and three other non-linear failure criteria, the
generalized Hoek-Brown, Barton-Bandies and Power Curve strength models
(Rocscience Inc., 2004).
5.4.2 Data process method
5.4.2.1 Input data of RocData
The four input parameters for RocData of the Generalized Hoek-Brown model is the
intact uniaxial compressive strength, GSI, material constant and disturbance
factor D. Three of the four parameters are fixed for the Bremanger sandstone rockfill,
only the GSI can be varied.
Table 5.4: The UCS, mi and D for the Bremanger sandstone rockfill.
Parameter name Parameter
symbol
Value Remark
Intact uniaxial compressive strength σci 188 MPa
Material constant index 19 Metasandstone
Disturbance factor D 1 Blasting rockfill
When these four parameters are entered, the , which is derived from the
principal stresses based on the geometric calculation from shear stress and normal
stress, is chosen. After this, RocData will automatically give the result of the
Hoek-Brown criterion, Mohr-Coulomb fit, rock mass parameters, major stress-minor
stress curve and normal stress-shear stress curve. In this study, the normal stress-shear
stress curve and Mohr-Coulomb fit data will be used for further comparison. The
basic mathematical equations for these two calculations are listed as follows. The
equations can easily be inserted in an excel sheet.
Normal stress-shear stress curve
In RocData, the following equation were used to calculate normal and shear stress

64
from the Hoek-Brown parameters (Hoek et al., 2002)(Balme,1952).
where
RocData will give a normal stress-shear stress curve when all the Hoek-Brown
parameters were entered.
Mohr-Coulomb criterion
The Mohr-Coulomb criterion fits an average linear relationship to the curve generated
by solving the generalized Hoek-Brown equation for a range of minor principal stress
values defined by . The fitting process involves balancing the areas
above and below the Mohr-Coulomb plot. The following equations are used in
calculating the friction angle and cohesive strength (Hoek et al., 2002):
where
Note that the value of , the upper limit of confining stress over which the
relationship between the Hoek-Brown and the Mohr-Coulomb criteria is considered,
has to be determined for each individual case.
5.4.2.2 Curve fit
The curve provided by RocData for each category was manually compared with the
65
parabolic curve by varying the GSI value. When the best fit GSI was found,
corresponding Mohr-Coulomb fit cohesion and friction were automatically calculated
by RocData.
For the small shear box test, the parabolic curve can fit very well with the normal
stress-shear stress curve estimated by RocData while the fit of the medium size shear
box test are not that accurate because of short normal stress range and unstable data.
The detailed curve fitting information can be found in appendix 9.1.
5.4.2.3 GSI determining factors
In the RocData, the GSI is related to the structure and surface condition. In this study,
the disintegrated condition is chosen for the rockfill structure. The variation of GSI
can be explained as the surface condition change due to the particle size and density
variation (Figure 2.3).
5.4.3 Result
The similarity between the two curves (parabolic curve based on the shear test data
and the Hoek-Brown curve from RocData, see Appendix 9.1) shows that it is possible
to apply Hoek-Brown criterion by using the direct shear test data to estimate the shear
strength of the Bremanger sandstone rockfill (Table 5.5). The advantage of this
method is that GSI is the only parameter that needs to be determined.
The friction angle estimated by RocData is 5-10 degree lower than the value
calculated by the Mohr-Coulomb model result. The cohesion estimated by RocData is
around twice the Mohr-Coulomb model result.
By comparing the GSI values of the nine different categories, the influence of density
and particle size can be compared. Category NB, NB and M2 have similar density
(1.63, 1.65 and 1.56 Mg/m^3) but different maximum particle size, the GSI variation
indicated that the higher the particle size the higher the GSI value. Figure 5.3 shows
the power trend line plotted for these categories, where GSI increase rapidly when
dmax ranges from 0 to 20 mm and increase slowly when dmax is bigger than 20 mm.
The accuracy of this curve needs to be verified by further study because the density
and normal stress of these three categories is not exactly the same and the error caused
by two equipments is unknown.

66
Table 5.5: The best fit GSI and corresponding friction angle and cohesion calculated by RocData
Category Full Name Category
Symbol
Density
(Mg/m3)
Best
Fit
GSI
(MPa)
Mohr-Coulomb Fit
Cohesion
(MPa)
Friction
angel
(Degree)
Small
Shear
Box
Normal density
(1.18mm<P<3.35mm) NS 1.63 23.5 0.6 0.140 37.41
Normal density
(3.35mm<P<6.30mm) NB 1.65 27.5 0.6 0.168 40.99
High density
(1.18mm<P<3.35mm) HS 1.71 24.5 0.6 0.147 38.34
High density
(3.35mm<P<6.30mm) HB 1.71 29.5 0.6 0.182 42.64
Mixture (70%small, 30% big) MS 1.65 24.5 0.6 0.147 38.34
Mixture (30%small, 70% big) MB 1.65 27 0.6 0.164 40.56
Medium
Shear
BOX
Normal density
(31.5mm<P<50mm) M1 1.40 30 0.02 0.046 63.79
High density
(31.5mm<P<50mm) M2 1.56 36 0.02 0.079 65.74
Normal density
(31.5mm<P<80mm) M3 1.40 35 0.02 0.072 65.48
Figure 5.3: The relationship between the GSI value and maximum particle size (category NS, NB
and M2)

67
The influence of the density can be compared by three pairs (Category NS&HS, NB&
HB, M1&M2). The higher density categories have 5-10% higher GSI values. To sum
up, the influence of the effective factors on the GSI value are as follows:
Table 5.6: The influence of maximum particle size and density on GSI value
Effective Factor GSI Value
Maximum particle size
Density
In conclusion, this method is comparably more applicable for estimating shear
strength of the Bremanger sandstone rockfill because there is only one parameter that
needs to be determined. It is also possible to quantify the factors affecting the GSI
value. Further research is recommended to verify the applicability of this method and
find the influence of other factors on the GSI value (such as normal stress, the grade
distribution, the uniformity coefficient etc.) to better estimate it.
With GSI values between 20 to 40 and damage factor of 1, the Hoek-Brown criterion
of failure predicts a uniaxial strength of the rockfill of zero in comparison the UCS of
intact rock (the s is very small). Note that the dilatancy measured during testing is not
used when determining the parameters of generalized Hoek-Brown criterion of
failure.
5.5 Barton Model
5.5.1 Introduction
Barton (1981) compared the shear strength of rockfill with rock joints and suggested
that the friction angle of rockfill can be estimated from knowing the following
parameters: (1) the uniaxial compressive strength; (2) the d50 particle size; (3) the
degree of particle roundedness; and (4) the porosity following compaction. The
general equation is as follows:
where is the peak shear stress;
is the peak normal stress;
is the basic friction angle;
R is the equivalent roughness of rockfill;
S is the equivalent strength of rockfill particles;

68
i is the structural component of strength;
5.5.2 Data process method
Step 1: Equation rewriting
Rewrite the basic equation as follows:
Calculate value and value for each specimen and plot
value and value for each experimental category on the y and x
axis respectively;
Step 2: Calculate R value
Add a linear trend (intercept ≠0) to the points of each category and get the equation
of this linear trend line (y=-Ax+B). A is equal to R, so the R value can be determined
directly. S value can be calculated by the following equation.
S value can calculated from the expression of the intercept B:
as follows:
Step 3: Estimate basic friction angle
The basic friction angle is a fundamental parameter of intact rock, and seems to be a
key parameter in describing the shear strength of rockfill. It usually ranges from about
25 degree to 38 degree (Barton & Kjaernsli, 1981).
Douglas (2002) summarized the shear strength of rockfill and indicated that “the shear
strength of rockfill at a particular confining stress may be seen as the combination of a
basic friction angle , plus a dilation angle caused by asperity or particle crushing
and reorientation of particles”.
where is the friction angle;
is the basic friction angle;
i is the dilation angle;
is the particle crushing and reorientation angle;
In this study, the basic friction angle is calculated by subtracting the secant friction
angle at failure by the dilatancy angle at failure for each specimen, assuming no

69
crushing.
The dilatancy angle at failure can be calculated by the arctangent of the slope of the
horizontal displacement-vertical displacement curve at failure (max. stress ratio). The
secant friction angle at failure can be calculated by the arctangent of the slope of the
shear stress-normal stress at failure.
Figure 5.4: Corrected normal stress vs. basic friction angle at failure
Figure 5.4 shows the calculation result of the basic friction angle. is relatively
constant under the same normal stress. When the normal stress is very low (5.86 kPa),
is around 45 degree. decrease rapidly when the normal stress changes from
5.86 kPa to 113.66 kPa and is constant when the normal stress change from 113.66
kPa to around 1 MPa. This can be explained by the crushing of particles. When the
normal stress is low, there is no crushing effect; the crushing effect increase a lot
when the normal stress increase from 5.86 kPa to 113.66 kPa, then keep in the same
level when the normal stress increase from 113.66 kPa to around 1 MPa.
For further calculation, the basic friction angle is assumed to be 35 degree for this
rockfill. Previous research at TU Delft shows that the basic friction of the Bremanger
sandstone cannot be measured easily. Diamond saw cutting produces polished
surfaces on which the quality of the polishing rather than the basic friction angle is
measured during direct box shearing (Ngan-Tillard & Mulder, 2010). Sandblasted has
been used to produce smooth surfaces whose texture reflects that of the natural rock.
Sandblasting causes micro-cracks that extend up to 0.1 mm below the blasted surface
(Verhoef, 2010). As a result, it leads to a low estimation of the basic friction angle. In
addition, deciding whether or not sandblasting simulates well the natural texture of the
rock is subjective.

70
Step 4: Calculate the S value
S value can be calculated by
.
Step 4: Compare the calculation results obtained from the shear box tests with those
derived from Barton‟s R and S (Figure 2.5 and Figure 2.6).
Four parameters (the uniaxial compressive strength, the d50 particle size, the degree of
particle roundedness, the porosity following compaction) need to be provided.
The uniaxial compressive strength is 188 MPa;
The d50 can be calculated by assuming the particle size is distribute evenly in each
category;
Talus rock is chosen for the degree of particle roundedness(Figure 5.5,Figure 5.6);
The porosity has been calculated in chapter 3.4 (Table 3.2)
Figure 5.5: Pictures of the small shear box (left: 3.35<P<6.30 mm; right: 3.35<P<6.30mm)
Figure 5.6: Pictures of the medium shear box (left: 31.5<P<50 mm; right: 31.5<P<80 mm)

71
5.5.3 Result
5.5.3.1 Experimental result
Table 5.7: The calculated R, B and R2 value from the experimental result
Category Full Name Category
Symbol
R B S(MPa)
Normal density
(1.18mm<P<3.35mm)
NS 11 76.13 0.994 35 5.48
Normal density
(3.35mm<P<6.30mm)
NB 13.77 89.28 0.995 35 8.75
High density
(1.18mm<P<3.35mm)
HS 12.34 81.82 0.991 35 6.23
High density
(3.35mm<P<6.30mm)
HB 12.07 86.35 0.972 35 17.96
Mixture (70%small, 30% big) MS 12.72 81.71 0.987 35 8.30
Mixture (30%small, 70% big) MB 12.46 83.83 0.957 35 4.70
Normal density
(31.5mm<P<50mm)
M1 9.19 87.86 0.838 35 563.81
High density
(31.5mm<P<50mm)
M2 6.52 88.78 0.938 35 Very large
Normal density
(31.5mm<P<80mm)
M3 6.10 87.17 0.911 35 Very large
5.5.3.2 The modeling result by Barton’s estimation figures
From Barton‟s R and S value estimating figures (Figure 2.5 and Figure 2.6), the R
value is 4.5 for small shear box and for medium size shear box is 4.2 (Figure 5.7). The
S value can be estimated from Figure 2.6 when assuming the grade is evenly
distributed (Figure 5.8,Table 5.8).

72
Figure 5.7:Estimating the equivalent roughness R (blue line for small shear box; red line for
medium size shear box) (Barton & Kjaernsli, 1981)
Figure 5.8: Estimating S/UCS reduction factors for estimating S (Barton & Kjaernsli, 1981)
73
Table 5.8: The d50 and estimated S value from Barton's figure
Category Symbol (mm) S (triaxial test)
(MPa)
S (plane test)
(MPa)
NS, HS 2.165 132 188
NB,HB 4.825 103 182
MS 2.730 128 188
MB 4.193 109 188
M1,M2 40.750 53 137
M3 55.75 51 133
5.5.3.3 Comparison between two results
When comparing the calculation result with the modeling result, the difference is very
obvious. The estimated R value is lower than the calculated S value while the
calculated S value is unstable. Barton (1973) indicated that at low values of normal
stress (
), the friction angle becomes very high. The small shear box has a
of 188 while the medium size shear box has a
of 5370. The very high
value
causes the instability of the calculated result.
To sum up, the application of Barton‟s model on this study is not good.
74
5.6 Comparison and conclusion of modeling results
The comparison of these four different models is listed as follows:
Table 5.9: The general comment on the models
Model Name General Comment
Mohr-Coulomb Model The estimation is simple, but not accurate
Power Curve Strength Model
The regression coefficients of these parabolic curves are
high, However there are two parameters that needs to be
determined, the influence of effective factors on these two
parameters is not clear.
Hoek -Brown Model Only one parameter needs to be determined; further study is
recommended.
Barton Model The fitting result is not good
It can be concluded that the Mohr-Coulomb model can be used for rough estimation
and Hoek-Brown Model can be used for more detailed estimation for the Bremanger
sandstone rockfill.

75
6 Plaxis modeling of the crane walk-way
6.1 Introduction
The Plaxis 2D program is a special purpose two-dimensional finite element program
used to perform deformation and stability simulations for various types of
geotechnical applications.
The detailed design of the crane walk-way of the MV2 project is not known to us. A
model was assumed for this study. The Bremanger sandstone rockfill layer is assumed
to be 2 meters high and 30 meters wide (Figure 6.1). A plane strain model was used
for this project. The Plaxis model is shown in Figure 6.2.
Figure 6.1: The layout of the crane walk-way design
Figure 6.2: The dimension and detailed information of the design

76
6.2 Method
The Plaxis 2D 10 Beta version, provided by Plaxis bv, is employed for this project. In
this beta version, the Hoek-Brown model has been added for modeling the behavior of
the rock mass and, here, rockfill. The software is used as follows:
Step 1: Creating the input
The basic parameters of the finite element model are entered in the software.
A geometric contour of the design is drawn (Figure 6.2) and the boundary
condition is defined.
The property of dense sand and the Bremanger sandstone rockfill material are
entered. „HS‟ small model is chosen for the dense sand material while
Hoek-Brown model is chosen for the rockfill. The detailed input data can be seen
in Table 6.1.
A mesh is automatically generated by the software. The rockfill layer area is
chosen to create a finer mesh for more accurate modeling.
Step 2: Performing calculations
Three construction stages are defined (the first one is constructing the dense sand
layer, the second one is constructing the rockfill layer, the third one is adding the
normal load). In each stage, the water level is defined (Figure 6.2).
A surcharge of 300 kPa is applied, either, at the middle of the fill or at the outer
edge.
One point is selected at the top right corner of the rockfill layer and two points
right under the normal load to generate the load-displacement curves.
An additional stage for the Mohr-Coulomb safety factor calculation is added. The
calculation is not straightforward, for additional information, refer to “Draft
presentation of the Hoek and Brown criterion of failure in PLAXIS” by
Brinkgreve (2010).
Step 3: Viewing output result
Safety factor can be read directly from the calculation procedure. The
deformation and stress distribution information can be extracted from the 2D
pictures.
Step 4: Varying the model for comparing the influence of the effective factors
The GSI value and the corresponding Young‟s modulus are varied based on the
generalized Hoek-Brown strength criterion from RocData.
Table 6.1: Detailed input data for the dense sand and the Bremanger sandstone rockfill material
property

77
Dense sand
Model HS small model Density 90%
1. General properties
Saturated weight sat 18.60 KN/m^3
Unsaturated weight unsat 20.44 KN/m^3
2. Parameters for stiffness
Secant stiffness in standard drained triaxial test E-50 ref 5.40E+04 KN/m^2
Tangent stiffness for primary oedometer loading E-oed ref 5.40E+04 KN/m^2
unloading/reload stiffness at engineering strains E-ur ref 1.62E+05 KN/m^2
Power for stress-level dependency of stiffness power(m)
3. Advanced parameters for stiffness
Poisson's ratio for unloading-reloading 0.20
Reference stress for stiffness p-ref 100.00 KN/m^2
Ko-value for normal consolidation 0.3673
4. Parameters for strength
Effective cohesion c'ref 0.00 KN/m^2
Effective angle of internal friction 39.25 degree
Angle of dilatancy 9.25 degree
5. Advanced parameters for strength
Failure ratio qf/qa Rf 0.8875
6. Parameters for small strain stiffness
Reference shear modulus at very small strains G-0 ref 1.21E+05 KN/m^2
Shear strain at which Gs=0.722Go Gamma0.7 1.10E-04
Bremanger sandstone rockfill
Model Hoek-Brown
model
1. General properties
Saturated weight sat 16.50 KN/m^3
Unsaturated weight unsat 16.50 KN/m^3
2. Parameters for stiffness
Young's modulus of rock mass E' 2.50E+06 KN/m^2
Poisson's ratio v' 0.30
3. Hoek-Brown parameters
Uniaxial compressive strength of rock material σci 1.88E+05 KN/m^2
Material constant for the intact rock mi 19.00
Geological Strength Index GSI 38.00
Disturbance factor D 1.00
4. Dilatation angle
Maximum dilatancy angle ψmax 30.00 degree
The normal pressure when the dilatancy angle become zero ψ 1500.00 KN/m^2

78
The maximum dilatancy angle and normal pressure when the dilatancy angle becomes
zero is extracted from Figure 4.15.
6.3 Result
The Plaxis modeling results show that the crane walk-way design has a high safety
factor. The total displacement is around 35-39 mm, which is acceptable for this design.
The influence of varying the GSI, and consequently the Young‟s modulus (calculated
by RocData), on the factor of safety and displacement was investigated (Table 6.2)
(Brinkgreve, 2010). As expected, the safety factor increases with an increase of GSI.
Normal surcharge in the middle model has a higher safety factor than normal load at
the edge model. Figure 6.3 shows that there is a linear relationship between the GSI
and safety factor for both loading methods. The safety factor approaches 1 when the
GSI value is 10. According to the discussion in charpter 5.4, an increse in density will
result in a higher GSI value. It is recommended to conduct some field test to find the
proper compaction density for the atucal project construction. The total displacement
decreases with an increase of GSI (Table 6.2,). The variation of vertical displacement
and horizontlal displacement is not significant with changes in GSI.
Additionally, the difference between using the Hoek-Brown model and the
Mohr-Coulomb model for rockfill are recommended to be studied in the future.
Table 6.2: The safety factor and total displacement of the design
Normal load in the middle Normal load at the edge
GSI 20 29 38 20 29 38
Young’s modulus 8.89E+05 1.49E+06 2.50E+06 8.89E+05 1.49E+06 2.50E+06
Safety Factor 1.86 2.15 2.40 1.44 1.75 2.00
Total
displacement
(mm)
37.11 36.28 35.33 38.59 37.66 36.60
Horizontal
displacement
(mm)
9.90 10.31 10.13 13.28 13.78 12.91
Vertical
displacement
(mm)
36.94 36.07 35.09 38.47 37.54 36.48

79
Figure 6.3: GSI value vs. safety factor of the crane walk-way design
Figure 6.4: The total displacement when the normal load is in the middle and GSI equal to 38
Figure 6.5: The vertical effective stress when the normal load is in the middle and GSI equal to 38

80
Figure 6.6: The total displacement when the normal load is at the outer edge and GSI equal to 38
Figure 6.7: The vertical effective stress when the normal load is at the outer edge and GSI equal to
38

81
7 Conclusions and recommendations
7.1 Conclusions
The shear stress-strain behavior of the Bremanger sandstone rockfill is nonlinear and
stress dependent. Typical mixed behavior was observed in the relation between
volume change and shear-strain. At low normal pressure, the rockfill behaves as a
dense material, while at high normal pressure it behaves as a loose material. Both the
secant friction angle and the dilatancy angle decreases as the normal stress increases.
By comparing the test results of both shear boxes, the influence of effective factors on
shear strength, friction angle and dilatancy was concluded as follows:
Effect factors Shear strength Friction angle Dilatancy
Particle size unknown
Density
Normal stress
It should be noted that for future studies, the relative density of the packing should be
used instead of density. This would also require knowing the maximum and minimum
porosity.
The increase in friction angles as a function of grain size is an unusual trend and can
be explained by several reasons. Firstly, the rockfill used in the small shear box has a
lower crushing strength because the material originates from corner chopping of
bigger aggregates. Secondly, it could be due to the differences in relative densities.
Lastly, it might be because of the scale/boundary effects. Both small size rockfill
(1.18<P<3.35mm and 3.35<P<6.30mm) should be tested in the medium size shear
box to assess the scale/boundary effects.
From comparing the modeling result of four different empirical model
(Mohr-Coulomb Model, Power Curve Strength Model, Barton Model and
Hoek-Brown Model), it can be concluded that the Mohr-Coulomb model can be used
for rough estimation and Hoek-Brown Model can be used for more detailed
estimation for the Bremanger sandstone rockfill.
The Plaxis 2D modeling results show that the crane walk-way design has a very high
safety factor. The total displacement is below 40 mm, which is acceptable for this
design.
There are four highlights in this study:

82
The dilatancy was recorded for both shear box tests. As a result, the
stress-dilatancy curve can be drawn to better explain the shear strength
behavior.
The relationship between the basic friction angle, secant friction angle at
failure and dilatancy angle at failure was discussed and used in the modeling.
A new method of using the Hoek-Brown model to estimate the shear strength
of rockfill material was proposed.
A geotechnical model was built using Plaxis 2D. Furthermore, the relationship
between GSI and safety factor was discussed to use the proposed Hoek-Brown
model more efficiently.
7.2 Recommendations
For both shear box tests, it is advisable to conduct at least two parallel tests
and use the average value for further analysis. High normal stress tests of the
medium size shear box are highly recommended for better comparison
between the two different equipments. If increasing the normal stress is not
possible, more tests with normal stress between 0 to 35 kPa are recommended.
The influence on the vertical and horizontal component of the normal stress
and shear stress due to the tilting of the dead weight for the medium size shear
box needs to be investigated.
A maximum particle size of 80 mm is too large for the medium size shear box.
A maximum particle size of 50 mm is recommended for future test.
It is suggested that further lab test (tilt test or push/pull test) be conducted to
accurately estimate the basic friction angle of the Bremanger sandstone
rockfill.
Hoek Brown model fitting method is a new method for estimating the shear
strength of rockfill. Further research is recommended to verify the
applicability of this method and to find the influence of other factors on the
GSI (such as normal stress, the grade distribution, the uniformity coefficient
etc).
In terms of the Plaxis 2D model, the difference between using the
Hoek-Brown model and the Mohr-Coulomb model for rockfill are
recommended to be studied in the future.
The grade distribution of the rockfill used in the MV2 project is unknown, the
influence of the grade distribution on the shear strength is recommended to be
investigated.

83
8 Reference
Al-Hussaini, M., 1983. Effect of partical size and strain conditions on the strength of
crushed basalt. Canadian Geotechnical Journal, 20, pp.706-17.
Alnaes, L., Johannsson, E. & Myrvang, A., 1999. Rock mechanical evaluation of
planned underground facilities at Dyrstad, Bremanger. Technical report. Trondheim:
SINTEF Civil and Environmental Engineering.
Anagnosti, P. & Popovic, M., 1982. Evaluation of shear strength for coarse-grained
granular materials. In Fouteenth Congres on Large Dmas. Rio de Janeiro, 1982.
ICOLD.
Asadzadeh, M. & Soroush, A., 2009. Direct shear testing on a rockfill material. The
Arabian Journal for Science and Engineering, 34(2B), pp.379-96.
Barton, N., 1973. Review of a new shear-strength criterion for rock joits. Engineering
Geology, 7, pp.287-332.
Barton, N., 1976. The shear strength of rock and rock joints. International Journal of
Rock Mechanics, Mining Sciences and Geomechanics Abstracts, 13(9), pp.255-79.
Barton, N., 1980. Estimation of in-situ joint properties, Naslinden mine. In
Proceedings of the Lulea Conference on Application of Rock Mechanics to
Cut-and-Fill Mining. London, 1980. Society of Mining Engineers.
Barton, N., 2008. Shear strength of rockfill, interfaces and rock joints, and their points
of contact in rock dump design. In A. Fourie, ed. Rock Dumps 2008. Perth:
Austrianlian Center for Geomechanics. pp.3-17.
Barton, N. & Bandis, S., 1980. Some effects of scale on the shear strength of joints.
International Journal of Rock Mechanics, Mining Sciences and Geomechanics
Abstracts, 17, pp.69-73.
Barton, N. & Choubey, V., 1977. The shear strength of rock joints in theory and
practice. In Rock Mechanics. Vienna: Springer-Verlag. pp.1-54.
Barton, N. & Kjaernsli, B., 1981. Shear strength of rockfill. Journal of the
Geotechnical Engineering Division, 107, pp.873-91.
Bertacchi, P. & Bellotti, R., 1970. Experimental research on materials for rockfill
dams. In Tenth Congress on Large Dams. Montreal, 1970. ICOLD.
Brauns, J., 1968. Über den Einfluß des Einzelkornbernberuches a uf die Belastbarkeit
von Haufwerken, besondersvon regelmäbigen Kugelpackungen, im Dreiaxialversuch.
33rd ed. Veröffentlichungen des Institutes für Boden-und Felsmechanik der
Universität Karlsruhe.
Brinkgreve, R., 2010. Draft presentation of the Hoek and Brown criterion of failure in

84
PLAXIS. Personal communitcation.
Cerato, A.B. & Lutenegger, A.J., 2006. Specimen size and scale effects of direct shear
box tests of sands. Geotechnical Testing Journal, 29(6), pp.1-10.
Charles, J.A., 1991. Laboratory compression tests and the deformation of rockfill
structures. In E. Maranha das Neves, ed. Advances in Rockfill Structures. Lisbon:
Kluwer Academic Publishers. pp.73-95.
Charles, J.A., 1991. Laboratory shear strength tests and the stability of rockfill slopes.
In E. Maranha das Neves, ed. Advances in Rockfill Structures. Lisbon: Kluwer
Academic Publishers. pp.53-72.
Charles, J.A. & Watts, S.K., 1980. The influence of confining pressure on the shear
strength of compacted rockfill. Geotechnique, 30(4), pp.353-67.
De Mello, V., 1977. Reflectoins on design conditions of practical significance to
enbankment dams. 17th Rankine Lecture. Geotechnique, 27(3), pp.281-354.
Douglas, K.J., 2002. The shear strength of rock mass. Ph.D. thesis. Sydney, Australia:
University of New South Wales. School of Civil and Environmental Engineering.
Estaire, J. & Olalla, C., 2005. Analysis of shear strength of armourstone based on 1
m^3 direct shear tests. WIT Transaction on The Built Environment, 78, pp.341-52.
Ghanbari, A., Sadeghpour, A.H., Mohamadzadeh, H. & Mohamadzadeh, M., 2008. An
experimental study on the behavior of rockfill materials using large scale tests.
http://www.ejge.com/2008/Ppr0871/Ppr0871.pdf. Tehran, Iran: EJGE.
Hoek, E., 2007. Shear strength of discontinuities. In Practical Rock Engineering.
2007th ed. www.rocscience.com. pp.60-72.
Hoek, E., 2007. Shear strength of discontinuities. In Practical Rock Engineering - An
Ongoing Set of Notes. 2007th ed. available on the rocscience websites:
www.rocscience.com. pp.60-72.
Hoek, E. & Brown, E.T., 1997. Practical estimates of rock mass strength.
International Journal of Rock Mechanics and Mining Sciences, 34(8), pp.1165-86.
Hoek, E., Carranza-Torres, C. & Corkum, B., 2002. Hoek-Brown failure criterion -
2002 editon. In Proceedings of North American Rock Mechanics Society meeting.
Toronto, July 2002.
Indraratna, B., 1994. The effect of normal stress-friction angle relationship on the
stability analysis of a rockfill dam. Geotechnical and Geological Engineering, 12,
pp.113-21.
Indraratna, B., Wijewardena, S.L.S. & Balasubramaniam, S.A., 1993. Large-scale
triaxial testing of greywacke rockfill. Geotechnique, 43(1), pp.37-51.
Krane, H., 2010. Revolutie in blokkenland. Rotterdam: PUMA.

85
Lee, D.S., Kim, K.Y., Oh, G.D. & Jeong, S.S., 2009. Shear characteristics of coarse
aggregates sourced from quarries. International Journal of Rock Mechanics & Mining
Sciences, 46, pp.210-18.
Leps, T.M., 1970. Review of the shearing strength of rockfill. Journal of the Soil
Mechanics and Foundations Division, 96(SM4), pp.1159-70.
Loman, G.J.A., 2009. "Maasvlakte 2" project: the winning DCM bid with an
EMSAGG focus on the innovative cobble sea defense. In EMSAGG Conference 2009.
Rome, 2009.
Marachi, D.N., Chan, C.K. & Seed, B.H., 1972. Evaluation of properties of rockfill
materials. Journal of the Soil Mechanics and Foundations Division, 98(SM1),
pp.95-114.
Marachi, D.N., Chan, K.C., Seed, B.H. & Duncan, B.H., 1969. Strength and
Deformation Characteristics of Rockfill Materials. 695th ed. Department of Civil
Engineering, University of California.
Marinos, P., Hoek, E. & Marinos, V., 2006. Variability of the engineering properties of
rock masses quantified by the geological strength index: the case of ophiolites with
special emphasis on tunnelling. Bulletin of Engineering Geology and the Environment,
65, pp.129-42.
Marsal, R.J., 1973. Mechanical properties of rockfill. In R.C. Hirschfeld & S.J. Poulos,
eds. Embankemnt-Dam Engineering. A Wiley-Interscience Pbulication. pp.110-200.
Matsumoto, N. & Wanatabe, K., 1987. The shear strength of rockfill materials.
Tsuchi-to-Kiso, ISSMFE 35(12).
Mulder, A. & Verwaal, W., 2006. Direct shear test. In A. Mulder & W. Verwaal, eds.
Soil Mechanics Test Procedures. Delft: Geological Engineering Department, Faculty
of Civil Engineering, Technology Uiversity of Delft. pp.48-52.
Myrvang, A., 1998. A preliminary rock mechanics survey at Dyrstad, Bremanger.
Technical report. Trondheim: SINTEF Civil and Environmental Engineering.
Oyanguren, R.P., Nicieza, G.C., Fernandez, A.M.I. & Palacio, G.C., 2008. Stability
analysis of Llerin rockfill dam: An in situ derect shear test. Engineering Geology,
100(3-4), pp.120-30.
Penman, M.A.D., Charles, A.J. & Humphreys, D.J., 1982. Sandstone rockfill in two
dams. In Fourteenth Congres on Large Dams. Rio de Janeiro, 1982. ICOLD.
Plaxis bv, 2010. Plaxis - Essential software for geotechnical professionals. [Online]
Available at: http://www.plaxis.nl [Accessed 24 June 2010].
Rocscience Inc., 2004. RocData Users Guide. Rocscience Inc.
Taylor, W.D., 1948. Fundamentals of soil mechanics. New York: Wiley.

86
van der Linden, M., 2010. Determine shear strength of Bremanger aggregate at low
normal stress using medium size direct shear box tests. BSc. Thesis. Delft: TU Delft.
Verhoef, P.N.W., 1987. Sandblast testing of rock. International Journal of Rock
Mechanics, Mining Sciences and Geomechanic Abstracts, 24(3), pp.185-92.
Verhoef, P.N.W., 2010. Damage caused by sandblasting. Personal communication.
Wood, M.D., 1990. Soil behavior and critical state soil mechanics. Cambridge:
Cambridge University Press.
Yan, L., 2004. Comparison of contrast between direct box shear test and triaxial test.
Shanxi Architecture, 30(24), p.64.

87
9 Appendix
9.1 AppendixⅠ: Hoek-Brown criterion detail curve fitting
information
1. Category NS
Figure 9.1: The power trend line curve of normal-shear strength value from category NS test data
Figure 9.2: The best fit curve with category NS test data when using Hoek-Brown criterion

88
2. Category NB
Figure 9.3: The power trend line curve of normal-shear strength value from category NB test data
Figure 9.4: The best fit curve with category NB test data when using Hoek-Brown criterion

89
3. Category HS
Figure 9.5: The power trend line curve of normal-shear strength value from category HS test data
Figure 9.6: The best fit curve with category HS test data when using Hoek-Brown criterion
90
4. Category HB
Figure 9.7: The power trend line curve of normal-shear strength value from category HB test data
Figure 9.8: The best fit curve with category HB test data when using Hoek-Brown criterion

91
5. Category MS
Figure 9.9: The power trend line curve of normal-shear strength value from category MS test data
Figure 9.10: The best fit curve with category MS test data when using Hoek-Brown criterion

92
6. Category MB
Figure 9.11: The power trend line curve of normal-shear strength value from category MB test
data
Figure 9.12: The best fit curve with category MB test data when using Hoek-Brown criterion

93
7. Category M1
Figure 9.13: The power trend line curve of normal-shear strength value from category M1 test
data
Figure 9.14: The best fit curve with category M1 test data when using Hoek-Brown criterion
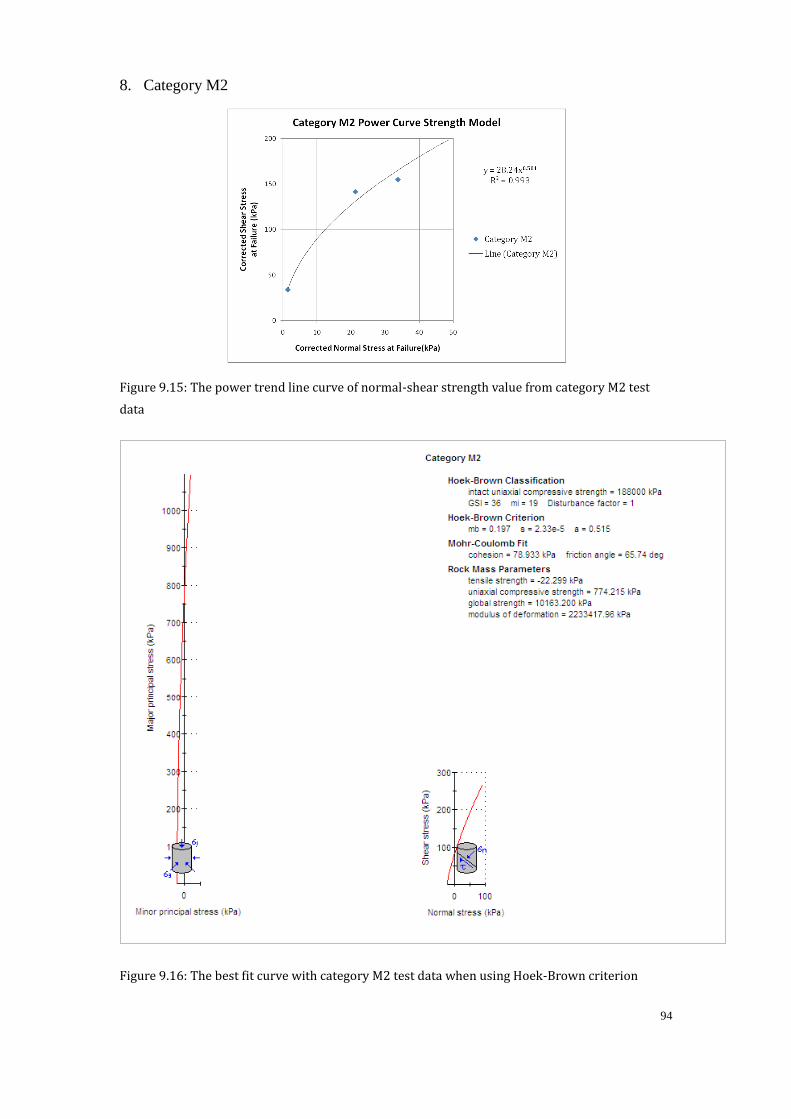
94
8. Category M2
Figure 9.15: The power trend line curve of normal-shear strength value from category M2 test
data
Figure 9.16: The best fit curve with category M2 test data when using Hoek-Brown criterion

95
9. Category M3
Figure 9.17: The power trend line curve of normal-shear strength value from category M3 test
data
Figure 9.18: The best fit curve with category M3 test data when using Hoek-Brown criterion