Embed Size (px)
Citation preview
»AES CorporationSanford C. Bernstein Strategic Decisions Conference 2007June 1, 2007 Andres Gluski, AES Chief Operating Officer
AES Corporation 2
» Safe Harbor Disclosure
Certain statements in the following presentation regarding AES’s business operations may constitute “forward looking statements.” Such forward-looking statements include, but are not limited to, those related to future earnings, growth and financial and operating performance. Forward-looking statements are not intended to be a guarantee of future results, but instead constitute AES’s current expectations based on reasonable assumptions. Forecasted financial information is based on certain material assumptions. These assumptions include, but are not limited to, continued normal or better levels of operating performance and electricity demand at our distribution companies and operational performance at our generation businesses consistent with historical levels, as well as achievements of planned productivity improvements and incremental growth from investments at investment levels and rates of return consistent with prior experience. For additional assumptions see the Appendix to this presentation. Actual results could differ materially from those projected in our forward-looking statements due to risks, uncertainties and other factors. Important factors that could affect actual results are discussed in AES’s filings with the Securities and Exchange Commission including but not limited to the risks discussed under Item 1A “Risk Factors” in the Company’s Annual Report on Form 10-K for the year ended December 31, 2006, as well as our other SEC filings. AES undertakes no obligation to update or revise any forward-looking statements, whether as a result of new information, future events or otherwise.
AES Corporation 3
» AES Overview
AES has a strong position in the industry through portfolio diversification
› Geographic diversity
› Fuel Diversity
› Technology diversity
› Business line diversity: generation and distribution
› Growing portfolio of businesses in adjacent markets
AES Corporation 4
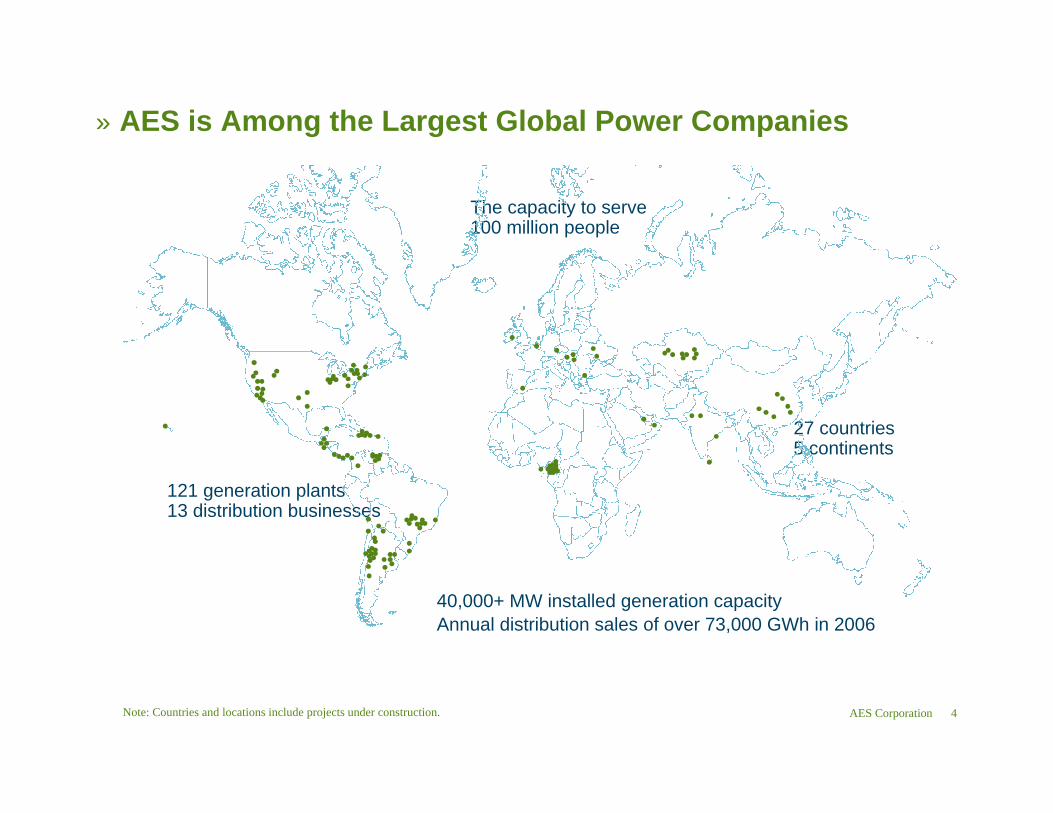
» AES is Among the Largest Global Power Companies
Note: Countries and locations include projects under construction.
The capacity to serve 100 million people
121 generation plants13 distribution businesses
40,000+ MW installed generation capacityAnnual distribution sales of over 73,000 GWh in 2006
27 countries5 continents
AES Corporation 5
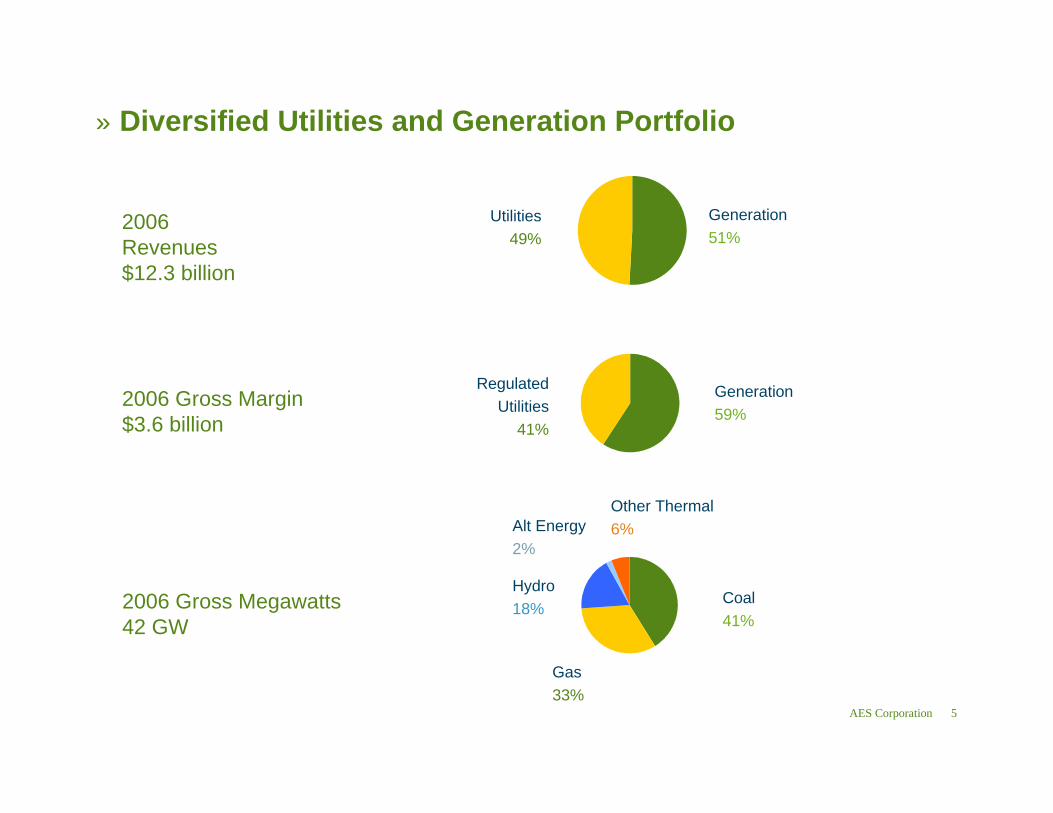
» Diversified Utilities and Generation Portfolio
Generation51%
2006 Revenues$12.3 billion
Utilities49%
Generation59%
2006 Gross Margin$3.6 billion
RegulatedUtilities
41%
2006 Gross Megawatts42 GW
Coal41%
Gas33%
Hydro18%
Alt Energy2%
Other Thermal6%
AES Corporation 6
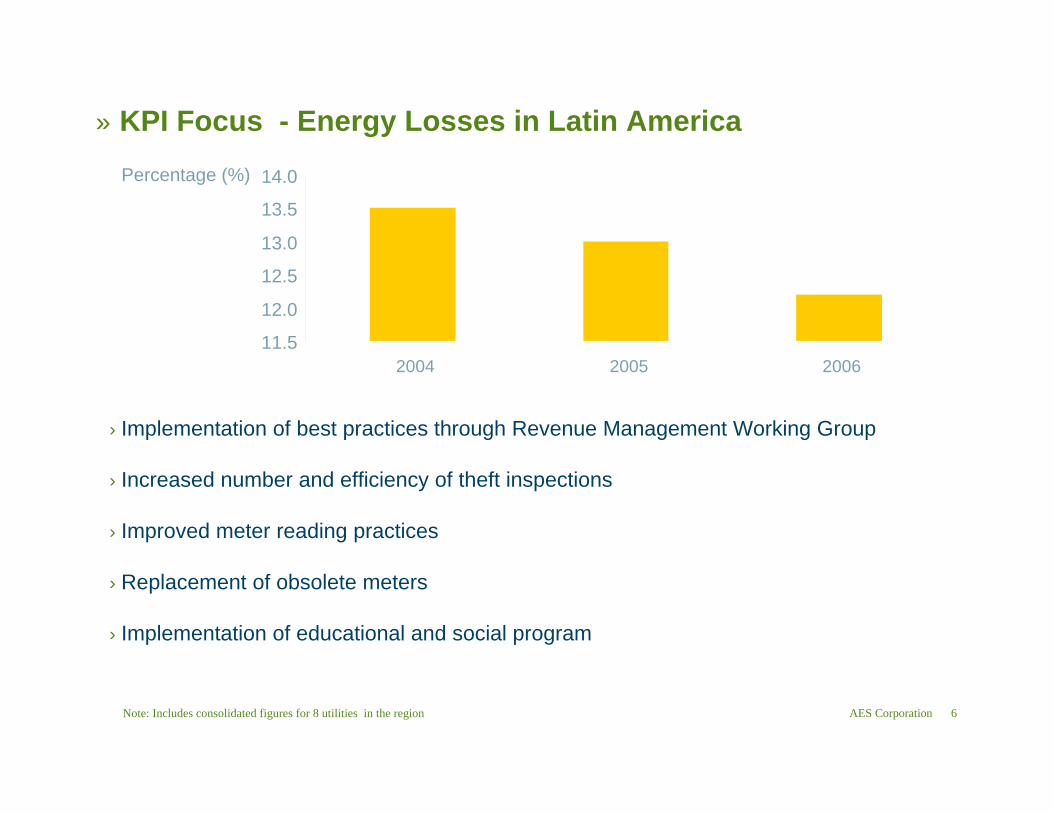
» KPI Focus - Energy Losses in Latin America
Note: Includes consolidated figures for 8 utilities in the region
Percentage (%)
› Implementation of best practices through Revenue Management Working Group
› Increased number and efficiency of theft inspections
› Improved meter reading practices
› Replacement of obsolete meters
› Implementation of educational and social program
11.5
12.0
12.5
13.0
13.5
14.0
2004 2005 2006
AES Corporation 7
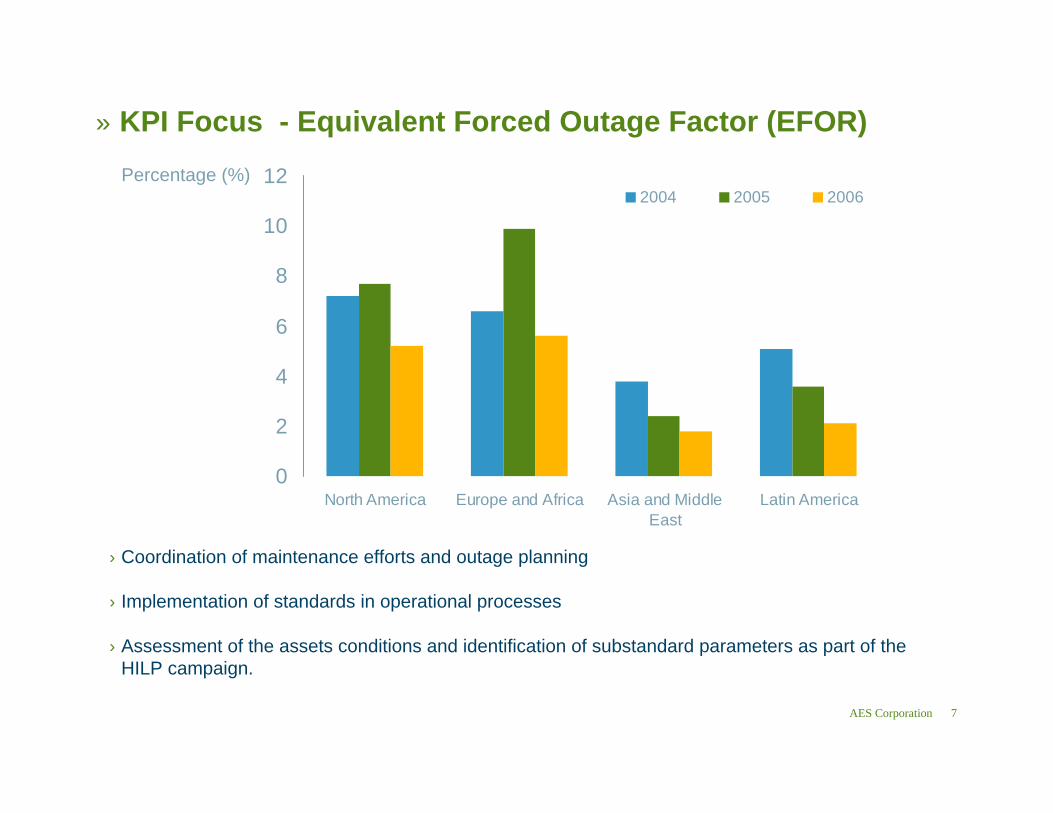
» KPI Focus - Equivalent Forced Outage Factor (EFOR)
0
2
4
6
8
10
12
North America Europe and Africa Asia and MiddleEast
Latin America
2004 2005 2006Percentage (%)
› Coordination of maintenance efforts and outage planning
› Implementation of standards in operational processes
› Assessment of the assets conditions and identification of substandard parameters as part of the HILP campaign.
AES Corporation 8
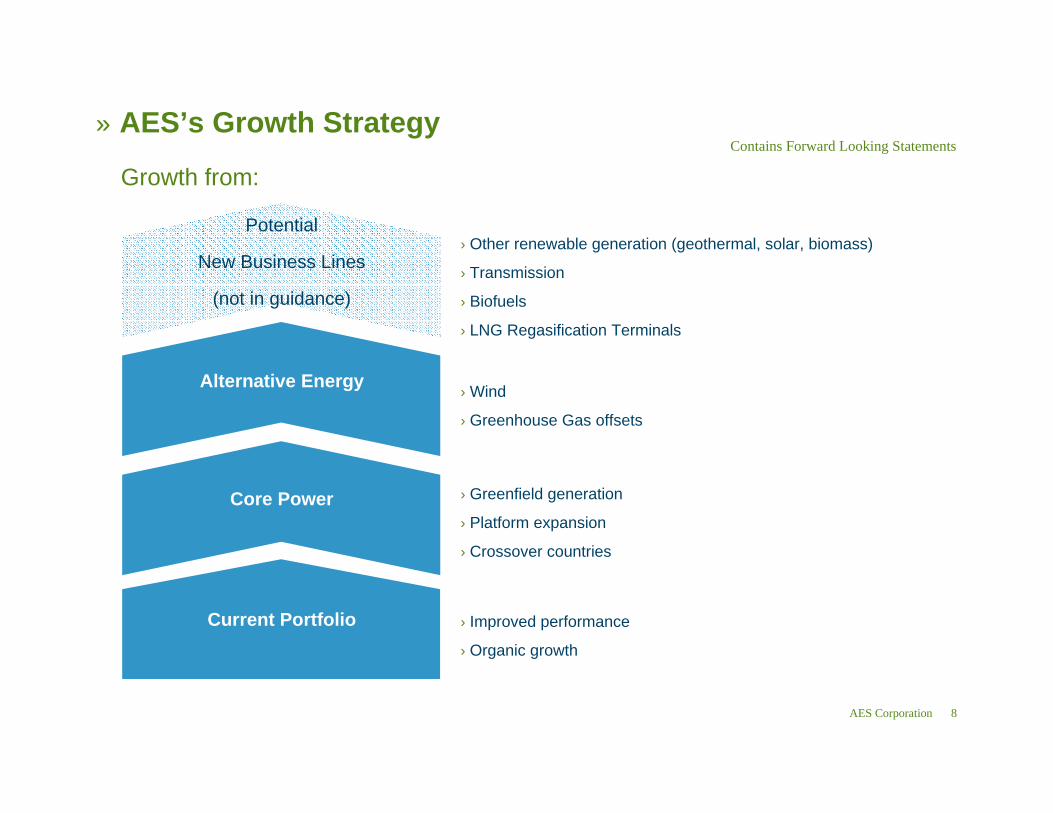
Potential
New Business Lines
(not in guidance)
» AES’s Growth Strategy
Growth from:
Current Portfolio
Core Power
Alternative Energy
› Improved performance
› Organic growth
› Greenfield generation
› Platform expansion
› Crossover countries
› Wind
› Greenhouse Gas offsets
› Other renewable generation (geothermal, solar, biomass)
› Transmission
› Biofuels
› LNG Regasification Terminals
Contains Forward Looking Statements
AES Corporation 9
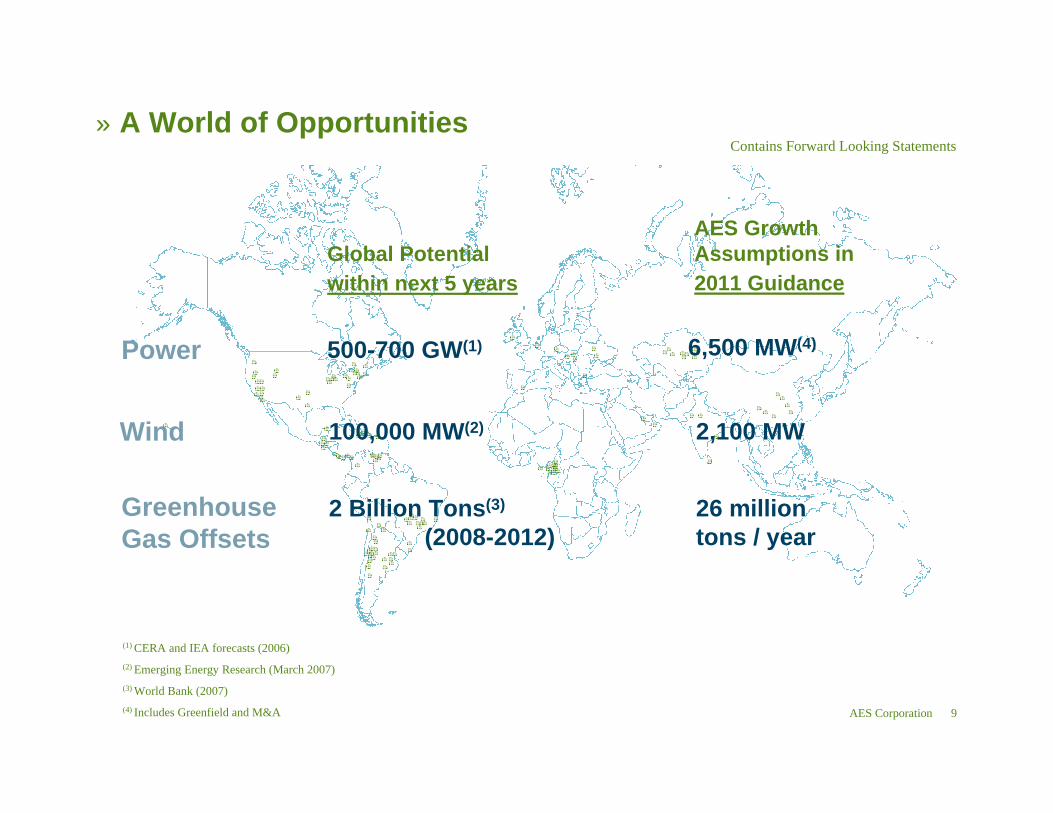
» A World of Opportunities
2 Billion Tons(3)
(2008-2012)
100,000 MW(2)
500-700 GW(1)
Global Potential within next 5 years
26 million tons / year
2,100 MW
6,500 MW(4)
AES Growth Assumptions in 2011 Guidance
Greenhouse Gas Offsets
Wind
Power
(1) CERA and IEA forecasts (2006)(2) Emerging Energy Research (March 2007)(3) World Bank (2007)(4) Includes Greenfield and M&A
Contains Forward Looking Statements

AES Corporation 10
» Development Pipeline
› Under construction projects:
– Maritza East 670 MW coal fired plant in Bulgaria– Guacolda III 152 MW coal fired plant at Gener (Chile)– Ventanas III 267 MW coal fired plant at Gener (Chile)– Changuinola 223 MW hydro plant in Panama– Buffalo Gap II 233 MW wind farm in Texas– Amman East (1) 370 MW gas-fired plant in Jordan
› In 2006 commercial operations commenced at:
– Cartagena 1,200 MW gas fired plant in Spain– Buffalo Gap 1 121 MW wind farm in Texas– Los Vientos 125 MW diesel/gas peaker in Chile
(January 2007)
LocationMWProject
Qatar2,600 Ras Laffan
Indonesia1,200 Musi Rawas
India1,200 Chattisgath
Turkey400ICTAS Energy India1,200 OPGC
Kazakhstan1,500 Kazakhstan
N Ireland400 Kilroot
Puerto Rico500 Puerto Rico 2
US600 Shady Pt 2
El Salvador200 Fonseca
Chile520 Alto Maipo
Chile532 Angamos
Panama213 Changuinola 2
Vietnam1,200 Mong Duong
› Current Development Pipeline has over 20 GW of specifically identified advanced stage opportunities representing over 40 projects in 20 countries
› AES core strength in project development is bringing pipeline cycle to completion
› Selected projects beyond early stage development:
(1) Amman East commenced construction in April 2007
Contains Forward Looking Statements
AES Corporation 11
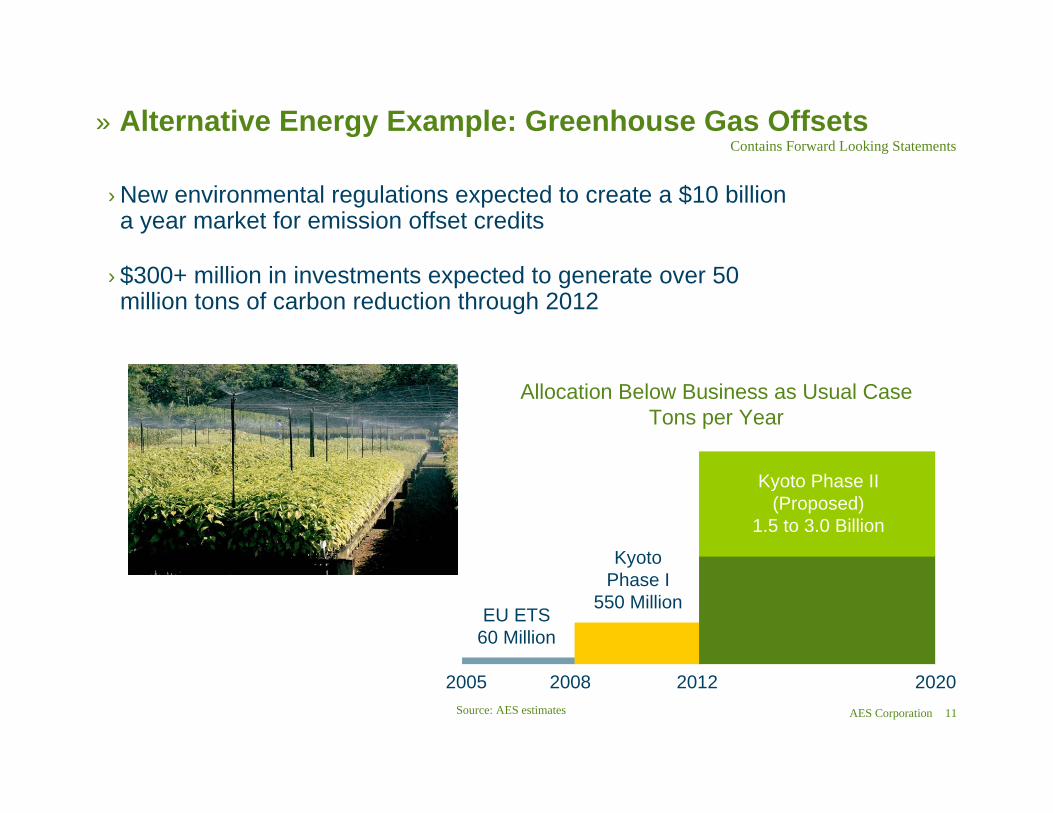
» Alternative Energy Example: Greenhouse Gas Offsets
› New environmental regulations expected to create a $10 billion a year market for emission offset credits
› $300+ million in investments expected to generate over 50 million tons of carbon reduction through 2012
2005 2008 2012 2020
Allocation Below Business as Usual CaseTons per Year
EU ETS60 Million
KyotoPhase I
550 Million
Kyoto Phase II(Proposed)
1.5 to 3.0 Billion
Source: AES estimates
Contains Forward Looking Statements
AES Corporation 12
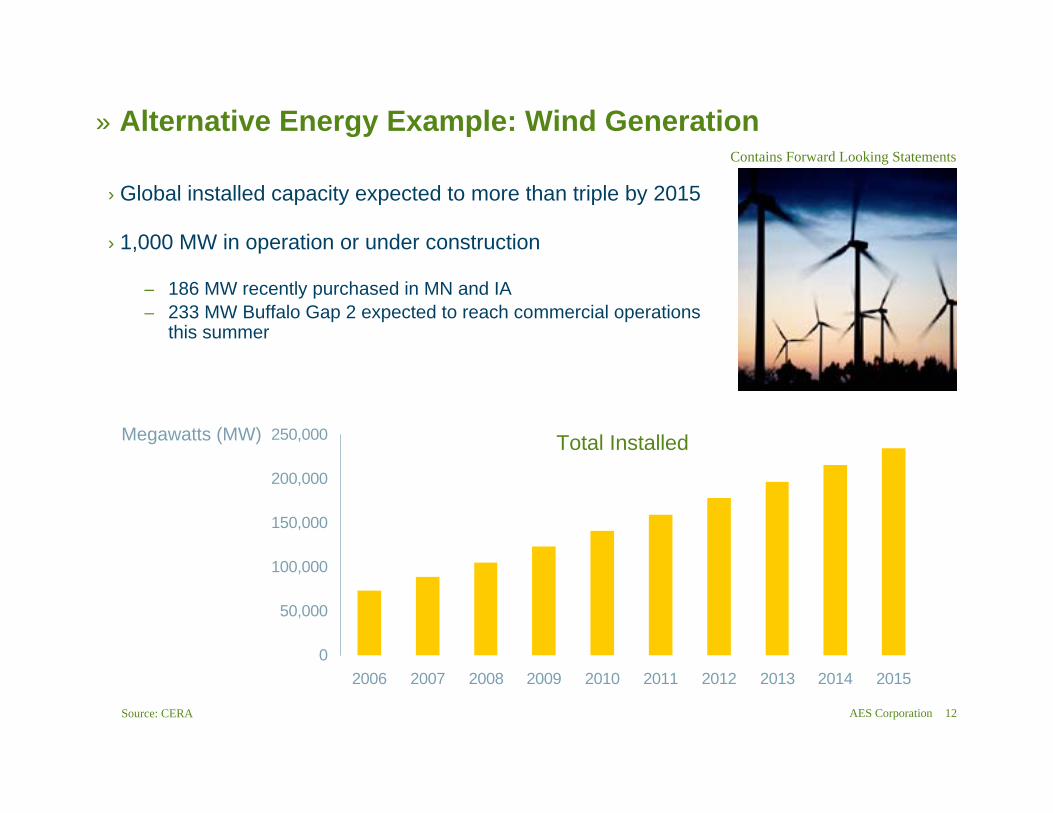
» Alternative Energy Example: Wind Generation
› Global installed capacity expected to more than triple by 2015
› 1,000 MW in operation or under construction
– 186 MW recently purchased in MN and IA– 233 MW Buffalo Gap 2 expected to reach commercial operations
this summer
Kyoto Phase II(Proposed)
1.5 to 3.0 Billion
Contains Forward Looking Statements
0
50,000
100,000
150,000
200,000
250,000
2006 2007 2008 2009 2010 2011 2012 2013 2014 2015
Total Installed
Source: CERA
Megawatts (MW)
AES Corporation 13
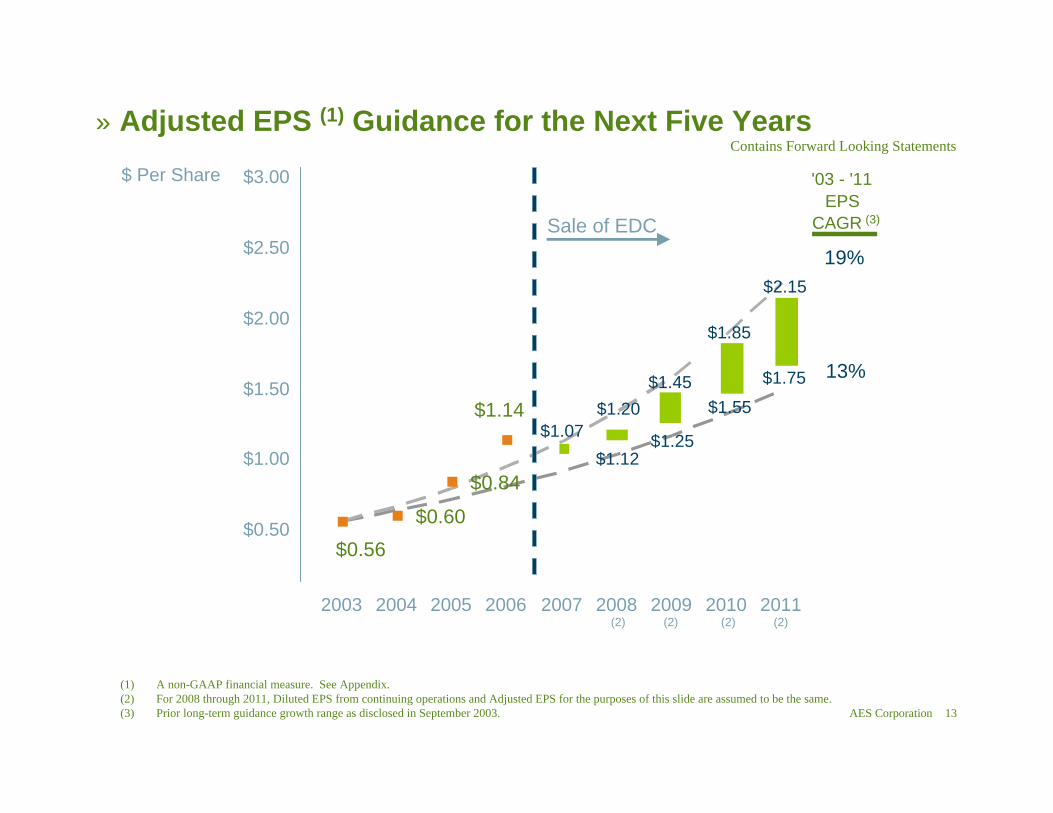
(1) A non-GAAP financial measure. See Appendix.(2) For 2008 through 2011, Diluted EPS from continuing operations and Adjusted EPS for the purposes of this slide are assumed to be the same. (3) Prior long-term guidance growth range as disclosed in September 2003.
» Adjusted EPS (1) Guidance for the Next Five YearsContains Forward Looking Statements
$1.12$1.25
$1.55
$1.75
$2.15
$1.85
$1.45
$1.07$1.20
$0.60
$0.84
$1.14
$0.56$0.50
$1.00
$1.50
$2.00
$2.50
$3.00
2004 2005 2006 2007 2008 2009 2010 2011
13%
19%
'03 - '11 EPS
CAGR (3)Sale of EDC
2003(2)(2) (2)(2)
$ Per Share
AES Corporation 14
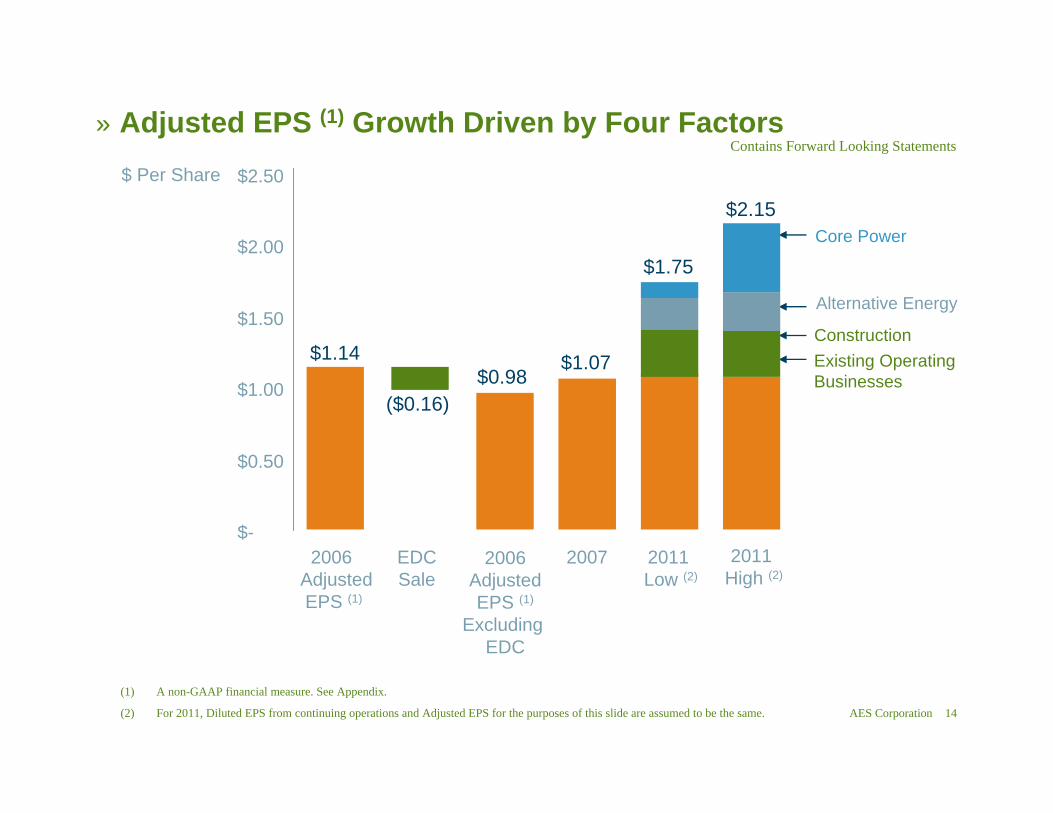
(1) A non-GAAP financial measure. See Appendix.
(2) For 2011, Diluted EPS from continuing operations and Adjusted EPS for the purposes of this slide are assumed to be the same.
» Adjusted EPS (1) Growth Driven by Four Factors
($0.16)
$1.14$0.98
$1.07
$1.75
$2.15
$-
$0.50
$1.00
$1.50
$2.00
$2.50
2006 AdjustedEPS (1)
EDCSale
2006AdjustedEPS (1)
Excluding EDC
2007 2011 Low (2)
2011 High (2)
Existing Operating Businesses
Alternative Energy
Core Power
Construction
Contains Forward Looking Statements
$ Per Share
AES Corporation 15
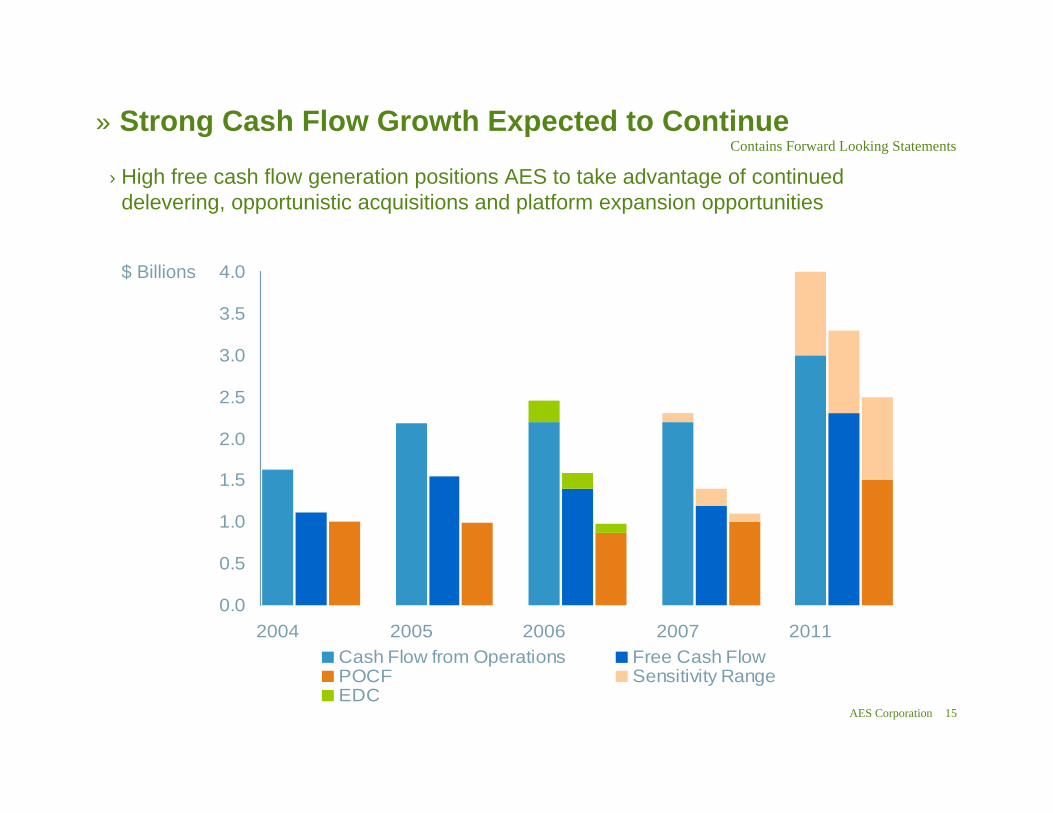
0.0
0.5
1.0
1.5
2.0
2.5
3.0
3.5
4.0
2004 2005 2006 2007 2011Cash Flow from Operations Free Cash FlowPOCF Sensitivity RangeEDC
» Strong Cash Flow Growth Expected to Continue
› High free cash flow generation positions AES to take advantage of continued delevering, opportunistic acquisitions and platform expansion opportunities
Contains Forward Looking Statements
$ Billions
AES Corporation 16
» Why Invest in AES?Contains Forward Looking Statements
› Global demand for power continues to grow
› AES is well positioned to leverage market opportunities and industry dynamics
–Global reach, local insights–Portfolio diversity, financial flexibility
› Focused on long-term value creation with sustained growth in EPS and cash flow
AES Corporation 17
» Appendix
AES Corporation 18
» AssumptionsForecasted financial information is based on certain material assumptions. Such assumptions include, but are not limited to: (a) no unforeseen external events such as wars, depressions, or economic or political disruptions occur; (b) businesses continue to operate in a manner consistent with or better than prior operating performance, including achievement of planned productivity improvements including benefits of global sourcing, and in accordance with the provisions of their relevant contracts or concessions; (c) new business opportunities are available to AES in sufficient quantity to achieve its growth objectives; (d) no material disruptions or discontinuities occur in GDP, foreign exchange rates, inflation or interest rates during the forecast period; and (e) material business-specific risks as described in the Company’s SEC filings do not occur individually or cumulatively. In addition, benefits from global sourcing include avoided costs, reduction in capital project costs versus budgetary estimates, and projected savings based on assumed spend volume which may or may not actually be achieved. Also, improvement in certain KPIs such as equivalent forced outage rate and commercial availability may not improve financial performance at all facilities based on commercial terms and conditions. These benefits will not be fully reflected in the Company’s consolidated financial results.
The cash held at qualifying holding companies (QHCs) represents cash sent to subsidiaries of the Company domiciled outside of the U.S. Such subsidiaries had no contractual restrictions on their ability to send cash to AES, the Parent Company. Cash at those subsidiaries was used for investment and related activities outside of the U.S. These investments included equity investments and loans to other foreign subsidiaries as well as development and general costs and expenses incurred outside the U.S. Since the cash held by these QHCs is available to the Parent, AES uses the combined measure of subsidiary distributions to Parent and QHCs as a useful measure of cash available to the Parent to meet its international liquidity needs. AES believes that unconsolidated parent company liquidity is important to the liquidity position of AES as a parent company because of the non-recourse nature of most of AES’s indebtedness.
AES Corporation 19
› Adjusted earnings per share – Defined as diluted earnings per share from continuing operations excluding gains or losses associated with (a) mark-to-market amounts related to FAS 133 derivative transactions, (b) foreign currency transaction impacts on the net monetary position related to Brazil, Venezuela, and Argentina, (c) significant asset gains or losses due to disposition transactions and impairments, and (d) early retirement of recourse debt. AES believes that adjusted earnings per share better reflects the underlying business performance of the Company, and is considered in the Company’s internal evaluation of financial performance. Factors in this determination include the variability associated with mark-to-market gains or losses related to certain derivative transactions, currency gains and losses, periodic strategic decisions to dispose of certain assets which may influence results in a given period, and the early retirement of corporate debt.
› Free cash flow – Net cash flow from operating activities less maintenance capital expenditures. Maintenance capital expenditures reflect property additions less growth capital expenditures. AES believes that free cash flow is a useful measure for evaluating our financial condition because it represents the amount of cash provided by operations less maintenance capital expenditures as defined by our businesses, that may be available for investing or for repaying debt.
› Subsidiary distributions – Cash distributions (primarily dividends and interest income) from subsidiary companies to the parent company and qualified holding companies. These cash flows are the source of cash flow to the parent to meet corporate interest, overhead, cash taxes, and discretionary uses such as recourse debt reductions and corporate investments.
» Definitions of Non-GAAP Financial Measures
AES Corporation 20(1) A non-GAAP financial measure.
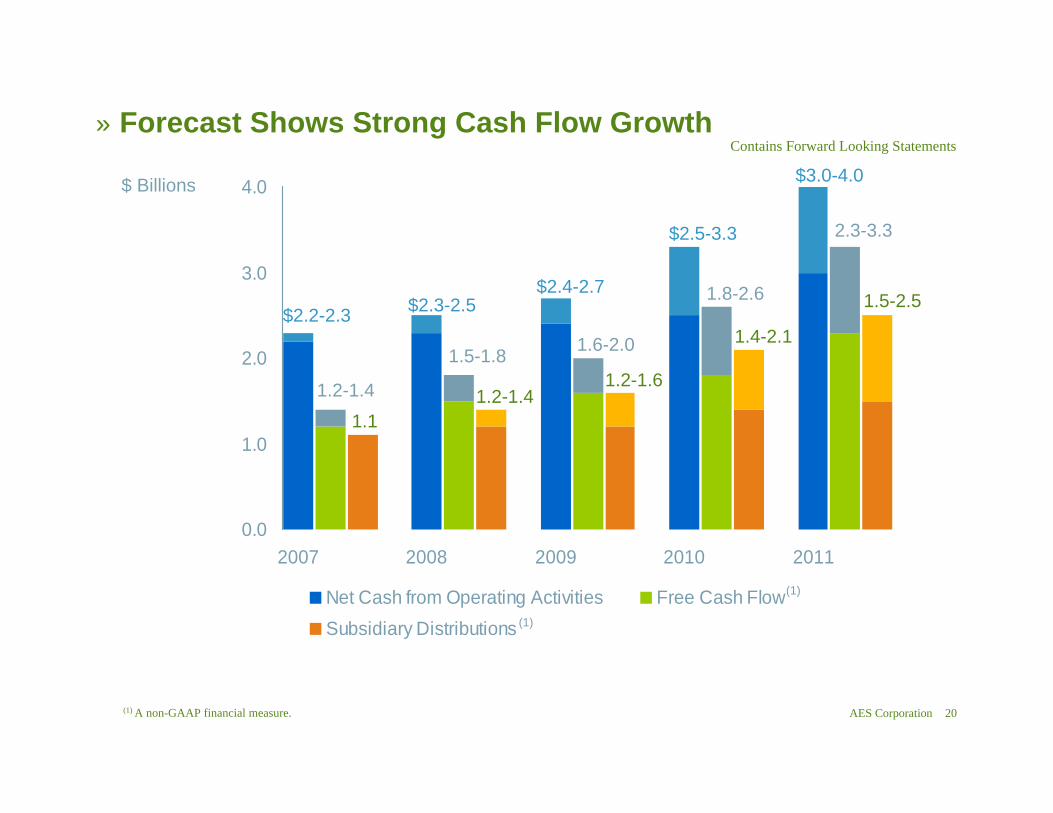
» Forecast Shows Strong Cash Flow GrowthContains Forward Looking Statements
0.0
1.0
2.0
3.0
4.0
2007 2008 2009 2010 2011
Net Cash from Operating Activities Free Cash FlowSubsidiary Distributions
$2.4-2.7$2.3-2.5$2.2-2.3
$2.5-3.3
$3.0-4.0
1.5-1.8
1.2-1.4
1.6-2.0
1.8-2.6
2.3-3.3
1.2-1.41.1
1.2-1.6
1.4-2.1
1.5-2.5
$ Billions
(1)
(1)
AES Corporation 21
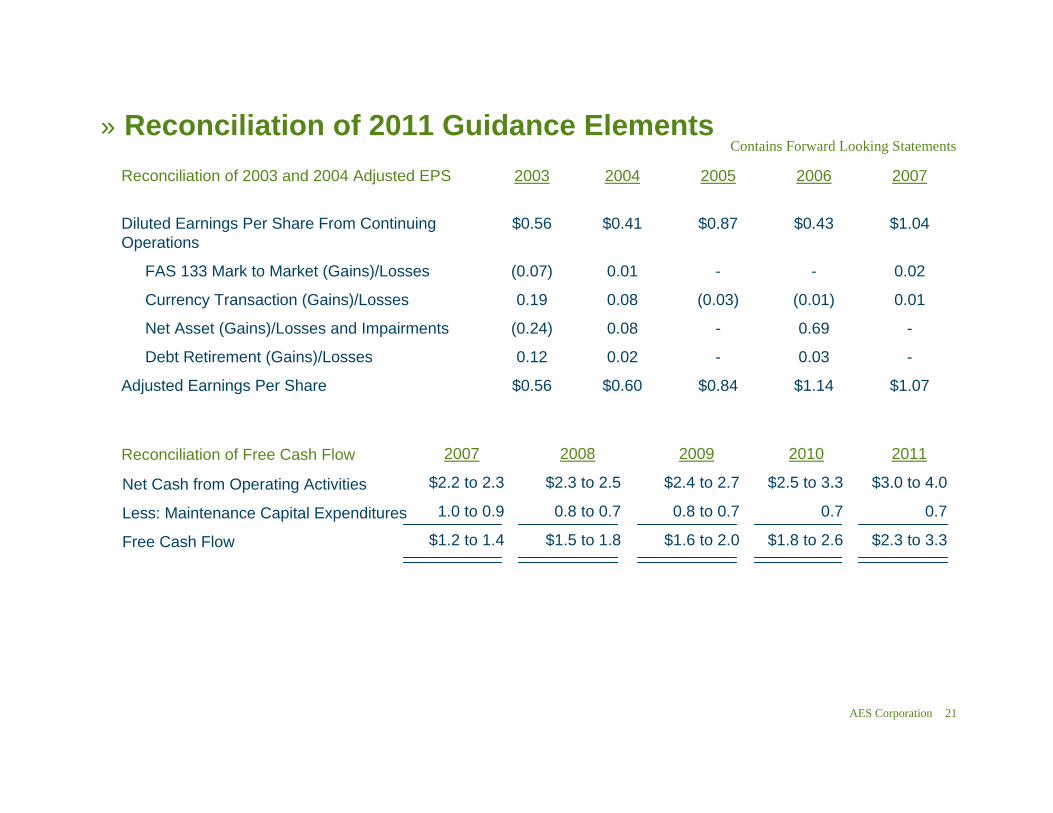
» Reconciliation of 2011 Guidance Elements
$0.60
0.02
0.08
0.08
0.01
$0.41
2004
$0.84
-
-
(0.03)
-
$0.87
2005
$1.14
0.03
0.69
(0.01)
-
$0.43
2006
$1.07
-
-
0.01
0.02
$1.04
20072003Reconciliation of 2003 and 2004 Adjusted EPS
$0.56
0.12
(0.24)
0.19
(0.07)
$0.56
Adjusted Earnings Per Share
Debt Retirement (Gains)/Losses
Net Asset (Gains)/Losses and Impairments
Currency Transaction (Gains)/Losses
FAS 133 Mark to Market (Gains)/Losses
Diluted Earnings Per Share From Continuing Operations
Reconciliation of Free Cash Flow
Net Cash from Operating Activities
Less: Maintenance Capital Expenditures
Free Cash Flow
$2.4 to 2.7
0.8 to 0.7
$1.6 to 2.0
20092008
$2.3 to 2.5
0.8 to 0.7
$1.5 to 1.8
$2.5 to 3.3
0.7
$1.8 to 2.6
2010
$3.0 to 4.0
0.7
$2.3 to 3.3
20112007
$2.2 to 2.3
1.0 to 0.9
$1.2 to 1.4
Contains Forward Looking Statements


![[PPT]PowerPoint Presentation - AES Corporation | …aes-corp.com/wp-content/uploads/2015/09/Dealer_ppt_Oct... · Web viewTECHNOLOGY Dealer url Dealer logo View ‘How Mesh Radio Technology](https://img.pdfslide.us/doc/110x75/5b8742527f8b9a162d8e9ec0/pptpowerpoint-presentation-aes-corporation-aes-corpcomwp-contentuploads201509dealerpptoct.jpg)