Embed Size (px)
Citation preview

AERSURFACE Tool:Status and Update
9th Conference on Air Quality ModelingOctober 9, 2008Research Triangle Park, NC
Roger W. BrodeU.S. EPA, OAQPSAir Quality Modeling GroupResearch Triangle Park, NC

Review of current AERSURFACE ToolImplementation Issues with AERSURFACEPlans for enhancing AERSURFACESummary
Outline

AERMOD designed to accept same meteorological data as ISCST3: NWS surface and upper air dataAERMOD also designed to accept more robust on-site meteorological data, including multi-level profiles of wind, temperature and turbulenceHowever, more advanced boundary layer algorithms in AERMOD require user-specified surface characteristics:
– Albedo– Bowen ratio– Surface roughness
Sensitivity to surface characteristics is one of the main implementation issues with AERMOD
AERMOD Met Data Needs

AERSURFACE is a tool designed to assist with determining surface characteristics data (albedo, Bowen ratio & surface roughness) for use in AERMET and/or AERSCREENInitial version of AERSURFACE was released on SCRAM on January 11, 2008AERSURFACE is not currently considered part of the AERMOD regulatory modeling system
What is AERSURFACE?

AERSURFACE incorporates recent changes to method for estimating surface characteristics from land cover data, presented in latest AERMOD Implementation Guide, also posted in January 2008Revisions to calculating area-weighted averages for surface roughness:
– Inverse-distance weighting to account for increased width/area of sector with distance
Revisions to calculation methods:– Averaging ln(zo) for surface roughness (= geometric mean)– Geometric mean for Bowen ratio
Revisions to default domain/distances:– 1km radius for roughness– 10x10km domain for Bowen ratio and albedo – no sector or
distance dependence
AERSURFACE Design

Default values/functions with several user choices:– Number of sectors (up to 12)– Output monthly, seasonal, or annual data– Wet/dry/normal conditions for Bowen ratio– Snow vs. no snow cover– Arid vs. Non-arid– Airport vs. Non-airport location
Current version of AERSURFACE supports 1992 National Land Cover Data (NLCD) files, with 21 categories at 30 meter horizontal resolution
AERSURFACE Design

1992 NLCD Land Cover CategoriesTable 1: USGS NLCD 92 Land Use Categories Classification Class Land Use Category
Open Water Water Perennial Ice/Snow Low Intensity Residential High Intensity Residential
Developed
Commercial/Industrial/TransportationBare Rock/Sand/Clay Quarries/Strip Mines/Gravel Pits
Barren
Transitional Deciduous Forest Evergreen Forest
Forested Upland
Mixed Forest Shrubland Shrubland Non-natural Woody Orchards/Vineyards/Other Herbaceous Upland Grasslands/Herbaceous
Pasture/Hay Row Crops Small Grains Fallow
Herbaceous Planted/Cultivated
Urban/Recreational Grasses Woody Wetlands Wetlands
Emergent Herbaceous Wetlands

AERSURFACE Surface Characteristics
1 Values are listed for the following seasonal categories: 1 - Midsummer with lush vegetation; 2 - Autumn with unharvested cropland; 3 - Late autumn after frost and harvest; or winter with no snow; 4 - Winter with continuous snow on ground; 5 - Transitional spring with partial green coverage or short annuals
AERMET 40.20.10.20.20.2Emergent Herbaceous Wetlands92
(43+92)/2150.70.50.60.70.7Woody Wetlands91
Randerson140.0150.0050.010.0150.02Urban/Recreational Grasses 85
31 & 81,82,83130.020.010.020.050.05Fallow84Garratt11 & Slade120.030.010.020.150.15Small Grains83Garratt11 & Slade120.030.010.020.20.2Row Crops82
Garratt11 & Slade120.030.010.020.150.15Pasture/Hay 81
AERMET 40.050.0050.010.10.1Grasslands/Herbaceous 71
Garratt110.20.050.10.30.3Orchards/Vineyards/Other61
AERMET 40.30.150.30.30.3Shrubland (Non-arid Region)
50% 51 (Non-Arid)100.15NA0.150.150.15Shrubland (Arid Region)51
(41+42)/2 91.150.90.951.31.3Mixed Forest 43
AERMET 41.31.31.31.31.3Evergreen Forest 42
AERMET 410.50.61.31.3Deciduous Forest 41
Estimate80.20.20.20.20.2Transitional33
Estimate70.30.30.30.30.3Quarries/Strip Mines/Gravel32
Slade60.050.050.050.050.05Bare Rock/Sand/Clay (Non-arid Region)
Slade60.05NA0.050.050.05Bare Rock/Sand/Clay (Arid Region)31
80%: 22 & 20%: 3150.80.80.80.80.8Commercial/Industrial/Transport (Not at Airport)
5%: 22 & 95%: 3150.10.10.10.10.1Commercial/Industrial/Transport (Site at Airport)23
AERMET 411111High Intensity Residential22
40% 22 + 50% 43+ 10% 8530.520.500.500.540.54Low Intensity Residential21
Stull20.0020.0020.0020.0020.002Perennial Ice/Snow12
Stull20.0010.0010.0010.0010.001Open Water 11
54321Reference(s)
Seasonal Surface Roughness1 (m)Class NameClass
Number

USGS NLCD 1992 Example Data

USGS NLCD 1992 Example Data

Uncertainties regarding ASOS met station locations – a key AERSURFACE input– Excel file with ASOS station locations available on
NCDC website is unreliable for location information– Additional data available for about 200 ASOS
stations as part of tropical cyclone wind study appears to be (generally) reliable
– Many locations off by several hundred meters (median value of about 500m)
– For example, RDU tower location is off by over 2km!– Use of erroneous station locations in AERSURFACE
could invalidate results
Potential AERSURFACE Issue

ASOS Met Station Locations – Cyclone Wind Study
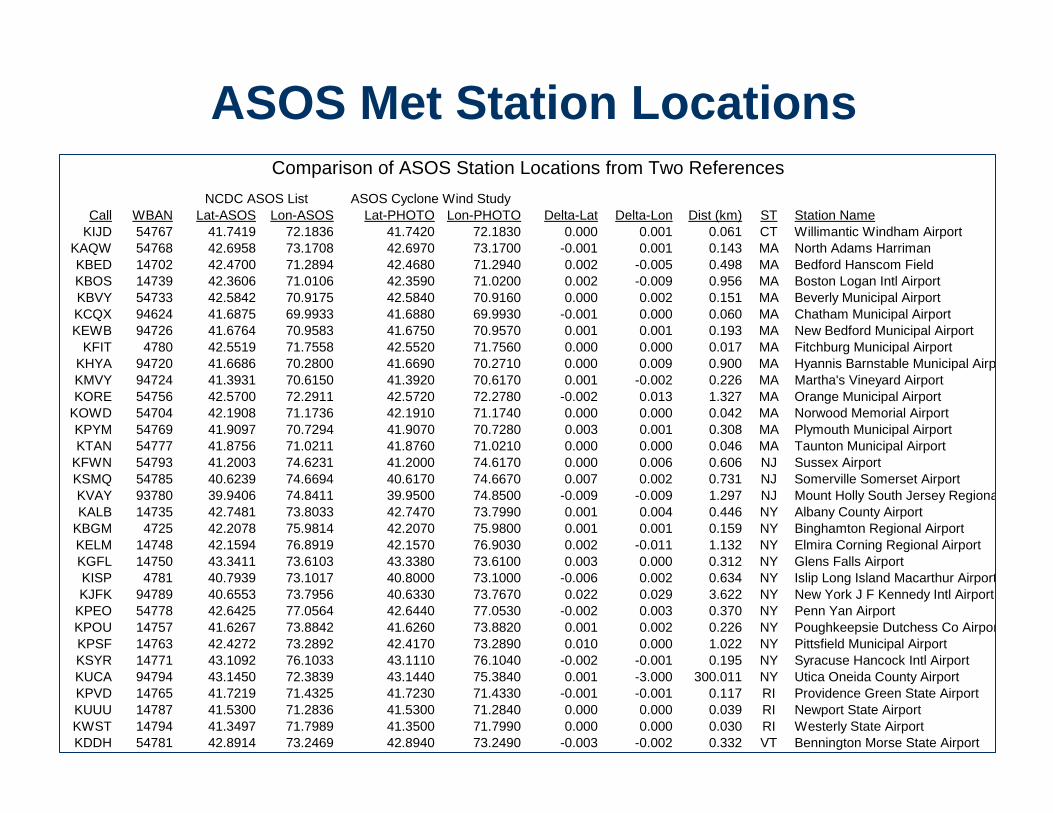
ASOS Met Station Locations
Call WBAN Lat-ASOS Lon-ASOS Lat-PHOTO Lon-PHOTO Delta-Lat Delta-Lon Dist (km) ST Station NameKIJD 54767 41.7419 72.1836 41.7420 72.1830 0.000 0.001 0.061 CT Willimantic Windham Airport
KAQW 54768 42.6958 73.1708 42.6970 73.1700 -0.001 0.001 0.143 MA North Adams HarrimanKBED 14702 42.4700 71.2894 42.4680 71.2940 0.002 -0.005 0.498 MA Bedford Hanscom FieldKBOS 14739 42.3606 71.0106 42.3590 71.0200 0.002 -0.009 0.956 MA Boston Logan Intl AirportKBVY 54733 42.5842 70.9175 42.5840 70.9160 0.000 0.002 0.151 MA Beverly Municipal AirportKCQX 94624 41.6875 69.9933 41.6880 69.9930 -0.001 0.000 0.060 MA Chatham Municipal AirportKEWB 94726 41.6764 70.9583 41.6750 70.9570 0.001 0.001 0.193 MA New Bedford Municipal Airport
KFIT 4780 42.5519 71.7558 42.5520 71.7560 0.000 0.000 0.017 MA Fitchburg Municipal AirportKHYA 94720 41.6686 70.2800 41.6690 70.2710 0.000 0.009 0.900 MA Hyannis Barnstable Municipal AirpKMVY 94724 41.3931 70.6150 41.3920 70.6170 0.001 -0.002 0.226 MA Martha's Vineyard AirportKORE 54756 42.5700 72.2911 42.5720 72.2780 -0.002 0.013 1.327 MA Orange Municipal Airport
KOWD 54704 42.1908 71.1736 42.1910 71.1740 0.000 0.000 0.042 MA Norwood Memorial AirportKPYM 54769 41.9097 70.7294 41.9070 70.7280 0.003 0.001 0.308 MA Plymouth Municipal AirportKTAN 54777 41.8756 71.0211 41.8760 71.0210 0.000 0.000 0.046 MA Taunton Municipal Airport
KFWN 54793 41.2003 74.6231 41.2000 74.6170 0.000 0.006 0.606 NJ Sussex AirportKSMQ 54785 40.6239 74.6694 40.6170 74.6670 0.007 0.002 0.731 NJ Somerville Somerset AirportKVAY 93780 39.9406 74.8411 39.9500 74.8500 -0.009 -0.009 1.297 NJ Mount Holly South Jersey RegionaKALB 14735 42.7481 73.8033 42.7470 73.7990 0.001 0.004 0.446 NY Albany County Airport
KBGM 4725 42.2078 75.9814 42.2070 75.9800 0.001 0.001 0.159 NY Binghamton Regional AirportKELM 14748 42.1594 76.8919 42.1570 76.9030 0.002 -0.011 1.132 NY Elmira Corning Regional AirportKGFL 14750 43.3411 73.6103 43.3380 73.6100 0.003 0.000 0.312 NY Glens Falls AirportKISP 4781 40.7939 73.1017 40.8000 73.1000 -0.006 0.002 0.634 NY Islip Long Island Macarthur AirportKJFK 94789 40.6553 73.7956 40.6330 73.7670 0.022 0.029 3.622 NY New York J F Kennedy Intl Airport
KPEO 54778 42.6425 77.0564 42.6440 77.0530 -0.002 0.003 0.370 NY Penn Yan AirportKPOU 14757 41.6267 73.8842 41.6260 73.8820 0.001 0.002 0.226 NY Poughkeepsie Dutchess Co AirporKPSF 14763 42.4272 73.2892 42.4170 73.2890 0.010 0.000 1.022 NY Pittsfield Municipal AirportKSYR 14771 43.1092 76.1033 43.1110 76.1040 -0.002 -0.001 0.195 NY Syracuse Hancock Intl AirportKUCA 94794 43.1450 72.3839 43.1440 75.3840 0.001 -3.000 300.011 NY Utica Oneida County AirportKPVD 14765 41.7219 71.4325 41.7230 71.4330 -0.001 -0.001 0.117 RI Providence Green State AirportKUUU 14787 41.5300 71.2836 41.5300 71.2840 0.000 0.000 0.039 RI Newport State AirportKWST 14794 41.3497 71.7989 41.3500 71.7990 0.000 0.000 0.030 RI Westerly State AirportKDDH 54781 42.8914 73.2469 42.8940 73.2490 -0.003 -0.002 0.332 VT Bennington Morse State Airport
Comparison of ASOS Station Locations from Two ReferencesNCDC ASOS List ASOS Cyclone Wind Study

Enhance AERSURFACE to support 2001 NLCD data; includes Alaska– Draft Beta-test version completed and being reviewed by
RO’s and AIWG; should be released on SCRAM soonBeta-test version also includes more robust GeoTIFF “Reader” to support wider range of data formats/structures (also in AERMAP for NED data)Supplement NLCD data with estimate of average height of obstacles derived from NED and SRTM elevation data– NLCD categories (both 1992 and 2001) are not ideal for
estimating surface roughness at airports
Future Plans for AERSURFACE

11. Open Water12. Perennial Ice/Snow21. Developed, Open Space - Areas with some constructed materials, but mostly vegetation in the
form of lawn grasses. Impervious surfaces account for less than 20 percent of total cover. 22. Developed, Low Intensity - Areas with a mixture of constructed materials and vegetation.
Impervious surfaces account for 20-49 percent of total cover. 23. Developed, Medium Intensity - Areas with a mixture of constructed materials and vegetation.
Impervious surfaces account for 50-79 percent of the total cover.24. Developed, High Intensity - Highly developed areas, includes apartment complexes, row houses
and commercial/industrial. Impervious surfaces account for 80-100 percent of the total cover.31. Barren Land (Rock/Sand/Clay)32. Unconsolidated Shore41. Deciduous Forest42. Evergreen Forest43. Mixed Forest51. Dwarf Scrub52. Shrub/Scrub71. Grassland/Herbaceous72. Sedge/Herbaceous73. Lichens74. Moss81. Pasture/Hay82. Cultivated Crops90. Woody Wetlands (with additional breakdown for coastal areas)95. Emergent Herbaceous Wetlands (with additional breakdown for coastal areas)
NLCD 2001 Land Cover Class Definitions
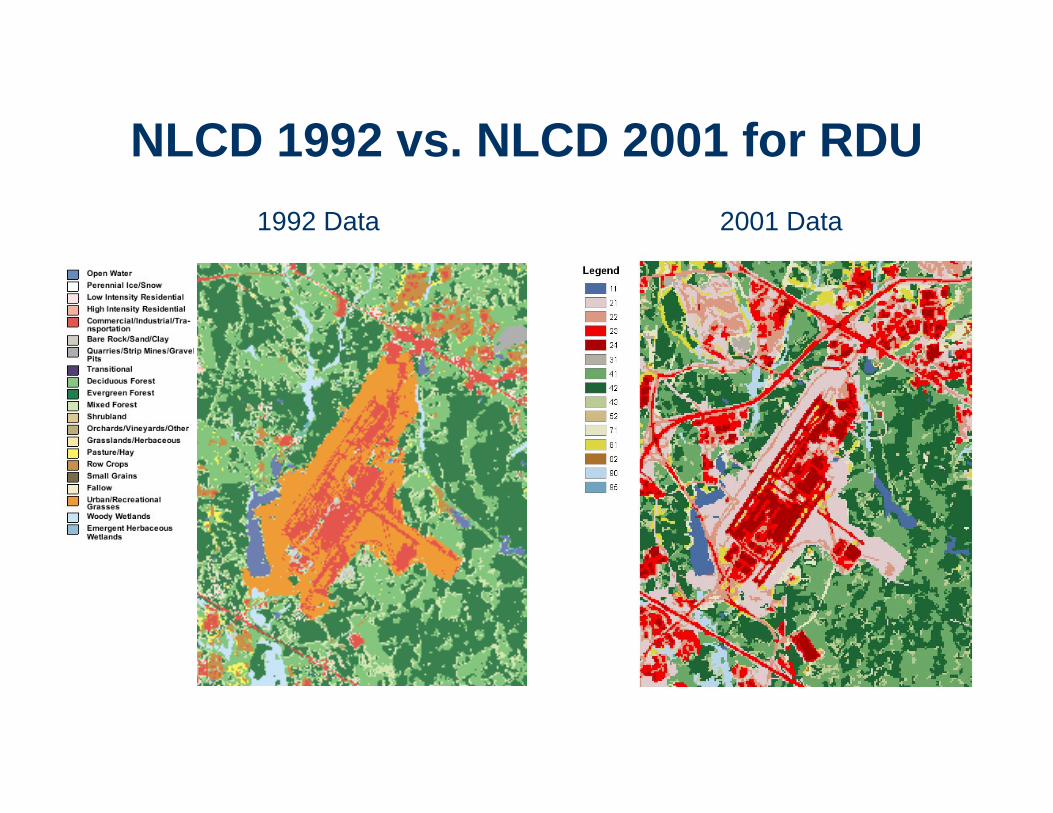
NLCD 1992 vs. NLCD 2001 for RDU1992 Data 2001 Data

NED and SRTM elevation data are both available at 1-sec (~30m) horizontal resolution for most of U.S. (no SRTM in northern AK)
– Same resolution as NLCD data– NED represents ground elevations– SRTM represents elevations of obstacles:
“The elevation data are with respect to the reflective surface, which may be vegetation, man-made features or bare earth.” (USGS Product Description)
Coupling estimates of average height of obstacles with NLCD data should facilitate better estimates of surface roughness
– Allows for distinguishing between “highly developed” grid cells (based on impervious land cover fraction) that are runways vs. buildings
Future Plans for AERSURFACE

NED vs. SRTM Elevations for RDUNED Data SRTM Data

SRTM-NED Elevations for RDUContour Plot of Elevation Differences (m) from SRTM - NED Datafor Raleigh-Durham International Airport; Met Tower Located at (0,0)
-2000 -1500 -1000 -500 0 500 1000 1500 2000-3000
-2500
-2000
-1500
-1000
-500
0
500
1000
1500
2000
X-coordinate (m)
Y-c
oord
inat
e (m
)

SRTM-NED Elevations for RDU

SRTM-NED Elevations for RDU

SRTM-NED Elevations for RDU
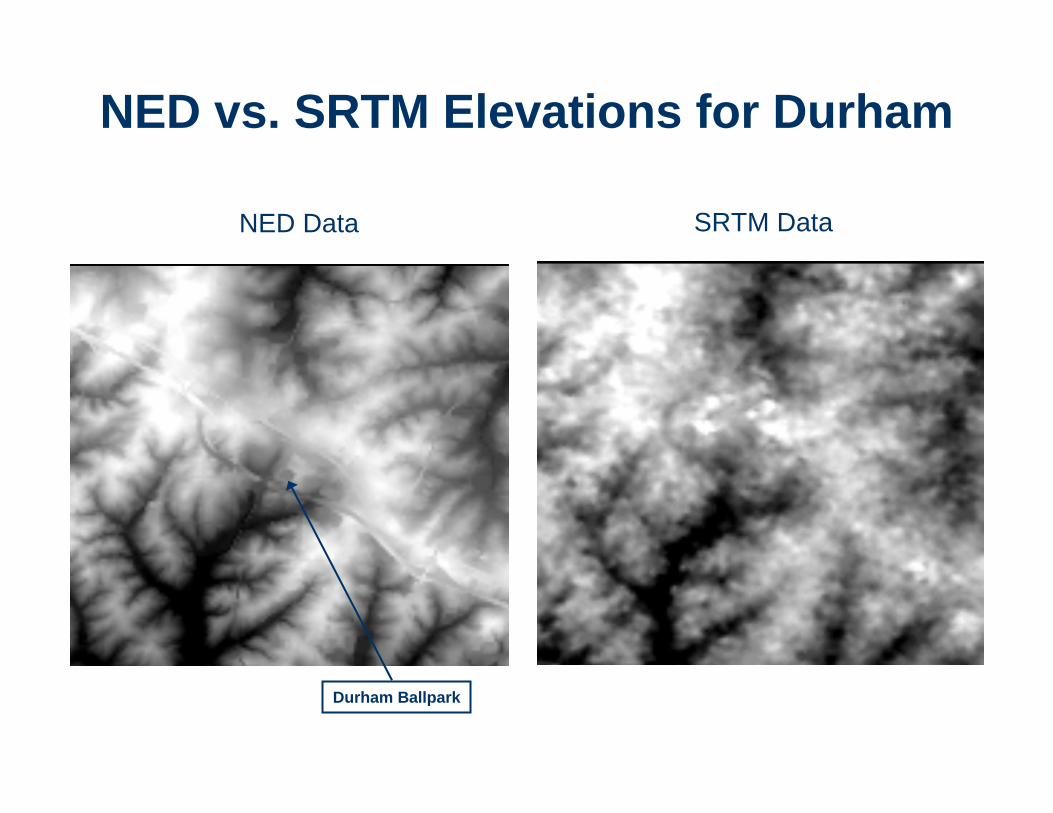
NED vs. SRTM Elevations for Durham
NED Data SRTM Data
Durham Ballpark
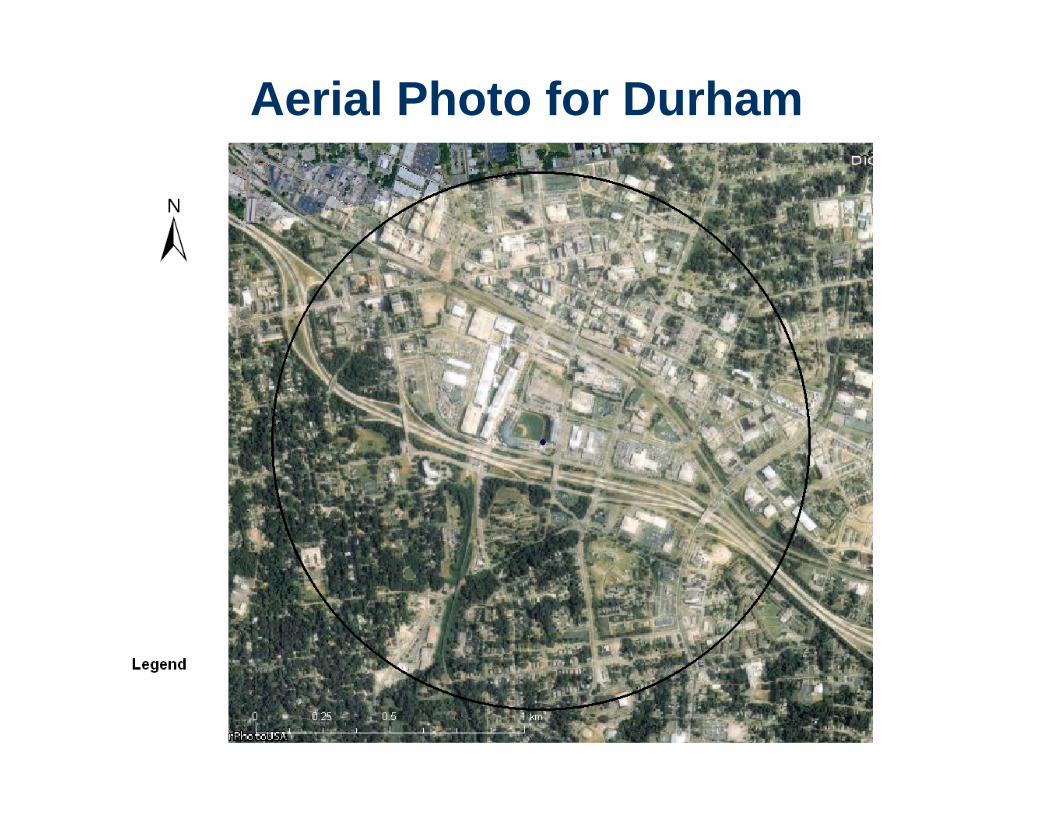
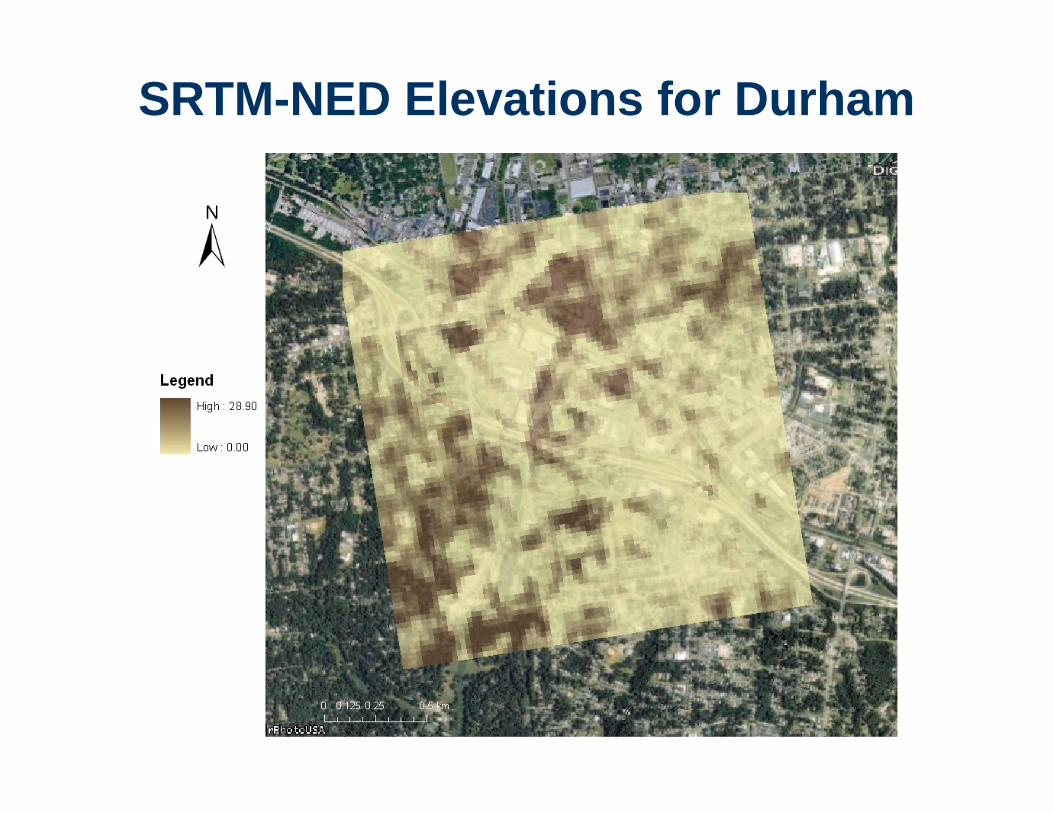
Aerial Photo for Durham

SRTM-NED Elevations for DurhamContour Plot of Elevation Differences (m) from SRTM - NED Data forDowntown Durham; (0,0) = Durham Ballpark - Corner of 1st Baseline
X-coordinate (m)
Y-c
oord
inat
e (m
)
-1000 -800 -600 -400 -200 0 200 400 600 800 1000-1000
-800
-600
-400
-200
0
200
400
600
800
1000

SRTM-NED Elevations for Durham
SRTM-NED Elevations for Durham

NED vs. SRTM Elevations for DC
NED Data SRTM Data

SRTM and 2001 NLCD Data for DC

2001 NLCD Data for Downtown DC

Aerial Photo of Downtown DC
Washington Monument

SRTM-NED Elevations for DCSRTM-NED Elevation Differences (m) for Washington, DC
322000 322500 323000 323500 324000 3245004305000
4305500
4306000
4306500
4307000
4307500

SRTM-NED Elevations for DC

SRTM-NED Elevations for DC

NED vs. SRTM Elevations for Chicago
NED Data SRTM Data

SRTM-NED Elevations for Chicago
-2000 -1500 -1000 -500 0 500 1000 1500 2000-2000
-1500
-1000
-500
0
500
1000
1500
2000
SRTM-NED Elevation Differences (m) for Chicago Area
0
10
20
30
40
50
75
100

One of the main AERMOD implementation issues is sensitivity of meteorology to surface characteristicsAERSURFACE tool provides an objective method for determining surface characteristicsChallenges exist with applicability of NLCD data to our needs, but opportunities exist to improve on current approachUntil recently, EPA dispersion modeling has been “data-limited”, but new data resources are shifting us to a more “data-driven” approach
Summary

Questions?