Embed Size (px)
Citation preview
Aerosol impacts on drizzle properties in warmclouds from ARM Mobile Facility maritimeand continental deploymentsJulian A. L. Mann1, J. Christine Chiu1, Robin J. Hogan1, Ewan J. O’Connor1,2, Tristan S. L’Ecuyer3,Thorwald H. M. Stein1, and Anne Jefferson4
1Department of Meteorology, University of Reading, Reading, UK, 2Finnish Meteorological Institute, Helsinki, Finland,3Department of Atmospheric and Oceanic Sciences, University of Wisconsin-Madison, Madison, Wisconsin, USA,4Cooperative Institute for Research in Environmental Science, University of Colorado Boulder, Boulder, Colorado, USA
Abstract We have extensively evaluated the response of cloud base drizzle rate (Rcb; mmd!1) inwarm clouds to liquid water path (LWP; gm!2) and to cloud condensation nuclei (CCN) numberconcentration (NCCN; cm
!3), an aerosol proxy. This evaluation is based on a 19month long data set ofDoppler radar, lidar, microwave radiometers, and aerosol observing systems from the AtmosphericRadiation Measurement (ARM) Mobile Facility deployments at the Azores and in Germany. Assuming0.55% supersaturation to calculate NCCN, we found a power law Rcb " 0:0015±0:0009# $%LWP 1:68±0:05# $
N! 0:66±0:08# $CCN , indicating that Rcb decreases by a factor of 2–3 as NCCN increases from 200 to 1000 cm!3
for !xed LWP. Additionally, the precipitation susceptibility to NCCN ranges between 0.5 and 0.9, inagreement with values from simulations and aircraft measurements. Surprisingly, the susceptibility ofthe probability of precipitation from our analysis is much higher than that from CloudSat estimatesbut agrees well with simulations from a multiscale high-resolution aerosol-climate model. Althoughscale issues are not completely resolved in the intercomparisons, our results are encouraging,suggesting that it is possible for multiscale models to accurately simulate the response of LWP toaerosol perturbations.
1. Introduction
Warm clouds in the boundary layer represent one of the main causes of the intermodel spread in climateprojections, because models disagree substantially on how warm cloud coverage and properties willchange in a warmer world and in turn feedback on surface temperature [Bony et al., 2006; Soden and Vecchi,2011]. Moreover, aerosols have a strong effect on climate via their potential to modify the properties ofwarm clouds; an increase in aerosol loading could reduce drizzle production, modulate the stability of theboundary layer, and change cloud properties, lifetime, and extent, which is referred to as the secondaerosol indirect effect [Albrecht, 1989; Pincus and Baker, 1994; Lohmann and Feichter, 2005; Feingold et al.,2010]. Recent studies showed that global models signi!cantly overestimate drizzle frequency [Stephenset al., 2010], which calls into question the !delity with which the second aerosol indirect effect is captured[Quaas et al., 2009].
Numerous modeling studies at a wide range of resolutions have shown drizzle suppression for warmclouds in polluted environments [e.g., Ackerman et al., 2004; Guo et al., 2011; H. Wang et al., 2011;M. Wang et al., 2011]. Intensive !eld campaigns for marine stratocumulus in the northeastern Atlantic[Albrecht et al., 1995; Wood, 2005], the northeastern Paci!c [Stevens et al., 2003; van Zanten et al., 2005;Lu et al., 2007, 2009], and the southeastern Paci!c [Comstock et al., 2004; Bretherton et al., 2010; Woodet al., 2011] have also found evidence of an aerosol effect on drizzle suppression. These observationalstudies characterized the dependence of cloud base drizzle rate (Rcb) on liquid water path (LWP) andcloud droplet number concentration (Nd, being sensitive to aerosol perturbations), which were wellreproduced with large-eddy simulations [Geoffroy et al., 2008]. However, other metrics such assusceptibilities of precipitation intensity and probability to aerosol have not shown consistentagreement among observations and simulations [Sorooshian et al., 2009, 2010; Terai et al., 2012; Feingoldet al., 2013].
MANN ET AL. ©2014. American Geophysical Union. All Rights Reserved. 1
PUBLICATIONSJournal of Geophysical Research: Atmospheres
RESEARCH ARTICLE10.1002/2013JD021339
Key Points:• Signi!cant warm-rain suppressionwith increasing aerosol
• Aerosol impact on rain rate agreeswith aircraft measurementsand models
• Aerosol impact on rain probabilityagrees well with multiscaleclimate model
Correspondence to:J. A. L. Mann,[email protected]
Citation:Mann, J. A. L., J. C. Chiu, R. J. Hogan,E. J. O’Connor, T. S. L’Ecuyer, T. H. M. Stein,and A. Jefferson (2014), Aerosol impactson drizzle properties in warm cloudsfrom ARM Mobile Facility maritime andcontinental deployments, J. Geophys. Res.Atmos., 119, doi:10.1002/2013JD021339.
Received 11 DEC 2013Accepted 17 MAR 2014Accepted article online 18 MAR 2014
Precipitation susceptibility (SR) is de!ned as follows:
SR " ! ! ln R# $! ln !# $
; (1)
with !xed LWP, where R is precipitation rate and ! is an aerosol proxy that is often Nd or aerosol index(AI; the product of aerosol optical depth and Ångström exponent). CloudSat observations of precipitatingcumulus show that susceptibility SR to AI monotonically increases with LWP up to 1000 gm!2, similar tothe susceptibility SR to Nd in large-eddy simulations but with different magnitudes due to different choicesof aerosol proxy [Sorooshian et al., 2009]. In contrast, aircraft-based observations have shown a mostly "atresponse of SR to Nd for precipitating clouds with LWP up to 300 gm!2, and when incorporatingnonprecipitating clouds, SR decreases with LWP [Terai et al., 2012]. Feingold et al. [2013] suggested that thetime scale available for collision-coalescence processes in cloud systems could explain the differentresponses of SR to aerosol proxy among simulations and observations. Other studies also point out thatpotential biases in estimates of SR can arise from different choices of minimum R thresholds, spatialaveraging scales, and cloud type among other factors [Duong et al., 2011; McComiskey and Feingold, 2012;Terai et al., 2012].
For susceptibility (SPOP) of the probability of precipitation (POP), de!ned as
SPOP " ! ! ln POP# $! ln !# $ ; (2)
Wang et al. [2012] found that SPOP to AI in satellite observations was insensitive to LWP and 2–5 times smallerthan that in climate models. Although these discrepancies could be partly attributed to the scale differences(as shown by McComiskey and Feingold [2012] for the aerosol impact on cloud albedo), this calls for moreobservational evidence to better understand how precipitation and POP susceptibilities change across a widerange of LWP.
In this paper, we analyze high temporal resolution observations of aerosols, clouds, and drizzle from theAtmospheric Radiation Measurement (ARM) Mobile Facility (AMF) deployments in the Black Forest, Germany,from April to December 2007 and at the Azores from June 2009 to December 2010. Through synergybetween ground-based aerosol observing systems and active and passive remote-sensing instruments, wecan examine aerosol-cloud-drizzle interactions with measurements that are collocated in a way that isdif!cult to replicate in satellite studies, and with higher spatiotemporal resolution than satellite and aircraftstudies. In section 2, we outline the ground-based observations andmethods used to perform our analysis. Insection 3, !rst we provide observational constraints for the response of drizzle properties to aerosolperturbations in warm clouds, and then we examine whether the response from AMF data agrees with resultsfrom state-of-the-art satellite observations and climate models.
2. Ground-Based Observations at the Azores and the Black Forest
The AMF deployments at the Azores and in the Black Forest provide valuable information on marine andcontinental boundary layer clouds, respectively. During the Azores deployment, liquid precipitation, de!nedas a signi!cant radar echo below ceilometer cloud base, occurred ~50% of cloudy times and was often in theform of virga, detailed by Rémillard et al. [2012]. Their study also found the most prevalent types of low cloudsto be cumulus (20%), cumulus under stratocumulus (10–30%), and single-layer stratocumulus (10%). Thedominant aerosol types were likely organic from long-distance continental pollution plumes and sea salt [Pioet al., 2007; Jefferson, 2010], although sea salt generally contributes mainly to mass rather than to aerosolnumber concentration [Blot et al., 2013]. Overall, aerosol amounts at the Azores were low; for asupersaturation of 0.55%, cloud condensation nuclei (CCN) number concentration (NCCN) mainly ranged from20 to 900 cm!3 with a peak at 250 cm!3. In contrast, aerosol amounts during the Black Forest deploymentwere high and dominated by organic aerosols [Jones et al., 2011]; NCCN ranged mostly from 150 to 2300 cm!3
with a peak at 900 cm!3. The occurrence of single-layer water clouds of interest was about 11% in the BlackForest [Ebell et al., 2011].
This study focuses on interdependences between NCCN, liquid water path (LWP), and drizzle rate at cloudbase (Rcb). NCCN was acquired from a Droplet Measurement Technologies CCN counter [Roberts and Nenes,
Journal of Geophysical Research: Atmospheres 10.1002/2013JD021339
MANN ET AL. ©2014. American Geophysical Union. All Rights Reserved. 2
2005] positioned on a 10m high mast, taking measurements every minute and cycling through sevensupersaturations (S) from 0.1% to 1.2% on a 30min basis. We discarded NCCN measurements madeimmediately after the counter changed temperature or supersaturation because the counter is unstable atthese times. As the Azores AMF was located near an airport, we also manually discarded data that wereaffected by exhaust during airplane maneuvers. For each 30min cycle, the mean NCCN for each S wascomputed and used in the relation NCCN = cSk [Twomey, 1959] to derive !t parameters c and k, after whichNCCN can be calculated for a chosen S. In the following analysis, S was chosen to be 0.55% as a best estimateto re"ect the low vertical velocities in marine boundary layer clouds [Martin et al., 1994; Hudson et al., 2010;Wood, 2012], and then linearly interpolated down from 30min to 1min resolution. At the Azores, mixing inthe marine boundary layer is generally driven by cloud top longwave cooling, which does not dependstrongly on the diurnal cycle, and so we assume that surface CCN measurements are representative of cloudbase values over the entire diurnal cycle. At the Black Forest, where strong surface cooling at nighttime cancreate stable surface layers that prevent mixing of aerosol in the boundary layer, we limited our analysis tosolar zenith angles less than 70°. This increases the likelihood that suf!cient surface heating drives boundarylayer mixing, and therefore that surface CCN measurements represent the cloud base values. Note that CCNdata were unavailable at the Azores from January to mid-July 2010 due to an instrument fault.
LWP retrievals are available in the ARM Archive with an uncertainty of 20–30 gm!2 using the method ofTurner et al. [2007]. The retrieval method optimizes LWP estimates by blending microwave radiometermeasurements at 20 s resolution with radiosonde observations and radiative transfer calculations. Thisphysically based method signi!cantly reduces clear-sky bias, a common problem in earlier LWP retrievals. Forour analysis, we excluded periods when the window of the microwave radiometer was wet as the resultingLWP retrievals were unreliable, and the period frommid-July to mid-August 2010 was also excluded due to aninstrument fault. Finally, LWP was averaged to 1min resolution, and any mean values below 20 gm!2
were discarded.
Drizzle rate below cloud, provided by Cloudnet [Illingworth et al., 2007] with 30 s temporal and 43m verticalresolution, is based on a synergy between 94GHz Doppler radar and 524 nm backscatter lidar. The retrievalmethod exploits the fact that the ratio of radar to lidar backscatter power is proportional to the fourth powerof mean drop size to characterize the drizzle drop size distribution, along with shape information fromDoppler spectral width [O’Connor et al., 2005]. The drizzle rate can then be estimated, given the drop sizedistribution and calculated drop terminal velocities, with an overall uncertainty of about 20%. Cloud baseheight from lidar, provided by Cloudnet, was used to select the cloud base drizzle rate Rcb, which was thenaveraged to 1min resolution. Note that the radar was down for 23 days in September 2010 during theAzores deployment.
To ensure the representativeness of derived interdependences between LWP and drizzle rate, the LWP mustcorrespond only to the lowest cloud layer and its associated drizzle detected by radar and lidar. Since themicrowave radiometer is sensitive to the liquid water in all clouds in the pro!le, for cases with multiple liquidwater cloud layers, the LWP is likely to be biased high for a given drizzle rate at lowest cloud base. Therefore,we restrict our analysis to single-layer warm clouds with bases above 170m and tops lower than 3 km—similarto the criteria applied in Rémillard et al. [2012]—and geometrical thicknesses less than 1.5 km. The threshold of1.5 km was chosen to minimize cases of multilayer precipitating clouds that are hard to separate by radarre"ectivity alone and could be erroneously identi!ed as a single-layer cloud. However, we include single-layerwarm clouds with overlying cirrus at a height above the!40°C isotherm, as these cirrus clouds will not containliquid water and so will not bias LWP in our analysis.
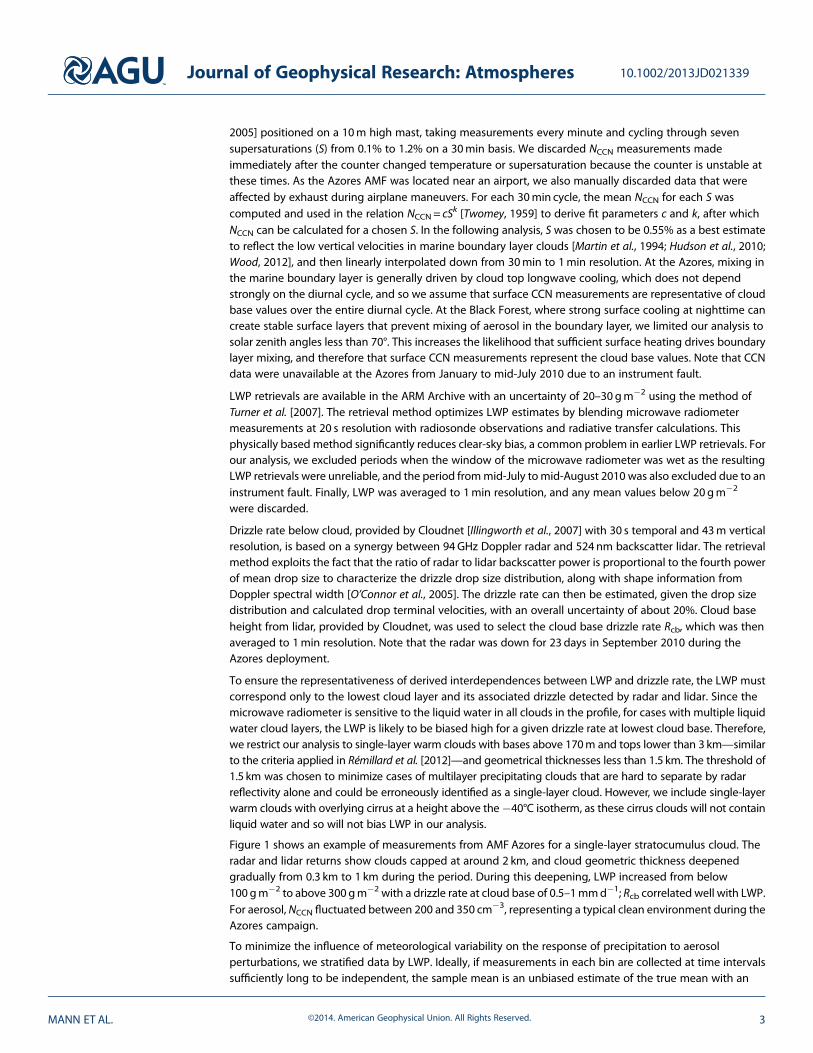
Figure 1 shows an example of measurements from AMF Azores for a single-layer stratocumulus cloud. Theradar and lidar returns show clouds capped at around 2 km, and cloud geometric thickness deepenedgradually from 0.3 km to 1 km during the period. During this deepening, LWP increased from below100 gm!2 to above 300 gm!2 with a drizzle rate at cloud base of 0.5–1mmd!1; Rcb correlated well with LWP.For aerosol, NCCN "uctuated between 200 and 350 cm!3, representing a typical clean environment during theAzores campaign.
To minimize the in"uence of meteorological variability on the response of precipitation to aerosolperturbations, we strati!ed data by LWP. Ideally, if measurements in each bin are collected at time intervalssuf!ciently long to be independent, the sample mean is an unbiased estimate of the true mean with an
Journal of Geophysical Research: Atmospheres 10.1002/2013JD021339
MANN ET AL. ©2014. American Geophysical Union. All Rights Reserved. 3
uncertainty of the standard error. When measurements are collected at time intervals too short to beindependent, the uncertainty increases as the total independent sample size reduces. To take account for theautocorrelation between samples in meteorological data sets, Leith [1973] characterized the time intervalbetween independent samples as twice the e-folding time of the lagged time autocorrelation function. Weanalyzed the lagged time autocorrelation function for 1min Rcb and found the time interval forindependence to be 5min. We then used this 5min independent time interval to count the number ofindependent samples for each bin and calculated the standard error using the corresponding independentsample size.
3. Results3.1. The Response of Drizzle Rate to LWP and NCCN
After selecting single-layer warm clouds in the process described earlier, a 28 day long data set was obtainedout of 19months of available observations from the combined AMF deployments at Azores and the BlackForest. The Azores has relatively few occurrences of high NCCN due to its marine location; the opposite is trueof the continental Black Forest where low NCCN is rare. To ensure that the response of Rcb to NCCN is derivedfrom a greater range of NCCN than is possible at a single site, we combined data from both sites to maximizethe number of NCCN bins and the sample sizes in each NCCN bin. As a result, the percentages of the totalsample size in the lowest, middle, and highest NCCN bin are approximately 40, 40, and 20.
Figure 2 shows mean Rcb as a function of LWP and NCCN at 0.55% supersaturation. Rcb increases with LWP anddecreases with NCCN; the drizzle suppression by increasing aerosol is consistent with the hypothesis thatgreater NCCN redistributes cloud water to more numerous and smaller droplets, reducing collision-coalescence rates. The suppression is also consistent with observations from satellite [Lebsock et al., 2008;L’Ecuyer et al., 2009], aircraft [e.g., Lu et al., 2009], and ground-based instruments [Comstock et al., 2004]. Ingeneral, Rcb decreases by a factor of 2–3 from the lowest to highest NCCN bins across most LWP bins. Note thatdespite differences in typical NCCN ranges between the Azores and Black Forest, the behavior of Rcb versusLWP at both sites individually is similar in the range between 300 and 600 cm!3 where both sites haveample samples.
0
150
300
450
0
150
300
450
0
150
300
450
0
1
2
3
0
1
2
Z (
dBZ
)
!40
!20
0
12 13 14 15 16 17 180
1
2
UTC Time (hours)
10!6
10!5
10!4
(a)
(b)
(c)
(d)
Figure 1. A subset of ARM Mobile Facility measurements on 29 November 2009 at AMFAzores. Time series of (a) cloud con-densation nuclei (CCN) number concentration (NCCN; red) and the potential range of cloud droplet number concentrationderived from NCCN (Nd; blue); and (b) cloud base drizzle rate (Rcb; red) and liquid water path (LWP; blue). The lower and higherbounds of Nd in Figure 1a are estimated using Nd= 0.2 · NCCN from Hudson and Yum [2002] and Nd=0.38 · NCCN+210 fromHegg et al. [2012], respectively (see section 3.1 for details). Time-height plots of (c) radar re"ectivity (Z) and (d) attenuated lidarbackscatter ("); the black lines in the panels show cloud top from the radar and cloud base from the lidar.
Journal of Geophysical Research: Atmospheres 10.1002/2013JD021339
MANN ET AL. ©2014. American Geophysical Union. All Rights Reserved. 4
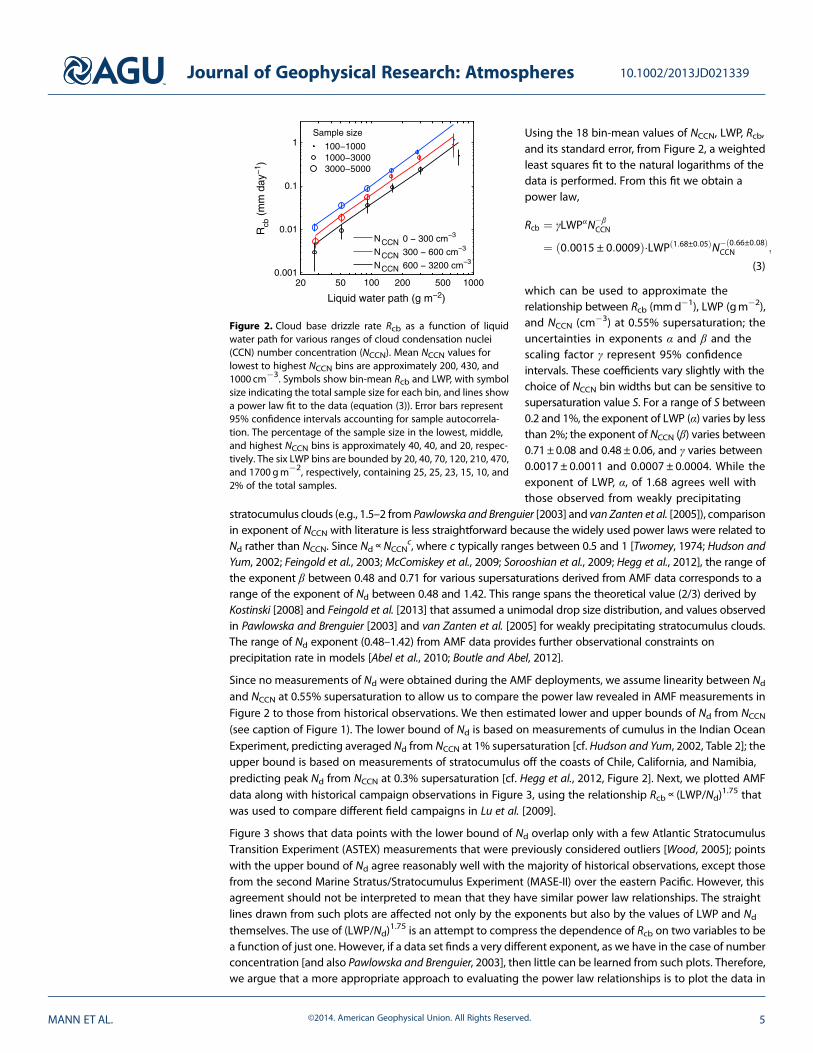
Using the 18 bin-mean values of NCCN, LWP, Rcb,and its standard error, from Figure 2, a weightedleast squares !t to the natural logarithms of thedata is performed. From this !t we obtain apower law,
Rcb " #LWP!N!"CCN
" 0:0015 ± 0:0009# $%LWP 1:68±0:05# $N! 0:66±0:08# $CCN ;
(3)
which can be used to approximate therelationship between Rcb (mmd!1), LWP (gm!2),and NCCN (cm!3) at 0.55% supersaturation; theuncertainties in exponents ! and " and thescaling factor # represent 95% con!denceintervals. These coef!cients vary slightly with thechoice of NCCN bin widths but can be sensitive tosupersaturation value S. For a range of S between0.2 and 1%, the exponent of LWP (!) varies by lessthan 2%; the exponent of NCCN (") varies between0.71± 0.08 and 0.48± 0.06, and # varies between0.0017 ± 0.0011 and 0.0007 ± 0.0004. While theexponent of LWP, !, of 1.68 agrees well withthose observed from weakly precipitating
stratocumulus clouds (e.g., 1.5–2 from Pawlowska and Brenguier [2003] and van Zanten et al. [2005]), comparisonin exponent of NCCN with literature is less straightforward because the widely used power laws were related toNd rather than NCCN. Since Nd!NCCN
c, where c typically ranges between 0.5 and 1 [Twomey, 1974; Hudson andYum, 2002; Feingold et al., 2003; McComiskey et al., 2009; Sorooshian et al., 2009; Hegg et al., 2012], the range ofthe exponent " between 0.48 and 0.71 for various supersaturations derived from AMF data corresponds to arange of the exponent of Nd between 0.48 and 1.42. This range spans the theoretical value (2/3) derived byKostinski [2008] and Feingold et al. [2013] that assumed a unimodal drop size distribution, and values observedin Pawlowska and Brenguier [2003] and van Zanten et al. [2005] for weakly precipitating stratocumulus clouds.The range of Nd exponent (0.48–1.42) from AMF data provides further observational constraints onprecipitation rate in models [Abel et al., 2010; Boutle and Abel, 2012].
Since no measurements of Nd were obtained during the AMF deployments, we assume linearity between Nd
and NCCN at 0.55% supersaturation to allow us to compare the power law revealed in AMF measurements inFigure 2 to those from historical observations. We then estimated lower and upper bounds of Nd from NCCN
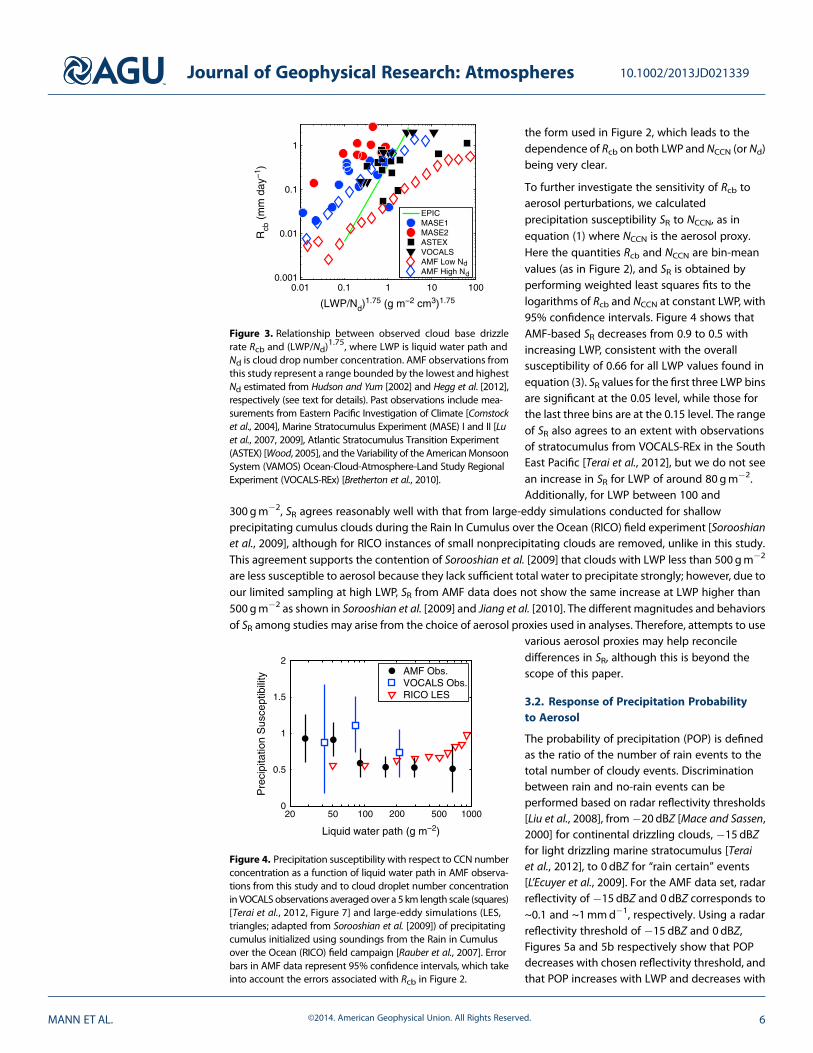
(see caption of Figure 1). The lower bound of Nd is based on measurements of cumulus in the Indian OceanExperiment, predicting averaged Nd from NCCN at 1% supersaturation [cf. Hudson and Yum, 2002, Table 2]; theupper bound is based on measurements of stratocumulus off the coasts of Chile, California, and Namibia,predicting peak Nd from NCCN at 0.3% supersaturation [cf. Hegg et al., 2012, Figure 2]. Next, we plotted AMFdata along with historical campaign observations in Figure 3, using the relationship Rcb! (LWP/Nd)
1.75 thatwas used to compare different !eld campaigns in Lu et al. [2009].
Figure 3 shows that data points with the lower bound of Nd overlap only with a few Atlantic StratocumulusTransition Experiment (ASTEX) measurements that were previously considered outliers [Wood, 2005]; pointswith the upper bound of Nd agree reasonably well with the majority of historical observations, except thosefrom the second Marine Stratus/Stratocumulus Experiment (MASE-II) over the eastern Paci!c. However, thisagreement should not be interpreted to mean that they have similar power law relationships. The straightlines drawn from such plots are affected not only by the exponents but also by the values of LWP and Nd
themselves. The use of (LWP/Nd)1.75 is an attempt to compress the dependence of Rcb on two variables to be
a function of just one. However, if a data set !nds a very different exponent, as we have in the case of numberconcentration [and also Pawlowska and Brenguier, 2003], then little can be learned from such plots. Therefore,we argue that a more appropriate approach to evaluating the power law relationships is to plot the data in
20 50 100 200 500 10000.001
0.01
0.1
1
Liquid water path (g m!2)
NCCN 0 ! 300 cm!3
NCCN 300 ! 600 cm!3
NCCN 600 ! 3200 cm!3
100!10001000!30003000!5000
Sample size
CCN
CCN
CCN
Figure 2. Cloud base drizzle rate Rcb as a function of liquidwater path for various ranges of cloud condensation nuclei(CCN) number concentration (NCCN). Mean NCCN values forlowest to highest NCCN bins are approximately 200, 430, and1000 cm!3. Symbols show bin-mean Rcb and LWP, with symbolsize indicating the total sample size for each bin, and lines showa power law !t to the data (equation (3)). Error bars represent95% con!dence intervals accounting for sample autocorrela-tion. The percentage of the sample size in the lowest, middle,and highest NCCN bins is approximately 40, 40, and 20, respec-tively. The six LWP bins are bounded by 20, 40, 70, 120, 210, 470,and 1700 gm!2, respectively, containing 25, 25, 23, 15, 10, and2% of the total samples.
Journal of Geophysical Research: Atmospheres 10.1002/2013JD021339
MANN ET AL. ©2014. American Geophysical Union. All Rights Reserved. 5
the form used in Figure 2, which leads to thedependence of Rcb on both LWP and NCCN (or Nd)being very clear.
To further investigate the sensitivity of Rcb toaerosol perturbations, we calculatedprecipitation susceptibility SR to NCCN, as inequation (1) where NCCN is the aerosol proxy.Here the quantities Rcb and NCCN are bin-meanvalues (as in Figure 2), and SR is obtained byperforming weighted least squares !ts to thelogarithms of Rcb and NCCN at constant LWP, with95% con!dence intervals. Figure 4 shows thatAMF-based SR decreases from 0.9 to 0.5 withincreasing LWP, consistent with the overallsusceptibility of 0.66 for all LWP values found inequation (3). SR values for the !rst three LWP binsare signi!cant at the 0.05 level, while those forthe last three bins are at the 0.15 level. The rangeof SR also agrees to an extent with observationsof stratocumulus from VOCALS-REx in the SouthEast Paci!c [Terai et al., 2012], but we do not seean increase in SR for LWP of around 80 gm!2.Additionally, for LWP between 100 and
300 gm!2, SR agrees reasonably well with that from large-eddy simulations conducted for shallowprecipitating cumulus clouds during the Rain In Cumulus over the Ocean (RICO) !eld experiment [Sorooshianet al., 2009], although for RICO instances of small nonprecipitating clouds are removed, unlike in this study.This agreement supports the contention of Sorooshian et al. [2009] that clouds with LWP less than 500 gm!2
are less susceptible to aerosol because they lack suf!cient total water to precipitate strongly; however, due toour limited sampling at high LWP, SR from AMF data does not show the same increase at LWP higher than500 gm!2 as shown in Sorooshian et al. [2009] and Jiang et al. [2010]. The different magnitudes and behaviorsof SR among studies may arise from the choice of aerosol proxies used in analyses. Therefore, attempts to use
various aerosol proxies may help reconciledifferences in SR, although this is beyond thescope of this paper.
3.2. Response of Precipitation Probabilityto Aerosol
The probability of precipitation (POP) is de!nedas the ratio of the number of rain events to thetotal number of cloudy events. Discriminationbetween rain and no-rain events can beperformed based on radar re"ectivity thresholds[Liu et al., 2008], from!20 dBZ [Mace and Sassen,2000] for continental drizzling clouds, !15 dBZfor light drizzling marine stratocumulus [Teraiet al., 2012], to 0 dBZ for “rain certain” events[L’Ecuyer et al., 2009]. For the AMF data set, radarre"ectivity of !15 dBZ and 0 dBZ corresponds to~0.1 and ~1mmd!1, respectively. Using a radarre"ectivity threshold of !15 dBZ and 0 dBZ,Figures 5a and 5b respectively show that POPdecreases with chosen re"ectivity threshold, andthat POP increases with LWP and decreases with
20 50 100 200 500 10000
0.5
1
1.5
2AMF Obs.VOCALS Obs.RICO LES
Figure 4. Precipitation susceptibility with respect to CCN numberconcentration as a function of liquid water path in AMF observa-tions from this study and to cloud droplet number concentrationin VOCALS observations averaged over a 5 km length scale (squares)[Terai et al., 2012, Figure 7] and large-eddy simulations (LES,triangles; adapted from Sorooshian et al. [2009]) of precipitatingcumulus initialized using soundings from the Rain in Cumulusover the Ocean (RICO) !eld campaign [Rauber et al., 2007]. Errorbars in AMF data represent 95% con!dence intervals, which takeinto account the errors associated with Rcb in Figure 2.
0.01 0.1 1 10 1000.001
0.01
0.1
1
EPIC ‘MASE1MASE2ASTEXVOCALSAMF Low NAMF High N
d
d
Figure 3. Relationship between observed cloud base drizzlerate Rcb and (LWP/Nd)
1.75, where LWP is liquid water path andNd is cloud drop number concentration. AMF observations fromthis study represent a range bounded by the lowest and highestNd estimated from Hudson and Yum [2002] and Hegg et al. [2012],respectively (see text for details). Past observations include mea-surements from Eastern Paci!c Investigation of Climate [Comstocket al., 2004], Marine Stratocumulus Experiment (MASE) I and II [Luet al., 2007, 2009], Atlantic Stratocumulus Transition Experiment(ASTEX) [Wood, 2005], and the Variability of the AmericanMonsoonSystem (VAMOS) Ocean-Cloud-Atmosphere-Land Study RegionalExperiment (VOCALS-REx) [Bretherton et al., 2010].
Journal of Geophysical Research: Atmospheres 10.1002/2013JD021339
MANN ET AL. ©2014. American Geophysical Union. All Rights Reserved. 6
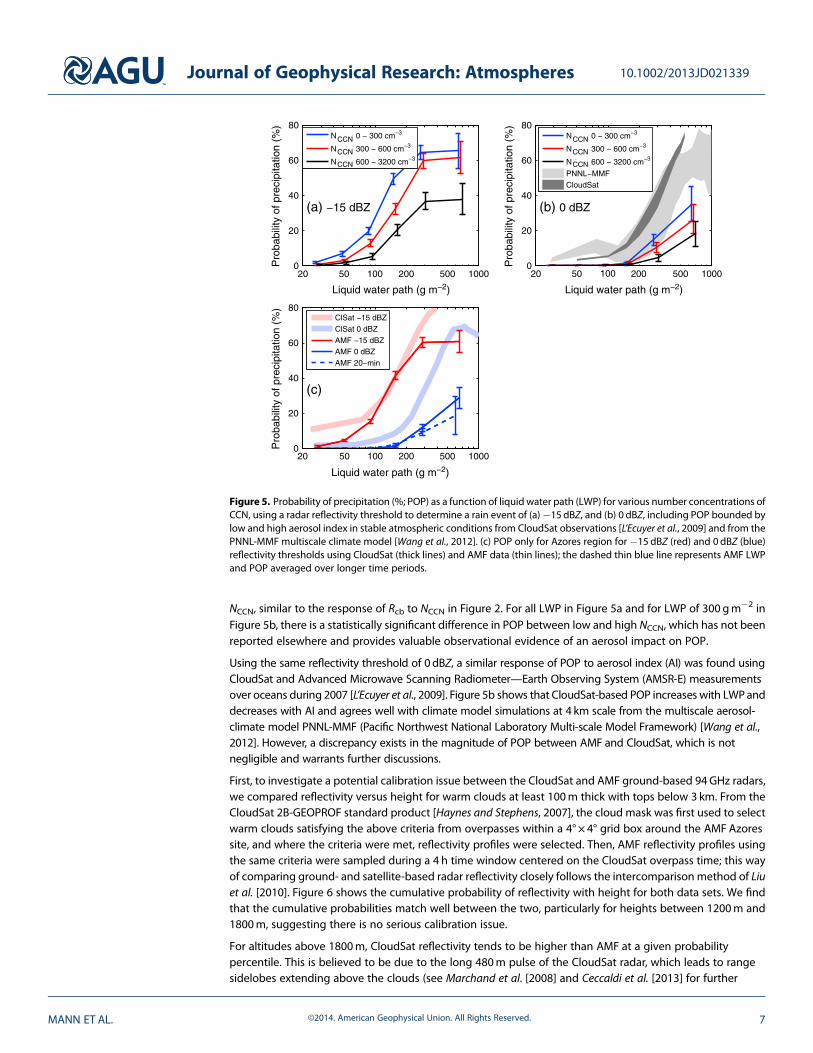
NCCN, similar to the response of Rcb to NCCN in Figure 2. For all LWP in Figure 5a and for LWP of 300 gm!2 inFigure 5b, there is a statistically signi!cant difference in POP between low and high NCCN, which has not beenreported elsewhere and provides valuable observational evidence of an aerosol impact on POP.
Using the same re"ectivity threshold of 0dBZ, a similar response of POP to aerosol index (AI) was found usingCloudSat and Advanced Microwave Scanning Radiometer—Earth Observing System (AMSR-E) measurementsover oceans during 2007 [L’Ecuyer et al., 2009]. Figure 5b shows that CloudSat-based POP increases with LWPanddecreases with AI and agrees well with climate model simulations at 4 km scale from the multiscale aerosol-climate model PNNL-MMF (Paci!c Northwest National Laboratory Multi-scale Model Framework) [Wang et al.,2012]. However, a discrepancy exists in the magnitude of POP between AMF and CloudSat, which is notnegligible and warrants further discussions.
First, to investigate a potential calibration issue between the CloudSat and AMF ground-based 94GHz radars,we compared re"ectivity versus height for warm clouds at least 100m thick with tops below 3 km. From theCloudSat 2B-GEOPROF standard product [Haynes and Stephens, 2007], the cloud mask was !rst used to selectwarm clouds satisfying the above criteria from overpasses within a 4°! 4° grid box around the AMF Azoressite, and where the criteria were met, re"ectivity pro!les were selected. Then, AMF re"ectivity pro!les usingthe same criteria were sampled during a 4 h time window centered on the CloudSat overpass time; this wayof comparing ground- and satellite-based radar re"ectivity closely follows the intercomparison method of Liuet al. [2010]. Figure 6 shows the cumulative probability of re"ectivity with height for both data sets. We !ndthat the cumulative probabilities match well between the two, particularly for heights between 1200m and1800m, suggesting there is no serious calibration issue.
For altitudes above 1800m, CloudSat re"ectivity tends to be higher than AMF at a given probabilitypercentile. This is believed to be due to the long 480m pulse of the CloudSat radar, which leads to rangesidelobes extending above the clouds (see Marchand et al. [2008] and Ceccaldi et al. [2013] for further
20 50 100 200 500 10000
20
40
60
80
Pro
babi
lity
of p
reci
pita
tion
(%)
NCCN 0 ! 300 cm!3
NCCN 300 ! 600 cm!3
NCCN 600 ! 3200 cm!3
20 50 100 200 500 10000
20
40
60
80
Pro
babi
lity
of p
reci
pita
tion
(%)
NCCN 0 ! 300 cm!3
NCCN 300 ! 600 cm!3
NCCN 600 ! 3200 cm!3
PNNL!MMFCloudSat
20 50 100 200 500 10000
20
40
60
80
Liquid water path (g m!2)
Liquid water path (g m!2)Liquid water path (g m!2)P
roba
bilit
y of
pre
cipi
tatio
n (%
)
ClSat !15 dBZClSat 0 dBZAMF !15 dBZAMF 0 dBZAMF 20!min
(a) !15 dBZ
CCN
CCN
CCN
(b) 0 dBZ
(c)
CCN
CCN
CCN
Figure 5. Probability of precipitation (%; POP) as a function of liquid water path (LWP) for various number concentrations ofCCN, using a radar re"ectivity threshold to determine a rain event of (a)!15 dBZ, and (b) 0 dBZ, including POP bounded bylow and high aerosol index in stable atmospheric conditions from CloudSat observations [L’Ecuyer et al., 2009] and from thePNNL-MMF multiscale climate model [Wang et al., 2012]. (c) POP only for Azores region for !15 dBZ (red) and 0 dBZ (blue)re"ectivity thresholds using CloudSat (thick lines) and AMF data (thin lines); the dashed thin blue line represents AMF LWPand POP averaged over longer time periods.
Journal of Geophysical Research: Atmospheres 10.1002/2013JD021339
MANN ET AL. ©2014. American Geophysical Union. All Rights Reserved. 7
discussions). An example of this is provided inFigure 7, which shows AMF radar measurements for1 day when CloudSat overpassed near the Azores,with coplotted cloud tops from the CALIPSOvertical feature mask [Vaughan et al., 2005]. TheCloudSat cloud mask frequently identi!es cloud upto 1 km above the cloud top heights from theCALIPSO mask and those detected by theAMF radar.
Unlike higher altitudes, any difference in thecumulative probability at lower altitudes betweentwo data sets will have an impact on results inFigure 5b. Figure 6 shows that AMF re"ectivitytends to be higher than CloudSat by 2.5 dB ataltitudes below 1200m at a given probabilitypercentile, because the ability of CloudSat to detectcloud with con!dence is reduced due to clutter[Marchand et al., 2008]. Interestingly, thissystematic re"ectivity difference should make AMF
data correspond to higher POP values (due to stronger radar re"ectivity) than CloudSat, which is opposite tothe !nding in Figure 5b. Therefore, the calibration issue (if any) and the cloud mask problem cannot explainthe discrepancy in POP between AMF and CloudSat data.
Second, to investigate whether the discrepancy in Figure 5b is due to regional variations in POP, weconducted the same analysis as L’Ecuyer et al. [2009] only for the region around the Azores (15–30°W; 30–45°N)in 2007–2010, shown in Figure 5c. Compared to Figure 5b, the relationships between POP and LWP fromglobal oceans and the Azores are similar, consistent to the !nding in Tselioudis et al. [2013] that thefrequencies of occurrence of various cloud types in the Azores are surprisingly close to those observedglobally. Additionally, the best agreement in POP between AMF and CloudSat occurs at lower LWP binswith a re"ectivity threshold of !15 dBZ; however, the agreement degrades with increasing LWP and there"ectivity threshold used in rain event discrimination.
Relationships between POP and LWP from satellite observations vary with the choice of LWP retrievals usedin the analysis. POP in Figures 5b and 5c is based on AMSR-E LWP retrieved from a footprint of 12 km. Whenusing LWP from Moderate Resolution Imaging Spectroradiometer (MODIS) measurements with a !ne spatial
Figure 7. A comparison between AMF, CloudSat, and CALIPSO data around the Azores, showing (a) AMF radar re"ectivitybetween 1430 and 1630 UTC on 29 November 2009, as also shown in Figure 1c, and (b) CloudSat re"ectivity from Orbit19095 on the same day, with overpass time at 1530 UTC over the Azores. The coplotted black line indicates the top of theliquid cloud layer identi!ed in the CALIPSO vertical feature mask.
!40 !30 !20 !10 0 10 20500
1000
1500
2000
2500
3000
Reflectivity (dBZ)
Hei
ght (
m)
75% AMF90% AMF95% AMF98% AMF75% CloudSat90% CloudSat95% CloudSat98% CloudSat
Figure 6. Curves of constant cumulative probability of re"ec-tivity with height. At a given height the 95% curve, forexample, intersects the value of re"ectivity Zi whereby 95%of samples at that height have a re"ectivity less than or equalto Zi. AMF Azores curves are shown by solid lines andcircles, and CloudSat curves are shown by dashed linesand triangles.
Journal of Geophysical Research: Atmospheres 10.1002/2013JD021339
MANN ET AL. ©2014. American Geophysical Union. All Rights Reserved. 8
resolution of 1 km, Suzuki et al. [2011] showed that 0 dBZ re"ectivity threshold (cf. Figure 2) yielded 1% and10% POP at LWP of 150 and 300 gm!2, respectively, which agreed well with AMF data; however, theagreement degraded if a threshold of!15 dBZwas used. Since AMSR-E and MODIS-based LWPs are differentnot only in spatial scale but also in their retrieval principles that may lead to some systematic differences[Seethala and Horváth, 2010], it is unclear howmuch the spatial scale difference between AMSR-E and MODISLWPs can be attributed to the discrepancy in POP. In short, POP from AMF data agrees better with results inL’Ecuyer et al. [2009] using!15 dBZ for drizzle discrimination, but agrees better with Suzuki et al. [2011] using0 dBZ. Agreements are best for LWP lower than 300 gm!2; for larger LWP, AMF-based POP values aresubstantially smaller than those from satellite observations, which can be partly due to the limitation ofground-based microwave radiometers in observing clouds with precipitation reaching the ground.
Third, to further investigate if the use of 1min average AMF data has led to the discrepancy in POP, weaveraged our LWP over 20min periods to increase the AMF spatial scale from 600m (with a nominal windspeed of 10m s!1) to 12 km, matching to the spatial scale of AMSR-E footprints. We also averaged radarre"ectivity over 2min periods to better match the 1.5 km footprint of CloudSat. The dashed blue line inFigure 5c shows that averaging over longer time periods not only slightly reduces POP but also shiftsprecipitating events into lower LWP bins, because re"ectivity and LWP are smoothed to lower values. Clearly,a better match in the spatial scales among data products cannot help reduce the discrepancy in POP, which isbroadly consistent with the spatial scale invariance shown in Terai et al. [2012] for clouds with geometricthickness greater than 200m. However, we are aware that the attempt to represent statistics within CloudSatand AMSR-E footprints by averaging AMF data in 2–20min time periods does not completely resolve theissue of spatial scale. A data set with a much longer time period can help obtain a greater sample size of2–20min averaged AMF data, which will in turn provide statistics that better represent those from 2-Dfootprints. For further investigation, such a data set could be provided by the recent addition of the Azores asa !xed observation site by the ARM Climate Research Facility.
After examining issues with calibration, spatial scale, and the use of radar re"ectivity and LWP retrievals, resultssuggest that dedicated intercomparisons not only between ground-based and satellite observations but alsoamong satellite observations themselves over focused regions and longer time periods will greatly help pindown the causes of the POP discrepancy. Furthermore, the ability for ground-based microwave radiometers tomeasure LWP in rainy conditions is needed to produce a more representative POP for clouds with large LWP.
3.3. Susceptibility of Precipitation Probability to Aerosol
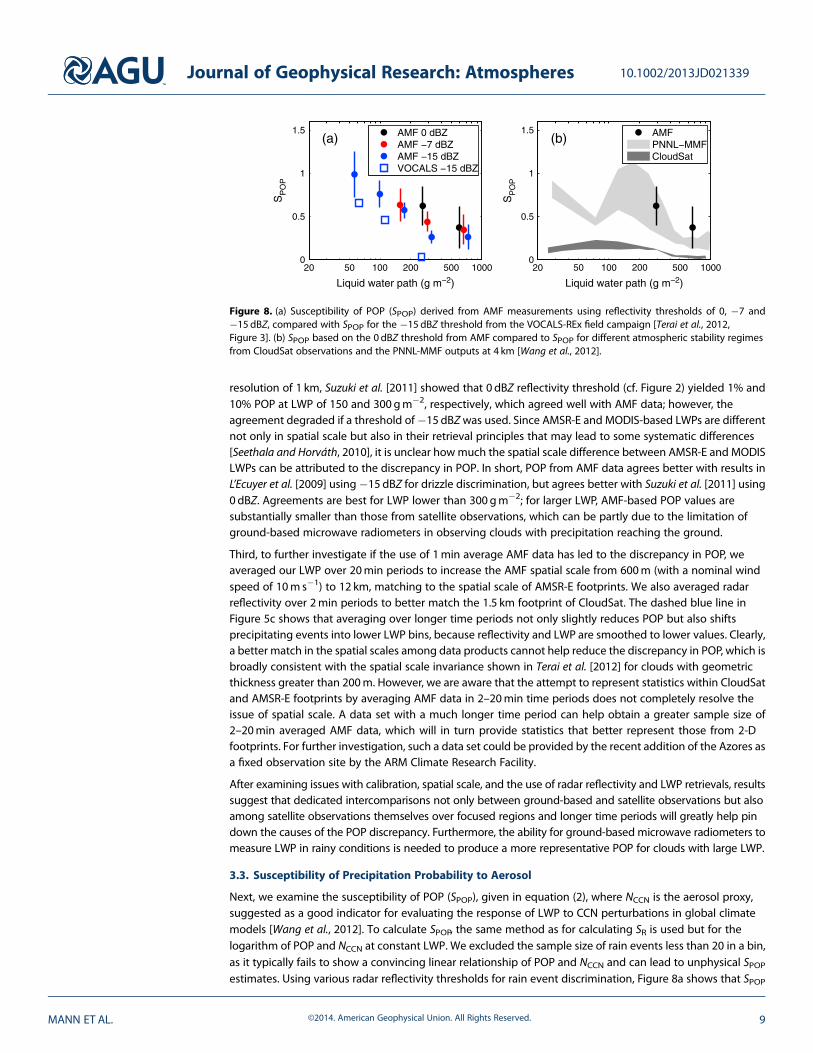
Next, we examine the susceptibility of POP (SPOP), given in equation (2), where NCCN is the aerosol proxy,suggested as a good indicator for evaluating the response of LWP to CCN perturbations in global climatemodels [Wang et al., 2012]. To calculate SPOP, the same method as for calculating SR is used but for thelogarithm of POP and NCCN at constant LWP. We excluded the sample size of rain events less than 20 in a bin,as it typically fails to show a convincing linear relationship of POP and NCCN and can lead to unphysical SPOPestimates. Using various radar re"ectivity thresholds for rain event discrimination, Figure 8a shows that SPOP
20 50 100 200 500 10000
0.5
1
1.5
Liquid water path (g m!2) Liquid water path (g m!2)S
PO
P
AMF 0 dBZAMF !7 dBZAMF !15 dBZVOCALS !15 dBZ
20 50 100 200 500 10000
0.5
1
1.5
SP
OP
AMFPNNL!MMFCloudSat
(b)(a)
Figure 8. (a) Susceptibility of POP (SPOP) derived from AMF measurements using re"ectivity thresholds of 0, !7 and!15 dBZ, compared with SPOP for the !15 dBZ threshold from the VOCALS-REx !eld campaign [Terai et al., 2012,Figure 3]. (b) SPOP based on the 0 dBZ threshold from AMF compared to SPOP for different atmospheric stability regimesfrom CloudSat observations and the PNNL-MMF outputs at 4 km [Wang et al., 2012].
Journal of Geophysical Research: Atmospheres 10.1002/2013JD021339
MANN ET AL. ©2014. American Geophysical Union. All Rights Reserved. 9
from AMF data mainly ranges between 0.2 and 1.0,and its response of SPOP to LWP can be sensitiveto the re"ectivity threshold used. With a lowerthreshold (i.e., !15 dBZ) and thus a larger rainingsample size, Figure 8a shows that SPOP has smalleruncertainty and tends to decrease with LWP, similarto the !nding in Terai et al. [2012] from aircraftobservations in the southeast Paci!c duringVOCALS-REx. Since the autoconversion processdominates precipitation at low LWP while accretionrapidly becomes dominant at higher LWP, thedecrease of SPOP with LWP suggests that aerosolsmore strongly in"uence precipitation initiation, inaccord with other studies [e.g., Wood et al., 2009;Sorooshian et al., 2013].
Focusing again on the 0 dBZ threshold, Figure 8bshows that the magnitude of SPOP agrees well withPNNL-MMF, while the response of SPOP fromCloudSat observations ranges between 0 and 0.2
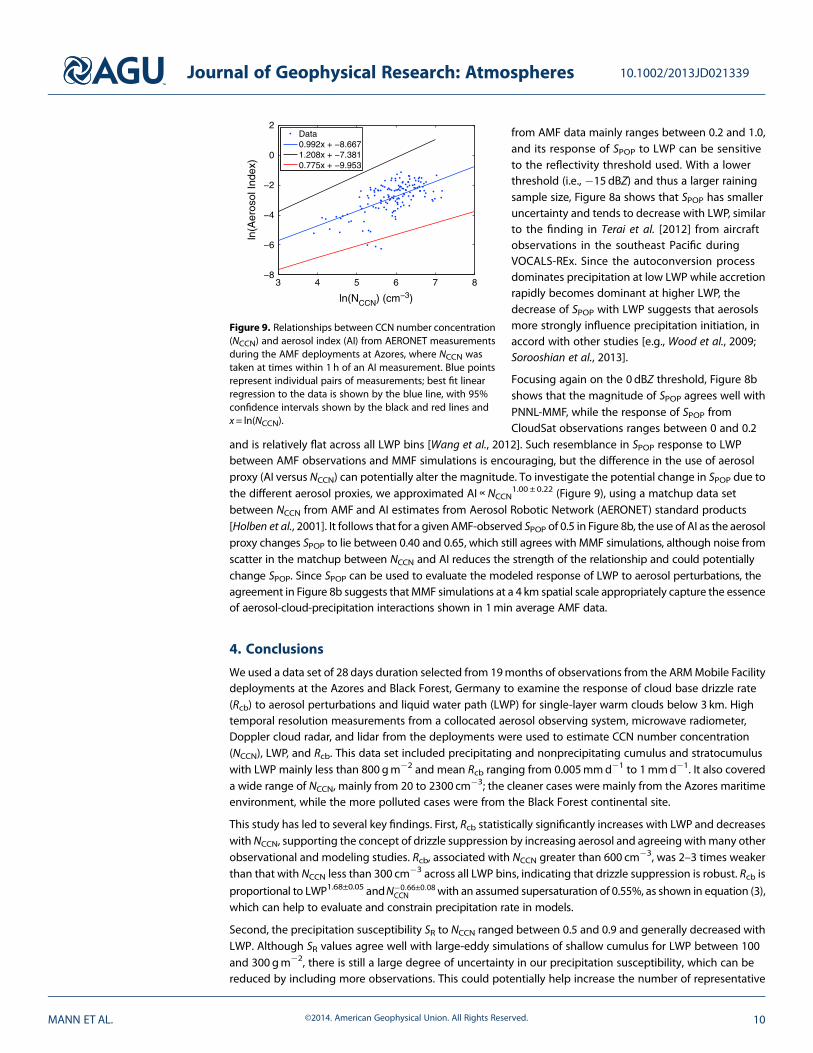
and is relatively "at across all LWP bins [Wang et al., 2012]. Such resemblance in SPOP response to LWPbetween AMF observations and MMF simulations is encouraging, but the difference in the use of aerosolproxy (AI versus NCCN) can potentially alter the magnitude. To investigate the potential change in SPOP due tothe different aerosol proxies, we approximated AI!NCCN
1.00 ± 0.22 (Figure 9), using a matchup data setbetween NCCN from AMF and AI estimates from Aerosol Robotic Network (AERONET) standard products[Holben et al., 2001]. It follows that for a given AMF-observed SPOP of 0.5 in Figure 8b, the use of AI as the aerosolproxy changes SPOP to lie between 0.40 and 0.65, which still agrees with MMF simulations, although noise fromscatter in the matchup between NCCN and AI reduces the strength of the relationship and could potentiallychange SPOP. Since SPOP can be used to evaluate the modeled response of LWP to aerosol perturbations, theagreement in Figure 8b suggests that MMF simulations at a 4 km spatial scale appropriately capture the essenceof aerosol-cloud-precipitation interactions shown in 1min average AMF data.
4. Conclusions
We used a data set of 28 days duration selected from 19months of observations from the ARMMobile Facilitydeployments at the Azores and Black Forest, Germany to examine the response of cloud base drizzle rate(Rcb) to aerosol perturbations and liquid water path (LWP) for single-layer warm clouds below 3 km. Hightemporal resolution measurements from a collocated aerosol observing system, microwave radiometer,Doppler cloud radar, and lidar from the deployments were used to estimate CCN number concentration(NCCN), LWP, and Rcb. This data set included precipitating and nonprecipitating cumulus and stratocumuluswith LWP mainly less than 800 gm!2 and mean Rcb ranging from 0.005mmd!1 to 1mmd!1. It also covereda wide range of NCCN, mainly from 20 to 2300 cm!3; the cleaner cases were mainly from the Azores maritimeenvironment, while the more polluted cases were from the Black Forest continental site.
This study has led to several key !ndings. First, Rcb statistically signi!cantly increases with LWP and decreaseswith NCCN, supporting the concept of drizzle suppression by increasing aerosol and agreeing withmany otherobservational and modeling studies. Rcb, associated with NCCN greater than 600 cm!3, was 2–3 times weakerthan that with NCCN less than 300 cm!3 across all LWP bins, indicating that drizzle suppression is robust. Rcb isproportional to LWP1.68±0.05 andN!0:66±0:08
CCN with an assumed supersaturation of 0.55%, as shown in equation (3),which can help to evaluate and constrain precipitation rate in models.
Second, the precipitation susceptibility SR to NCCN ranged between 0.5 and 0.9 and generally decreased withLWP. Although SR values agree well with large-eddy simulations of shallow cumulus for LWP between 100and 300 gm!2, there is still a large degree of uncertainty in our precipitation susceptibility, which can bereduced by including more observations. This could potentially help increase the number of representative
3 4 5 6 7 8!8
!6
!4
!2
0
2
ln(A
eros
ol In
dex)
Data0.992x + !8.6671.208x + !7.3810.775x + !9.953
Figure 9. Relationships between CCN number concentration(NCCN) and aerosol index (AI) from AERONET measurementsduring the AMF deployments at Azores, where NCCN wastaken at times within 1 h of an AI measurement. Blue pointsrepresent individual pairs of measurements; best !t linearregression to the data is shown by the blue line, with 95%con!dence intervals shown by the black and red lines andx= ln(NCCN).
Journal of Geophysical Research: Atmospheres 10.1002/2013JD021339
MANN ET AL. ©2014. American Geophysical Union. All Rights Reserved. 10
NCCN bins and thus help to reduce errors in SR to tighten constraints on models. Additionally, analysisand intercomparisons of precipitation susceptibility to other aerosol proxies, such as cloud dropletnumber concentration, aerosol optical depth, and AI could help resolve outstanding discrepancies amongvarious studies.
Third, similar to Rcb, the probability of precipitation (POP) also statistically signi!cantly increases withLWP and decreases with NCCN. POP using the !15 dBZ re"ectivity threshold from AMF deploymentsagrees better with CloudSat-based POP that uses AMSR-E LWP, while better agreement in POP is seenwith the CloudSat study using MODIS LWP when using the 0 dBZ threshold. AMF POP is also lower thanPOP from a high-resolution aerosol-climate model, although interestingly, the susceptibility of POP toNCCN (SPOP) agrees well with each other and shows a sign of decrease with LWP. Since autoconversion(accretion) processes tend to dominate at low (high) LWP, this behavior in SPOP suggests that autoconversion-dominated precipitation is more susceptible to aerosol perturbations than accretion-dominated precipitation,as many suggested.
Finally, this study highlights the difference in SPOP between observations from ground-based, aircraft andsatellites, and model simulations. SPOP from AMF data is higher than that from satellites and similar to SPOPfrom aircraft observations and a high-resolution climate model, which treats aerosol effects explicitly in anembedded cloud-resolving model. In particular, the similarity in SPOP with this model suggests that multiscaleclimate models may already be capable of representing aerosol-cloud-precipitation interactions well, andmay not overestimate response of LWP to aerosol perturbations as originally thought. More studies, such asintercomparisons between high-resolution simulations, satellite observations, and ground-basedobservations at !xed sites for longer time periods and for various aerosol proxies, will help reduceuncertainties and provide con!rmation of this.
ReferencesAbel, S. J., D. N. Walters, and G. Allen (2010), Evaluation of stratocumulus cloud prediction in the Met Of!ce forecast model during VOCALS-Rex,
Atmos. Chem. Phys., 10, 10,541–10,559.Ackerman, A. S., M. P. Kirkpatrick, D. E. Stevens, and O. B. Toon (2004), The impact of humidity above stratiform clouds on indirect aerosol
climate forcing, Nature, 432(7020), 1014–1017, doi:10.1038/nature03174.Albrecht, B. A. (1989), Aerosols, cloud microphysics, and fractional cloudiness, Science, 245, 1227–1230, doi:10.1126/science.245.4923.1227.Albrecht, B. A., C. S. Bretherton, D. W. Johnson, W. H. Schubert, and A. S. Frisch (1995), The Atlantic stratocumulus transition experiment
ASTEX, Bull. Am. Meteorol. Soc., 76, 889–904.Blot, R., A. D. Clarke, S. Freitag, V. Kapustin, S. G. Howell, J. B. Jensen, L. M. Shank, C. S. McNaughton, and V. Brekhovskikh (2013), Ultra!ne sea
spray aerosol over the southeastern Paci!c: Open-ocean contributions to marine boundary layer CCN, Atmos. Chem. Phys., 13, 7263–7278.Bony, S., et al. (2006), How well do we understand and evaluate climate change feedback processes?, J. Clim., 19, 3445–3482.Boutle, I. A., and S. J. Abel (2012), Microphysical controls on the stratocumulus topped boundary-layer structure during VOCALS-REx, Atmos.
Chem. Phys., 12, 2849–2863.Bretherton, C. S., R. Wood, R. C. George, D. Leon, G. Allen, and X. Zheng (2010), Southeast paci!c stratocumulus clouds, precipitation and
boundary layer structure sampled along 20°S during VOCALS-REX, Atmos. Chem. Phys., 10, 10,639–10,654, doi:10.5194/acp-10-10639-2010.Ceccaldi, M., J. Delanoë, R. J. Hogan, N. L. Pounder, A. Protat, and J. Pelon (2013), From CloudSat-CALIPSO to EarthCare: Evolution of the DARDAR
cloud classi!cation and its comparison to airborne radar-lidar observations, J. Geophys. Res. Atmos., 118, 7962–7981, doi:10.1002/jgrd.50579.Comstock, K. K., R. Wood, S. A. Yuter, and C. S. Bretherton (2004), Re"ectivity and rain rate in and below drizzling stratocumulus, Q. J. R.
Meteorol. Soc., 130, 2891–2918, doi:10.1256/qj.03.187.Duong, H. T., A. Sorooshian, and G. Feingold (2011), Investigating potential biases in observed and modeled metrics of aerosol-cloud-
precipitation interactions, Atmos. Chem. Phys., 11, 4027–4037.Ebell, K., S. Crewell, U. Lohnert, D. D. Turner, and E. J. O’Connor (2011), Cloud statistics and cloud radiative effect for a low-mountain site,
Q. J. R. Meteorol. Soc., 137, 306–324.Feingold, G., W. L. Eberhard, D. E. Veron, andM. Previdi (2003), First measurements of the Twomey indirect effect using ground-based remote
sensors, Geophys. Res. Lett., 30(6), 1287, doi:10.1029/2002GL016633.Feingold, G., I. Koren, H. Wang, H. Xue, and W. A. Brewer (2010), Precipitation-generated oscillations in open cellular cloud !elds, Nature, 466,
849–852, doi:10.1038/nature09314.Feingold, G., A. McComiskey, D. Rosenfeld, and A. Sorooshian (2013), On the relationship between cloud contact time and precipitation
susceptibility to aerosol, J. Geophys. Res. Atmos., 118, 10,544–10,554, doi:10.1002/jgrd.50819.Geoffroy, O., J.-L. Brenguier, and I. Sandu (2008), Relationship between drizzle rate, liquid water path and droplet concentration at the scale
of a stratocumulus cloud system, Atmos. Chem. Phys., 8, 4641–4654.Guo, H., J.-C. Golaz, and L. J. Donner (2011), Aerosol effects on stratocumulus water paths in a PDF-based parameterization, Geophys. Res.
Lett., 38, L17808, doi:10.1029/2011GL048611.Haynes, J. M., and G. L. Stephens (2007), Tropical oceanic cloudiness and the incidence of precipitation: Early results from CloudSat, Geophys.
Res. Lett., 34, L09811, doi:10.1029/2007GL029335.Hegg, D. A., D. S. Covert, H. H. Jonsson, and R. K. Woods (2012), A simple relationship between cloud drop number concentration and pre-
cursor aerosol concentration for the regions of Earth’s large marine stratocumulus decks, Atmos. Chem. Phys., 12, 1229–1238.Holben, B. N., et al. (2001), An emerging ground-based aerosol climatology: Aerosol optical depth from AERONET, J. Geophys. Res., 106(D11),
12,067–12,097, doi:10.1029/2001JD900014.
Journal of Geophysical Research: Atmospheres 10.1002/2013JD021339
MANN ET AL. ©2014. American Geophysical Union. All Rights Reserved. 11
AcknowledgmentsThis research was supported by astudentship from the UK NaturalEnvironment Research Council (NERC;reference NE/I528569/1), and by grantDE-SC0007233 from the Of!ce ofScience (BER), U.S. Department ofEnergy. We would like to thank RobertWood and the two anonymousreviewers for their thorough and helpfulcomments to improve our manuscript.We are very grateful to Thomas Bell andJochen Broecker for their help with thestatistics of our data set. We also thankGraham Feingold, Allison McComiskey,Chris Terai, Minghuai Wang, and ChrisWestbrook for stimulating discussionsand Colin O’Dowd and Ciaran Monahanfor their helpful insight regardingground-based instrumentation andaerosol measurements.
Hudson, J. G., and S. S. Yum (2002), Cloud condensation nuclei spectra and polluted and clean clouds over the Indian Ocean, J. Geophys. Res.,107(D19), 8022, doi:10.1029/2001JD000829.
Hudson, J. G., S. Noble, and V. Jha (2010), Stratus cloud supersaturations, Geophys. Res. Lett., 37, L21813, doi:10.1029/2010GL045197.Illingworth, A. J., et al. (2007), Continuous evaluation of cloud pro!les in seven operational models using ground-based observations, Bull.
Am. Meteorol. Soc., 88, 1–16, doi:10.1175/BAMS-88-6.Jefferson, A. (2010), Empirical estimates of CCN from optical properties at four remote sites, Atmos. Chem. Phys., 10, 6855–6861, doi:10.5194/
acp-10-6855-2010.Jiang, H., G. Feingold, and A. Sorooshian (2010), Effect of aerosol on the susceptibility and ef!ciency of precipitation in warm trade cumulus
clouds, J. Atmos. Sci., 67, 3525–3540.Jones, H. M., J. Crosier, A. Russell, M. J. Flynn, M. Irwin, T. W. Choularton, H. Coe, and G. McFiggans (2011), In situ aerosol measurements taken
during the 2007 COPS !eld campaign at the hornisgrinde ground site, Q. J. R. Meteorol. Soc., 137, 252–266, doi:10.1002/qj.727.Kostinski, A. B. (2008), Drizzle rates versus cloud depths for marine stratocumuli, Environ. Res. Lett., 3, doi:10.1088/1748-9326/3/4/045019.Lebsock, M. D., G. L. Stephens, and C. Kummerow (2008), Multisensor satellite observations of aerosol effects on warm clouds, J. Geophys.
Res., 113, D15205, doi:10.1029/2008JD009876.L’Ecuyer, T. S., W. Berg, J. Haynes, M. Lebsock, and T. Takemura (2009), Global observations of aerosol impacts on precipitation occurrence in
warm maritime clouds, J. Geophys. Res., 114, D09211, doi:10.1029/2008JD011273.Leith, C. E. (1973), The standard error of time-average estimates of climatic means, J. Appl. Meteorol., 12, 1066–1069, doi:10.1175/2009JAS3071.1.Liu, Y., B. Geerts, M. Miller, P. Daum, and R. McGraw (2008), Threshold radar re"ectivity for drizzling clouds, Geophys. Res. Lett., 35, L03807,
doi:10.1029/2007GL031201.Liu, Z., R. Marchand, and T. Ackerman (2010), A comparison of observations in the tropical western Paci!c from ground-based and satellite
millimeter-wavelength cloud radars, J. Geophys. Res., 115, D24206, doi:10.1029/2009JD013575.Lohmann, U., and J. Feichter (2005), Global indirect aerosol effects: A review, Atmos. Chem. Phys., 5, 715–737.Lu, M.-L., W. C. Conant, H. H. Jonsson, V. Varutbangkul, R. C. Flagan, and J. H. Seinfeld (2007), The marine stratus/stratocumulus experiment
(MASE): Aerosol-cloud relationships in marine stratocumulus, J. Geophys. Res., 112, D10209, doi:10.1029/2006JD007985.Lu, M.-L., A. Sorooshian, H. H. Jonsson, G. Feingold, R. C. Flagan, and J. H. Seinfeld (2009), Marine stratocumulus aerosol cloud relationships in the
MASE-II experiment: Precipitation susceptibility in eastern Paci!cmarine stratocumulus, J. Geophys. Res., 114, D24203, doi:10.1029/2009JD012774.Mace, G. G., and K. Sassen (2000), A constrained algorithm for retrieval of stratocumulus cloud properties using solar radiation, microwave
radio-meter, and millimeter cloud radar data, J. Geophys. Res., 105, 29,099–29,108.Marchand, R., G. G. Mace, T. Ackerman, and G. L. Stephens (2008), Hydrometeor detection using CloudSat—An Earth-orbiting 94-GHz cloud
radar, J. Atmos. Oceanic Technol., 25, 519–533.Martin, G., D. Johnson, and A. Spice (1994), The measurement and parameterization of effective radius of droplets in warm stratocumulus
clouds, J. Atmos. Sci., 51, 1823–1842.McComiskey, A., and G. Feingold (2012), The scale problem in quantifying aerosol indirect effects, Atmos. Chem. Phys., 12(2), 1031–1049,
doi:10.5194/acp-12-1031-2012.McComiskey, A., G. Feingold, A. S. Frisch, D. D. Turner, M. A. Miller, J. C. Chiu, Q. L. Min, and J. A. Ogren (2009), An assessment of aerosol-cloud
interactions in marine stratus clouds based on surface remote sensing, J. Geophys. Res., 114, doi:10.1029/2008JD011006.O’Connor, E. J., R. J. Hogan, and A. J. Illingworth (2005), Retrieving stratocumulus drizzle parameters using Doppler radar and lidar, J. Appl.
Meteorol., 44, 14–27.Pawlowska, H., and J.-L. Brenguier (2003), An observational study of drizzle formation in stratocumulus clouds for general circulation model
(GCM) parameterizations, J. Geophys. Res., 108(D15), 8630, doi:10.1029/2002JD002679.Pincus, R., and M. B. Baker (1994), Effect of precipitation on the albedo susceptibility of clouds in the marine boundary-layer, Nature, 372,
250–252, doi:10.1038/372250a0.Pio, C. A., et al. (2007), Climatology of aerosol composition (organic versus inorganic) at nonurban sites on a west-east transect across Europe,
J. Geophys. Res., 112, D23S02, doi:10.1029/2006JD008038.Quaas, J., et al. (2009), Aerosol indirect effects—General circulation model intercomparison and evaluation with satellite data, Atmos. Chem.
Phys., 9, 8697–8717.Rauber, R. M., et al. (2007), Rain in shallow cumulus over the ocean: The RICO campaign, Bull. Am. Meteorol. Soc., 88, 1912–1928.Rémillard, J., P. Kollias, E. Luke, and R. Wood (2012), Marine boundary layer cloud observations at the Azores, J. Clim., 25, 7381–7398.Roberts, G. C., and A. Nenes (2005), A continuous-"ow streamwise thermal-gradient CCN chamber for atmospheric measurements, Aer. Sci.
Tech., 39, 206–221, doi:10.1080/027868290913988.Seethala, C., and Á. Horváth (2010), Global assessment of AMSR-E and MODIS cloud liquid water path retrievals in warm oceanic clouds,
J. Geophys. Res., 115, D13202, doi:10.1029/2009JD012662.Soden, B., and G. Vecchi (2011), The vertical distribution of cloud feedback in coupled ocean-atmosphere models, Geophys. Res. Lett., 38,
L12704, doi:10.1029/2011GL047632.Sorooshian, A., G. Feingold, M. D. Lebsock, H. Jiang, and G. L. Stephens (2009), On the precipitation susceptibility of clouds to aerosol per-
turbations, Geophys. Res. Lett., 36, L13803, doi:10.1029/2009GL038993.Sorooshian, A., G. Feingold, M. D. Lebsock, H. Jiang, and G. L. Stephens (2010), Deconstructing the precipitation susceptibility construct:
Improving methodology for aerosol-cloud precipitation studies, J. Geophys. Res., 115, D17201, doi:10.1029/2009JD013426.Sorooshian, A., Z. Wang, G. Feingold, and T. S. L’Ecuyer (2013), A satellite perspective on cloud water to rain water conversion rates and
relationships with environmental conditions, J. Geophys. Res. Atmos., 118, 6643–6650, doi:10.1002/jgrd.50523.Stephens, G., T. L’Ecuyer, R. Forbes, A. Gettlemen, J.-C. Golaz, A. Bodas-Salcedo, K. Suzuki, P. Gabriel, and J. Haynes (2010), Dreary state of
precipitation in global models, J. Geophys. Res., 115, D24211, doi:10.1029/2010JD014532.Stevens, B., et al. (2003), Dynamics and chemistry of marine stratocumulus - DYCOMS-II, Bull. Am. Meteorol. Soc., 84, doi:10.1175/BAMS-84-5.579.Suzuki, K., G. L. Stephens, S. C. van den Heever, and T. Y. Nakajima (2011), Diagnosis of the warm rain process in cloud-resolving models using
joint CloudSat and MODIS observations, J. Atmos. Sci., 68, 2655–2670, doi:10.1175/JAS-D-10-05026.1.Terai, C. R., R. Wood, D. C. Leon, and P. Zuidema (2012), Does precipitation susceptibility vary with increasing cloud thickness in marine
stratocumulus?, Atmos. Chem. Phys., 12, 4567–4583.Tselioudis, G., et al. (2013), Global weather states and their properties from passive and active satellite cloud retrievals, J. Clim., 26,
7734–7746.Turner, D. D., S. A. Clough, J. C. Liljegren, E. E. Clothiaux, K. E. Cady-Pereira, and K. L. Gaustad (2007), Retrieving liquid water path and precipitable
water vapor from the atmospheric radiation measurement (arm) microwave radiometers, IEEE Trans. Geosci. Remote Sens., 45, 3680–3690,doi:10.1109/tgrs.2007.903703.
Journal of Geophysical Research: Atmospheres 10.1002/2013JD021339
MANN ET AL. ©2014. American Geophysical Union. All Rights Reserved. 12
Twomey, S. (1959), The nuclei of natural cloud formation: Part II: The supersaturation in natural clouds and the variation of cloud dropletconcentration, Pure Appl. Geophys., 43, 243–249.
Twomey, S. (1974), Pollution and planetary albedo, Atmos. Environ., 8, 1251–1256.van Zanten, M. C., B. Stevens, G. Vali, and D. L. Lenschow (2005), Observations of drizzle in nocturnal marine stratocumulus, J. Atmos. Sci., 62,
88–106.Vaughan, M., D. Winker, and K. Powell (2005), CALIOP Algorithm Theoretical Basis Document, Part 2: Feature detection and layer
properties algorithms, PC-SCI-202.01, 87 pp., NASA Langley Res. Cent., Hampton, VA. [Available at http://www-calipso.larc.nasa.gov/resources/project_documentation.php.]
Wang, H., P. J. Rasch, and G. Feingold (2011), Manipulating marine stratocumulus cloud amount and albedo: A process-modelling study ofaerosol-cloud-precipitation interactions in response to injection of cloud condensation nuclei, Atmos. Chem. Phys., 11, 4237–4249.
Wang, M., S. Ghan, M. Ovchinnikov, X. Liu, R. Easter, E. Kassianov, Y. Qian, and H. Morrison (2011), Aerosol indirect effects in a multi-scaleaerosol-climate model PNNL-MMF, Atmos. Chem. Phys., 11, 5431–5455, doi:10.5194/acp-11-5431-2011.
Wang, M., et al. (2012), Constraining cloud lifetime effects of aerosols using A-Train satellite observations, Geophys. Res. Lett., 39, L15709,doi:10.1029/2012GL052204.
Wood, R. (2005), Drizzle in stratiform boundary layer clouds. Part I: Vertical and horizontal structure, J. Atmos. Sci., 62, 3011–3033.Wood, R. (2012), Stratocumulus clouds, Mon. Weather Rev., 140, 2373–2423, doi:10.1175/MWR-D-11-00121.1.Wood, R., T. L. Kubar, and D. L. Hartmann (2009), Understanding the importance of microphysics and macrophysics for warm rain in marine
low clouds. Part II: Heuristic models of rain formation, J. Atmos. Sci., 66, 2973–2990, doi:10.1175/2009JAS3072.1.Wood, R., et al. (2011), The VAMOS Ocean-Cloud-Atmosphere-Land Study Regional Experiment (VOCALS-REX): Goals, platforms, and !eld
operations, Atmos. Chem. Phys., 11, 627–654, doi:10.5194/acp-11-627-2011.
Journal of Geophysical Research: Atmospheres 10.1002/2013JD021339
MANN ET AL. ©2014. American Geophysical Union. All Rights Reserved. 13


![Aerosol impacts on clouds and precipitation in eastern ...zli/PDF_papers/2011JD016537.pdf2.2. Stratus Clouds (SC) [8] The nimbostratus and stratus clouds formed on November 17 at the](https://img.pdfslide.us/doc/110x75/605396a0365ae66127395d15/aerosol-impacts-on-clouds-and-precipitation-in-eastern-zlipdfpapers-22.jpg)