Embed Size (px)
Citation preview

Aerosol Formation in the Atmosphere
David CockerDepartment of Chemical and Environmental Engineering
CE-CERT

Program Goal• Development of a detailed chemical mechanism
for the prediction of ozone, toxics, and secondary organic aerosol(SOA) formation within the atmosphere
– Studies of ozone and SOA at VOC and NOx levels similar to the urban atmosphere
– Investigation of gas-particle partitioning of semi-volatile compounds in the presence of ambient particle loadings
– Improved interpretation of ambient data obtained using aerosol mass spectrometers
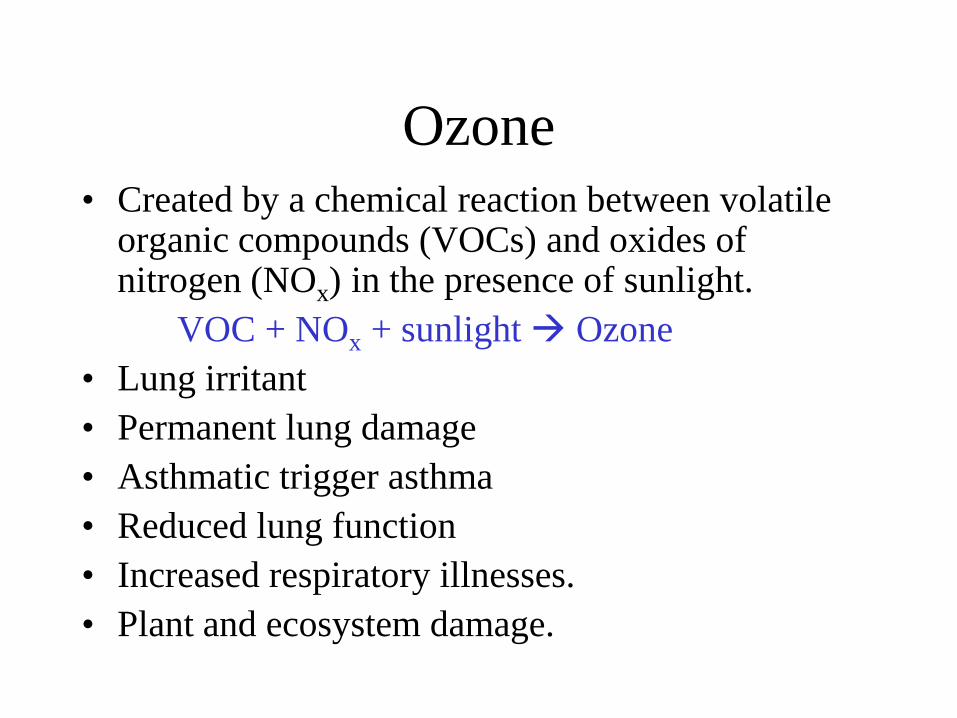
Ozone• Created by a chemical reaction between volatile
organic compounds (VOCs) and oxides of nitrogen (NOx) in the presence of sunlight.
VOC + NOx + sunlight Ozone• Lung irritant• Permanent lung damage• Asthmatic trigger asthma• Reduced lung function• Increased respiratory illnesses. • Plant and ecosystem damage.

U.S. Counties in non-attainment for Phase II Ozone Rule, 2005
(0.08 ppm for 8 hr standard)
www.epa.gov
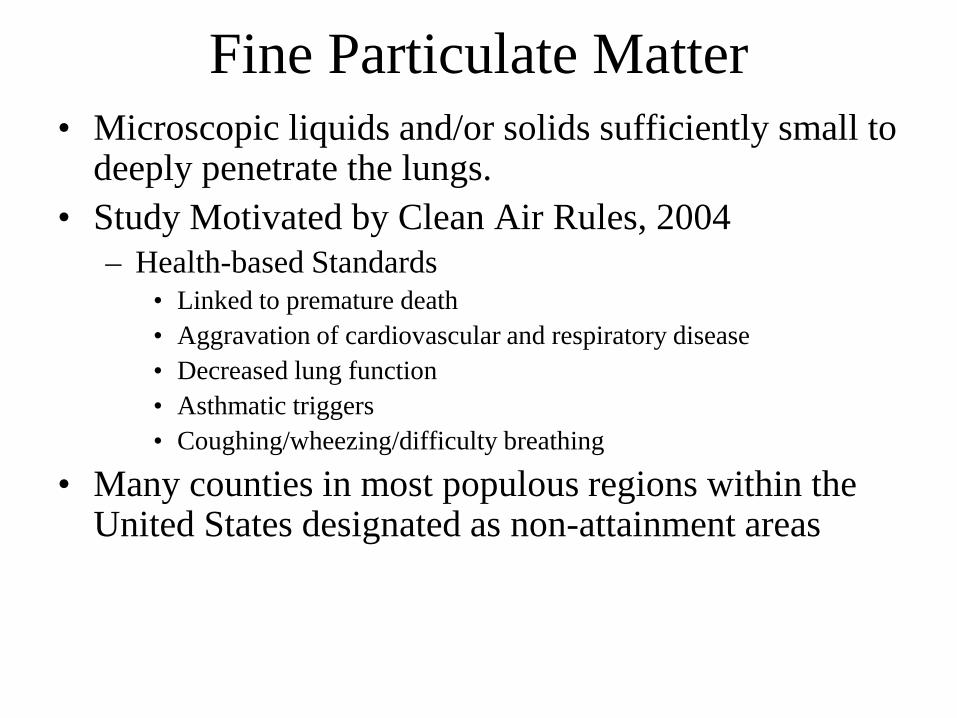
Fine Particulate Matter• Microscopic liquids and/or solids sufficiently small to
deeply penetrate the lungs. • Study Motivated by Clean Air Rules, 2004
– Health-based Standards• Linked to premature death • Aggravation of cardiovascular and respiratory disease• Decreased lung function• Asthmatic triggers• Coughing/wheezing/difficulty breathing
• Many counties in most populous regions within the United States designated as non-attainment areas
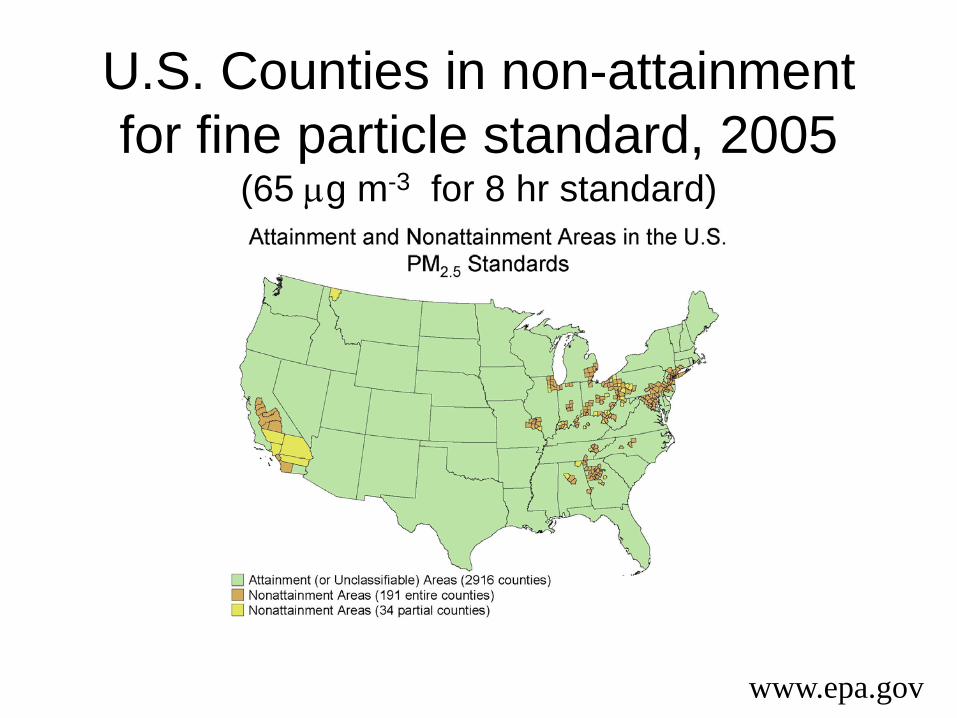
U.S. Counties in non-attainment for fine particle standard, 2005
(65 µg m-3 for 8 hr standard)
www.epa.gov
Fine Particulate Matter
• Secondary aerosol can contribute to the majority of fine particulate mass concentrations in polluted regions
• SOA significant contributor to fine particle concentrations in urban airsheds– Up to 80% of urban organic carbon attributed to
secondary organic aerosol
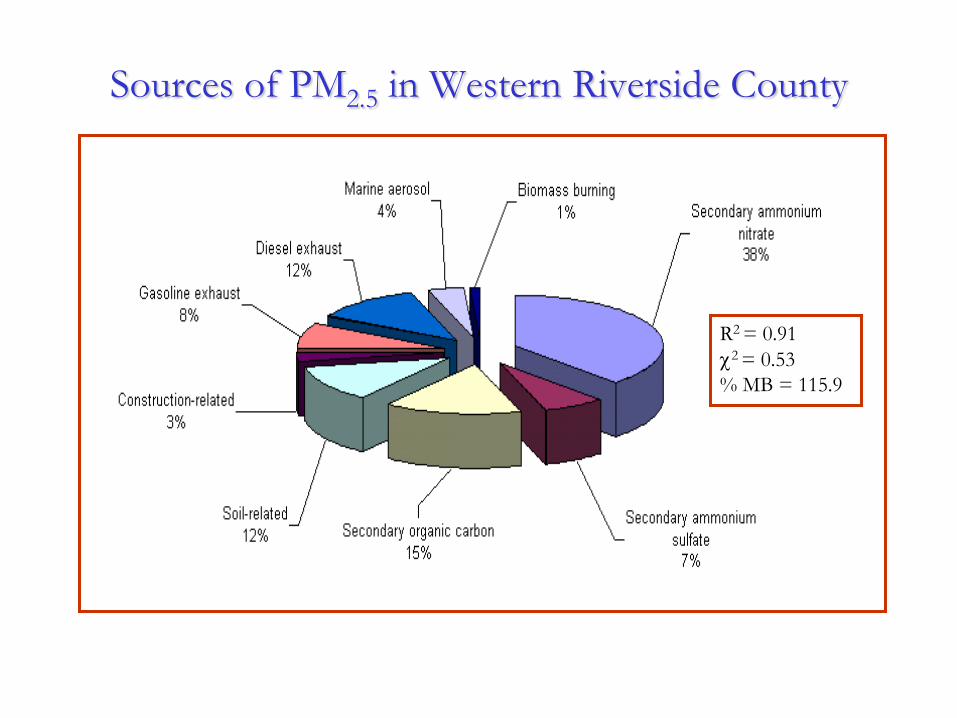
Sources of PM2.5 in Western Riverside County
R2 = 0.91χ2 = 0.53% MB = 115.9

Aerosol Round The World
Q. Zhang, et al.GRL, 34:L13801, 2007

Fine particulate matter• Visibility reduction:
Pasadena, CA

Fine particulate matter• Global radiative forcing (direct and indirect)
thereby affect global climate change

Health Effect
Climate Effect
Regional Air Quality
How does Aerosol Affect us?
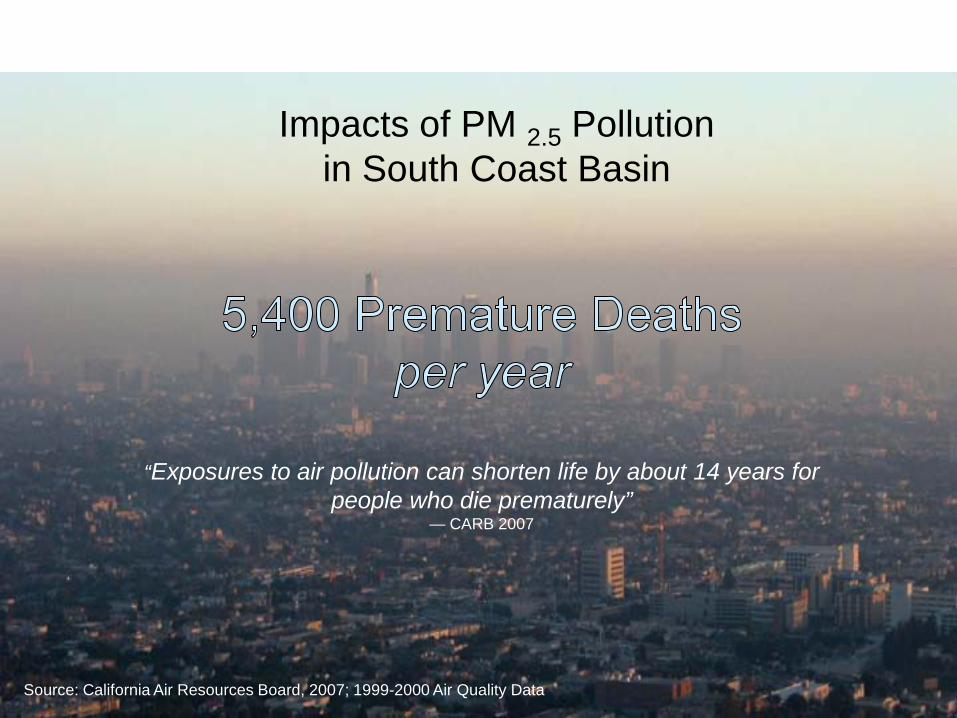
“Exposures to air pollution can shorten life by about 14 years for people who die prematurely”
— CARB 2007
Impacts of PM 2.5 Pollutionin South Coast Basin
Source: California Air Resources Board, 2007; 1999-2000 Air Quality Data
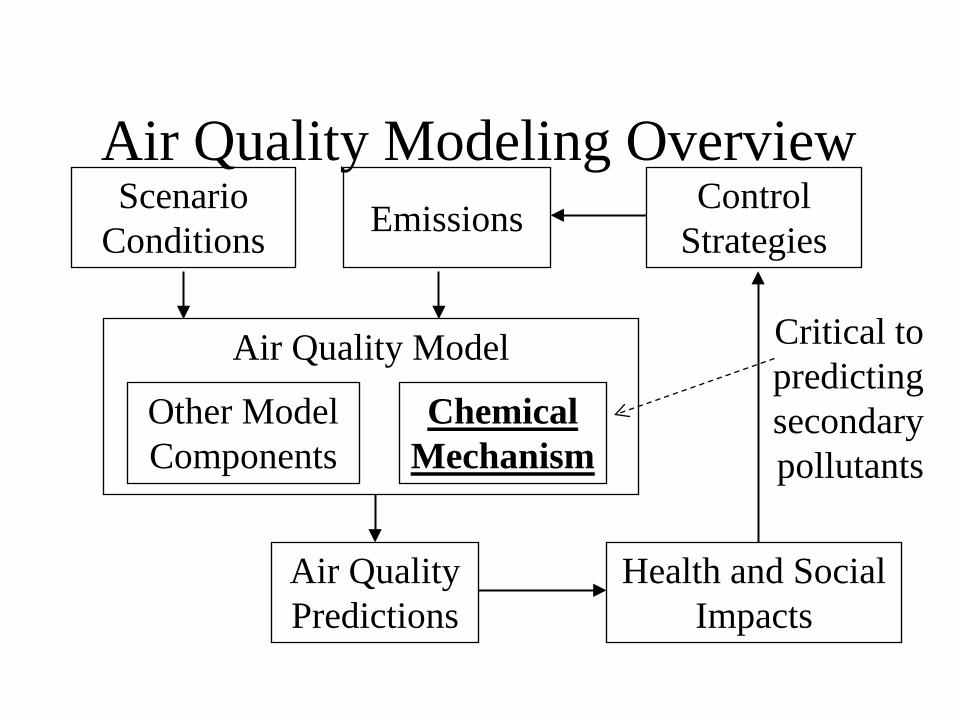
Air Quality Modeling OverviewScenario
Conditions Emissions Control Strategies
Air Quality Model
Air Quality Predictions
Health and Social Impacts
Other Model Components
Chemical Mechanism
Critical to predicting secondary pollutants
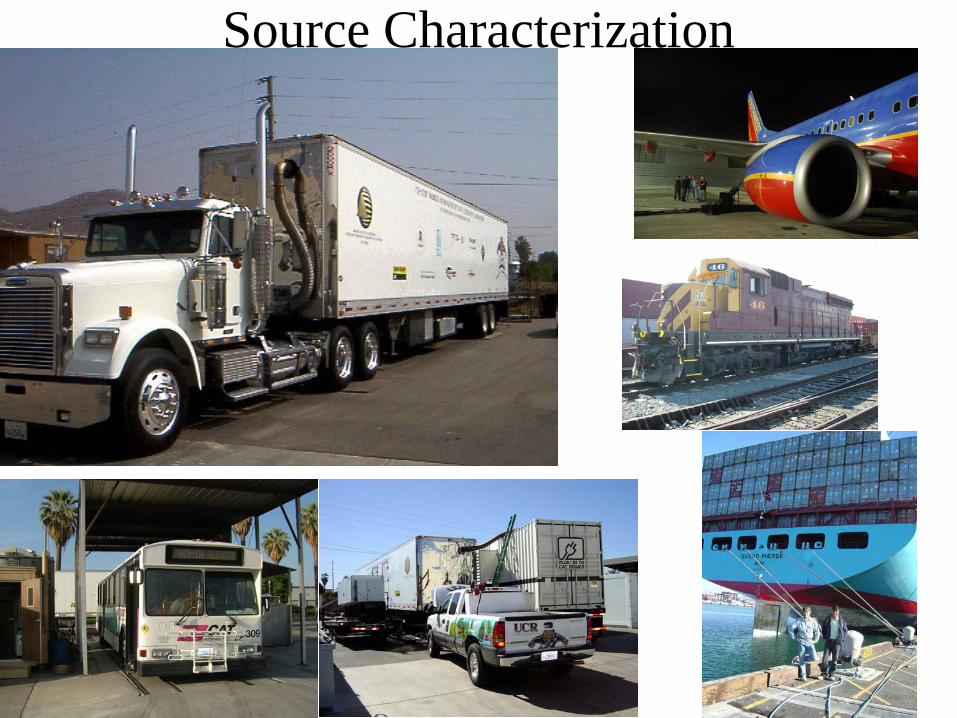
Source Characterization
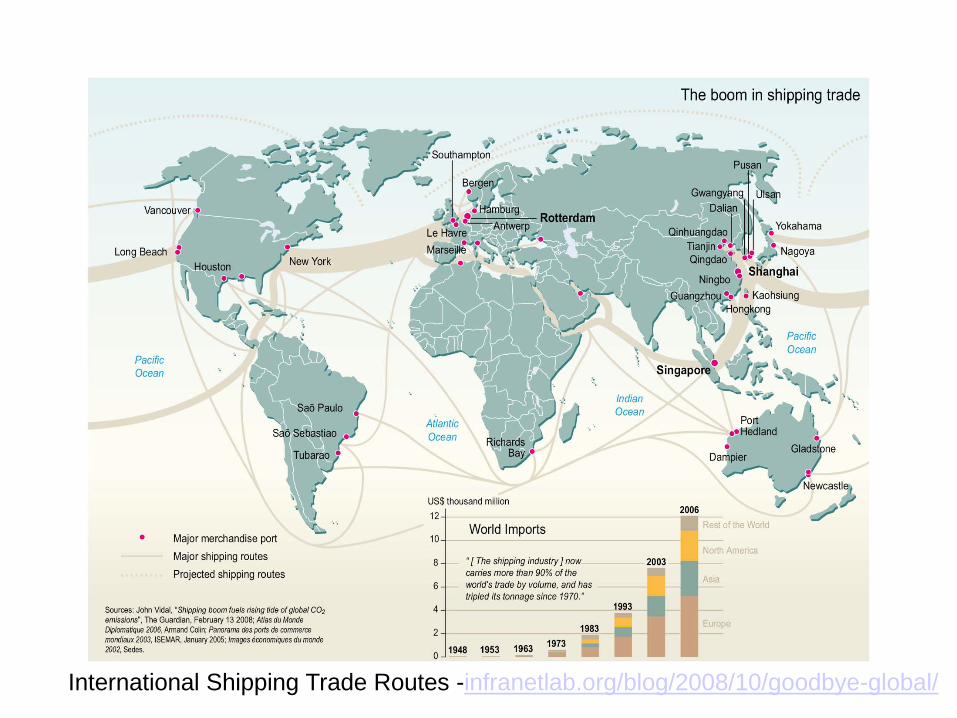
International Shipping Trade Routes -infranetlab.org/blog/2008/10/goodbye-global/

Ports of Los Angeles and Long Beach• Nation’s largest container cargo port complex•>40 % of nation’s containerized imports arrive here
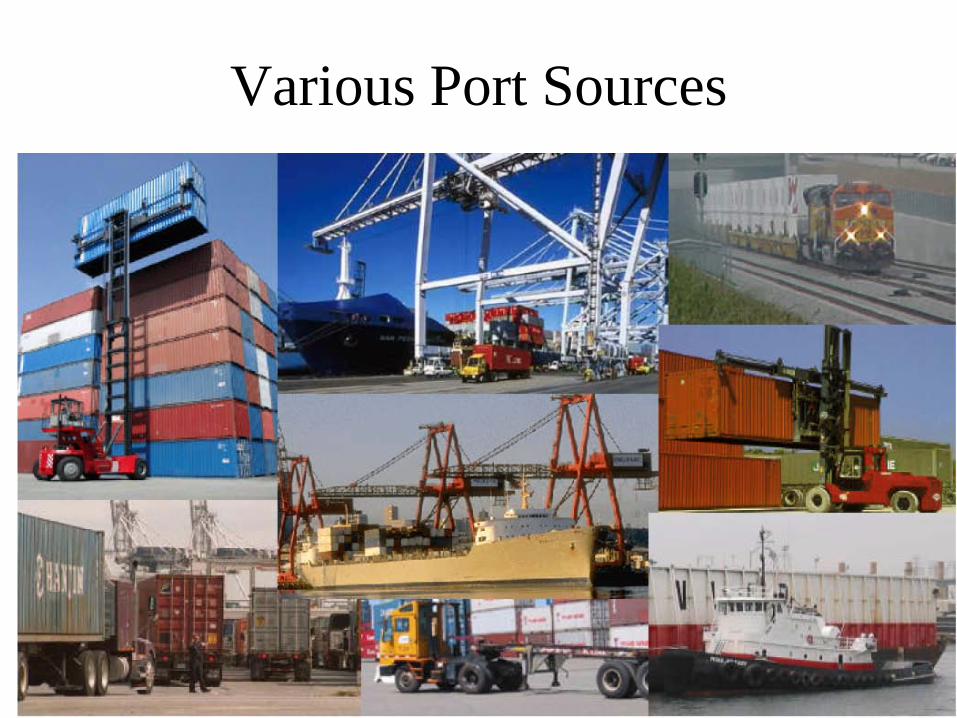
Various Port Sources

Engines on OGVs• Main Propulsion Engine
– Two Stroke– Displacement > 1000 liters/Cyl
(6-12 cyl)– 54,000 kW, 90 rpm
• Auxiliary Engine– Four Stroke– Displacement > 10 liters/Cyl
(6cyl)– 900 kW, 900 rpm
Main Engine Cylinder
21
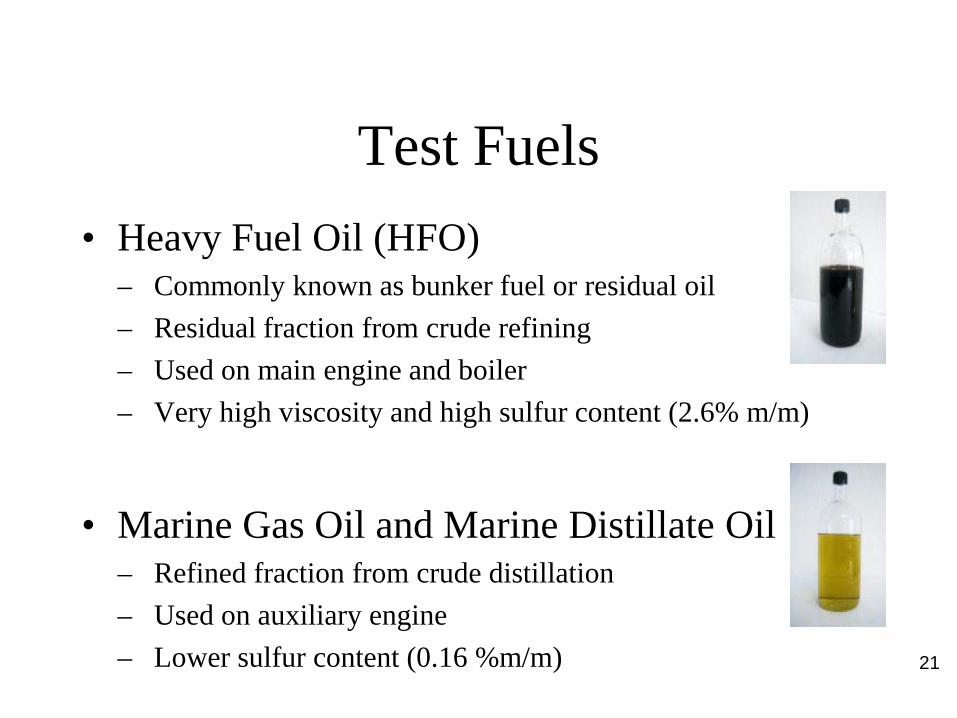
Test Fuels• Heavy Fuel Oil (HFO)
– Commonly known as bunker fuel or residual oil– Residual fraction from crude refining– Used on main engine and boiler– Very high viscosity and high sulfur content (2.6% m/m)
• Marine Gas Oil and Marine Distillate Oil– Refined fraction from crude distillation– Used on auxiliary engine– Lower sulfur content (0.16 %m/m)
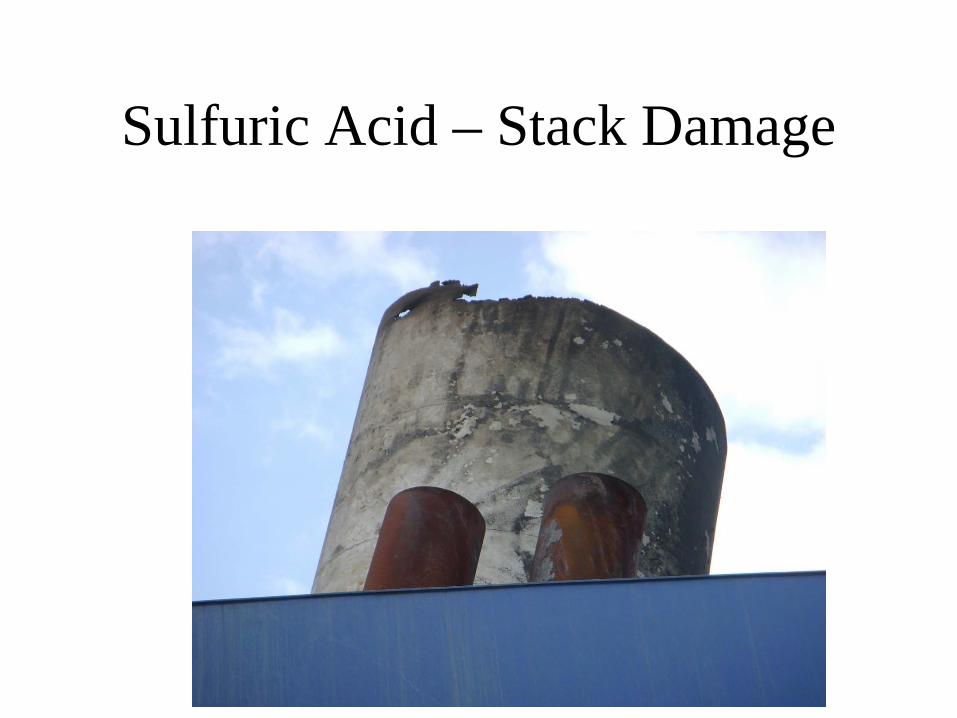
Sulfuric Acid – Stack Damage

23

Photograph taken of the container ship from the cabin of the CIRPAS Twin
Otter
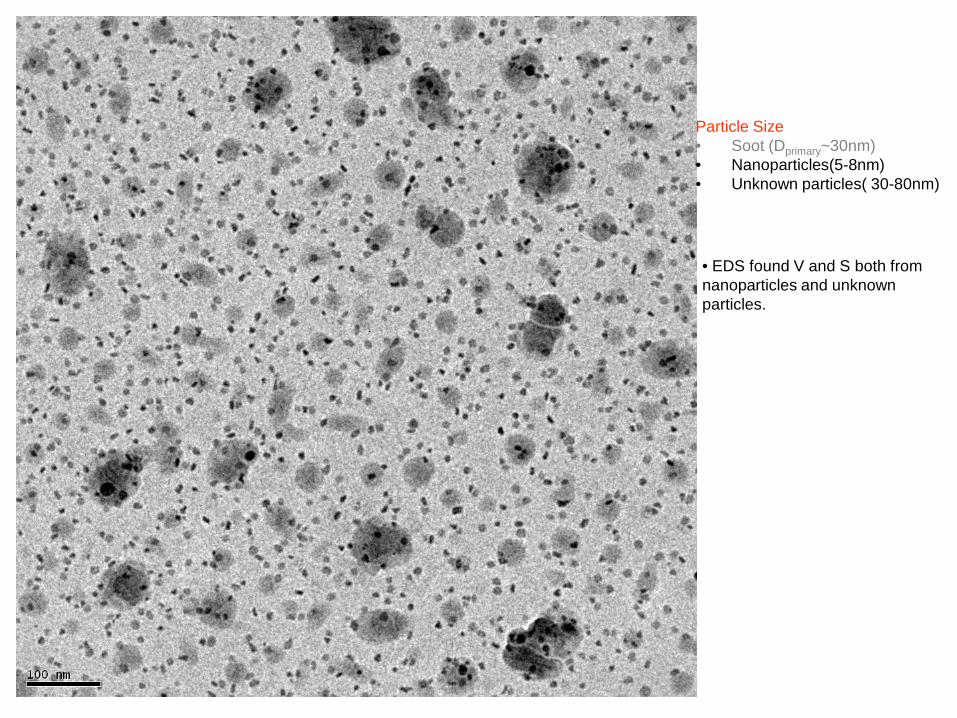
Particle Size• Soot (Dprimary~30nm)• Nanoparticles(5-8nm)• Unknown particles( 30-80nm)
• EDS found V and S both from nanoparticles and unknown particles.

Comparison of PM Emissions (g/kg CO2)
3
2.5
1
0.75
0.5
0.25
0
HDD trucks SwitchingLocomotives
Ship MainEngine
Ship AuxiliaryEngine
Yard Tractor BUG Aircraft
g/kg
CO
2
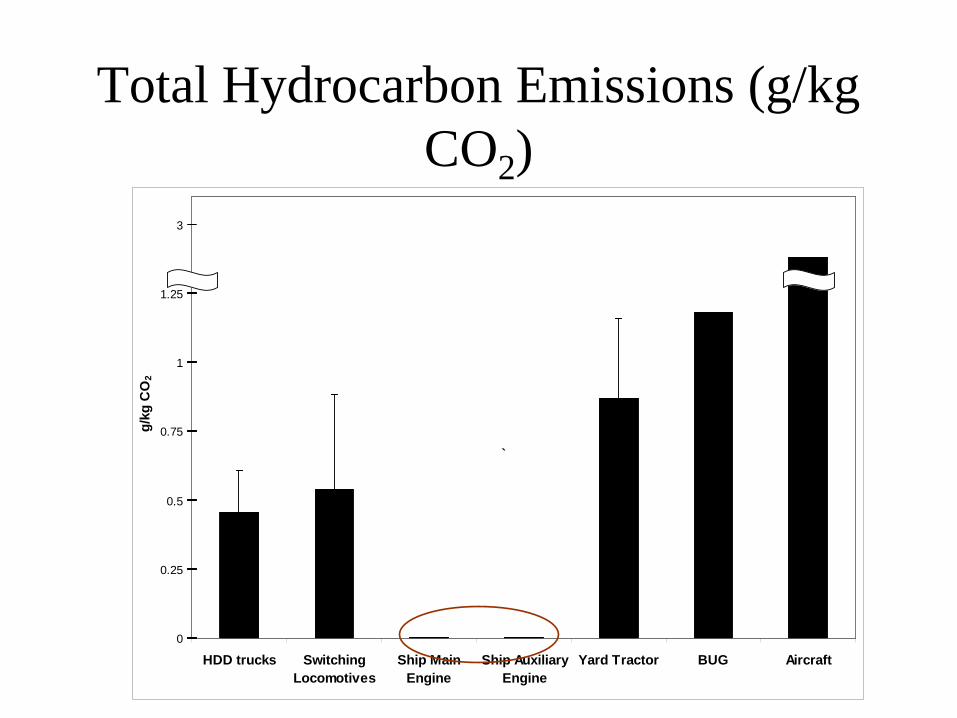
Total Hydrocarbon Emissions (g/kg CO2)
0
0.25
0.5
0.75
1
1.25
3
HDD trucks SwitchingLocomotives
Ship MainEngine
Ship AuxiliaryEngine
Yard Tractor BUG Aircraft
g/kg
CO
2
`

Comparison of PM Emissions (g/mile/ton)
0
0.005
0.01
0.015
0.02
0.025
0.03
0.035
1994-97 1998 1999-2002
SD-18 SD-20 SW-1200St1
SW-1200St2
MainEngine
AuxiliaryEngine
HDD Trucks Locomotive Ships
g/m
ile/to
n

Moving From Primary to Secondary Pollutants
• Ozone: only formed in atmosphere• Particulate matter: 80% formed in the
atmosphere
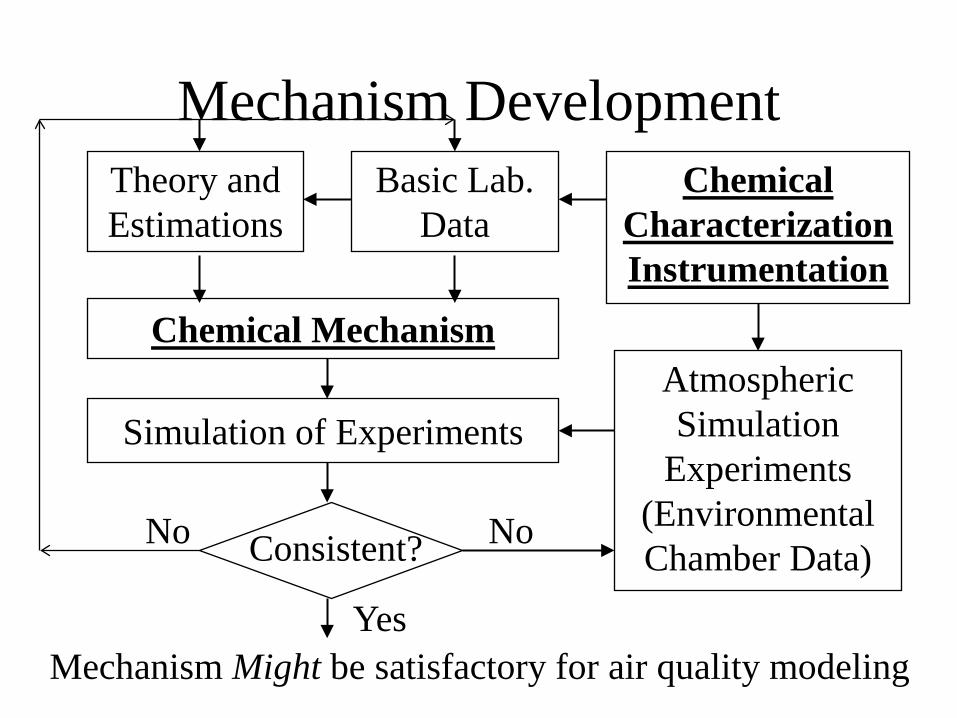
Mechanism DevelopmentBasic Lab.
DataTheory and Estimations
Chemical Characterization Instrumentation
Atmospheric Simulation
Experiments (Environmental Chamber Data)
Chemical Mechanism
Simulation of Experiments
Consistent?No
YesMechanism Might be satisfactory for air quality modeling
No
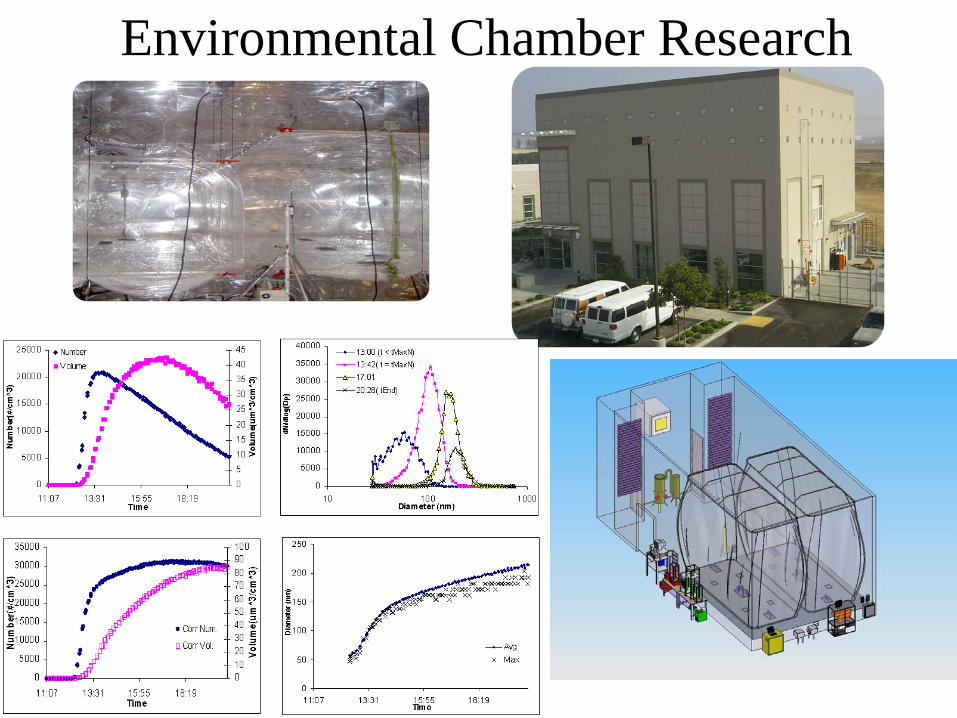
Environmental Chamber Research
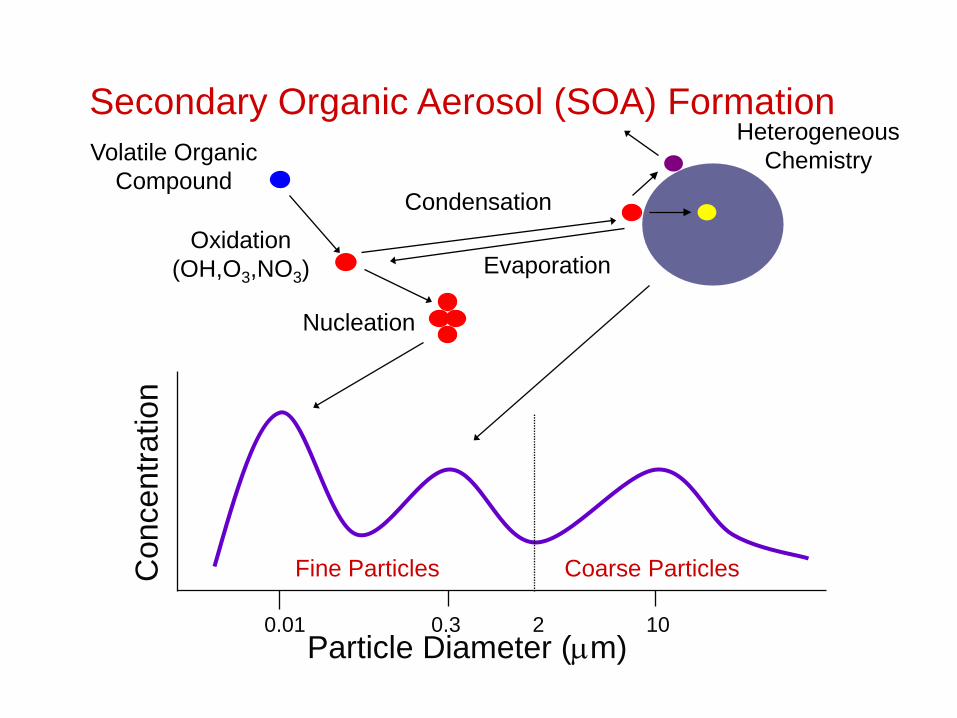
Secondary Organic Aerosol (SOA) Formation
Particle Diameter (µm)0.01 0.3 2 10
Con
cent
ratio
nCondensation
Nucleation
Volatile OrganicCompound
HeterogeneousChemistry
Oxidation(OH,O3,NO3)
Fine Particles Coarse Particles
Evaporation

SOA Theory: Equilibrium Partitioning of Semi-Volatile Compounds
G1, G2,…,Gn
Kom,i =Ai/∆Mo
Gi
=MWomγipo
L,i
RT
HC + Oxidant αiPi Pi= Ai + Gi
oom
omo
i oiom,
iom,io
ii
o
MK1KαM
MK1Kα
MYΔHCMY
+=
+=== ∑∑
(Odum et al., 1996)
Ai – Aerosol Products
Gi – Gaseous Products
Mo – Mass of Organic in Aerosol
Kom – Gas Partitioning Coefficient
R – Ideal Gas Constant
γ – Activity Coefficient
poLi – Sub cooled saturation liquid vapor pressure
α – Mass based stoichiometric coefficient
Single Product Model
A1, A2,…,AiKom,i

UCR Chamber Facility

UC Riverside/CE-CERT Environmental Chamber
Dual 90 m3
Teflon reactors
Descending frames to maintain positive pressure
Purified air flushed 450 m3 enclosure
Injection and sample portsDual SMPS’s
Particle free two chamber humidifier
Air handler circulation system
TDMA – Hygroscopicity Measurement
Argon arc lamp
Black lights

SOA formation potential
∑∑ +===
i oiom,
iom,io
ii
o
MK1Kα
MYΔROGΔMY
0
2
4
6
8
10
12
0 100 200 300 400 500 600Time (minute)
Volu
me
(µm
3 /cm
3 )
0
10
20
30
40
50
60H
C (p
pb)
PM Volume(corrected)PM Volume(uncorrected)Hydrocarbon
∆RO
G
∆Mo
0.00
0.02
0.04
0.06
0.08
0.10
0.12
0.14
0.16
0.18
0.20
0 50 100 150 200 250 300Mo(µg/m 3)
Mas
s Fr
actio
nal Y
ield
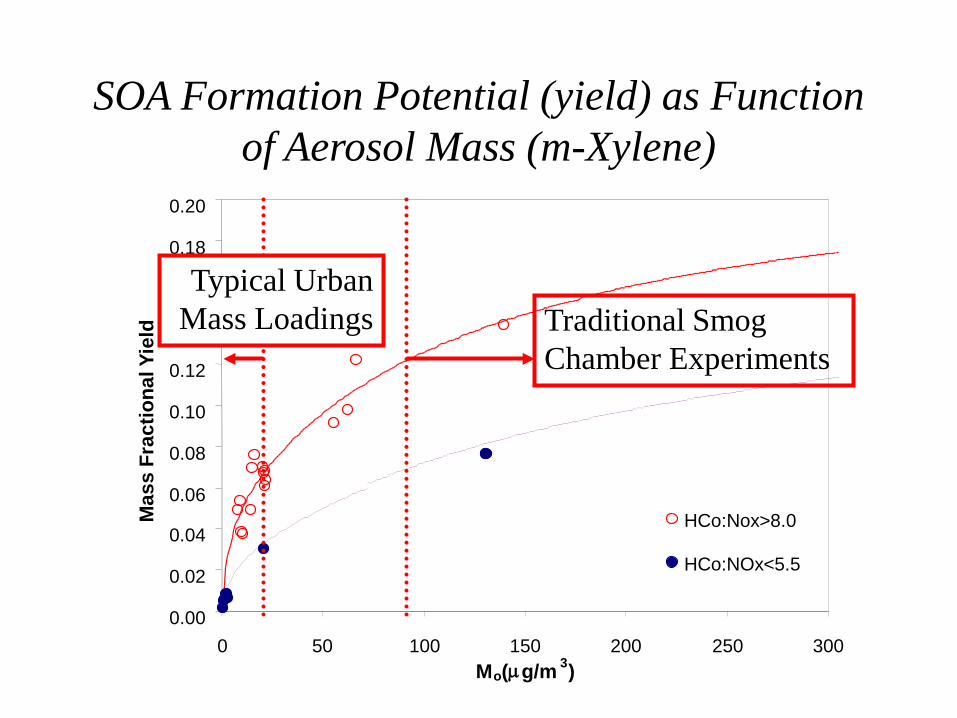
HCo:Nox>8.0
HCo:NOx<5.5
SOA Formation Potential (yield) as Function of Aerosol Mass (m-Xylene)
Traditional Smog Chamber Experiments
Typical Urban Mass Loadings
0
50
100
150
200
250
300
350
400
0 200 400 600 800 1000 1200 1400 1600 1800 2000ΔHC(µg/m3)
Mo(
µg/
m3 )
HCo:NOx>8.0
HCo:NOx<5.5
0
5
10
15
20
25
0 100 200 300ΔHC(µg/m3)
Mo( µ
g/m
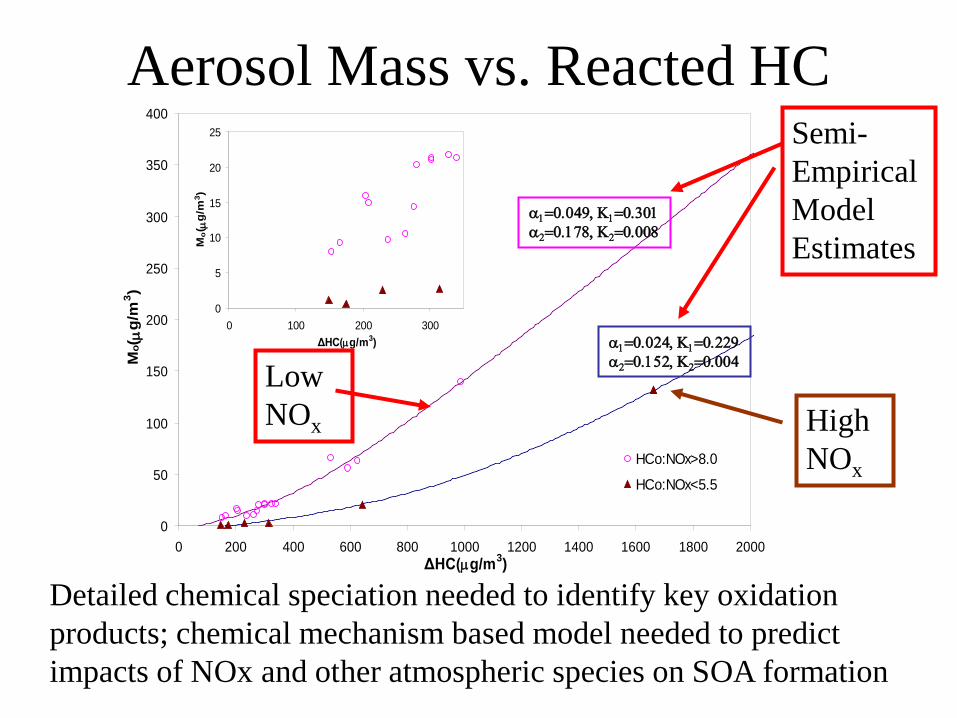
3 )α1=0.049, Κ1=0.301α2=0.178, Κ2=0.008
α1=0.024, Κ1=0.229α2=0.152, Κ2=0.004
Aerosol Mass vs. Reacted HC
Detailed chemical speciation needed to identify key oxidation products; chemical mechanism based model needed to predict impacts of NOx and other atmospheric species on SOA formation
Semi-Empirical Model Estimates
High NOx
Low NOx
What can we do here?
• There are many individual and team projects that lead to the results shown above– What do the particles formed look like?
• What are their chemical characteristics?• What are their physical characteristics?• What is their atmospheric behaviour?
– What hazardous air pollutants are released?• By whom? Where? Who is impacted?
– Lots of instruments, lots of students to work with, lots of questions to address……
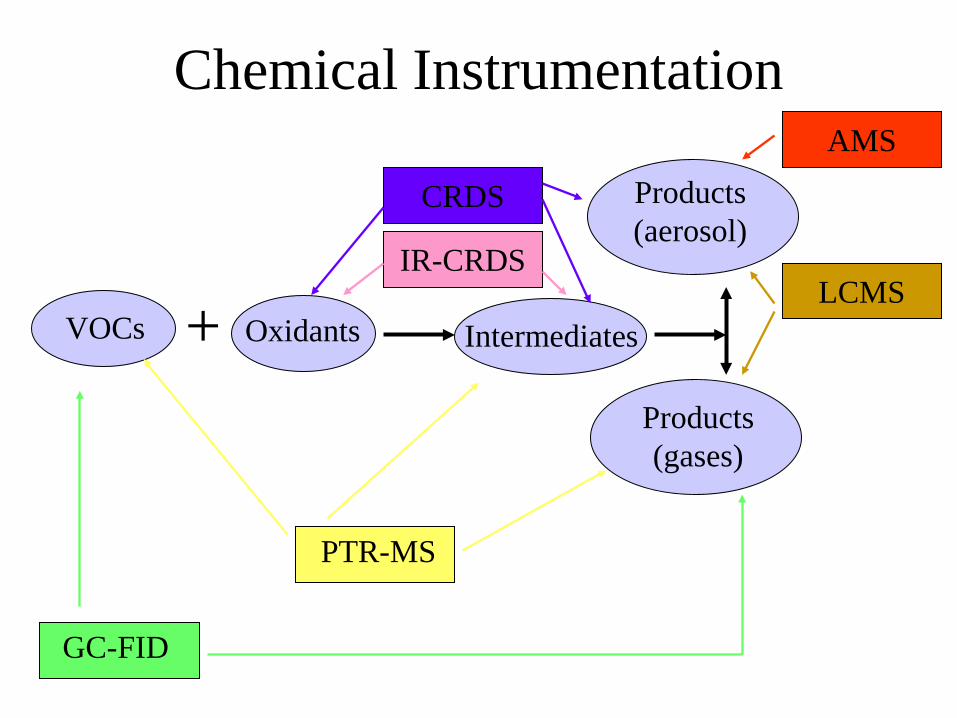
Chemical Instrumentation
+VOCs Oxidants
Products (aerosol)
Products (gases)
GC-FID
PTR-MS
IntermediatesLCMS
AMS
IR-CRDS
CRDS

Aerosol Instrumentation
Atmospheric reactor
SMPS(Size
Distribution)
CPC(Number
Concentration)
APM(Single
Particle Mass)
(CCN)Cloud particle activation
SOA
Aerosol Mass
Produced
![[PPT]Environmental Chemistry - PowerPoint … · Web viewAtmospheric Chemistry Formation of the Atmosphere The Early Atmosphere Origin of Life and Oxygen Ozone Air Pollution Acid](https://img.pdfslide.us/doc/110x75/5b0b179c7f8b9a45518d6ccd/pptenvironmental-chemistry-powerpoint-viewatmospheric-chemistry-formation-of.jpg)


![Jennifer Cocker [Portfolio]](https://img.pdfslide.us/doc/110x75/557f1e82d8b42a00268b45ba/jennifer-cocker-portfolio.jpg)