Embed Size (px)
Citation preview
Aerosol Extinction Assessment and Impact on Regional Haze Rule Implementation
Douglas Lowenthal
Desert Research Institute
Pat Ryan
Sonoma Technology, Inc.
Naresh Kumar
Electric Power Research Institute
Proposed EPA Haze Rule Requires Reduction of Light Extinction in National Parks to Background Levels by 2064.
Assessment based on reconstructed, notmeasured light extinction:
Bext = 3 f(RH) [(NH4)2SO4 + NH4NO3] +
4 [1.4 OC] + 1 [PM2.5 Soil] +
0.6 [Coarse (PM10-PM2.5) Mass] + 10 [EC] + 10 Mm-1 (Rayleigh Scattering)
Dry Mass Scattering Efficiencies
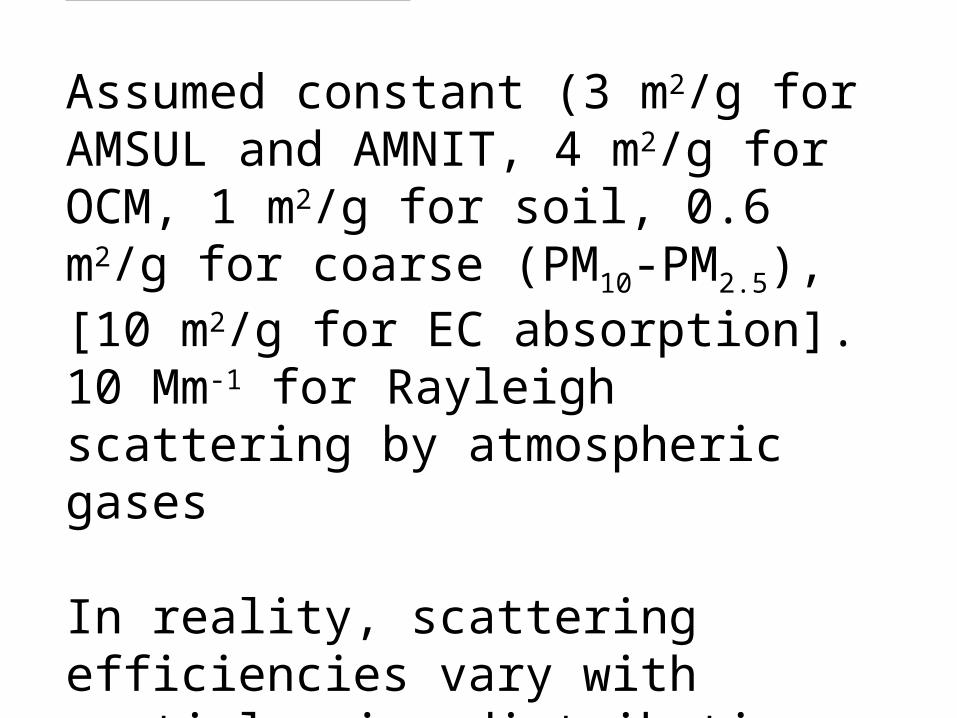
Assumed constant (3 m2/g for AMSUL and AMNIT, 4 m2/g for OCM, 1 m2/g for soil, 0.6 m2/g for coarse (PM10-PM2.5), [10 m2/g for EC absorption]. 10 Mm-1 for Rayleigh scattering by atmospheric gases
In reality, scattering efficiencies vary with particle size distribution
To Assess the IMPROVE Equation:
Compare measured light scattering (Bsp) and reconstructed Bsp from 20 IMPROVE sites from 1993-1999
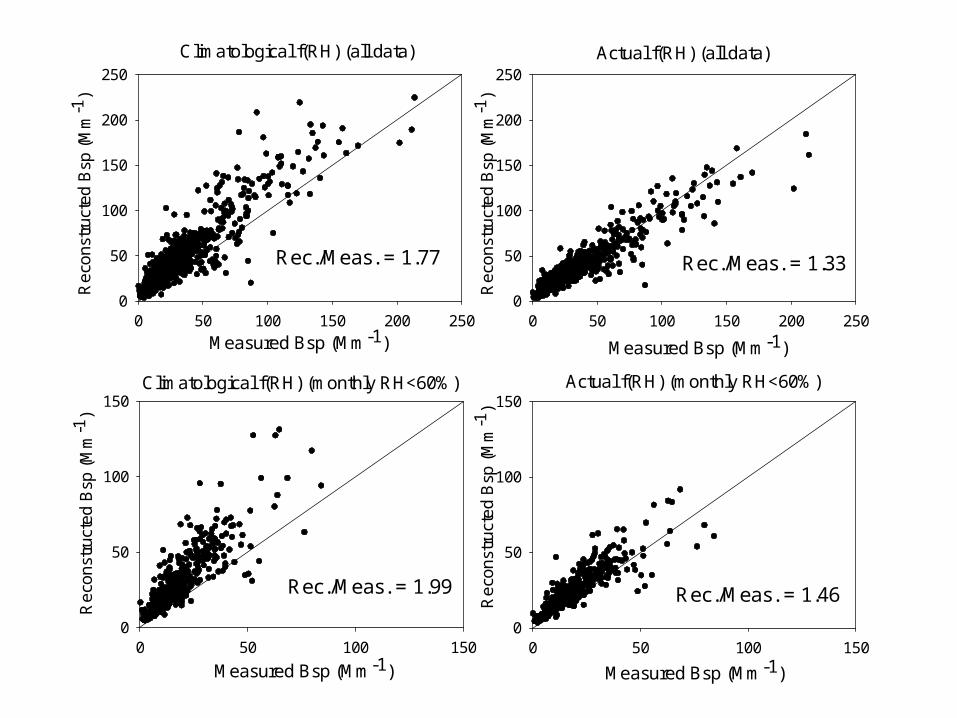
Climatological f(RH): Based on historical RH across U.S. from 1988-1997 (>95% rollback)
Actual f(RH): Based on measured hourly RH with Bsp (>95% omitted)
M/R = 0.61
Actual f(RH) (monthly RH<60%)
Measured Bsp (Mm-1)
0 50 100 150
Re
con
stru
cte
d B
sp (
Mm
-1)
0
50
100
150
Rec./Meas. = 1.46
Climatological f(RH) (monthly RH<60%)
Measured Bsp (Mm-1)0 50 100 150
Re
con
stru
cte
d B
sp (
Mm
-1)
0
50
100
150
Climatological f(RH) (all data)
Measured Bsp (Mm-1)0 50 100 150 200 250
Re
con
stru
cte
d B
sp (
Mm
-1)
0
50
100
150
200
250
Rec./Meas. = 1.77
Actual f(RH) (all data)
Measured Bsp (Mm-1)
0 50 100 150 200 250
Re
con
stru
cte
d B
sp (
Mm
-1)
0
50
100
150
200
250
Rec./Meas. = 1.33
Rec./Meas. = 1.99
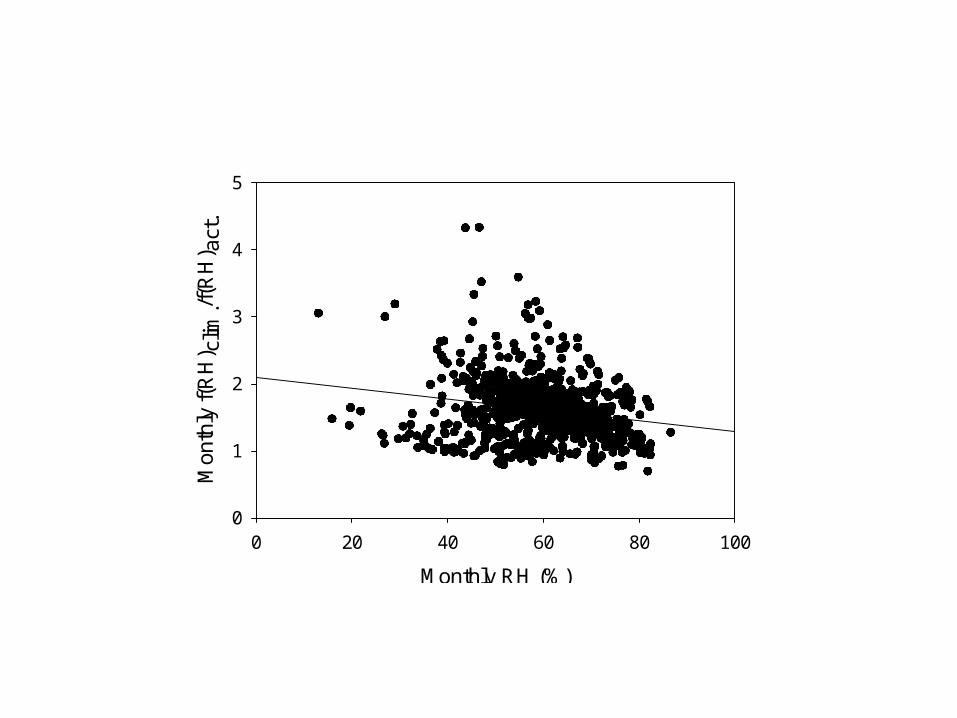
Monthly RH (%)
0 20 40 60 80 100
Mon
thly
f(R
H) c
lim./
f(R
H) a
ct.
0
1
2
3
4
5
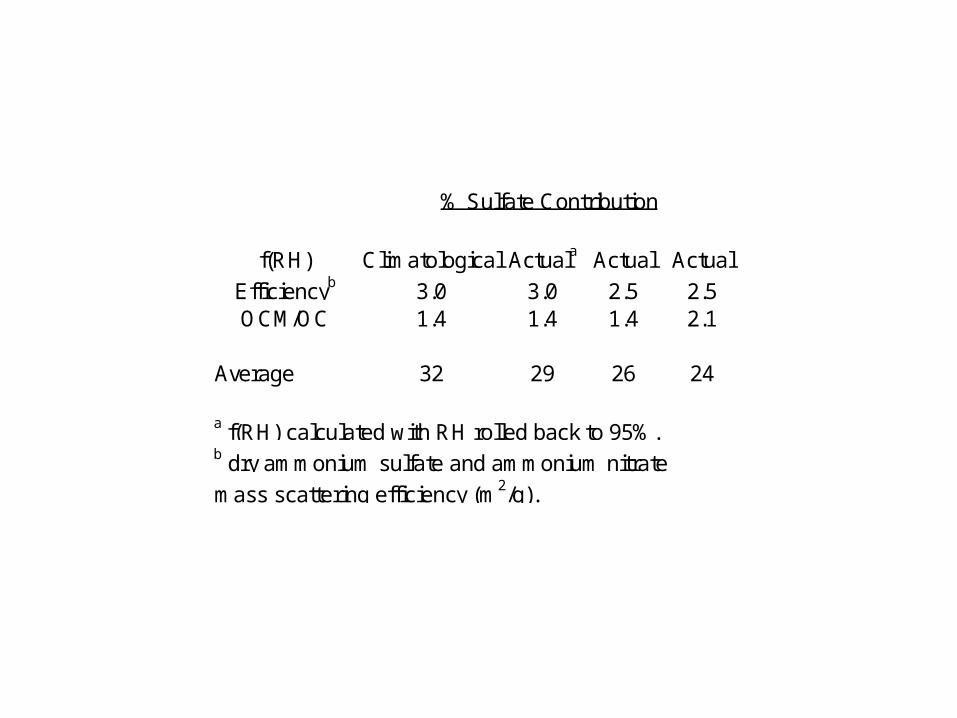
f(RH) Climatological Actuala Actual Actual
Efficiencyb 3.0 3.0 2.5 2.5OCM/OC 1.4 1.4 1.4 2.1
Average 32 29 26 24
a f(RH) calculated with RH rolled back to 95%.b dry ammonium sulfate and ammonium nitrate
mass scattering efficiency (m2/g).
% Sulfate Contribution
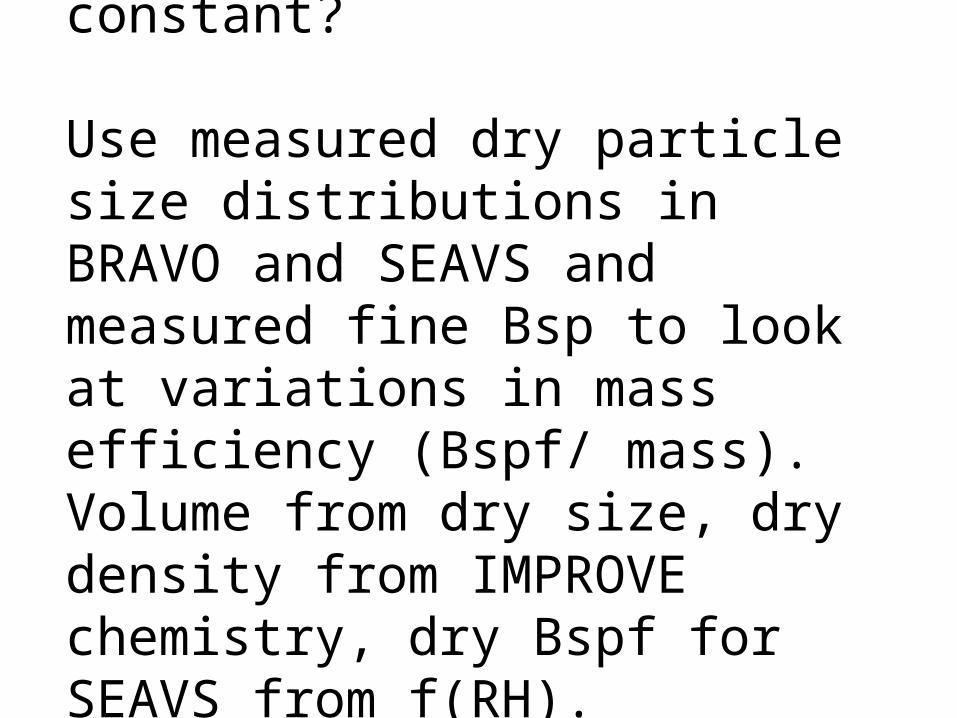
Are dry efficiencies constant?
Use measured dry particle size distributions in BRAVO and SEAVS and measured fine Bsp to look at variations in mass efficiency (Bspf/ mass). Volume from dry size, dry density from IMPROVE chemistry, dry Bspf for SEAVS from f(RH).
0 20 40 60 80 100E
m (
m2 /g
)
0
2
4
6
8
0 50 100 150 200 250 300 350
Em (
m2 /g
)
0
2
4
6
8
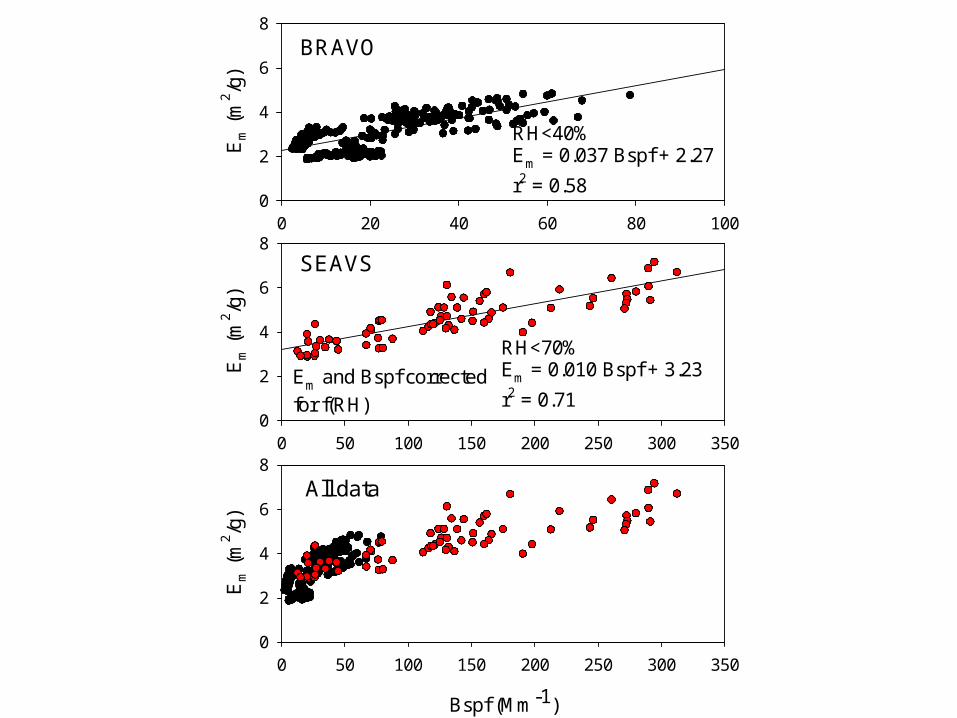
RH<40%Em = 0.037 Bspf + 2.27
r2 = 0.58
BRAVO
SEAVS
RH<70%Em = 0.010 Bspf + 3.23
r2 = 0.71
Bspf (Mm-1)
0 50 100 150 200 250 300 350
Em (
m2 /g
)
0
2
4
6
8
All data
Em and Bspf corrected
for f(RH)
Result: Mass efficiency increases with the degree of pollution (Bspf) in remote national parks.

Dry mass efficiency increases for typical pollution aerosol distributions with 0.1<diameter<0.6 μm (Watson, 2002)
The shift of the ambient dry particle size distribution over this size range under more polluted conditions causes the variation in efficiency.
OCM/OC Ratio Affects Apportionment of Bext to Organics and Sulfates Assumed Ratio = 1.4 (urban – unoxidized) Calculate OCM/OC from IMPROVE Data (1988-1999): Ratio = (PM2.5 – (AMSUL + AMNIT + EC + SOIL + Other))/OC Assume: conc>3σ, N>20, soil=soil/0.91 (based on DRI soil profiles), 0<Ratio<10 (remove outliers).
Average OCM/OC (partial list) Site Ratio Std. N
BIBE 2.00 0.72 105
GRSM 2.33 1.23 262
GRCA 2.19 1.10 89
PORE 2.00 1.02 194
YELL 1.90 0.39 43
ALL 2.06 0.30 9597
Implementation Effects of Regional Haze Rule Process (STI)
• Estimation of the Natural Background Variation from Current IMPROVE Reconstructed Extinction
• Parameterization of Dry Efficiencies as a Function of Ammonium Sulfate + Ammonium Nitrate Concentrations
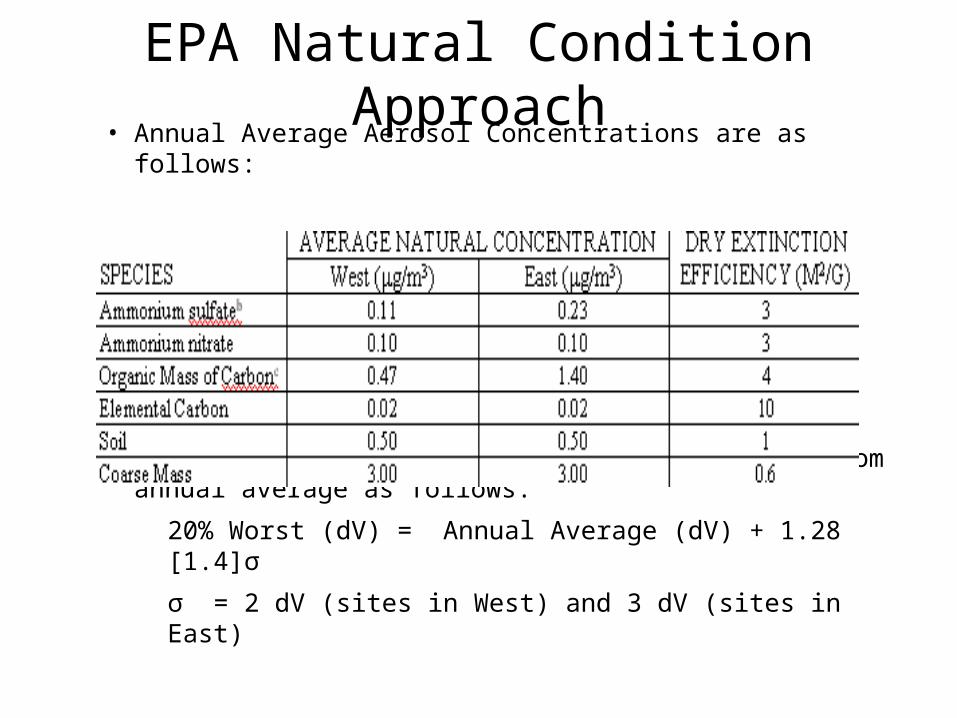
EPA Natural Condition Approach• Annual Average Aerosol Concentrations are as follows:
• 20% worst natural conditions (dV) determined from annual average as follows:
20% Worst (dV) = Annual Average (dV) + 1.28 [1.4]σ
σ = 2 dV (sites in West) and 3 dV (sites in East)
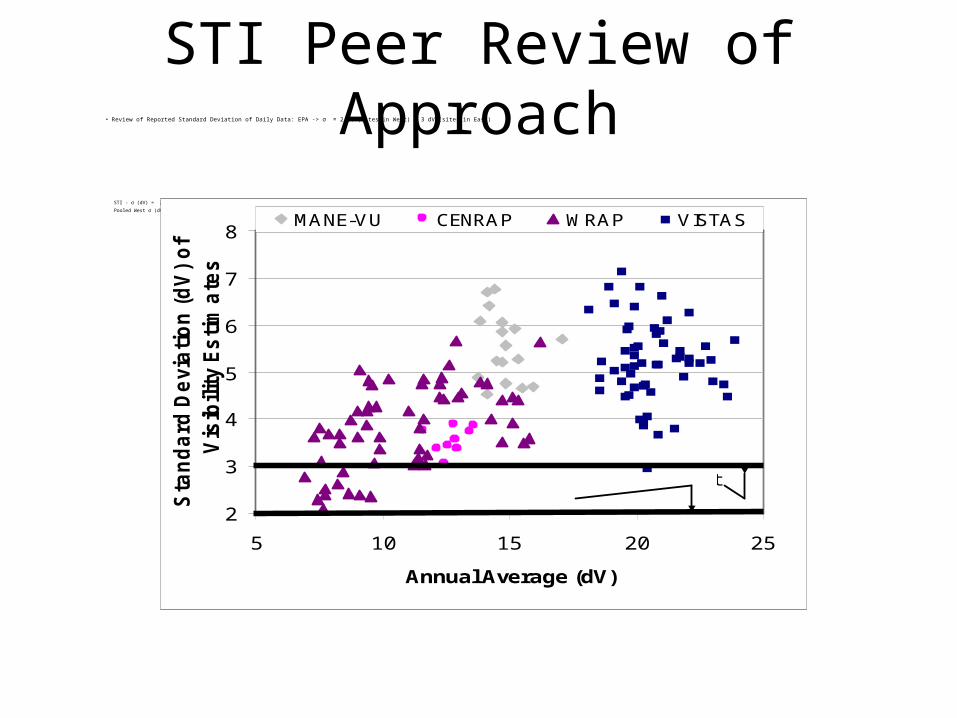
STI Peer Review of Approach• Review of Reported Standard Deviation of Daily Data: EPA -> σ = 2 dV (sites in West) & 3 dV (sites in East)
STI - σ (dV) = 2.43 + 0.14 Annual Average (dV); r = 0.61
Pooled West σ (dV) = 3.8; Pooled East σ (dV) = 5.3
2
3
4
5
6
7
8
5 10 15 20 25
Annual Average (dV)
Sta
nd
ard
De
via
tio
n (
dV
) o
f D
aily
Vis
ibilit
y E
sti
ma
tes
MANE-VU CENRAP WRAP VISTAS
EPA recommendation for East and West class I sites
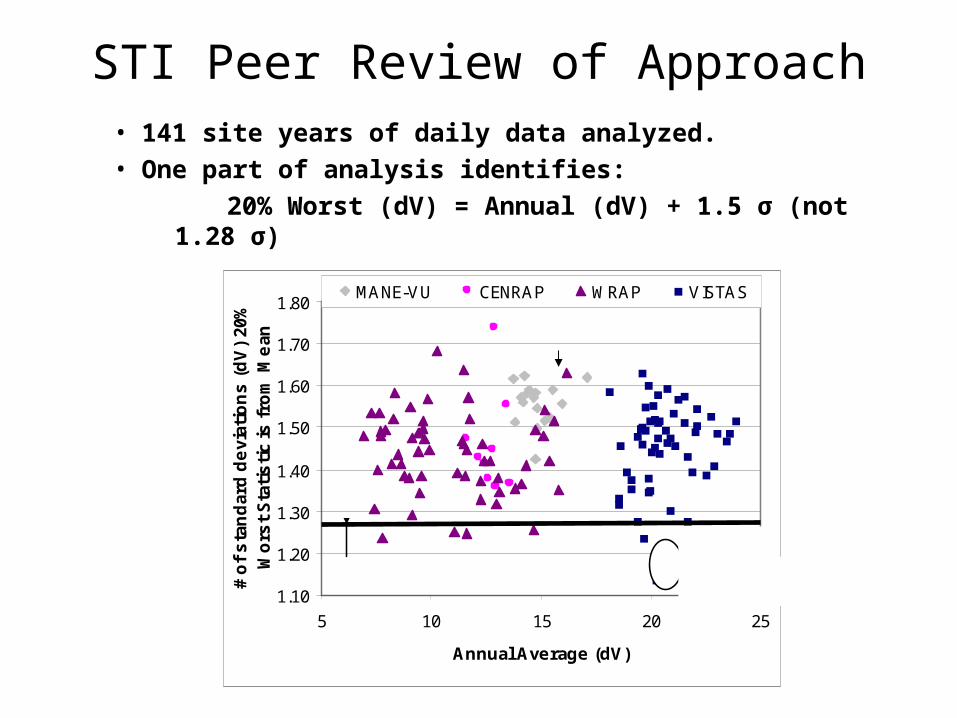
STI Peer Review of Approach
• 141 site years of daily data analyzed.
• One part of analysis identifies:
20% Worst (dV) = Annual (dV) + 1.5 σ (not 1.28 σ)
1.10
1.20
1.30
1.40
1.50
1.60
1.70
1.80
5 10 15 20 25
Annual Average (dV)
# o
f s
tan
dar
d d
evi
atio
ns
(d
V)
20%
W
ors
t S
tati
sti
c is
fro
m M
ean
MANE-VU CENRAP WRAP VISTAS
Ames and Malm recommendation (1.28 σ) OKEF1 (1994-96)
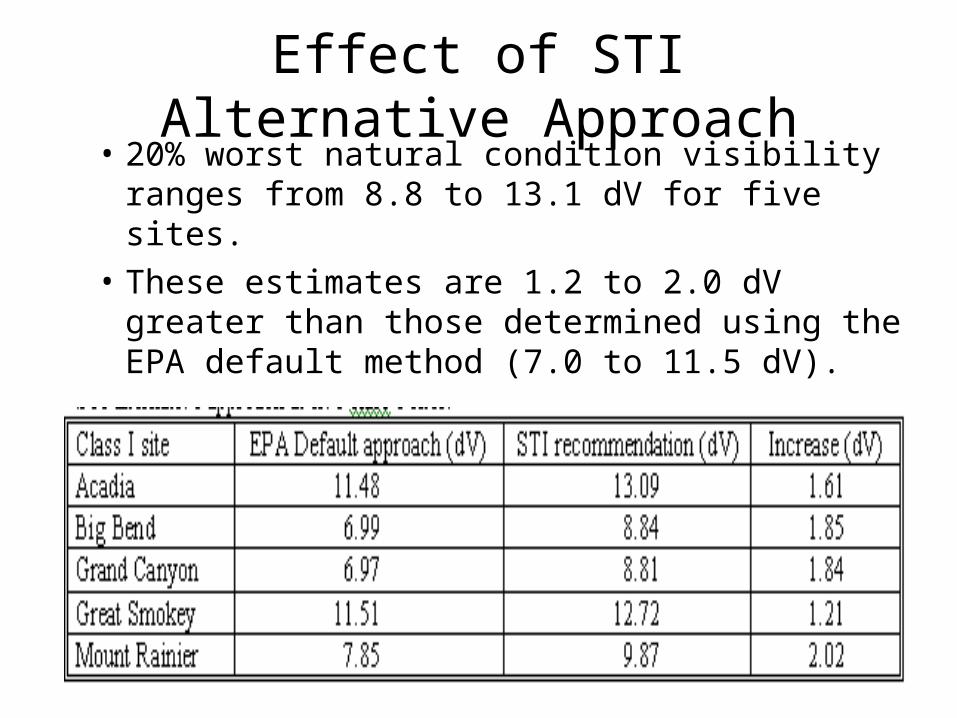
Effect of STI Alternative Approach• 20% worst natural condition visibility ranges
from 8.8 to 13.1 dV for five sites.
• These estimates are 1.2 to 2.0 dV greater than those determined using the EPA default method (7.0 to 11.5 dV).
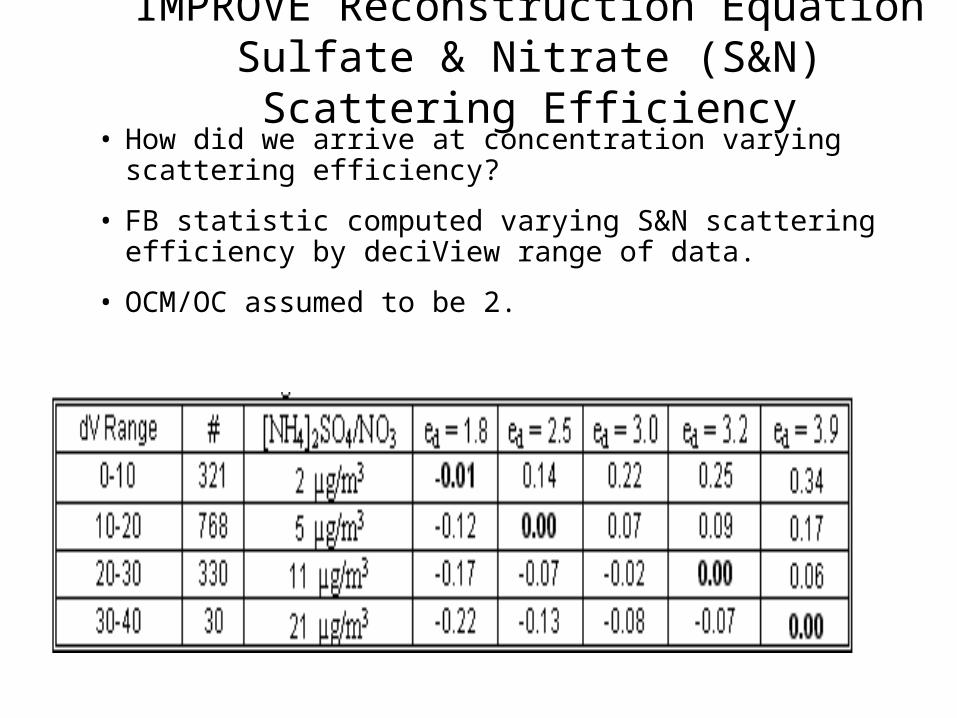
IMPROVE Reconstruction EquationSulfate & Nitrate (S&N) Scattering Efficiency
• How did we arrive at concentration varying scattering efficiency?
• FB statistic computed varying S&N scattering efficiency by deciView range of data.
• OCM/OC assumed to be 2.
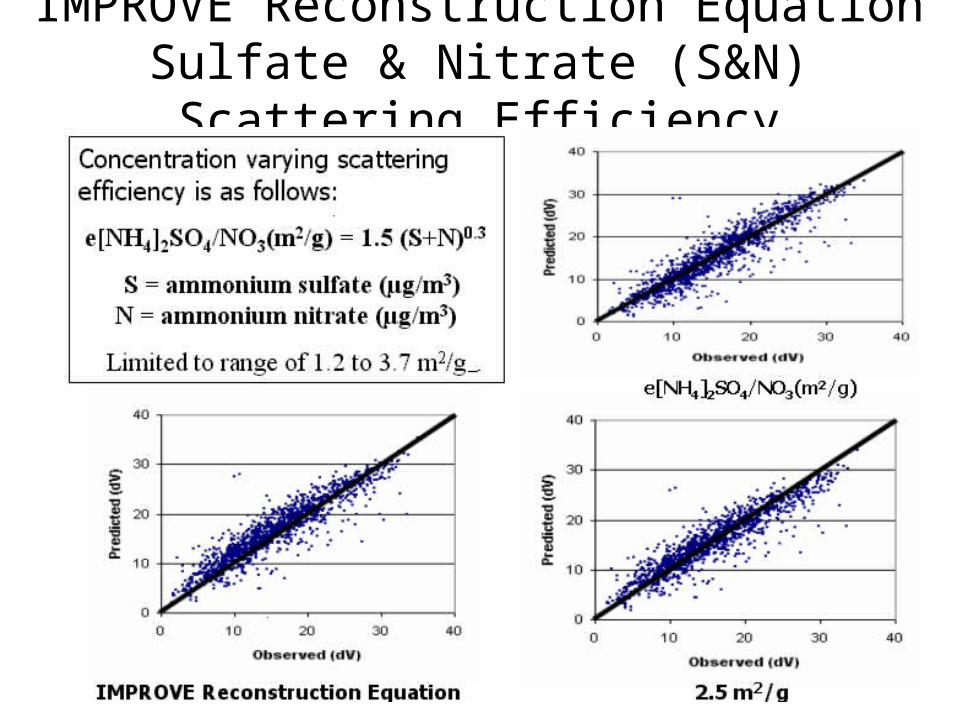
IMPROVE Reconstruction EquationSulfate & Nitrate (S&N) Scattering Efficiency
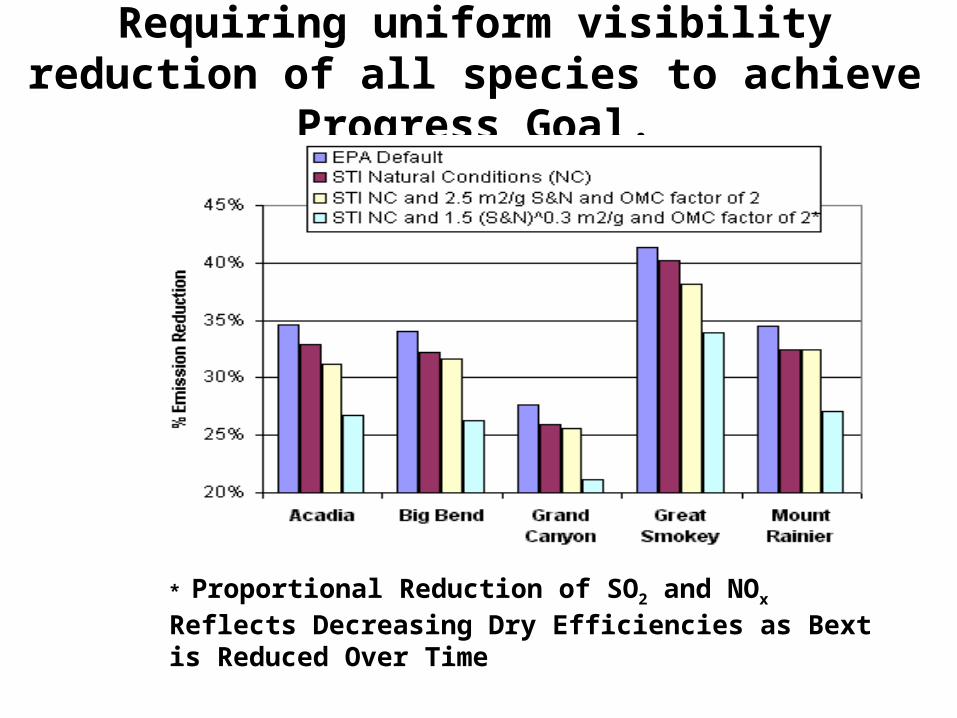
Requiring uniform visibility reduction of all species to achieve Progress Goal.
* Proportional Reduction of SO2 and NOx Reflects Decreasing Dry Efficiencies as Bext is Reduced Over Time
Acknowledgements This work was supported by the Electric Power Research Institute in Palo Alto, CA. We thank IMPROVE for aerosol, Bext, Bsp, and RH data obtained from their web site, and: UC Davis for IMPROVE aerosol sampler data, Jeff Collett (CSU) and Peter McMurry (UMN) for MOUDI data, Susanne Hering (ADI, Inc.) and Jenny Hand (CSU) and Sonia Kreidenweis (CSU) for particle size data, and Derek Day (CSU) for Bsp data from SEAVS and BRAVO.

finis