Embed Size (px)
Citation preview

BNL-75155-2005-BC
AEROSOL, CLOUDS, AND CLIMATE CHANGE
S. E. SchwartzEnvironmental Sciences Dept./Atmospheric Sciences Div.
Brookhaven National LaboratoryUpton, NY 11973-5000
Published in“Nucleation and Atmospheric Aerosols 2004”,
M. Kasahara and M. Kulmala, Eds., pp.323-338,Kyoto Univ. Press, 2004.
September 2005
Notice: This manuscript has been authored by employees of Brookhaven Science Associates, LLC underContract No. DE-AC02-98CH10886 with the U.S. Department of Energy. The publisher by accepting themanuscript for publication acknowledges that the United States Government retains a non-exclusive, paid-up,irrevocable, world-wide license to publish or reproduce the published form of this manuscript, or allow othersto do so, for United States Government purposes.
This preprint is intended for publication in a journal or proceedings. Since changes may be made beforepublication, it may not be cited or reproduced without the author’s permission.

DISCLAIMER
This report was prepared as an account of work sponsored by an agency of theUnited States Government. Neither the United States Government nor anyagency thereof, nor any of their employees, nor any of their contractors,subcontractors, or their employees, makes any warranty, express or implied, orassumes any legal liability or responsibility for the accuracy, completeness, or anythird party’s use or the results of such use of any information, apparatus, product,or process disclosed, or represents that its use would not infringe privately ownedrights. Reference herein to any specific commercial product, process, or serviceby trade name, trademark, manufacturer, or otherwise, does not necessarilyconstitute or imply its endorsement, recommendation, or favoring by the UnitedStates Government or any agency thereof or its contractors or subcontractors.The views and opinions of authors expressed herein do not necessarily state orreflect those of the United States Government or any agency thereof.

Aerosols, Clouds, and Climate Change
Stephen E. Schwartz
Brookhaven National LaboratoryUpton NY 11973 USA
Abstract. Earth's climate is thought to be quite sensitive to changes in radiative fluxes that are quitesmall in absolute magnitude, a few watts per square meter, and in relation to these fluxes in the naturalclimate. Atmospheric aerosol particles exert influence on climate directly, by scattering and absorbingradiation, and indirectly by modifying the microphysical properties of clouds and in turn their radiativeeffects and hydrology. The forcing of climate change by these indirect effects is thought to be quitesubstantial relative to forcing by incremental concentrations of greenhouse gases, but highly uncertain.Quantification of aerosol indirect forcing by satellite- or ground-based remote sensing has proved quitedifficult in view of inherent large variation in the pertinent observables such as cloud optical depth,which is controlled mainly by liquid water path and only secondarily by aerosols. Limited work hasshown instances of large magnitude of aerosol indirect forcing, with local instantaneous forcingupwards of 50 W m-2. Ultimately it will be necessary to represent aerosol indirect effects in climatemodels to accurately identify the anthropogenic forcing at present and over secular time and to assessthe influence of this forcing in the context of other forcings of climate change. While the elements ofaerosol processes that must be represented in models describing the evolution and properties of aerosolparticles that serve as cloud condensation particles are known, many important components of theseprocesses remain to be understood and to be represented in models, and the models evaluated againstobservation, before such model-based representations can confidently be used to represent aerosolindirect effects in climate models.
Key Words: Aerosols, Clouds, Climate, Radiative forcing
INTRODUCTION
We are meeting in Kyoto, a city whose name has become epynomous with the issue ofclimate change. The issue that we confront, as citizens of the world, is how to respond to theconsequences of inevitable increases in atmospheric carbon dioxide associated with fossil fuelcombustion. Briefly the options are mitigation (reductions in CO2 emissions, which can takeplace only at considerable cost to our energy economy) and adaptation (preparation to live in agreenhouse warmed world, also at great social cost). Our responsibility, as scientists, is todevelop improved understanding of Earth's climate system, so that we may be able to statewith confidence the nature and extent of climate change that would result from prospectiveperturbations to the climate system.
If we have learned anything in the study of climate it is that there is a potential of largechanges in climate from small changes in radiative fluxes. The global- and annual-averageincrease in downwelling irradiance at the tropopause from a doubling of CO2 (which seemsinevitable in the lifetime of many alive today) is roughly 4 W m-2. This perturbation in one ofthe key radiative flux components of Earth's climate system, a so-called radiative forcing ofclimate change, is usefully compared with the flux itself, ~325 W m-2 (Ramanathan, 1987;Kiehl and Trenberth, 1997), or hardly more than 1%. According to present understanding, assummarized in the 2001 assessment report of the Intergovernmental Panel on Climate Change(IPCC, 2001) such a slight radiative forcing would result in an increase in global meantemperature of 3 ± 1.5 K (IPCC). Such a change is again of order 1%, but such a globaltemperature change must be reckoned as potentially quite a serious perturbation to Earth'sclimate, given the fact that the difference between the present global mean temperature and thatin the last glacial ice age is 6 K (Folland et al., 2001). Perhaps just as important for decision

making is the uncertainty in the estimated temperature increase; a global mean temperatureincrease of 1.5 K would be of much less consequence to society than an increase of 4.5 K.Determining Earth's climate sensitivity, the change in global mean temperature that wouldresult from a given forcing, is thus a major objective of present research on climate change.
A key assumption underlying the climate sensitivity concept is that the global meantemperature change over a suitably long averaging period is proportional to the totality ofchanges in global mean radiative fluxes over that period. This radiative forcing hypothesis isthe basis for comparisons of magnitudes and uncertainties in radiative forcing of climatechange over the industrial period. Central to the quantitative understanding of climate changeover this period, whether through the use of global climate models or by empirical inference, isthe need to know, with sufficient accuracy, the total forcing over this period.
In its 2001 assessment the IPCC identified the key contributors to radiative forcing ofclimate change and provided estimates of the magnitudes and uncertainties of these forcings,as shown in Figure 1. In addition to forcings due to changes in concentrations of long- andshort-lived greenhouse gases (GHGs) the IPCC identified forcings due to light scattering andabsorption by aerosols in clear (cloud-free) air and changes in cloud microphysical properties
Level of Scientific Understanding
-2
-1
0
1
2
3
Rad
iativ
e fo
rcin
g (
Wat
ts p
er s
quar
e m
etre
)
Coo
ling
War
min
g
High Medium Medium Low VeryLow
VeryLow
VeryLow
VeryLow
VeryLow
VeryLow
CO2
VeryLow
CH4
N2OHalocarbons
Stratosphericozone
Troposphericozone
Sulphate
Blackcarbon from
fossilfuel
burning
Organic carbon
from fossilfuel
burning
Biomassburning
Contrails
SolarMineral
Dust
Aerosolindirect effect
Land-use
(albedo) only
Aviation-induced
Cirrus
VeryLow
Aerosols
TotalForcing
TotalAerosolForcing
Figure 1. Global mean radiative forcing of climate change for the year 2000 relative to 1750 as givenby the Intergovernmental Panel on Climate Change (2001), shown in the left portion of the figure. Positivebars denote warming forcings; negative bars denote cooling forcings; I-beams denote estimated uncertainties.For mineral dust and the aerosol indirect effect no estimates of the forcing were given, only uncertaintyranges. Level of scientific understanding represents the subjective judgment of the IPCC working group onradiative forcing of the reliability of the forcing estimate. Bars and I-beams at right denote estimates of totalaerosol forcing, total forcing, and associated uncertainties. First bar denotes total aerosol forcing evaluated asalgebraic sum of IPCC aerosol forcings, with mineral dust and aerosol indirect forcings taken as zero; forsecond bar these forcings are taken as the mid-points of the IPCC uncertainty ranges. Third and fourth barsdenote total forcing evaluated in the same way, again with mineral dust and aerosol indirect forcings taken aszero and as the mid-points of the IPCC uncertainty ranges, respectively. For each bar two uncertaintyestimates are provided. Upper and lower limits of the first (larger) uncertainty range are calculated as algebraicsum of upper and lower limits, respectively, of the uncertainties of the several forcings. Upper and lowerlimits of the second (smaller) uncertainty range are calculated as square root of the sum of the squares,respectively, of the upper and lower uncertainty ranges relative to the estimated forcings denoted by the bars.

by aerosols as key contributors to radiative forcing of climate change, most likely exerting acooling influence but of highly uncertain magnitude. If the total aerosol forcing is negative,that is exerting a cooling influence, then this aerosol forcing would be offsetting a fraction,perhaps a substantial fraction, of the warming forcing due to increased concentrations ofGHGs. Importantly in the context of this conference on atmospheric aerosols these aerosolinduced forcings are considered the greatest source of uncertainty in the totality of radiativeforcing over the industrial period. The present uncertainties in aerosol forcing precludeaccurate assessment of the total forcing over the industrial period; the total forcing over theindustrial period might be substantially lower (or greater) than the forcing due to GHGs alone(Boucher and Haywood, 2002; Gregory, 2002). For a given amount of warming over theindustrial period, a lower (greater) forcing would imply a greater (lower) climate sensitivity,(Gregory, 2002).
Of the several aerosol forcings identified, the so-called indirect forcing, arising from theinfluence of anthropogenic aerosols on the microphysical, optical, and radiative properties ofclouds is considered to be the most uncertain. As a consequence of this uncertainty the IPCCpanel declined to provide an estimate of this forcing, indicating, rather, a likely range (0 to -2W m-2). This uncertainty range is quite wide relative to both the magnitude and uncertainty offorcing by the long-lived GHGs (+2.45 ± 0.4 W m-2). As the uncertainty in aerosol forcingdominates the uncertainty in the total radiative forcing of climate change over the industrialperiod, as indicated by the uncertainties indicated on the total forcing at the right-hand side ofFigure 1, the uncertainty in aerosol forcing assumes a major importance in understanding andquantifying climate change over the industrial period. It is thus clear that quantification of thisforcing must be greatly improved if the uncertainty in forcing, and hence in climate sensitivity,is to be substantially reduced.
Two approaches seem available to identifying indirect forcing and quantifying it onclimatologically relevant scales–observational and modeling–but neither is entirelystraightforward. Suppose it proved possible to determine cloud albedo by satellitemeasurements with sufficient global coverage to be representative: how then might oneidentify and quantify the anthropogenic enhancement? The alternative approach, first-principles modeling would seem intellectually satisfying, but there are many gaps in presentunderstanding of the pertinent processes and consequently large modeling uncertainties.
This presentation examines present knowledge and some new developments in theunderstanding of aerosol indirect forcing of climate change and points to some importantfuture directions.
PHYSICAL BASIS OF INDIRECT FORCING
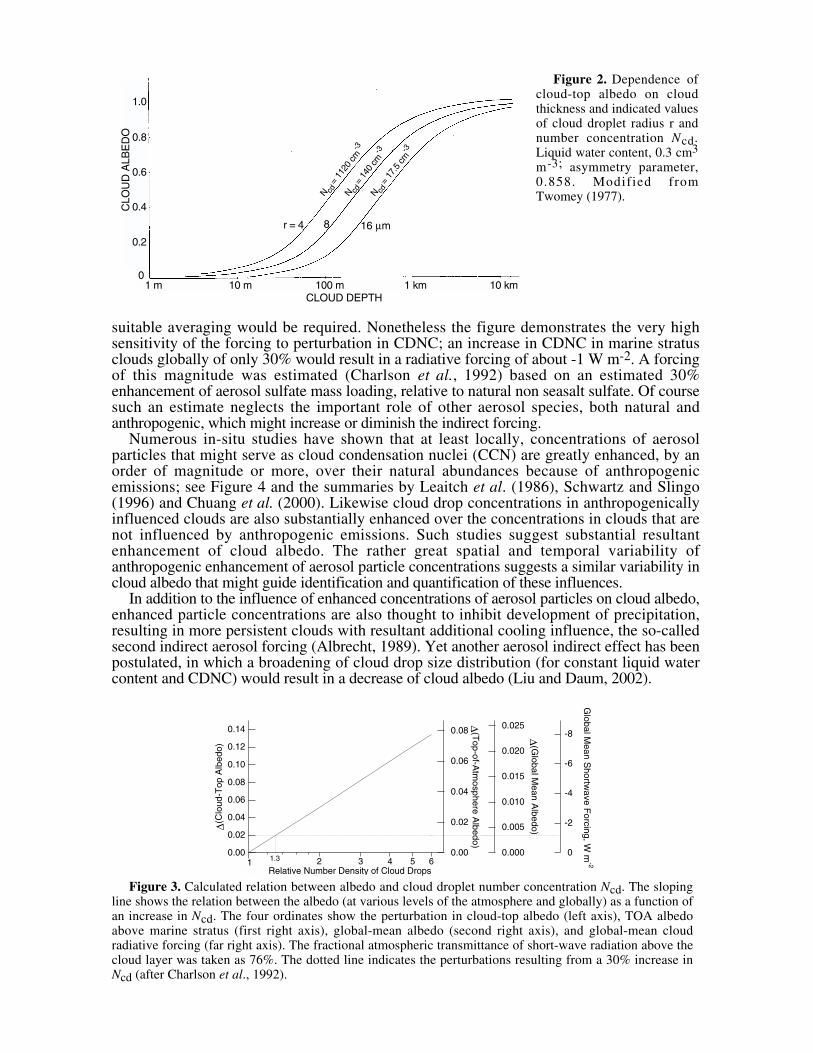
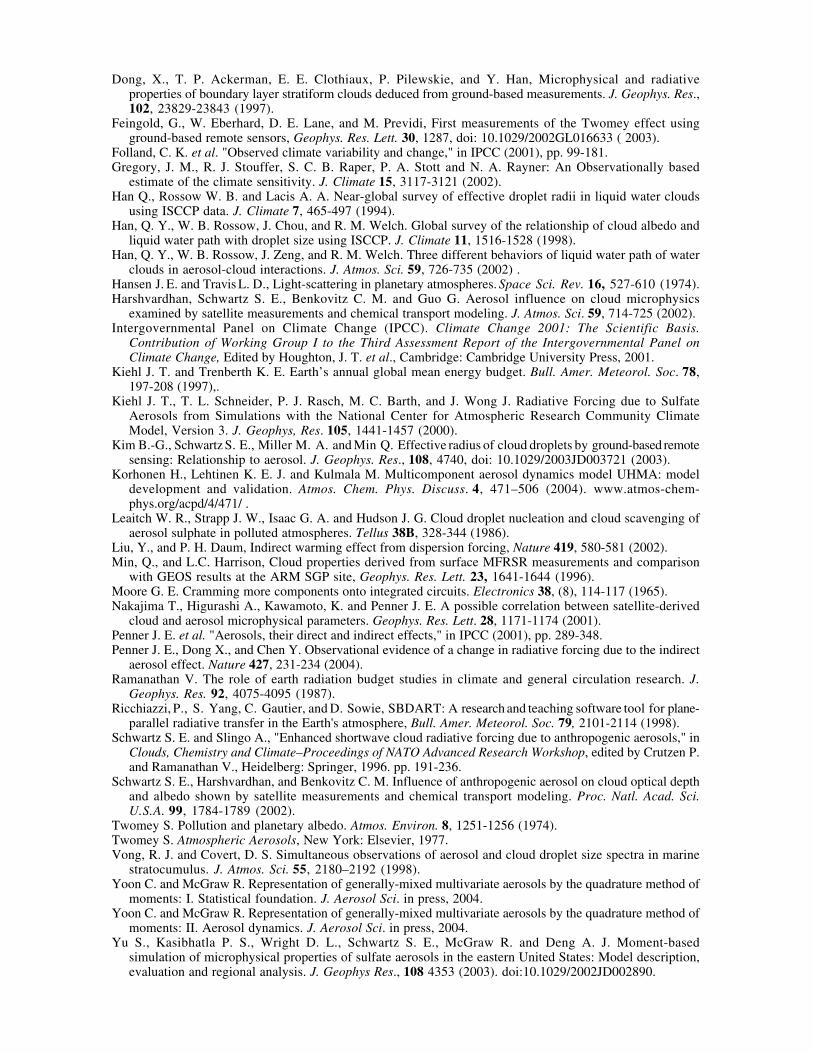
While influences of anthropogenic aerosols on cloud properties and precipitationdevelopment had been recognized for some time, it was the seminal work of Sean Twomey inthe 1970s (Twomey, 1974) that first called attention to the possible climatic influence throughthe mechanism of increased cloud droplet number concentration (CDNC) and resultantenhancement of cloud reflectivity, now commonly referred to as the "first indirect aerosoleffect" or often the "Twomey effect." This effect is manifested as an enhancement in cloud-top reflectivity associated with an increase in CDNC at a given cloud physical thickness underassumption of fixed cloud liquid water content, Figure 2. The assumption of fixed liquid watercontent is based on the assumption that this liquid water content is governed bythermodynamics and would not be expected to hold under conditions in which water has beenappreciably removed from the cloud by precipitation. For clouds of intermediate optical depththe enhancement in cloud-top reflectance and resultant radiative forcing can be substantial foreven a slight increase in CDNC. The magnitude of this effect can be illustrated in a number ofways. Figure 3 shows that the enhancement of cloud-top reflectance, local top-of-atmospherereflectance, and global-average top-of-atmosphere reflectance and the resultant global-averageshortwave radiative forcing increase linearly with the logarithm of the ratio of the cloud dropletnumber concentration in the anthropogenically perturbed situation to that in the unperturbedsituation. In view of the nonlinearity of the forcing and nonuniform perturbations in CDNC,
r = 4 8 16 µm
N =
140
cm-3
cd
CLO
UD
ALB
ED
O
CLOUD DEPTH
N =
112
0 cm
-3
cd N =
17.
5 cm
-3
cd
0.2
0.4
0.6
0.8
1.0
010 m 100 m 1 km 10 km1 m
Figure 2. Dependence ofcloud-top albedo on cloudthickness and indicated valuesof cloud droplet radius r andnumber concentration Ncd.Liquid water content, 0.3 cm3
m-3; asymmetry parameter,0.858. Modified fromTwomey (1977).
suitable averaging would be required. Nonetheless the figure demonstrates the very highsensitivity of the forcing to perturbation in CDNC; an increase in CDNC in marine stratusclouds globally of only 30% would result in a radiative forcing of about -1 W m-2. A forcingof this magnitude was estimated (Charlson et al., 1992) based on an estimated 30%enhancement of aerosol sulfate mass loading, relative to natural non seasalt sulfate. Of coursesuch an estimate neglects the important role of other aerosol species, both natural andanthropogenic, which might increase or diminish the indirect forcing.
Numerous in-situ studies have shown that at least locally, concentrations of aerosolparticles that might serve as cloud condensation nuclei (CCN) are greatly enhanced, by anorder of magnitude or more, over their natural abundances because of anthropogenicemissions; see Figure 4 and the summaries by Leaitch et al. (1986), Schwartz and Slingo(1996) and Chuang et al. (2000). Likewise cloud drop concentrations in anthropogenicallyinfluenced clouds are also substantially enhanced over the concentrations in clouds that arenot influenced by anthropogenic emissions. Such studies suggest substantial resultantenhancement of cloud albedo. The rather great spatial and temporal variability ofanthropogenic enhancement of aerosol particle concentrations suggests a similar variability incloud albedo that might guide identification and quantification of these influences.
In addition to the influence of enhanced concentrations of aerosol particles on cloud albedo,enhanced particle concentrations are also thought to inhibit development of precipitation,resulting in more persistent clouds with resultant additional cooling influence, the so-calledsecond indirect aerosol forcing (Albrecht, 1989). Yet another aerosol indirect effect has beenpostulated, in which a broadening of cloud drop size distribution (for constant liquid watercontent and CDNC) would result in a decrease of cloud albedo (Liu and Daum, 2002).
-8
-6
-4
-2
0
Global M
ean Shortw
ave Forcing, W
m-2
0.025
0.020
0.015
0.010
0.005
0.000
∆(G
lobal Mean A
lbedo)
0.14
0.12
0.10
0.08
0.06
0.04
0.02
0.00
∆(C
loud
-Top
Alb
edo)
12 3 4 5 6
Relative Number Density of Cloud Drops
0.08
0.06
0.04
0.02
0.00
∆(T
op-of-Atm
osphere Albedo)
1
1.3
Figure 3. Calculated relation between albedo and cloud droplet number concentration Ncd. The slopingline shows the relation between the albedo (at various levels of the atmosphere and globally) as a function ofan increase in Ncd. The four ordinates show the perturbation in cloud-top albedo (left axis), TOA albedoabove marine stratus (first right axis), global-mean albedo (second right axis), and global-mean cloudradiative forcing (far right axis). The fractional atmospheric transmittance of short-wave radiation above thecloud layer was taken as 76%. The dotted line indicates the perturbations resulting from a 30% increase inNcd (after Charlson et al., 1992).

Figure 4. Summary (Chuanget al., 2000) of measurements ofthe relation between numberconcentration of cloud droplets Ncdand below- or in-cloudaccumulation mode aerosolparticles Nap. Lines for the Vongand Covert (1998) data representthe envelope of their data (for highand low liquid water contentcases). Best-fit line (slope 0.48) isregression of all measurementsexcept for the Vong and Covertdata. The model data D1 and D2represent results of Chuang et al.(2000) for two size distributions.Reprinted from Tellus 52B 843-847 (2000). Permission pending.
QUANTIFYING INDIRECT FORCING IN REMOTE SENSING
Several studies have attempted to identify indirect forcing by anthropogenic aerosols usingsatellite remote sensing data. An important early study was that of Han et al. (1994), whichcompared zonal mean cloud drop effective radius re (ratio of third to second moment of thecloud drop size distribution, important for radiative transfer; Hansen and Travis, 1974), fromAVHRR (Advanced Very High Resolution Radiometer) measurements in the Northern andSouthern Hemispheres under the hypothesis that anthropogenic aerosols, predominantly inthe Northern Hemisphere would lead to an enhancement of CDNC relative to the SouthernHemisphere and resultant decrease in cloud drop radius. Comparisons were made separatelyfor continental and maritime clouds. Effective radii were smaller in the NH (average 11.6 µmfor maritime clouds; 8.2 µm for continental clouds) than in the SH (12.0 µm and 9.0 µm,respectively), Figure 5. For fixed liquid water content, a decrease in effective radius by 3.4%and 10%, for maritime and continental clouds respectively, would correspond to an increase inCDNC by 10% and 30%, respectively, and might be expected to result in an enhancement incloud-top albedo of 0.007 and 0.02, respectively. However subsequent examination by thesame group (Han et al., 1998) of interhemispheric differences in cloud albedo determined bythe International Satellite Cloud Climatology Project (ISCCP) failed to reveal any systematicindication of aerosol influence. This was attributed to lack of constancy of cloud liquid waterpath as a function of cloud droplet size (Han et al., 1998, 2002).
Figure 5. Annual (four-seasonal-month) average, zonal mean water clouddroplet effective radii for 1987 fromanalysis of NOAA-9 AVHRR radiances.From Han et al. (1994).

Several studies have attempted to identify and quantify aerosol indirect forcing in satellite-based sensing by examination of correlations between cloud albedo (or other microphysicalproperties) and proximate remotely sensed aerosol properties. Nakajima et al., (2001)compared monthly-average cloud and clear-aerosol properties determined from AVHRRradiance measurements. Retrieved quantities included aerosol optical depth τc aerosol particlecolumn number concentration Na, cloud optical depth, cloud drop effective radius, and clouddrop column number concentration Nc. Taking advantage of the large spatial variation in thesequantities they were able to adduce correlations among the several quantities, including apositive sublinear correlation of Nc with Na, log ( . . ) ( . . )log10 101 80 0 43 0 50 0 07N Nc a= ± + ± ;here Na and Nc are in particles cm-2. Effective radius re decreased from about 15 µm at low Nato about 12 µm at high Na. Bréon et al. (2002) examined spatial correlation of monthly meanre with monthly mean aerosol index (a measure of aerosol loading) in data from the POLDER(POLarization and Directionality of the Earth's Reflectances) satellite-borne radiometer.Effective radius decreased with increasing aerosol index from about 11 µm (ocean) or 9 µm(land) to about 8 µm.
Indication of a remarkably strong aerosol influence on cloud albedo was found in anexamination (Chameides et al., 2002) of correlation of cloud optical depth (from ISCCP) andmodeled anthropogenic aerosol for China and neighboring regions, Figure 6. Values of R2,the square of the Pearson product-moment correlation coefficient, were approximately 0.6 forcorrelation between modeled four-seasonal-month average (Nov. 1994; Jan., April, and July1995) column mass burden of anthropogenic aerosol (sulfate, nitrate, ammonium organiccarbon, other organic elements, and elemental carbon) and annual average (1993) low-cloudand total cloud optical depth and cloud amount. While such high correlations are indicative ofcoherent long-term average spatial patterns of aerosol concentration and cloud optical depth, itis not clear whether the high optical depth is causally related to the high aerosol loading or ismerely a consequence of persistent clouds in this region of China north of the Tibetan plateauand high anthropogenic aerosol concentrations resulting from high emissions and persistentinversions in this region. What would seem to be required to ascribe enhancement of cloudoptical depth to aerosols is analysis of short-term situations of comparable cloud liquid waterbut variable aerosol loading to see if the correlation persists.
Figure 6. F o u r - m o n t haverage (Nov. 1994; Jan., April,and July 1995) distributions ofmodeled column-integrated (top-left) and boundary-layerconcentration (top-right) ofanthropogenic aerosols, andannual-average ISCCP-derivedtotal-cloud optical depth for1993 (bottom-left) and 1990(bottom-right). From Chameideset al. (2002).
An alternative approach, which thus far has seen only limited application is based onexamination of temporal variation of cloud properties and aerosol loading in a region. A recentstudy by our group in collaboration with Harshvardhan of Purdue University (Harshvardhanet al., 2002; Schwartz et al., 2002) examined cloud properties determined from AVHRRradiance measurements in conjunction with output of a chemical transport model (Benkovitz et

al., 1994, 2001) to examine dependence of cloud properties on sulfate aerosol concentration.The study examined the time dependence of cloud properties in 5˚ × 5˚ regions of the NorthAtlantic well removed from local sources during specific episodes of transport from NorthAmerica or Europe during which sulfate concentrations increased and then decreased overseveral-day periods. The AVHRR measurements, which were each afternoon, local time,provide high resolution (1 km × 4 km) data of visible, near infrared, and thermal infraredirradiance. Only low clouds (cloud top temperatures greater than 260 K as determined fromthermal infrared) were examined, and rigorous attention was given to exclusion of potentiallyinhomogeneous pixels by comparison of examined pixels with adjacent pixels. FollowingNakajima and Nakajima (1995) we used visible and near infrared data to determine cloud dropeffective radius and cloud visible optical depth τc. These measurements allowed determinationof cloud liquid water path (LWP) as L r= ( / )3 2 ρ τw c e where ρw is density of liquid water. Ingeneral we have found that LWP is highly variable spatially, presumably as a consequence oflocally variable cloud dynamics. As a consequence cloud optical depth and cloud albedo aresimilarly highly variable. This variability undoubtedly limits ability to infer or quantify aerosolindirect effects from examination of cloud albedo. Examination on any given day of thedependence of cloud optical depth on LWP showed, not surprisingly, a strong dependence, asLWP is the dominant influence on cloud optical depth. It is possible to use this variation toadvantage to identify day-to-day differences in effective radius from the slopes of a plots ofoptical depth versus LWP, that slope being inversely proportional to re. Comparison of theslopes of such plots over the course of the several-day episodes revealed substantial variationof effective radius, as illustrated in Figure 7 for an episode of transport of European sulfate toa location ~1200 km west of Ireland.
6004002000
16 128 4 re = µm
1705 UTC8 April
6004002000
16 128 4 re = µm
1524 UTC8 April
6004002000
16 128 4 re = µm
1534 UTC7 April
16 128 4 re = µm
1555 UTC5 April
60
40
20
06004002000
16 128 4 re = µm
1544 UTC6 April
16 128 4 re = µm
1606 UTC4 April
60
40
20
0
16 128 4 re = µm
1628 UTC2 April
Liquid Water Path, g m-2
Clo
ud O
ptic
al D
epth
τ c
16 128 4 re = µm
1617 UTC3 April
Figure 7. Pixel-average cloud optical depth τc as a function of vertical cloud liquid water path for eightsatellite overpasses over a study area 50-55˚N, 25-30˚W, for April 2-8, 1987; two sets of data are shown forApril 8, for which the study area was within range of the satellite on two successive overpasses. Data pointswith τc > 70 are plotted at τc = 70 because of insensitivity of retrieval method at high optical depth; thesepoints are evident as horizontal clusters at τc = 70. Data points with τc <~ 3 were excluded to eliminatepixels that could be covered by haze but not clouds. Lines denote cloud optical depth for indicated constantvalues of effective radius re. From Schwartz et al. (2002).
The variation over the course of the episode of sulfate concentration and of several cloudproperties derived from the satellite measurements, summarized in Figure 8, illustrates severalimportant features of this data set. First the modeled sulfate column burden (vertical integralof concentration) exhibited a marked increase and then decrease over the course of the 6-dayperiod. In contrast there was no evident trend in cloud optical depth or albedo derived fromthis optical depth, and on any given day these quantities can exhibit excursions throughout

120
80
40
0Sul
fate
, µm
ol m
-2
60
40
20O
ptic
al D
epth
0.9
0.8
0.7
0.6Sph
. Alb
edo
20
15
10
5
Eff.
Rad
., µm
500
300
100
LW P
ath,
g m
-2
0.2
0.1
0.0∆ S
ph. A
lbed
o
-100
-50
0
For
cing
, W m
-2
98765432
Date, April, 1987
a
b
c
d
e
f
g
Figure 8. Time series of sulfate columnburden from chemical transport model and pixel-average (1 km × 4 km) cloud properties determinedfrom satellite retrievals over mid North Atlantic,25-30˚W, 50-55˚N, April 2-8, 1987. a) Modeledsulfate column burden, obtained by interpolation ofmodel output at 6-h intervals; b) optical depth, τc;c) cloud-top spherical albedo, αsph; d) liquid waterpath, LWP; e) effective radius at cloud top, re; f)enhancement of cloud-top spherical albedo relativeto that calculated for April 2 for the same LWPdistribution; g ) radiative forcing at top ofatmosphere, relative to April 2, calculated for LWP= 100 g m-2 and solar zenith angle 60˚. Bars denotecentral 80% of the data; ticks note upper quartile,median, and lower quartile. Two sets of data areshown for April 8, for which the study area waswithin range of the satellite on two successiveoverpasses. Dates and times are UTC. FromSchwartz et al. (2002).
most of the observational range of the entire data set. There was likewise considerablevariation in LWP, although there is a discernible trend, actually, to increased LWP toward themiddle of the episode; such a variation is likely under control of larger-scale dynamics ratherthan microphysics, as any inhibition of precipitation by incremental sulfate would result in anincrease in LWP. In contrast there is a marked decrease in cloud drop effective radius that iscoherent with the increase in sulfate, which would be consistent with the first indirect effect.
The influence of enhanced aerosol loading on cloud spherical albedo αsph is examined inFigure 9. While the dominant influence on cloud albedo is LWP, marked day-to-daydifferences are readily apparent in graphs of cloud spherical albedo versus LWP. The clustersof data points for the several days are distinctly segregated, manifesting the differentdependences on the several days. Also shown in the figure are curves representing thedependence of αsph on LWP for specific values of cloud-top effective radius, re = 4, 8, and 16µm. These curves, which may be directly compared to those given by Twomey (Figure 2above), explicitly show the increase in modeled cloud albedo with decreasing drop radius for agiven LWP. The aerosol influence is similarly manifested in the data by the points at a givenLWP exhibiting a higher cloud albedo on days with higher aerosol loading. Thus, althoughthe aerosol influence is not evident in comparisons of the aggregate cloud albedo for theseveral days (Figure 8f), at any given LWP cloud albedo was greater on April 5, at the peak ofthe sulfate incursion, than on April 7, toward the end of the episode, or on April 2, prior to theepisode.
The enhancement in cloud albedo between the high sulfate, low re day (April 5) and the lowsulfate, high re day prior to the episode (April 2) is shown in Figure 10, evaluated as thedifference between αsph calculated from τc and re obtained from satellite data for April 5 andαsph calculated for the same LWP using a linear fit of τc to LWP for the April 2 data. Thisplot explicitly shows the amount by which αsph has been enhanced over what it would havebeen with the same LWP but with re characteristic of the unperturbed day, consistent with theTwomey mechanism for albedo enhancement by anthropogenic aerosols. Plotting theenhancement against LWP shows the maximum enhancement at intermediate values of LWP,for which the sensitivity to increased cloud-drop number concentration is the greatest. Theenhancement in αsph relative to April 2 evaluated in this way for the entire episode (Figure 8f)

0.9
0.8
0.7
0.6
0.5
0.4
0.3
Sph
eric
al A
lbed
o (0
.25
- 1.
19 µ
m)
102 3 4 5 6 7 8 9
1002 3 4 5 6 7 8 9
1000Liquid Water Path, g m-2
re =
8 16 µm
April 2
April 5
April 7
4
Figure 9. Pixel-average cloudspherical albedo as a function ofvertical cloud liquid water path, forthree satellite overpasses for the area50-55˚N, 25-30˚W for the indicateddates in April, 1987. Clusters ofpoints at albedo ~0.88 representpoints with τc > 70 for whichspherical albedo was calculated as ifτc = 70. Curves denote cloud albedofor indicated constant values ofeffective radius re. From Schwartz etal. (2002).
mirrors the excursions in effective radius and sulfate over this period. The correspondingradiative forcing, calculated for a solar zenith angle of 60˚ and constant assumed LWP of 100g m-2 (Figure 8g) approaches -85 W m-2 at the peak of the episode. While this calculationmay be somewhat artificial in view of the assumed effective radius of the base case, 17 µm,and the constant LWP, it nonetheless establishes the magnitude of the first indirect forcingthat may be experienced locally as a consequence of anthropogenic aerosol and highsensitivity of forcing to enhanced aerosol number concentration. Perhaps just as important,this study demonstrates the large day-to-day variation in cloud properties associated withvariation in aerosol properties. Such variation would seem to call into question inferences ofthe magnitude of aerosol indirect effect based on spatial correlations alone.
0.3
0.2
0.1
0.0
-0.1∆ S
pher
ical
Alb
edo,
∆ α
sph
102 3 4 5 6 7 8 9
1002 3 4 5 6 7
Liquid Water Path, g m-2
Figure 10. Enhancement of pixel-averagecloud spherical albedo ∆αsph on April 5, 1987,relative to that on April 2, as a function ofLWP, for 50-55˚N, 25-30˚W. ∆ α sph wasevaluated for each datum of April 5 as thedifference between αsph calculated using τc andre obtained from satellite data for that date and thevalue at the same LWP calculated using a linearfit of τc to LWP for April 2. Data points for τc> 70 (592 data out of a total of 6443), calculatedfor τc = 70, lie along the diagonal line at theupper right. From Schwartz et al. (2002).
An additional approach to remote sensing of the indirect aerosol effect is through ground-based remote sensing. Several groups (Min and Harrison, 1996; Dong et al, 1997; Feingold etal., 2003; Penner et al., 2004) have determined cloud microphysical properties throughmeasurements of liquid water path (microwave radiometer) cloud optical depth (by sunphotometry) and/or cloud drop radius (cloud radar). In our work (Kim et al., 2003) we havedetermined τc by narrow-band sun photometry at 415 nm, which minimizes sensitivity tosurface reflectance. The method is limited to complete overcast conditions (indicated in part bycoincidence of direct and total downwelling solar irradiance) because of photon diffusion inclouds as well as the wide field of view of the photometer. Cloud boundaries are determinedby cloud radar. LWP is determined by microwave radiometry. An example of the primary datais given in Figure 11 for measurements at a site in north central Oklahoma. Cloud optical

depth is determined by a radiation transfer model (Ricchiazzi et al., 1998). Cloud optical depthis in turn approximately equal to twice the vertical integral of the square of the cloud dropradius integrated over the drop size distribution:
τ π πc = ≈∫∫ ∫∫r Q r N r z drdz r N r z drdze2 22( ) ( , ) ( , ) (1)
where Qe(r), the extinction efficiency for a cloud droplet of radius r is equal to 2 within a fewpercent for cloud droplets of radius much greater than the wavelength of visible light.Similarly LWP is equal to (4π/3) times the vertical integral of the cube of the cloud dropradius integrated over the drop size distribution:
L r N r z drdzw= ∫∫43
3π ρ ( , ) (2)
from which the effective radius pertinent to the cloud as a whole is calculated as
rL
ew c
=32 ρ τ
. (3)
0
1
2
3
Alti
tude
(km
)
2000/04/13
00.30.60.91.21.5
Irr
adia
nce
(W
m-2
nm
-1)
totaldiffuse
0
0.3
0.6
0.9
1.2
Tra
nsm
ittan
ce
0
5
10
r e (µm
)
100
101
102
Op
tica
l Dep
th
101
102
103
LWP
(g m
-2)
Cloud
12 15 18 21 24
Time (UTC)
LWP
τc
a
b
c
d
e
Figure 11. Ground-based remote sensing of cloud microphysical properties. a) Time series of cloud-base and cloud-top heights; b) total horizontal and diffuse irradiances; c) atmospheric transmittance; d) cloudoptical depth τc and liquid water path LWP; and e) effective radius of cloud droplets re on April 13, 2000 atthe U. S. Department of Energy Atmospheric Radiation Measurement site in north central Oklahoma. Blackline indicates the period that satisfies requirements for determination of cloud optical depth and effectiveradius.

As indicated in Figure 11, both LWP and τc were found to vary substantially over the courseof the day, but the effective radius was remarkably constant. This situation was found to holdon all 13 days in 2000 which met the criteria for application of this method at themeasurement site. Thus in ground-based sensing also it is possible to turn the variation inLWP to advantage in inferring re; graphs of cloud optical depth versus LWP shown in Figure12 for the most part exhibit similar linear dependence similar to that seen in the remotesensing work, with slopes that differ substantially from day to day.
0
25
50
75
100
02/18
re=4 8 12 16 µm
03/15
re=4 8 12 16 µm
03/19
re=4 8 12 16 µm
0
25
50
75
100
04/13
re=4 8 12 16 µm
04/15
re=4 8 12 16 µm
05/19
re=4 8 12 16 µm
0
25
50
75
100
07/23
re=4 8 12 16 µm
10/05
re=4 8 12 16 µm
10/06
re=4 8 12 16 µm
0 250 500 750 1000
10/21
re=4 8 12 16 µm
0 250 500 750 1000
10/26
re=4 8 12 16 µm
0 250 500 750 1000
11/06
re=4 8 12 16 µm
LWP (g m-2)
Opt
ical
Dep
th
0 250 500 750 1000
Figure 12. Scatterplots of cloud optical depth (determined from radiometry at 415 nm) against cloudliquid water path determined from microwave radiometry, LWP, at the Atmospheric Radiation MeasurementProgram site in north central Oklahoma on 12 of 13 days in 2000 that met required conditions of fullyovercast sky. Lines denote cloud optical depth for indicated constant values of effective radius, re. From Kimet al. (2003).
To relate the cloud drop effective radius to aerosol loading we used as a surrogate for thatloading measurements of light scattering coefficient σsp that were made at the surfacesimultaneously with the remote sensing of the cloud properties. While some correlation wasobserved in the relation between re and σsp (R2 = 0.24 in a regression of log re vs. log σsp,Figure 13), it is evident that light scattering coefficient at the surface is not a good surrogatefor CCN concentration at cloud level and/or that there are additional influences on cloud dropeffective radius besides aerosol concentration. One unexplained feature of these results is theremarkable constancy in effective radius despite large variation in both τc and LWP. Clearlythese questions need to be resolved in future work, but the tools to do this seem at hand, atleast from the remote sensing perspective.
As was found in the satellite remote sensing studies, although the dominant influence oncloud albedo was LWP, as expected, there is a substantial day-to-day difference in thisdependence that is associated with re, Figure 14, and is thus putatively associated with aerosolloading. This influence on cloud albedo also translates into a radiative forcing; for solar zenithangle 60˚ and LWP = 100 g m-2, as effective radius decreases from 10.2 to 5.8 µm, asdetermined on different days, the resultant decrease in calculated net shortwave irradiance atthe top of the atmosphere (Twomey forcing) is about 50 W m-2.

3
4
5
6789
10
2
3
4
Clo
ud D
rop
Effe
ctiv
e R
adiu
s r e
(µm
)
12 3 4 5 6 7 8 9
102 3 4 5 6 7 8 9
1002
Aerosol Light Scattering Coefficient σsp
(Mm-1)
0218 0315 0319 0413 0415 0423 0519 0723 1005 1006 1021 1026 1106
Figure 13. Scatterplot (logarithmic axes) of 5-minute average cloud-drop effective radius re vs. lightscattering coefficient for submicrometer aerosol at 550 nm σsp. Data for individual days are distinguished bysymbol. Equation of regression is log re = 1.06 – 0.13 logσsp ; R2 = 0.24. Data for σsp are interpolated tomeasurement time of re, and gaps in σsp (but not re) are filled by interpolation. From Kim et al. (2003).
QUANTIFYING INDIRECT FORCING BY PROCESS MODELING
The ability of an aerosol particle to serve as a cloud condensation nucleus and therebyincrease the number concentration of cloud drops and thus exert an indirect radiative forcingdepends on its size and composition and on the supersaturation history that the particle willexperience. This history depends not only on the imposed supersaturation governed by watervapor, temperature and mean and turbulent velocities of the air parcel in which the particlefinds itself but also on the concentration of other aerosol particles in the vicinity of the particleand their activation spectra. Representing aerosol indirect forcing in climate models thusrequires representing the entire life cycle of aerosol particles that might serve as CCN (or thatmight not): emission of particles, with specification of composition and size, and gaseousprecursors; new particle formation in the atmosphere; evolution of the size distribution andcomposition by coagulation, uptake of condensable gases, and exchange and possible reactionof volatile gases; exchange of water vapor; activation to form cloud droplets; aqueous-phase
101
102
103
0.3
0.5
0.7
0.9
LWP (g m -2)
Spherica
l Alb
edo
re=5.8 7.8 10.2 m
02/1810/2110/26
Figure 14. Cloud top spherical albedo asa function of cloud liquid water path, LWP,calculated for measured LWP and optical depthat the Atmospheric Radiation Measurementsite in North Central Oklahoma on February18, October 21, and October 26, 2000.Curves denote cloud albedo for indicatedconstant values of effective radius, re. FromKim et al. (2003).

reaction in cloud droplets; in-cloud coagulation; gravitational fall of hydrometeors, clouddissipation by precipitation and evaporation, and removal of aerosol particles and precursorsfrom the atmosphere by dry and wet deposition. All of these processes must be modeled as afunction of location and time, and the pertinent three-dimensional transport processes mustalso be modeled. Finally, these processes must be represented in climate models as opposedsimply to forcing the climate model with an aerosol field calculated off line, for if the aerosolinfluences on climate are substantial, then the resultant climate modification must be accountedfor in the climate model calculation, for example, changes in radiation affecting the thermalstructure of the atmosphere and clouds, or increased cloud lifetime and displaced precipitation.
The aerosol properties and the processes governing them required to model the influence ofanthropogenic aerosols on cloud microphysical properties and the resultant radiative forcingare summarized in Table 1. Calculation of indirect aerosol forcing of climate change requiresknowledge of the anthropogenic enhancement for all properties and processes as well as ofthe interactions among the several aerosol substances, for example in uptake of volatile gasesaffecting new particle formation and the uptake of water affecting cloud droplet activation. Theindirect forcing is highly nonlinear; thus at a given cloud optical depth, the higher the initialCDNC, the lower the forcing that would result from a given increase in CDNC. This results,for example, in a strong dependence of the forcing by anthropogenic sulfate on the naturalabundance of sea salt aerosol. All quantities and processes must be known as a function oflocation x (2- or 3-dimensional) and time t. Optical properties and changes in radiative fluxesmust be known as a function of wavelength λ. There are substantial gaps in understanding ofnumerous aspects of these processes, for well specified conditions, in addition to theuncertainties attendant on the conditions in the actual atmosphere; there is uncertainty as wellin the ability to represent even known understanding in models. To date no satisfactoryanalysis has been conducted of the uncertainties associated with present knowledge of theseprocesses. Thus it would seem that estimates such as that by Penner et al. (2001, Table 5.15),which suggests the forcing due to the first indirect effect of sulfate aerosols as -1.4 W m-2,with a 2/3 uncertainty range from 0 to -2.8 W m-2 must be considered rudimentary at best.
Of course aerosol properties and influences must be represented in some statisticallymeaningful sense. It is not possible, nor should it be set up as a requirement, to model the fate
TABLE 1. Quantities and processes pertinent to description aerosol indirect forcing ofclimate change and the quantities on which their dependence must be known.
Quantity/Process Symbol Dependence on
Particle and gaseous precursoremissions
e(x, t, rap, χ) Radius rap, composition χ
Transport, chemical reaction,microphysical evolution
↓↓↓↓ Concentrations of precursors and other reagents,solar intensity; size dependent concentrationsof other aerosol species; 3-D winds, clouds . . .
Aerosol particle numberconcentration
nap(x, t, rap, χ) Radius, composition
Supersaturation spectrum nccn(s) Radius, composition, supersaturationsCloud formation and dissipation ↓↓↓↓ nccn(s), updraft velocity, turbulent intensity,
precipitation development, heating rate,entrainment . . .
Cloud drop number concentrationand properties
ncd(x, t, rcd, ω(λ)) Radius, single scatter albedo ω, wavelength λ
Cloud optics ↓↓↓↓ Cloud drop size distribution, Mie scattering
Cloud drop scattering andabsorption coefficients
{σsc, σac}(x, t, λ) Absorption by dissolved and suspended materials
Vertical integral ↓↓↓↓ Updrafts, entrainment
Cloud scattering and absorptionoptical depth
{τsc, τac}(x, t, λ) Cloud physical depth, liquid water path
Radiation transfer (3D) ↓↓↓↓ Cloud geometry, surface reflectance
Net spectral flux at top ofatmosphere
Ftoa(x, t, λ)

of every individual particle. Rather techniques should be developed to model the pertinentaerosol properties–that is properties of the suspension. How this will play out remains to beseen. Much emphasis is currently being given to attempting to represent the size distributiontypically by some sort of sectional approach, with the number of prognostic variables being oforder 50 (e.g., Korhonen et al., 2004), perhaps with the expectation that computational powerwill continue grow exponentially (Moore, 1965) to keep up with the computationalrequirements of representing such a high dimensionality in chemical transport models orclimate models. However it would seem that alternative approaches, such as moment basedrepresentations (Yu et al., 2003) may offer advantages as they are readily expandable into twoor more dimensions (e.g., size and composition) such that computational requirements scaleas the sum of a small number of variables (typically 6 or fewer) characterizing each dimensionrather than as the product of a considerably greater number of variables in each dimension.Moment methods may be readily combined with statistical approaches such as principalcomponents analysis, which also work with moments, allowing optimized variable selection andcoordinate number reduction for highly multivariate problems (Yoon and McGraw, 2004 a,b).
The consequences of the uncertainty in indirect forcing are quite substantial in the contextof interpretation of global climate change over the industrial period, from the perspective eitherof empirical interpretation of climate sensitivity from knowledge of the forcing andtemperature change over the industrial period (Gregory et al., 2002) or of evaluation of theperformance of climate models in representing climate change over this period. As an exampleone might note the study of Kiehl et al. (2000) who used the output of a chemical transportmodel for sulfate mass as the basis of a calculation of direct and indirect forcing by thisaerosol. Shown in Figure 15 is the geographical distribution of the total forcing (preindustrialto present) due to changes in CO2 and other long-lived greenhouse gases, ozone, and sulfateaerosol, calculated from the geographical distributions of the concentrations. The incrementalsulfate concentration field was the same for both calculations, with global average burden 0.74mg m-2 (preindustrial) and 2.97 mg m-2. The difference between the calculations was entirelyin the assumed relation between CDNC and sulfate mass concentration, both of which areconsistent with recent empirical correlations. The geographical pattern of the total forcing isqualitatively different in the two calculations, and the global mean total forcing differs by more
Figure 15. Global average(at upper left of each panel) andgeographical distribution ofannual-average radiative forcingof climate change due toenhanced concentrations oflong-lived greenhouse gases,ozone, and sulfate aerosol(direct and first indirect forcingonly). The two panels presentresults for sulfate indirectforcing calculated by twodifferent relations betweenc l o u d d r o p n u m b e rconcentration and sulfateconcentration. Dashed contour(0) demarcates regions ofpositive and negative forcing.From Kiehl et al. (2000).

than a factor of 25, from a very small 0.05 W m-2 to a much more appreciable 1.42 W m-2
(indirect sulfate aerosol forcing 1.78 W m-2 and 0.42 W m-2, respectively). This comparisonacutely illustrates the consequences of the present latitude in calculation of radiative forcingover the industrial period due to uncertainty in aerosol indirect forcing.
CONCLUSIONS
There is now abundant evidence of the importance of aerosol indirect forcing of climatechange in the context of anthropogenic forcings over the industrial period. However thisforcing remains highly uncertain. So far it has proved difficult to quantify the indirect forcingof anthropogenic aerosols on global scales, by satellite or other remote sensing measurements.Likewise, there are many barriers remaining to developing understanding and model-basedrepresentation of this forcing. For example, even though the principles of cloud dropactivation seem well understood based on classic Köhler theory, it has proved difficult toquantitatively relate the number concentration of aerosol particles or the number spectrum ofCCN as a function of supersaturation to the number concentration of cloud drops in actualclouds. This understanding is but one of many essential components of any effort to representindirect aerosol forcing in climate models.
In its 2001 assessment of the several forcings of climate change the IntergovernmentalPanel on Climate Change characterized the level of scientific understanding of the aerosolindirect forcing as "very low." Perhaps it would be more accurately stated that although therehave been substantial increases in understanding this forcing, the ability to quantify it remainsvery low and will continue to remain very low unless and until much more effort is directed toobservationally quantifying it and to understanding the governing processes.
Acknowledgments
I am indebted to numerous colleagues at Brookhaven National Laboratory and elsewherefor their contributions to the research in our group, some of which is presented here,especially Carmen Benkovitz, Robert McGraw, Byung-Gon Kim, and Harshvardhan (PurdueUniversity). This research was supported by the Climate Change Research Division of theU.S. Department of Energy (DOE) and was performed under the auspices of DOE underContract No. DE-AC02-98CH10886.
References
Albrecht B. A. Aerosols, cloud microphysics, and fractional cloudiness. Science 245, 1227-1230 (1989).Benkovitz C. M., Berkowitz C. M., Easter R. C., Nemesure S., Wagener R. and Schwartz S. E. Sulfate over the
North Atlantic and adjacent continental regions: Evaluation for October and November 1986 using a three-dimensional model driven by observation-derived meteorology. J. Geophys. Res. 99 , 20725-20756 (1994).
Benkovitz C. M., Miller M. A., Schwartz S. E. and Kwon O-U. Dynamical influences on the distribution andloading of SO2 and sulfate over North America, the North Atlantic and Europe in April 1987. Geochem.Geophys. Geosyst. 2 , Paper 2000GC000129 (2001). http://www.agu.org/journals/gc/gc0106/2000GC000129/zfs2000GC000129.html .
Boucher O. and Haywood J. On summing the components of radiative forcing of climate change. ClimateDynamics 18, 297-302 (2001).
Bréon F. M., Tanré D., and Generoso S. Aerosol effect on cloud droplet size monitored from satellite. Science295, 834-838 (2002).
Chameides W. L., Luo C., Saylor R., Streets D., Huang Y., Bergin M., and Giorgi F. Correlation betweenmodel-calculated anthropogenic aerosols and satellite-derived cloud optical depths: Indication of indirecteffect? J. Geophys. Res., 107, doi: 10.1029/2000JD000208 (2002).
Charlson R. J., Schwartz S. E., Hales J. M., Cess R. D., Coakley J. A., Jr., Hansen J. E. and Hofmann D.J. Climate forcing by anthropogenic aerosols. Science 255, 423-430 (1992).
Chuang, P. Y., D. R. Collins, H. Pawlowska, J. R. Snider, H. H. Jonsson, J. L. Brenguier, R. C. Flagan,and J. H. Seinfeld, CCN Measurements during ACE-2 and their Relationship to Cloud MicrophysicalProperties, Tellus 52B, 843-857 (2000).
Dong, X., T. P. Ackerman, E. E. Clothiaux, P. Pilewskie, and Y. Han, Microphysical and radiativeproperties of boundary layer stratiform clouds deduced from ground-based measurements. J. Geophys. Res.,102, 23829-23843 (1997).
Feingold, G., W. Eberhard, D. E. Lane, and M. Previdi, First measurements of the Twomey effect usingground-based remote sensors, Geophys. Res. Lett. 30, 1287, doi: 10.1029/2002GL016633 ( 2003).
Folland, C. K. et al. "Observed climate variability and change," in IPCC (2001), pp. 99-181.Gregory, J. M., R. J. Stouffer, S. C. B. Raper, P. A. Stott and N. A. Rayner: An Observationally based
estimate of the climate sensitivity. J. Climate 15, 3117-3121 (2002).Han Q., Rossow W. B. and Lacis A. A. Near-global survey of effective droplet radii in liquid water clouds
using ISCCP data. J. Climate 7, 465-497 (1994).Han, Q. Y., W. B. Rossow, J. Chou, and R. M. Welch. Global survey of the relationship of cloud albedo and
liquid water path with droplet size using ISCCP. J. Climate 11, 1516-1528 (1998).Han, Q. Y., W. B. Rossow, J. Zeng, and R. M. Welch. Three different behaviors of liquid water path of water
clouds in aerosol-cloud interactions. J. Atmos. Sci. 59, 726-735 (2002) .Hansen J. E. and Travis L. D., Light-scattering in planetary atmospheres. Space Sci. Rev. 16, 527-610 (1974).Harshvardhan, Schwartz S. E., Benkovitz C. M. and Guo G. Aerosol influence on cloud microphysics
examined by satellite measurements and chemical transport modeling. J. Atmos. Sci. 59, 714-725 (2002).Intergovernmental Panel on Climate Change (IPCC). Climate Change 2001: The Scientific Basis.
Contribution of Working Group I to the Third Assessment Report of the Intergovernmental Panel onClimate Change, Edited by Houghton, J. T. et al., Cambridge: Cambridge University Press, 2001.
Kiehl J. T. and Trenberth K. E. Earth’s annual global mean energy budget. Bull. Amer. Meteorol. Soc. 78,197-208 (1997),.
Kiehl J. T., T. L. Schneider, P. J. Rasch, M. C. Barth, and J. Wong J. Radiative Forcing due to SulfateAerosols from Simulations with the National Center for Atmospheric Research Community ClimateModel, Version 3. J. Geophys, Res. 105, 1441-1457 (2000).
Kim B.-G., Schwartz S. E., Miller M. A. and Min Q. Effective radius of cloud droplets by ground-based remotesensing: Relationship to aerosol. J. Geophys. Res., 108, 4740, doi: 10.1029/2003JD003721 (2003).
Korhonen H., Lehtinen K. E. J. and Kulmala M. Multicomponent aerosol dynamics model UHMA: modeldevelopment and validation. Atmos. Chem. Phys. Discuss. 4, 471–506 (2004). www.atmos-chem-phys.org/acpd/4/471/ .
Leaitch W. R., Strapp J. W., Isaac G. A. and Hudson J. G. Cloud droplet nucleation and cloud scavenging ofaerosol sulphate in polluted atmospheres. Tellus 38B, 328-344 (1986).
Liu, Y., and P. H. Daum, Indirect warming effect from dispersion forcing, Nature 419, 580-581 (2002).Min, Q., and L.C. Harrison, Cloud properties derived from surface MFRSR measurements and comparison
with GEOS results at the ARM SGP site, Geophys. Res. Lett. 23, 1641-1644 (1996).Moore G. E. Cramming more components onto integrated circuits. Electronics 38, (8), 114-117 (1965).Nakajima T., Higurashi A., Kawamoto, K. and Penner J. E. A possible correlation between satellite-derived
cloud and aerosol microphysical parameters. Geophys. Res. Lett. 28, 1171-1174 (2001).Penner J. E. et al. "Aerosols, their direct and indirect effects," in IPCC (2001), pp. 289-348.Penner J. E., Dong X., and Chen Y. Observational evidence of a change in radiative forcing due to the indirect
aerosol effect. Nature 427, 231-234 (2004).Ramanathan V. The role of earth radiation budget studies in climate and general circulation research. J.
Geophys. Res. 92, 4075-4095 (1987).Ricchiazzi, P., S. Yang, C. Gautier, and D. Sowie, SBDART: A research and teaching software tool for plane-
parallel radiative transfer in the Earth's atmosphere, Bull. Amer. Meteorol. Soc. 79, 2101-2114 (1998).Schwartz S. E. and Slingo A., "Enhanced shortwave cloud radiative forcing due to anthropogenic aerosols," in
Clouds, Chemistry and Climate–Proceedings of NATO Advanced Research Workshop, edited by Crutzen P.and Ramanathan V., Heidelberg: Springer, 1996. pp. 191-236.
Schwartz S. E., Harshvardhan, and Benkovitz C. M. Influence of anthropogenic aerosol on cloud optical depthand albedo shown by satellite measurements and chemical transport modeling. Proc. Natl. Acad. Sci.U.S.A. 99, 1784-1789 (2002).
Twomey S. Pollution and planetary albedo. Atmos. Environ. 8, 1251-1256 (1974).Twomey S. Atmospheric Aerosols, New York: Elsevier, 1977.Vong, R. J. and Covert, D. S. Simultaneous observations of aerosol and cloud droplet size spectra in marine
stratocumulus. J. Atmos. Sci. 55, 2180–2192 (1998).Yoon C. and McGraw R. Representation of generally-mixed multivariate aerosols by the quadrature method of
moments: I. Statistical foundation. J. Aerosol Sci. in press, 2004.Yoon C. and McGraw R. Representation of generally-mixed multivariate aerosols by the quadrature method of
moments: II. Aerosol dynamics. J. Aerosol Sci. in press, 2004.Yu S., Kasibhatla P. S., Wright D. L., Schwartz S. E., McGraw R. and Deng A. J. Moment-based
simulation of microphysical properties of sulfate aerosols in the eastern United States: Model description,evaluation and regional analysis. J. Geophys Res., 108 4353 (2003). doi:10.1029/2002JD002890.