Embed Size (px)
Citation preview

Atmos. Chem. Phys., 12, 4723–4742, 2012www.atmos-chem-phys.net/12/4723/2012/doi:10.5194/acp-12-4723-2012© Author(s) 2012. CC Attribution 3.0 License.
AtmosphericChemistry
and Physics
Aerosol chemical composition at Cabauw, The Netherlands asobserved in two intensive periods in May 2008 and March 2009
A. A. Mensah1,*, R. Holzinger2, R. Otjes3, A. Trimborn 1, Th. F. Mentel1, H. ten Brink 3, B. Henzing4, andA. Kiendler-Scharr 1
1Institut fur Energie- und Klimaforschung: Troposphare (IEK 8), Forschungszentrum Julich GmbH, Julich, Germany2Institute for Marine and Atmospheric research Utrecht (IMAU), Utrecht, The Netherlands3Energy research Centre of The Netherlands (ECN), Petten, The Netherlands4Netherlands Organisation for Applied Scientific Research (TNO), Utrecht, The Netherlands* now at: Institute of Atmospheric and Climate Science (IAC), ETH Zurich, Zurich, Switzerland
Correspondence to:A. A. Mensah ([email protected]) and A. Kiendler-Scharr ([email protected])
Received: 5 September 2011 – Published in Atmos. Chem. Phys. Discuss.: 12 October 2011Revised: 28 April 2012 – Accepted: 2 May 2012 – Published: 30 May 2012
Abstract. Observations of aerosol chemical composition inCabauw, the Netherlands, are presented for two intensivemeasurement periods in May 2008 and March 2009. Sub-micron aerosol chemical composition was measured by anAerodyne Aerosol Mass Spectrometer (AMS) and is com-pared to observations from aerosol size distribution measure-ments as well as composition measurements with a Mon-itor for AeRosol and GAses (MARGA) based instrumentand a Thermal-Desorption Proton-Transfer-Reaction Mass-Spectrometer (TD-PTR-MS). An overview of the data is pre-sented and the data quality is discussed. In May 2008 en-hanced pollution was observed with organics contributing40 % to the PM1 mass. In contrast the observed averagemass loading was lower in March 2009 and a dominance ofammonium nitrate (42 %) was observed. The semi-volatilenature of ammonium nitrate is evident in the diurnal cy-cles with maximum concentrations observed in the morninghours in May 2008 and little diurnal variation observed inMarch 2009. Size dependent composition data from AMSmeasurements are presented and show a dominance of or-ganics in the size range below 200 nm. A higher O:C ratio ofthe organics is observed for May 2008 than for March 2009.Together with the time series of individual tracer ions thisshows the dominance of OOA over HOA in May 2008.
1 Introduction
Aerosol particles directly and indirectly affect the global cli-mate. Depending on their optical properties, particles canscatter or absorb long and short wave radiation. This can havecooling or heating effects on the atmosphere and has thusa direct impact on the radiation balance of the Earth (e.g.global dimming, Nazarenko and Menon, 2005; Ramanathanet al., 2007; Romanou et al., 2007). Aerosol particles alsoexhibit a range of indirect effects in acting as cloud con-densation nuclei (CCN). Changes in particle number con-centration and size distribution alter cloud albedo (Norrisand Wild, 2007) and can cause suppression or enhancementof rain (Nober et al., 2003; Tao et al., 2007; Phillips et al.,2002). The IPCC report 2007 identifies aerosol particles asthe major uncertainty in the prediction of future climaticconditions (IPCC, 2007). Aerosol particles are providing thesurface for heterogeneous reactions, thus affect the atmo-spheric lifetime of atmospheric trace constituents (Dentenerand Crutzen, 1993). Furthermore, aerosol particles controlthe visibility and are associated with health hazards suchas increased cardiopulmonary (Moolgavkar et al., 1994) orlung cancer mortality (Pope et al., 2002). Apart from water,the major constituents found in atmospheric aerosol particlesare sulfate, nitrate, ammonium, minerals, black carbon (BC)and organic components often referred to as organic matter(OM) (Rogge et al., 1993). The fractional abundance of the
Published by Copernicus Publications on behalf of the European Geosciences Union.

4724 A. A. Mensah et al.: Aerosol chemical composition at Cabauw
individual constituents is strongly dependent on the particlesorigin and processing during their atmospheric lifetime.
Ammonium nitrate is a major component of the PM1mass in polluted regions of Europe where reductions in sul-fur dioxide emissions have reduced the occurrence of am-monium sulfate (Monks et al., 2009). Also the ubiquity oforganic components in boundary layer aerosol particles iswell documented (Zhang et al., 2007). Recently Jimenez etal. (2009) pointed out that atmospheric aging lowers the or-ganic aerosol volatility and thus enhances the persistence ofthe particulate organic aerosol fraction and their hygroscopicproperties (Jimenez et al., 2009; Morgan et al., 2010b). Theinorganic particulate aerosol is well characterized in CentralEurope in general and especially at the measurement locationof the campaigns presented in this paper (Schaap et al., 2011;Weijers et al., 2011; ten Brink et al., 2007, 2009).
Here we present an overview of the aerosol composi-tion as measured in two intensive observation periods atCabauw, the Netherlands. The measurements were linkedto the intensive observation periods of the European Inte-grated Project on Aerosol Cloud Climate and Air Qualityinteractions (EUCAARI) (Kulmala et al., 2009) and activi-ties of the European Monitoring and Evaluation Programme(EMEP, http://www.emep.int/). Previous work on this dataset has focused on the aerosol direct effect (Roelofs et al.,2010; Morgan et al., 2010a) and showed that the high frac-tion of ammonium nitrate observed in May 2008 largely im-pacts the aerosol optical thickness (Roelofs et al., 2010). Itwas shown that due to its semi-volatile nature maximum con-centrations of ammonium nitrate are observed at the top ofthe boundary layer (Morgan et al., 2010a). The height profileneeds to be taken into account when modelling the aerosoldirect effects. We focus on the comparison of different in-struments that measured the inorganic aerosol components inMay 2008. Aerosol particle mass spectrometric data is com-pared to the results obtained by Monitor for AeRosol andGAses (MARGA) and Thermal-Desorption Proton-Transfer-Reaction Mass-Spectrometry (TD-PTR-MS) measurements.We show that the inorganic particulate aerosol mass con-centrations derived by the different approaches are in goodagreement with each other. Diurnal patterns of particulate in-organic and organic aerosol are discussed and an overviewof the concentrations observed in the two campaigns is pre-sented. Beside analysis of the inorganic particulate matter,we extend the analysis by investigating the composition ofthe organic particulate phase by high resolution time of flightmass spectrometry. In particular the O/C ratio and individualtracer ions are used to track OOA and HOA in both obser-vation periods. To our knowledge, this is the first time thatonline analysis of the organic particulate aerosol phase is re-ported for that measurement location.
2 Experimental
2.1 CESAR Tower
As part of EMEP and the EUCAARI project, several in-tensive observations periods were defined during which theaerosol particles chemical composition was characterizedby aerosol mass spectrometry (AMS) at a number of fieldsites throughout Europe (Kulmala et al., 2011). An Aero-dyne High Resolution Time of Flight AMS (HR-ToF AMS,hereafter referred to as AMS) was operated at the CabauwExperimental Site for Atmospheric Research (CESAR), TheNetherlands, during two of these intensive observation pe-riods. The first campaign (Intensive Measurement PeriodAt Cabauw Tower, IMPACT) took place in May 2008, thesecond in March 2009. The CESAR observatory (51◦57′ N,4◦54′ E, −0.7 m a.s.l) is located at a rural site in the centerof the Netherlands, about 20 km south-west of Utrecht and50 km south of Amsterdam. The measurement site is repre-sentative for North-West Europe and features continental andmaritime conditions, depending on the wind direction. Theplain geography of the Netherlands and especially in the areaof Cabauw reduces ambiguities in terms of air parcel con-vection and turbulences. The CESAR observatory is run bythe Royal Netherlands Meteorological Institute (KNMI), DeBilt, The Netherlands. The site features a 213 m high towerequipped with standard measurement devices for outsideand dew point temperature, and wind direction and speed at200 m, 140 m, 80 m, 40 m, 20 m, 10 m, and 2 m height. Be-side this, precipitation, cloud cover and height, radiation anda range of remote sensing, flux and concentration measure-ments of Green House Gases (GHG) are continuously per-formed (Russchenberg et al., 2005).
2.2 AMS
The AMS was located in the tower basement, samplingfrom an aerosol sampling line, which was shared with otheraerosol instrumentation. The inlet system consisted of fourparts: (a) 4 PM10 size selective inlets, (b) a Nafion dryingsystem that dried the aerosol stream to or below 40 % rela-tive humidity, (c) a 60 m stainless steel pipe, and d) a man-ifold that splits the flow to a variable suite of instruments.Instruments sampled their flow from the manifold using sep-arate pumps to adjust the required flow for proper operation.The total flow sustained in the 60 m inlet pipe was kept atabout 60 l min−1, which was the highest flow that warrantedlaminar flow (Re≈ 2000). Excess air was drawn through thesampling heads and the pipe to assure optimal operation ofthe PM10 inlets and to keep the flow in the pipe at 60 l min−1
even if the suit of instruments used less. Whenever an instru-ment was added or removed from the manifold, the excessair and flows to the other instruments were checked and ad-justed when needed. The entire distance between tower inletat 60 m height and AMS inlet was about 70 m. The AMS
Atmos. Chem. Phys., 12, 4723–4742, 2012 www.atmos-chem-phys.net/12/4723/2012/

A. A. Mensah et al.: Aerosol chemical composition at Cabauw 4725
was connected to the sampling manifold by 3 m stainlesssteel tubing with an inner diameter of 4 mm. The flow of680 ml min−1 between the manifold and the AMS inlet wasachieved by parallel sampling of the AMS (80 ml min−1)and an Ultrafine Condensational Particle Counter (UCPC,TSI 3786, 600 ml min−1).
The working principles of the Aerodyne Aerosol MassSpectrometer (AMS) were described in detail elsewhere(Canagaratna et al., 2007; Jayne et al., 2000; Jimenez et al.,2003). A brief summary of the modes of operation and cali-brations performed during the campaigns follows here.
The AMS allows the mass spectrometric online investi-gation of aerosol particle composition after substantial re-duction of the gas phase. The AMS can be separated intofour sections: an aerodynamic lens as inlet, a differen-tially pumped vacuum particle sizing chamber, a vaporiza-tion/ionization region and a mass spectrometer (MS). Anaerosol stream of 80 ml min−1 passes through a Liu typeaerodynamic lens (Liu et al., 1995a, b). The lens reduces thegas phase to particle phase concentration by a factor of 107.This gas phase reduction is a key feature since gaseous ni-trogen alone has a concentration of 950× 106 µg m−3 in theair and particulate aerosol concentrations range from a fewmicrograms per meters cubed in remote areas like Hyytiala,FI (Zhang et al., 2007) to about 100 µg m−3 in polluted areaslike Mexico City, MX (Aiken et al., 2009). The lens has analmost 100 % transmission efficiency for particles between60 nm and 600 nm. Particles in the size ranges of 30 nm to70 nm and 500 nm to 2500 nm are still substantially trans-mitted, with a 50 % transmission efficiency for particles of1 µm (Jayne et al., 2000; Zhang et al., 2004). Hence, the AMSis referred to as PM1 instrument (Canagaratna et al., 2007).The particle sizing is achieved in a differentially pumpedparticle sizing chamber by measuring the particles time offlight (PToF) between entering the chamber and detection.After passing through the PToF chamber the particle beamstrikes the vaporizer. In general, the vaporizer is operated atapproximately 600◦ causing the non-refractory componentsof the particles to flash evaporate on the surface (Jayne etal., 2000). The evaporated molecules are ionized by 70 eVelectron impact (EI) and are then extracted into the MS forcompositional analysis. The HR-ToF mass spectrometer ac-quires a full mass spectrum in one ion extraction, which oc-curs every 30 µs in V-mode and every 50 µs in W-mode. V-and W-mode refer to the flight path of the ions within theMS. V-mode is a single reflection flight path (1.3 m) and W-mode is a triple reflection flight path (2.9 m) with resolvingpowers of about 2000 and 4000, respectively (DeCarlo et al.,2006). This allows for a clear separation of different ions ofthe same nominal mass such as C2H3O+ and C3H+
7 on massto charge ratiom/z43. In the so called MS mode of opera-tion mass spectral information is collected over the integralaerosol size distribution. In the PToF mode of operation sizedependent compositional data is acquired.
For quantitative measurements with the AMS the ioniza-tion efficiency (IE) needs to be determined by a calibra-tion with ammonium nitrate particles (Drewnick et al., 2004;Jayne et al., 2000). In the standard calibration procedure asperformed here dried and size selected ammonium nitrateparticles are measured with the AMS and a condensationalparticle counter (CPC) in parallel. Taking the bulk density ofammonium nitrate, the size, and the number of the particles,the total mass of aerosol particles introduced into the AMSis calculated. This value is compared to the detected ion sig-nal of the mass spectrometer. A scaling factor is introducedto link the amount of molecules introduced into the AMSwith the ion count per molecule detected by the AMS. Thescaling factor, the so called IE, is in general at the order of10−6 ions/molecule. The ammonium nitrate calibration al-lows for the determination of other aerosol compounds interms of nitrate equivalent mass. The actual mass of the com-pound of interest can be determined, when the compoundsspecific ionization efficiency is known. In practice, ioniza-tion efficiencies relative to the ionization efficiency of nitrate(IENO3) are used. These ionization efficiencies are called rel-ative ionization efficiencies (RIE). E.g., the RIE of ammo-nium (RIENH4), which is determined during the standard IEcalibration, is generally about 4.
Another quantity that needs to be determined for quantita-tive measurements with the AMS is the Collection Efficiency(CE, Huffman et al., 2005). The CE is a unit less quantity,which accounts for the difference between aerosol mass en-tering the instrument and the detected mass. Since the CEis composition dependent (Matthew et al., 2008; Crosier etal., 2007), its determination will be explained in detail in theupcoming section Aerosol Particle Composition (3.2.1).
In both observation periods, the aerosol stream was driedby two Nafion dryers at the inlet at 60 m height. Therefore,RH values measured in the sampling line do not reflect ambi-ent RH. The RH time series were incorporated into the AMSdata analysis to apply a time dependent correction for thecontribution of gas phase water (RH) to the total water signaldetected by the AMS. A relative ionization efficiency of wa-ter (RIEH2O) of 2 as determined by Mensah et al. (2011) wasapplied for determination of the residual particulate water.Size calibrations were performed through measurements ofthe particle time of flight of polystyrene latex particles (PSL,Duke Scientific Corporation, Palo Alto CA) of defined sizes.
At Cabauw, the AMS was operated in alternation mode,switching between V-mode (MS, and PToF mode) and W-mode (MS mode only) regularly. The vaporizer temperaturewas set to about 580◦ throughout both sampling periods. TheAMS was run on remote control to enable permanent controlof the instrument performance. Particle size and ionizationefficiency calibrations were performed once a week. Reg-ular measurements with a High Efficiency Particulate Air(HEPA) filter in line were performed to determine the gasphase background signal. Data was collected with a time res-olution of 5 min.
www.atmos-chem-phys.net/12/4723/2012/ Atmos. Chem. Phys., 12, 4723–4742, 2012

4726 A. A. Mensah et al.: Aerosol chemical composition at Cabauw
The data acquired with the AMS will be compared to dataacquired by several other collocated aerosol measurement in-struments. In the following short descriptions of a ScanningMobility Particle Sizer (SMPS, TSI 3034), two Monitor forAeRosol and GAses (MARGA, ten Brink et al., 2007) instru-ments, and a Thermal-Desorption Proton-Transfer-ReactionMass-Spectrometer (TD-PTR-MS, Holzinger et al., 2010b)will be given.
2.3 SMPS
Likewise the AMS, the Scanning Mobility Particle Sizer(SMPS) was located in the basement and sampled from thecommon aerosol inlet line. It was operated with 5 min timeresolution and the particle number size distributions coveringthe diameter range from about 10 nm to 470 nm were mea-sured with a log-equidistant resolution of 32 size bins perdecade in both campaigns.
The mobility size spectrometer (e.g. ten Brink et al., 1983)consists of a sequential set-up of an impactor, neutralizer, dif-ferential mobility analyzer (DMA) and a condensation parti-cle counter (CPC). In the DMA, aerosol particles are classi-fied according to their electrical mobility. The analyzer con-sists of a cylinder with a negatively charged rod at the center.Only aerosols in a narrow range of mobility exit through theoutput slit, where they enter the CPC, which determines theparticle concentration of that size. Before entering the DMA,aerosols are brought to a bipolar charge equilibrium usinga 85Kr bipolar charger (neutralizer). In charge equilibrium,the fraction of particles with a single elementary charge isknown for all sizes (Wiedensohler, 1988). An impactor up-stream of the DMA removes particles larger than the uppersize limit of the mobility spectrometer and allows for correc-tion of multiple charged particles with same mobility as thesingly charged particles that are to be counted.
The operated SMPS is a modified version of a commer-cially available instrument (TSI 3034). To ensure reliablemeasurement data that is comparable to other European mea-surement data, the technical standards for mobility size spec-trometers developed within the EUSAAR project are fol-lowed (Wiedensohler et al., 2012). Moreover, the SMPSparticipated in a series of three intercomparison workshopsconducted between 2006 and 2009 at the WCCAP (WorldCalibration Centre for Aerosol Physics) facilities in Leipzig(Wiedensohler et al., 2012). At the workshops the particlecounting efficiency of the CPC used here was experimentallydetermined and the inversion routine, necessary for convert-ing measured mobility distributions into final particle num-ber size distributions taking into account the bipolar chargedistribution as well as the DMA transfer function, was com-pared to different commercial and custom-programmed in-version routines to insure optimal performance of the SMPSsystem.
2.4 MARGA
The two MARGA instruments sampled at a separate inletat 4 m height and collected aerosol at ambient RH and tem-perature. The MARGA is a combination of a Wet AnnularDenuder (WAD) followed by a Steam Jet Aerosol Collec-tor (SJAC, Slanina et al., 2001) to facilitate the chemical on-line analysis of water soluble gases and particulate aerosolcomponents at the same time (Trebs et al., 2004). Detailsof the calibrations, quality assurance and data analysis pro-cedures routinely performed for MARGA are described inTrebs et al. (2004). Here we give only a summary of thespecific sampling strategy for the Cabauw site. The instru-ment can be run with different inlets to confine the parti-cle size range. The MARGA-2S was deployed as the stan-dard Applikon instrument (http://www.metrohm-applikon.com/Products/MARGA.html). The MARGA-2S was in op-eration at the Cabauw site as part of the Dutch Beleid Onder-steunend Project (BOP) program for over a year (Septem-ber 2007–October 2008). It measured both the PM10 andPM2.5 fraction. This was accomplished by sampling the am-bient air with a Teflon coated PM10 impactor at 2 m3 h−1.A polyethene tube carried the sample air to an indoor split-ter. The outdoor length of 2 m was surrounded by a fandriven outdoor airflow to prevent wall interactions. Indoors,the sample lines were insulated for the same purpose. Afterthe iso-kinetic split the two lines were connected to the twoMARGA sampling boxes. In one of the lines a Teflon coatedPM2.5 cyclone was inserted. The Marga-2S was serviced ona weekly basis. Both sample flows were calibrated. The an-alytical part, the anion and cation ion chromatography (IC),was continuously calibrated by a traceable internal LiBr stan-dard solution. Generally the sum of the PM2.5 ions represents50 % of the PM10 mass fraction. The measured ion concen-trations compared well with filter measurements (Schaap etal., 2011).
The MARGA-Sizer (ten Brink et al., 2007) was locatedbeside the MARGA-2S and sampled through the same inlet.It was operated throughout the year 2008 as part of the DutchBesluit Subsidies Investeringen Kennisinfrastructuur BSIKprogram. The MARGA-Sizer sampled ambient air through a1 m3 h−1 Teflon coated PM2.5 impactor at 30 l min−1, whichrepresents about the particle fraction with diameters smallerthan 2 µm. The outdoor inlet was surrounded by the sameoutdoor airflow as used for the MARGA-2S. Key differ-ence between the MARGA-2S and MARGA-Sizer is a pre-separator of parallel mounted impactors for size classifica-tion defining the measurement range of the particles by dif-ferent cut off sizes. During May 2008 the MARGA- Sizerwas operated with 5 Moudi impactor stages of the follow-ing cut off sizes: 0.18 µm, 0.32 µm, 0.56 µm, 1.00 µm, and2.00 µm. The cut off characteristics of the Moudi stageswere checked with mono disperse Latex spheres prior tothe May 2008 IMPACT campaign. Additionally to the fiveimpactor inlets, an inlet equipped with a particle filter was
Atmos. Chem. Phys., 12, 4723–4742, 2012 www.atmos-chem-phys.net/12/4723/2012/

A. A. Mensah et al.: Aerosol chemical composition at Cabauw 4727
used to perform blank measurements and determine thebackground concentration of the compounds. Measurementsthrough the different size classes were alternated, resultingin a semi-continuous measurement but gaining insights tothe size distribution of the individual species. In the standard2 h cycle the blank was analyzed twice, while each impactorstage, the direct connection and the denuder (gas phase mea-surements) only once. The time coverage per fraction wasthus 12.5 %. Due to the low concentrations in the samplesolutions for the smallest fractions the ICs were equippedwith concentrator columns instead of the standard injectionloops. Calibration and servicing of the MARGA-Sizer wasthe same as for the MARGA-2S. The MARGA-Sizer outputwas normalized by a factor 1.8 to match with the MARGA-2S results. The cause of deviation remained unexplained andimplications will be discussed below.
2.5 TD-PTR-MS
The TD-PTR-MS instrument was located inside the build-ing next to the MARGA instruments. Aerosol was sampledfrom the roof at a height of 5 m above the ground througha 10 m long non-insulated copper tube with an inner diam-eter of 4 mm. The system consists of a modified commer-cial PTR-MS (Ionicon Inc., Innsbruck, Austria, Hansel etal., 1995; Lindinger et al., 1998) which is equipped withboth a gas and an aerosol inlet. Since detailed descriptionscan be found in Holzinger et al. (2010a, b) only a brief de-scription follows. The centerpiece of the aerosol inlet is aCollection-Thermal-Desorption (CTD) cell (Williams et al.,2006, Aerosol Dynamics, Berkeley, CA, USA), which col-lects ambient particles in the 0.07 µm to 2.00 µm size rangeat an air sample flow rate of 1 l min−1, and allows for grad-ual thermal desorption of the collected sample into the PTR-MS system. Particle collection is achieved by humidification-aided impaction onto the stainless steel collection surface us-ing a sonic jet impactor. Humidification was needed to re-duce particle rebound. Additionally, the CTD cell contains anauxiliary injection port for the manual introduction of liquidstandards by means of a syringe. The transfer lines and thePTR-MS drift tube were operated at elevated temperaturesof 200◦ to avoid re-condensation of evaporated particulateaerosol compounds. A measurement cycle of the TD-PTR-MS system is as follows: While the PTR-MS is connected tothe gas phase inlet, ambient air is pulled through the CTDcell and the aerosol particles are collected on a sharp pointin the CTD cell. Due to the high operating temperature ofthe PTR-MS drift tube and inlet lines a significant fraction ofthe aerosol particles evaporate, so that in the gas-phase chan-nel the combined signal of gas phase and condensed-phaseorganics is detected. After aerosol collection a small flow of10 ml min−1 to 12 ml min−1 of nitrogen carrier gas transports100 % of the compounds evaporating from the CTD cell di-rectly into the PTR-MS. The temperature of the CTD cellis ramped from ambient temperatures to 350◦, which takes
about 15 min at a ramping rate of 25◦ min−1. After a cooldown period of 10 min to 15 min a new collection cycle canbe started. The operation including valve switching and heat-ing/cooling is automated and therefore the system is capableof continuous measurements over extended periods of time.
The instrument was equipped with a quadrupole mass fil-ter which recorded full mass spectra in the mass range of20 Da to 219 Da at a scanning speed of 0.2 s/mass unit, soa full mass scan was completed every 40 s. The TD-PTR-MS detects all species with the same sensitivity and signalsof the measured aerosol species can be directly related toa mass concentration without calibration. While Holzingeret al. (2010a) pointed out that in principle all desorbableorganic aerosol compounds should be detectable with thismethod, reservations hold with respect to possible fragmen-tation during proton transfer or thermal dissociation on theCTD cell which can produce simple structures such as CO2,CO or NO2 that are not detected by PTR-MS. If not other-wise mentioned, concentrations of individual aerosol specieshave been calculated according to the procedure outlined inHolzinger et al. (2010b).
3 Results and discussion
3.1 Measurement conditions
Key meteorological parameters are shown in Fig. 1. The topgraph (Fig. 1a) presents data from May 2008 and the bot-tom graph (Fig. 1b) data from March 2009. The top pan-els in both graphs show the wind direction. As a guidanceof the eye, northerly wind directions are colored in blue,southerlies in red, and easterly and westerly wind directionsin green. Ambient temperature (T ) and the relative humid-ity (RH) at 40 m height are given in the second upper panel.Further, the aerosol composition as observed with the AMS isshown in the lower parts of the graphs. Particle mass loadingsof organics (Org, green), nitrate (NO3, blue), sulfate (SO4,red), ammonium (NH4, orange), and chloride (Cl, pink) areshown in the second lowest panels, as well as the total non-refractory mass loading (black), i.e. the sum of these species.The contributions of the individual species to the total massare shown as a function of time in the bottom panels ofFig. 1a and b. Gaps in the time series are due to instrumentmaintenance, calibrations, filter measurements, or instrumentfailure.
The 2008 measurement period was dominated by east-erly and south-easterly wind directions (top panel in Fig. 1a)transporting air masses from Eastern and Central Europe tothe measurement site. An overview of the synoptic situationover Europe through the campaign is given by Hamburgeret al. (2011). From 17 to 20 May northerly winds fromthe North Sea prevailed, transporting low mass loadings ofaerosol particles (< 5 µg m−3) due to precipitation scaveng-ing. This time period is referred to as scavenged background
www.atmos-chem-phys.net/12/4723/2012/ Atmos. Chem. Phys., 12, 4723–4742, 2012

4728 A. A. Mensah et al.: Aerosol chemical composition at Cabauw
situation from here on. Though not reflected in the local windprofile, the meteorological background was dominated bylong range transport of Sahara dust from North Africa from23 May on (Roelofs et al., 2010), from here on referred toas Sahara dust period. The particulate aerosol mass loadingreached maximum concentrations of more than 30 µg m−3
during this period. As opposed to 2008, the measurement pe-riod in 2009 was dominated by westerly winds (top panelin Fig. 1b), almost uniformly covering the entire range fromSouth to North. Only on 29 February and in the period from17 to 21 March easterly winds, predominantly from north-easterly directions, were present.
As mentioned above, the aerosol stream was dried by twoNafion driers in both campaigns. Since the temperature inthe basement was generally higher than the ambient temper-ature, the positive temperature gradient caused a further re-duction of the RH within the sampling line. In May 2008,the ambient temperature and RH ranged from 6.5◦ to 25.2◦
and 24.5 % to 99.8 %, respectively, with average values of15.5◦ and 62.8 %, respectively. In the same time period, thetemperature at the AMS inlet ranged from 22.7◦ to 29.4◦
with an average of 26.5◦ and the RH ranged from 12.7 %to 42.2 % with an average of 23.1 %. This indicates, thatthe temperature was generally higher and the RH lower inthe basement accompanied by a considerably reduced spreadin the values. Since the measurement period in 2009 tookplace in early spring, recorded temperatures were lower andRH higher compared to the summer campaign in 2008. InMarch 2009, the average ambient temperature was only 7.0◦
(0.7 ≤ T [◦] ≤ 11.2) and the average RH as high as 77.6 %(31.9≤ RH [%] ≤ 99.2). As opposed to 2008, RH and tem-perature data were not available at the AMS inlet.
3.2 Aerosol particle composition
The temporal evolution of the total particle mass loadingas well as the individual species as shown in the middlepanel in Fig. 1a resulted in an average mass loading of10.21 µg m−3 in spring 2008. The chemical composition ofthe aerosol particles was generally dominated by organics(bottom panel in Fig. 1a), accounting for 40 % of the to-tal mass averaged over the measurement period (Fig. 2a).The second dominant contributor to the particles composi-tion was nitrate (26 %), which was distinctly anti-correlatedto sulfate (18 %). The scavenged background situation dur-ing mid of May was characterized by an average mass load-ing of only 3.69 µg m−3 accompanied by a high fractionalabundance of sulfate and a very low fractional abundance ofnitrate. In contrast to that, the Sahara dust period had an av-erage mass loading of 14.35 µg m−3 with maximum concen-trations of almost 40 µg m−3. This period, especially from 25to 28 May was characterized by decreasing organic and in-creasing nitrate contributions. In March 2009, the dominanceof nitrate (42 %) and organics (22 %) contribution to the av-erage non-refractory particulate aerosol composition (bottom
41
1
2
Fig. 1. Campaign overviews of aerosol chemical composition inMay 2008(a) and March 2009(b). Mass concentrations (secondlowest panel) and relative contributions (lowest panel) are shownfor total AMS measured mass (black), ammonium (orange), nitrate(blue), sulfate (red), organics (green), and chloride (purple). Theambient temperature and RH in the second upper panel as well asthe wind direction in the most upper panel are given in both graphs.As a guidance of the eye, northerly wind directions are colored inblue, southerlies in red, and easterly and westerly wind directionsin green.
panel in Figs. 1b and Fig. 2b), is interchanged compared toMay 2008. Furthermore, an average mass loading of only
Atmos. Chem. Phys., 12, 4723–4742, 2012 www.atmos-chem-phys.net/12/4723/2012/

A. A. Mensah et al.: Aerosol chemical composition at Cabauw 4729
43
1
2
Figure 2: Mean aerosol composition in May 2008 (left) and March 2009 (right). While the 3
aerosol chemical composition is dominated by organics (41%) in May 2008, the main fraction 4
is composed of nitrate (42%) in March 2009. The average mass loading was 10.21 μg/m3 in 5
May 2008 and 6.86 μg/m3 in March 2009. 6
7
Fig. 2. Mean aerosol composition in May 2008 (left) and March 2009 (right). While the aerosol chemical composition is dominated byorganics (40 %) in May 2008, the main fraction is composed of nitrate (42 %) in March 2009. The average mass loading was 10.21 µg m−3
in May 2008 and 6.86 µg m−3 in March 2009.
6.86 µg m−3 was measured. Since westerly winds dominatedduring March 2009, the aerosol particles had a significantlyshorter time over land and therefore a limited time to takeup organic species. This fact in combination with the gener-ally reduced biogenic activity and reduced photochemistry inwinter time can explain the reduced organic contribution tothe average particle composition in March 2009 compared toMay 2008. The average fractional abundances of sulfate, am-monium and chloride show only minor differences between2008 and 2009. To calculate the residual particulate watercontent detected by the AMS the RIEH2O (Mensah et al.,2010) and the RH in the basement in 2008 and in the pipe in2009, respectively, was taken into consideration in data anal-ysis. The average residual particulate water was 0.67 µg m−3
in 2008 and 0.37 µg m−3 in 2009 corresponding to 6.6 % and5.5 % of the average particulate mass reported for 2008 and2009, respectively.
In 2008 the AMS measured ammonium concentration ex-ceeded the mass needed for neutralization of nitrate and sul-fate up to 20 %. Artifacts from data analysis are unlikelysince special attention was paid in terms of possible interfer-ences from gas phase ammonia and relative ionization effi-ciency of ammonium determined by repeated ionization effi-ciency calibrations. Unusually high ammonia concentrationsmeasured at CESAR tower in previous campaigns were as-signed to agricultural activities nearby (Schaap et al., 2011;Weijers et al., 2011). We speculate that our observed excessammonium has agricultural sources, since high concentra-tions of nitrogen containing compounds such as ammoniaand amines are known not only to be in the manure but alsoto evaporate in significantly amounts (Rotz, 2004). Particlescontaining oxalic acid can take up significant amounts of am-monia from the gas phase under laboratory conditions, whichthen can be detected as particulate ammonium by the AMS(Mensah et al., 2011). As discussed below, there is evidence
of substantial contribution of highly oxidized organic com-pounds, such as organic acids to the particulate aerosol massin May 2008. Further characterization of the measurementlocation is needed for a final explanation of this observation,since a chicken farm is located only about 600 m north westof the CESAR tower.
3.2.1 Determination of CE and comparison ofAMS with SMPS
The determination of the absolute mass loading in the AMSrequires the knowledge of the CE. Dry and solid particles,e.g. particles with a high sulfate mass fraction, tend to bounceoff the vaporizer without being evaporated, i.e., substantialamounts of the introduced particulate mass will not be de-tected in the MS. That means in reverse, the ratio of intro-duced to detected amount is favored for wet or waxy parti-cles, e.g. particles with a high nitrate mass fraction. Labo-ratory studies show that the CE can range from 0.3 for am-monium sulfate dominated to 1.0 for nitrate dominated in-ternally mixed particles (Matthew et al., 2008). A CE valueof 0.5 was determined in numerous field campaigns (Cana-garatna et al., 2007 and references therein). To evaluate ifthis value is also appropriate for these specific measurements,the mass loadings determined by the AMS are compared toother measurements. Comparisons are generally performedfor the total particle mass loading (Quinn et al., 2006) orspecific components, e.g. sulfate (Drewnick et al., 2004).The upper panel of Fig. 3 shows the ratio of AMS nitrateto the particulate MARGA-Sizer nitrate of the 1 µm channel(AMSNO3/MARGANO3,1.00) in blue and the according ratiofor sulfate (AMSSO4/MARGASO4,1.00) in red. In both panelsan inflection of the mass ratios at a particulate nitrate massfraction MFNO3 of about 0.3 can be seen. MFNO3 is definedas the particulate nitrate mass divided by the total particu-late mass. This inflection is mass and time independent and
www.atmos-chem-phys.net/12/4723/2012/ Atmos. Chem. Phys., 12, 4723–4742, 2012

4730 A. A. Mensah et al.: Aerosol chemical composition at Cabauw
is controlled mainly by the nitrate mass fraction. The lowerpanel of Fig. 3 shows the ratio of the total mass detectedby the AMS to the mass derived from SMPS measurements(AMS/SMPS, black squares) versus the (MFNO3). The in-flection at MFNO3 = 0.3 can also be seen in this comparison.This seems to be a general behavior across Europe basedon other AMS measurements performed at other locationsduring that campaign (Nemitz et al., 2012). The particulateaerosol mass was determined from the measured SMPS num-ber distributions. To compare the mass loading of the AMSto measurements of the SMPS two things need to be consid-ered concerning the different size cut offs of AMS and SMPS(Kleinman et al., 2008). First, the AMS has an almost 100 %transmission efficiency of particles only between∼60 nm to∼600 nm. There is a steep decrease in transmission efficiencyfor particles smaller and larger than this size range. Alreadyparticles of 700 nm show significantly decreased transmis-sion efficiency of only 67 % in laboratory experiments (Jayneet al., 2000). Second, the size range of the AMS is givenas aerodynamic diameter (dva). To compare to the geomet-ric diameter (dgeo) reported by the SMPS, the particle den-sity needs to be taken into account. In a rough calculationassuming spherical particles and an average particle densityof 1.5 g cm−3, adva of 600 nm corresponds to adgeo of only400 nm. In the actual calculation, the following steps wereperformed. Each number distribution was transferred into avolume distribution under the assumption of spherical parti-cles. In each measurement interval the fractional abundanceof the individual species determined by the AMS was usedto calculate the particle density. Densities of dry NH4NO3(1.72 g cm−3) and (NH4)2SO4 (1.77 g cm−3) were used aswell as a density of 1.40 g cm−3 for organics (Hallquist etal., 2009). The chloride detected in the AMS needs to flashevaporate at the vaporizer temperature of about 600◦. Theprobability that this chloride origins from an inorganic saltis very small. We set the density of the chloride fraction to1.00 g cm−3 and expect only a minor impact on the averageparticle density in view of the low fractional abundance of1 % and 3 %, respectively, in the two measurement periods.The mass was then calculated by combination of the volumeand the density information.
To account for the known fact of a composition dependentCE of the AMS (Crosier et al., 2007), especially the depen-dence on MFNO3, an empirical function was generated. Aconstant CE of 0.5 was applied to all measurements with aMFNO3 below 0.3 (Eq. 1a), which corresponds to the valuefound in other field campaigns with dry, sulfate dominatedaerosol particles (Allan et al., 2004). Atmospheric nitrateis dominated by ammonium nitrate and laboratory experi-ments show a CE of 1.0 for pure ammonium nitrate particles(Matthew et al., 2008), in which the MFNO3 is 0.78. This factis reflected in equation 1b. To account for the increasing CEof particles with increasing nitrate fraction, the CE of parti-cles with a MFNO3 above 0.3 and below 0.78 was calculatedaccording to Eq. (1c):
44
1
2
Figure 3: Lower panel: Ratio of raw (black squares, left axis) and CE corrected (grey dots, 3
right axis) AMS total mass to SMPS derived aerosol particle mass as function of nitrate mass 4
fraction (MFNO3) in the particles. Top panel: Raw AMS/MARGA-Sizer (1.00 µm) nitrate 5
(blue) and sulfate (red) mass ratios. Note that the CE of the AMS shows a dependence on the 6
aerosol nitrate fraction with increasing nitrate fraction leading to increasing collection 7
efficiency. 8
9
Fig. 3. Lower panel: ratio of raw (black squares, left axis) and CEcorrected (grey dots, right axis) AMS total mass to SMPS derivedaerosol particle mass as a function of nitrate mass fraction (MFNO3)
in the particles. Top panel: raw AMS/MARGA-Sizer (1.00 µm) ni-trate (blue) and sulfate (red) mass ratios. Note that the CE of theAMS shows a dependence on the aerosol nitrate fraction with in-creasing nitrate fraction leading to increasing collection efficiency.
CE=0.5 for MFNO3 < 0.3 (1a)
CE=1.0 for MFNO3 = 0.78 (1b)
CE=0.1875+ 1.0417× MFNO3 for 0.3 ≤ MFNO3 < 0.78 (1c)
These equations reflect the general behavior of the CE acrossEurope and is also given by Nemitz et al. (2012). The changeof the AMS/SMPS mass ratio after application of this CEis shown by the grey dots in the lower panel of Fig. 3(right axis). The magnitude of the standard deviation of theAMS/SMPS ratio is reduced from 24 % to 18 % and the ratiohas a value of 1.06± 0.20 after application of the CE to theAMS data.
For further comparison time series of the total particulatemass loading of the AMS (black) and the mass loading de-rived from these SMPS measurements (red) are shown inFig. 4. from 14 May 2008 to End of May 2008. The mea-surements show very good quantitative and qualitative agree-ment, since even small temporal loading variations are visi-ble in both time series. Correlating the SMPS derived massto the total AMS mass results in a slope of 0.89 (R2
= 0.86)even when the Sahara dust event is included. High mass load-ings of more than 30 µg m−3 were measured during the Sa-hara dust event.
Atmos. Chem. Phys., 12, 4723–4742, 2012 www.atmos-chem-phys.net/12/4723/2012/

A. A. Mensah et al.: Aerosol chemical composition at Cabauw 4731
Table 1.Correlation of the 0.56 µm and the 1.00 µm channel of the MARGA-Sizer to AMS loadings of NO3, SO4, NH4 and Cl. Presented arethe slopes and one standard deviation of a linear regression over the entire measurement period in May 2008. The coefficient of determination(R2) is given in parenthesis.
NO3 SO4 NH4 Cl
0.56 µm 1.03± 0.02 (0.70) 1.12± 0.03 (0.22) 0.73± 0.02 (0.37) 0.72± 0.03 (0.49)1.00 µm 1.91± 0.03 (0.82) 1.81± 0.03 (0.69) 1.32± 0.02 (0.72) 1.30± 0.04 (0.68)
Middlebrook et al. (2011) evaluated the impact of com-position of the particle on the CE in greater detail. Similarto our results they found a constant CE for particles with aMFNO3 ≤ 0.31 and an increasing CE with higher MFNO3.The constant CE was determined to be 0.45, which can beconsidered relatively low compared to the minimum/averagevalue found in other field measurements (Canagaratna etal., 2007). Overall, the application of Eq. (6) in Middle-brook (2011) to our data would result in higher AMS massloadings, which would increase the discrepancy to the SMPSderived mass loading.
3.2.2 Comparison of inorganic composition from AMSand MARGA-Sizer
The AMS data are further compared to measurementsobtained with a MARGA-Sizer, which was available inMay 2008 (Fig. 5). Here, we only present the compari-son to data acquired with the 560 nm sampling inlet of theMARGA-Sizer. Figure 5 is separated into four panels pre-senting from top to bottom the particulate chloride (Cl), am-monium (NH4), sulfate (SO4) and nitrate (NO3) concentra-tions measured by AMS (colored lines) and MARGA-Sizer(black lines). The respective time series follow each othervery well and good quantitative agreement is achieved. Sincethe AMS is considered a PM1 instrument best quantitativeagreement was expected with the data obtained through the1.00 µm channel. However, the measurement results of the1.00 µm channel are on average a factor of 1.6 higher thanthe AMS results, which is in the range of the scaling fac-tor of 1.8 applied to the MARGA-Sizer data equivalencewith the standard MARGA-2S. Correlations of the individualspecies for AMS and the 560 nm channel of the MARGA-Sizer show ratios ranging from 0.73 and 0.72 for ammo-nium and chloride, respectively, to 1.03 and 1.12 for nitrateand sulfate, respectively. It should be noted that even thoughthe quantitative agreement of AMS and MARGA-Sizer wasbest for the 560 nm channel, the coefficients of determination(R2) were higher for the comparison of AMS with the 1 µmchannel (see Table 1). This indicates that indeed the varia-tion of the concentrations observed by the AMS was bet-ter fetched by the 1 µm channel. The difference in absolutemass concentration between the AMS and the 1 µm channelof the MARGA-Sizer could be due to different sample po-sitions for the AMS (60 m) and MARGA-Sizer (4 m), sincethe observed mass will depend on the vertical distribution of
45
1
2
Figure 4: Time series of AMS total mass and mass derived from SMPS measurements in 3
2008.4
Fig. 4.Time series of AMS total mass and mass derived from SMPSmeasurements in 2008.
46
1
2
Figure 5: Comparison of AMS chemical composition with MARGA sizer data for the 3
May 2008 intensive campaign. AMS data are compared to MARGA 0.56 µm channel with 4
good agreement in terms of both absolute mass concentration and relative trends. 5
6
Fig. 5. Comparison of AMS chemical composition with MARGAsizer data for the May 2008 intensive campaign. AMS data are com-pared to MARGA 0.56 µm channel with good agreement in termsof both absolute mass concentration and relative trends.
species as well as on the losses within the sampling line. Con-sidering the instrumental accuracies and limitations due todifferent sampling locations AMS and MARGA-Sizer showa qualitatively good agreement.
www.atmos-chem-phys.net/12/4723/2012/ Atmos. Chem. Phys., 12, 4723–4742, 2012

4732 A. A. Mensah et al.: Aerosol chemical composition at Cabauw
3.2.3 Comparison of nitrate and organics from AMSand TD-PTR-MS
During May 2008, the TD-PTR-MS was applied for mea-surements of individual components in the PM2 range. Thesingle highest signal was detected atm/z46, which is at-tributed to NO+
2 . Note that unambiguous ion compositionassignment is hindered here by the use of a Quadurpole MS.Concentrations were calculated using a molecular weight of62 g mole−1 (NO3) and a default reaction rate constant forproton transfer of 0.85× 10⁻⁹ cm3 s−1molecule1. The detec-tion of ammonium nitrate and the accuracy of the parameterswere confirmed in laboratory experiments. Figure 6 (lowerpanel) shows that the TD-PTR-MS derived nitrate corre-sponds quite well to the AMS nitrate (R2
= 0.60). It is in-teresting to note that the built-up of high night time concen-trations in the period 9–13 May was not observed with theTD-PTR-MS. The reason for this is not known at this point.The top panel in Figure 6 compares the total organic signalmeasured with the TD-PTR-MS (all aerosol species exceptm/z46) and the particulate organic fraction detected in theAMS. In the period 9 May to 16 May the TD-PTR-MS totalorganic signal was about 30 % of the AMS organic concen-tration. This fraction is lower than previously published val-ues of comparisons to other AMS measurements, however,in the period 17 May to 20 May the TD-PTR-MS total or-ganic signal was about 85 % of AMS organic concentration.During this period very clean conditions prevailed and thehigh fraction detected with the TD-PTR-MS is in agreementwith data from the Mt. Sonnblick observatory (Holzinger etal., 2010a). The increase in detection sensitivity of the TD-PTR-MS might be due to changes in the composition ofthe aerosol particles. The fractional contribution of organicsis significantly decreased at that time, which is most prob-ably accompanied by an increase in the hygroscopicity ofthe aerosol particles. Since particle collection is achieved byhumidification-aided impaction, an increased hygroscopicityof the particles could result in an increased collection effi-ciency. The organic contribution increases again after the 21May. Unfortunately, no TD-PTR-MS data is available afterthat time to investigate this hypothesis in greater detail. A rel-atively high correlation of the TD-PTR-MS signal atm/z149with AMS chloride is achieved in the time from 15 May mid-night to 17 May midnight (R2
= 0.75) as shown in Fig. 7(lower panel). This time period includes a distinct peak inchloride concentration that was not only captured by AMSand TD-PTR-MS but also by the water soluble chloride de-tecting MARGA-Sizer (compare top panel in Fig. 5). Theratio of signals detected atm/z149,m/z150 andm/z151 sug-gests that organic species with one chloride atom such asC6H9ClO2 could cause the majority of the signal. However,since the TD-PTR-MS was operated with a Quadrupole MS,we cannot exclude the contribution of several other speciesto the signal detected atm/z149. Utilizing the high resolu-tion capabilities of the AMS, we could identify a mass peak
47
1
2
Figure 6: Comparison of AMS to TD-PTR-MS results. Lower panel: AMS nitrate (blue, left 3
axis) and TD-PTR-MS nitrate (m/z 46, black, right axis). Upper panel: AMS organic (green, 4
left axis) and TD-PTR-MS total organic (black, right axis). 5
Fig. 6. Comparison of AMS to TD-PTR-MS results. Lower panel:AMS nitrate (blue, left axis) and TD-PTR-MS nitrate (m/z46, black,right axis). Upper panel: AMS organic (green, left axis) and TD-PTR-MS total organic (black, right axis).
at m/z148.029 (C6H9ClO2) that is indicative of an organicchloride source (red line in upper panel of Fig. 7). The sametemporal behavior of the corresponding isotope (C6H37
9 ClO2,m/z150.026) can be found. The ratio of these two signal re-flects the isotopic ratio of35Cl/37Cl when no constrains areapplied within the analysis software. Therefore, these peakscan be considered real, even though they account for only aminor fraction of the total chloride containing high resolu-tion signal (< 1 %). On the one hand, this time trace does notshow high correlation to the time trace of the TD-PTR-MSsignal onm/z149. On the other hand, peaks simultaneous intime for aliphatic organic ions detected on mass to chargeratios m/z43, m/z55, andm/z57 can be found, which willbe discussed in further detail in Sect. 3.5.1. These findingssupport the expectation that AMS chloride originates fromorganic compounds as discussed earlier.
3.3 Chemical size distribution
Campaign averages of chemically resolved size distributionsas measured by the AMS at CESAR tower in 2008 (dashedlines) and 2009 (solid lines) are shown in Fig. 8. The modediameter of the total mass (black line, panel a) is about500 nm in both measurement periods. The inorganic speciesare predominately detected in the larger size fraction whileorganic show a much broader size distribution extending intosize fractions below 100 nm. Similar behavior of organic andinorganic species was found by Poulain et al. (2011) but withgenerally smaller mode diameters. Main differences betweenthe two observation periods are the smaller modal diame-ter of nitrate and the larger fraction of organics that is ob-served at small sizes in 2009 compared to 2008. Maximum
Atmos. Chem. Phys., 12, 4723–4742, 2012 www.atmos-chem-phys.net/12/4723/2012/

A. A. Mensah et al.: Aerosol chemical composition at Cabauw 4733
48
1
2
Figure 7: Comparison of AMS to TD-PTR-MS results. Lower panel: AMS chloride (purple, 3
left axis) and TD-PTR-MS mass trace at m/z 149 (black, right axis). Upper panel: AMS high 4
resolution traces of C6H9ClO2 (m/z 148.029, red). 5
6
Fig. 7. Comparison of AMS to TD-PTR-MS results. Lower panel:AMS chloride (purple, left axis) and TD-PTR-MS mass trace atm/z149 (black, right axis). Upper panel: AMS high resolution tracesof C6H9ClO2 (m/z148.029, red).
49
1
2
Figure 8: Average size distribution for May 2008 (dashed lines) and March 2009 (solid lines) 3
of the total mass (black, panel a), nitrate, sulfate, and ammonium (blue, red, and orange, 4
respectively, panel b), organics, and chloride (green, and purple, respectively, panel c). Panel 5
d shows the average size distributions of organic signal on m/z 43, m/z 44, and m/z 57 (Org43 6
(green), Org44 (black), and Org57 (purple), respectively, panel d). Note, that the signal of 7
Org57 is multiplied by a factor of 2 for better display. 8
9
Fig. 8. Average size distribution for May 2008 (dashed lines) andMarch 2009 (solid lines) of the total mass (black, panela), ni-trate, sulfate, and ammonium (blue, red, and orange, respectively,panelb), organics, and chloride (green, and purple, respectively,panelc). Paneld shows the average size distributions of organicsignal onm/z43,m/z44, andm/z57 (Org43 (green), Org44 (black),and Org57 (purple), respectively). Note, that the signal of Org57 ismultiplied by a factor of 2 for better display.
average mass fractions of nitrate were observed in the sizerange 500 nm–1000 nm in May 2008 and between 300 nm–800 nm in March 2009. On average 30 % of the observed or-ganics are due to particles with diameters below 200 nm in
March 2009. In comparison only 20 % of the organics arefound in the size range below 200 nm in May 2008 Note thatthe mass fraction of organics in particles smaller than 200 nmwas thus≥ 60 % in May 2008 and≥ 35 % in March 2009.
Additionally, we present in panel d of Fig. 8 the aver-age size distribution of the organic signal onm/z43 (Org43,green),m/z44 (Org44, black), andm/z55 (Org57, purple).For better display, the signal of Org57 is multiplied by a fac-tor of 2. Org44 shows a clear maximum at about 450 nmto 500 nm Org43 shows especially in 2009 a much broadersize distribution. The size distribution of Org57 shows nodistinct peak and extends far into the small size range ofbelow 100 nm. While Org43 and Org44 are generally asso-ciated with secondary organic aerosol, Org57 is associatedwith primary organic aerosol (Zhang et al., 2005b). An ex-tended discussion on organic tracer analysis will follow inthe upcoming section “Analysis of the organic phase”.
3.4 Diurnal cycles
Figure 9 shows the diurnal averages of individual aerosolcomponents for the episodes defined above based on mainmeteorological conditions. In 2008 (left part of Fig. 9) nitrateshowed a night time maximum, if the entire measurementperiod is taken into account (upper most panel). While thismaximum is very pronounced for the two episodes 1 May to16 May (easterly winds, lowest left panel) and 21 May to28 May (Sahara dust episode, second upper left panel) itis barely recognizable for the scavenged background situa-tion (second lowest left panel). Night time maxima of nitratenot only in the fractional abundance but even in absolutemass concentration were found also at other measurementsites during the EUCAARI campaign (Poulain et al., 2011).Likely this is due to heterogeneous N2O5 conversion in thenight and to volatilization of (ammonium) nitrate during theday. In contrast to nitrate, sulfate is characterized by a day-time maximum during all periods of the campaign, in accor-dance with its photochemical formation. Even a distinct peakin sulfate concentration right before noon can be recognizedduring the scavenged background situation. On average, or-ganics show a slightly higher concentration during the night(upper most left panel). This night time maximum is mostpronounced during the first half of May 2008 (lowest leftpanel). The average diurnal circle of the measurement cam-paign in March 2009 (upper most right panel) shows no pro-nounced maxima or minima in any specie. In the first mea-surement period from 24 February–3 March (lowest rightpanel) when southerly and westerly winds dominated, diur-nal cycles with a night time maximum in nitrate, a daytimemaximum in sulfate but only slight diurnal variations in or-ganics and ammonium can be found. Though the second pe-riod in 2009 from 9 March to 17 March is a low loading pe-riod similar to the scavenged background situation on 2008the diurnal evolution of the individual species is similar tothe first period. This is most probably due to the same wind
www.atmos-chem-phys.net/12/4723/2012/ Atmos. Chem. Phys., 12, 4723–4742, 2012

4734 A. A. Mensah et al.: Aerosol chemical composition at Cabauw
situation, where origins range from south to north but onlypassing westerly directions. As opposed to the two periodsjust mentioned, the wind originates from easterly directionsin the third period from 17 March to 20 March. In this case,daytime maxima are observed not only in sulfate and ammo-nium but also in nitrate. In general, ammonium diurnal cyclesin 2008 and 2009 can be explained based on the sum contri-bution of ammonium to ammonium nitrate and ammoniumsulfate. The diurnal cycles of nitrate, sulfate and ammoniumobserved during the two campaigns agree well with obser-vations reported by Schaap et al. (2011) for PM10 diurnalcycles measured with MARGA.
3.5 Analysis of the organic phase
3.5.1 Organic tracer analysis
Figure 10a and b show the time traces of different organicions at mass to charge ratiom/z43,m/z44,m/z55, andm/z57from top to bottom. Please note, in 2008 the signals ofC2H3O+ on m/z43 and CO+2 on m/z44 are divided by afactor of 10 to allow for parallel display on the same axisas the other ions at the respectivem/z. In 2009 this is onlythe case for CO+2 . Furthermore, the CO2 signal reported hererepresents the particulate CO+
2 after correction for gas phaseCO+
2 interference. While the ions atm/z43 andm/z44 canbe considered as tracers for oxidized organic aerosol (OOA)the signals atm/z55 andm/z57 are considered as tracers ofaliphatic/hydrocarbon-like organic aerosol (HOA, Zhang etal., 2005a).
Due to the evaporation/ionization scheme of the AMS, al-most all molecules are subject to substantial fragmentation.Therefore, the mass spectrum consists mainly of ions whichare fragments of the mother ion. The high reproducibility ofthe fragmentation allows for assigning the ion fragments tospecific molecular classes. That means for the ions presentedhere, that the non-oxidized ions most probably originate fromaliphatic molecules or molecules which are dominated byan aliphatic structure. The ions containing a single oxygenatom most probably originate from molecules containing car-bonyl groups such as aldehydes, ketones or ethers. Exceptfor the CO+
2 ion onm/z44, which represents carboxyl com-pounds such as organic acids or esters, the concentration ofions containing two oxygen atom is highly dependent on thesample but generally and especially in these field campaignsnegligible. Since the signals atm/z43 andm/z44 are gener-ally dominated by the oxidized ions, they are associated withsecondary organic aerosol (SOA). Opposite to this,m/z55and m/z57 are dominated by aliphatic ions and are there-fore associated with primary organic aerosol (POA, Zhanget al., 2005b).
High-resolution analysis of the organic mass spectra al-lows for exact attribution of signal intensity to different ionsat the same nominal mass. While the CO+
2 ion is shown inblack, the other oxygenated ions are shown in green and the
Fig. 9. Average diurnal variation of the total mass (black), organics(green), nitrate (blue), sulfate (red), ammonium (orange), and chlo-ride (purple) as campaign averages (top panels) and for each of theindividual meteorological periods encountered in May 2008 (left)and March 20009 (right).
aliphatic ions in gray. At the nominal mass ofm/z43 theions C3H+
7 and C2H3O+ are detected. The latter is generallydominant and considered as a tracer of less oxidized/semi-volatile organic aerosol (SV-OOA, Ng et al., 2010). C3H+
8and C2H4O+ as well as CO+2 contribute to the signal atm/z44. CO+
2 is by far the dominating ion, originating fromhighly oxidized/low-volatile organic aerosol (LV-OOA) suchas organic acids (Ng et al., 2010). Except for a few instances,the time traces of all ions are highly correlated. An inter-esting phenomenon can be seen on the 15 May 2008. Thealiphatic ions onm/z43, m/z55, andm/z57 show a distinctpeak in the early hours which is simultaneous with a verydistinct peak in the chloride time trace. This supports theassumption of an organic origin of that chloride. This chlo-ride peak was not only detected by the AMS but also by thecollocated instruments MARGA-Sizer (Fig. 5) and TD-PRT-MS (Fig. 7) The temporal correlation of the AMS chloridepeak with the TD-PTR-MSm/z149 and the aliphatic ion timetraces further supports the organic origin of AMS detectedchloride.
As already seen in other field campaigns (Zhang et al.,2005a; Alfarra et al., 2004) and can be seen in the pie chart
Atmos. Chem. Phys., 12, 4723–4742, 2012 www.atmos-chem-phys.net/12/4723/2012/

A. A. Mensah et al.: Aerosol chemical composition at Cabauw 4735
Fig. 10.Time traces of different organic ions at mass to charge ratiom/z43,m/z44,m/z55, andm/z57 from top to bottom in May 2008(a)and March 2009(b), respectively. Please note, in 2008 the signals of C2H3O+ onm/z43 and CO+2 onm/z44 are divided by a factor of 10 to
allow for parallel display on the same axis as the other ions at the respectivem/z. In 2009 this is only the case for CO+2 .
insets,m/z43 andm/z44 are dominated by the oxidized com-ponent andm/z55, andm/z57 are dominated by the aliphaticcomponents. The pie charts give the contribution of the dif-ferent ions a the respectivem/z. The contribution of oxidizedto aliphatic ions differs significantly for the two measurementperiods. In general, the fraction of oxidized ions is higher inMay 2008. We interpret this as a result of the increases ox-idative potential of the atmosphere in spring/summer com-pared to winter. Higher intensity accompanied by longer du-ration of sunlight increases the production of OH radicals,which are the major oxidants in the atmosphere (Finlayson-Pitts and Pitts, 2000) during day time. E.g. while C2H3O+
contributes 85 % of the signal atm/z43 in May 2008, thecontribution is lowered to only 60 % in March 2009. Similarbehavior can be observed onm/z55 andm/z57 where the sig-nal is composed of contributions by C4H+
7 and C3H3O+, andC4H+
9 and C3H5O+, respectively. As already stated, thesemass to charge ratios are generally dominated by the non-oxidized ions and associated with fresh, primary and/or an-thropogenic emissions (Zhang et al., 2005a). The dominanceof the aliphatic ion increases from summer to winter. Thecontribution of C4H+
7 on m/z55 increases from slightly overhalf to more than two thirds. This increase is even morepronounced for C4H+
9 on m/z57, where the contribution in-
creases from slightly over half to more than three quarters.The overall increase in the contribution of aliphatic ions israther due to the significant decrease of the oxygenated ionsthan the moderate increase of the aliphatic ions from summerto winter.
3.5.2 Diurnal cycles of O:C and H:C ratios
Further insight to the composition of the organic particulatephase can be gained by investigating the oxygen to carbon(O:C) and hydrogen to carbon ratio (H:C), respectively. TheO:C and H:C ratios can be determined from high resolutionanalysis of the organic mass spectra (Aiken et al., 2007). Fig-ure 11a and b show the diurnal cycles of the O:C ratio (greendots, left axes) and H:C ratios (gray triangles, right axes) inMay 2008 and March 2009, respectively. The top panel ineach graph shows the diurnal average for the entire measure-ment period and the three panels below show the average di-urnal cycles for three specific time intervals. The O:C andH:C ratios are highly anti-correlated in both measurementperiods. The average O:C ratio in May 2008 is significantlyhigher than in March 2009. While the ratio reaches valuesof almost 0.7 in May 2008, which corresponds to highly ox-idized LV-OOA (Aiken et al., 2008), the O:C ratio did not
www.atmos-chem-phys.net/12/4723/2012/ Atmos. Chem. Phys., 12, 4723–4742, 2012

4736 A. A. Mensah et al.: Aerosol chemical composition at Cabauw
Fig. 11.Diurnal cycles of the O:C ratio (green dots, left axes) and H:C ratios (gray triangles, right axes) in May 2008(a) and March 2009(b), respectively. The top panel in each graph shows the diurnal average for the entire measurement period and the three panels below showthe average diurnal cycle for three specific time intervals.
exceed 0.4 in winter 2009. These low values are generally as-sociated with less oxidized SV-OOA (Jimenez et al., 2009).
On a daily basis, the O:C ratios show a minimum in theearly morning hours and a maximum during the daytime.This maximum is pronounced and extended in May 2008compared to March 2009 which correlates with more hoursof sunshine in May and therefore longer time of photochem-ical aging. This indicates local aging of organic compoundsby photochemical oxidation during the daytime. Interest-ingly, the period P2 during scavenged background conditionsin May 2008 shows a reduced amplitude in O:C ratio accom-panied by a high average value of 0.61. The combination ofthese two facts indicates the detected aerosol particles wereaged and subject to long range transport in addition to theabsence of local sources for OOA (Hildebrandt et al., 2010).In both measurement periods, the H:C ratios show a maxi-mum in the morning hours. In May 2008 a moderate increasebetween 04:00 h and 08:00 h can be seen. The ratio peaksbetween 05:00 h and 06:00 h UTC, which corresponds to 2 hlater in the day in local time. Therefore, the peak on H:C ra-tio appears at the time of morning traffic, which is generallyaccompanied by an increased emission of compounds high inH:C and low in O:C ratios from fossil fuel emissions (Aikenet al., 2008). In March 2009, morning peak values in H:C
are found between 06:00 h and 07:00 h UTC which also cor-responds to a local time of 07:00 h to 08:00 h due to reducedtime shift of only one hour in winter. The decrease in H:Cratio during the daytime is not only due to the transforma-tion from aliphatic to oxygenated compounds but also dueto temperature increase. Aliphatic compounds high in H:Ctend to have higher vapor pressures than oxygenated species,causing the aliphatic compounds to evaporate from the par-ticulate phase with increasing temperature. The temperaturedependence of O:C and H:C ratios was shown by Huffman etal. (2009) by thermodenuder experiments on ambient aerosolparticles. Reduced photochemical ageing due to reduced sun-light in addition to lower ambient temperatures can explainthe significantly higher H:C ratios in March 2009. As ex-pected, elevated H:C ratios were measured in winter com-pared to summer. While in March 2009, the H:C ratio fluc-tuates around 1.5, it fluctuates around 1.3 in May 2008. Theincreased H:C ratio corresponds to the finding of the traceranalysis showing reduced aging of the aerosol particles dueto a lowered oxidative potential of the atmosphere in wintertime.
Atmos. Chem. Phys., 12, 4723–4742, 2012 www.atmos-chem-phys.net/12/4723/2012/

A. A. Mensah et al.: Aerosol chemical composition at Cabauw 4737
Fig. 12. van Krevelen diagram presenting the H:C and O:C ratios for the two campaigns in May 2008 (left) and March 2008 (right),respectively. The data is colored by time and the result of a linear regression (black solid line) is shown. Transformation from CH2 to COand CO2 is indicated by the left (A to B) and right (A to C) dashed grey line, respectively.
3.5.3 O:C and H:C in the van Krevelen diagram
The H:C and O:C ratios of an ensemble of measurementscan be graphically illustrated in a van Krevelen diagram (vanKrevelen, 1950, Fig. 12). Here, the H:C ratio is plotted versusthe O:C ratio. Three distinct points in the graph are labeledin the left part of Fig. 12 with the letters A, B, and C, respec-tively. Label A is at a H:C ratio of 2.0 and an O:C ratio of0.0. This corresponds to a theoretical hydrocarbon consistingsolely of (-CH2-)-segments. The H:C ratio of 0.0 at an O:Cratio of 1.0 labeled B corresponds to a theoretical hydrocar-bon consisting solely of (-C(=O)-)-segments. And the H:Cratio of 0.0 at an O:C ratio of 2.0 corresponds to a theoret-ical hydrocarbon consisting solely of (-C(=O)O-)-segmentsis labeled C. The transition from point A to B correspondsto the transformation of a (-CH2-)-segment into a (-C(=O)-)-segment, i.e. a carbonyl group, is highlighted by the left greydashed line with a slope of−2. The transition from point Ato point C corresponds to the transformation of a (-CH2-)-segment into a (-C(=O)O-)-segment, i.e. a carboxyl group, ishighlighted by the right grey dashed line with a slope of−1.It is generally assumed that the final stage of atmospheric ox-idation is reached, when all organic carbon is transformed toCO2.
As can be seen in Fig. 12, the data acquired during the twofield campaigns in Cabauw in May 2008 and March 2009,respectively lies within the two grey dashed lines. The dataof the campaign in May 2008 colored by time is presentedin the left part of Fig. 12. The data points are lumped be-tween O:C = 0.25/H:C = 1.61 and O:C = 0.79/H:C = 0.91. Alinear regression to these data points yields a slope of−1.16
and an offset of 1.91 (R2= 0.85). The linear regression to
the data points of the campaign in March 2009 presented inthe right part of Fig. 12 yields a slope of−0.95 and an off-set of 1.80 (R2
= 0.80) and is focused to the region betweenO:C = 0.16/H:C = 1.70 and O:C = 0.64/H:C = 1.26. As couldalready be anticipated from the diurnal cycles of these tworatios in Fig. 11, the data points of 2008 ratios span overa broader range and are shifted to generally lower H:C andhigher O:C ratios compared to 2009. Though the slopes areslightly different, they are close to a value of−1 in bothyears. As described above, this slope is associated with thetransformation of a (−CH2−)-segment into a carboxylic-segment. This can be achieved also by the transformationof two (−CH2−)-segments into a hydroxycarbonyl-group(−C(=O)−HCOH−).
Though the organic aerosol measured at Cabauw duringthe two campaigns consisted of a multitude of different com-pounds, the data points are focused into a fairly narrow rangewithin the van Krevelen diagram. This result was also foundby Heald et al. (2010), who investigated a large number ofdifferent ambient and laboratory measurements, predomi-nantly showing a slope of−1 in the van Krevelen diagram.We agree to their conclusion that the differences in com-pound composition and aging processes for individual cam-paigns is rather reflected in the spread of the data points thanby a significantly different location within the diagram or sig-nificantly different regression slopes. Even detailed analysisof the van Krevelen diagram on a diurnal basis did not re-veal any evidence of hydration/dehydration reactions whichwould cause a slope of +1. Therefore, we conclude if at all
www.atmos-chem-phys.net/12/4723/2012/ Atmos. Chem. Phys., 12, 4723–4742, 2012

4738 A. A. Mensah et al.: Aerosol chemical composition at Cabauw
oligomerization reactions play only a minimal role during thetwo campaigns.
4 Summary and conclusion
Extensive aerosol chemical composition measurements overthe course of several weeks were performed at the CESARtower, The Netherlands, in May 2008 and March 2009. Whilethe measurement period in 2008 was dominated by organ-ics (40 %), nitrate was the dominant specie detected in 2009(42 %). In both years, nitrate was the most abundant inor-ganic specie detected in AMS and MARGA measurements.The phenomenon of high nitrate fractional abundances is notonly typical for the measurement location (ten Brink et al.,2009) but is known to occur all over Europe (ten Brink etal., 1997; Putaud et al., 2004). For the first time, a solelynitrate dependent CE was applied for quantifying ambientAMS data. This allows for an easy and straight forward cor-rection of the CE. The CE increased linearly for particulatenitrate fractions exceeding 0.3. A possible explanation is thereduced tendency of particles bouncing at elevated nitratecontent. This parameterization seems to be valid for all cen-tral European measurement locations during the EUCAARImeasurement campaign (Nemitz et al., 2012). The averageaerosol particulate mass loading was 10.21 µg m−3 in 2008and 6.85 µg m−3 in 2009, which is in good agreement withPM2.5 concentrations determined at different rural Europeanlocations (Van Dingenen et al., 2004).
Size resolved mass distribution measurements of the indi-vidual species detected in the AMS indicate a mode diameterat 400 nm to 500 nm for the total mass as well as for the in-organic species. The mass distribution of organics is muchbroader and extents into the size range below 100 nm. Simi-lar size distributions with inorganic species dominating in thelarger size fraction and a bimodal behavior of organics haveoften been observed in AMS measurements independent oflocation (Alfarra et al., 2004; Allan et al., 2003).
Comparison of AMS total mass to the mass derived fromSMPS measurements show high qualitative and quantitativeagreement. In 2008 a MARGA-Sizer was operated at CE-SAR tower and comparison of the various inlet channels toAMS data show best correlation for the 1 µm channel. How-ever, the mass concentrations of this channel were on aver-age a factor of 1.6 higher than the AMS total mass loading.Best quantitative agreement between AMS and MARGA-Sizer was obtained through the PM0.56 channel. Since thisdata present the first comparison of AMS and MARGA-Sizerof ambient aerosol particles, further parallel sampling cam-paigns are needed to investigate the presented discrepancy.For the first time, a comparison of AMS data to data ob-tained with the newly developed TD-PTR-MS is performed.Surprisingly, best qualitative and quantitative agreement wasachieved for the particulate nitrate concentration, which isdominantly of inorganic origin. The total organic mass de-
tected by the TD-PTR-MS accounted for 30 % to 85 % of theorganic mass detected by the AMS depending on the mea-surement period. Further intensive parallel measurements areneeded in the future for a deeper understanding of differencesin detected mass and temporal evolution.
High resolution analysis was performed to gain insightinto the composition of the organic particulate phase. Theexamination of specific organic tracers onm/z43, m/z44,m/z55, andm/z57 shows an increased contribution of oxy-genated compounds in May 2008 compared to March 2009.This is further supported by the investigation of the diur-nal O:C and H:C ratios in both years. While the O:C ratioreaches values of almost 0.7 associated with LV-OOA (Aikenet al., 2008) in May 2008, the O:C ratio does not exceed0.4, which is associated with SV-OOA. The reduced agingof the organic particulate matter in combination with an in-creased H:C ratio in winter/spring 2009 can be explained byreduced photochemical activity and increased condensationof aliphatic compounds due to the low average temperature.
Acknowledgements.This work was supported through the FP6project EUCAARI (Contract 34684) and EUSAAR (European Su-persites for Atmospheric Aerosol Research, EU FP6 Integrated In-frastructures Initiatives project, No. FP6-026140)
We appreciate the support from KNMI in hosting the experimentat Cabauw and for the access to meteorological data from thetower. The authors thank the CESAR tower team, especiallyMarcel Brinkenberg and Jaques Warmer for the big support duringboth campaigns. Further thanks go to P. Jongejan for his effort inoperating both MARGA’s and Marcel Moerman for performing thesize distribution measurements.
Edited by: V.-M. Kerminen
References
Aiken, A. C., DeCarlo, P. F., and Jimenez, J. L.: ElementalAnalysis of Organic Species with Electron Ionization High-Resolution Mass Spectrometry, Anal. Chem., 79, 8350–8358,doi:10.1021/ac071150w, 2007.
Aiken, A. C., DeCarlo, P. F., Kroll, J. H., Worsnop, D. R., Huff-man, J. A., Docherty, K. S., Ulbrich, I. M., Mohr, C., Kimmel,J. R., Sueper, D., Sun, Y., Zhang, Q., Trimborn, A., Northway,M., Ziemann, P. J., Canagaratna, M. R., Onasch, T. B., Alfarra,M. R., Prevot, A. S. H., Dommen, J., Duplissy, J., Metzger, A.,Baltensperger, U., and Jimenez, J. L.: O/C and OM/OC Ratios ofPrimary, Secondary, and Ambient Organic Aerosols with High-Resolution Time-of-Flight Aerosol Mass Spectrometry, Environ.Sci. Techol., 42, 4478–4485,doi:10.1021/es703009q, 2008.
Aiken, A. C., Salcedo, D., Cubison, M. J., Huffman, J. A., DeCarlo,P. F., Ulbrich, I. M., Docherty, K. S., Sueper, D., Kimmel, J.R., Worsnop, D. R., Trimborn, A., Northway, M., Stone, E. A.,Schauer, J. J., Volkamer, R. M., Fortner, E., de Foy, B., Wang,J., Laskin, A., Shutthanandan, V., Zheng, J., Zhang, R., Gaffney,J., Marley, N. A., Paredes-Miranda, G., Arnott, W. P., Molina,
Atmos. Chem. Phys., 12, 4723–4742, 2012 www.atmos-chem-phys.net/12/4723/2012/

A. A. Mensah et al.: Aerosol chemical composition at Cabauw 4739
L. T., Sosa, G., and Jimenez, J. L.: Mexico City aerosol analysisduring MILAGRO using high resolution aerosol mass spectrom-etry at the urban supersite (T0) – Part 1: Fine particle composi-tion and organic source apportionment, Atmos. Chem. Phys., 9,6633–6653,doi:10.5194/acp-9-6633-2009, 2009.
Alfarra, M. R., Coe, H., Allan, J. D., Bower, K. N., Boudries, H.,Canagaratna, M. R., Jimenez, J. L., Jayne, J. T., Garforth, A.A., Li, S.-M., and Worsnop, D. R.: Characterization of urbanand rural organic particulate in the Lower Fraser Valley usingtwo Aerodyne Aerosol Mass Spectrometers, Atmos. Environ.,38, 5745–5758,doi:10.1016/j.atmosenv.2004.01.054, 2004.
Allan, J. D., Bower, K. N., Coe, H., Boudries, H., Jayne, J. T., Cana-garatna, M. R., Millet, D. B., Goldstein, A. H., Quinn, P. K., We-ber, R. J., and Worsnop, D. R.: Submicron aerosol compositionat Trinidad Head, California, during ITCT 2K2: Its relationshipwith gas phase volatile organic carbon and assessment of in-strument performance, J. Geophys. Res.-Atmos., 109, D23S24,doi:10.1029/2003jd004208, 2004.
Canagaratna, M. R., Jayne, J. T., J.L., J., J.D., A., M.R., A., Zhang,Q., Onasch, T. B., Drewnick, F., Coe, H., Middlebrook, A., Delia,A., Williams, L. R., Trimborn, A. M., Northway, M. J., DeCarlo,P. F., Kolb, C. E., Davidovits, P., and Worsnop, D. R.: Chemicaland microphysical characterization of ambient aerosols with theaerodyne aerosol mass spectrometer, Mass Spectrom. Rev., 26,185–222,doi:10.1002/mas.20115, 2007.
Crosier, J., Allan, J. D., Coe, H., Bower, K. N., Formenti, P., andWilliams, P. I.: Chemical composition of summertime aerosol inthe Po Valley (Italy), northern Adriatic and Black Sea, Q. J. Roy.Meteorol. Soc., 133, 61–75,doi:10.1002/qj.88, 2007.
DeCarlo, P. F., Kimmel, J. R., Trimborn, A., Northway, M. J., Jayne,J. T., Aiken, A. C., Gonin, M., Fuhrer, K., Horvath, T., Docherty,K. S., Worsnop, D. R., and Jimenez, J. L.: Field-Deployable,High-Resolution, Time-of-Flight Aerosol Mass Spectrometer,Anal. Chem., 78, 8281–8289,doi:10.1021/ac061249n, 2006.
Dentener, F. J. and Crutzen, P. J.: Reaction of N2O5 onTropospheric Aerosols: Impact on the Global Distributionsof NOx, O3, and OH, J. Geophys. Res., 98, 7149–7163,doi:10.1029/92jd02979, 1993.
Drewnick, F., Schwab, J. J., Jayne, J. T., Canagaratna, M., Worsnop,D. R., and Demerjian, K. L.: Measurement of Ambient AerosolComposition During the PMTACS-NY 2001 Using an AerosolMass Spectrometer. Part I: Mass Concentrations, Aerosol Sci.Tech., 38, 92–103,doi:10.1080/02786820390229507, 2004.
Finlayson-Pitts, B. J. and Pitts, J. N.: Chemistry of the Upper andLower Troposphere, Academic Press, San Diego, USA, 2000.
Hallquist, M., Wenger, J. C., Baltensperger, U., Rudich, Y., Simp-son, D., Claeys, M., Dommen, J., Donahue, N. M., George, C.,Goldstein, A. H., Hamilton, J. F., Herrmann, H., Hoffmann, T.,Iinuma, Y., Jang, M., Jenkin, M. E., Jimenez, J. L., Kiendler-Scharr, A., Maenhaut, W., McFiggans, G., Mentel, T. F., Monod,A., Prevot, A. S. H., Seinfeld, J. H., Surratt, J. D., Szmigiel-ski, R., and Wildt, J.: The formation, properties and impactof secondary organic aerosol: current and emerging issues, At-mos. Chem. Phys., 9, 5155–5235,doi:10.5194/acp-9-5155-2009,2009.
Hamburger, T., McMeeking, G., Minikin, A., Birmili, W.,Dall’Osto, M., O’Dowd, C., Flentje, H., Henzing, B., Junninen,H., Kristensson, A., de Leeuw, G., Stohl, A., Burkhart, J. F.,Coe, H., Krejci, R., and Petzold, A.: Overview of the synop-
tic and pollution situation over Europe during the EUCAARI-LONGREX field campaign, Atmos. Chem. Phys., 11, 1065–1082,doi:10.5194/acp-11-1065-2011, 2011.
Hansel, A., Jordan, A., Holzinger, R., Prazeller, P., Vogel, W., andLindinger, W.: Proton-Transfer Reaction Mass-Spectrometry:On-line Trace Gas Analysis at the ppb Level, Int. J. Mass Spec-trom., 150, 609–619,doi:10.1016/0168-1176(95)04294-u, 1995.
Heald, C. L., Kroll, J. H., Jimenez, J. L., Docherty, K. S., DeCarlo,P. F., Aiken, A. C., Chen, Q., Martin, S. T., Farmer, D. K., andArtaxo, P.: A simplified description of the evolution of organicaerosol composition in the atmosphere, Geophys. Res. Lett., 37,L08803,doi:10.1029/2010gl042737, 2010.
Hildebrandt, L., Engelhart, G. J., Mohr, C., Kostenidou, E., Lanz,V. A., Bougiatioti, A., DeCarlo, P. F., Prevot, A. S. H., Bal-tensperger, U., Mihalopoulos, N., Donahue, N. M., and Pan-dis, S. N.: Aged organic aerosol in the Eastern Mediterranean:the Finokalia Aerosol Measurement Experiment – 2008, Atmos.Chem. Phys., 10, 4167–4186,doi:10.5194/acp-10-4167-2010,2010.
Holzinger, R., Kasper-Giebl, A., Staudinger, M., Schauer, G., andRockmann, T.: Analysis of the chemical composition of or-ganic aerosol at the Mt. Sonnblick observatory using a novelhigh mass resolution thermal-desorption proton-transfer-reactionmass-spectrometer (HR-TD-PTR-MS), Atmos. Chem. Phys., 10,10111–10128,doi:10.5194/acp-10-10111-2010, 2010a.
Holzinger, R., Williams, J., Herrmann, F., Lelieveld, J., Donahue,N. M., and Rockmann, T.: Aerosol analysis using a Thermal-Desorption Proton-Transfer-Reaction Mass Spectrometer (TD-PTR-MS): a new approach to study processing of organicaerosols, Atmos. Chem. Phys., 10, 2257–2267,doi:10.5194/acp-10-2257-2010, 2010b.
Huffman, J. A., Jayne, J. T., Drewnick, F., Aiken, A. C., Onasch, T.,Worsnop, D. R., and Jimenez, J. L.: Design, Modeling, Optimiza-tion, and Experimental Tests of a Particle Beam Width Probe forthe Aerodyne Aerosol Mass Spectrometer, Aerosol Sci. Tech.,39, 1143–1163,doi:10.1080/02786820500423782, 2005.
Huffman, J. A., Docherty, K. S., Aiken, A. C., Cubison, M. J., Ul-brich, I. M., DeCarlo, P. F., Sueper, D., Jayne, J. T., Worsnop,D. R., Ziemann, P. J., and Jimenez, J. L.: Chemically-resolvedaerosol volatility measurements from two megacity field studies,Atmos. Chem. Phys., 9, 7161–7182,doi:10.5194/acpd-9-2645-2009, 2009.
IPCC: Intergovernmental Panel on Climate Change: ClimateChange 2007: The Physical Science Basis, Cambrige UniversityPress, 2007.
Jayne, J. T., Leard, D. C., Zhang, X. F., Davidovits, P., Smith,K. A., Kolb, C. E., and Worsnop, D. R.: Development ofan aerosol mass spectrometer for size and composition anal-ysis of submicron particles, Aerosol Sci. Tech., 33, 49–70,doi:10.1080/027868200410840, 2000.
Jimenez, J. L., Jayne, J. T., Shi, Q., Kolb, C. E., Worsnop, D.R., Yourshaw, I., Seinfeld, J. H., Flagan, R. C., Zhang, X. F.,Smith, K. A., Morris, J. W., and Davidovits, P.: Ambient aerosolsampling using the Aerodyne Aerosol Mass Spectrometer, J.Geophys. Res.-Atmos., 108, 8425,doi:10.1029/2001JD001213,2003.
Jimenez, J. L., Canagaratna, M. R., Donahue, N. M., Prevot, A. S.H., Zhang, Q., Kroll, J. H., DeCarlo, P. F., Allan, J. D., Coe,H., Ng, N. L., Aiken, A. C., Docherty, K. S., Ulbrich, I. M.,
www.atmos-chem-phys.net/12/4723/2012/ Atmos. Chem. Phys., 12, 4723–4742, 2012

4740 A. A. Mensah et al.: Aerosol chemical composition at Cabauw
Grieshop, A. P., Robinson, A. L., Duplissy, J., Smith, J. D., Wil-son, K. R., Lanz, V. A., Hueglin, C., Sun, Y. L., Tian, J., Laak-sonen, A., Raatikainen, T., Rautiainen, J., Vaattovaara, P., Ehn,M., Kulmala, M., Tomlinson, J. M., Collins, D. R., Cubison, M.J., E, Dunlea, J., Huffman, J. A., Onasch, T. B., Alfarra, M. R.,Williams, P. I., Bower, K., Kondo, Y., Schneider, J., Drewnick,F., Borrmann, S., Weimer, S., Demerjian, K., Salcedo, D., Cot-trell, L., Griffin, R., Takami, A., Miyoshi, T., Hatakeyama, S.,Shimono, A., Sun, J. Y., Zhang, Y. M., Dzepina, K., Kimmel,J. R., Sueper, D., Jayne, J. T., Herndon, S. C., Trimborn, A.M., Williams, L. R., Wood, E. C., Middlebrook, A. M., Kolb,C. E., Baltensperger, U., and Worsnop, D. R.: Evolution of Or-ganic Aerosols in the Atmosphere, Science, 326, 1525–1529,doi:10.1126/science.1180353, 2009.
Kleinman, L. I., Springston, S. R., Daum, P. H., Lee, Y. N., Nun-nermacker, L. J., Senum, G. I., Wang, J., Weinstein-Lloyd, J.,Alexander, M. L., Hubbe, J., Ortega, J., Canagaratna, M. R.,and Jayne, J.: The time evolution of aerosol composition overthe Mexico City plateau, Atmos. Chem. Phys., 8, 1559–1575,doi:10.5194/acp-8-1559-2008, 2008.
Kulmala, M., Asmi, A., Lappalainen, H. K., Carslaw, K. S., Poschl,U., Baltensperger, U., Hov, Ø., Brenquier, J. L., Pandis, S.N., Facchini, M. C., Hansson, H. C., Wiedensohler, A., andO’Dowd, C. D.: Introduction: European Integrated Project onAerosol Cloud Climate and Air Quality interactions (EUCAARI)– integrating aerosol research from nano to global scales, At-mos. Chem. Phys., 9, 2825–2841,doi:10.5194/acp-9-2825-2009,2009.
Kulmala, M., Asmi, A., Lappalainen, H. K., Baltensperger, U.,Brenguier, J.-L., Facchini, M. C., Hansson, H.-C., Hov, Ø.,O’Dowd, C. D., Poschl, U., Wiedensohler, A., Boers, R.,Boucher, O., de Leeuw, G., Denier van der Gon, H. A. C., Fe-ichter, J., Krejci, R., Laj, P., Lihavainen, H., Lohmann, U., Mc-Figgans, G., Mentel, T., Pilinis, C., Riipinen, I., Schulz, M.,Stohl, A., Swietlicki, E., Vignati, E., Alves, C., Amann, M.,Ammann, M., Arabas, S., Artaxo, P., Baars, H., Beddows, D.C. S., Bergstrom, R., Beukes, J. P., Bilde, M., Burkhart, J. F.,Canonaco, F., Clegg, S. L., Coe, H., Crumeyrolle, S., D’Anna,B., Decesari, S., Gilardoni, S., Fischer, M., Fjaeraa, A. M., Foun-toukis, C., George, C., Gomes, L., Halloran, P., Hamburger, T.,Harrison, R. M., Herrmann, H., Hoffmann, T., Hoose, C., Hu,M., Hyvarinen, A., Horrak, U., Iinuma, Y., Iversen, T., Josipovic,M., Kanakidou, M., Kiendler-Scharr, A., Kirkevag, A., Kiss, G.,Klimont, Z., Kolmonen, P., Komppula, M., Kristjansson, J.-E.,Laakso, L., Laaksonen, A., Labonnote, L., Lanz, V. A., Lehtinen,K. E. J., Rizzo, L. V., Makkonen, R., Manninen, H. E., McMeek-ing, G., Merikanto, J., Minikin, A., Mirme, S., Morgan, W. T.,Nemitz, E., O’Donnell, D., Panwar, T. S., Pawlowska, H., Pet-zold, A., Pienaar, J. J., Pio, C., Plass-Duelmer, C., Prevot, A.S. H., Pryor, S., Reddington, C. L., Roberts, G., Rosenfeld, D.,Schwarz, J., Seland, Ø., Sellegri, K., Shen, X. J., Shiraiwa, M.,Siebert, H., Sierau, B., Simpson, D., Sun, J. Y., Topping, D.,Tunved, P., Vaattovaara, P., Vakkari, V., Veefkind, J. P., Viss-chedijk, A., Vuollekoski, H., Vuolo, R., Wehner, B., Wildt, J.,Woodward, S., Worsnop, D. R., van Zadelhoff, G.-J., Zardini,A. A., Zhang, K., van Zyl, P. G., Kerminen, V.-M., S Carslaw,K., and Pandis, S. N.: General overview: European Integratedproject on Aerosol Cloud Climate and Air Quality interactions(EUCAARI) – integrating aerosol research from nano to global
scales, Atmos. Chem. Phys., 11, 13061–13143,doi:10.5194/acp-11-13061-2011, 2011.
Lindinger, W., Hansel, A., and Jordan, A.: Proton-transfer-reactionmass spectrometry (PTR-MS): on-line monitoring of volatile or-ganic compounds at pptv levels, Chem. Soc. Rev., 27, 347–354,doi:10.1039/A827347Z 1998.
Liu, P., Ziemann, P. J., Kittelson, D. B., and McMurry, P. H.:Generating Particle Beams of Controlled Dimensions and Di-vergence: I. Theory of Particle Motion in Aerodynamic Lensesand Nozzle Expansions, Aerosol Sci. Tech., 22, 293–313,doi:10.1080/02786829408959748, 1995a.
Liu, P., Ziemann, P. J., Kittelson, D. B., and McMurry, P. H.: Gener-ating Particle Beams of Controlled Dimensions and Divergence:II. Experimental Evaluation of Particle Motion in AerodynamicLenses and Nozzle Expansions, Aerosol Sci. Tech., 22, 314–324,doi:10.1080/02786829408959749, 1995b.
Matthew, B. M., Middlebrook, A. M., and Onasch, T. B.:Collection Efficiencies in an Aerodyne Aerosol Mass Spec-trometer as a Function of Particle Phase for Labora-tory Generated Aerosols, Aerosol Sci. Tech., 42, 884–898,doi:10.1080/0278682080235679, 2008.
Mensah, A. A., Buchholz, A., Mentel, T. F., Tillmann, R., andKiendler-Scharr, A.: Aerosol mass spectrometric measurementsof stable crystal hydrates of oxalates and inferred relativeionization efficiency of water, J. Aerosol. Sci., 42, 11–19,doi:10.1016/j.jaerosci.2010.10.003, 2011.
Middlebrook, A. M., Bahreini, R., Jimenez, J. L., and Cana-garatna, M. R.: Evaluation of Composition-Dependent Col-lection Efficiencies for the Aerodyne Aerosol Mass Spec-trometer using Field Data, Aerosol Sci. Tech., 46, 258–271,doi:10.1080/02786826.2011.620041, 2011.
Monks, P. S., Granier, C., Fuzzi, S., Stohl, A., Williams, M. L., Aki-moto, H., Amann, M., Baklanov, A., Baltensperger, U., Bey, I.,Blake, N., Blake, R. S., Carslaw, K., Cooper, O. R., Dentener,F., Fowler, D., Fragkou, E., Frost, G. J., Generoso, S., Ginoux,P., Grewe, V., Guenther, A., Hansson, H. C., Henne, S., Hjorth,J., Hofzumahaus, A., Huntrieser, H., Isaksen, I. S. A., Jenkin,M. E., Kaiser, J., Kanakidou, M., Klimont, Z., Kulmala, M., Laj,P., Lawrence, M. G., Lee, J. D., Liousse, C., Maione, M., McFig-gans, G., Metzger, A., Mieville, A., Moussiopoulos, N., Orlando,J. J., O’Dowd, C. D., Palmer, P. I., Parrish, D. D., Petzold, A.,Platt, U., Poschl, U., Prevot, A. S. H., Reeves, C. E., Reimann,S., Rudich, Y., Sellegri, K., Steinbrecher, R., Simpson, D., tenBrink, H., Theloke, J., van der Werf, G. R., Vautard, R., Vestreng,V., Vlachokostas, C., and von Glasow, R.: Atmospheric compo-sition change – global and regional air quality, Atmos. Environ.,43, 5268–5350,doi:10.1016/j.atmosenv.2009.08.021, 2009.
Moolgavkar, S. H., Dockery, D. W., and Pope, C. A.: Air Pol-lution and Mortality, New Engl. J. Med., 330, 1237–1238,doi:10.1056/NEJM199404283301714, 1994.
Morgan, W. T., Allan, J. D., Bower, K. N., Esselborn, M., Har-ris, B., Henzing, J. S., Highwood, E. J., Kiendler-Scharr, A.,McMeeking, G. R., Mensah, A. A., Northway, M. J., Osborne,S., Williams, P. I., Krejci, R., and Coe, H.: Enhancement ofthe aerosol direct radiative effect by semi-volatile aerosol com-ponents: airborne measurements in North-Western Europe, At-mos. Chem. Phys., 10, 8151–8171,doi:10.5194/acp-10-8151-2010, 2010a.
Atmos. Chem. Phys., 12, 4723–4742, 2012 www.atmos-chem-phys.net/12/4723/2012/
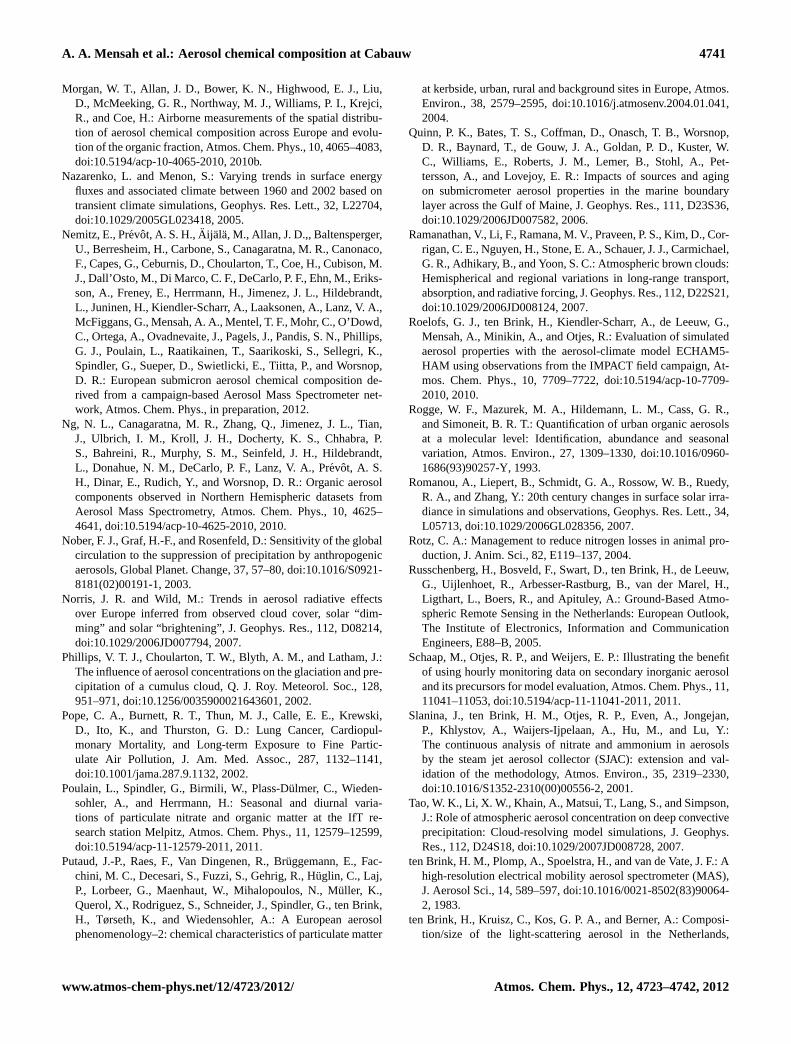
A. A. Mensah et al.: Aerosol chemical composition at Cabauw 4741
Morgan, W. T., Allan, J. D., Bower, K. N., Highwood, E. J., Liu,D., McMeeking, G. R., Northway, M. J., Williams, P. I., Krejci,R., and Coe, H.: Airborne measurements of the spatial distribu-tion of aerosol chemical composition across Europe and evolu-tion of the organic fraction, Atmos. Chem. Phys., 10, 4065–4083,doi:10.5194/acp-10-4065-2010, 2010b.
Nazarenko, L. and Menon, S.: Varying trends in surface energyfluxes and associated climate between 1960 and 2002 based ontransient climate simulations, Geophys. Res. Lett., 32, L22704,doi:10.1029/2005GL023418, 2005.
Nemitz, E., Prevot, A. S. H.,Aij ala, M., Allan, J. D.,, Baltensperger,U., Berresheim, H., Carbone, S., Canagaratna, M. R., Canonaco,F., Capes, G., Ceburnis, D., Choularton, T., Coe, H., Cubison, M.J., Dall’Osto, M., Di Marco, C. F., DeCarlo, P. F., Ehn, M., Eriks-son, A., Freney, E., Herrmann, H., Jimenez, J. L., Hildebrandt,L., Juninen, H., Kiendler-Scharr, A., Laaksonen, A., Lanz, V. A.,McFiggans, G., Mensah, A. A., Mentel, T. F., Mohr, C., O’Dowd,C., Ortega, A., Ovadnevaite, J., Pagels, J., Pandis, S. N., Phillips,G. J., Poulain, L., Raatikainen, T., Saarikoski, S., Sellegri, K.,Spindler, G., Sueper, D., Swietlicki, E., Tiitta, P., and Worsnop,D. R.: European submicron aerosol chemical composition de-rived from a campaign-based Aerosol Mass Spectrometer net-work, Atmos. Chem. Phys., in preparation, 2012.
Ng, N. L., Canagaratna, M. R., Zhang, Q., Jimenez, J. L., Tian,J., Ulbrich, I. M., Kroll, J. H., Docherty, K. S., Chhabra, P.S., Bahreini, R., Murphy, S. M., Seinfeld, J. H., Hildebrandt,L., Donahue, N. M., DeCarlo, P. F., Lanz, V. A., Prevot, A. S.H., Dinar, E., Rudich, Y., and Worsnop, D. R.: Organic aerosolcomponents observed in Northern Hemispheric datasets fromAerosol Mass Spectrometry, Atmos. Chem. Phys., 10, 4625–4641,doi:10.5194/acp-10-4625-2010, 2010.
Nober, F. J., Graf, H.-F., and Rosenfeld, D.: Sensitivity of the globalcirculation to the suppression of precipitation by anthropogenicaerosols, Global Planet. Change, 37, 57–80,doi:10.1016/S0921-8181(02)00191-1, 2003.
Norris, J. R. and Wild, M.: Trends in aerosol radiative effectsover Europe inferred from observed cloud cover, solar “dim-ming” and solar “brightening”, J. Geophys. Res., 112, D08214,doi:10.1029/2006JD007794, 2007.
Phillips, V. T. J., Choularton, T. W., Blyth, A. M., and Latham, J.:The influence of aerosol concentrations on the glaciation and pre-cipitation of a cumulus cloud, Q. J. Roy. Meteorol. Soc., 128,951–971,doi:10.1256/0035900021643601, 2002.
Pope, C. A., Burnett, R. T., Thun, M. J., Calle, E. E., Krewski,D., Ito, K., and Thurston, G. D.: Lung Cancer, Cardiopul-monary Mortality, and Long-term Exposure to Fine Partic-ulate Air Pollution, J. Am. Med. Assoc., 287, 1132–1141,doi:10.1001/jama.287.9.1132, 2002.
Poulain, L., Spindler, G., Birmili, W., Plass-Dulmer, C., Wieden-sohler, A., and Herrmann, H.: Seasonal and diurnal varia-tions of particulate nitrate and organic matter at the IfT re-search station Melpitz, Atmos. Chem. Phys., 11, 12579–12599,doi:10.5194/acp-11-12579-2011, 2011.
Putaud, J.-P., Raes, F., Van Dingenen, R., Bruggemann, E., Fac-chini, M. C., Decesari, S., Fuzzi, S., Gehrig, R., Huglin, C., Laj,P., Lorbeer, G., Maenhaut, W., Mihalopoulos, N., Muller, K.,Querol, X., Rodriguez, S., Schneider, J., Spindler, G., ten Brink,H., Tørseth, K., and Wiedensohler, A.: A European aerosolphenomenology–2: chemical characteristics of particulate matter
at kerbside, urban, rural and background sites in Europe, Atmos.Environ., 38, 2579–2595,doi:10.1016/j.atmosenv.2004.01.041,2004.
Quinn, P. K., Bates, T. S., Coffman, D., Onasch, T. B., Worsnop,D. R., Baynard, T., de Gouw, J. A., Goldan, P. D., Kuster, W.C., Williams, E., Roberts, J. M., Lemer, B., Stohl, A., Pet-tersson, A., and Lovejoy, E. R.: Impacts of sources and agingon submicrometer aerosol properties in the marine boundarylayer across the Gulf of Maine, J. Geophys. Res., 111, D23S36,doi:10.1029/2006JD007582, 2006.
Ramanathan, V., Li, F., Ramana, M. V., Praveen, P. S., Kim, D., Cor-rigan, C. E., Nguyen, H., Stone, E. A., Schauer, J. J., Carmichael,G. R., Adhikary, B., and Yoon, S. C.: Atmospheric brown clouds:Hemispherical and regional variations in long-range transport,absorption, and radiative forcing, J. Geophys. Res., 112, D22S21,doi:10.1029/2006JD008124, 2007.
Roelofs, G. J., ten Brink, H., Kiendler-Scharr, A., de Leeuw, G.,Mensah, A., Minikin, A., and Otjes, R.: Evaluation of simulatedaerosol properties with the aerosol-climate model ECHAM5-HAM using observations from the IMPACT field campaign, At-mos. Chem. Phys., 10, 7709–7722,doi:10.5194/acp-10-7709-2010, 2010.
Rogge, W. F., Mazurek, M. A., Hildemann, L. M., Cass, G. R.,and Simoneit, B. R. T.: Quantification of urban organic aerosolsat a molecular level: Identification, abundance and seasonalvariation, Atmos. Environ., 27, 1309–1330,doi:10.1016/0960-1686(93)90257-Y, 1993.
Romanou, A., Liepert, B., Schmidt, G. A., Rossow, W. B., Ruedy,R. A., and Zhang, Y.: 20th century changes in surface solar irra-diance in simulations and observations, Geophys. Res. Lett., 34,L05713,doi:10.1029/2006GL028356, 2007.
Rotz, C. A.: Management to reduce nitrogen losses in animal pro-duction, J. Anim. Sci., 82, E119–137, 2004.
Russchenberg, H., Bosveld, F., Swart, D., ten Brink, H., de Leeuw,G., Uijlenhoet, R., Arbesser-Rastburg, B., van der Marel, H.,Ligthart, L., Boers, R., and Apituley, A.: Ground-Based Atmo-spheric Remote Sensing in the Netherlands: European Outlook,The Institute of Electronics, Information and CommunicationEngineers, E88–B, 2005.
Schaap, M., Otjes, R. P., and Weijers, E. P.: Illustrating the benefitof using hourly monitoring data on secondary inorganic aerosoland its precursors for model evaluation, Atmos. Chem. Phys., 11,11041–11053,doi:10.5194/acp-11-11041-2011, 2011.
Slanina, J., ten Brink, H. M., Otjes, R. P., Even, A., Jongejan,P., Khlystov, A., Waijers-Ijpelaan, A., Hu, M., and Lu, Y.:The continuous analysis of nitrate and ammonium in aerosolsby the steam jet aerosol collector (SJAC): extension and val-idation of the methodology, Atmos. Environ., 35, 2319–2330,doi:10.1016/S1352-2310(00)00556-2, 2001.
Tao, W. K., Li, X. W., Khain, A., Matsui, T., Lang, S., and Simpson,J.: Role of atmospheric aerosol concentration on deep convectiveprecipitation: Cloud-resolving model simulations, J. Geophys.Res., 112, D24S18,doi:10.1029/2007JD008728, 2007.
ten Brink, H. M., Plomp, A., Spoelstra, H., and van de Vate, J. F.: Ahigh-resolution electrical mobility aerosol spectrometer (MAS),J. Aerosol Sci., 14, 589–597,doi:10.1016/0021-8502(83)90064-2, 1983.
ten Brink, H., Kruisz, C., Kos, G. P. A., and Berner, A.: Composi-tion/size of the light-scattering aerosol in the Netherlands,
www.atmos-chem-phys.net/12/4723/2012/ Atmos. Chem. Phys., 12, 4723–4742, 2012

4742 A. A. Mensah et al.: Aerosol chemical composition at Cabauw
Atmos. Environ., 31, 3955–3962, doi:10.1016/S1352-2310(97)00232-X, 1997.
ten Brink, H., Otjes, R., Jongejan, P., and Slanina, S.: An instrumentfor semi-continuous monitoring of the size-distribution of nitrate,ammonium, sulphate and chloride in aerosol, Atmos. Environ.,41, 2768–2779,doi:10.1016/j.atmosenv.2006.11.041, 2007.
ten Brink, H., Otjes, R., Jongejan, P., and Kos, G.: Monitoringof the ratio of nitrate to sulphate in size-segregated submi-cron aerosol in the Netherlands, Atmos. Res., 92, 270–276,doi:10.1016/j.atmosres.2008.12.003, 2009.
Trebs, I., Meixner, F. X., Slanina, J., Otjes, R., Jongejan, P., andAndreae, M. O.: Real-time measurements of ammonia, acidictrace gases and water-soluble inorganic aerosol species at a ru-ral site in the Amazon Basin, Atmos. Chem. Phys., 4, 967–987,doi:10.5194/acp-4-967-2004, 2004.
Van Dingenen, R., Raes, F., Putaud, J.-P., Baltensperger, U., Char-ron, A., Facchini, M. C., Decesari, S., Fuzzi, S., Gehrig, R.,Hansson, H.-C., Harrison, R. M., Huglin, C., Jones, A. M., Laj,P., Lorbeer, G., Maenhaut, W., Palmgren, F., Querol, X., Ro-driguez, S., Schneider, J., Brink, H. t., Tunved, P., Tørseth, K.,Wehner, B., Weingartner, E., Wiedensohler, A., and Wahlin,P.: A European aerosol phenomenology – 1: physical char-acteristics of particulate matter at kerbside, urban, rural andbackground sites in Europe, Atmos. Environ., 38, 2561–2577,doi:10.1016/j.atmosenv.2004.01.040, 2004.
Van Krevelen, D. W.: Graphical-statistical method for the study ofstructure and reaction processes of coal, Fuel, 24, 269–284, 1950.
Weijers, E. P., Schaap, M., Nguyen, L., Matthijsen, J., Deniervan der Gon, H. A. C., ten Brink, H. M., and Hoogerbrugge,R.: Anthropogenic and natural constituents in particulate mat-ter in the Netherlands, Atmos. Chem. Phys., 11, 2281–2294,doi:10.5194/acp-11-2281-2011, 2011.
Wiedensohler, A.: An approximation of the bipolar charge distribu-tion for particles in the submicron size range, J. Aerosol Sci., 19,387–389,doi:10.1016/0021-8502(88)90278-9, 1988.
Wiedensohler, A., Birmili, W., Nowak, A., Sonntag, A., Weinhold,K., Merkel, M., Wehner, B., Tuch, T., Pfeifer, S., Fiebig, M.,Fjaraa, A. M., Asmi, E., Sellegri, K., Depuy, R., Venzac, H., Vil-lani, P., Laj, P., Aalto, P., Ogren, J. A., Swietlicki, E., Williams,P., Roldin, P., Quincey, P., Huglin, C., Fierz-Schmidhauser, R.,Gysel, M., Weingartner, E., Riccobono, F., Santos, S., Gruning,C., Faloon, K., Beddows, D., Harrison, R., Monahan, C., Jen-nings, S. G., O’Dowd, C. D., Marinoni, A., Horn, H. G., Keck,
L., Jiang, J., Scheckman, J., McMurry, P. H., Deng, Z., Zhao, C.S., Moerman, M., Henzing, B., de Leeuw, G., Loschau, G., andBastian, S.: Mobility particle size spectrometers: harmonizationof technical standards and data structure to facilitate high qual-ity long-term observations of atmospheric particle number sizedistributions, Atmos. Meas. Tech., 5, 657–685,doi:10.5194/amt-5-657-2012, 2012.
Williams, B. J., Goldstein, A. H., Kreisberg, N. M., and Her-ing, S. V.: An In-Situ Instrument for Speciated OrganicComposition of Atmospheric Aerosols: Thermal DesorptionAerosol GC/MS-FID (TAG), Aerosol Sci. Tech., 40, 627–638,doi:10.1080/02786820600754631, 2006.
Zhang, Q., Alfarra, M. R., Worsnop, D. R., Allan, J. D., Coe,H., Canagaratna, M. R., and Jimenez, J. L.: Deconvolution andQuantification of Hydrocarbon-like and Oxygenated OrganicAerosols Based on Aerosol Mass Spectrometry, Environ. Sci.Technol., 39, 4938–4952,doi:10.1021/es048568l, 2005a.
Zhang, Q., Worsnop, D. R., Canagaratna, M. R., and Jimenez, J.L.: Hydrocarbon-like and oxygenated organic aerosols in Pitts-burgh: insights into sources and processes of organic aerosols,Atmos. Chem. Phys., 5, 3289–3311,doi:10.5194/acp-5-3289-2005, 2005b.
Zhang, Q., Jimenez, J. L., Canagaratna, M. R., Allan, J. D., Coe,H., Ulbrich, I., Alfarra, M. R., Takami, A., Middlebrook, A.M., Sun, Y. L., Dzepina, K., Dunlea, E., Docherty, K., De-Carlo, P. F., Salcedo, D., Onasch, T., Jayne, J. T., Miyoshi,T., Shimono, A., Hatakeyama, S., Takegawa, N., Kondo, Y.,Schneider, J., Drewnick, F., Borrmann, S., Weimer, S., Demer-jian, K., Williams, P., Bower, K., Bahreini, R., Cottrell, L.,Griffin, R. J., Rautiainen, J., Sun, J. Y., Zhang, Y. M., andWorsnop, D. R.: Ubiquity and dominance of oxygenated speciesin organic aerosols in anthropogenically-influenced NorthernHemisphere midlatitudes, Geophys. Res. Lett., 34, L13801,doi:10.1029/2007GL029979, 2007.
Zhang, X., Smith, K. A., Worsnop, D. R., Jimenez, J. L., Jayne,J. T., Kolb, C. E., Morris, J., and Davidovits, P.: NumericalCharacterization of Particle Beam Collimation: Part II IntegratedAerodynamic-Lens-Nozzle System, Aerosol Sci. Tech., 38, 619–638,doi:10.1080/02786820490479833, 2004.
Atmos. Chem. Phys., 12, 4723–4742, 2012 www.atmos-chem-phys.net/12/4723/2012/