Embed Size (px)
Citation preview

Aerosol and cloud property relationships for summertime stratiform
clouds in the northeastern Atlantic from Advanced Very High
Resolution Radiometer observations
Mark A. Matheson, James A. Coakley Jr., and William R. TahnkCollege of Oceanic and Atmospheric Sciences, Oregon State University, Corvallis, Oregon, USA
Received 1 May 2005; revised 5 August 2005; accepted 26 September 2005; published 23 December 2005.
[1] Advanced Very High Resolution Radiometer (AVHRR) 4-km data collected over thenortheastern Atlantic off the coast of the Iberian Peninsula for May to August 1995were used to investigate the feasibility of empirically deriving estimates of the aerosolindirect radiative forcing. A retrieval scheme was used to derive cloud visible opticaldepth, droplet effective radius, cloud layer altitude, and pixel-scale fractional cloud cover.A two-channel aerosol retrieval scheme was used to determine aerosol optical depth incloud-free pixels. Mean aerosol optical depths derived from the cloud-free pixels in 1� �1� latitude-longitude regions on a given satellite overpass were associated with meancloud properties derived from the cloudy pixels in the same region for the samesatellite overpass. The analysis was restricted to 1� regions that contained only single-layered, low-level cloud systems. Because aerosol and cloud properties are highlyvariable, results for the 4-month period were composited into 5� � 5� latitude-longituderegions and averaged to obtain reliable trends in the cloud properties as functions ofaerosol burden. Consistent with expectations for the aerosol indirect effect, in some 5�regions, droplet effective radii decreased, and cloud visible optical depths increased asaerosol optical depths increased. The hypothesis that drizzle is suppressed in pollutedclouds predicts that liquid water path should increase as aerosol burden increases. In threeof the thirteen 5� regions studied, the liquid water path increased as aerosol opticaldepth increased, but in none of the regions was the increase in cloud liquid waterstatistically significant. In the remaining regions, cloud liquid water remained constant oreven decreased with increasing aerosol optical depth. In many of the 5� regions, theretrieved aerosol optical depth increased as the percentage of cloudy pixels increased.Consistent with expectations from adiabatic cloud parcel models, droplet effective radius,cloud optical depth, and cloud liquid water path also increased as fractional cloud coverincreased. The simultaneous increase in retrieved aerosol and cloud optical depthswith increasing fractional cloud cover might have been due to the aerosol indirect effect,but it might also have resulted from processes that affect both the cloud and aerosolproperties as cloud cover changes. The dependence on fractional cloud cover suggests thatsome of the trends between aerosol optical depth and the cloud properties cannot be solelyattributed to the effects of the aerosols. For comparison with previous studies, thesimultaneous changes in aerosol and cloud properties were used to estimate the dailyaverage aerosol indirect forcing for overcast conditions in the summertime northeasternAtlantic. The magnitude of the indirect forcing relative to that of the direct forcingreported here is smaller than estimates reported by others.
Citation: Matheson, M. A., J. A. Coakley Jr., and W. R. Tahnk (2005), Aerosol and cloud property relationships for summertime
stratiform clouds in the northeastern Atlantic from Advanced Very High Resolution Radiometer observations, J. Geophys. Res., 110,
D24204, doi:10.1029/2005JD006165.
1. Introduction
[2] The effect of particulates on clouds and their conse-quent effect on the sunlight reflected by clouds was firstnoted by Twomey [1974] and is known as the ‘‘Twomey
Effect’’ or aerosol indirect radiative forcing. Starting withKaufman and Nakajima [1993], several studies have usedsatellite imagery data to deduce the effect of aerosols onclouds by correlating aerosol and cloud properties withinlocalized regions [Kaufman and Fraser, 1997; Wetzel andStowe, 1999; Nakajima et al., 2001; Sekiguchi et al., 2003;Quaas et al., 2004]. Among the goals of these studies were(1) to provide evidence for cloud-aerosol interactions on
JOURNAL OF GEOPHYSICAL RESEARCH, VOL. 110, D24204, doi:10.1029/2005JD006165, 2005
Copyright 2005 by the American Geophysical Union.0148-0227/05/2005JD006165$09.00
D24204 1 of 16

regional and global scales, and (2) to empirically deriveestimates of the aerosol indirect effect which might limit thelarge uncertainty in model estimates of the aerosol indirectradiative forcing. Partly because they rely on climate modelsimulations of cloud properties, which are known to be poor[Randall et al., 2003; Potter and Cess, 2004], modelestimates of the indirect forcing are highly uncertain[Lohmann and Feichter, 1997; Rotstayn, 1999; Lohmannet al., 2000; Lohmann and Lesins, 2002]. The modelestimates lead to the ‘‘poor confidence’’ and large uncer-tainty associated with the aerosol indirect radiative forcingas assessed by the Intergovernmental Panel on ClimateChange [2001].[3] Here the strategy of correlating aerosol properties
with collocated cloud properties to deduce the indirect effectof aerosols was reexamined by analyzing NOAA 14 4-kmAVHRR observations of marine stratus and stratocumulusand aerosol burden in the northeastern Atlantic for thesummer of 1995. The region and season were selectedbecause (1) stratus and stratocumulus are the dominantcloud system and (2) the flow is sufficiently weak thatfrequent intrusions of polluted air from Europe encroach onthe marine environment [Brenguier et al., 2000a]. Also, theNOAA 14 satellite was launched in December 1994 and theradiometric calibration of the AVHRR visible channel hasbeen characterized for the summer of 1995 [Tahnk andCoakley, 2001a, 2001b]. Although AVHRR has fewerspectral bands and coarser resolution than currently avail-able with the Moderate Resolution Imaging Spectrometer(MODIS) [e.g., King et al., 2003], the AVHRR was usedbecause of the multiyear length of its data record, which willbe exploited in a forthcoming paper (M. A. Matheson et al.,Satellite observations of summertime stratocumulus collo-cated with aerosols in the northeastern Atlantic, submittedto Journal of Geophysical Research, 2005).[4] This satellite study differs from the previous satellite
assessments in a variety of ways. First, the aerosols and theclouds were collocated at the same time in relatively smallregions (1� � 1� latitude-longitude). This condition ofsimultaneity and collocation avoided the possibility ofaerosols occurring on one day in one location beingcompared with cloud properties on another day in anotherlocation as was possible in some of the earlier studies[Wetzel and Stowe, 1999; Sekiguchi et al., 2003]. Likewise,the relatively small region in which the clouds and aerosolswere collocated also avoided attributing the appearance of acloud response in one location to the effects of aerosols inanother location [Sekiguchi et al., 2003; Quaas et al., 2004].Second, results from the simultaneous occurrence of cloudsand aerosols were composited within relatively limitedgeographic regions (5� � 5� latitude-longitude). Again,the restriction avoided comparisons of clouds in geographicregions subject to heavy aerosol burdens accompanied byone set of thermodynamic conditions with clouds in othergeographic regions subject to light aerosol burdens accom-panied by possibly distinctly different thermodynamic con-ditions as could have arisen in the global surveys performedby Nakajima et al. [2001] and Sekiguchi et al. [2003].Third, only regions with single-layered, low-level, maritimeclouds were examined in order to avoid multilayered cloudsystems, which might have contaminated the results in theearlier studies.
[5] In this study, the cloud properties were retrieved usinga scheme that accounts for the partial cloudiness of thepixels [Coakley et al., 2005]. While some earlier studiessought to avoid pixels that were partially cloud covered[Wetzel and Stowe, 1999; Nakajima et al., 2001], theretrieval schemes relied on the assumption that the pixelsused to obtain the cloud properties were overcast. Suchretrievals generally lead to estimates for partly cloudy pixelsof cloud droplet effective radii that are larger and opticaldepths that are smaller than would be obtained if the pixelswere overcast [Han et al., 1994; Platnick et al., 2003].Consequently, as a region fills with clouds and the numberof partly cloudy pixels decreases, cloud droplet effectiveradius might decrease while optical depth increases simplybecause of the biases in cloud properties associated with theassumption of overcast pixels. As aerosol optical depthhas been found to increase with increasing cloud cover[Sekiguchi et al., 2003; Ignatov et al., 2005; Loeb andManalo-Smith, 2005], correlations between aerosol burdenand the biased retrieved cloud properties that arise as cloudcover increases could be misinterpreted as evidence of theTwomey Effect. The partly cloudy pixel retrieval schemeused here yields droplet radii and cloud optical depths thatare both smaller, but only slightly so, for the clouds in thepartly cloudy pixels when compared with those of clouds innearby overcast pixels and is therefore less susceptible totrends that would mimic those associated with the TwomeyEffect. Nonetheless, as is shown in section 4, cloud prop-erties also vary systematically with regional cloud cover inways that mimic expectations based on adiabatic cloudparcel models. Consequently, some of the trends betweencloud properties and aerosol burden might be attributable tothe response of the clouds to thermodynamic processes.
2. Cloud and Aerosol Properties
[6] Global Area Coverage (GAC) radiances, with a nom-inal nadir resolution of 4 km, measured by the AdvancedVery High Resolution Radiometer (AVHRR) on board theNational Oceanic and Atmospheric Administration (NOAA)satellite, NOAA 14, were analyzed for the months of Maythrough August of 1995. All daytime satellite overpassesfrom the 4 months were used. The analysis area chosen forthis study was in the northeastern Atlantic bounded by 35�–55�N latitude and 20�W–0� longitude. Although the regionincludes parts of Europe, cloud and aerosol properties wereretrieved only over the ocean. The study region containedboth coastal and open ocean regions. In addition, periods ofboth sustained onshore and offshore flow were observed inthe NCEP reanalysis wind fields. These geographic andmeteorological conditions allow for the analysis of a widerange of aerosol burdens and their effects on clouds. Thisregion has also been studied in a variety of field campaignssuch as the Atlantic Stratocumulus Transition Experiment(ASTEX) [Albrecht et al., 1995] and the Second AerosolCharacterization Experiment (ACE–2) [Raes et al., 2000].[7] Channel 1 (0.64 mm) of the AVHRR was calibrated in
reference to the radiometrically stable ice sheets of Antarc-tica [Tahnk and Coakley, 2001a, 2001b]. An on-boardblackbody and deep-space views were used to calibratechannels 3 and 4 (3.7 and 11 mm) [Kidwell, 1995]. Imagerpixels containing land were identified by the latitude and
D24204 MATHESON ET AL.: INFERENCES OF AEROSOL-CLOUD INTERACTIONS
2 of 16
D24204

longitude included in the AVHRR data stream and wereremoved from further analysis. Pixels which may have beenaffected by sun glint were assumed to be those for which theangle of reflection was within 40� of that for specularreflection from a flat surface. Pixels in the sun glint wereremoved from the analysis. A scene identification schemewas used to determine if the 4-km pixels were cloud-free,completely overcast by clouds in a single layer, partiallycovered by clouds, or overcast by clouds that were distrib-uted in altitude [Coakley et al., 2005].[8] Aerosol optical depths at 0.55 mm were retrieved in
the imager pixels identified as cloud-free using a two-channel method originally developed to obtain aerosolproperties from AVHRR for the Indian Ocean Experiment(INDOEX) [Coakley et al., 2002]. For the INDOEX aero-sols, the bias and RMS error in the aerosol optical depth at0.65 mm were 0.01 ± 0.06 when compared to surface Sunphotometer data. While the retrieval scheme for the aerosolsdifferentiated between a fine mode aerosol, an averagecontinental aerosol described by Hess et al. [1998], and acoarse mode aerosol, a marine aerosol, the correlationsperformed here were between cloud properties and totalaerosol optical depth, which is given by the sum of the fineand coarse mode aerosol optical depths. The total aerosoloptical depth yielded the strongest correlations with clouddroplet effective radius. As the fine mode fraction for theregion was found to be 0.66, the fine mode optical depthand total aerosol optical depth produced much the samecorrelations with droplet effective radius, while the coarsemode optical depth produced little correlation. Nonetheless,in all but one of the 5� latitude-longitude regions for whichthe correlations were significant when using both the totalaerosol optical depth and the fine mode optical depth, orusing both the total optical depth and the coarse modeoptical depth, the trends in the cloud properties with aerosoloptical depth were in the same direction.[9] Cloud properties were retrieved using the method of
Coakley et al. [2005]. For pixels that the scene identificationscheme identified as being overcast by optically thicksingle-layered clouds, radiances at 0.64, 3.7 and 11 mmwere used to retrieve cloud optical thickness, dropleteffective radius, and cloud layer altitude. For partly cloudypixels the clouds were assumed to be at the mean altituderetrieved for the nearby overcast pixels. In addition, thepixel radiances were assumed to have a linear mixture of theradiances that would be seen if the pixels were eithercompletely overcast or completely cloud-free, so that,
I ¼ 1� Acð ÞIs þ AcIc tc;Re; zcð Þ
where I is the radiance observed by the satellite instrument,Ac is the fractional cloud cover for the pixel, Is is theaverage radiance for the cloud-free portion of the pixel, andIc(tc, Re, zc) is the average radiance for the cloud-coveredportion of the pixel and is a function of: tc, the cloud opticaldepth, Re, the droplet effective radius, and, zc, the cloudlayer altitude. With zc given by the altitude retrieved fornearby pixels that were overcast, radiances at 0.64, 3.7, and11 mm were used to derive Ac, tc, and Re. Radiances in thecloud-free portions of the partly cloudy pixels wereassumed to be equal to the mean of the radiances takenfrom nearby cloud-free pixels, or, lacking sufficient nearby
cloud-free pixels, from a monthly and regional climatologyof cloud-free radiances.[10] An example of derived cloud and aerosol properties
is shown in Figure 1. The region was covered largely bylow-level clouds (Figure 1a) but some high clouds werepresent on this day as indicated by their emission at 11 mm(Figure 1b). As described below, 1� � 1� latitude-longituderegions that contain clouds that are not from single-layered,low-level systems were excluded from the data analysis. Onthis day, there was a high aerosol burden in the region offthe Iberian Peninsula, but the air north of approximately 43�N was relatively clean (Figure 1c). If the aerosol propertiesin the cloudy pixels are assumed to be similar to the aerosolproperties in the nearby cloud-free pixels then the clouds offthe coast of Iberia were in an environment with high aerosolburden, whereas the clouds further north were in an envi-ronment with a relatively low aerosol burden. The clouds inthe north had larger droplet radii and the clouds near thecoast of Iberia had smaller droplet radii (Figure 1d). Therelationship between droplet radius and aerosol burdenillustrated in Figure 1 is qualitatively consistent with thatexpected for the Twomey Effect.[11] The analysis in this study was limited to single-
layered, low-level clouds. Regions off the western coastof most continents at midlatitudes often contain marineboundary layer clouds and are regions likely to be suscep-tible to cloud-aerosol interaction [Nakajima et al., 2001].Screening rules were applied to the radiances and retrievedcloud properties within 1� � 1� latitude-longitude regions toidentify regions in which all of the clouds were part of asingle-layered, low-level system. If a cloud layer waspresent in the region, the mean cloud temperature and the5th percentile of the 11-mm brightness temperature wererequired to be within 20 K of the mean surface temperature.In addition, to ensure that the clouds were in a well-definedlayer, as opposed to being distributed in altitude, if thedifference between the mean surface temperature and themean cloud temperature was greater than or equal to 10 Kthen (Ts � T5th)/(Ts � Tc) < 1.2 and sc/(Ts � Tc) < 0.2,where, Ts is the mean surface temperature, T5th is the 5thpercentile of the 11-mm brightness temperature, Tc is themean temperature associated with the layer at altitude zc,and sc is the standard deviation of Tc, for the 1� latitude-longitude region. If Ts � Tc < 10 K then the requirementswere Ts � T5th < 12 K and sc < 2 K.[12] Figure 2 illustrates the average properties of single-
layered, low-level clouds for the region under study. Satel-lite data for individual cloud or aerosol properties wereaveraged in 1� � 1� latitude-longitude regions for eachorbital pass. In the case of the cloud properties, the averageswere obtained by weighting the values by the pixel-scalefractional cloud cover. The means of each 1� latitude-longitude region were then averaged over all passes. Forthe summer of 1995, the air in the northeastern Atlantic wasmore polluted near the coast and cleaner over the ocean(Figure 2a). The cloud droplet effective radius of single-layered, low-level clouds was small near the coast and largeover the open ocean (Figure 2b). Aerosol optical depthincreased and cloud droplet effective radius decreased fromwest to east, as if the trends were manifestations of theTwomey Effect. On the other hand, the thinning andbreakup of clouds as the continent is approached is typical
D24204 MATHESON ET AL.: INFERENCES OF AEROSOL-CLOUD INTERACTIONS
3 of 16
D24204

of marine stratus and may simply reflect the influence ofincursions of dry continental air in the marine boundarylayer and not the Twomey Effect. Regions closest to thecoast were usually clear or contained broken clouds andmore extensive cloud cover appeared further from shore(Figure 2c).[13] Fractional cloud cover was relatively constant from
south to north (Figure 2c). Both aerosol optical depth andcloud droplet radius increased from south to north despitethe supposition that cloud-aerosol interaction should resultin smaller droplets where there is more aerosol. Dropleteffective radius did not decrease as aerosol optical depth
increased from south to north because there were south-north trends in cloud optical depth (Figure 2d) and liquidwater path (Figure 2e), here calculated as W = 2
3Retcr, where
r = 1 g cm�3 is the density of water.
3. Relating Collocated Aerosol and CloudProperties
[14] Pixel-scale observations from each satellite over-pass were mapped into 1� � 1� latitude-longitude regions.As stated earlier, all data were screened to ensure that 1�latitude-longitude regions that were either cloud-free
Figure 1. Images of the study region on 7 June 1995, dominated by low-level, single-layeredstratocumulus off the west coast of Europe. (a) 0.84-mm 4-km AVHRR reflectances. (b) 11-mm radiances.Upper-level clouds (light objects) overlie a portion of the low-level clouds. (c) Same as Figure 1a butoverlain with 0.55-mm aerosol optical depth. (d) Same as Figure 1a but overlain with droplet effectiveradius (mm).
D24204 MATHESON ET AL.: INFERENCES OF AEROSOL-CLOUD INTERACTIONS
4 of 16
D24204

ocean or partly covered by nothing but single-layered,low-level clouds were the only regions included in theanalysis. The means of all cloud and aerosol propertieswere calculated in each 1� latitude-longitude region withthe constraint that a minimum of 10 pixels or 5% of thepixels in the region (whichever was greater) for bothaerosol and cloud properties were required. Becauseaerosol optical depth has an autocorrelation length ofroughly 100 km [Anderson et al., 2003], the aerosolproperties in the cloud-free pixels of the region wereassumed to be well correlated with the aerosol propertiesin the cloudy pixels of the same region.[15] Within a geographic region, cloud properties and
aerosol burden vary markedly from day to day. To detectreliable trends in cloud properties and aerosol burden theeffects of the variability are reduced through averaging.In this study observations for the 1� latitude-longituderegions for each orbital pass were averaged within theircorresponding 5� � 5� latitude-longitude regions and thenthe pass averages were averaged for the 4-month period.In addition, as was discussed in the previous section,there were large-scale trends in the 20� � 20� latitude-longitude region that could be interpreted as evidence forthe Twomey Effect. The trends in cloud properties, on theother hand, may not be due to changes in aerosol burdenbut instead due to other factors such as the outflow of
dry air from the continent. Averaging the collocated cloudand aerosol properties for the 1� latitude-longitude regionswithin the 5� latitude-longitude regions reduces somewhatthe influence of the large-scale geographic gradients. Ofcourse, gradients are still likely within the 5� latitude-longitude regions, but the 5� regions were the smalleststudied because of the relatively small number of samplesthat fell into each region.[16] For each satellite overpass, the observations were
segregated into 0.05-unit-wide bins in 0.55-mm aerosoloptical depth. The means of the cloud properties and thecorresponding aerosol optical depths were then calculatedfor each bin. After the means of each bin for each pass hadbeen calculated, the bins were averaged over all passes. Forexample, Figure 3 shows the mean droplet effective radiuscalculated for every 0.05-unit-wide bin of aerosol opticaldepth. In Figure 3, and all subsequent figures, results for allsixteen 5� latitude-longitude regions are displayed simulta-neously in their appropriate geographic location. Results forregions that contained land used data only from the pixelsidentified as being over ocean. In order to ensure that thevalues in each season-averaged bin were representative,means from at least five different passes for that bin wererequired. Linear least squares fits were performed to quan-tify the trends in the cloud properties with aerosol opticaldepth. To improve the confidence in the least squares fits,
Figure 2. Summertime (May to August 1995) average properties of single-layered, low-level cloudsand aerosols. Contour data have been smoothed to show large-scale trends. (a) 0.55-mm aerosol opticaldepth. Aerosol data from 1� � 1� latitude-longitude regions that contained clouds that were not partof a single-layered, low-level cloud system were not included in the analysis. (b) Droplet effectiveradius (mm). (c) Fractional cloud cover. (d) 0.64-mm cloud optical depth. (e) Liquid water path (g/m2). InFigures 2b–2e, data were limited to 1� latitude-longitude regions that contained only low-level, single-layered cloud systems. In calculating the pass averages within a region, cloud properties were weightedby the pixel-scale fractional cloud cover.
D24204 MATHESON ET AL.: INFERENCES OF AEROSOL-CLOUD INTERACTIONS
5 of 16
D24204

outlier data were removed by eliminating 1� latitude-longi-tude regions from individual satellite passes that had meansthat were outside the 5th and 95th percentiles for anyproperty, except fractional cloud cover, in that 5� latitude-longitude region for the entire summer’s collection of data.Fractional cloud cover is constrained between 0.0 and 1.0,so extremes were not considered outliers. Three of thesixteen regions had insufficient observations for calculatingcorrelations. These regions are left blank in Figures 3–9.[17] The error bars for each bin in Figure 3 are given
by the standard error of the bin, calculated as thestandard deviation of the means of the individual satellitepasses contributing to that bin divided by the square rootof the number of satellite passes. Averages within a bin
for each pass were taken to be statistically independent.As noted earlier, linear fits to the bin means wereperformed to determine the trends in the cloud propertieswith aerosol optical depth. In the fits, the means wereinversely weighted by their estimated standard errors[Bevington, 1969]. The slopes and estimates of theiruncertainties were obtained from the distribution of thedata about the trend lines [Press et al., 1994] and arereported in the figures. A slope is considered to bestatistically significant if its magnitude is greater thantwice the estimated uncertainty.[18] For the 4-month period, 577 satellite overpasses
were analyzed. There were 59,352 1� latitude-longituderegions that contained at least one pixel that was ob-
Figure 3. Means of daily averaged droplet effective radius (mm) for 1� latitude-longitude regions binnedfor each 0.05 interval of aerosol optical depth. Each subpanel contains data from that 5� � 5� latitude-longitude region. Error bars represent the standard error, given by the standard deviation of the meansfrom individual days for that bin divided by the square root of the number of days that contributedobservations to that bin. The dashed line is a linear fit to the bin means inversely weighted by the standarderrors. Also given are the mean and standard deviation estimated for the slope of the linear fit.
D24204 MATHESON ET AL.: INFERENCES OF AEROSOL-CLOUD INTERACTIONS
6 of 16
D24204

served during daytime, over water, and away from sunglint, and was therefore suitable for attempting a retrieval.The number and percentage of 1� regions that passed thedata screening algorithms described in this section arelisted in Table 1. In order to maximize the signal of theaerosol indirect effect, data were tightly screened. Only2.9% of the available 1� regions were used in theanalysis. Despite the screening, the data were still rathernoisy. The estimated uncertainties in the slopes of theassociated cloud properties and aerosol optical depthswere often larger than the slope estimates themselves.The highly variable nature of clouds makes determiningreliable trends in cloud properties challenging.[19] As is shown in Figure 3, in all but one of the 5�
latitude-longitude regions droplet radius decreased asaerosol burden increased. Some regions showed an in-crease in cloud optical depth as aerosol burden increasedwhile other regions showed no trend or even a decreasein cloud optical depth as aerosol burden increased
(Figure 4). Eight of the thirteen regions showed adecrease in droplet effective radius and an increase incloud optical depth as aerosol burden increased. In onlyone of these eight regions, however, were the slopessignificantly greater than twice the estimated error inthe slopes and thus taken to be statistically significant.All but one region showed an increase in droplet numberconcentration, as given by tc/(2pRe
2), with increasingaerosol burden (not shown). Clouds in some regions wereprobably gaining CCN as aerosol burden increased andthe clouds were probably responding to the aerosolsconsistent with the Twomey Effect.[20] None of the 5� latitude-longitude regions showed
an increase in liquid water path as aerosol burdenincreased with an estimated slope that was significantlylarger than the error estimate of the slope (Figure 5).Many regions showed a decrease in liquid water path asaerosol burden increased. Decreases in liquid water havealso been observed for ship tracks [Platnick et al., 2000;
Figure 4. Same as Figure 3 but for 0.64-mm cloud optical depth and 0.55-mm aerosol optical depth.
D24204 MATHESON ET AL.: INFERENCES OF AEROSOL-CLOUD INTERACTIONS
7 of 16
D24204

Coakley and Walsh, 2002]. Such trends might stand asevidence against the suppression of drizzle and increasedcloud liquid water and cloud lifetimes for polluted cloudsproposed by Albrecht [1989]. On the other hand, highaerosol burdens in the coastal regions might have beenassociated with air originating over the continent, andthus the air was dryer. Clouds that formed in this dryerair might have been starved for water and quicklyevaporated by entraining dry air from above the cloud,while clouds that formed far from the coast might haveformed in moister, oceanic air with higher humidity andwere less likely to dry out [Ackerman et al., 2004].Attempts to use humidity data from 2.5� � 2.5� lati-tude-longitude resolution NCEP reanalysis products to testthis hypothesis were inconclusive. The decrease in cloudliquid water as aerosol burden increased might also beexplained by the aerosol semidirect effect; an increase inaerosol burden might lead to increased atmospheric heat-
ing which hinders cloud formation and augments clouddissipation [Ackerman et al., 2000].
4. Dependence of Cloud Properties and AerosolOptical Depth on Regional Cloud Cover
[21] The previous section demonstrated that in someregions changes in cloud and aerosol properties were relatedin ways that are consistent with the Twomey Effect. Cloudproperties, on the other hand, are also interrelated regardlessof aerosol burdens. The possibility that the relationshipsamong the cloud properties could have been incorrectlyattributed to the Twomey Effect is explored.[22] Adiabatic cloud models provide a theoretical basis
for relationships among cloud properties. Szczodrak et al.[2001] derive Re / tc
1/5 and give observational evidence forthis relationship in maritime stratus off the west coast ofNorth America. Brenguier et al. [2000b] describe aircraft
Figure 5. Same as Figure 3 but for cloud liquid water path (g/m2) and 0.55-mm aerosol optical depth.
D24204 MATHESON ET AL.: INFERENCES OF AEROSOL-CLOUD INTERACTIONS
8 of 16
D24204

observations showing liquid water content, w / h, whereh is height above cloud base. By integration, the columnwater amount, W / H, where H is cloud geometricthickness. Brenguier et al. [2000b] also provide observa-tional evidence for the derived relationship Re / h1/3, andfind tc / H5/3. All of these relationships are for constantcloud droplet number concentration, and should thereforebe observable for adiabatic conditions and a given aerosolburden. As cloud fields break up, however, fractional cloudcover decreases, mixing of dry air into clouds increases, and
the relationships among cloud properties are likely to departfrom those derived assuming adiabatic cloud parcels.[23] Figures 6 and 7 show trends in cloud properties as
fractional cloud cover increased. Here binning proceduressimilar to those used in Figures 3–5 were used but the binsare for every 0.05 in fractional cloud cover for the 1�regions. When associating aerosol and cloud properties,the 1� latitude-longitude regions used in the analysis wererequired to contain both cloud and aerosol retrievals. Thisrestriction does not apply when comparing cloud properties
Figure 6. Means of daily averaged 0.64-mm cloud optical depth for 1� latitude-longitude regions binnedfor each 0.05 interval of fractional cloud cover. Each subpanel contains data from that 5� � 5� latitude-longitude region. Circles are data for 1� regions that contained sufficient observations of both aerosol andcloud properties to be included in Figures 3–5. Crosses are data from 1� latitude-longitude regions thatpassed the screening tests for single-layered, low-level clouds but lacked a sufficient number of aerosolretrievals to be included in the aerosol-cloud associations. The root-mean-square of the standard error (asdescribed in Figure 3) for the two data sets are shown in the bottom right corner of each panel. Thedashed line is a linear fit to the bin means of the combined data sets inversely weighted by the standarderrors of the combined data sets. Also given are the mean and standard deviation estimated for the slopeof the linear fit.
D24204 MATHESON ET AL.: INFERENCES OF AEROSOL-CLOUD INTERACTIONS
9 of 16
D24204

to fractional cloud cover. Figures 6 and 7 show data fromboth 1� latitude-longitude regions that were used in thecloud-aerosol associations (circles) and 1� latitude-longi-tude regions that passed the screening tests for single-layered, low-level clouds but lacked sufficient numbers ofaerosol retrievals to be included in the cloud-aerosol asso-ciations (crosses). The data shown as circles in Figures 6and 7 are the same as used in the cloud-aerosol correlations(Figures 3–5). As regions filled with clouds, the relation-ships among the cloud properties exhibited qualitatively thetendencies expected for adiabatic cloud parcels. Cloudoptical depth increased as fractional cloud cover increased(Figure 6). In all but the southernmost regions, dropleteffective radius increased as fractional cloud cover in-creased (Figure 7). For a given cloud cover fraction, cloudoptical depths and droplet effective radii of the cloudsassociated with (circles) and not associated with aerosols(crosses) showed little difference with the exception ofdroplet effective radius in the southernmost regions. There,
clouds observed near aerosols (circles in Figure 7) hadlarger droplet effective radii than clouds that were presentwith no collocated aerosol retrievals (crosses in Figure 7).Liquid water path, which is proportional to the product ofcloud optical depth and droplet effective radius, increased asfractional cloud cover increased in all 5� latitude-longituderegions (not shown). Clouds observed near aerosolsappeared to have higher cloud tops than clouds observedwith no collocated aerosol retrievals (not shown). Cloud topheight decreased with increasing fractional cloud cover inapproximately half of the 5� latitude-longitude regions andwas independent of fractional cloud cover in the other halfof the regions (not shown).[24] Aerosol optical depth can be associated with both the
fractional cloud cover and the cloudy pixel fraction, definedas the fraction of pixels in a 1� latitude-longitude region thatwere identified as having clouds (pixel-scale cloud fraction,Ac > 0.2). Because aerosol optical depth is not retrieved inpartly cloudy pixels, cloudy pixel fraction was used as an
Figure 7. Same as Figure 6 but for droplet effective radius (mm) and fractional cloud cover.
D24204 MATHESON ET AL.: INFERENCES OF AEROSOL-CLOUD INTERACTIONS
10 of 16
D24204
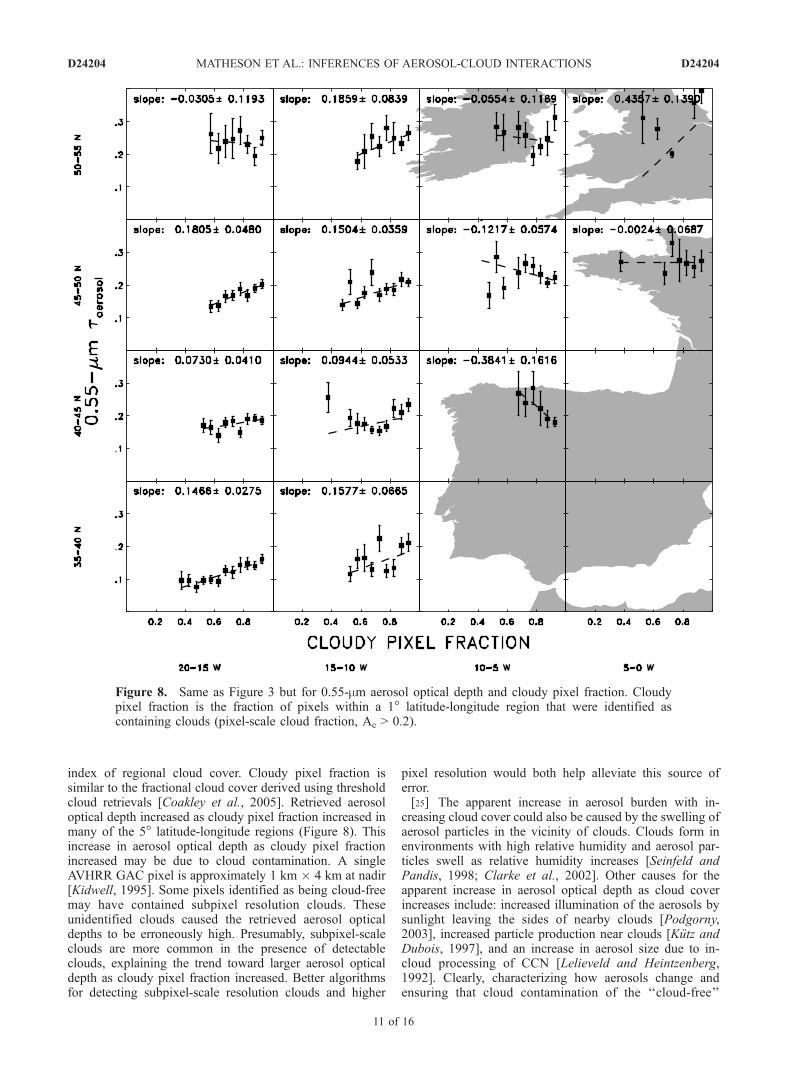
index of regional cloud cover. Cloudy pixel fraction issimilar to the fractional cloud cover derived using thresholdcloud retrievals [Coakley et al., 2005]. Retrieved aerosoloptical depth increased as cloudy pixel fraction increased inmany of the 5� latitude-longitude regions (Figure 8). Thisincrease in aerosol optical depth as cloudy pixel fractionincreased may be due to cloud contamination. A singleAVHRR GAC pixel is approximately 1 km � 4 km at nadir[Kidwell, 1995]. Some pixels identified as being cloud-freemay have contained subpixel resolution clouds. Theseunidentified clouds caused the retrieved aerosol opticaldepths to be erroneously high. Presumably, subpixel-scaleclouds are more common in the presence of detectableclouds, explaining the trend toward larger aerosol opticaldepth as cloudy pixel fraction increased. Better algorithmsfor detecting subpixel-scale resolution clouds and higher
pixel resolution would both help alleviate this source oferror.[25] The apparent increase in aerosol burden with in-
creasing cloud cover could also be caused by the swelling ofaerosol particles in the vicinity of clouds. Clouds form inenvironments with high relative humidity and aerosol par-ticles swell as relative humidity increases [Seinfeld andPandis, 1998; Clarke et al., 2002]. Other causes for theapparent increase in aerosol optical depth as cloud coverincreases include: increased illumination of the aerosols bysunlight leaving the sides of nearby clouds [Podgorny,2003], increased particle production near clouds [Kutz andDubois, 1997], and an increase in aerosol size due to in-cloud processing of CCN [Lelieveld and Heintzenberg,1992]. Clearly, characterizing how aerosols change andensuring that cloud contamination of the ‘‘cloud-free’’
Figure 8. Same as Figure 3 but for 0.55-mm aerosol optical depth and cloudy pixel fraction. Cloudypixel fraction is the fraction of pixels within a 1� latitude-longitude region that were identified ascontaining clouds (pixel-scale cloud fraction, Ac > 0.2).
D24204 MATHESON ET AL.: INFERENCES OF AEROSOL-CLOUD INTERACTIONS
11 of 16
D24204

pixels remains unchanged as regions go from being largelycloud-free to largely overcast are hurdles which will have tobe overcome before reliable assessments of the indirecteffect of aerosols can be obtained empirically. Better cloudscreening and better characterizations of aerosols in thevicinity of clouds are among the desired outcomes of thecombination of lidar and imagery to come from CALIPSOand A-Train observations [Winker et al., 2003].[26] In all of the 5� latitude-longitude regions where
aerosol optical depth increased as cloudy pixel fractionincreased (Figure 8), cloud optical depth also increased asfractional cloud cover increased (Figure 6). The simulta-neous increase in cloud and aerosol optical depth could be
interpreted as an indication of the Twomey Effect, assuggested previously in this study (Figure 4). On the otherhand, both cloud and aerosol optical depth might have beenchanging in response to cloud cover, indicating that at leastsome of the perceived correlation between cloud andaerosol optical depths may not be due to the TwomeyEffect.[27] How can aerosol optical depth (Figure 8) and droplet
effective radius (Figure 7) both increase with increasingcloud cover fraction, yet droplet effective radius decreasewith increasing aerosol optical depth (Figure 3)? The resultsshown for all of the parameters in Figures 3–8 are meansdrawn from widely dispersed distributions. Aerosol and
Figure 9. Radiative forcing estimates (W/m2) for an arbitrary increase of 0.55-mm aerosol optical depthof 0.1 (from 0.15 to 0.25). Solid bars are the forcings for overcast conditions calculated using the changesin cloud optical depth taken from the linear fits in Figure 4 and an increase of the aerosol optical depthbelow the cloud. Shaded bars are the same forcing as the black bars except the aerosol optical depth washeld at the ‘‘background’’ level. Open bars are the forcings for overcast conditions calculated using thechanges in droplet effective radius taken from the linear fits in Figure 3 and assuming a constant liquidwater path. The dashed line is the aerosol direct radiative forcing for cloud-free conditions (�3.94 W/m2).
D24204 MATHESON ET AL.: INFERENCES OF AEROSOL-CLOUD INTERACTIONS
12 of 16
D24204
cloud optical depths have highly skewed distributions. Bothhave long tails stretching to large optical depths at lowfrequencies. Droplet radius, on the other hand, has a morecompact distribution owing to bounds constrained by drop-let formation at the low end and by precipitation at the highend. The full range of cloud properties is exhibited underaverage aerosol conditions while the clouds that appear withthe infrequent occurrence of large aerosol burdens tend tohave smaller than average droplets and, for the most part,larger than average optical depths. The fact that dropletradius decreases with increasing aerosol optical depthdespite the countering trends of increasing droplet radiusand aerosol optical depth with increasing cloud coverfraction suggests that the clouds are likely responding tothe increased particle loading. On the other hand, since thenumber of partly cloudy pixels generally decreases and thenumber of overcast pixels increases as regional cloud coverincreases, and since droplet radius is generally overesti-mated when the partly cloudy pixels are assumed to beovercast, the downward trend in droplet radius with increas-ing aerosol optical depth may also arise from misidentifyingsome partly cloudy pixels as being overcast [Coakley et al.,2005]. Because of the natural trends in cloud properties withchanging cloud fraction, the potential errors in the cloudproperty retrievals, and the observed increase in aerosoloptical depth as the cloudy pixel fraction increases, cautionmust clearly be used in attributing observed correlations ofcloud and aerosol properties to the Twomey Effect.
5. Radiative Forcing Estimates
[28] Section 3 demonstrated that cloud microphysicalproperties might have been changing in response to changesin aerosol optical depth. Section 4 explained that thecorrespondence between aerosol optical depth and cloudproperties is more complicated than suggested by section 3.Because of the great interest in determining the magnitudeof aerosol indirect radiative forcing, this section estimatesthe forcing using the trends calculated in section 3. Theseresults must, of course, be viewed skeptically in light of thediscussion of section 4.[29] A broadband radiative transfer model that accounts
for scattering and absorption by gases, aerosols, and clouds[Coakley et al., 2002] was used to calculate top of theatmosphere fluxes in each of the 5� latitude-longitude
regions. For the calculations, an equal mix of continentaland marine aerosols as described by Hess et al. [1998] wasassumed. The mean fraction of continental aerosol type forthe 1� latitude-longitude regions containing both cloud andaerosol retrievals was 0.66 ± 0.30. In this study, an arbitrarychange in 0.55-mm aerosol optical depth of 0.1 was used toproduce the radiative effects. The ‘‘background’’ level waschosen to be an aerosol optical depth of 0.15, and the‘‘polluted’’ level was chosen to be an aerosol optical depthof 0.25. When a cloud was inserted in the model it wasplaced above the aerosol layer and the optical depth of thecloud was taken from the linear fits in Figure 4 associatedwith the aerosol optical depths set at 0.15 and 0.25.[30] Calculations were performed for five different cases:
(1) cloud-free and a ‘‘background’’ 0.55-mm aerosol opticaldepth of 0.15, (2) overcast with a cloud optical depth givenby that associated with a ‘‘background’’ 0.55-mm aerosoloptical depth of 0.15 as given in Figure 4 combined with anunderlying aerosol with the same optical depth, (3) cloud-free and a ‘‘polluted’’ 0.55-mm aerosol optical depth of 0.25,(4) overcast with a cloud optical depth associated with a‘‘polluted’’ 0.55-mm aerosol optical depth of 0.25 as givenin Figure 4 combined with an underlying aerosol with thesame optical depth, and (5) overcast with a cloud opticaldepth associated with a ‘‘polluted’’ 0.55-mm aerosol opticaldepth of 0.25 as given in Figure 4 but combined with anunderlying aerosol with the ‘‘background’’ 0.55-mm opticaldepth of 0.15. The difference between cases 1 and 3 is theaerosol direct radiative forcing and is the same in all 5�latitude-longitude regions. The difference between cases 2and 4 is here reported as the aerosol indirect radiativeforcing. Changes in cloud cover associated with changesin aerosol optical depth were not considered in thesecalculations. The aerosol indirect radiative forcing reportedhere is not comparable to the forcing between preindustrialand current times, but is rather the forcing that results froman arbitrary 0.1 change in the 0.55-mm aerosol optical depthfor overcast conditions. Cases 2 and 5 had the same amountof aerosol, but the optical depths of the clouds weredifferent. The difference between cases 2 and 5 was usedto investigate the relative contributions of changes in cloudproperties and changes in aerosol burden in the calculationof the aerosol indirect radiative forcing.[31] The direct radiative forcing for cloud-free oceans is
the same in all 5� latitude-longitude regions, �3.94 W/m2
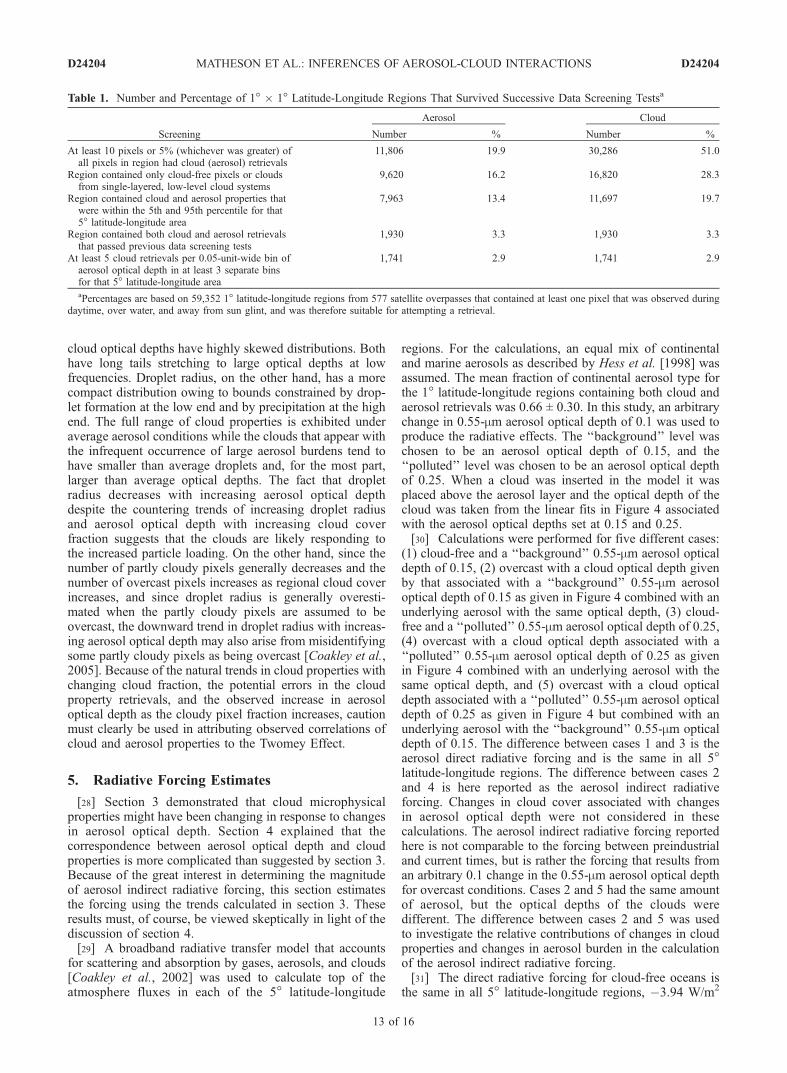
Table 1. Number and Percentage of 1� � 1� Latitude-Longitude Regions That Survived Successive Data Screening Testsa
Screening
Aerosol Cloud
Number % Number %
At least 10 pixels or 5% (whichever was greater) ofall pixels in region had cloud (aerosol) retrievals
11,806 19.9 30,286 51.0
Region contained only cloud-free pixels or cloudsfrom single-layered, low-level cloud systems
9,620 16.2 16,820 28.3
Region contained cloud and aerosol properties thatwere within the 5th and 95th percentile for that5� latitude-longitude area
7,963 13.4 11,697 19.7
Region contained both cloud and aerosol retrievalsthat passed previous data screening tests
1,930 3.3 1,930 3.3
At least 5 cloud retrievals per 0.05-unit-wide bin ofaerosol optical depth in at least 3 separate binsfor that 5� latitude-longitude area
1,741 2.9 1,741 2.9
aPercentages are based on 59,352 1� latitude-longitude regions from 577 satellite overpasses that contained at least one pixel that was observed duringdaytime, over water, and away from sun glint, and was therefore suitable for attempting a retrieval.
D24204 MATHESON ET AL.: INFERENCES OF AEROSOL-CLOUD INTERACTIONS
13 of 16
D24204

(shown as dashed lines in Figure 9). This forcing is the24-hour average forcing for an increase of 0.1 in the aerosol0.55-mm optical depth for cloud-free oceans during thesummer months in the northeastern Atlantic. The indirectradiative forcing varied from �14.60 W/m2 to 2.43 W/m2
(shown as solid bars in Figure 9). In approximately half theregions, the indirect radiative forcing was found to providemore cooling than the direct radiative forcing. In two of theregions, the indirect radiative forcing was found to bewarming. In these two regions, cloud optical depth de-creased with increasing aerosol optical depth (Figure 4).[32] Case 5 gives the top of the atmosphere forcing for
‘‘polluted’’ clouds over ‘‘background’’ aerosols. The differ-ence between case 2 and case 5 is shown as shaded bars inFigure 9 and was compared to the aerosol indirect radiativeforcing (the difference between case 2 and case 4) as anindication of how much of the aerosol indirect forcing wassolely the result of the changes in cloud properties. In allregions, the aerosol indirect radiative forcing and theforcing by changes in cloud properties alone were similar,within 1.5 W/m2, indicating that changes in the overcastregions due to the scattering and absorption by the increasedburden of aerosols was relatively minor.[33] The radiative forcing calculations were repeated, but
instead of calculating cloud optical depth using the trendsshown in Figure 4, cloud optical depth was calculated usingthe observed changes in droplet effective radius as aerosoloptical depth increased (Figure 3) and an assumption offixed liquid water. The indirect radiative forcing calculatedin this manner was always cooling and varied from �7.78 to�0.68 W/m2 (shown as open bars in Figure 9). The averagevalue of the radiative forcing calculated for constant liquidwater, weighting the 13 regions equally, was �4.69 W/m2,which is smaller than the average forcing calculated usingobserved changes in cloud optical depth, �5.22 W/m2. Inten of the regions the forcing calculated by assuming fixedliquid water is more than 3 W/m2 different from the forcingcalculated by using observed changes in cloud opticaldepth. In one region, the assumption of fixed liquid watergives a forcing that was 10.48 W/m2 smaller than the valuecalculated using the observed changes in cloud opticaldepth. Many climate model simulations show an increasein cloud water content with increasing aerosols [e.g.,Feichter et al., 2004] whereas the results presented hereshow that a decrease in liquid water path is clearly possible(Figure 5).[34] The mean value of the aerosol indirect radiative
forcing for overcast conditions, weighting the 13 regionsequally, was �5.22 W/m2 for a 0.1 change in aerosol0.55-mm optical depth. The change in albedo for overcastconditions per unit change in aerosol optical depth, calcu-lated using a solar constant of 1365 W/m2 and the diurnalaverage of the cosine of the solar zenith angle for July forthe North Atlantic of 0.354, was Dr/Dta = 0.11. Kaufmanand Fraser [1997], studying the effect of smoke on low-level clouds over the Amazon, observed a similar value,Dr/Dta = 0.12 ± 0.08.[35] Sekiguchi et al. [2003], using AVHRR data, estimated
the global mean aerosol indirect radiative forcing, notincluding changes in cloud fraction, as between �0.7 and�0.9 W/m2. Their fractional cloud cover was between 0.3and 0.4, indicating an indirect radiative forcing for overcast
conditions of �1.75 to �3.0 W/m2. They also calculated anaerosol direct radiative forcing of �0.4 W/m2, indicating aradiative forcing for cloud-free conditions of �0.57 to�0.67 W/m2. Therefore Sekiguchi et al. [2003] calculatedan indirect forcing for overcast conditions that was 3 to4.5 times greater than the direct forcing for cloud-freeconditions. In the current study, the mean value of theaerosol indirect radiative forcing for overcast conditionswas only slightly larger than the direct forcing for cloud-free conditions (�5.22 and �3.94 W/m2 respectively).When holding cloud liquid water constant, Sekiguchi et al.[2003] calculated an indirect radiative forcing (�0.64 or�0.16 W/m2) that was 30 or 76% less than the indirectforcing calculated for observed changes in cloud opticaldepth (�0.91 or �0.68 W/m2). The current study calculatesan indirect radiative forcing assuming constant liquid waterthat was 10% less than the forcing calculated from observedchanges in cloud optical depth (�4.69 and �5.22 W/m2
respectively). Both Sekiguchi et al. [2003] and the currentstudy indicate that the assumption of fixed liquid water canlead to estimates of the aerosol indirect radiative forcing thatare different from the indirect forcing that is estimated for theobserved changes in cloud optical depth.[36] Rotstayn and Penner [2001] used a global climate
model to estimate the global average direct radiative forcingbetween the preindustrial and current eras as �0.75 W/m2
and the indirect forcing as �2.57 W/m2. Because theirmodel included multiple cloud layers (approximately 40%low-cloud cover and 32% high-cloud cover), it is difficult totranslate these numbers into forcings for cloud-free andovercast conditions. Nevertheless, their estimate of indirectforcing was substantially larger than their estimate of directradiative forcing. A major difference between the currentstudy and those of Sekiguchi et al. [2003] and Rotstayn andPenner [2001] is that their studies were global averageswhereas the current study was limited to a 20� � 20�latitude-longitude region in the northeastern Atlantic. Inaddition, the current study used collocated simultaneousobservations of aerosol and cloud properties as discussedearlier.
6. Conclusions
[37] AVHRR imagery data with a nominal nadir resolu-tion of 4 km were collected over the northeastern Atlanticfor May to August 1995. Within each satellite overpass,mean cloud properties deduced from the cloudy pixels in1� � 1� latitude-longitude regions were associated withsimultaneous mean aerosol properties deduced from thecloud-free pixels in the same 1� latitude-longitude regions.The observations were screened so that 1� latitude-longituderegions that contained only single-layered, low-level cloudsand had sufficient numbers of cloud-free pixels yieldingaerosol retrievals were used in the analysis. In pixels thatcontained clouds, a retrieval scheme was used to derive:cloud visible optical depth, droplet effective radius, cloudlayer altitude, and pixel-scale fractional cloud cover. Aero-sol optical depth was retrieved in cloud-free pixels. Resultswere composited in 5� � 5� latitude-longitude areas. Theconditions of simultaneity and close spatial proximity wereadopted to ensure that the observed properties of the cloudswere in response to the observed aerosol burden, that is,
D24204 MATHESON ET AL.: INFERENCES OF AEROSOL-CLOUD INTERACTIONS
14 of 16
D24204

comparisons of clouds from one day and location toaerosols from a different day or different location wereavoided.[38] Clouds in some areas of the study region appeared to
respond to aerosols as predicted by the Twomey Effect: asaerosol optical depth increased, cloud droplet numberconcentration increased, droplet effective radius decreased,and cloud optical depth increased. Strong evidence fortrends consistent with the Twomey Effect was lacking inmany of the 5� latitude-longitude regions. Many regionsexhibited no change or even a decrease in cloud liquid wateras aerosol burden increased. The incursion of dry, pollutedcontinental air in the marine environment is suggested as apossible explanation for the decrease in cloud water asso-ciated with the increase in aerosol optical depth.[39] As regional fractional cloud cover increased, droplet
effective radius, cloud optical depth, and cloud liquid waterpath all increased. Aerosol optical depth increased as thepercentage of pixels identified as containing clouds (pixel-scale cloud fraction, Ac > 0.2) increased. The increase inretrieved aerosol optical depth as cloud fraction increasedmight have been due to (1) cloud contamination in theretrievals of the aerosol properties, (2) the swelling ofaerosols in the high-humidity cloudy environments, (3) theincreased illumination of the cloud-free columns bythe scattering of sunlight reflected from nearby clouds,(4) the increased particle production by photochemicalprocesses in the vicinity of clouds, and (5) the chemicalprocessing within cloud droplets leading to larger particleswhen the droplets evaporate. The simultaneous increase incloud optical depth and aerosol optical depth as fractionalcloud cover increased might be interpreted as the aerosolindirect effect. On the other hand, cloud and aerosol opticaldepth were both responding to an increase in cloud coverand some of the correlation between the cloud and aerosoloptical depths might not have been due to the TwomeyEffect.[40] An assumption intrinsic to all satellite studies of
cloud-aerosol interaction is that clouds observed near aero-sols are influenced by aerosols similar to those observednearby. The current study was limited to single-layered,low-level clouds. It was assumed that most of the aerosolswere in the boundary layer and affected the microphysicalproperties of the low-level clouds. The region off the coastof Europe was chosen, in part, because aerosol plumescoming from the continent are often in the boundary layer[Johnson et al., 2000]. A vertical profiling instrument suchas GLAS [Abshire et al., 1998] or the lidar to be flown onthe CALIPSO satellite [Winker et al., 2003] is required todetermine whether the observed clouds and aerosols areactually at the same altitude and thus likely to be interacting,or a substantial fraction of the aerosol is in a lofted layerabove the clouds, as presumably would be the case for thelong-range transport of windblown dust.[41] For comparison with other studies, a broadband radi-
ative transfer model was used to calculate the direct andindirect radiative forcing for an arbitrary change of 0.1 in theaerosol 0.55-mm optical depth. The 24-hour average sum-mertime indirect radiative forcing calculated for overcastconditions in the 5� latitude-longitude regions ranged from�14.60 to 2.43W/m2. Themajority of this forcing was due tochanges in the cloud properties and not to the increased
reflectivity caused by increased aerosol burden beneath theclouds. When averaged over all regions, the aerosol indirecteffect for overcast conditions was �5.22 W/m2, which wasonly slightly larger than the direct radiative forcing of�3.94 W/m2 for cloud-free regions. Rerunning the forcingcalculations using the observed changes in droplet effectiveradius and assuming fixed liquid water resulted in an aerosolindirect radiative forcing that was 10% less (�4.69 W/m2)than the forcing calculated from observed changes in cloudoptical depth. The indirect forcing obtained here is similar tothat found by Kaufman and Fraser [1997]. The indirectforcing when compared with the direct forcing is smallerthan similar comparisons reported by Sekiguchi et al. [2003]and by Rotstayn and Penner [2001]. Here no account wasmade for changes in fractional cloud cover which may beassociated with the effects of the aerosols because, as notedearlier, many alternative physical processes might explain thecorrelations observed between aerosol burden and cloudcover fraction.
[42] Acknowledgments. We thank two anonymous reviewers whosecomments greatly improved the presentation. This work was supported inpart by the NASA CALIPSO Project through NAS1-99104 and in part bythe NOAA Global Change Program through NA16GP2911. Part of thiswork was also performed while one of the authors (J.A.C.) was a visitor inthe NASA Goddard Earth Science and Technology Fellows Program atNASA’s Goddard Space Flight Center. The hospitality, suggestions, andhelpfulness of colleagues at Goddard were greatly appreciated.
ReferencesAbshire, J. B., J. C. Smith, and B. E. Schutz (1998), The geoscience laseraltimeter system (GLAS), AIP Conf. Proc., 240, 33–37.
Ackerman, A. S., O. B. Toon, D. E. Stevens, A. J. Heymsfield,V. Ramanathan, and E. J. Welton (2000), Reduction of tropical cloudinessby soot, Science, 288, 1042–1047.
Ackerman, A. S., M. P. Kirkpatrick, D. E. Stevens, and O. B. Toon (2004),The impact of humidity above stratiform clouds on indirect aerosol cli-mate forcing, Nature, 432, 1014–1017.
Albrecht, B. A. (1989), Aerosols, cloud microphysics, and fractional clou-diness, Science, 245, 1227–1230.
Albrecht, B. A., C. S. Bretherton, D. Johnson, W. H. Scubert, and A. S.Firsch (1995), The Atlantic stratocumulus transition experiment—AS-TEX, Bull. Am. Meteorol. Soc., 76, 889–904.
Anderson, T. L., R. J. Charlson, D. M. Winker, J. A. Ogren, and K. Holmen(2003), Mesoscale variations of tropospheric aerosols, J. Atmos. Sci., 60,119–136.
Bevington, P. R. (1969), Data Reduction and Error Analysis for the Phy-sical Sciences, Mcgraw-Hill, New York.
Brenguier, J.-L., P. Y. Chuang, Y. Fouquart, D. W. Johnson, F. Parol,H. Pawlowska, J. Pelon, L. Schuller, F. Schroder, and J. Snider(2000a), An overview of the ACE-2 CLOUDYCOLUMN closure experi-ment, Tellus, Ser. B, 52, 815–827.
Brenguier, J.-L., H. Pawlowska, L. Schuller, R. Preusker, J. Fischer, andY. Fouquart (2000b), Radiative properties of boundary layer clouds:Droplet effective radius versus number concentration, J. Atmos. Sci.,57, 803–821.
Clarke, A. D., et al. (2002), INDOEX aerosol: A comparison and summaryof chemical, microphysical, and optical properties observed from land,ship, and aircraft, J. Geophys. Res., 107(D19), 8033, doi:10.1029/2001JD000572.
Coakley, J. A., Jr., and C. D. Walsh (2002), Limits to the aerosol indirectradiative effect derived from observations of ship tracks, J. Atmos. Sci.,59, 668–680.
Coakley, J. A., Jr., W. R. Tahnk, A. Jayaraman, P. K. Quinn, C. Devaux,and D. Tanre (2002), Aerosol optical depths and direct radiative forcingfor INDOEX derived from AVHRR: Theory, J. Geophys. Res., 107(D19),8009, doi:10.1029/2000JD000182.
Coakley, J. A., Jr., M. A. Friedman, and W. R. Tahnk (2005), Retrievals ofcloud properties for partly cloudy imager pixels, J. Atmos. Oceanic Tech-nol., 22, 3–17.
Feichter, J., E. Roeckner, U. Lohmann, and B. Liepert (2004), Nonlinearaspects of the climate response to greenhouse gas and aerosol forcing,J. Clim., 17, 2384–2398.
D24204 MATHESON ET AL.: INFERENCES OF AEROSOL-CLOUD INTERACTIONS
15 of 16
D24204

Han, Q., W. B. Rossow, and A. A. Lacis (1994), Near-global survey ofeffective droplet radii in liquid water clouds using ISCCP data, J. Clim.,7, 465–497.
Hess, M., P. Koepke, and I. Schult (1998), Optical properties of aerosolsand clouds: The software package OPAC, Bull. Am. Meteorol. Soc., 79,831–844.
Ignatov, A., P. Minnis, N. Loeb, B. Wielicki, W. Miller, S. Sun-Mack,D. Tanre, L. Remer, I. Laszlo, and E. Geier (2005), Two MODIS aerosolproducts over ocean on the Terra and Aqua CERES SSF datasets,J. Atmos. Sci., 62, 1008–1031.
Intergovernmental Panel on Climate Change (2001), Climate Change 2001:The Scientific Basis, edited by J. T. Houghton et al., Cambridge Univ.Press, New York.
Johnson, D. W., et al. (2000), An overview of the Lagrangian experimentsundertaken during the North Atlantic regional Aerosol CharacterizationExperiment (ACE-2), Tellus, Ser. B, 52, 290–320.
Kaufman, Y. J., and R. S. Fraser (1997), The effect of smoke particles onclouds and climate forcing, Science, 277, 1636–1639.
Kaufman, Y. J., and T. Nakajima (1993), Effect of Amazon smoke on cloudmicrophysics and albedo—Analysis from satellite imagery, J. Appl. Me-teorol., 32, 729–744.
Kidwell, K. B. (1995), NOAA Polar Orbiter Data User’s Guide, NOAANatl. Environ. Satell., Data, and Inf. Serv., Washington, D. C.
King, M. D., W. P. Menzel, Y. J. Kaufman, D. Tanre, B.-C. Gao, S. Platnick,S. A. Ackerman, L. A. Remer, R. Pincus, and P. A. Hubanks (2003),Cloud and aerosol properties, precipitable water, and profiles of tempera-ture and water vapor fromMODIS, IEEE Trans. Geosci. Remote Sens., 41,442–458.
Kutz, S., and R. Dubois (1997), Balloon-borne aerosol measurements in theplanetary boundary layer: Particle production associated with a continen-tal stratiform cloud, Contrib. Atmos. Phys., 70, 109–116.
Lelieveld, J., and J. Heintzenberg (1992), Sulfate cooling effect on climatethrough in-cloud oxidation of anthropogenic SO2, Science, 258, 117–120.
Loeb, N. G., and N. Manalo-Smith (2005), Top-of-atmosphere direct radia-tive effect of aerosols over global oceans from merged CERES andMODIS observations, J. Clim., 18, 3506–3526.
Lohmann, U., and J. Feichter (1997), Impact of sulfate aerosols on albedoand lifetime of clouds: A sensitivity study with the ECHAM4 GCM,J. Geophys. Res., 102(D12), 13,685–13,700.
Lohmann, U., and G. Lesins (2002), Stronger constraints on the anthropo-genic indirect aerosol effect, Science, 298, 1012–1015.
Lohmann, U., J. Feichter, J. Penner, and R. Leaitch (2000), Indirect effectof sulfate and carbonaceous aerosols: A mechanistic treatment, J. Geo-phys. Res., 105(D10), 12,193–12,206.
Nakajima, T., A. Higurashi, K. Kawamoto, and J. E. Penner (2001), Apossible correlation between satellite-derived cloud and aerosol micro-physical parameters, Geophys. Res. Lett., 28, 1171–1174.
Platnick, S., P. A. Durkee, K. Nielson, J. P. Taylor, S.-C. Tsay, M. D. King,R. J. Ferek, P. V. Hobbs, and J. W. Rottman (2000), The role of back-ground cloud microphysics in the radiative formation of ship tracks,J. Atmos. Sci., 57, 2607–2624.
Platnick, S., M. D. King, S. A. Ackerman, W. P. Menzel, B. A. Baum, J. C.Riedi, and R. A. Frey (2003), The MODIS cloud products: Algorithmsand examples from Terra, IEEE Trans. Geosci. Remote Sens., 41, 459–473.
Podgorny, I. A. (2003), Three-dimensional radiative interactions in a pol-luted broken cloud system, Geophys. Res. Lett., 30(14), 1771,doi:10.1029/2003GL017287.
Potter, G. L., and R. D. Cess (2004), Testing the impact of clouds on theradiation budgets of 19 atmospheric general circulation models, J. Geo-phys. Res., 109, D02106, doi:10.1029/2003JD004018.
Press, W. H., S. A. Teukolsky, W. T. Vetterling, and B. P. Flannery (1994),Numerical Recipes in FORTRAN: The Art of Scientific Computing, 2nded., Cambridge Univ. Press, New York.
Quaas, J., O. Boucher, and F.-M. Breon (2004), Aerosol indirect effects inPOLDER satellite data and the Meteorologie Dynamique—Zoom(LMDZ) general circulation model, J. Geophys. Res., 109, D08205,doi:10.1029/2003JD004317.
Raes, F., T. Bates, F. McGovern, and M. Van Liedekerke (2000), The 2ndaerosol characterization experiment (ACE-2): General overview and mainresults, Tellus, Ser. B, 52, 111–125.
Randall, D., M. Khairoutdinov, A. Arakawa, and W. Grabowski (2003),Breaking the cloud parameterization deadlock, Bull. Am. Meteorol. Soc.,84, 1547–1564.
Rotstayn, L. D. (1999), Indirect forcing by anthropogenic aerosols: A glo-bal climate model calculation of the effective-radius and cloud-lifetimeeffects, J. Geophys. Res., 104(D8), 9369–9380.
Rotstayn, L. D., and J. E. Penner (2001), Indirect aerosol forcing, quasiforcing, and climate response, J. Clim., 14, 2960–2975.
Seinfeld, J. H., and S. N. Pandis (1998), Atmospheric Chemistry and Phy-sics: From Air Pollution to Climate Change, John Wiley, Hoboken, N. J.
Sekiguchi, M., T. Nakajima, K. Suzuki, K. Kawamoto, A. Higurashi,D. Rosenfeld, I. Sano, and S. Mukai (2003), A study of the direct andindirect effects of aerosols using global satellite data sets of aerosol andcloud parameters, J. Geophys. Res., 108(D22), 4699, doi:10.1029/2002JD003359.
Szczodrak, M., P. H. Austin, and P. B. Krummel (2001), Variability ofoptical depth and effective radius in marine stratocumulus clouds,J. Atmos. Sci., 58, 2912–2926.
Tahnk, W. R., and J. A. Coakley Jr. (2001a), Improved calibration coeffi-cients for NOAA-14 AVHRR visible and near-infrared channels, Int.J. Remote Sens., 22, 1269–1283.
Tahnk, W. R., and J. A. Coakley Jr. (2001b), Updated calibration coeffi-cients for NOAA-14 AVHRR channels 1 and 2, Int. J. Remote Sens., 22,3053–3057.
Twomey, S. (1974), Pollution and the planetary albedo, Atmos. Environ., 8,1251–1256.
Wetzel, M. A., and L. L. Stowe (1999), Satellite-observed patterns in stratusmicrophysics, aerosol optical thickness, and shortwave radiative forcing,J. Geophys. Res., 104(D24), 31,287–31,299.
Winker, D. M., J. R. Pelon, and M. P. McCormick (2003), The CALIPSOmission: Spaceborne lidar for observation of aerosols and clouds, Proc.SPIE Int. Soc. Opt. Eng., 4839, 1–11.
�����������������������J. A. Coakley Jr., M. A. Matheson, and W. R. Tahnk, College of Oceanic
and Atmospheric Sciences, 104 COAS Admin Building, Oregon StateUniversity, Corvallis, OR 97331-5503, USA. ([email protected])
D24204 MATHESON ET AL.: INFERENCES OF AEROSOL-CLOUD INTERACTIONS
16 of 16
D24204