Embed Size (px)
Citation preview

AeroSafetyW O R L D
VULNERABILITIES OF AUTOMATIONNEW REPORT POINTS TO SOLUTIONS
THE JOURNAL OF FLIGHT SAFETY FOUNDATION
Unmarked low-altitude towersRISKY BUSINESS
Getting in on the ground levelSMS FOR UAS
Jet crash rate near all-time low2013 IN REVIEW
FEBRUARY 2014
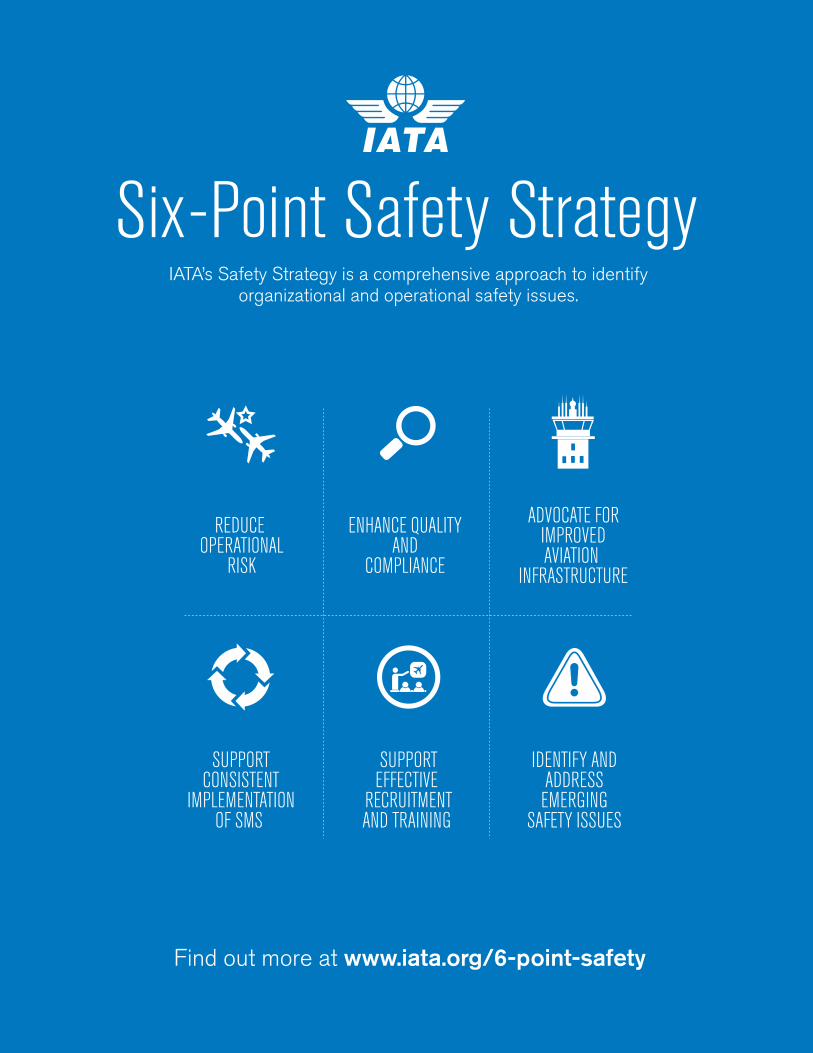
IATA’s Safety Strategy is a comprehensive approach to identify organizational and operational safety issues.

| 1FLIGHTSAFETY.ORG | AEROSAFETYWORLD | FEBRUARY 2014
PRESIDENT’SMESSAGE
Capt. Kevin L. Hiatt President and CEO
Flight Safety Foundation
You may have heard by now that I will be leaving Flight Safety Foundation in mid-February to become the senior vice presi-dent of safety and flight operations at the
International Air Transport Association (IATA). This seat change comes with bittersweet emotions.
For the past three and a half years it has been my privilege to further the mission of the Foun-dation while working with an excellent staff and a highly professional Board of Governors. As president and CEO, I have worked to ensure that the Foundation remains a prominent organization today, as well as in the future.
While in the left seat at the Foundation, I have learned so much from our members and support-ers from all walks of aviation and aviation safety. It always amazes me how much passion people have for safety and how we all work together for the com-mon goal of keeping the aviation industry as safe as it can be. It has been an honor to help promote that goal, and, hopefully, to contribute to the continued advancement of aviation safety around the world.
Safety has obviously come a long way since the 1940s, when commercial aviation really began to take off. Many of you have heard me say that com-placency is one of our biggest concerns as we move into the next generation of aviation operations. In order to overcome that tendency to be complacent, we must be not only proactive, but also predictive.
Being predictive means using the mountains of data we are all collecting to really analyze what is happening in flight, air traffic and ground opera-tions. That is the key to the future. The Foundation is poised to play a large part in that data collection and analysis effort in many parts of the world, work-ing in collaboration with partners such as IATA, the
International Civil Aviation Organization, MITRE and the National Business Aviation Association.
So, speaking of IATA, this seat change will allow me to continue to help drive the data initiatives from a different constituency within the worldwide air-line industry, and potentially blend those initiatives with the initiatives coming from the Foundation. So much of what we have been doing at the Foun-dation for the past 10 years has been leading up to this point, and I am very excited to see it progress.
While the Foundation has provided me a fan-tastic perspective on a broad range of aviation safety entities and issues, I am excited to return to my wheelhouse of airline operations and safety. Plus, I will still be able to associate with all of you, but in a different capacity. I want to thank all of you for supporting me and the Foundation. Your expertise, dedication, hospitality and kindness have been over-whelming. I look forward to seeing the Foundation continue to gain altitude and to help where I can!
As I move over to my new seat at IATA, the Foundation’s board has launched a search for a new president and CEO. In the interim, board members Ken Hylander and Bill Bozin will serve as acting president and CEO, and acting chief operating officer, respectively. I thank them both for their continued dedication to the Foundation and its missions.
SEAT Change
FLIGHT SAFETY FOUNDATION | AEROSAFETYWORLD | FEBRUARY 20142 |
19
AeroSafetyWORLD
12
features12 Cover Story | Addressing Automation’s Vulnerabilities
19 2013Review | Jet Crash Rate Nears All-Time Low
23 HelicopterSafety | Disorientation Probably Figured in Crash
30 ThreatAnalysis | Unmarked Towers Pose Unexpected Risks
34 AviationMedicine | FAA Mulls Sleep Apnea Crackdown
39 InSight | SMS for UAS
departments1 President’s Message | Seat Change
5 EditorialPage | Safety First
7 FoundationFocus | Purdue University Student Chapter
8 Safety Calendar | Industry Events
contents February 2014 Vol 9 Issue 1

AeroSafetyWORLDtelephone: +1 703.739.6700
Frank Jackman, editor-in-chief, FSF director of publications [email protected], ext. 116
Wayne Rosenkrans, senior editor [email protected], ext. 115
Linda Werfelman, senior editor [email protected], ext. 122
Rick Darby, contributing editor [email protected]
Mark Lacagnina, contributing editor [email protected]
Jennifer Moore, art director [email protected]
Susan D. Reed, production specialist [email protected], ext. 123
| 3FLIGHTSAFETY.ORG | AEROSAFETYWORLD | FEBRUARY 2014
9 In Brief | Safety News
43 DataLink | Wildlife Strikes
47 InfoScan | James Reason’s Error Messages
51 On Record | 757’s Fuel Leak
We Encourage Reprints (For permissions, go to <flightsafety.org/aerosafety-world-magazine>)
Share Your KnowledgeIf you have an article proposal, manuscript or technical paper that you believe would make a useful contribution to the ongoing dialogue about aviation safety, we will be glad to consider it. Send it to Director of Publications Frank Jackman, 801 N. Fairfax St., Suite 400, Alexandria, VA 22314-1774 USA or [email protected].
The publications staff reserves the right to edit all submissions for publication. Copyright must be transferred to the Foundation for a contribution to be published, and payment is made to the author upon publication.
Sales ContactEmerald MediaCheryl Goldsby, [email protected] +1 703.737.6753 Kelly Murphy, [email protected] +1 703.716.0503
Subscriptions: All members of Flight Safety Foundation automatically get a subscription to AeroSafety World magazine. For more information, please contact the membership department, Flight Safety Foundation, 801 N. Fairfax St., Suite 400, Alexandria, VA 22314-1774 USA, +1 703.739.6700 or [email protected].
AeroSafety World © Copyright 2014 by Flight Safety Foundation Inc. All rights reserved. ISSN 1934-4015 (print)/ ISSN 1937-0830 (digital). Published 11 times a year. Suggestions and opinions expressed in AeroSafety World are not necessarily endorsed by Flight Safety Foundation. Nothing in these pages is intended to supersede operators’ or manufacturers’ policies, practices or requirements, or to supersede government regulations.
About the CoverEven in highly automated cockpits, the most demanding situations increase the crew’s task complexity and workload, a new study says.
© Darren Howie/AirTeamImages.com
23 3430
39

April 16–17, 2014Sheraton San Diego Hotel and Marina
San Diego, California
For details, visit our Web site at flightsafety.org/BASS2014
To register or exhibit at the summit, contact Namratha Apparao,tel: +1.703.739.6700, ext. 101, [email protected]
To sponsor an event, contact Kelcey Mitchell, ext. 105, [email protected]
To receive membership information, contact Susan Lausch, ext. 112, [email protected]
To advertise in AeroSafety World magazine, contact Emerald MediaCheryl Goldsby, [email protected], tel: +1 703.737.6753Kelly Murphy, [email protected], tel: +1 703.716.0503
SAVE THE DATE

| 5FLIGHTSAFETY.ORG | AEROSAFETYWORLD | FEBRUARY 2014
EDITORIALPAGE
In the lull between the Christmas and New Year’s holidays, the U.S. Federal Aviation Administra-tion (FAA) announced the six locations it has cho-sen as unmanned aircraft systems (UAS) test sites
as part of the research and certification effort that eventually will see UAS integrated into the National Airspace System [NAS] (“Safety Briefs,” p. 9). The establishment of a test site program was mandated by the U.S. Congress in the FAA Modernization and Reform Act of 2012, and represents a significant milestone in the UAS integration process.
The research and testing will not be accom-plished overnight. According to the FAA, test site operations will continue until at least mid-February 2017. There are a myriad of problems to be solved and issues to be worked out, not the least of which are widely held privacy concerns. But one day, in the not too distant future, manned and remotely piloted aircraft will ply the same airways over the United States.
In its document “Integration of Civil Un-manned Aircraft Systems in the National Airspace System Roadmap,” the FAA says, “Ultimately, UAS must be integrated into the NAS without reduc-ing existing capacity, decreasing safety, negatively impacting current operators, or increasing the risk to airspace users or persons and property on the ground any more than the integration of compa-rable new and novel technologies.”
It is imperative that safety be baked into civil/commercial UAS operations from the outset, and that means during the testing phase. I’m not
talking about just operating the UAS safely at the test sites, but about learning from the test site operations as we do in commercial and business operations.
Tom Anthony, director of the Aviation Safety and Security Program at the University of South-ern California, and colleague Harrison Wolf contend in the InSight article (“Right From the Start,” p. 39), “The United States has an historic opportunity to influence the safe integration of civil unmanned aircraft systems in its National Airspace System by implementing a safety man-agement system (SMS) for UAS operators now
— before the full UAS integration into the NAS.” Anthony and Wolf go on to propose that UAS operators using any of the six test sites be required to report operational data to the FAA to identify hazards and develop mitigations.
InSight articles, by their nature, are opinion pieces, and this one is no different. The opinions expressed in the article are the authors’ and not necessarily those of Flight Safety Foundation. Still, Anthony and Wolf make a good argument, and, if I were in a decision-making role at FAA, I would seriously consider it.
Frank Jackman Editor-in-Chief
AeroSafety World
SAFETY
First

OFFICERS AND STAFF
Chairman Board of Governors David McMillan
President and CEO (Acting) Kenneth J. Hylander
Chief Operating Officer (Acting) William G. Bozin
General Counsel and Secretary Kenneth P. Quinn, Esq.
Treasurer David J. Barger
ADMINISTRATIVE
Manager of Support Services and Executive Assistant Stephanie Mack
FINANCIAL
Financial Operations Manager Jaime Northington
MEMBERSHIP AND BUSINESS DEVELOPMENT
Senior Director of Membership and Business Development Susan M. Lausch
Director of Events and Seminars Kelcey Mitchell
Seminar and Exhibit Coordinator Namratha Apparao
Membership Services Coordinator Ahlam Wahdan
Consultant, Student Chapters and Projects Caren Waddell
COMMUNICATIONS
Director of Communications Emily McGee
GLOBAL PROGRAMS
Director of Global Programs Rudy Quevedo
Foundation Fellow James M. Burin
BASIC AVIATION RISK STANDARD
BARS Managing Director Greg Marshall
Past President Capt. Kevin L. Hiatt
Founder Jerome Lederer 1902–2004
MemberGuideFlight Safety Foundation 801 N. Fairfax St., Suite 400, Alexandria VA 22314-1774 USA tel +1 703.739.6700 fax +1 703.739.6708 flightsafety.org
Member enrollment ext. 102 Ahlam Wahdan, membership services coordinator [email protected]
Seminar registration ext. 101 Namratha Apparao, seminar and exhibit coordinator [email protected]
Seminar sponsorships/Exhibitor opportunities ext. 105 Kelcey Mitchell, director of events and seminars [email protected]
Donations/Endowments ext. 112 Susan M. Lausch, senior director of membership and development [email protected]
FSF awards programs ext. 105 Kelcey Mitchell, director of events and seminars [email protected]
Technical product orders ext. 101 Namratha Apparao, seminar and exhibit coordinator [email protected]
Seminar proceedings ext. 101 Namratha Apparao, seminar and exhibit coordinator [email protected]
Website ext. 126 Emily McGee, director of communications [email protected]
Basic Aviation Risk Standard Greg Marshall, BARS managing director [email protected]
BARS Program Office: Level 6, 278 Collins Street, Melbourne, Victoria 3000 Australia tel +61 1300.557.162 fax +61 1300.557.182 [email protected]
facebook.com/flightsafetyfoundation
@flightsafety
www.linkedin.com/groups?gid=1804478
Since 1947, Flight Safety Foundation has helped save lives around the world. The Foundation is an international non-profit organization whose sole purpose is to provide impartial, independent, expert safety guidance and resources for the
aviation and aerospace industry. The Foundation is in a unique position to identify global safety issues, set priorities and serve as a catalyst to address the issues through data collection and information sharing, education, advocacy and communications. The Foundation’s effectiveness in bridging cultural and political differences in the common cause of safety has earned worldwide respect. Today, membership includes more than 1,000 organizations and individuals in 150 countries.
FLIGHT SAFETY FOUNDATION | AEROSAFETYWORLD | FEBRUARY 2014
Serving Aviation Safety Interests for More Than 65 Years
Way
ne R
osen
kran
s
Rudari and Winter
| 7FLIGHTSAFETY.ORG | AEROSAFETYWORLD | FEBRUARY 2014
FOUNDATIONFOCUS
+Research-based teamwork yielded
positive results for the seven inaugural members of the Flight Safety Foundation Student Chapter
at the Purdue University Department of Aviation Technology, says Scott Winter, the chapter’s first president and now assistant professor of aviation science at Florida Institute of Technology. Among findings of the chapter’s Foundation-assigned research project during the 2012–2013 academic year were risk fac-tors that might help explain how runway excursions occur even when professional pilots meet the industry-accepted crite-ria for a stabilized approach.
In October, Winter presented the main findings of this descriptive study during the FSF International Air Safety Summit (IASS), and he was interviewed by ASW with Lukas Rudari, the current chapter secretary, a Purdue graduate student and a summer 2013 intern at the International Civil Aviation Organization.
“The student chapter is still going strong … entering its second full year,” Winter said, citing the 11 currently ac-tive students’ work in progress on crew resource management problems as a causal factor in accidents worldwide. Rudari said, “It’s an enormous privilege
to have access to all the resources of Flight Safety Foundation for, actually, a very affordable price. For students, money matters, so it’s a great opportunity for us to have access to [ASW], to the da-tabases and do research with that data.”
The project Winter presented at IASS began as a comparison of runway excursion analyses covering 2008–2010 events from an FSF dataset that matched those in a study by The Boeing Co. of 2003–2010 events involv-ing only Boeing-related aircraft.
Students first focused on the degree of similarity or difference in the com-parison. As a follow-up effort, they suc-cessfully proposed to explore derivative questions with a different subset of FSF data comprising 520 runway-excursion acci-dents from 1995–2010.
“Essentially, we found out [from the comparison] that while the rank order may vary slightly, the top three risk factors tended to remain the same …. contaminated runway, landing long or with excessive speed and … unstabilized
approaches,” Winter said. The team’s follow-up analysis included runway excursions in industry sectors other than major airlines. Business jets and commercial jets and turboprops had a similar pattern of variables and interac-tions of multiple variables, he said, adding, “At what point does something go wrong [and] cause the aircraft to have an excursion? … We identified that there were 183 out of the 520 land-ing accidents — in the [FSF] database stretching from 1995 to 2010 — that resulted from excursions after stabilized approaches. … About 50 accidents were ‘unknown’ in terms of the type of ap-proach [stabilized/unstabilized].”
— Wayne Rosenkrans
Stabilized Approach Runway ExcursionFSF Student Chapter at Purdue University
reexamines 2003–2010 data.

8 | FLIGHT SAFETY FOUNDATION | AEROSAFETYWORLD | FEBRUARY 2014
➤ SAFETYCALENDAR
Aviation safety event coming up? Tell industry leaders about it.
If you have a safety-related conference, seminar or meeting, we’ll list it. Get the information to us early. Send listings to Frank Jackman at Flight Safety Foundation, 801 N. Fairfax St., Suite 400, Alexandria, VA 22314-1774 USA, or <[email protected]>.
Be sure to include a phone number, website, and/or an email address for readers to contact you about the event.
FEB. 4–6 ➤ MRO Middle East. Aviation Week. Dubai, United Arab Emirates. Helen Kang, <[email protected]>, <www.aviationweek.com>, +1 212.904.6305.
FEB. 11–16 ➤ Singapore Airshow 2014. Experia Events. Singapore. <[email protected]>, <www.singaporeairshow.com>, +65 6542 8660.
FEB. 17–18 ➤ Safety Management Systems Short Course. Aerosafe Risk Management. Irving, Texas, U.S. Julie Rompel, <[email protected]>, +1 202.449.7693. (Also March 17–18, May 19–20, and June 16–17, 2014.)
FEB. 19–20 ➤ Risk Management Short Course. Aerosafe Risk Management. Irving, Texas, U.S. Julie Rompel, <[email protected]>, +1 202.449.7693. (Also March 19–20, May 21–22, and June 18–19, 2014.)
FEB. 19–20 ➤ European Business Aviation Safety Conference. Aviation Screening. Munich, Germany. Christian Beckert, <[email protected]>, <www.ebascon.eu>, +49 7158 913 44 20.
FEB. 24–27 ➤ Heli-Expo 2014. Helicopter Association International. Anaheim, California, U.S. <[email protected]>, <rotor.org>, +1 703.683.4646.
MARCH 4–5 ➤ Air Charter Safety Symposium. Air Charter Safety Foundation. Ashburn, Virginia, U.S. Bryan Burns, <[email protected]>, <acsf.aero>, +1 703.647.6401.
MARCH 4–6 ➤ World ATM Congress 2014. Civil Air Navigation Services Organisation. Madrid, Spain. Rugger Smith, <[email protected]>, <worldatmcongress.org>, +1 703.299.2430.
MARCH 13–14 ➤ 2Gether 4Safety Seminar & Expo. AviAssist Foundation. Entebbe, Uganda. <[email protected]>, <2gether4safety.org>.
MARCH 18–19 ➤ Approach and Go-Around Safety. Regional Airline Association. Orlando. Stacey Bechdolt, <[email protected]>, <raa.org>.
MARCH 18–20 ➤ African Aviation MRO Africa Conference & Exhibition. African Aviation. Johannesburg, South Africa. <www.africanaviation.com>.
MARCH 19–21 ➤ ARSA Annual Repair Symposium and Legislative Fly-In. Aeronautical Repair Station Association. Arlington, Virginia, U.S. <www.arsa.org>.
MARCH 26–27 ➤ Safety in Aviation Asia. Flightglobal. Singapore. Alex Aubrey, <[email protected]>, <flightglobalevents.com/safetyasia14>, +44 (0)20 8652 4724.
MARCH 31–APRIL 2 ➤ 10th Annual CHC Safety & Quality Summit. CHC Helicopter. Vancouver, British Columbia, Canada. <www.chcsafetyqualitysummit.com>.
MARCH 31–APRIL 2 ➤ IATA Ops Conference 2014. International Air Transport Association. Bangkok, Thailand. <www.iata.org>.
APRIL 1–3 ➤ World Aviation Training Conference and Tradeshow (WATS 2014). Halldale Group. Orlando, Florida, U.S. Zenia Bharucha, <[email protected]>, <halldale.com/wats#.Ub4RyhYTZCY>, +1 407.322.5605.
APRIL 1–3 ➤ ERAU Unmanned Aircraft Systems Workshop. Embry-Riddle Aeronautical University. Daytona Beach, Florida, U.S. Sara Ochs, <[email protected]>, <daytonabeach.erau.edu/usa>, +1 386.226.6928.
APRIL 8–10 ➤ MRO Americas. Aviation Week. Phoenix. Helen Kang, <[email protected]>, <www.aviationweek.com>, +1 212.904.6305.
APRIL 16–17 ➤ 59th annual Business Aviation Safety Summit (BASS 2014). Flight Safety Foundation and National Business Aviation Association. San Diego. Namratha Apparao, <[email protected]>, <flightsafety.org/bass>, +1 703.739.6700, ext. 101.
MAY 8–9 ➤ 3rd Air Medical & Rescue Congress China 2014. China Decision Makers Consultancy. Shanghai. <cdmc.org.cn/2014/amrcc/>.
MAY 9 ➤ Search & Rescue Forum China 2014. China Decision Makers Consultancy. Shanghai. Patrick Cool, <[email protected]>, <cdmc.org.cn/2014/isrfc/>.
MAY 12–16 ➤ SMS Expanded Implementation Course. The Aviation Consulting Group. Honolulu, Hawaii, U.S. Bob Baron, <[email protected]>.
MAY 13–15 ➤ RAA 39th Annual Convention. Regional Airline Association. St. Louis, Missouri, U.S. David Perez-Hernandez, <www.raa.org>, +1 312.673.4838.
MAY 20–22 ➤ IATA Cabin Safety Conference. International Air Transport Association. Madrid, Spain. <www.iata.org>.
MAY 21–22 ➤ Asia Pacific Aviation Safety Seminar (APASS 2014). Association of Asia Pacific Airlines. Bangkok, Thailand. C.V. Thian, <[email protected]>, +603 2162 1888.
MAY 24–25 ➤ Rotortech 2014. Australian Helicopter Industry Association. Sunshine Coast, Queensland, Australia. <[email protected]>.
JUNE 10–11 ➤ 2014 Safety Forum: Airborne Conflict. Flight Safety Foundation, Eurocontrol, European Regions Airline Association. Brussels, Belgium. <[email protected]>, <skybrary.aero>.
JUNE 30–JULY 2 ➤ Safe-Runway Operations Training Course. JAA Training Organisation. Abu Dhabi, United Arab Emirates. <jaato.com>, +31 (0)23 56 797 90.
JULY 14–20 ➤ 49th Farnborough International Airshow. Farnborough International. Farnborough, Hampshire, England. <[email protected]>, <farnborough.com>, +44 (0)1252 532 800.
OCT. 13–17 ➤ ISASI 2014 Seminar. International Society of Air Safety Investigators. Adelaide, Australia. <www.isasi.org>.
NOV. 11–13 ➤ 67th annual International Air Safety Summit. Flight Safety Foundation. Abu Dhabi, United Arab Emirates. Namratha Apparao, <[email protected]>, +1 703.739.6700, ext. 101.

| 9FLIGHTSAFETY.ORG | AEROSAFETYWORLD | FEBRUARY 2014
INBRIEF
UAS Sites
Six sites have been chosen by the U.S. Federal Aviation Administration (FAA) as unmanned aircraft systems (UAS) test sites to be used for research into the certifica-
tion and operational requirements for incorporating UAS into the National Airspace System (see “Right From the Start,” p. 39).
The six sites are in Alaska, Nevada, New York, North Dakota, Texas and Virginia.
The FAA said that factors considered in the site-selection process included geography, climate, location of ground infrastructure, research needs, airspace use, safety, aviation experience and risk. “In totality, these six test applications achieve cross-country geographic and climatic diversity and help the FAA meet its UAS research needs,” the agency said.
Transportation Secretary Anthony Foxx said that the sites would yield “valuable information about how best to ensure the safe introduction of this advanced technology into our nation’s skies.”
FAA Administrator Michael Huerta added, “We have successfully brought new technology into the nation’s avia-tion system for more than 50 years, and I have no doubt we will do the same with unmanned aircraft.”
Operators of the six sites will conduct research in several areas. For example, the University of Alaska’s research plan, which calls for test site loca-tions in Hawaii and Oregon as well as Alaska, includes the development of standards for un-manned aircraft categories, state monitoring and navigation.
The state of Nevada will examine UAS standards and op-erations, operator standards and “a concentrated look at how air traffic control procedures will evolve with the introduc-tion of UAS into the civil environment and how these aircraft will be integrated with NextGen [the FAA’s plan to overhaul the national airspace, known formally as the Next Genera-tion Air Transportation System].”
Griffiss International Airport, near Rome, New York, will work on testing and evaluations, and validation and verification processes under FAA safety oversight, as well as UAS sense-and-avoid capabilities and operations in the congested airspace of the northeastern United States.
The North Dakota Department of Commerce will conduct UAS human factors research in addition to its plan to “develop UAS airworthiness essential data and validate high reliability link technology.”
Texas A&M University – Corpus Christi plans to develop safety requirements for UAS vehicles and operations, along with airworthiness testing procedures.
Virginia Polytechnic Institute and State University (Virginia Tech) is planning UAS failure-mode testing and an evaluation of operational and technical risk areas. The Virginia Tech pro-posal includes test sites in New Jersey as well as Virginia.
The law calls for test site operations to continue at least until February 2017.
Safety Review
The Australian government has ordered an independent review of the nation’s aviation safety regulation network, including the effectiveness of agencies involved in safety regulation and their relationships and interactions with one another.Warren Truss, deputy prime minister and minister for infrastructure and regional development, said the review is intended to
“reassess how our safety regulatory system is placed in dealing with this dynamic and evolving sector.”The review, to be conducted by a panel of aviation safety experts, will “benchmark Australia’s safety regulation against other
leading countries,” the minister’s office said, noting that the panel will be headed by David Forsyth, chairman of Safeskies Australia and former chairman of Airservices Australia. Members will include Don Spruston, former director general of civil aviation for Transport Canada and former director general of the International Business Aviation Council, and Roger Whitefield, former head of safety at British Airways.
The panel is expected to submit its final report to Truss in May.
U.S. National Aeronautics and Space Administration
Safety News

10 | FLIGHT SAFETY FOUNDATION | AEROSAFETYWORLD | FEBRUARY 2014
INBRIEF
Ann Mullikin
Ann L. Mullikin, Flight Safety Foundation’s longtime art director and graphic designer, died Dec. 27, 2013, in Alexandria, Virginia, U.S., after a brief illness. She was 59.
Ann worked at the Foundation from 1997 until 2012, and was responsible for the design of AeroSafety World, introduced in 2006. J.A. Donoghue, editor-in-chief of ASW at the time, praised Ann as “an excellent artist and collaborator … who estab-lished an artistic identity for the magazine that was one of solid professionalism.”
Ann also taught graphic design for The Art League, an Alexandria organiza-tion offering courses in fine arts and crafts.
Before joining the Foundation, she was graphics department manager for a management consulting, engineering and information technology company in Arlington, Virginia. She also spent 11 years as a flight attendant and purser for Pan American World Airways.
Wider Use of PEDs
Aviation authorities in Europe and the United States have authorized the expanded use of portable electronic devices (PEDs) by passengers.
The European Aviation Safety Agency (EASA) and the U.S. Federal Aviation Administration (FAA) issued updated guidance to airlines saying that they had determined that PEDs, when used in non-transmitting “flight mode” (or “airplane mode”) present no risk to safety.
Siim Kallas, EC vice president responsible for transport, said in December that he had asked EASA to speed up its safety review of the use of PEDs in trans-mitting mode; new guidance should be published early in 2014, he said.
“We all like to stay connected while we are traveling, but safety is the key word here,” Kallas said. “I have asked for a review based on a clear principle: If it’s not safe, it should not be allowed, but if it is safe, it can be used within the rules.”
EASA’s December guidance said PEDs could be used in flight mode “in all phases of the journey, from gate to gate.”
FAA guidance also said that, after airlines could prove to the FAA that their airplanes would allow safe use of PEDs in airplane mode, the devices would be permitted during all phases of flight, although cell phones cannot be used for voice communications because of Federal Communications Commission (FCC) regulations. The FCC has said it is considering changing its regulations banning cell phone calls during flight to allow the airlines themselves to decide whether passengers should be permitted to make cell phone calls during flight and under what conditions.
The FAA said that its PED Aviation Rulemaking Committee had deter-mined that “most commercial airplanes can tolerate radio interference signals from PEDs.” The panel recommended that after individual airlines verify that the devices can be used without causing interference, their in-flight use should be permitted. On some occasions, however, passengers will be asked to turn off PEDs during landing, the FAA said.
Cell phones are treated differently than other PEDs because of their stronger signals, the FAA said.
Wayne Rosenkrans
Comparisons
The U.S. air traffic control system has more flexibility than its Euro-pean counterparts in responding to
imbalances in demand and capacity, ac-cording to a report by the Eurocontrol Performance Review Commission and the U.S. Federal Aviation Administra-tion Air Traffic Organization.
The report, published in December, compares the operational and economic performance of air traffic management (ATM) in Europe and the United States from 2008 through 2012, a period char-acterized by declining traffic.
The goal of the joint study on which the report was based was “to under-stand differences between the two ATM systems in order to further optimize ATM performance and to identify best practices for the benefit of the overall air transport system.”
The study found that variations in performance indicators were often as-sociated with differences in ATM policy or operating strategies, including “when and where air traffic flow management measures are applied; a more frag-mented structure of service provision in Europe; greater flexibility of the U.S. system in mitigating demand/capacity imbalances through the use of traffic flow initiatives that are coordinated across multiple en route centres; and airline and airport scheduling, their im-pact on airport throughput [a measure-ment of the number of aircraft handled in a specific time period] and the ability to effectively sustain airport throughput in bad weather.”
The report suggested “a more com-prehensive comparison” of the quality of ATM service, especially in regard to safety, capacity and other factors that affect performance.
“A better understanding of trade-offs, such as maximizing capacity and throughput against maximizing predictability, would be needed to identify best practices and policies,” the report said.

| 11FLIGHTSAFETY.ORG | AEROSAFETYWORLD | FEBRUARY 2014
INBRIEF
In Other News …
The Australian Civil Aviation Safety Authority administered 11,252 alcohol and drug tests in the 2012–2013 financial year, with seven people testing positive for alcohol and two testing positive for drugs, the agency says. … The International Civil Avia-tion Organization and the International Air Transport Association have established a new global training alliance, designed to “intensify and refine air transport training and learning resources” to address expected shortages of air transport personnel. The organizations cited forecasts that call for a doubling of aviation system capacity by 2030 and a need to hire thousands of new pilots, air traffic controllers and maintenance personnel.
Proposed Penalties
The U.S. Federal Aviation Administration (FAA) has proposed a $325,000 civil penalty against Southwest Airlines, alleging that the airline operated a Boeing 717 that had been improperly modified.
The modification involved the Aug. 29, 2011, installation of a switch intended to en-able flight crews to test the airplane’s windshield heating system. The 717 was operated by AirTran Airways, which is merging with Southwest. If the switch had been installed prop-erly, flight crews would have been able to “isolate the windshield anti-ice system that was causing a warning that the windshield heater was failing,” the FAA said. However, when the switch was installed, the center and left windshield warning systems were reversed, the FAA said.
The airplane was operated on 1,140 passenger flights before the problem was cor-rected, the agency added.
In an unrelated matter, the FAA proposed a $304,000 civil penalty against Great Lakes Aviation for conducting 19 flights using airplanes that were not in compliance with Federal Aviation Regulations. The airplanes — Beech 1900s — were operated in January 2011 with deicing fluid that exceeded the maximum allowable temperature; the temperature limit was intended to prevent damage to the airplane or the deicer.
Both airlines were given 30 days to respond after receiving the FAA’s civil penalty letter.
Banned Airlines
The European Commission (EC), in the most recent revision of its “air safety
list,” has added all air carriers based in Nepal to the list of those banned from operating in the European Union (EU).
Siim Kallas, EC vice presi-dent responsible for transport, said the commission hopes that the ban will result in improve-ments in aviation safety in Nepal. Kallas said he had asked the European Aviation Safety Agency to develop a Nepal-ese aviation safety assistance project.
After consultation with civil aviation authorities in Libya, the EC said that the voluntary restrictions that have kept Libyan airlines from oper-ating in the EU would continue. Those restrictions have been in place since the Libyan revolu-tion in 2011.
The revised list prohibits EU operations by all airlines certified in 21 countries — a total of 295 airlines — plus two additional airlines certified in other countries. Ten additional airlines are subject to specific operational restrictions.
Kallas said that recent efforts indicate safety progress in several countries on the list, especially the Philippines, Sudan and Zambia.
Icarus/WikiMedia Commons
Anthony92931/WikiMedia Commons
Compiled and edited by Linda Werfelman.

AutomationVulnerabilities
BY WAYNE ROSENKRANS
12 | FLIGHT SAFETY FOUNDATION | AEROSAFETYWORLD | FEBRUARY 2014
COVERSTORY

| 13
COVERSTORY
FLIGHTSAFETY.ORG | AEROSAFETYWORLD | FEBRUARY 2014
© F
elix
Got
twal
d/Ai
rTea
mIm
ages
.com
Although difficult flight path–management tasks are handled routinely by professional pilots operating highly automated jets, the most demanding situations still tend to sig-
nificantly increase the pilots’ task complexity and workload, says a U.S. working group of subject matter experts. For example, in cases in which air traffic control (ATC) suddenly issued an amended clearance/vector changing the preplanned flight path — say, for temporary deviation from a com-plex instrument flight procedure — some pilots told the working group they struggled at times to recover the optimum flight path by relying solely on modes of the automated systems. Moreover, complete or partial reversion to manual flight operations to resolve brief confusion could be problematic, the working group’s analyses showed.
Actual and potential safety consequences of this and related problems, and new recommen-dations for integrated solutions, form the core of the final report on operational use of flight path management systems, issued in late 2013 by the Flight Deck Automation Working Group.1
Kathy Abbott, chief scientific and technical adviser for flight deck human factors at the U.S. Federal Aviation Administration (FAA) and a co-chair of the 34-member working group, said in 2010 that the airline industry’s “impressive safety record” partly can be attributed to flight crews intervening as expected to mitigate flight path–related risks during flights, underscoring the reason for addressing persistent problems in flight path management. This initiative also dovetails with government-industry efforts in airplane upset prevention, recognition and recovery, the report said.
“Incident and accident reports suggest that flight crews continue to have problems interfac-ing with these systems and have difficulty using these flight path management systems,” Abbott told the 2010 Flight Safety Foundation Interna-tional Air Safety Seminar in Milan, Italy. “We found vulnerabilities2 in [automation] mode and energy-state awareness, manual handling, and managing system malfunctions or failures. These included failures anticipated by designers, [failures] for which there were no flight crew
procedures, and [failures] in flight management system (FMS) programming.”
At a December 2013 investigative hearing of the U.S. National Transportation Safety Board (NTSB), Abbott and another working group co-chair — David McKenney, a United Airlines captain representing the International Federation of Air Line Pilots’ Associations — fielded ques-tions about the relevance of the new report to an accident five months earlier (see “NTSB Hearing on Crash of Asiana Airlines Flight 214,” p. 16).
Asked about the integration of philosophies and policies of human-centered design into flight deck automation during the last 15 years, Abbott told the hearing that “one of the important gaps that … sometimes does happen is a difference between the philosophy and the design, and the way that the systems are actually operated.”
McKenney testified, “Manual flight opera-tions is not just the stick-and-rudder skills that everybody thinks it is. The term means [the psychomotor skills,] the cognitive skills, the airmanship, how we fly the aircraft [and] how we use these automated systems to actually maintain the flight path. … What we are recom-mending is that we create an operational policy for flight path management which highlights … that the responsibility of flight path man-agement rests with the pilot — and that the automated systems are only one of the tools. … Pilots [are trained] to rely on the systems all the time, but they are not taught to question the systems. They expect the system to work when they use it and when it doesn’t, then they get caught short.”
In addition to presenting and cross-referencing exhaustive analyses of accident/incident data, line operations safety audit (LOSA) data, deidentified voluntary reports from front-line personnel and structured interviews with industry specialists, the report integrates some exclusively obtained, confidential material from individuals and organizations.
For each of the findings, the report links and summarizes the contribution from each respective source. A table compares the new recommendations with those in the related 1996
U.S. study
of flight path
management
anomalies
updates
recommended
solutions.
14 | FLIGHT SAFETY FOUNDATION | AEROSAFETYWORLD | FEBRUARY 2014
COVERSTORY
FAA report on flight deck automation interfaces,3 adding today’s status of relevant FAA and industry mitigation efforts — including whether the later working group reiterated, updated or dropped each older recommendation.
RecommendationsThe following excerpts selected by ASW from 14 of 18 recommendations also reflect the scope of inquiry; the four that were omitted concern ways to improve the regulatory process to expedite aircraft/equipment certification, encour-age consistency in new pilot-automation interfaces, improve data collection/analysis to advance knowledge of human factors in flight path management, and improve accident investigation practices in these contexts. The excerpts also omit
most explanatory text (capitalization and punctuation have been edited, and num-bers have been added, for ASW editorial style or clarity).
1. “Develop and implement standards and guidance for maintaining and improving knowledge and skills for manual flight operations that include the following: Pilots must be provided with opportunities to refine this knowledge and practice the skills; training and checking should directly address this topic; and operators’ policies for flight path management must support and be consistent with the training and practice in the aircraft type.
2. “For the near term, emphasize and encourage improved training and
flight crew procedures to improve autoflight mode awareness as part of an emphasis on flight path manage-ment. For the longer term, equip-ment design should emphasize reducing the number and complex-ity of autoflight modes from the pilot’s perspective and improve the feedback to pilots (e.g., on mode transitions) while ensuring that the design of the mode logic assists with pilots’ intuitive interpretation of failures and reversions.
3. “Develop or enhance guidance for documentation, training and pro-cedures for information automation systems [including communications automation] (e.g., EFBs [electronic flight bags], moving map displays, performance management calcula-tions, multi-function displays) or functions. Describe what is meant by information automation and what systems [or] equipment are included; define terms associated with informa-tion automation; develop guidelines concerning the content and structure of policy statements in flight opera-tions policy manuals for information automation; and develop operational procedures to avoid information automation–related errors.
4. “In the near term, develop or enhance guidance for flight crew documen-tation, training and procedures for FMS use. For the longer term, re-search should be conducted on new interface designs and technologies that support pilot tasks, strategies and processes, as opposed to ma-chine or technology-driven strategies.” Among contextual notes, the report says, “Consideration should be given to a new, much simpler flight path management system design from the pilot’s perspective [closely integrat-
Crew Coordination, Problem Solving and Manual Handling Skills
Normal/Typical Normal/Typical Basic/Reversionary
Evolving Normal/Typical
Evolving
1960s
Scop
e of O
pera
tion/
Inte
rrela
tions
hips
— Pi
lot K
nowl
edge
and S
kills
Need
ed
2000sTime Frame
Notes:
Parallel evolutions of flight deck technology, airspace/operations and demands that professional pilots continually increase their knowledge and skills have been a driver/factor in persistent flight path and energy management problems. Levels of pilot skill once considered normal/typical in the 1960s now have become basic/reversionary. The new normal/typical level (2000s) requires pilots to be system-of-systems managers who can adapt to their evolving operations yet retain their basic/reversionary level of cognitive and manual handling skills to handle non-normal situations.
Source: Flight Deck Automation Working Group
Figure 1

| 15FLIGHTSAFETY.ORG | AEROSAFETYWORLD | FEBRUARY 2014
COVERSTORY
ing new FMS designs with evolving airspace requirements].
5. “Research should be conducted and implemented on processes and methods of verification and vali-dation ([including] validation of requirements) during the design of highly integrated systems that spe-cifically address failures and failure effects resulting from the integration.
6. “Flight crew training should be en-hanced to include characteristics of the flight deck system design that are needed for operation of the aircraft (such as system relationships and interdependencies during normal and non-normal modes of operation for flight path management for exist-ing aircraft fleets). For new systems, manufacturers should design flight deck systems such that the under-lying system should be more un-derstandable from the flight crew’s perspective by including human-centered design processes.” Among contextual notes, the report says,
“Newer designs should focus on the flight crew’s ability to understand normal system operations and their ability to function effectively with-out error, especially when failures occur. … The integration of multiple systems should be designed such that the flight crew has clear, defini-tive and well understood actions in the event of failures or degraded modes.”
7. “Develop guidance for flight crew strategies and procedures to address malfunctions for which there is no specific procedure.
8. “For the near term, update guid-ance … and develop recommended practices for design of standard operating procedures (SOPs) [for
flight crews] based on manufacturer procedures, continuous feedback from operational experience and les-sons learned. This guidance should be updated to reflect operational ex-perience and research findings on a recurring basis. For the longer term, conduct research to understand and address when and why SOPs are not followed. The activities should place particular emphasis on monitoring, cross-verification and appropriate allocation of tasks between pilot flying and pilot monitoring.
9. “Operators should have a clearly stated flight path management policy as follows: The policy should high-light and stress that the responsibility for flight path management remains with the pilots at all times. Focus the policy on flight path manage-ment, rather than automated systems. Identify appropriate opportunities for manual flight operations. Recognize the importance of automated sys-tems as a tool (among other tools)
to support the flight path manage-ment task, and provide operational policy for the use of automated sys-tems. Distinguish between guidance and control. Encourage flight crews to tell [ATC] ‘unable’ [to comply with instruction/clearance] when appropriate. Adapt to the opera-tor’s needs and operations. Develop consistent terminology for automat-ed systems, guidance, control and other terms that form the founda-tion of the policy. Develop guid-ance for development of policies for managing information automation.” Among contextual notes, the report says, “The operator’s policy should provide guidance on the op-erational use of automated systems [including] examples of circumstanc-es in which the autopilot should be engaged, disengaged, or used in a higher or lower authority mode; the conditions under which the autopilot or autothrottle will or will not en-gage, will disengage, or will revert to
Examples of Pilot-Related Insights From Automation Data
0% 20% 60%50%40%30%10%
Pilots are out ofthe control loop
FMS programming
errors
Threats resulting from insu�cient pilot knowledge LOSA
AccidentsMajor incidentsASRS reports
Proportion of Source Data Citing Issue
LOSA = line operations safety audit; FMS = flight management system; ASRS = Aviation Safety Reporting System
Notes:
The working group’s analyses of events used database subsets that fell within the scope and time frames specified in its final report. The data shown do not represent the frequency of occurrence for all accidents, major incidents, ASRS reports or LOSA reports from these time frames.
Source: Flight Deck Automation Working Group
Figure 2

16 | FLIGHT SAFETY FOUNDATION | AEROSAFETYWORLD | FEBRUARY 2014
COVERSTORY
NTSB Hearing on Crash of Asiana Airlines Flight 214
The release in late 2013 of a U.S. government-industry report titled Operational Use of Flight Path Management Systems roughly coincided with a public investigative hearing on Dec. 11 by the U.S. National Transportation Safety Board (NTSB). The subject was the crash of Asiana Airlines Flight 214, a Boeing 777, at San Francisco International Airport.
Preliminary NTSB factual reports and the agency’s public statements about the event — in which the aircraft struck a seawall before reaching the landing runway threshold during a visual approach while the glide slope of the instrument landing system was out of service — say that one of the investigators’ areas of focus is the pilots’ interface with flight deck automation.
Among subject matter experts called to testify at the investigative hearing were Kathy Abbott, chief scientist and technical adviser for flight deck human factors, U.S. Federal Aviation Administration (FAA), and David McKenney, a United Airlines captain representing the International Federation of Air Line Pilots’ Associations. They spoke in their roles as co-chairs of the Flight Deck Automation Working Group, and they also provided personal opinions.
Abbott said, “We saw that autoflight mode-confusion errors continue to occur, and we saw that FMS [flight manage-ment system] programming and usage errors continue to occur, as well as others. … The data suggest that the highly integrated nature of current flight decks and additional add-on features, and retrofits in older aircraft, have increased flight crew knowledge requirements and introduced complexity that sometimes results in pilot confusion and errors in flight deck operations. … We identified vulnerabilities in that pilots sometimes rely too much on the automated systems and may be reluctant to intervene.”
Some manufacturers of aircraft and avionics can address automation concerns with current human factors knowledge, she said, noting in part that “we found that human factors expertise has been increasingly incorporated into the design pro-cess at most manufacturers but is still inconsistently applied at some manufacturers. Furthermore, human factors specialists or human factors expertise may not exist in some organizations or is called in very late in the [design/engineering] process.”
Since a 1996 FAA report on the interfaces between flight crews and modern flight deck systems, the Automation Subcommittee of the Air Transport Association of America (now Airlines for America) produced four papers on recom-mended practices for training and use of automated systems, and a U.S. Commercial Aviation Safety Team safety enhance-ment facilitated further work on mode awareness and automation policy for airlines, she said. Abbott told the hearing that among the FAA’s most relevant regulatory amendments or new regulations implemented between 1996 and 2013 is Federal Aviation Regulations Part 25.1329 on flight guidance systems, which include autopilots, autothrottle/autothrust systems and flight directors. Others are Part 25.1302, Installed Systems and Equipment for Use by the Flight Crew, covering design-related pilot error, and amendments to Part 25.1322 on flight deck alerting systems. Updated guidance based on the period’s research includes Advisory Circular 25-11 on electronic flight deck displays.
NTSB panelists asked the working group co-chairs, “Why did it take 17 years to update the 1996 report?” Abbott said that the deliberative rulemaking processes involved are inherently time consuming, and that automation-related improvements to pilot training — a number of them dating from the 1996 report — needed to be implemented gradually by the industry, given time to become effective and then assessed over a number of years for the FAA to determine the safety results.
McKenney told the hearing that a key 2013 report finding was that during an airline pilot’s career, skills evolve over time. “This increase in pilot knowledge and skills is not diminished as a result of the automated systems but is actually in-creased,” he said. “It also requires pilots to be even more of a pilot [in terms of manual flight operations] and also a systems manager, where we have to not only control the aircraft but also manage the additional systems that have been put in the flight deck.”
Another working group consensus was that overall there is “incomplete understanding of complex relationships in modes of flight director, autopilot, autothrottle and autothrust and [FMS] computers, including such things as system limi-tations, the operating procedures and the need for confirmation and cross-verification — as well as the mode transitions and behavior,” he said.
Training improvements that, for now, appear to be most relevant to the current Asiana accident investigation, he said, are knowledge of when to use various combinations of the automated systems, the situations that can lead to distractions and strategies to prevent these distractions, both on the ground and in flight. Other key areas appear to be knowledge re-lated to the mode logic and maintaining awareness of the state of the system modes, task workload management, automa-tion management, automated system mode management and decision making, McKenney said.
— WR

| 17FLIGHTSAFETY.ORG | AEROSAFETYWORLD | FEBRUARY 2014
COVERSTORY
another mode; and appropriate com-binations of automatic and manual flight path control (e.g., autothrottle engaged with the autopilot off).”
10. “Discourage the use of regional or country-specific terminology in favor of international harmonization. Implement harmonized phraseol-ogy for amendments to clearances and for reclearing onto [approach] procedures with vertical profiles and speed restrictions. Implement education and familiarization out-reach for air traffic personnel to better understand flight deck sys-tems and operational issues associ-ated with amended clearances and other air traffic communications. In operations, minimize the threats associated with runway-assignment changes through a combination of better planning and understanding of the risks involved.
11. “Continue the transition to PBN [performance-based navigation] operations and drawdown of those conventional procedures with lim-ited utility [or potentially higher risk (e.g., those procedures that lack vertical guidance)]. As part of that transition, address proce-dure design complexity (from the perspective of operational use) and mixed-equipage issues. Standardize PBN procedure design and imple-mentation processes with inclusion of recommended practices and les-sons learned. This includes arrivals, departures and approaches.
12. “Ensure that appropriate human factors expertise is integrated into the flight deck design process in partnership with other disciplines, with the goal of contributing to a human-centered design. To assist in this process, an accessible repository
of references should be developed that identifies the core documents relevant to ‘recommended prac-tices’ for human-centered flight deck and equipment design. Early in the design process, designers should document their assumptions on how the equipment should be used in operation.
13. “Revise initial and recurrent pilot train-ing, qualification requirements (as necessary), and revise guidance for the development and maintenance of improved knowledge and skills for successful flight path manage-ment. … Improve the oversight of air carriers and [U.S. Federal Aviation Regulations] Part 142 training centers.
14. “Review and revise, as necessary, guidance and oversight for initial and recurrent training and qualifi-cation for instructors/evaluators … to successfully teach and evaluate airplane flight path management, including use of automated systems.”
Accident Insights
Among the diverse insights brought to the working group, a number are now be-ing considered coincidentally by accident investigators assigned to recent accidents.
“Since the working group com-pleted its data collection and analysis, several accidents have occurred where the investigative reports identified vul-nerabilities in the events that are similar to those vulnerabilities identified in this report,” the report said. “These vulner-abilities represent systemic issues that continue to occur. … Other factors that affect the pilots’ [automation-related] decisions include the high reliability of the systems (fostering insufficient cross-verification, not recognizing autopilot or autothrottle disengage-ment, or not maintaining target speed,
heading or altitude). … This may be exacerbated in the future by some new airspace procedures that are so complex and require such precision that flying manually is impractical or not allowed, because of the likelihood of deviation. … Although there is general industry consensus that monitoring, cross-verification and error management are important, these topics are not always explicitly trained.”
To produce the report, the working group analyzed accidents, incidents and normal operations for various periods ending in July 2009 and conducted in-terviews with manufacturers, operators and training organizations. Other sourc-es were “reports from related activities,” including those confidentially submitted by individuals and organizations; vari-ous types of observations and analyses during LOSAs, from the archives of the LOSA Collaborative; and personal knowledge and experiences of working group participants, including James M. Burin, then Flight Safety Foundation’s director of technical programs. �
Notes
1. Flight Deck Automation Working Group. Operational Use of Flight Path Management Systems: Final Report of the [FAA] Performance-based Operations Aviation Rulemaking Committee/[U.S.] Commercial Aviation Safety Team Flight Deck Automation Working Group. Sept. 5, 2013. The third co-chair of the working group is Paul Railsback of Airlines for America.
2. The working group defined vulnerability, in the context of flight path management, as “a characteristic or issue that renders the system or process more likely to break down or fail when faced with a particular set of circumstances or challenges.”
3. Abbott, Kathy et al. “The Interfaces Between Flightcrews and Modern Flight Deck Systems, FAA Human Factors Team Report.” June 18, 1996. <1.usa.gov/1cZpsf3>.

D o n ’ t m i s s o u tw w w . c h c s a f e t y q u a l i t y s u m m i t . c o m
Westin Bayshore Resort & Marina, Vancouver, BC, Canada
MARCH 31ST – APRIL 2ND 2014
Come to ExploreSafety and Quality in the Real World; Turning Theory into Best Practice
40 Sessions Exceptional valueWorld-class speakersOutstanding networkingUnprecedented training opportunities
PLATINUM
BRONZE
Sponsors correct at time of publication
PARTNERS IN SAFETY
Aviall
Lenovo
AMERICAN EXPRESS
MEDIA
SILVERGOLD
This is absolutely the best conference series that I have ever attended.Bill Rankin – Technical Fellow, Boeing
A valuable event and excellent platform to improve individual knowledge and exchange ideas.Stephan Koehler, AIR-TEC“
“””

On April 13, 2013, Lion Air Flight 904, a Boeing 737-800, struck the sea
approximately 20 m (66 ft) from shore and 300 m (984 ft) southwest
of the Runway 09 threshold at Ngurah Rai International Airport, Bali,
Indonesia, during an instrument approach to the runway in rain.
| 19FLIGHTSAFETY.ORG | AEROSAFETYWORLD | FEBRUARY 2014
2013REVIEW
Unlike the previous two years, the worldwide commercial jet accident rate did not achieve a record low point in 2013, but it
was still an excellent year for aviation safety. The 2013 commercial jet major accident rate was 0.24 accidents per mil-lion departures, which is up from 2012’s record rate of 0.14, but below 2011’s then-record rate of 0.28. The 2013 rate is the second-lowest rate ever recorded.
Unfortunately, there were two commercial jet upset aircraft accidents in 2013, the first in two years, and the return of controlled flight into terrain (CFIT) accidents continued. Four of the seven commercial major jet accidents were CFIT accidents.
Commercial turboprops also regressed slightly from their 2012 record low point in terms of number of accidents for the year. CFIT accidents
again dominated the turboprop fatality numbers. Business jets had eight major accidents in 2013, an improvement from their 2012 total of 13.
There are now over 23,000 commer-cial jets in the world (Table 1, p. 20). Of these, approximately 4 percent are East-ern built, and 17 percent of the world’s commercial turboprop fleet is Eastern built. The commercial jet inventory grew about 2.5 percent from 2012, while the
© In
done
sian
Polic
e/Re
uter
s
2013Year in ReviewBY JAMES M. BURIN
Global data show another near-record-low commercial jet accident rate.

Commercial Jet Major Accidents, 2002–2013
20132002 2003 2004 2005 2006 2007 2008 2009 2010 201220110
5
10
15
20
Num
ber o
f acc
iden
ts
Year
Eastern builtWestern built
7
19 19
13 13
16
11
171719
14
7
Source: Ascend
Figure 1
Western-Built Commercial Jet Major Accident Rates, 1999–2013
1999 2000 2001 2002 2003 2004 2005 2006 2007 2008 2009 20132012201120100.0
0.2
0.4
0.6
0.8
1.0
1.2
Acc
iden
ts p
er m
illio
n de
part
ures
Year
Major accident rate5-year running average
Note: Total departure data are not available for Eastern-built aircraft.
Source: Ascend
Figure 2
Major Accidents, Worldwide Commercial Jets, 2013
Date Operator Aircraft Location Phase Fatal
Jan. 29 SCAT Air CRJ-200 Almaty, Kazakhstan Approach 21
April 13 Lion Air B-737 Bali, Indonesia Approach 0
April 29 National Airlines B-747 Bagram, Afghanistan Takeoff 7
July 6 Asiana Airlines B-777 San Francisco Landing 3
Aug. 14 UPS A300 Birmingham, Alabama, U.S. Approach 2
Nov. 17 Tatarstan Airlines B-737 Kazan, Russia Approach 50
Nov. 29 LAM EMB-190 Bwabwata Park, Namibia En route 33
Controlled flight into terrain Loss of control–in flight (upset aircraft)
Source: Ascend
Table 2
The Fleets, 2013
TypeWestern
BuiltEastern
Built Total
Turbojets 22,113 1,007 23,120
Turboprops 4,797 1,101 5,898
Business jets 18,072
Source: Ascend
Table 1
20 | FLIGHT SAFETY FOUNDATION | AEROSAFETYWORLD | FEBRUARY 2014
2013REVIEW
commercial turboprop inventory decreased about 2 percent. The business jet inventory grew 2 per-cent from the previous year. Thus, for the first time in many years, the leaders in growth were commercial jets, not business jets.
The numbers in Table 1 reflect the total fleets. The numbers of active aircraft, the aircraft actually in use, are somewhat smaller. Approximately 8 percent of the commercial jet fleet is inactive, including almost 40 percent of the Eastern-built commercial jets. Approx-imately 14 percent of the turboprop fleet is inactive. For the third year in a row, there were inactive business jets, with 3.5 percent of the inventory inactive.
Table 2 shows the major accidents that oc-curred in 2013 for all scheduled and unscheduled passenger and cargo operations for Western-built and Eastern-built commercial jet aircraft. Five of the seven accidents happened during the approach and landing phase of flight. As men-tioned, four of the seven were CFIT accidents, and there were two upset aircraft accidents.
Figure 1 shows the total number of com-mercial jet major accidents and the number of Eastern-built aircraft accidents for commercial jets since 2002. Over the last five years, an aver-age of 5 percent of the active commercial jet fleet was Eastern built, but they accounted for 30 percent of the major accidents over that same period. There were no Eastern-built commercial jet major accidents in 2013.
Figure 2 shows the commercial jet major accident rates and the five-year running aver-age. This rate is only for Western-built jets because, even though we know the number of major accidents for Eastern-built jets, we do not
Major Accidents, Worldwide Business Jets, 2013
Date Operator Aircraft Location Phase Fatal
Feb. 20 The Vein Guys Premier I Thomson, Georgia, U.S. Landing 5
March 4 Global Jet Luxembourg Premier I Annemasse, France Takeoff 2
March 17 7700 Enterprises Premier I South Bend, Indiana, U.S. Approach 2
May 5 Private Lear 60 Valencia, Venezuela Approach 2
Sept. 29 CREW MMCLLC Citation CJ2 Santa Monica, California, U.S. Landing 4
Oct. 18 Dufrense, Inc. Citation I Derby, Kansas, U.S. Climb 2
Nov. 19 AirEvac International Lear 35 Ft. Lauderdale, Florida, U.S. Climb 4
Dec. 17 Mallen Industries Premier I Atlanta Approach 2
Controlled flight into terrain
Source: Ascend
Table 3
Major Accidents, Worldwide Commercial Turboprops, 2013
Date Operator Aircraft Location Phase Fatal
Jan. 23 Kenn Borek Air DHC-6 Terra Nova Bay, Antarctica En route 3
Feb. 13 South Airlines AN-24 Donetsk, Ukraine Approach 5
March 4 CAA Fokker 50Goma, Democratic Republic of the Congo Approach 7
March 8 ACE Air Cargo Beech 1900 Anchorage, Alaska, U.S. Approach 2
April 7 Sahel Air Service Beech 1900 San Tome and Principe Approach 1
April 17 Lao Air DHC-6 Vientiane-Wattay, Laos Takeoff 0
May 16 Nepal Airlines DHC-6 Jomson, Nepal Landing 0
May 16 Flying Dragon Aviation
Y-12 Shenyang, China Climb 0
June 1 Sita Air DO-228 Simikot, Nepal Landing 0
June 10 Merpati Airlines MA-60 Kupang, Indonesia Landing 0
June 13 SkyBahamas Saab 340 Marsh Harbor, Bahamas Landing 0
June 29 Batair Cargo EMB-110 Francistown, Botswana Approach 2
Aug. 9 Ukraine Air Alliance AN-12 Leipzig, Germany Start 0
Sept. 9 CorpFlite DO-228 Viña del Mar, Chile Approach 2
Oct. 3 Associated Aviation EMB-120 Lagos, Nigeria Takeoff 13
Oct. 10 MASwings DHC-6 Kudat, Malaysia Landing 2
Oct. 16 Lao Airlines ATR-72 Pakse, Laos Approach 49
Oct. 19 Air Niugini ATR-42 Madang, Papua New Guinea Takeoff 0
Nov. 3 Aerocon Metro III Riberalta, Bolivia Approach 8
Nov. 10 Bearskin Airlines Metro III Red Lake, Canada Approach 5
Dec. 2 IBC Airways Metro III Arecibo, Puerto Rico En route 2
Dec. 26 Irkut AN-12 Irkutsk, Russia Approach 9
Controlled flight into terrain
Source: Ascend
Table 4
| 21FLIGHTSAFETY.ORG | AEROSAFETYWORLD | FEBRUARY 2014
2013REVIEW
have reliable worldwide exposure data (hours flown or departures) to calculate valid accident rates. After a decade of negligible improvement in the accident rate for commercial jets, a very positive trend of improvement that started in 2011 is evident, and the five-year run-ning average continues to decrease.
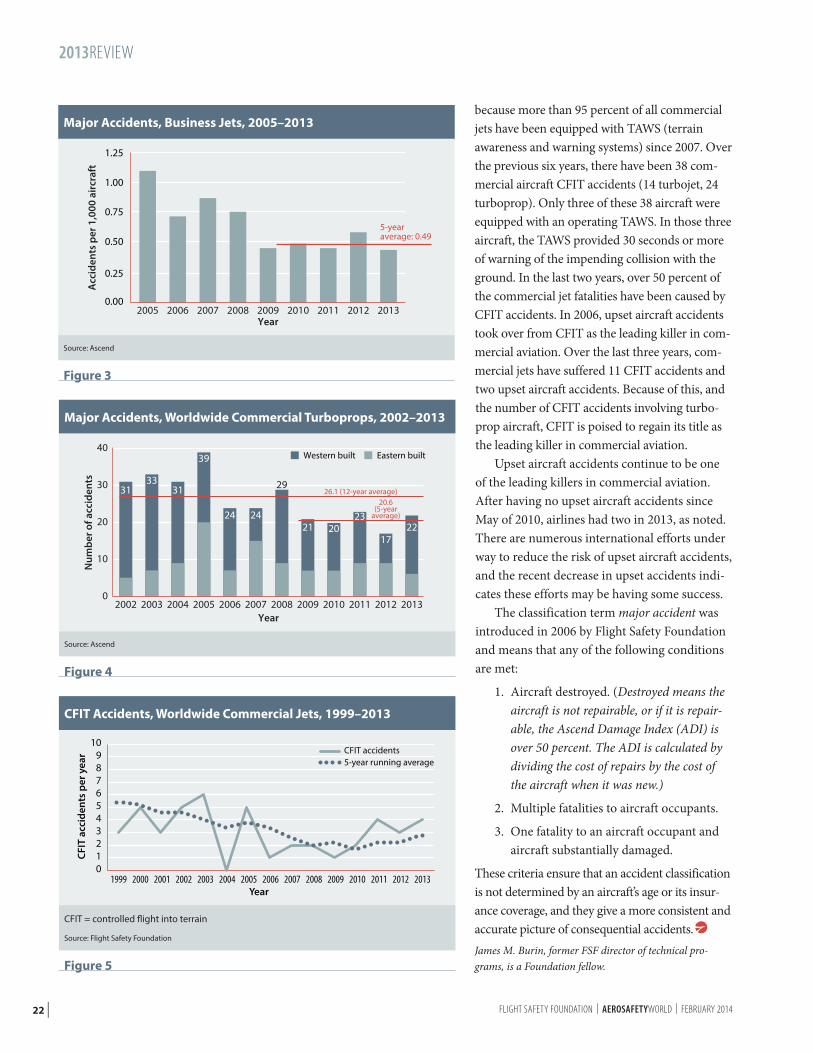
The eight major accidents for busi-ness jets in 2013 (Table 3) were below their 12-year average of 10.5. As with Eastern-built aircraft, calculating accident rates for business jets is difficult due to the lack of reliable exposure data. One rate that can be calculated is the number of major accidents per 1,000 aircraft. Figure 3 (p. 22) uses this metric, and it shows an improvement in the business jet accident rate over the last nine years.
Table 4 lists the major accidents involving Western-built and Eastern-built commercial turboprop aircraft with more than 14 passenger seats. The 22 major turboprop accidents in 2013 are about av-erage, and above the record low of 17 set in 2012. Figure 4 (p. 22) shows the num-ber of turboprop accidents since 2002. CFIT accidents continue to dominate the accident and fatality numbers for com-mercial turboprops. In 2013, eight of the 22 major accidents were CFIT accidents. Over the last seven years, 30 percent of the commercial turboprop major ac-cidents have been CFIT accidents.
CFIT, approach and landing, and up-set aircraft accidents continue to account for the majority of accidents and cause the majority of fatalities in commercial aviation. Of the seven commercial jet major accidents in 2013, five were ap-proach and landing accidents. Over the last five years, 70 percent of commercial jet major accidents have been approach and landing accidents. Figure 5 (p. 22) shows the CFIT accidents for all com-mercial jets since 1999. The upward trend since 2009 is quite disappointing
Major Accidents, Business Jets, 2005–2013
1.00
1.25
0.75
0.50
0.25
0.00
5-year average: 0.49
2005 2006 2007 2008 2009 2011 201320122010Year
Acc
iden
ts p
er 1
,000
air
craf
t
Source: Ascend
Figure 3
Major Accidents, Worldwide Commercial Turboprops, 2002–2013
20132002 2003 2004 2005 2006 2007 2008 2009 2010 2011 20120
10
20
30
40
Num
ber o
f acc
iden
ts
Year
17
3133
31
39
24 24
29
21 2023
Eastern builtWestern built
22
20.6(5-year
average)
26.1 (12-year average)
Source: Ascend
Figure 4
CFIT Accidents, Worldwide Commercial Jets, 1999–2013
Year
CFIT
acc
iden
ts p
er y
ear
2005 2006 2007 2008 2009 2010 2011 201320122003 20042002200120001999
109876543210
CFIT accidents5-year running average
CFIT = controlled flight into terrain
Source: Flight Safety Foundation
Figure 5
22 | FLIGHT SAFETY FOUNDATION | AEROSAFETYWORLD | FEBRUARY 2014
2013REVIEW
because more than 95 percent of all commercial jets have been equipped with TAWS (terrain awareness and warning systems) since 2007. Over the previous six years, there have been 38 com-mercial aircraft CFIT accidents (14 turbojet, 24 turboprop). Only three of these 38 aircraft were equipped with an operating TAWS. In those three aircraft, the TAWS provided 30 seconds or more of warning of the impending collision with the ground. In the last two years, over 50 percent of the commercial jet fatalities have been caused by CFIT accidents. In 2006, upset aircraft accidents took over from CFIT as the leading killer in com-mercial aviation. Over the last three years, com-mercial jets have suffered 11 CFIT accidents and two upset aircraft accidents. Because of this, and the number of CFIT accidents involving turbo-prop aircraft, CFIT is poised to regain its title as the leading killer in commercial aviation.
Upset aircraft accidents continue to be one of the leading killers in commercial aviation. After having no upset aircraft accidents since May of 2010, airlines had two in 2013, as noted. There are numerous international efforts under way to reduce the risk of upset aircraft accidents, and the recent decrease in upset accidents indi-cates these efforts may be having some success.
The classification term major accident was introduced in 2006 by Flight Safety Foundation and means that any of the following conditions are met:
1. Aircraft destroyed. (Destroyed means the aircraft is not repairable, or if it is repair-able, the Ascend Damage Index (ADI) is over 50 percent. The ADI is calculated by dividing the cost of repairs by the cost of the aircraft when it was new.)
2. Multiple fatalities to aircraft occupants.
3. One fatality to an aircraft occupant and aircraft substantially damaged.
These criteria ensure that an accident classification is not determined by an aircraft’s age or its insur-ance coverage, and they give a more consistent and accurate picture of consequential accidents. �James M. Burin, former FSF director of technical pro-grams, is a Foundation fellow.

Susa
n Re
ed
| 23FLIGHTSAFETY.ORG | AEROSAFETYWORLD | FEBRUARY 2014
HELICOPTERSAFETY
The selection of the wrong destination on a global positioning system (GPS) unit probably contributed to a pilot’s spatial disorientation in the seconds before his
Eurocopter AS355 F2 crashed in dark night con-ditions after departing from a South Australia island, the Australian Transport Safety Bureau (ATSB) says.
The 16,000-hour pilot and his two passen-gers — members of a film crew working on a television documentary — were killed in the crash 145 km (78 nm) north of Marree, South
Australia, at 1902 local time Aug. 18, 2011. The helicopter was destroyed.
In its final report, released in November 2013, the ATSB said that the pilot probably became spatially disoriented seconds after he intentionally began a gentle right turn at 1,500 ft (Figure 1, p. 24).
“Factors contributing to the disorienta-tion included dark night conditions, high pilot workload associated with establishing the helicopter in cruise flight and probably attempt-ing to correct the fly-to point in a GPS unit, the
BY LINDA WERFELMAN
Darkness, spatial disorientation
and a heavy workload figured
in the fatal 2011 crash of an
AS355, the ATSB says.

24 | FLIGHT SAFETY FOUNDATION | AEROSAFETYWORLD | FEBRUARY 2014
HELICOPTERSAFETY
pilot’s limited recent night flying and instrument flying experience, and the helicopter not being equipped with an autopilot.”
The report said that the accident flight was one in a series that began Aug. 17 in Sydney, New South Wales. The helicopter landed that evening in Parachilna, South Australia, and departed at 0716 the next day for the first filming flight of the day. Other flights in the Lake Eyre region followed, and the helicopter landed early in the afternoon at Muloorina Station, 48 km (26 nm) north of Marree, where luggage was offloaded and the helicopter was refueled (Figure 2). The helicopter left Muloorina Station at 1418, and, after the first stop, flew to an island in the Cooper Creek inlet, landing around 1715. Plans called for the crew to return to Muloorina Station after completing their work on the island.
When the helicopter departed from the island site at 1859, it “initially climbed vertically while moving rearwards … most likely to maintain a vi-sual reference to the campfire, which was the only available ground light source,” the report said.
At 500 ft, the helicopter turned left to a head-ing of 035 degrees, then climbed to 1,500 ft. The
helicopter flew east, then northeast, “contrary to what [witnesses] expected, as they understood that the crew were returning to their accommo-dation at Muloorina Station (96 km [52 nm] away on a southerly bearing),” the report said.
One witness radioed the helicopter pilot to question the flight path, but there was no response. Investigators could not determine whether the helicopter’s radio had been turned on, but they noted that, as expected, there were no radio communications with air traffic ser-vices during the brief flight.
The helicopter was not equipped with a flight data recorder or a cockpit voice recorder, and neither was required. Data recovered from the helicopter’s GPS unit showed that the helicopter entered a shallow right turn and, 12 seconds later, began a downward spiral that continued for 38 seconds, until the helicopter crashed into the ground at high speed and a bank angle of about 90 degrees.
The report said witnesses at the departure site — members of a tour group on the island — had watched the helicopter’s descent, “followed by a fireball and an orange glow.” They notified
authorities and began a search, locating the wreckage about 3 km (1.6 nm) east-north-east of the departure site at 2040.
The report said that the initial depar-ture path, with the turn at 500 ft, was “consistent with the pilot using one or both of the helicop-ter’s … GPS units … and tracking to a destination selected prior to departure.”
The 035-degree outbound track “can best be explained by the pilot having selected an incorrect
Sate
llite
imag
e: G
oogl
e
Path of Accident Flight
0 secondsdeparture point
from island
32 seconds
61 seconds
103 seconds
108 seconds
121 seconds
131 seconds 133 seconds
148 seconds161 seconds
171 secondsaccidentlocation
Lake Eyre
3,619 ft
Source: Australian Transport Safety Bureau
Figure 1

The Bell 206B crashed in a wooded area near Green Cove Springs, Florida, after flying
into night instrument meteorological conditions.
| 25FLIGHTSAFETY.ORG | AEROSAFETYWORLD | FEBRUARY 2014
HELICOPTERSAFETY
destination on one or both of the GPS units,” the report added, noting that data for another planned landing site, which had been pro-grammed into at least one GPS, called for the helicopter to fly within about one degree of the 035-degree track.
“Errors in selecting a waypoint on a GPS unit are not uncommon, and are potentially more likely to occur during preflight planning in low-light situations,” the report said. Even if the pilot did not hear the radioed question about his departure path, “the data-entry error would probably have become evident to the pi-lot at some stage during the climb or soon after reaching 1,500 ft. … It is likely that the right turn after reaching 1,500 ft was intentional, and it was initiated in order to correct an unin-tended problem with the initial departure track to the northeast.”
In the last seconds of the flight, “given that the pilot was probably manipulating the flight controls but not apparently recognising the descent and increasing bank angle in sufficient time to recover, it is likely that he was spatially disoriented,” the report said. “The circum-stances of the flight included limited percep-tual cues of a problem, elevated workload and potential for distraction, a pilot with limited instrument flying recency and an aircraft with no autopilot. These types of factors have been associated with many previous spatial disorien-tation accidents, including accidents involving a gradually increasing bank angle and descent over a significant time period.”
Owner and Chief PilotThe accident pilot was the owner, managing di-rector and chief pilot of the third-party operator hired by the helicopter’s owner, a Sydney media organization, to take charge of its helicopter operations. The pilot had provided services to the media organization for more than 20 years, the report said.
He had obtained a commercial pilot license for helicopters in 1977, while he was a pilot for the Australian Army, and a night visual flight rules (VFR) helicopter rating (which included
approval for the use of nondirectional beacons and VHF omnidirectional radios) in 1979. He had never held a civil command instrument rat-ing, which had more stringent requirements and was required for night aerial work and charter flying, or GPS navigation approval. He was endorsed in several helicopter types, including the AS355.
According to the last entry in the pilot’s log-book, not quite two months before the accident, he had 16,353 flight hours, most of them in helicopters. That flight time included 484 hours at night, including 3.4 nighttime hours in the previous year.
Accident investigators found “no relevant re-cords” for the period between June 27, 2011, and Aug. 17, and family members and colleagues could not remember whether he had flown dur-ing those months.
To carry passengers at night, the pilot was required to have flown three night takeoffs and landings in the previous 90 days; there was a re-cord of one night landing, at the operator’s base in Sydney, during that period.
Accident Site
WesternAustralia
NorthernTerritory
SouthAustralia
Queensland
New SouthWales
Victoria
Tasmania
Cowarie Station
Lake Eyre
Accident siteDeparture site (Cooper Creek Inlet)
Muloorina Station
Marree
Parachilna
100 miles
Source: Australian Transport Safety Bureau
Figure 2
Sate
llite
imag
e: U
.S. N
atio
nal A
eron
autic
s and
Spa
ce A
dmin
istra
tion;
in
set m
ap: T
hom
as S
tein
er/W
ikim
edia
CC-
BY-S
A 2.
5 m
odifi
ed b
y Su
san
Reed

LOC-I in Helicopters
Preventing, recognizing and responding to rotorcraft upsets must evolve in a manner similar
to the prevention of loss of control–in flight (LOC-I ) involving large commer-cial jets, according to Geoff Connolly, a captain and consultant experimental test pilot, FlightExperimentations. Speaking at the Royal Aeronautical Society’s 8th International Flight Crew Training Conference in London in September 2013, he said, “LOC-I in helicopters is most often because of
spatial disorientation–positional aware-ness. Very often, a combination of … factors [aggravated by pilot errors in airspeed and power control] can lead to loss of control and subsequently [to] semi-controlled flight into the terrain.”
Various LOC-I causal factors have been proposed, but a few have been cited repeatedly in U.K. investigations, he said, adding, “The lack of automatic stabilization or autopilots, particularly in VFR [visual flight rules] operations, is a particular factor.”
He identified commonalities among seven of many reports he reviewed, sug-gesting that future mitigations be more integrated from an LOC-I perspective. The commonalities were degraded vi-sual environment (including dark night conditions and low visibility in weather); visual illusions (“a particular problem offshore where things can be very black,” he said); human factors; crew resource management, including pilot monitoring; cockpit design/human-machine interface; system performance/handling qualities; depth of pilot understanding of automation/lack of
automation; and unexpected transitions from visual meteorological conditions (VMC) to instrument meteorological conditions (IMC).
“I have sat in simulators and seen the startle effect on an experienced pilot sitting alongside me who inadvertently enters IMC,” Connolly said. “He’s not ex-pecting it, and the startle effect is real.”
One of the helicopter LOC-I threats, incipient vortex ring state, requires attention to fundamental rotary-wing aerodynamics. On the plotted lift/drag curve for a helicopter, “we can come all the way back up the curve, as speed reduces, until we end up in the hover,” he said. “So we have a large area of our flight envelope where we can be in a low airspeed–high power demand area. … Vortex ring state [is] effectively the helicopter equivalent of the [airplane wing] stall. … The good news: We can recover. And, funny old thing, recovery is stick forward, select an accelerative at-titude, allow the airspeed to increase and you will get out of the condition.” (continued next page)
26 | FLIGHT SAFETY FOUNDATION | AEROSAFETYWORLD | FEBRUARY 2014
HELICOPTERSAFETY
A May 2009 operator’s proficiency check was the pilot’s last recorded biennial flight re-view, although an April 2010 proficiency check was “conducted to the same standard and by the same approved testing officer as the May 2009 check,” the report said.
The pilot turned 60 in October 2010 and was required by civil aviation regulations to complete an annual proficiency check or flight review in order to serve as pilot-in-command on any passenger-carrying commercial flight. Because the last proficiency check had been conducted April 27, 2010, he was ineligible to conduct commercial flights with passengers after April 27, 2011.
The 2010 proficiency flight included 0.7 hours of night flying, and the check pilot found
no problems with the pilot’s performance. The flight did not include dark night conditions, how-ever, and the check pilot noted that the accident pilot’s next check flight “should address night flight in marginal VMC [visual meteorological conditions] to revise instrument scan skills.”
Previous check flights had revealed “no sig-nificant concerns” about the pilot’s instrument flight skills.
Because the operator’s flights were conducted by single pilots, the accident pilot’s colleagues had limited opportunity to observe his perfor-mance, the report said. Media personnel who had flown with him said that their operations rarely required night flights, although one previous pas-senger reported a flight that had involved about 30 minutes of night flying and no problems.
Susa
n Re
ed
Discussing the seven reports with possible LOC-I elements, Connolly noted that sometimes pilots with the highest levels of flight experience failed to recognize or recover from upset situations, including incipient vortex ring state. In a 1991 offshore ship-to-helideck approach by two such pilots in night VMC, the helicopter lost airspeed and descended at a high rate into the water.1 In a 1992 case, the crew was flying a shuttle between oil rigs at night in snow showers, rough seas and with the wind gusting 55 kt while turning downwind (with possible downdraft effects).2 “The pilot flying reduced power and raised the nose, airspeed reduced to zero and the rate of descent started to increase; full power failed to stop the aircraft enter-ing the water,” he said.
A 2006 accident involved a night approach to an oil rig platform in poor visibility and rain (ASW, 1/09, p. 26). “The copilot … got into an unusual attitude and lost control. … The air-craft was 12 degrees nose down, 20 degrees right roll and at 126 kt when it went into the water,” Connolly said. In a 2009 accident, the helicopter flew into the sea in a near-level attitude
during visual approach to an oil rig in poor visual conditions at night (ASW, 11/11, p. 24). “There were no stabilized approach criteria — something we’ve learned from our fixed-wing breth-ren,” he said.
Although an accident on Aug. 23, 2013, in the Shetland Islands, North Sea, remains under investigation, Connolly said that preliminary facts from official sources — “the airspeed reduced, the aircraft started to descend and then ended up descending rapidly into the water” — imply a need to con-sider LOC-I scenarios (ASW, 10/13, p. 8).
Mitigation efforts so far — such as revised weather limitations for night operations under VFR; electronic flight instrument systems; synthetic vision aids (including head-up displays and forward-looking infrared) to coun-teract visual illusions; new autopilot capabilities and limitations; enhanced helideck lighting standards; standard operating procedures for pilots (in-cluding stabilized approach criteria); and greater fidelity in simulation modeling — should be viewed as steps toward even better operating methodology and flight procedures. He also proposed practicing hands-on
flying skills and scenarios involving “disorientation, loss of control, deci-sion making and judgment — think-ing about energy management and vortex ring.”
“Our synthetic training devices have improved immensely,” Connolly added. ”There are still deficiencies in the mathematical modeling of some emergencies — like vortex ring, tail rotor failures and so on. But they are what we’ve got, and we must use them as best as we can. … We should be educating ourselves and going beyond just training. … We need improved and greater depth of knowledge of automated systems.”
— Wayne Rosenkrans
Notes
1. Australian Bureau of Air Safety Investigation (BASI). “Puma SA 330J Helicopter VH-WOF, Mermaid Sound, Western Australia, 12 May 1991.” BASI Report B/915/1020. <www.atsb.gov.au/media/24791/199100126.pdf>.
2. AAIB. “Report on the accident to AS 332L Super Puma, G-TIGH, near the Cormorant ‘A’ platform, East Shetland Basin [North Sea], on 14 March 1992.” Aircraft Accident Report 2/93. 1993. <www.aaib.gov.uk/cms_resources.cfm?file=/2-1993%20G-TIGH.pdf>.
| 27FLIGHTSAFETY.ORG | AEROSAFETYWORLD | FEBRUARY 2014
HELICOPTERSAFETY
“Overall, it was considered likely that most of the pilot’s night flying in recent years would have been near built-up areas with a significant amount of terrestrial lighting,” the report said.
The report said that the week before the accident, the pilot had been vacationing in an area located three time zones away from Sydney, but he returned five days before his flight duties began Aug. 17 and was considered well rested. He flew 7.5 hours on Aug. 17, landing at 1637, and began flying at 0716 the next morning, after a period of time off that gave him an opportu-nity for eight hours of sleep. Before the accident flight, he had conducted eight flights in 4.3 flight hours.
The pilot had a Class 1 medical certifi-cate and had undergone an aviation medical
assessment, including a routine stress electro-cardiogram, in November 2010; no problems were found.
Normal OperationsThe helicopter was manufactured in 1988 and registered in Australia in 1989. When the acci-dent occurred, it had accumulated 11,920 hours total time. It was maintained in accordance with manufacturer requirements and certified for day and night charter operations under night VFR. The pilot had told maintenance personnel during the flight to the Lake Eyre region that the helicopter was operating normally.
The helicopter had two GPS units — a Garmin GPS400W on the center pedestal below the instrument panel and a portable

28 | FLIGHT SAFETY FOUNDATION | AEROSAFETYWORLD | FEBRUARY 2014
HELICOPTERSAFETY
Garmin GPSMAP 495, which was mounted above the instrument panel on the center pil-lar of the windscreen.
The helicopter also had a radar altimeter system that indicated height above ground level up to 2,000 ft; however, at more than 30 degrees of bank and more than 20 degrees of pitch, the device displayed an altitude greater than the actual height above ground level.
The helicopter was not equipped with a ground proximity warning system, and one was not required. The helicopter also lacked an au-topilot — a factor that the report said “increased the likelihood that an unusual attitude would develop during the right turn” — but, an autopi-lot was not required for night VFR flight.
Light From a CampfireMembers of the island tour group said there were no clouds and minimal winds before the takeoff, about one hour after sunset, and they classified the ambient illumination level as “dark.”
“Apart from the tour group’s campfire on the island, there were no other known sources of terrestrial lighting cues available in the vicinity of the helicopter’s flight path,” the report said, adding that the moon was not visible at the time of the crash, and stars would have been the only source of light.
A pilot who had flown in the area several years earlier for the same media organization said the stars had not been visible because of glare from the instrument lights, and there was no visible horizon. “The pilot said the darkness was ‘frightening,’ and he had to fly the helicopter by flight instruments for the flight to Marree,” the report said.
The departure site lacked markings, light-ing and wind indicators that were specified by Civil Aviation Advisory Publication (CAAP) 92-2 (1) as necessary for night operations, the report said, noting that the operator’s operations manual told pilots to comply with the CAAP.
Safety ManagementThe report credited the operator with using a system of risk control for night VFR flight that
in some cases exceeded regulatory requirements. However, the operator “did not effectively man-age the risk associated with operations in dark night conditions,” the report said.
In addition, the operator did not require a written risk assessment before each flight.
The Australian Civil Aviation Safety Au-thority (CASA) said, in a May 2011 safety trend indicator assessment of the operator, that it was advising the chief pilot to adopt a formal safety management system and to consider imple-menting a fatigue risk management system, although neither was required.
Safety IssuesNoting that VFR flights were permitted in dark night conditions — “effectively the same as instrument meteorological conditions” — the report said the ATSB had identified the follow-ing safety issues:
• The absence of “sufficient requirements for proficiency checks and recent experi-ence to enable flight solely by reference to instruments”; and,
• The absence of requirements for “autopi-lots and similar systems that are in place” for flights conducted under instrument flight rules.
In response, CASA noted that pilot licensing rules that took effect in December 2013 require pilots to “demonstrate competency during bien-nial night [VFR] assessments.” The agency said it would provide additional guidance material on night VFR operations, consider related rules changes, clarify its definition of nighttime “vis-ibility” and promulgate a regulation requiring either an autopilot or an IFR-qualified two-pilot crew in passenger-carrying night air transport flights in helicopters.
The report said that another issue involving the operator’s risk control systems was rendered moot because the company stopped conducting flight operations after the accident. �
This article is based on ATSB Transport Safety Report AO-2011-102, “VFR Flight Into Dark Night Involving Aerospatiale AS355F2, VH-NTV.” Nov. 14, 2013.
‘The pilot said
the darkness was
“frightening.”’

PRISM Complete Safety Management Solution
[email protected] +1 513.852.1010 www.prism.aero
PRISM Services Include:
•SMSBriefingsforExecutives•TrainingClassesavailableforHelicopterOperators(DeliveredinEnglishorSpanish)
•SMSFacilitationServices(Develop,Plan,Implement)
•On-siteSMSEvaluationandGuidance•ManualReviewandDevelopment•CertificationConsultant•“ARMOR”aWeb-basedSafetyandQualityManagementToolCompatiblewithiPad®
PRISM’s unique internet-enabled solutions coupled with our dedicated in-house Helicopter Safety Experts address the challenges of setting
up a functional and effective Safety Management System (SMS) PRISM Affiliations:

30 | FLIGHT SAFETY FOUNDATION | AEROSAFETYWORLD | FEBRUARY 2014
THREATANALYSIS
Towers equipped with sensors to measure winds for power-generation feasibility studies can put at risk pilots and aircraft operating at low altitudes, especially
during aerial application of crop-protection chemicals, seeds and fertilizers.
Meteorological evaluation towers (METs), erected temporarily to measure winds for electric power-generation feasibility studies in the United States, in recent years have become common in some areas. After a number of acci-dents, the National Transportation Safety Board (NTSB) and the agricultural flying industry advocated changes to the current federal level of aviation safety oversight — which ultimately resulted in requests for voluntary measures by
MET users — and appealed to state officials to address the concerns.
The NTSB said earlier in 2013, “Currently, it is unknown how many METs are erected in the United States.”
The first of three accident reports selected as examples by the NTSB reflects key issues. On Jan. 10, 2011, at 1057 local time, a pilot with a commercial pilot certificate and over 26,000 total flight hours in airplanes flew a Rockwell International S-2R Thrush Commander — a single-engine, turboprop airplane designed for aerial application — directly into an unmarked 198-ft (60-m) MET while performing a routine seeding operation on Webb Tract Island fields in Oakley, California. Visual meteorological
Unmarked Meteorological TowersBring Low-Altitude Risk
© F.
John
Hay
, Uni
vers
ity o
f Neb
rask
a Li
ncol
n
Wind-monitoring sensors, installed without
notice, can present an unexpected hazard
to pilots of low-flying aircraft.
BY ED BROTAK

| 31FLIGHTSAFETY.ORG | AEROSAFETYWORLD | FEBRUARY 2014
THREATANALYSIS
conditions (VMC) with 10 mi (16 km) visibility were reported.
The pilot flew over the field, then descended to begin the seeding. Witnesses said he made no observed evasive maneuvers to avoid the unpainted metal tower and its guy wires, and in-vestigators concluded that “his ability to detect it [the tower] visually was extremely limited,” and he never saw it. The aircraft crashed into the ground, killing the pilot; the airplane was substantially damaged.
In its final accident report, the NTSB con-cluded that the probable cause was “an in-flight collision with an unmarked [MET] during an aerial application flight, due to the pilot’s failure to see and avoid the obstacle” and that “contributing to the accident was the lack of visual conspicuity of the MET and the lack of information available to the pilot about the MET before the flight.”
The report also noted that “because many METs … are just below the 200-ft [61-m] threshold at which U.S. Federal Aviation Ad-ministration [FAA] regulations would require the applicant to notify the FAA of the MET and to provide a lighting and marking plan for FAA assessment, many METs are unmarked, un-lighted and not referenced in any FAA notices or publications for pilots.”
Two similar fatal accidents occurred earlier. On May 19, 2005, at 0944 local time, an Air Tractor AT-602 (a single-turboprop agricul-tural airplane) collided with a 197-ft (60-m) unmarked and unlighted MET 15 days after the tower had been erected in Ralls, Texas. This crash involved an experienced pilot with 21,000 flight hours, performing a flight maneuver after a second aerial application (herbicide spraying) on an area of trees. Part of the right wing sepa-rated in the collision and was found adjacent to the base of the tower; the top 3 ft (1 m) of the tower were severed. The plane crashed and burned, killing the pilot and destroying the airplane. Visibility at the time, as reported by a
nearby weather station, was 10 mi (16 km). The probable cause
was “the pilot’s failure to maintain clear-ance from the antenna tower” and contribut-ing factors were “the recency of the tower’s construction and the lack of obstruction lights on the tower.”
The third accident — involving a personal, non-agricultural flight — occurred Dec. 15, 2003, at 1416 local time, when an Erickson (Glasair)/SHA Glasair TD, a single-engine homebuilt airplane, collided with an MET near Vansycle, Oregon, in VMC with 10-mi vis-ibility. The pilot held an airline transport pilot certificate with over 11,000 total flight hours (determined by investigators). Both he and a passenger were killed. The 164-ft (50-m) an-emometer (an instrument for measuring wind velocity) tower they struck was sited among a field of wind turbines. The probable cause was “the pilot’s failure to maintain adequate clearance with the anemometer pole/wires during low altitude flight” and the contribut-ing factors were “the pole and the pilot’s low altitude flight.”
Need for MeasurementsTo better understand and predict the weather, meteorologists have for years probed the atmosphere above the ground. Radiosondes — balloon-borne instrument packages — are regularly released twice a day from hundreds of sites around the world and often rise to over 100,000 ft. Closer to the ground, towers are often equipped with instrumentation to collect data from the low-altitude atmosphere, which meteorologists call the “boundary layer.” Such information is critical in producing more accu-rate forecasts for the aviation industry. But most of these towers are relatively low compared with METs and pose no significant hazard to aircraft.
METs, however, are a specialized, derivative version of such towers. As the demand for re-newable, natural energy sources has increased, designers and engineers at many energy com-panies have turned to groups of wind-driven turbine generators for producing electricity.
Unmarked Meteorological TowersBring Low-Altitude Risk “Many METs
are unmarked,
unlighted and not
referenced in any
FAA notices or
publications for
pilots.”
© st
evem
c/12
3RF.c
om

The FAA and the
NTSB want MET
users to make the
towers and their
supporting wires
more visible, with
the use of orange
and white paints and
marker balls.
32 | FLIGHT SAFETY FOUNDATION | AEROSAFETYWORLD | FEBRUARY 2014
THREATANALYSIS
But to be practically, environmentally and economically feasible, they have to be installed where there is a fairly constant wind.
To test possible sites for these wind farms, energy companies first erect METs. These towers are equipped with anemometers as well as vanes to determine wind direction. The instruments are located at various heights on the tower. The towers themselves are assembled quickly and are usually left up for a year, sometimes several years. This provides the long-term wind data necessary to make economically driven decisions.
Why So High?Why do these towers have to be so high — often 200 ft or more? Large wind turbines are massive. Blades can be over 100 ft (30 m) in length and sit on a supporting tower, which itself is often over 200 ft high. The entire wind turbine can easily rise 300 to 400 ft (91 to 122 m). People in the wind-energy business talk about winds at “hub height,” the height at which the blades con-nect to the main structure.
Although typical METs have substantial mass, they can be erected in a matter of hours. Some companies specialize in their construction and installation.
Tubular, galvanized metal types have thin poles with the wind-sensing equipment mounted at predetermined heights. They are assembled at ground level, then tilted up-right and supported by a system of guy wires. Lattice-type METs are more elaborate. Their prefabricated sections are connected and lifted into place. Often, a nearly 200-ft tower can
appear from one day to the next in a previously vacant field.
The major risk factor is that the dull metal used for the tower, and the supporting guy wires, are difficult to see from the air. The tower and wires easily blend into the surroundings, making them a hazard to pilots of low-flying aircraft.
At particular risk, as evidenced by two of the fatal accidents cited, are pilots performing aerial application. By the nature of their tasks, these pilots must fly at low altitudes, often within 10 ft (3 m) of the ground. Historically, the typical wind farm sites have been in rural areas, far from loca-tions where they would create obstructions for aviation. But this is no longer the case. For this reason, the National Agricultural Aviation Asso-ciation (NAAA) has been in the forefront of call-ing for action to mitigate the risks of unmarked, unregistered and unexpected towers.
Even prior to the 2011 accident, the NAAA had noted that 25 percent of fatal accidents (in which 24 pilots were killed) during agricultural flying for aerial application were due to colli-sions with towers and/or their guy wires. As for the METs, NAAA Executive Director Andrew Moore said, “They go up overnight — literally overnight. And there’s no central database to log their existence.”
U.S. wind farming is practiced in many re-gions but most notably in the Plains states. The open terrain and steady winds are ideal for the wind turbines. Texas leads the nation in wind-generated electricity. Along the West Coast, California has numerous sites, and is second in wind turbine numbers. The Midwest and the Northeast also have sites. Only the South and Southeast remain untouched so far. Many countries around the world also have turned to wind-energy production, and they have encoun-tered the MET risks to aviation.
Mitigations So FarAfter the Oakley accident, the NTSB sent out a special safety alert in March 2011 warning pilots about METs.1 It described the problem and urged pilots to “be vigilant” when flying where these towers might be located. Just five days
© F.
John
Hay
, Uni
vers
ity o
f Neb
rask
a Li
ncol
n

FLIGHTSAFETY.ORG | AEROSAFETYWORLD | FEBRUARY 2014 | 33
THREATANALYSIS
prior to the Oakley accident, the FAA had issued a request for public comments about voluntary marking of such towers. The FAA requires that any tower over 200 ft be clearly marked and lighted and be listed on a publicly accessible federal registry.
As noted, heights of many METs fall just under the FAA’s 200-ft threshold. Applications for city, county or state construction permits — such as for the one issued by Contra Costa County and applicable for the Oakley MET erection in April 2009 — explicitly state that the tower will be just short of the limit for requir-ing federal assessment of obstruction marking, lighting and registration.
Energy companies also consider factors such as the lower cost of obtaining government per-mits and erecting 60-m METs compared with standard 80-m (252-ft) types; and keeping secret from competitors sites where wind measure-ments (wind prospecting) will occur.
The policy decision by the FAA in June 2011 was to recommend voluntary marking of towers under 200 ft. How would the FAA like MET users to increase the level of safety? First, paint the towers with alternating aviation orange and white stripes from top to bottom. Also, install one high-visibility sleeve on each guy wire and install eight high-conspicuity, spherical marker balls on the wires.
The FAA determined that requiring light-ing on such towers would be unreasonably difficult because of the often-remote locations. The agency also opted not to require national registration of such towers, although officials acknowledged that local or state governments can register them. In fact, 10 states (Califor-nia, Idaho, Wyoming, North Dakota, South Dakota, Nebraska, Kansas, Missouri, Michi-gan and Montana) have issued guidelines or enacted laws dealing specifically with towers ranging in height from 50 ft (15 m) to 200 ft, according to NTSB research. Some states, such as South Dakota and California, also require the tower to be clearly marked. Others, such as Wyoming, Nebraska and Montana, require marking and registration.
In May 2013, the NTSB issued another safety recommendation letter,2 which included recommendations to a number of the stake-holders in this issue. The agency recommended that the FAA require all METs to be marked and create “a publicly accessible national data-base for the required registration of all meteo-rological evaluation towers.” The NTSB further recommended that other federal agencies (the Departments of Interior, Defense and Agricul-ture) involved in approving the installation of METs instruct the applicants in standard avia-tion marking procedures.
The NTSB also recommended that the American Wind Energy Association in its Wind Energy Siting Handbook acknowledge the avia-tion hazard that the METs pose and encourage voluntary marking. Finally, the NTSB recom-mended that the 46 states and the District of Columbia that do not currently require METs to be registered in a directory do so, and that all states require marking these towers.
The University of Nebraska Lincoln Exten-sion program and the Nebraska Aviation Trades Association have produced and posted on YouTube two videos highlighting the dangers of unmarked METs, including footage shot from flight.3 The videos show the benefits of properly marking such towers. �
Edward Brotak, Ph.D., retired in 2007 after 25 years as a professor and program director in the Department of Atmospheric Sciences at the University of North Carolina, Asheville.
Notes
1. NTSB Safety Alert SA-016, Meteorological Evaluation Towers, is available at <1.usa.gov/1cR9V1Cl> to educate pilots about these safety issues. FAA guidance on conspicuity for METs is in Advisory Circular 70/7460-1K, Obstruction Marking and Lighting, <1.usa.gov/1i1GOwe>.
2. NTSB. Safety Recommendation A-13-21, May 15, 2013. <www.ntsb.gov/doclib/recletters/2013/A-13-021.pdf>.
3. University of Nebraska Lincoln Extension program and Nebraska Aviation Trades Association. <www.youtube.com/watch?v=Mc6TdFmqkE8>.
The FAA determined
that requiring
lighting on such
towers would be
unreasonably
difficult.

34 | FLIGHT SAFETY FOUNDATION | AEROSAFETYWORLD | FEBRUARY 2014
AVIATIONMEDICINE
Sleep, InterruptedThe FAA is considering more aggressive
screening of pilots for potentially deadly sleep apnea.
BY LINDA WERFELMAN

© M
irekP
/iSto
ckph
oto
| 35FLIGHTSAFETY.ORG | AEROSAFETYWORLD | FEBRUARY 2014
AVIATIONMEDICINE
Susa
n Re
ed
C iting the “significant safety implica-tions” of obstructive sleep apnea (OSA), U.S. Federal Air Surgeon Fred Tilton has proposed screening the most obese
pilots — those most likely to have the disor-der — and requiring those diagnosed with OSA to undergo treatment before they receive medical certification.
Tilton outlined the plan in November 2013,1 noting that OSA is “almost universal” among people with a body mass index (BMI) of 40 or higher — a category that BMI calcula-tors sometimes label “morbidly obese” (see “Measuring Obesity,” p. 36) — and a neck circumference of 17 in (43 cm) or more. About 30 percent of those with a BMI below 30 — the threshold for obesity — also have OSA, he said.
Initially, Tilton said that policy details would be released shortly after announcement of the planned changes, but the announcement was greeted by protests from pilots’ organizations, which objected to the lack of opportunity for their feedback on the proposal, and by a group representing aviation medical examiners, which said wholesale interventions for potential cases of sleep apnea would be outside their tradi-tional area of responsibility. In addition, a U.S. House of Representatives committee approved a proposal to require formal rulemaking for any revised requirement involving the testing or treating of a pilot or air traffic controller for a sleep disorder. The proposal must be approved by the full House, the Senate and the president before it can take effect.
In the aftermath of those objections, the U.S. Federal Aviation Administration (FAA) said it was “considering” the proposal, and an agency spokeswoman said in late December there had been no decision on when it might take effect. Pilots’ organizations, including the Aircraft Owners and Pilots Association (AOPA), said Tilton had told them that the FAA would open discussions in January with aviation industry representatives to develop what AOPA described as “a more palatable solution for pilots” that would also address the agency’s concerns.2
Safety ImplicationsOSA is the most common form of sleep apnea,3 which causes repeated interruptions in a person’s breathing during sleep for 10 seconds or longer, sometimes up to a minute; these periods of not breathing result in less oxygen and more carbon dioxide in the blood and the brain.
“OSA inhibits restorative sleep, and it has significant safety implications because it can cause excessive daytime sleepiness, cognitive impairment, cardiac dysrhythmias, sudden cardiac death, personality disturbances and hypertension, to cite just a few,” Tilton said.
Tilton said his office had begun its cam-paign against OSA by publishing educational pamphlets and discussing the ailment at pilot safety meetings and FAA medical examiner seminars. The next step, he said, would be requiring medical examiners to calculate the BMI of every pilot; pilots with scores of 40 or more would be referred to a physician who is a sleep specialist and be required to undergo treatment before they could receive a medical certificate.
Blockedairway
Tongue
Air �ow
Soft palate
Epiglottis
Uvula
Obstructive sleep
apnea occurs when
muscles in the
throat — muscles
that support the
soft palate, uvula
and tongue — relax
enough to block
the airway. Some
sufferers also have
enlarged tissue at the
back of the mouth.

36 | FLIGHT SAFETY FOUNDATION | AEROSAFETYWORLD | FEBRUARY 2014
AVIATIONMEDICINE
After these pilots are “appropriately dealt with,” Tilton said, “we will gradually expand the testing pool by going to lower BMI measure-ments until we have identified and assured treat-ment for every airman with OSA.”
He added that although plans call for imple-mentation of the same assessment and treatment program for controllers, “we have to finalize some logistical details before we can proceed.”
ICAO ConcernsThe International Civil Aviation Organiza-tion (ICAO), in its Manual of Civil Aviation Medicine, said OSA is “both common and
under-diagnosed in the general and crew popu-lation.”4 The manual quotes one unidentified specialist as estimating that “about 3 percent of the middle-aged pilot population” has OSA, although many are unaware of the problem.
The manual says that ICAO is especially concerned about OSA because of its associa-tion with an increased risk of coronary artery disease, hypertension and stroke.
“Crewmembers treated for OSA normally only recognize the extent of their performance decrement once it is successfully remedied with treatment,” the manual says.
The manual recommends that medical ex-aminers follow a course of action similar to that discussed by Tilton, suggesting that examiners ask two questions of pilots whom they believe may have OSA: “Do you snore at a level that dis-turbs someone sleeping in the same room?” and “Do you have a tendency to fall asleep or doze at inappropriate times?”
Pilots who answer yes to either question, as well as those with a neck circumference greater than 17 in or a BMI greater than 30, should be questioned in greater detail. If their responses lead medical specialists to suspect OSA, the pilots should be considered tempo-rarily unfit to fly and sent for a sleep study, the manual says, noting that, in most cases of OSA, treatment with a continuous positive airway pressure (CPAP) machine and “ap-propriate advice regarding weight loss” will be required before the pilot will be permitted to return to duty.
Rarely CitedAlthough sleep apnea has only rarely been cited as a factor in an accident or incident, the FAA said its review of the U.S. National Transportation Safety Board (NTSB) aviation accident data-base identified 34 accidents, including 32 fatal accidents, involving people with sleep apnea.5 Among the more recent incidents was a Feb. 13, 2008, flight in which the captain and first officer of a go! Bombardier CL-600 fell asleep during a midmorning flight from Honolulu to Hilo, Hawaii, and overflew their destination by 26 nm
Measuring Obesity
Medical authorities typically rely on the body mass index (BMI) to measure overweight and obesity. BMI can be determined by using an online calculator1 or by dividing2:
• Weight in kilograms by height in meters squared, for example, 68 kg ÷ (1.65 m)2 = 24.98; or,
• Weight in pounds by height in inches squared, and multiplying by a conversion factor of 703, for example, [150 lb ÷ (65 in)2] x 703 = 24.96.
The following are standard categories associated with BMI ranges for adults:
BMI Weight Status
Below 18.5 Underweight
18.5–24.9 Normal
25.0–29.9 Overweight
30.0 and higher Obese
Some BMI scales also include an additional category of “morbidly obese” or “extremely obese,” which they apply to BMI scores of 40 and above.
So, while a 6 ft (2 m) tall pilot would be considered to have a normal weight at 175 lb (79 kg), he would be considered overweight at 185 lb (84 kg) and obese at 221 lb (100 kg). At 295 lb (134 kg), he would have a BMI of 40.
— LWNotes
1. Many health-related websites include BMI calculators, such as this one published by the U.S. Centers for Disease Control and Prevention (CDC) at <www.cdc.gov/healthyweight/assessing/bmi/adult_bmi/english_bmi_calculator/bmi_calculator.html>.
2. CDC. About BMI for Adults. <www.cdc.gov/healthyweight/assessing/bmi/adult_bmi/index.html>.

© DeVilbiss
FLIGHTSAFETY.ORG | AEROSAFETYWORLD | FEBRUARY 2014 | 37
AVIATIONMEDICINE
(48 km). Air traffic control (ATC) tried repeatedly to contact the flight crew, but there was no response. After 18 minutes of silence, the crew contacted ATC and followed their instructions to turn back to Hilo, where they landed the airplane without further incident. None of the 43 passengers and crew was injured.6
In its final report, the NTSB cited as the probable cause of the incident “the captain and first officer inadvertently falling asleep.” Contributing factors were “the captain’s undiagnosed ob-structive sleep apnea,” as well as several days of early-morning start times.
The 53-year-old captain’s OSA was diagnosed and characterized as “severe” during a medical exam soon after the incident, but “symptoms (such as snoring) and risk factors (such as obesity) were present before
the incident,” the report said. “This condition likely caused him to experi-ence chronic daytime fatigue and contributed to his falling asleep during the incident flight.”
The captain told NTSB incident investigators that he and the first officer fell asleep after they leveled at cruise altitude.
“It was comfortable in the cockpit. The pressure was behind us,” he said. “The warm Hawaiian sun was blaring in as we went eastbound. I just kind of closed my eyes for a minute, enjoying the sunshine, and dozed off.”
Most SusceptibleOSA is relatively common and occurs more frequently among men than women. About half of those who have the condition are overweight,
and the risk increases with age and with a buildup of fat or a decrease in muscle tone in the muscles involved in breathing.7,8
Experts at the National Institute of Neurological Disorders and Stroke (NINDS) at the U.S. National Institutes of Health (NIH) describe an episode of sleep apnea this way:
The person’s effort to inhale air cre-ates suction that collapses the windpipe. This blocks the air flow for 10 seconds to a minute while the sleeping person struggles to breathe. When the per-son’s blood oxygen level falls, the brain responds by awakening the person enough to tighten the upper airway muscles and open the windpipe. The person may snort or gasp, then resume snoring. This cycle may be repeated hundreds of times a night.9
Treatment for obstructive sleep apnea often involves use of a
continuous positive airway pressure (CPAP) machine, which
blows a stream of air through a tube and into a mask over
the nose, or sometimes over both the nose and mouth.

38 | FLIGHT SAFETY FOUNDATION | AEROSAFETYWORLD | FEBRUARY 2014
AVIATIONMEDICINE
Anyone sleeping near a person with OSA is likely to hear the loud snoring and gasping for air that is one of the most common symptoms of sleep apnea.
Other symptoms include frequent sleepiness during the day; headaches in the morning; memory problems or difficulty concentrating; irritability, depression, mood swings or changes in personality; difficulty in perform-ing skilled motor tasks and a dry mouth or sore throat after waking. In addition, ICAO noted that people with moderate and severe OSA have experienced “an unusually high rate of road traffic accidents.”
Sleep StudyOSA is diagnosed after a physical exam that involves a check of the mouth, nose and throat. Often, people with sleep apnea have enlarged tissue at the back of the mouth.
The exam typically is followed with a sleep study. The most com-mon study is a polysomnogram, an overnight study conducted in a spe-cialized sleep center. Sensors are at-tached to the patient to record brain activity, blood pressure, heart rate, respiratory rate and movements of muscles in various parts of the body. Snoring is monitored, and blood oxygen level is measured.
Afterward, specialists review the sleep data to finalize the diagnosis and determine what treatment is necessary.
For mild cases of OSA, lifestyle changes — such as avoiding alcohol, tobacco and sleep-inducing medica-tions; losing weight; sleeping on one side instead of on the back; and using nasal sprays or allergy medications to help open nasal passages — may be all that is required.10
Sometimes, a mouthpiece made by an orthodontist or dentist is recom-mended to adjust the lower jaw and tongue to help keep the airway open during sleep.
In cases of moderate or severe OSA, the most common treatment involves the use of a CPAP machine (photo, p. 37), a device that blows a steady stream of air through a tube to a mask that fits over the patient’s nose or both the nose and mouth. The pressure from the air helps keep the airway open.
Sometimes, another overnight sleep study is needed to identify the correct settings for the CPAP machine. After the settings are determined, a techni-cian visits the home to set up the CPAP equipment according to a doctor’s prescribed settings.
Sleep specialists say that CPAP can not only keep the airway open but also improve the quality of sleep, alleviate other symptoms of sleep apnea and lower high blood pressure.
“Many people who use CPAP report feeling better once they begin treatment,” said the National Heart, Lung and Blood Institute (NHLBI) of NIH. “They feel more attentive and better able to work during the day. They also report fewer complaints from bed partners about snoring and sleep disruption.”
Disqualifying ConditionThe FAA and other civil aviation au-thorities consider untreated OSA as a disqualifying medical condition.
However, a pilot with OSA who is being treated by a personal physician, as well as a medical examiner, may fly. The pilot and his or her FAA medical examiner must first submit records of a polysomnogram and other relevant medical information to the FAA, which then decides whether a special issuance medical certificate should be issued.
Agency data in late 2013 showed that 4,917 FAA-certificated pilots who were being treated for sleep apnea held special issuance medical certificates.11 Of those, 367 pilots had BMIs of 40 or more.
The FAA says the plan outlined by Tilton does not represent a change in the agency’s medical standards on OSA but rather “a new approach to help [aviation medical examiners] find undi-agnosed and untreated OSA.” �
Notes
1. Tilton, Fred. “Perspective: New Obstructive Sleep Apnea Policy.” Federal Air Surgeon’s Medical Bulletin Volume 51 (Number 4, 2013–2014): 2.
2. Miller, Alyssa J. FAA Puts Sleep Apnea Policy on Hold. Dec. 19, 2013. <www.aopa.org>.
3. Another, less common, form of sleep apnea — central sleep apnea — occurs when the brain is unable to transmit signals to the muscles that control breathing. According to the Mayo Clinic, central sleep apnea typi-cally occurs as a result of congestive heart failure or stroke but can also result from the use of some medications or exposure to very high altitude.
4. ICAO. Manual of Civil Aviation Medicine, Document 8984. Third edition, 2012.
5. FAA. Fact Sheet — Sleep Apnea in Aviation. <www.faa.gov/news/fact_sheets/>.
6. NTSB. Incident report no. SEA08LA080. Feb. 13, 2008.
7. NIH, NHLBI. Who Is at Risk for Sleep Apnea? <www.nhlbi.nih.gov/health/health-topics/topics/sleepapnea>.
8. NIH, NINDS. Brain Basics: Understanding Sleep. <www.ninds.nih.gov/disorders/brain_basics/understanding_sleep.htm>.
9. Ibid.
10. NHLBI.
11. Of the 4,917 pilots, 1,437 held first class medical certificates, 1,008 held second class certificates, and 2,472 held third class certificates.

Sign
: © P
orco
rex/
iSto
ckph
oto
UAV
: © m
ipan
/123
RF.c
om
| 39FLIGHTSAFETY.ORG | AEROSAFETYWORLD | FEBRUARY 2014
INSIGHT
The United States has an historic oppor-tunity to influence the safe integration of civil unmanned aircraft systems (UAS) into its National Airspace System (NAS)
by implementing a safety management system (SMS) for UAS operators now — before the full UAS integration into the NAS. We also recom-mend adoption of the term remotely operated aircraft to replace unmanned aerial vehicle, but in this article have retained the older term from the U.S. strategic roadmap.
The advantages of such an SMS strategy are overwhelming and persuasive. Paramount is the opportunity to amend the regulatory framework based on actual hazard data derived from day-to-day developments within UAS operations.
The circumstances are perfect. The U.S. Federal Aviation Administration (FAA) is granting authorization for six test sites and accompanying airspace for the development of UAS technologies (see “UAS Sites,” p. 9). This will prove a boon for the developing civil UAS technology companies. But what should the FAA expect in return?
We propose first that UAS operators using any of these test sites be required to report op-erational data to the FAA to identify systemwide hazards and develop systemwide mitigations. These lessons would then be circulated among all UAS operators. The operators will learn op-erational safety issues, including those from the mistakes of others.
BY THOMAS ANTHONY AND HARRISON WOLF
SMS must be built into UAS development
— beginning with testing.
40 | FLIGHT SAFETY FOUNDATION | AEROSAFETYWORLD | FEBRUARY 2014
INSIGHT
Our method is clear. Each operator using a test site would be required to implement a basic SMS designed to identify hazards, assess risk, implement mitigations and ensure that the miti-gations work. The International Civil Aviation Organization (ICAO) has spent much useful ef-fort within the last decade developing SMS guid-ance that is simple, direct and straightforward.
Unfortunately, the FAA has not taken the same path for UAS operators. Implementation of SMS within the UAS community should have as its central guiding principles simplicity, clarity and ease of implementation. Just as ICAO has served as the foundation for civil aviation devel-opment worldwide, the establishment of SMS as a basis for UAS regulatory development is too good an idea to ignore. We are at a crossroads and must choose the right road to minimize risk in the full integration of civil UAS.
On Nov. 7, 2013, the FAA published Integra-tion of Civil Unmanned Aircraft Systems (UAS) in the National Airspace System (NAS) Roadmap.1 Section 3.5 of this document, titled “Procedures and Airspace,” says:
ICAO has issued guidance requiring Mem-ber States to implement safety management system programs. These programs are essen-tial to manage risk in the aviation system. The FAA supports this and is a leader in the design and implementation of SMS. Technical challenges abound, including the ability to analyze massive amounts of data to provide useful information for oversight and assessment of risk.
The Roadmap goes on to say: “A key input to a safety management methodology is the use of safety data. Valuable data collection is under way, but development of a safety-reporting database is currently limited to reporting requirements from existing COAs [certificates of authorization or waiver] and experimental certificate holders.”
Because the FAA is not ready to accept safety data via an automated data collection instrument does not negate the importance of requiring operators using the test sites to imple-ment SMS as a condition of operation. SMS is an
operator-based safety system. It is not a regula-tor-based safety system.
The critical thing is for each operator to establish from the start a system that identifies, assesses and mitigates safety hazards before they can result in damage, injury or death. Collection of safety data from test site operators can come later when the FAA has a mechanism in place. All the essential elements and functions already are well established for commercial air transport — replication would not be difficult.
The FAA should limit the reporting of raw, deidentified data by these operators to pre-defined categories representing safety-hazard in-formation of the most value to UAS operations across the nation. The collection and screening of raw safety data would be done entirely by the operator, like gold being sifted from the gravel along a river. Only the “gold” data would need to be reported. The “rocks and gravel” data would remain with the operator (Figure 1).
This approach would place a minimal extra oversight burden on the FAA because the agency’s NAS-level analytical resources would remain focused where they are most valu-able. Reporting could be expanded as database capability is expanded and the low-hanging fruit of safety improvements are harvested. The FAA, freed from examining loads of unimportant data, could identify, analyze and recommend changes through regulation, providing a safer framework for UAS regulatory integration and amendment.
We in the aviation community must ac-knowledge that unless civil UAS operators worldwide start to share operational safety data with the appropriate national civil aviation authorities, no realistic progress can be made to-ward an effective regulatory framework that will ensure safety while providing an environment conducive to the development of UAS technolo-gies. A single major accident involving a UAS aircraft and a commercial passenger aircraft could result in a legislative environment hostile to the full integration of UAS technologies.
While discussing the complexities of SMS implementation, the FAA identified in its UAS-NAS Roadmap that SMS should be a component

| 41FLIGHTSAFETY.ORG | AEROSAFETYWORLD | FEBRUARY 2014
INSIGHT
of test sites. What the FAA did not specify was who would be responsible for developing, monitoring and sharing data. Historically, some aircraft manufacturers have declined to share safety data without a regulatory requirement. We believe operators have more precedents and incentives to share SMS data because they are on the front lines, not wanting to lose an aircraft, cause injury or be involved in an incident or accident. The University of Southern California’s Aviation Safety and Security Program has been fighting for the integration and widespread use of SMS in commercial air transport for more than two decades, and the aviation industry is just beginning to reap the rewards.
Though safety remains the primary concern of most aviation professionals, there is a related “elephant in the room” that the United States must address when discussing UAS integra-tion — privacy. Privacy concerns have taken center stage, surpassing safety concerns in the public eye. Many groups advocate strong privacy protections, attempting to influence legislation at various government levels to limit what types of UAS-obtained data can be collected by operators.
Manufacturers, operators, regulators and the public should be wary of these limitations — es-pecially if they would apply to flight operations safety data as well as UAS sensor data. Unless privacy concerns are addressed as integral to UAS deployment, the effort for full integration could be a non-starter.
Our proposed requirement for operators to implement an SMS as a condition of opera-tion can be a significant first step in addressing privacy concerns by removing the misunder-standing that UAS operations are anonymous and outside the scope of normal civil aviation authorities. There may, in fact, be an opportu-nity for SMS safety data to remedy some privacy concerns by opening to public disclosure facts such as UAS flight status, route and mission. This can only help to ensure more open and transparent civil flight operations.
It is important to start, at the beginning of UAS testing for full integration, to create the safety culture that this new aviation community
must have. The main UAS users come from separate backgrounds: those who have military aviation experience and those with hobbyist aviation experience. Both cultures bring unique challenges, biases and operating procedures that
Mining the UAS Safety Gold
OPS 1 OPS 2 OPS 3
ATC
Management
Test Site
FAA Gold
Lessons learned
most important from test
site system
OPSEC
Raw data Gold data
Lessons learned
from each area within each test
site
Test Site 1
Test Site 4
Test Site 2
Test Site 5 Test Site 6
Test Site 3
Note: Each organizational level identifies the most important hazard/safety data and as this information moves upward, it becomes systematically applicable knowledge.
Source: Thomas Anthony and Harrison Wolf
Figure 1

42 | FLIGHT SAFETY FOUNDATION | AEROSAFETYWORLD | FEBRUARY 2014
INSIGHT
they are accustomed to, which will affect their aviation approach.
Military users may not understand the impor-tance of mishap reporting in the current civil-data context, but they already know how to report, what might be included in their reporting or at least that reporting is required. Typical hobbyists have existed in a world relatively free of regulation and within their own, restricted airspace using “right-of-way” rules designed to reduce accidents involving model, not conventional, aircraft.
These independent cultures already are mix-ing in the UAS community — and a major differ-ence in approach results. The difference, however, should not affect how reporting takes place, the depth of information shared or with whom the information is shared. All UAS and non-UAS op-erators, manufacturers and regulators will benefit from sharing in-depth accident and incident data.
Last, a word about the term “UAS.” A tremen-dous amount of misunderstanding exists with re-gard to UAS, much of it because of inappropriate terminology. Foremost is the word unmanned. The appropriate term is remotely piloted. There is a pilot; the difference is that the pilot is located somewhere other than the aircraft.
In a recent visit to an operator of Predator-type aircraft, I was quickly corrected after using the even-earlier term “UAV” (unmanned aerial vehicle). One of the operator’s senior managers asked me, “Do you know how many people it takes to operate one of these things?”
“No, I do not,” I said after thinking for a moment.
He nodded, and replied with a grin, “About 10 or 12 people at any given time.” It was clear that this was not the first time he had had to correct someone’s terminology.
That’s all it took to convince me. Further, at a recent conference in Canada, a large contingent of attendees initially agreed that there could not be human factors issues connected with operation of remotely piloted aircraft, as there wasn’t a pilot aboard. But certainly, with 10 or 12 individuals involved in their operation, many missions involving these aircraft are replete with human factors issues and hazards. Within minutes of a UAS presentation, the attendees were convinced of their mistake — but it takes a change of understanding about what these new vehicles really encompass.
The future of U.S. remotely piloted aircraft is at a critical crossroads. The opportunity is at hand to choose the proactive approach to safety, which is now recognized as the standard throughout the world. That is SMS, the future of aviation safety. The opportunity will only come once to make SMS a basic requirement for operators of remotely piloted aircraft during the initial stage of development. �
Thomas Anthony is the director of the Aviation Safety and Security Program at the University of Southern California. Harrison Wolf is the staff UAS specialist within the program responsible for development of the course “Safety Management for Remotely Piloted Aircraft.”
The opinions expressed here are the authors’ and not neces-sarily those of Flight Safety Foundation.
Note
1. FAA. Integration of Civil Unmanned Aircraft Systems (UAS) in the National Airspace System (NAS) Roadmap. <www.faa.gov/about/initiatives/uas/me-dia/uas_roadmap_2013.pdf>. U
.S. C
usto
ms
and
Bord
er P
rote
ctio
n
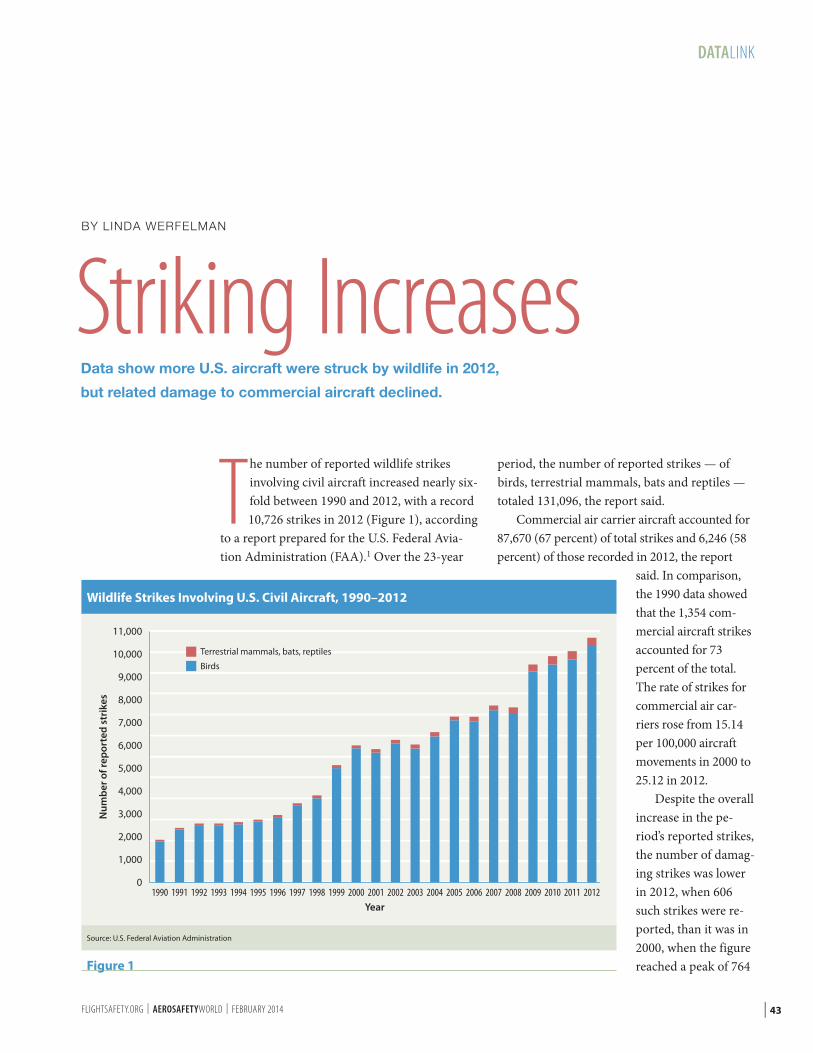
| 43FLIGHTSAFETY.ORG | AEROSAFETYWORLD | FEBRUARY 2014
DATALINK
Wildlife Strikes Involving U.S. Civil Aircraft, 1990–2012
11,000
10,000
9,000
8,000
7,000
6,000
5,000
4,000
3,000
2,000
1,000
01990 1991 1992 1993 1994 1995 1996 1997 1998 1999 2000 2001 2002 2003 2004 2005 2006 2007 2008 2009 2010 2011 2012
Num
ber o
f rep
orte
d st
rike
s
Year
Terrestrial mammals, bats, reptiles
Birds
Source: U.S. Federal Aviation Administration
Figure 1
The number of reported wildlife strikes involving civil aircraft increased nearly six-fold between 1990 and 2012, with a record 10,726 strikes in 2012 (Figure 1), according
to a report prepared for the U.S. Federal Avia-tion Administration (FAA).1 Over the 23-year
period, the number of reported strikes — of birds, terrestrial mammals, bats and reptiles — totaled 131,096, the report said.
Commercial air carrier aircraft accounted for 87,670 (67 percent) of total strikes and 6,246 (58 percent) of those recorded in 2012, the report
said. In comparison, the 1990 data showed that the 1,354 com-mercial aircraft strikes accounted for 73 percent of the total. The rate of strikes for commercial air car-riers rose from 15.14 per 100,000 aircraft movements in 2000 to 25.12 in 2012.
Despite the overall increase in the pe-riod’s reported strikes, the number of damag-ing strikes was lower in 2012, when 606 such strikes were re-ported, than it was in 2000, when the figure reached a peak of 764
BY LINDA WERFELMAN
Striking IncreasesData show more U.S. aircraft were struck by wildlife in 2012,
but related damage to commercial aircraft declined.

44 | FLIGHT SAFETY FOUNDATION | AEROSAFETYWORLD | FEBRUARY 2014
DATALINK
Damaging Wildlife Strikes Involving U.S. Civil Aircraft, 1990–2012
900
800
700
600
500
400
300
200
100
01990 1991 1992 1993 1994 1995 1996 1997 1998 1999 2000 2001 2002 2003 2004 2005 2006 2007 2008 2009 2010 2011 2012
Repo
rted
str
ikes
with
dam
age
Year
Terrestrial mammals, bats, reptiles
Birds
Source: U.S. Federal Aviation Administration
Figure 2
Damaging Bird Strikes Involving Commercial Aircraft at Varying Heights, 1990–2012
400
350
300
250
200
150
100
50
01990 1991 1992 1993 1994 1995 1996 1997 1998 1999 2000 2001 2002 2003 2004 2005 2006 2007 2008 2009 2010 2011 2012
Num
ber o
f dam
agin
g bi
rd s
trik
es
Year
> 500 ft above ground level≤ 500 ft above ground level
Source: U.S. Federal Aviation Administration
Figure 3
(Figure 2), the report said. The decline has been most pronounced for commercial aircraft in the airport environment — at or below 500 ft above ground level (AGL), the report said (Figure 3).
In that category, dam-aging strikes totaled 228 in 2012, down from 353 in 2000.
Data showed no decline in damag-ing strikes involving commercial aircraft above 500 ft AGL or general aviation aircraft. In fact, the number of damag-ing wildlife strikes involving commercial aircraft above 500 ft AGL increased slight-ly to 151 in 2012, up from 142 in 2000.
Overall, data show a total of 381 damaging wildlife strikes involving commercial aircraft in 2012, down 25 percent from the record 510 reported in 2000. The rate of damaging strikes to commercial air-craft over the same period declined 12 percent, from 1.73 per 100,000 aircraft movements in 2000 to 1.53 in 2012, the report said.
“These declines in damaging strikes for commercial aviation in the airport environment have occurred in spite
of an increase in populations of hazardous wildlife species and demonstrate progress in wildlife hazard management programs” at air-ports certificated under U.S. Federal Aviation

| 45FLIGHTSAFETY.ORG | AEROSAFETYWORLD | FEBRUARY 2014
DATALINK
Airports Where Wildlife Strikes Were Reported, 1990–2012
800
700
600
500
400
300
200
100
01990 1991 1992 1993 1994 1995 1996 1997 1998 1999 2000 2001 2002 2003 2004 2005 2006 2007 2008 2009 2010 2011 2012
Num
ber o
f air
port
s
Year
Non-U.S. airports
General aviation airports
FARs Part 139 airports
Notes: U.S. Federal Aviation Regulations (FARs) Part 139 airports are those certificated for air carrier operations with aircraft that can seat more than nine people.
Source: U.S. Federal Aviation Administration
Figure 4
Regulations Part 139 to handle air carrier operations with aircraft that can seat more than nine people, the report said.
The population increase in those hazard-ous wildlife species is one factor that is cited in explaining the increased number of wildlife strikes. For example, the resident (non-migratory) population of Canada geese in the United States and Canada increased to 3.8 million in 2012, up from 500,000 in 1980, the report said.
As populations of those species have in-creased, so has air traffic, with commercial air traffic in the United States growing from 18 million aircraft movements in 1980 to 23 mil-lion in 1990 and up to 29 million movements in each year that followed. Over the years, many air carriers have retired airplanes with older, noisier engines and replaced them with quieter two-engine airplanes that are more difficult for birds to detect and avoid.
These factors mean that wildlife strikes are likely to continue in-creasing over the next decade, the report said.
Strikes were reported at 1,771 U.S. airports over the 23-year period, in-cluding 531 Part 139 certificated airports and 1,240 gen-eral aviation airports; strikes involving U.S.-registered aircraft also were reported at 273 non-U.S. airports, the report said (Figure 4). In 2012, strikes were reported at 643 airports, compared with 332 in 1990.
The report said that in 2012, all Part 139 airports had
either completed a wildlife hazard assessment, were completing an assessment or had taken a federal grant to conduct one. The report credited risk-mitigation efforts at many of these airports with contributing to the general decline in damaging strikes since 2000, despite increas-ing populations of many large bird species.
The report said that the National Wildlife Research Center, operated by the FAA and U.S. Department of Agriculture’s Animal and Plant Health Inspection Service (APHIS), has focused its recent strike-prevention research in several areas, including evaluating avian radar systems.
“The assessment effort is part of the FAA’s overall investigation into the effectiveness of commercially available avian radar detection systems at U.S. civil airports when used in conjunction with other known wildlife man-agement and control techniques,” the report said. “Though it is well established that radar can detect wild birds, there is little published

46 | FLIGHT SAFETY FOUNDATION | AEROSAFETYWORLD | FEBRUARY 2014
DATALINK
information concerning the accuracy and detection capabilities related to range, altitude, target size and effects of weather for avian radar systems” (ASW, 3/09, p. 38).
Other research has examined the likely effects of limiting the access of birds and other wildlife to storm water ponds and other attractive areas on and near airports, developing and using new technologies to harass and deter hazardous species and using pulsating lights mounted on aircraft to enhance wildlife deterrence.
Although many airports have taken steps to mitigate wildlife strike risks, little has been done to reduce the number of wildlife strikes outside airport boundaries, the report said, recommending enhanced wildlife manage-ment efforts aimed at areas within 5 nm (9 km) of airports.
Over the entire reporting period, 482 spe-cies of birds were involved in 97 percent of the reported wildlife strikes, the report said; the most damaging strikes have been associated with waterfowl, gulls and raptors. Forty-two species of terrestrial mammals accounted for 2.2 percent of wildlife strikes, with deer and related species linked to the most damaging strikes. In addition, 15 species of bats were involved in 0.6 percent of strikes, and 11 species of reptiles in 0.1 percent.
Data showed that 52 percent of bird strikes occurred between July and October, and 30 percent of deer strikes occurred in October and November. Bird strikes were more frequent dur-ing the day (62 percent), and strikes involving terrestrial mammals were more likely at night. Both birds (60 percent) and terrestrial mammals (64 percent) were most likely to be struck dur-ing landing. Thirty-seven percent of bird strikes and 34 percent of terrestrial mammal strikes were reported during takeoff and climb.
The report assigned a “hazard level” to each of the 86 species of birds and 10 species of ter-restrial mammals that had figured in at least 50 strikes, calculating scores based on the percent of strikes that caused damage; major damage; and/or a negative effect on flight, which most
often involved a precautionary or emergency landing, as noted in 4 percent of wildlife strike reports.2 At the top of the list of most hazard-ous species were snow geese, followed by black vultures, turkey vultures, northern pintails and Canada geese.
The number of strikes decreased dramati-cally with altitude, with 72 percent of all strikes involving commercial aircraft occurring at or below 500 ft. Above that altitude, data showed that the number of strikes involving commercial aircraft decreased 34 percent with every 1,000 ft increase in height.
Since 1990, the report said, aircraft have been destroyed in 60 wildlife strikes. On aver-age, strikes have cost the U.S. civil aviation industry $957 million and 583,175 hours of air-craft down time annually, the report estimated.
Worldwide, since 1988, 250 people have been killed and more than 229 aircraft have been destroyed in wildlife strikes, including a September 2012 accident in which a Dornier 228-200 crashed after being struck by a vulture during a takeoff in Nepal, killing 19 people.
In recent years, the FAA has developed programs intended to make it easier to report a wildlife strike online or using mobile devices. Information is available at <www.faa.gov/mo-bile/> and <wildlife.faa.gov>. �
Notes
1. Dolbeer, Richard A.; Wright, Sandra E.; Weller, John; Begier, Michael J. Wildlife Strikes to Civil Aircraft in the United States, 1990–2012. Report prepared by the FAA and the Wildlife Services agency of USDA’s APHIS. FAA National Wildlife Strike Database Serial Report Number 19. September 2013. Available from the FAA at <wildlife.faa.gov/downloads/StrikeReport1990-2012.pdf>.
2. The report said that the precautionary or emer-gency landings included 45 instances of jettison-ing fuel, 46 instances of circling to deplete fuel or conducting an overweight landing. Rejected takeoffs were the second-most frequent negative effect; rejected takeoffs occurred in 2 percent of the reported strikes.

| 47FLIGHTSAFETY.ORG | AEROSAFETYWORLD | FEBRUARY 2014
INFOSCAN
BOOKS
Slips, Mistakes and ViolationsA Life in Error: From Little Slips to Big DisastersReason, James. Farnham, Surrey, England, and Burlington, Vermont, U.S.: Ashgate, 2013. 149 pp. Figures, references, index.
A teapot and a cat set James Reason on the path to becoming a renowned expert on error in complex industries such as
aviation.As Reason tells the anecdote in his new book,
one afternoon in the early 1970s, he was brewing tea and about to put the tea leaves in the pot when the cat — “a very noisy Burmese” that slightly intimidated him — showed up and howled insis-tently to be fed. Reason opened a tin of cat food and spooned some out … into the teapot.
“I little realized at the time that this bizarre slip would change my professional life,” Reason says. A lecturer in psychology at the University of Leicester, he was going through a dry spell in research topics.
“I started to reflect upon my embarrass-ing slip,” he says. “One thing was certain: There was nothing random or potentially inexplicable about these actions-not-as-planned. They had a number of interesting properties. First, both tea-making and cat-feeding were highly automatic, habitual sequences that were performed in a very familiar environment. I was almost certainly thinking about something other than tea-making or cat-feeding. But then my attention had been captured by the clamouring of the cat … .
“This occurred at the moment I was about to spoon tea into the pot, but instead I put cat food into the pot. Dolloping cat food into an object (like the cat bowl) affording containment had migrated into the tea-making sequence.”
A Life in Error is not, despite the title, an autobiography, although Reason occasionally describes personal events to illustrate points. Unlike his more academic books that have made him one of the most influential theoreticians in risk management, this new publication (so
Error MessagesJames Reason looks back at his career and ideas.
BY RICK DARBY

48 | FLIGHT SAFETY FOUNDATION | AEROSAFETYWORLD | FEBRUARY 2014
INFOSCAN
far available only in paperback and as a Kindle download) is written in an informal style with-out sacrificing scientific rigor.
A simplified version of the theories that have been the basis of his career, A Life will be especially valuable to operational personnel whose jobs bear on safety, without specializing in it. Such readers could range from top-floor executives to frontline workers. Even special-ists who are familiar with most of the content should appreciate the book’s concision, smooth flow and glimpses into its author’s personality.
Most people believe they know what an error is, yet the concept can be surprisingly hard to pin down. “Dictionaries send us on a semantic circular tour through other [similar] terms such as mistake, fault defect and back to error again,” Reason says. “That dictionaries yield synonyms rather than definitions suggests that the notion of error is something fundamental and irreduc-ible. But we need to probe more deeply into error’s psychological meaning.”
Error is connected in the human mind to other constructs — plan, intention, action and results: “The success or failure of our actions can only be judged by the extent to which they achieve, or are on the way to achieving, their planned consequences.”
Reason suggests the following as a useful working definition:
The term “error” will be applied to all those occasions in which a planned sequence of mental or physical activities fails to achieve its desired goal without the intervention of some chance agency.
Only the last phrase might raise a question for some people. Reason takes into account the possibility that a goal might be achieved, but not because the plan worked as intended.
“If you were struck down in the street by a piece of returning space debris, you would not achieve your immediate goal [to cross the street], but neither would you be in error, since this unhappy intervention was outside your con-trol,” Reason says. “By the same token, achieving your goal through the influence solely of happy chance — as when you slice a golf ball that
bounces off a tree and onto the green — could hardly be called correct performance.”
He distinguishes two basic ways in which an objective can fail to be achieved:
• “The plan of action may be entirely ap-propriate, but the actions do not go as planned. These are slips and lapses (absent-mindedness) or trips and fumbles (clumsy or maladroit actions). Such failures occur at the level of execution rather than in the formulation of intentions or planning.
• “Your actions follow the plan exactly, but the plan itself is inadequate to achieve its desired goal. These are termed mistakes and involve more complex, higher-level processes such as judging, reasoning and decision making. Mistakes, being more subtle and complex, are much harder to detect than slips, lapses, trips and fumbles.
… It is not always obvious what kind of a plan would be ideal for attaining a particu-lar objective. Thus mistakes can pass un-noticed for long periods — and even when detected they can be a matter of debate.”
Reason adopted the error-type classification formulated by Jens Rasmussen, a Danish control engineer, that recognized three performance levels — skill-based (SB), rule-based (RB) and knowledge-based (KB). Reason says, “Using his framework, I was able to distinguish three distinct error types: skill-based slips, rule-based mistakes and knowledge-based mistakes.”
The cat food/teapot error was an example of an SB slip. “Activities at the SB level involve routine and habitual action sequences with little in the way of conscious control,” Reason says. “There is no awareness of a current problem; actions proceed mainly automatically in mostly familiar situations.”
Such actions sound simple and easy. What can go wrong? Often it is a distraction (which might include an outside event, stray thought or daydreaming) that leads to confusion about the context of the action. The routine is carried out as it is meant to be, but it is the wrong routine for the situation.
Most people believe
they know what
an error is, yet the
concept can be
surprisingly hard to
pin down.

| 49FLIGHTSAFETY.ORG | AEROSAFETYWORLD | FEBRUARY 2014
INFOSCAN
RB and KB mistakes differ from SB slips in that they come into play only when the person acting realizes there is a problem to be solved. Both require thinking about a solution, but insofar as they are mistakes, the solution chosen is incorrect.
“There are two kinds of problem: those for which you have pre- packaged solutions (RB level) and those for which you have not (KB level),” Rea-son says. In the former case, once a problem is recognized, the need is to determine the appropriate response that has already been formulated — for instance, a checklist published in a quick reference handbook. Devising KB solutions for problems whose exact nature may be unclear or for which no standard solution exists requires analysis and creativity.
Yet another kind of error, viola-tions, strongly impressed Reason as a result of the 1986 Chernobyl nuclear power plant disaster in Ukraine. The explosion of the reactor’s core could be traced to two distinct types of unsafe act. Reason says, “There was an un-intended slip at the outset of the fatal experiment that caused the reactor to operate at too low a power setting … . Unable to bring the power level up to the desired 20 percent, the operators deliberately persisted with the trial and in so doing made a serious violation of safe operating procedures.
“They did this partly because they did not really understand the physics of the reactor, but also because of their de-termination to continue with the test-ing of the voltage generator — which, ironically, was intended as a safety device in the event of a power loss.”
Chernobyl marked the beginning of a new, wider phase of Reason’s study of error. “Up to this time the focus had been very largely upon
individual error makers,” he says. “But the appearance of violations required a shift away from a purely cognitive information-processing orientation to one that incorporated motivational, social and institutional factors, and paramount among the latter were rules and procedures.”
Why would anyone deliberately violate procedures designed, at least in theory, to safeguard people — in-cluding the operators committing the violations? Reason cites several motivations. Corner cutting or routine violations are intended to save time and effort, or to work around what are perceived as unnecessary limitations. Thrill seeking provides stimulation for some people as they “push the envelope.” Necessary violations are a counterweight to the tendency of or-ganizations to issue ever-stricter rules, usually in response to the most recent accident, which operators at the sharp end find impractical.
Reason cites the “balance sheet” de-veloped by German psychologist Petra Klumb in connection with violations:
• Perceived benefits: “An easier way of working; saves time; more exciting; gets the job done; shows skill; meets a deadline; looks macho.”
• Perceived costs: “Possible ac-cident; injury to self or others; damage to assets; costly to repair; risk of sanctions; loss of job; dis-approval of friends.”
The potential benefits versus poten-tial costs might seem to most people, especially those not actively involved with the work, as a bad trade-off. But Reason points out that “the benefits of non-compliance are immediate and the costs are remote from experience: violating often seems an easier way of
working and for the most part brings no bad consequences.”
He is skeptical that “get tough” policies toward rule violators who are caught will improve matters much. Most do not get caught; some believe they have no choice if they are to meet their productivity targets in spite of un-feasible and excessive requirements. In-stead, Reason believes a better approach is “to try to increase the perceived ben-efits of compliance. That means having procedures that are for the most part workable, correct and available. They should describe the quickest and most efficient ways of doing the job.”
From studying violations, it was a short step to developing the ideas that Reason is most associated with — “holes” in the layers of defense against error that occasionally align to create a path of vulnerability, latent threats that lurk undetected and organizational fac-tors. All these conditions are now rec-ognized in orthodox risk management.
I counted three possible absent-minded slips by the author or editor in the book. He says, “Chapter 5 deals with absent-minded slips and lapses.” But they are the subject of Chapter 4. “In Chapter 10, we move from errors to violations,” he says, with the next page headed “Chapter 9, Violations.” In that chapter, he correctly gives the year of the Chernobyl nuclear accident as 1986, but in the chapter on organizational accidents, he dates it to 1985.
Reason has nothing to be embar-rassed about. He has long made the point that everyone will make errors from time to time, which includes world-famous researchers in the field. Like many of the colleagues he has in-fluenced, he is concerned not with the impossible task of eliminating all error but building barriers against it and reducing its consequences. �

| 51FLIGHTSAFETY.ORG | AEROSAFETYWORLD | FEBRUARY 2014
ONRECORD
The following information provides an awareness of problems that might be avoided in the future. The in-formation is based on final reports by official investigative authorities on aircraft accidents and incidents.
JETS
Pump Seal Damaged Boeing 757-200. Minor damage. No injuries.
The incorrect installation of a seal in the coupling between a fuel tube and the high-pressure fuel pump on the 757’s right engine
likely caused a significant fuel leak during a chartered flight from Helsinki, Finland, to Las Palmas in Spain’s Canary Islands the afternoon of Jan. 15, 2011. The flight crew diverted the flight toward Paris.
In a recently released English translation of the final report on the serious incident, the Safety Investigation Authority of Finland said that the crew did not shut down the engine, as prescribed by the quick reference handbook (QRH), during the diversion.
“The pilots’ deviation from QRH instruc-tions caused the maximum allowable fuel imbal-ance to be exceeded as the fuel leak continued, which led to operations outside the approved performance envelope, and the incident devel-oped into a serious incident according to ICAO [International Civil Aviation Organization] clas-sification,” the report said.
Despite the excessive fuel imbalance, the crew was able to land the 757 without further incident in Paris. There were 210 passengers and eight crewmembers aboard the aircraft.
The pilots discovered the leak about two hours after departing from Helsinki. During an apparent routine hourly fuel check, they noticed that fuel consumption was significantly higher than calculated. “On closer examination, the pilots concluded that there was a fuel leak and traced it to the right fuel system or engine,” the report said. “The fuel leak was so large that the captain decided to land at the nearby Paris Charles de Gaulle airport.”
Investigators later calculated that, due to the leak, fuel consumption from the right fuel system was about 63 kg (139 lb) per minute higher than the left fuel system. The crew did not declare an emergency, but air traffic control (ATC) handled the flight as an emergency after the pilots explained the reason for the diversion.
Although the QRH required a shutdown, “the captain decided not to shut down the right engine until during the ground run since the right engine was running well and he considered it safer to fly with two live engines under these circumstances rather than with one engine,” the report said.
Other factors in the captain’s decision to leave the right engine running were the absence of any sign of a fire and the need to reduce the fuel load to lighten the 757’s landing weight. Moreover, the captain apparently did not trust
Fuel Leak Prompts DiversionThe engine was not shut down as required,
and the 757 was landed with an excessive fuel imbalance.
BY MARK LACAGNINA

52 | FLIGHT SAFETY FOUNDATION | AEROSAFETYWORLD | FEBRUARY 2014
ONRECORD
the left engine. “According to the captain, there had been vibration in the left engine during the flight,” the report said. “Vibration had also occurred on previous flights [and was not corrected by maintenance performed before the aircraft departed from Helsinki].”
The aircraft was landed with a fuel imbalance of 1,700 kg (3,748 lb), or 815 kg (1,797 lb) above the prescribed max-imum. “Reverse thrust was not used during the ground run, as the pilots estimated that it might suck any leaking fuel into the hot section of the engine,” the report said. “The captain shut down the right engine on the runway.”
Investigators found that the main-tenance performed immediately before the flight included replacement of the right engine’s accessory gearbox, on which the high-pressure fuel pump is installed. Their post-flight examination of the engine revealed that the O-ring seal in the coupling was deformed and partially unseated.
“The most probable cause leading to the fuel leak … is that the fitting of the seal was originally too tight, for which reason the seal may have been pressed incorrectly against the edge of the groove when it was installed during maintenance before the incident flight,” the report said.
Corrosion Triggers Shaft FailureMcDonnell Douglas MD-10-30F. Substantial damage. No injuries.
The freighter was accelerating through 60 kt on takeoff from Port-land (Oregon, U.S.) International
Airport the afternoon of Feb. 13, 2012, when the flight crew heard sounds similar to a compressor stall, felt abnor-mal vibrations and saw the left engine’s exhaust gas temperature increase.
The crew rejected the takeoff and tax-ied the MD-10 back to the gate. The U.S. National Transportation Safety Board
(NTSB) report said that disassembly of the left engine showed that the aft end of the midshaft that connects the fan with the low-pressure turbine had fractured.
Further examination revealed that synthetic oil had entered a cavity between the midshaft and the center vent tube. The oil deteriorated and caused corro-sion pitting and the eventual failure of the shaft. “The exact source or mechanism by which the oil entered the dry cavity between the fan midshaft and the center vent tube is unknown,” the report said.
Smoke Traced to Cooling FanBoeing 777-200. Minor damage. No injuries.
The 777 was 38,000 ft over the North Atlantic and about four hours into a flight from Philadelphia to
London with 174 passengers and 13 crewmembers the night of Dec. 1, 2012, when the pilots detected smoke on the flight deck. The commander said that the smoke became “quite bad,” so he de-clared an emergency, initiated a descent to 15,000 ft and diverted the flight to Shannon (Ireland) Airport.
“During the descent, the flight crew carried out the smoke checklist in ac-cordance with the QRH, and the smoke cleared,” said the report by the Air Acci-dent Investigation Unit of Ireland. “They reported that they received a status message to the effect that the right-hand equipment cooling fan had failed.”
The crew changed their flight condition from an emergency to an ur-gency but, because of the increased fuel consumption at 15,000 ft, continued to Shannon, where the aircraft was landed without further incident.
Examination of the cooling fan revealed that a bearing race had collapsed, resulting in contact and overheating of internal rotating and sta-tionary parts. The report said that this is a common failure mode for rotary
fans and that the operator of the 777 was experiencing about one equipment cooling fan failure per year. “However, the subject event was the second such failure in two months and the second related diversion since 2008.”
Excursion on Snowy RunwayLearjet 35. Substantial damage. No injuries.
As the pilots taxied the Learjet for a departure with eight passengers from Pueblo (Colorado, U.S.)
Memorial Airport the evening of Feb. 2, 2012, the automatic terminal informa-tion system reported winds from 360 degrees at 15 kt and 3/4 mi (1 1/4 km) visibility in snow.
The NTSB report said that the cap-tain chose to take off with a crosswind from Runway 08R because, at 10,498 ft (3,200 m), it was longer than Runway 35 (8,310 ft [2,533 m]).
While taxiing to Runway 08R, the captain estimated the snow depth on the taxiways was about 1/8 in (3/8 cm). “The control tower reported that they had no current runway-condition reports since there were no recent landings or depar-tures,” the report said. “The captain said the snow on the runway seemed to be no heavier than what he observed on the taxiway, and he could see the end stripes on the runway.”
The captain recalled that the takeoff initially was normal. However, as the air-plane neared V1, or about 120 kt, he felt it “lurch” right. “He immediately applied full left rudder [and] full left aileron and reduced power, but the airplane contin-ued off the right side of the runway,” the report said. “The airplane traveled across several taxiways before coming to rest upright south of the runway on the grass.”
Both main landing gear separated, and the nose gear and the right wing were substantially damaged, but there was no fire.

| 53FLIGHTSAFETY.ORG | AEROSAFETYWORLD | FEBRUARY 2014
ONRECORD
NTSB concluded that the probable cause of the accident was “the captain’s failure to main-tain airplane control during an attempted cross-wind takeoff on a contaminated runway.”
Fall From a Service DoorEmbraer 145LR. No damage. One serious injury.
Surface winds were at 25 kt, gusting to 35 kt, as the airplane was being prepared for departure from Cincinnati, Ohio, U.S., the
afternoon of Feb. 19, 2013. A flight attendant was opening the galley door for a service crew when a gust dislodged papers inside the galley.
“As she attempted to retrieve them, the wind blew her out the door,” the NTSB report said. “The safety strap had not been attached at the time of the event. The flight attendant experienced a serious injury to her vertebrae.” �
TURBOPROPS
Inexplicable Engine ShutdownCessna 425. Substantial damage. No injuries.
The flight crew said that the left engine’s interstage turbine temperature rapidly increased and torque decreased to zero dur-
ing a medevac positioning flight from Hanover, Germany, to Munich the night of Feb. 2, 2010. The crew requested and received clearance from ATC to descend from 23,000 ft to 15,000 ft.
“The crew could not state which actions they had carried out after the descent clearance and during shut-off and securing of the left engine,” said the report by the German Federal Bureau of Aircraft Accident Investigation. The investigation revealed that they had not feath-ered the propeller.
Radar data indicated that groundspeed varied from 210 kt to 80 kt as the pilots conducted the instrument landing system (ILS) approach to Munich’s Runway 26L in instrument meteorological conditions that included 1,800 m (1 1/8 mi) visibility in snow. Airspeed was below the prescribed minimum single- engine approach speed when the 425 descended below the glideslope about 3 nm (6 km) from the runway.
The crew increased power from the right engine, and the aircraft veered left and struck snow-covered terrain about 100 m (328 ft) from the runway threshold and 60 m (197 ft) left of the extended centerline.
Examination of the left engine revealed no anomalies. Noting that the crew could not recall any other power plant parameters, the report
said that their reason for shutting down the left engine could not be clarified. “Since the inves-tigation did not reveal any mechanical engine damage, it is highly likely that the engine was generally capable of producing power.”
‘I’ve Got It. Don’t Worry’ATR 42-300. No damage. No injuries.
The pilots had been on duty about 9 1/2 hours and were conducting the last of three cargo flights the morning of Feb. 22, 2012,
when the stall-warning horn sounded and the stick shaker activated during an ILS approach to Glasgow, Scotland.
“Simultaneously, the autopilot disconnected,” said the report by the U.K. Air Accidents Inves-tigation Branch (AAIB). “The copilot called, ‘Fly the aircraft [expletive].’” The commander almost immediately pitched the aircraft nose-down to –10 degrees and advanced the power levers [from about 20 percent torque] almost to full power, saying as he did so, “I’ve got it. I’ve got it. Don’t worry.”
As airspeed increased to 125 kt, the com-mander leveled the aircraft but did not reduce the torque setting of 98 percent. The overspeed warning activated as the approach flaps limit of 170 kt was exceeded. The commander then reduced power to slightly above flight idle. The copilot suggested that the autopilot be re- engaged, and the commander replied, “Shhh, just steady on.”
The ATR was descending through 1,500 ft on the glideslope when angle-of-attack

54 | FLIGHT SAFETY FOUNDATION | AEROSAFETYWORLD | FEBRUARY 2014
ONRECORD
reached 10.5 degrees, just below the stick-shaker threshold. “The flight crew attempted to re-engage the autopilot, but it disconnected immediately,” the report said. “Simultaneous-ly, engine torque was increased to 45 percent, airspeed increased and the angle-of-attack reduced.”
The crew had not established radio communication with the tower controller, as previously instructed. When queried by the approach controller, the copilot replied, “Stand by. We’ve just got … a few problems.” The copilot then advised that the problem had been resolved and that they would switch to the tower frequency.
The remainder of the approach was uneventful until a nacelle-overheat warning activated on touchdown. “The flight crew did not action the associated procedure,” the report said. They taxied the ATR to the gate and shut it down. The copilot later reported the incident to the company.
The AAIB concluded that the crew’s perfor-mance during the approach “may have been af-fected by tiredness or fatigue” and demonstrated a lack of adherence with standard operating procedures, ineffective monitoring and dimin-ished cooperation.
Nosewheel Steering MalfunctionsFairchild SA227. Substantial damage. No injuries.
The Metroliner veered right after touching down about halfway down the 5,800-ft (1,768-m) runway at Somerset, Kentucky,
U.S., the afternoon of Jan. 2, 2010. “The pilot applied full left rudder and full reverse on the left power lever but was unsuccessful in correcting the alignment of the airplane,” the NTSB report said.
“He then engaged the nosewheel steering button on the left power lever, and the airplane began a more aggressive turn to the right. It departed the runway, traveled down an em-bankment and came to rest against the airport boundary fence.” The right wing and both propellers were damaged by rocks, but the pilots and their passenger were not hurt.
The Metroliner was repaired and returned to service, but an intermittent loss of steering subsequently was encountered. The problem was traced to damaged wires in the nosewheel steering harness.
“Although an electrical anomaly contributed to the [Jan. 2] loss of control, the fact that the pilots landed long and potentially with excess speed resulted in less runway and time available to recover from the anomaly,” the report said. �
PISTON AIRPLANES
Stall on Missed ApproachCessna 414A. Substantial damage. Two fatalities, four serious injuries.
Weather conditions deteriorated rapidly as the 414 neared the uncontrolled airport in Hayden, Colorado, U.S.,
the afternoon of Feb. 19, 2012. Visibility decreased to 1/4 mi (400 m), the ceiling was overcast at 400 ft, and surface winds were from 290 degrees at 10 kt, gusting to 14 kt. The NTSB report said that the precipitation type was not reported but that heavy snow was likely.
The pilot conducted the ILS approach to Runway 10. “A review of on-board global
positioning system data indicated that the air-plane flew through the approach course several times during the approach and was consistently below the glideslope,” the report said.
The airplane was below the published decision height and right of the extended runway centerline when the pilot initiated a missed approach. Groundspeed decreased during the climb, and the 414 stalled and struck terrain. The pilot and one passenger were killed; the other four passengers were seriously injured.
“The airplane’s anti-ice and propeller anti-ice switches were found in the ‘off ’ position,”

| 55FLIGHTSAFETY.ORG | AEROSAFETYWORLD | FEBRUARY 2014
ONRECORD
the report said. “It is likely that the airframe collected ice during the descent and approach, which affected the airplane’s performance and led to an aerodynamic stall during the climb.”
Control Lost in CrosswindPiper Chieftain. Substantial damage. No injuries.
The Chieftain was on a visual flight rules air-taxi flight the evening of Feb. 16, 2013, to Dutch Harbor, Alaska, U.S., which was
reporting winds from 339 degrees at 26 kt, gust-ing to 35 kt, a 1,200-ft overcast and 5 mi (8 km) visibility in blowing snow.
The NTSB report said that the pilot chose to land with a quartering tailwind on Runway 12 and lost control of the Chieftain after touch-down. “During the landing roll, a wind gust pushed the nose of the airplane to the right, and the airplane began to slide momentarily on an icy patch on the runway,” the report said. “While sliding sideways, the left main landing gear contacted bare pavement, which resulted in the collapse of the left main landing gear.”
Damage to the landing gear and wing was substantial, but the pilot and his two passengers escaped injury. �
HELICOPTERS
‘Threshold of Control’Bell 206B3. Substantial damage. Two minor injuries.
The JetRanger was dispatched to film a truck accident on a road in hilly terrain near Perth, Western Australia, the morning of
Jan. 19, 2013. Day visual meteorological condi-tions with northeasterly winds of 10 to 15 kt prevailed at the accident site.
After hovering and maneuvering about 500 ft above the ground for three minutes, the pilot initiated a right turn to complete the filming and depart from the area. “The helicopter was exposed to a crosswind from the left while at an airspeed around the 30-kt threshold value for susceptibility to loss of tail rotor effectiveness,” said the report by the Australian Transport Safety Bureau.
As the right turn began, the nose moved left and then rapidly to the right, and the helicop-ter began to rotate. “The pilot responded with control inputs and regained sufficient control to carry out a forced landing, but [he] did not apply full left pedal as recommended for loss of tail rotor effectiveness, resulting in a likely delay in recovery,” the report said.
The JetRanger rolled over after touching down in a clear area on sloping terrain. The pilot and the photographer sustained minor in-juries and were attended by emergency services personnel at the site.
Engine Fails in Icing ConditionsHughes 500. Substantial damage. No injuries.
The pilot told investigators that the auto- ignition system was armed when the engine lost power after the helicopter flew through
an area of moderate to heavy snow during a flight from Canton, Ohio, U.S., to Dayton the morning of Jan. 29, 2013.
“The pilot entered an autorotation and ap-plied excessive aft cyclic during the touchdown in a field [in London, Ohio], which caused the main rotor blades to flex down and sever the tail boom,” the NTSB report said. The pilot and his passenger escaped injury.
Examination of the engine revealed no mechanical anomalies. The report said that the Hughes 500 rotorcraft flight manual prohibits flight into known icing conditions and requires the fuel to meet the anti-icing capability of JP-4 when operating in temperatures below 41 degrees F (5 degrees C).
Weather conditions in the area included snow and freezing fog, an 800-ft overcast and a surface temperature of 16 degrees F (minus 9 degrees C). “A review of fueling records re-vealed that no anti-icing additive was added to the fuel,” the report said. “The pilot was aware of the icing conditions, but he continued the flight.” �

56 | FLIGHT SAFETY FOUNDATION | AEROSAFETYWORLD | FEBRUARY 2014
ONRECORD
Preliminary Reports, November 2013
Date Location Aircraft Type Aircraft Damage Injuries
Nov. 1 Springdale, Arkansas, U.S. Beech King Air C90 destroyed 2 fatal
The King Air struck terrain while diverting to Springdale after the pilot reported that he was low on fuel.
Nov. 1 Caledonia, Minnesota, U.S. Piper Aztec substantial 3 fatal, 1 serious
Visual meteorological conditions prevailed when the Aztec struck terrain during approach.
Nov. 2 Coburg, Germany Piper Seneca destroyed 3 fatal
The Seneca struck trees on approach in unreported weather conditions.
Nov. 3 Riberalta, Bolivia Swearingen Metro 3 destroyed 8 fatal, 10 serious
Instrument meteorological conditions (IMC) prevailed when the Metro landed long and veered off the wet runway after completing a circling approach.
Nov. 3 Devil’s Hole, Channel Islands, U.K. Pilatus Britten-Norman Islander substantial none
The pilot and four crewmembers escaped injury during a forced landing after both engines lost power during a night search mission. The fuel selectors were found positioned to the empty tip tanks; the main tanks were nearly full.
Nov. 6 Donnelly, Idaho, U.S. Cessna U206F substantial 3 fatal
The airplane struck terrain at 8,000 ft during an air taxi flight from McCall to Challis, both in Idaho.
Nov. 10 Red Lake, Ontario, Canada Swearingen Metro 3 destroyed 5 fatal, 2 serious
The flight crew declared an emergency shortly after crossing the final approach fix during an area navigation approach. The Metro then struck power lines and terrain near the runway threshold.
Nov. 10 Owasso, Oklahoma, U.S. Mitsubishi MU-2B-25 destroyed 1 fatal
The airplane was on final approach to Runway 18L at Tulsa International Airport when the pilot reported a control problem and that the left engine was shut down. Witnesses said that the MU-2 was in a shallow left turn when it entered a steep, spiral descent.
Nov. 12 Junction, Texas, U.S. Cessna T310R destroyed 2 fatal
Witnesses heard the 310 circling, then the sound of an impact. IMC prevailed in the area; the airplane was not on a flight plan.
Nov. 17 Kazan, Russia Boeing 737-500 destroyed 50 fatal
IMC prevailed when the flight crew reported that they were going around because the aircraft was “not in a position to land.” The 737 entered a steep climb and reached about 700 m (2,300 ft) before descending rapidly to the ground.
Nov. 18 Xalapa, Mexico Cessna 414 destroyed 2 fatal
The 414 was in cruise flight in marginal weather conditions when it struck terrain near a mountaintop.
Nov. 19 Mouffy, France Socata TBM-700 destroyed 6 fatal
A witness saw the aircraft emerge from a cloud layer in an uncontrolled descent.
Nov. 19 Fort Lauderdale, Florida, U.S. Learjet 35A destroyed 4 fatal
Shortly after taking off for a medevac positioning flight to Cozumel, Mexico, the flight crew declared an emergency and told air traffic control that they wanted to return to the airport. The Learjet struck the ocean about 3 nm (5 km) from the airport.
Nov. 25 Kibeni, Papua New Guinea Cessna 208B destroyed 3 fatal, 7 minor
The Grand Caravan was on a charter flight from Kamusi to Purari when the flight crew sent a distress signal and diverted to the Kibeni Airstrip. The aircraft crashed in a river during the attempted emergency landing.
Nov. 29 Bwabwata National Park, Namibia Embraer 190-100 destroyed 33 fatal
Contact with the ERJ was lost during a scheduled flight from Maputo, Mozambique, to Luanda, Angola. Low visibility and heavy rain associated with thunderstorms hindered initial search efforts. The wreckage was found the next day about 200 km (108 nm) east of Rundu, Namibia.
Nov. 29 Saint Mary’s, Alaska, U.S. Cessna 208B destroyed 4 fatal, 6 serious
Visibility was 1 mi (1,600 m) when the Grand Caravan crashed about 4 nm (7 km) from the airport on approach.
This information, gathered from various government and media sources, is subject to change as the investigations of the accidents and incidents are completed.

Multiple Aviation Industry Segments, One Message: Safety.
If the entire aviation industry should collaborate on one thing, it is safety. At a time of constrained resources, increased regulation and unprecedented
scrutiny, the Flight Safety Foundation continues to be the leading advocate for safety and prevention of accidents, thereby saving lives.
Show your commitment to the aviation community’s core value — a strong, e� ective global safety culture.
Join the Flight Safety Foundation.
Flight Safety FoundationHeadquarters: 801 N. Fairfax Street, Suite 400Alexandria, Virginia U.S. 22314-1774Tel.: +1 703.739.6700Fax: +1 703.739.6708
� ightsafety.org
Member EnrollmentAhlam Wahdan membership services coordinatorTel.: ext. 102membership@� ightsafety.org
Membership/Donations/EndowmentsSusan M. Lauschmanaging director of membership and business developmentTel.: ext. 112lausch@� ightsafety.org
BARS Program O� ceLevel 6 | 278 Collins Street Melbourne VIC 3000 Australia GPO Box 3026 Melbourne VIC 3001 Australia Tel.: +61 1300 557 162Fax: +61 1300 557 182Email: bars@� ightsafety.org
“Honeywell has been a partner with the Flight Safety Foundation (FSF) for more than 40 years in supporting the FSF mission to continuously improve fl ight safety.”
— Don Bateman, Honeywell Corporate Fellow and Chief Engineer- Technologist for Flight Safety Systems and Technology

SURPRISINGLY SIMPLEREMARKABLY HUMAN
INTRODUCINGSAVVYdoc™ Document Management
SURPRISINGLY SIMPLEREMARKABLY HUMAN
INTRODUCINGSAVVYdoc™ Document Management
"We analyzed, assessed and evaluated the program to be afar superior model than what we were currently utilizing."
West Coast Aviation Director
"We analyzed, assessed and evaluated the program to be afar superior model than what we were currently utilizing."
West Coast Aviation Director
Heli-Expo Booth #5915 • Feb 25-27 • Anaheim, CA+1.843.342.5434 • BaldwinAviation.com