Embed Size (px)
Citation preview

© 2020 JETIR February 2020, Volume 7, Issue 2 www.jetir.org (ISSN-2349-5162)
JETIR2002065 Journal of Emerging Technologies and Innovative Research (JETIR) www.jetir.org 423
1Raghu P, 2Mr R Senthil Kumaran and 3Dr.K S Shashishekar 1Department of Mechanical Engineering Siddaganga Institute of Technology, Tumakuru, Karnataka, India.
2Propulsion Division, National Aerospace Laboratory, Bengaluru, Karnataka, India.
3Department of Mechanical Engineering Siddaganga Institute of Technology, Tumakuru, Karnataka, India.
Abstract: This paper provides a complete review of the experimental and numerical results demonstrating the
aerodynamic performance of a turbine stator cascade. The experimental work involved linear cascade testing in the
NAL Transonic Cascade Tunnel (TCT). Used pressure based Navier-Stokes solver of ANSYS CFX for Numerical
simulations. The cascade model was tested with two different end wall configurations; straight and contoured
converging end walls. By using straight and contoured converging end walls, two different Axial Velocity Density
Ratios were simulated. Pitch-wise, wake traverses were carried out across several span locations to map the secondary
flow. Experiments were carried out over 0.7 to 1.2 exit Mach numbers at three different angles of incidence including
the design condition. Blade loading was measured at three different span locations. Reynolds number close to the
actual engine values were simulated during the experiments. Aerodynamic performance parameters like profile loss,
flow deflection, blade loading etc., were measured. Oil flow visualization studies were realized to characterize the
flow pattern over the blade surfaces and the end walls. Both straight and contoured end wall configurations exhibit
similar loss trends at mid span. However, contoured end wall configuration shows fractionally lower pressure loss.
Keywords: AVDR, blade loading, boundary layer, cascade, flow deflection, profile loss, secondary flow, etc.,
NOMENCLATURE
C = Chord of the blade (mm) Cax = Axial Chord of the blade (mm)
βs = Stagger angle (Degree) β1 = Inlet flow angle (Degree)
β2 = Outlet flow angle (Degree) β1' = Inlet metal angle (Degree)
β2' = Outlet metal angle (Degree) i = Incidence angle (Degree)
δ = Deviation angle (Degree) S = Pitch /Spacing (mm)
θ = Blade camber angle (Degree) ε = Flow deflection (Degree)
λ = Solidity Ratio t = Turbulent viscosity (Pa s)
k = Turbulent kinetic energy P01 = Inlet total pressure (mm of Hg)
P02 = Exit total pressure (mm of Hg) p1 = Inlet static pressure (mm of Hg)
p2 = Outlet static pressure (mm of Hg) M1 = Inlet Mach number
M2 = Outlet Mach number x = Chord wise distance (mm)
y = Pitch wise distance (mm) AVDR = Axial Velocity Density Ratio
HP = High Pressure NGV = Nozzle Guided Vane
TCT = Transonic Cascade Tunnel SST = Shear Stress Transport turbulence model
1 INTRODUCTION
When the flows are three-dimensional it is very difficult to measure, model & understand. Nowadays the testing of
turbine & compressor blades in a cascade is the most common way. A cascade is simply a turbine or compressor that
is cut in half along the axis and made to lay down flat. For testing the aerodynamics and other properties more easily
the blades are arranged in parallel or in annular way inside the wind tunnel. A wind tunnel is used to find out the
effects of fluid flow over the blades. To increase the efficiency of a turbine, need to improve in the turbine section.
Very hot gases from combustion chamber enter into gas turbine and expand through the turbine blades, causing it to
rotate. The rotation of turbine blade leads to rotate the shaft to provides the power for compressor and in power
generation drives an additional generator. High pressure gases exit the turbine and passes through a nozzle at high
velocity, creating thrust is required for the propulsion purposes. Pressure drops across each blade cause the rotation.
“AERODYNAMIC PERFORMANCE OF A
HIGH-SPEED TURBINE CASCADE WITH
AXIALLY CONTOURED ENDWALLS”

© 2020 JETIR February 2020, Volume 7, Issue 2 www.jetir.org (ISSN-2349-5162)
JETIR2002065 Journal of Emerging Technologies and Innovative Research (JETIR) www.jetir.org 424
Due to secondary flows additional pressure losses are created. Grant Laidlaw Ingram [7] emphasized that end-wall
profile targets to reduce the unacceptable secondary flow elements by modeling the end-wall in the middle of the
turbine blades. The modeling too accelerates the flow which reduces the local static pressure. By using boundary layer
fence with a turbine cascade effectually minimizes the strength of the major loss leading to minor aerodynamic losses
in the turbine path. So, the total pressure losses within the boundary layer is reduced. By 15% to 25% the total
pressure loss is reduced for the fence’s heights of 12 mm and 16 mm respectively according to M. Govardhan and
P.K. Maharia [6]. The change was obtained in lift and drag coefficients due to reduction in the total pressure loss.
Overall, it was concluded the secondary loss can be reduced by fences and increases the performance of the turbine
cascade. The profile losses can be reduced by using different end-wall in cascade testing.
II. DESIGN PROCEDURE
A. Profile Details
The turbine stator aerofoil has been designed for a solidity ratio [C / S] of 1.42. The cascade geometry and design
flow conditions are listed in Table 1. All angles are in axial direction. At flow condition M2=0.98 and β1=00.
Table-I: Turbine stator cascade geometry
Parameters Notation Magnitude
Stagger angle βs 53.500
Solidity ratio λ 1.42
Inlet metal angle β1 ' 0.00
Outlet metal angle β2 ' 710
No. of blades in assembly N 7
B. Cascade Geometry
The below figure shows the cascade geometry of turbine stator blade profile.
Fig. 1 Cascade geometry. Fig. 2 Wake measurement positions for the cascade.
C. Cascade Model
Secondary flow measurement was carried out for the cascade with both the end wall configurations. Secondary flow
was mapped by measuring Wake flow at several span wise locations like 5, 10, 15, 20, 25, 30, 40 and 50%. A five-
hole cone probe was traversed at fine pitch-wise interval of 1.5 mm at all the above-mentioned span locations.
Secondary flow measurement was made with cascade configurations at the design flow condition of β1 = 0° and M2 =
0.98.

© 2020 JETIR February 2020, Volume 7, Issue 2 www.jetir.org (ISSN-2349-5162)
JETIR2002065 Journal of Emerging Technologies and Innovative Research (JETIR) www.jetir.org 425
D. Arrangement of Blades on Cascade
The blades were mounted at the required pitch and stagger angle on the perspex sheets using the stem and pin
arrangement. The stem is used for fixing the pitch and pin is used for setting the stagger angle. Cascade width of 153
mm was maintained and the extra length of the long / instrumented blades was fully embedded on one side of the
perspex sheet to facilitate easy access of the instrumentation tubes is shown in figure 2.
Fig. 3 Schematic view of stator cascade in TCT at 00 angle of incidence.
E. Mesh / Grid Generation
The 3D CAD model created in CATIA was saved as an IGES file and imported into the preprocessing tool ICEM
for meshing. A hybrid mesh was created for discretizing the control volume. A structured quadrilateral type grid was
used near the blade to represent the boundary layer effects. The figure 4 and 5 shows the meshing.
The details of boundary layer mesh
First row thickness: 0.002 mm
Growth Factor: 1.2
Number of lines in the boundary Layer: 30
Fig. 4 Meshing near the leading edge and trailing edge. Fig. 5 Fully meshed CFD domain.
F. Grid Independence Study
Grid independence study is taken for minimize the grid size for a model, getting the best accuracy to the solution
with the minimum computational time. The simulation must give exact result as number of grid points increases and
there should not be considerable alteration on the result with further resizing of the grid.
In both the cases medium sized mesh was used for further simulations, because in the three type of meshes there is
no changes in outlet Mach number and total outlet pressure as shown in above tables and for medium mesh data will
be converging at less time.

© 2020 JETIR February 2020, Volume 7, Issue 2 www.jetir.org (ISSN-2349-5162)
JETIR2002065 Journal of Emerging Technologies and Innovative Research (JETIR) www.jetir.org 426
Table-II: Grid independence for different end-wall
End-wall Mesh No. of nodes No. of elements M1 M2
Straight
Medium
511440
482196
0.190
0.982
Contour
Medium
533560
508759
0.1473
0.981
III. CASCADE TEST EXPERIMENTS
A. Transonic Cascade Tunnel
Transonic Cascade Tunnel (TCT) is a high-speed wind tunnel equipped to test linear cascade models of turbine and
compressor blade profiles. It uses working fluid as compressed air. For any type of axial flow compressor, gas and
steam turbine blade profiles are tested in TCT. It is a blow down tunnel with a test section size of 153*500 mm for
testing turbo machinery cascades at transonic/supersonic outlet Mach numbers. It is ideally suited to obtaining blade
profile design / performance data in the transonic Mach number range encountered at the final stages of large steam
turbines, which use special blade profiles for supersonic flows. The TCT can also cater for quasi-3D studies with
coolant flows, end wall secondary flows, inlet boundary layers, inlet turbulence etc. This facility has been extensively
used as an imperative tool to accomplish several national and international research programs in the field of turbo
machinery. Gostelow in Reference [1].
Fig. 6 Schematic layout of the Transonic Cascade Tunnel (TCT).
B. Blade Loading /Pressure Distribution Measurements
The surface pressure distribution is measured by taking number of pressures at the blade surface through
hypodermic needles embedded in the blade itself. Two blades are instrumented, one at the suction and the other at
pressure side to get the blade channel pressure distribution. All the tubes are drawn inside the blade and taken out
through the sidewalls so that these tubes do not disturb the flow. These pressure tubes are connected to multiport
pressure measurement device and the readings are acquired through the PC using a data acquisition card for further
study.
C. Data Reduction
The responses obtained from the transducers were in the form of millivolts. These data were later converted into
engineering units using the calibration data of the transducers. The data measured using the five-hole edge probe was
reduced using the probe calibration coefficients. The downstream mixed out or homogenous values were calculated
from the local values using a 2D mass averaging technique.
The inlet Mach number calculated by utilizing inlet total and static pressures

© 2020 JETIR February 2020, Volume 7, Issue 2 www.jetir.org (ISSN-2349-5162)
JETIR2002065 Journal of Emerging Technologies and Innovative Research (JETIR) www.jetir.org 427
The exit Mach number calculated by utilizing the momentum averaged total and static pressures measured by probe
in the wake
The pressure loss coefficient ‘ξ’ is calculated using the following expression
IV. RESULTS AND DISCUSSION
The local values can be measured in the wake flow through the five-hole probe are averaged by a two-dimensional
momentum method. The data obtained from numerical simulations of the turbine cascade with straight end wall in
table III and contoured end wall in IV table.
Table-III: CFD results for straight end-wall configuration.
Table-IV: CFD results for contoured end-wall configuration.
A. Surface Mach Number Distribution at Design Mach Number for 50% Span
The surface Mach number distribution for straight end wall and contoured end wall cases was shown in figure 10.
In both cases, the contour end wall having lower peak Mach number than straight end wall at the shock location so,
thus reduces the intensity of the shock wave in contour end wall.
Run
no.
M1 M2 Pressure Loss
coefficient
[ dP0/(P02-p2)]
P01
mm of Hg
p1
mm of Hg
P02
mm of Hg
p2
mm of Hg
33 0.162 0.601 0.062 892.70 876.51 880.58 685.00
21 0.171 0.681 0.063 953.10 933.78 937.40 687.00
34 0.183 0.827 0.065 1104.20 1078.60 1078.95 688.51
35 0.187 0.911 0.077 1218.10 1188.75 1185.14 692.05
36 0.19 1.013 0.090 1469.00 1432.40 1412.5 734.52
37 0.191 1.082 0.094 1664.60 1622.77 1591.43 760.76
38 0.191 1.201 0.100 1863.00 1816.02 1758.46 722.87
Run
no.
M1 M2 Pressure Loss
coefficient
[ dP0/(P02-p2)]
P01
mm of Hg
p1
mm of Hg
P02
mm of Hg
p2
mm of Hg
88 0.123 0.575 0.067 872.00 862.86 860.32 687.00
86 0.138 0.727 0.069 1004.30 991.10 984.15 692.00
87 0.143 0.818 0.071 1109.60 1093.93 1082.17 696.00
92 0.145 0.901 0.078 1226.00 1208.07 1189.50 701.00
91 0.147 0.998 0.085 1466.00 1444.00 1405.5 742.40
90 0.147 1.094 0.096 1664.00 1639.00 1583.60 745.50
88 0.123 1.575 0.104 872.00 862.86 860.32 687.00

© 2020 JETIR February 2020, Volume 7, Issue 2 www.jetir.org (ISSN-2349-5162)
JETIR2002065 Journal of Emerging Technologies and Innovative Research (JETIR) www.jetir.org 428
For straight end-wall For Contoured end-wall
Fig. 7 Effect of surface Mach number distribution at design incidence.
B. Effect of Total pressure ratio at design flow condition
The local values of CFD data and experimental data are compared, here the total pressure ratio and outlet Mach
number of typical wakes caused by the stator cascade at single pitch is shown below figure. Below data shows good
flow periodicity and repeatability across the pitches.
For straight end-wall For Contoured end-wall
Fig. 8 Effect of Total pressure ratio at design incidence.
C. Effect of Incidence on Pressure
The difference in profile loss coefficient along the incidence of an angle 100, 00 and -100. The numerical
and experimental results are presented for both straight and contoured end-wall of high-pressure turbine
stator cascade.
0
0.2
0.4
0.6
0.8
1
1.2
1.4
1.6
0 0.2 0.4 0.6 0.8 1
Mach
Nu
mb
er
X/Cax
CFD-0.98
EXP-0.98
0
0.2
0.4
0.6
0.8
1
1.2
1.4
1.6
0 0.2 0.4 0.6 0.8 1
X/Cax
CFD
EXP
0.88
0.9
0.92
0.94
0.96
0.98
1
1.02
0 0.2 0.4 0.6 0.8 1
Tota
l P
ress
ure
Rati
o (
P02/P
01)
Pitch (y)
CFD
EXP
0.88
0.90
0.92
0.94
0.96
0.98
1.00
1.02
0.0 0.2 0.4 0.6 0.8 1.0
Pitch (y)
CFD-0.98
EXP-0.98

© 2020 JETIR February 2020, Volume 7, Issue 2 www.jetir.org (ISSN-2349-5162)
JETIR2002065 Journal of Emerging Technologies and Innovative Research (JETIR) www.jetir.org 429
For straight end-wall For Contoured end-wall
Fig. 9 Effect of incidence on the pressure loss coefficient at M2-0.98.
D. Pressure Loss Coefficient at Different Outlet Mach Number
In the below figure 13 shows how coefficient of pressure loss is varying at different exit Mach number for straight
and contoured end wall cases. The pressure loss coefficient in contoured end wall shows less as compared than
straight end wall. So, contoured end wall can decrease the pressure losses marginally.
Fig. 10 Outlet Mach number on pressure loss coefficient at design incidence.
E. Mach number contours at design incidence
For both straight and contoured end-wall the Mach number contours are representing the how Mach number is
distributed on the symmetry in of the computational domain for 0.98 Mach numbers design incidence (β1 - 00). We
can observe that the plots are showing exact outlet Mach number at the trailing edge as shown in the below figures.
0.07
0.075
0.08
0.085
0.09
0.095
0.1
-10 0 10
Incidence angle (θ)
CFD
EXP
0.07
0.075
0.08
0.085
0.09
0.095
0.1
-10 0 10
Pr
loss
Co
effi
cien
t (Ω
)
Incidence angle (degree)
CFD
EXP

© 2020 JETIR February 2020, Volume 7, Issue 2 www.jetir.org (ISSN-2349-5162)
JETIR2002065 Journal of Emerging Technologies and Innovative Research (JETIR) www.jetir.org 430
Straight end-wall Contoured end-wall
Mach number M2 = 0.98
Mach number M2 = 0.98
Fig. 11 Mach number contours at β1 - 00, for designed Mach numbers.
F. Mach Number Contours at Design Mach Number for Different Incidence
The figure 12 shows that, how Mach number is distributed on the symmetry at an incidence of 00, 100 and -100 for
design Mach number.
Straight end-wall Contoured end-wall
At angle 00
At angle 00
At angle 100
At angle 100
At angle -100
At angle -100
Fig. 12 Mach number contours at different angle of incidence, for Mach number M2-0.98.
G. Oil Flow Visualization
Oil flow visualization was considered for the desired condition of β1-0 and M2-0.98 with the straight and contoured
end-walls cascade. The pressure and suction surfaces with oil flow pattern are in below figures.
© 2020 JETIR February 2020, Volume 7, Issue 2 www.jetir.org (ISSN-2349-5162)
JETIR2002065 Journal of Emerging Technologies and Innovative Research (JETIR) www.jetir.org 431
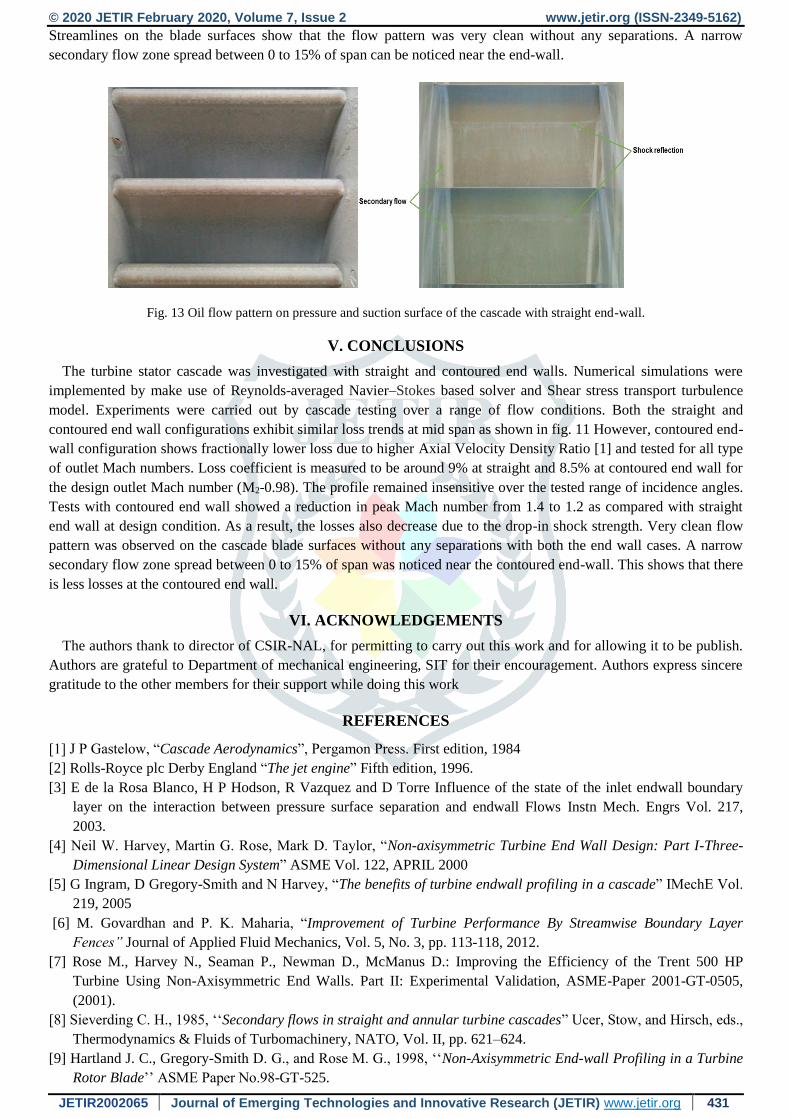
Streamlines on the blade surfaces show that the flow pattern was very clean without any separations. A narrow
secondary flow zone spread between 0 to 15% of span can be noticed near the end-wall.
Fig. 13 Oil flow pattern on pressure and suction surface of the cascade with straight end-wall.
V. CONCLUSIONS
The turbine stator cascade was investigated with straight and contoured end walls. Numerical simulations were
implemented by make use of Reynolds-averaged Navier–Stokes based solver and Shear stress transport turbulence
model. Experiments were carried out by cascade testing over a range of flow conditions. Both the straight and
contoured end wall configurations exhibit similar loss trends at mid span as shown in fig. 11 However, contoured end-
wall configuration shows fractionally lower loss due to higher Axial Velocity Density Ratio [1] and tested for all type
of outlet Mach numbers. Loss coefficient is measured to be around 9% at straight and 8.5% at contoured end wall for
the design outlet Mach number (M2-0.98). The profile remained insensitive over the tested range of incidence angles.
Tests with contoured end wall showed a reduction in peak Mach number from 1.4 to 1.2 as compared with straight
end wall at design condition. As a result, the losses also decrease due to the drop-in shock strength. Very clean flow
pattern was observed on the cascade blade surfaces without any separations with both the end wall cases. A narrow
secondary flow zone spread between 0 to 15% of span was noticed near the contoured end-wall. This shows that there
is less losses at the contoured end wall.
VI. ACKNOWLEDGEMENTS
The authors thank to director of CSIR-NAL, for permitting to carry out this work and for allowing it to be publish.
Authors are grateful to Department of mechanical engineering, SIT for their encouragement. Authors express sincere
gratitude to the other members for their support while doing this work
REFERENCES
[1] J P Gastelow, “Cascade Aerodynamics”, Pergamon Press. First edition, 1984
[2] Rolls-Royce plc Derby England “The jet engine” Fifth edition, 1996.
[3] E de la Rosa Blanco, H P Hodson, R Vazquez and D Torre Influence of the state of the inlet endwall boundary
layer on the interaction between pressure surface separation and endwall Flows Instn Mech. Engrs Vol. 217,
2003.
[4] Neil W. Harvey, Martin G. Rose, Mark D. Taylor, “Non-axisymmetric Turbine End Wall Design: Part I-Three-
Dimensional Linear Design System” ASME Vol. 122, APRIL 2000
[5] G Ingram, D Gregory-Smith and N Harvey, “The benefits of turbine endwall profiling in a cascade” IMechE Vol.
219, 2005
[6] M. Govardhan and P. K. Maharia, “Improvement of Turbine Performance By Streamwise Boundary Layer
Fences” Journal of Applied Fluid Mechanics, Vol. 5, No. 3, pp. 113-118, 2012.
[7] Rose M., Harvey N., Seaman P., Newman D., McManus D.: Improving the Efficiency of the Trent 500 HP
Turbine Using Non-Axisymmetric End Walls. Part II: Experimental Validation, ASME-Paper 2001-GT-0505,
(2001).
[8] Sieverding C. H., 1985, ‘‘Secondary flows in straight and annular turbine cascades” Ucer, Stow, and Hirsch, eds.,
Thermodynamics & Fluids of Turbomachinery, NATO, Vol. II, pp. 621–624.
[9] Hartland J. C., Gregory-Smith D. G., and Rose M. G., 1998, ‘‘Non-Axisymmetric End-wall Profiling in a Turbine
Rotor Blade’’ ASME Paper No.98-GT-525.

© 2020 JETIR February 2020, Volume 7, Issue 2 www.jetir.org (ISSN-2349-5162)
JETIR2002065 Journal of Emerging Technologies and Innovative Research (JETIR) www.jetir.org 432
[10] Bardia J. E., Haung P.G., Caukely T.J., “Turbulence Modeling, Validation, Testing and Development”, NASA
Technical Memorandum 110446, 1997.
[11] Mentor F. R., “Zonal two equation κ-ω turbulence models for aerodynamic flows” AIAA paper, 93-2906, 1993.
[12] Pankhurst R.C. and Bryer D. W., “Pressure-probe methods for determining wind speed and flow direction”,
National Physical Laboratory, London, ISBN 0 11 480012 X.
[13] Private conversations with Mr.R.Senthil Kumaran, Principal Scientists, PR Division NAL.