Embed Size (px)
Citation preview
Loughborough UniversityInstitutional Repository
Aerator design formicrobubble generation
This item was submitted to Loughborough University's Institutional Repositoryby the/an author.
Citation: HANOTU, J., BANDULASENA, H.C.H. and ZIMMERMAN, W.B.,2017. Aerator Design for Microbubble Generation. Chemical Engineering Re-search and Design, 123, pp. 367-376.
Additional Information:
• This paper was published in the journal Chemical Engineering Re-search and Design and the definitive published version is available athttps://doi.org/10.1016/j.cherd.2017.01.034.
Metadata Record: https://dspace.lboro.ac.uk/2134/24798
Version: Accepted for publication
Publisher: c© Elsevier
Rights: This work is made available according to the conditions of the Cre-ative Commons Attribution-NonCommercial-NoDerivatives 4.0 International(CC BY-NC-ND 4.0) licence. Full details of this licence are available at:https://creativecommons.org/licenses/by-nc-nd/4.0/
Please cite the published version.
Accepted Manuscript
Title: Aerator Design for Microbubble Generation
Authors: James O. Hanotu, Hemaka Bandulasena, William B.Zimmerman
PII: S0263-8762(17)30093-XDOI: http://dx.doi.org/doi:10.1016/j.cherd.2017.01.034Reference: CHERD 2570
To appear in:
Received date: 20-4-2015Revised date: 31-12-2016Accepted date: 14-1-2017
Please cite this article as: Hanotu, James O., Bandulasena, Hemaka, Zimmerman,William B., Aerator Design for Microbubble Generation.Chemical EngineeringResearch and Design http://dx.doi.org/10.1016/j.cherd.2017.01.034
This is a PDF file of an unedited manuscript that has been accepted for publication.As a service to our customers we are providing this early version of the manuscript.The manuscript will undergo copyediting, typesetting, and review of the resulting proofbefore it is published in its final form. Please note that during the production processerrors may be discovered which could affect the content, and all legal disclaimers thatapply to the journal pertain.

1
Aerator Design for Microbubble Generation
James O. Hanotu1* [email protected], Hemaka Bandulasena2, William B Zimmerman1
1Department of Chemical and Biological Engineering, University of Sheffield, Mappin Street, Sheffield S1 3JD, United Kingdom
2Department of Chemical Engineering, Loughborough University, Leicestershire, LE11 3TU, United Kingdom.
*Corresponding author.
2
Highlights o A new design for microbubble aerators is proposed o The design entails compartmentalizing aerator plenum chamber to reduce
inactive zones o Inactive zones in aerator plenum chambers lead to flow mal-distribution o Flow distributor within the plenum chamber aids microbubble generation o Oscillating the inlet gas to a aerator can prevent bubble growth by mutual
contact
3
Abstract Fine bubbles are a key component in improving the performance of gas-liquid reactors, particularly in situations where reactions are mass transfer limited. Many aerator types exist for different reactor applications; however conventional aerators are mostly suited to coarse bubble generation. A new aerator suitable for microbubble generation by fluidic oscillation has been designed and tested with the view of getting a uniform bubble distribution across the aerator. Microbubbles generated from various membrane pore sizes and oscillation frequencies were characterized for this aerator to determine the optimum operating parameters. It was evident that the introduction of a flow distributor plate to the plenum chamber improved gas distribution from the inlet to the porous membrane leading to uniform bubble generation across the entire aerator The resultant average bubble size from this new design under oscillatory flow was found to be approximately 2-3 times the membrane pore size. This outcome has a great potential to promote the efficiency of multiphase reactors where mass transfer plays a key role.
Keywords: Membrane; Plenum chamber; Fluidic Oscillator; Microbubbles; Aerator
4
Introduction Mass and momentum transfer processes in bioreactors are preferentially achieved with microbubbles due to their high surface area to volume ratio; less coalescing potential and increased residence time. The thorough mixing of the liquid phase brought about by their high cumulative convective force is another justification for their application relative to coarse bubbles. Bubbles play a vital role in the quality and quantity of bioreactor end-products. However, it is important that an energy efficient bubble generation mechanism is employed for the process to be viable.
In many industrial applications where gas-liquid mass transfer is essential, spargers are commonly employed to generate and disperse gases efficiently owing to their adaptability to many systems. Some common design types include multiple ring and spider spargers (Kulkarni et al., 2009), pipe spargers (Kulkarni et al., 2007), Wheel-type spargers (Kulkarni and Joshi 2011) and plate spargers (Thorat et al., 2001). Of the different types of spargers, plate spargers that consist of a plate-shaped plenum chamber overlaid with a porous material are widely used owing to their relatively simple design and efficiency (Kulkarni et al., 2007). However, these spargers often generate coarse bubbles and are only suited to limited applications in industry. Kulkani and Joshi (2011b) reported an average bubble size of 19 mm from a plate sparger with 3 mm pore size. By decreasing the pore size to 1 mm, an average bubble size of 9 mm was obtained by the authors. In wastewater industry, bubbles on the order of 1-3 mm diameter are often utilized and are deemed to be effective. However, Rehman et al. (2015) reported that significant mass transfer improvements can be achieved by smaller bubbles on the order of 80-120 µm. Other applications such as flotation separation, where fine particles or oil emulsions are separated from a solution using bubbles, very fine microbubbles (<80 µm) are required (Hanotu et al., 2012).
The difficulty in generating microbubbles is not only attributed to the generation mechanism but also the design of the sparger system. Sadly, most research on microbubble generation and application has mainly focused on the generation techniques. The reason is probably because the mechanism of bubble production from multi-porous sparger is similar to that of a single orifice. Generally, production of bubbles occurs in two fashions: chain bubbling and bubble dispersion as a result of jet breakage (Akagi et al., 1987; Kulkarni and Joshi 2005). Typically, these bubbling regimes are manipulated by merely tuning the superficial gas flowrate. In another method shown to be more effective (Zimmerman et al., 2008), the gas stream is oscillated to facilitate early bubble pinch-off, resulting in largely mono-dispersed, relatively uniformly sized bubbles. Regardless of the generation method, multi-porous spargers can pose more complex challenges mainly due to the pressure drop variations influencing bubble production. The pressure drop fluctuation is responsible for mal-distribution across the pores. As a result, the first bubble formed provides the path of minimum resistance, preferentially growing larger than the surrounding bubbles. Additionally, in a multiporous sparger the irregularity of spacing between two bubbles generally leads to bubble coalescence and conjunction, which in turn affects the
5
pressure drop that results in mal-distribution. Conventionally, mal-distribution in plate sparger is overcome by making the sparger plate thicker. The main example in this category is the multiporous sintered glass, steel and ceramic material. Whilst this approach offers relatively better distribution, it creates a potentially bigger problem. As their thickness increases, better gas distribution through the pores is achieved. However this increases the sparger’s susceptibility to clogging but also, the increased sparger plate thickness can lead to increased pressure drop through the pores and ultimately high operating costs.
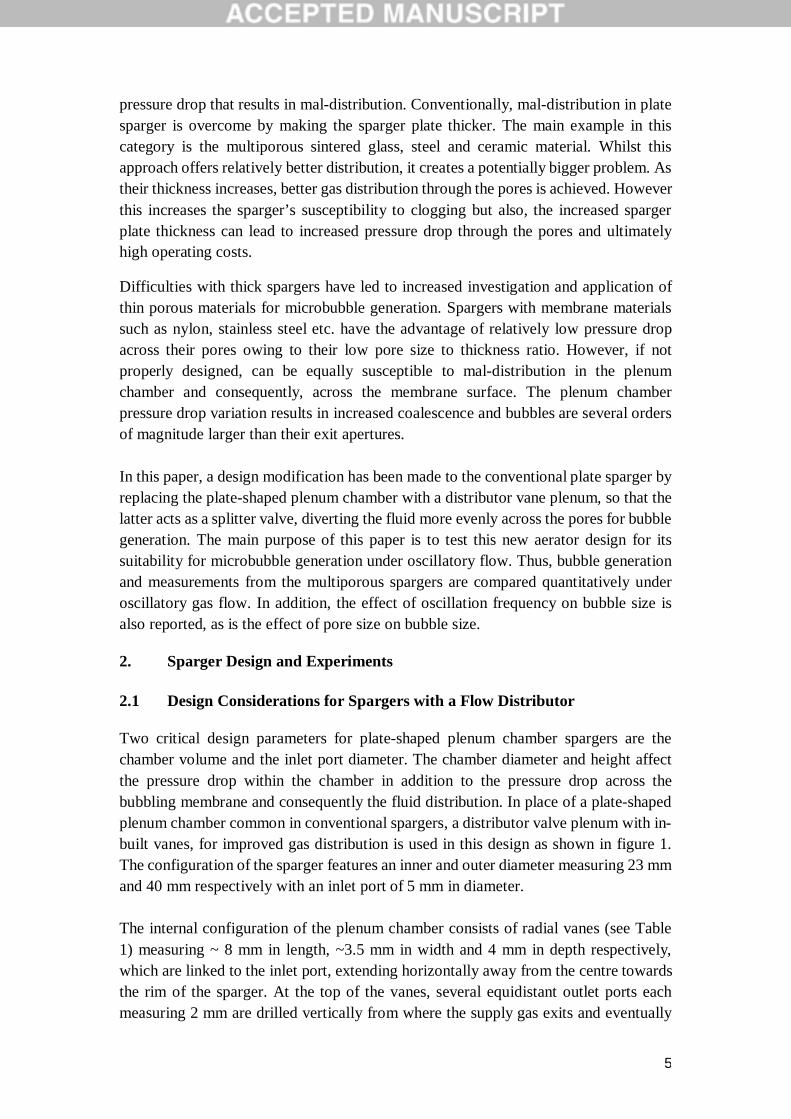
Difficulties with thick spargers have led to increased investigation and application of thin porous materials for microbubble generation. Spargers with membrane materials such as nylon, stainless steel etc. have the advantage of relatively low pressure drop across their pores owing to their low pore size to thickness ratio. However, if not properly designed, can be equally susceptible to mal-distribution in the plenum chamber and consequently, across the membrane surface. The plenum chamber pressure drop variation results in increased coalescence and bubbles are several orders of magnitude larger than their exit apertures. In this paper, a design modification has been made to the conventional plate sparger by replacing the plate-shaped plenum chamber with a distributor vane plenum, so that the latter acts as a splitter valve, diverting the fluid more evenly across the pores for bubble generation. The main purpose of this paper is to test this new aerator design for its suitability for microbubble generation under oscillatory flow. Thus, bubble generation and measurements from the multiporous spargers are compared quantitatively under oscillatory gas flow. In addition, the effect of oscillation frequency on bubble size is also reported, as is the effect of pore size on bubble size.
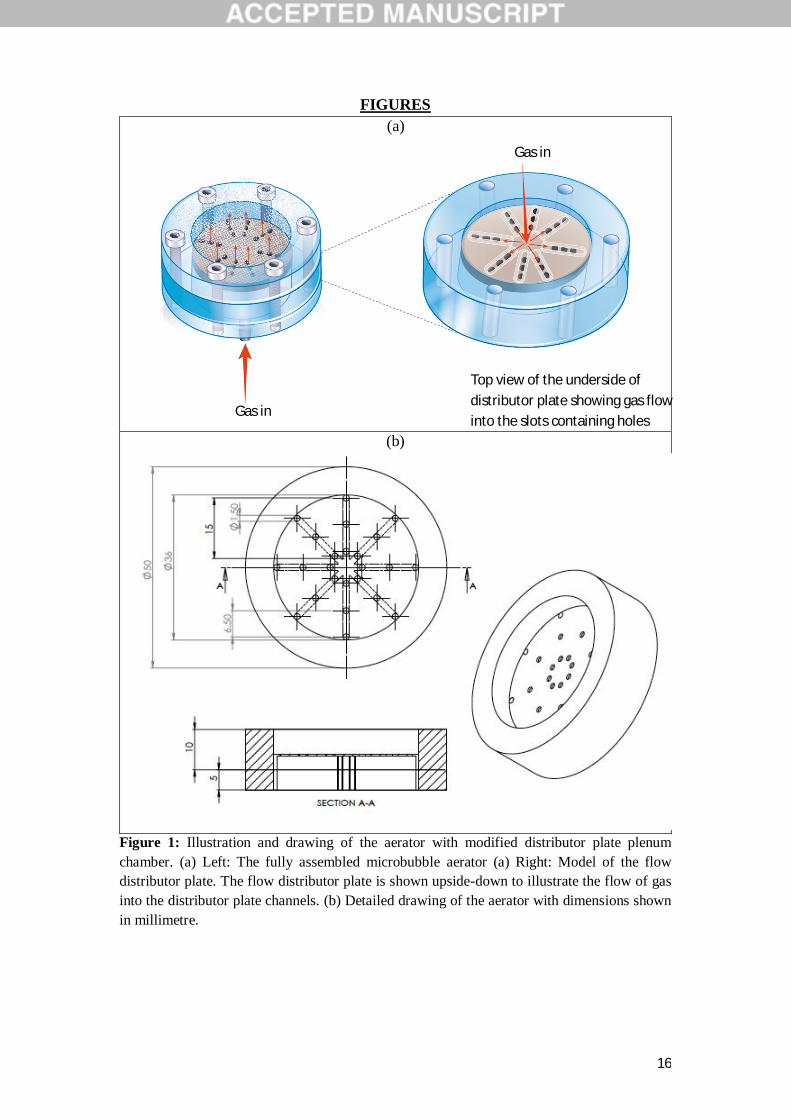
2. Sparger Design and Experiments 2.1 Design Considerations for Spargers with a Flow Distributor Two critical design parameters for plate-shaped plenum chamber spargers are the chamber volume and the inlet port diameter. The chamber diameter and height affect the pressure drop within the chamber in addition to the pressure drop across the bubbling membrane and consequently the fluid distribution. In place of a plate-shaped plenum chamber common in conventional spargers, a distributor valve plenum with in-built vanes, for improved gas distribution is used in this design as shown in figure 1. The configuration of the sparger features an inner and outer diameter measuring 23 mm and 40 mm respectively with an inlet port of 5 mm in diameter. The internal configuration of the plenum chamber consists of radial vanes (see Table 1) measuring ~ 8 mm in length, ~3.5 mm in width and 4 mm in depth respectively, which are linked to the inlet port, extending horizontally away from the centre towards the rim of the sparger. At the top of the vanes, several equidistant outlet ports each measuring 2 mm are drilled vertically from where the supply gas exits and eventually
6
passes through to the porous membrane. The distance from the top of the plenum splitter to the membrane is 5 mm. This circuitry design allows the supplied gas to divert regularly and largely distribute across the membrane. An ‘O’-ring is affixed to the outer rim of the plenum splitter to provide support for the membrane and prevent any leakages. A clamping ring is mounted over the microporous membrane and the whole unit is firmly secured by bolts.
2.2 Computational modeling
The effect of the flow splitter on flow distribution to the porous membrane was investigated using numerical simulations. These computations provided system and operating parameters most suitable for this modified aerator.
Computational geometry and mesh
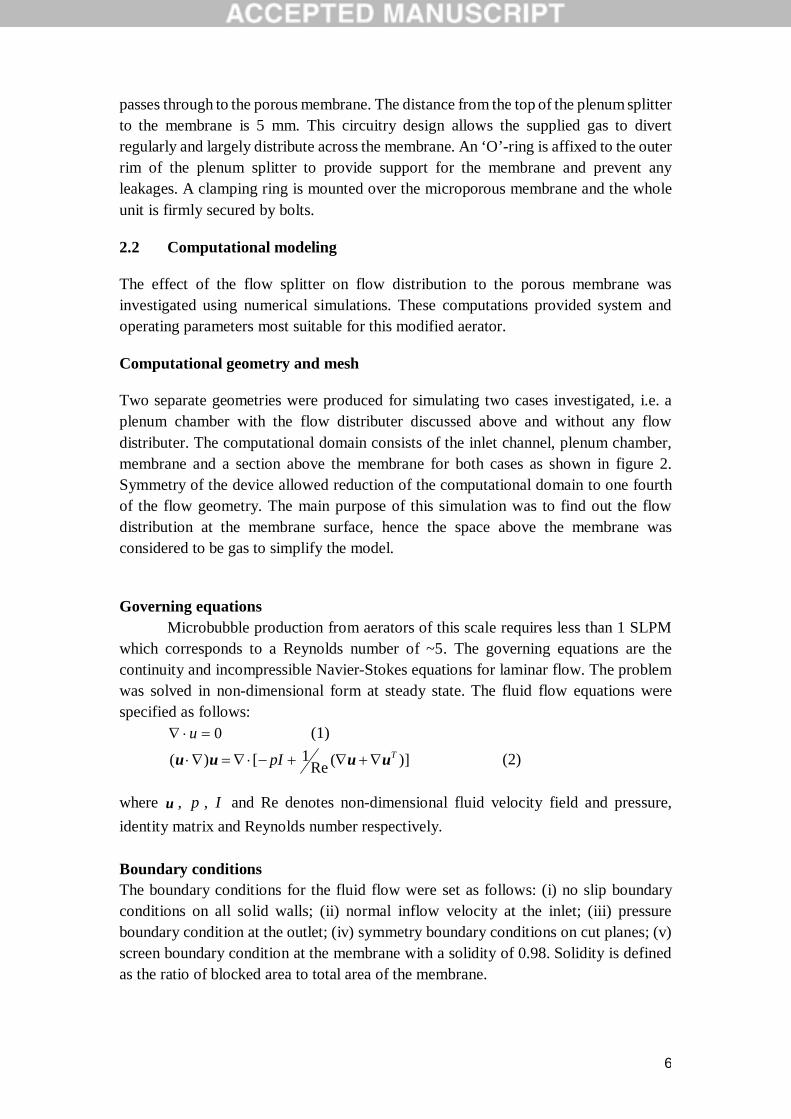
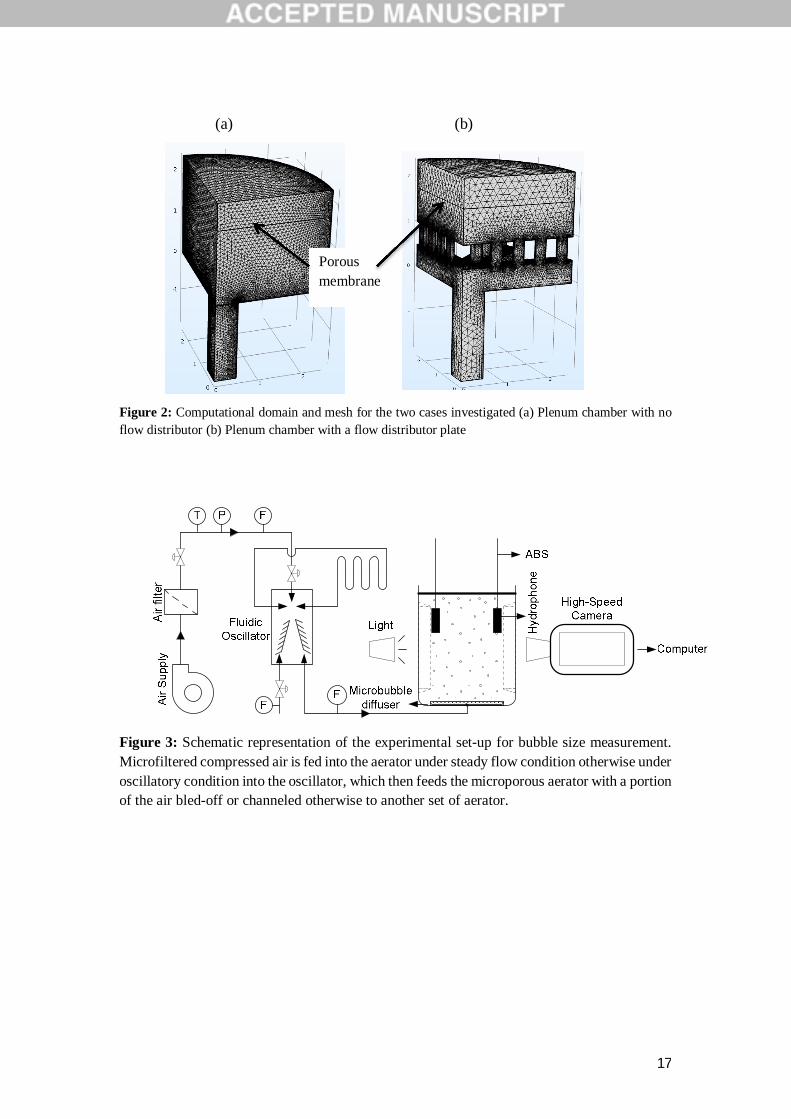
Two separate geometries were produced for simulating two cases investigated, i.e. a plenum chamber with the flow distributer discussed above and without any flow distributer. The computational domain consists of the inlet channel, plenum chamber, membrane and a section above the membrane for both cases as shown in figure 2. Symmetry of the device allowed reduction of the computational domain to one fourth of the flow geometry. The main purpose of this simulation was to find out the flow distribution at the membrane surface, hence the space above the membrane was considered to be gas to simplify the model.
Governing equations
Microbubble production from aerators of this scale requires less than 1 SLPM which corresponds to a Reynolds number of ~5. The governing equations are the continuity and incompressible Navier-Stokes equations for laminar flow. The problem was solved in non-dimensional form at steady state. The fluid flow equations were specified as follows: 0 u (1)
)](Re1[)( TpI uuuu (2)
where u , p , I and Re denotes non-dimensional fluid velocity field and pressure, identity matrix and Reynolds number respectively. Boundary conditions The boundary conditions for the fluid flow were set as follows: (i) no slip boundary conditions on all solid walls; (ii) normal inflow velocity at the inlet; (iii) pressure boundary condition at the outlet; (iv) symmetry boundary conditions on cut planes; (v) screen boundary condition at the membrane with a solidity of 0.98. Solidity is defined as the ratio of blocked area to total area of the membrane.
7
Numerical method The problem was solved using a commercial finite element code - Comsol MultiphysicsTM 5.2. Mesh-independent solutions were obtained with 918321 tetrahedral elements and the simulation time for each case was approximately 10 minutes on an Intel Core i7 64-bit 2.7 GHz processor.
2.3 Bubble Generation Bubble generation was achieved by fluidic oscillation. Microfiltered compressed air, at room temperature (21 oC), was fed into the sparger via the fluidic oscillator. The fluidic oscillator used here is the no-moving part hybrid-synthetic jet actuator (Tesař et al., 2005). It is worthy of mention that this fluidic oscillator with outside dimensions of 10 cm x 5 cm x 5 cm is a pilot scale unit, hence a high operating flowrate (>60 L/min) is required to operate it. This flowrate is significantly higher than the designed sparger capacity; therefore, a significant proportion of the outlet gas stream was bled off downstream before feeding into the aerator unit. A schematic diagram of the set-up is shown in Figure 3. The mode of operation of the fluidic oscillator has been described in detail by several authors (Zimmerman et al., 2008; Tesař and Bandulasena, 2011; Hanotu et al., 2012) as a fluidic amplifier that converts steady fluidic flow into an oscillatory flow. Thus, by passing a stream of continuous air supply through the device, pulsating air is generated from its outlets, which is then fed to a microbubble sparger for microbubble generation. During this experimental study, the membrane pore size was varied from 25 µm to 125 µm in steps of 25 µm as was the feedback loop length (400, 420, 440, 460, 480, 500, 520 and 540 mm) and the operating flowrate to the fluidic oscillator.
2.4 Bubble Characterization
Bubble characterisation was achieved with a Spraytec system (Malvern Instrument, UK), which employs laser diffraction method to measure bubble sizes. The clear glass tank for bubble generation was placed in between both arms of the open bench Spraytec instrument, so that the laser from the transmitter (containing the light source) passed through to the receiver (containing a series of detectors). During measurements, the bubble plumb scatter the laser light and the receiver lens focuses this scattered beam onto a series of detectors that measure the intensity of the scattered light. The Spraytec software then processes the scattering data to calculate the size distribution of bubbles generated.
2.5 Oscillation Frequency Measurements
Altering the feedback loop length, flow rate and sparger pore size can modulate the bubble size generated under oscillatory flow. For bubble production with the fluidic oscillator, oscillation frequency was measured with an accelerometer. Accelerometers are electromechanical devices that measure vibration or acceleration forces. An accelerometer was fitted 100 mm downstream either of the two outlet terminals of the
8
fluidic oscillator and connected to a Lab view interface to display the time domain signal. The recorded signals were analysed using fast furrier transform (FFT) to obtain dominant frequency using Matlab. Measurements were taken at varying operating flow rates and feedback loop lengths during the experiment to obtain a relationship between flowrate, feedback loop length and bubble size.
3 Results and Discussion 3.1 Sparger Performance
The sparger design has been described in Section 2.1. During operation, the sparger is placed at the base of the reactor and the inlet was connected to an air supply (steady or oscillatory). We have opted to use the fluidic oscillator in producing oscillatory flow for bubble generation as several studies (Zimmerman et al., 2009; Zimmerman et al., 20011c; Al-Mashhadani et al., 2011; Hanotu et al., 2014) have reported on its efficiency in producing microbubbles. The air that enters at the bottom of the sparger first gets distributed into the vanes radially and then rises though the vertical channels before exiting as bubbles through the overlaid porous membrane. A uniform distribution is obtained when all the pores are actively generating similar size bubbles. For bubble generation from small pores under continuous flow, Mersmann, (1980) suggests that this state is achieved provided the Weber number -- ratio of inertial forces to surface tension forces -- is equal or greater than 2 as illustrated in the equation (3):
푊푒 = ≥ 2 (3) where Vo is the gas velocity through hole (m/s); do is the membrane pore size (m); 휌 is the gas density (kg/m3); 휎 is the surface tension of liquid (N/m). Under oscillatory flow however, the We value obtained is <1 for the flowrate range tested. This difference is perhaps attributable to the sparger design or a combination of both features- oscillation and sparger design. One major hurdle in achieving a uniform distribution of bubbles is liquid weeping due to the change in the plenum chamber volume, which leads to inactive pores and consequently, mal-distribution. Liquid weeping through pores is largely due to the pressure difference within the plenum chamber and the liquid above the porous membrane surface. Miyahara et al. (1984) reported that the chamber volume plays a significant role in the liquid weeping rate. The plenum chamber pressure has to be higher than the capillary pressure of the pores in order to initiate bubbles formation (Yang et al., 2007). As the bubbles grow, pressure inside the sparger plenum chamber drops. Immediately after bubbles detach from the pores, pressure drop in the sparger plenum chamber and reaches a minimum value. At that moment, if the plenum chamber pressure is substantially less than that of the liquid phase above the sparger surface region, liquid weeping occurs. By compartmentalizing the plenum chamber, the percent free area that results in flow non-uniformity is decreased and therefore the effect of
9
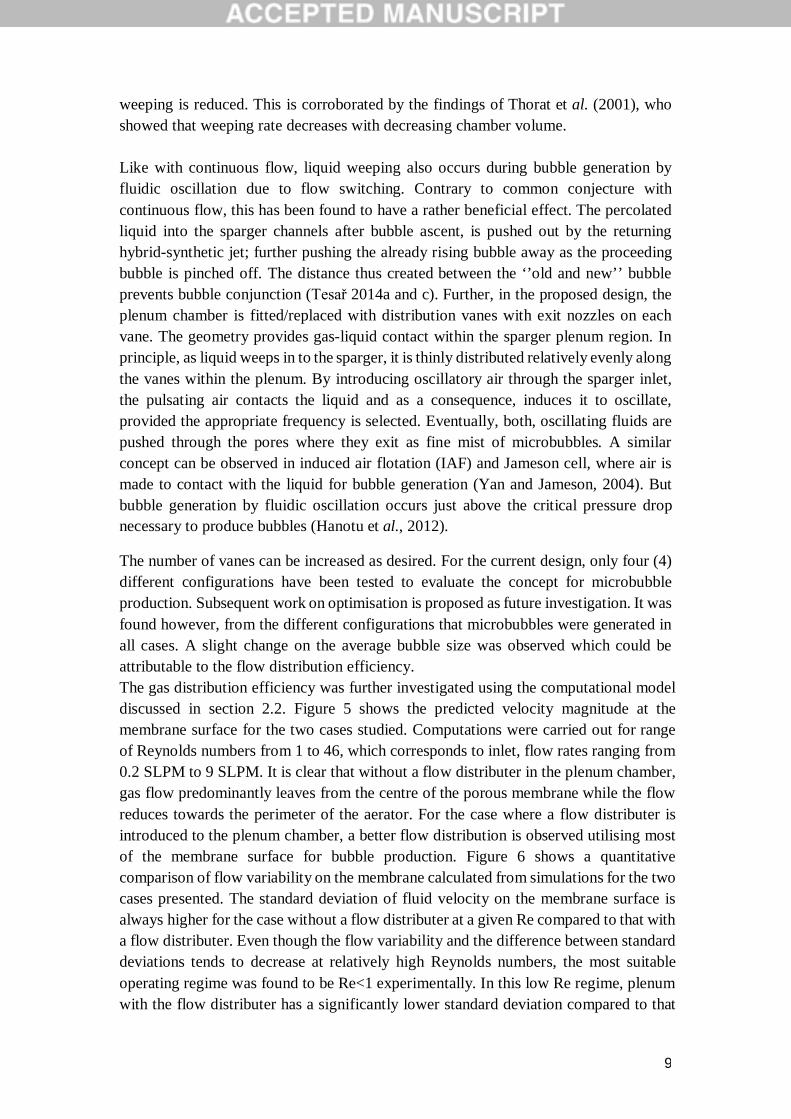
weeping is reduced. This is corroborated by the findings of Thorat et al. (2001), who showed that weeping rate decreases with decreasing chamber volume. Like with continuous flow, liquid weeping also occurs during bubble generation by fluidic oscillation due to flow switching. Contrary to common conjecture with continuous flow, this has been found to have a rather beneficial effect. The percolated liquid into the sparger channels after bubble ascent, is pushed out by the returning hybrid-synthetic jet; further pushing the already rising bubble away as the proceeding bubble is pinched off. The distance thus created between the ‘’old and new’’ bubble prevents bubble conjunction (Tesař 2014a and c). Further, in the proposed design, the plenum chamber is fitted/replaced with distribution vanes with exit nozzles on each vane. The geometry provides gas-liquid contact within the sparger plenum region. In principle, as liquid weeps in to the sparger, it is thinly distributed relatively evenly along the vanes within the plenum. By introducing oscillatory air through the sparger inlet, the pulsating air contacts the liquid and as a consequence, induces it to oscillate, provided the appropriate frequency is selected. Eventually, both, oscillating fluids are pushed through the pores where they exit as fine mist of microbubbles. A similar concept can be observed in induced air flotation (IAF) and Jameson cell, where air is made to contact with the liquid for bubble generation (Yan and Jameson, 2004). But bubble generation by fluidic oscillation occurs just above the critical pressure drop necessary to produce bubbles (Hanotu et al., 2012).
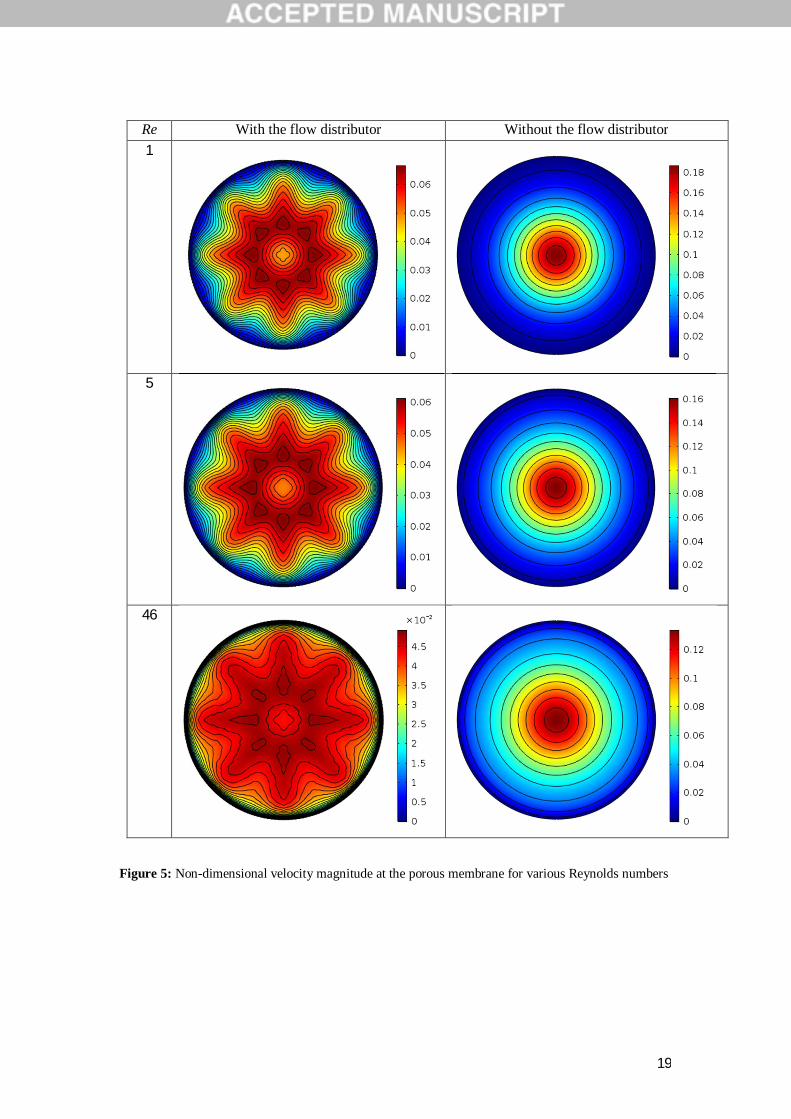
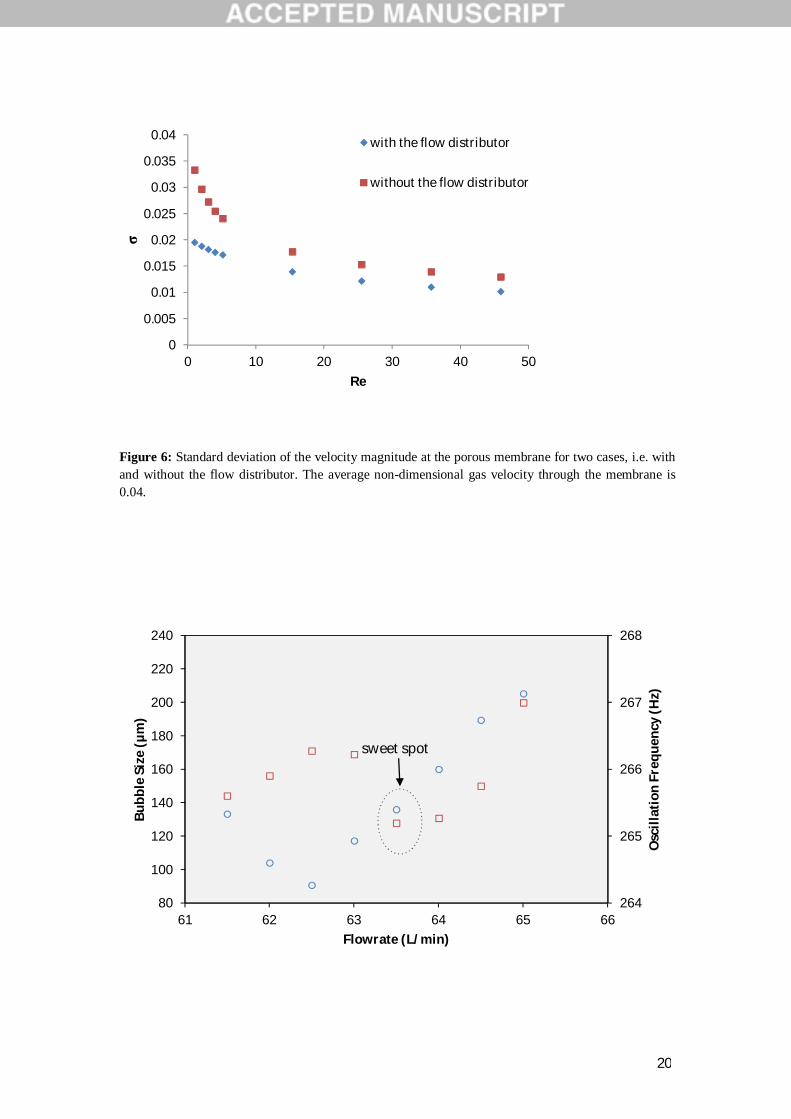
The number of vanes can be increased as desired. For the current design, only four (4) different configurations have been tested to evaluate the concept for microbubble production. Subsequent work on optimisation is proposed as future investigation. It was found however, from the different configurations that microbubbles were generated in all cases. A slight change on the average bubble size was observed which could be attributable to the flow distribution efficiency. The gas distribution efficiency was further investigated using the computational model discussed in section 2.2. Figure 5 shows the predicted velocity magnitude at the membrane surface for the two cases studied. Computations were carried out for range of Reynolds numbers from 1 to 46, which corresponds to inlet, flow rates ranging from 0.2 SLPM to 9 SLPM. It is clear that without a flow distributer in the plenum chamber, gas flow predominantly leaves from the centre of the porous membrane while the flow reduces towards the perimeter of the aerator. For the case where a flow distributer is introduced to the plenum chamber, a better flow distribution is observed utilising most of the membrane surface for bubble production. Figure 6 shows a quantitative comparison of flow variability on the membrane calculated from simulations for the two cases presented. The standard deviation of fluid velocity on the membrane surface is always higher for the case without a flow distributer at a given Re compared to that with a flow distributer. Even though the flow variability and the difference between standard deviations tends to decrease at relatively high Reynolds numbers, the most suitable operating regime was found to be Re<1 experimentally. In this low Re regime, plenum with the flow distributer has a significantly lower standard deviation compared to that
10
of the plenum without a distributer plate which explains the improvement of performance with the new design as seen in the experiments.
3.2 Effect of Gas Flowrate
Figure 7 presents the plot of mean bubble size for bubbles generated under oscillatory flow and at varying superficial gas flow rates. Initially, mean bubble size increased directly proportionate with flowrate as expected but more remarkable, is the drop in oscillation frequency observed with increase in gas flowrate (as soon as bubble generation begins). At this stage, the gas flowrate is the primary factor influencing the mean bubble size. Eventually, with further increase in flow rate a gradual decrease is observed before the mean bubble size dipped to its lowest size (128 µm from a 50 µm pore). Conversely, an increase in oscillation frequency is noted, leading to its intersection with the mean bubble size. This ‘sweet spot’- intersection between mean bubble size and oscillation frequency- is the optimum operating condition for the production of smallest mean bubble size (see gated region on graph). At this stage, despite the increase in gas flowrate, the oscillation frequency appears to be the more influential factor affecting bubble size. Finally, with further increase in gas flowrate, mean bubble size begins to increase again. The bubble growth dependence switches back to supply flowrate. Consequently other factors such as coalescence and wetting force become more dominant.
The increase in bubble size as gas flowrate increases can be explained by the growth mechanism of bubbles from their exit orifices (but also, by the frequency of oscillation). Preliminary studies on traditional non-oscillated sparging have shown substantial growth in bubble size 28 times (Hanotu et al., 2012) and 47 times (Tesař 2013) larger than their exit pores. Typically, bubble production at low flow conditions generally relies on bubble buoyancy, which implies that in order to attain the buoyant force sufficient to overcome the binding wetting force, bubbles tend to grow substantially larger than their exit pores before detachment (usually 1-5 mm with a 50 µm pore). For single pores, bubbles ascend individually after formation without much coalescing. Thus only gas flowrate is the primary cause of growth. However, for multi-porous membranes, a more complex behaviour results. Apart from gas supply, bubble growth pattern can be significantly altered due to coalesce with neighbouring or preceding bubbles during formation and ascent, leading to increase in their effective sizes. This observation is supported by the findings of Miyahara and Hayashino (1995). Bubbles formed from sparger plates experience coalescence just after or as formation occurs depending on the pitch size, giving rise to a log-normal probability distribution of the bubble sizes. Tesař (2014b) observed however, that the increase in size is rather as a result of growth by conjunction (mutual contact between bubbles) soon after pinch-off from their exit pores. This phenomenon is not only due to the low buoyant force of microbubbles but also, the energy dissipated following conjoining leads to the resultant larger bubble wobbling (Tesař, 2014a). Owing to this wobbling, the bubble experiences
11
further deceleration and consequently, prone to new bubbles catching up and conjoining, thus restarting the cycle.
By oscillating the gas, bubble production is achieved as bubbles grow beyond the hemispherical stage --the smallest stage for which bubble production from a pore can occur (Zimmerman et al., 2008) -- but crucially, the intermittent weeping and flushing of liquid from the sparger plenum during oscillatory cycles ensures that the rising microbubble travels sufficiently away from the vicinity of the emerging microbubble due to the inertia of the water, so that both bubbles are prevented from conjoining or coalescing (Tesař, 2014c). The result is the production of relatively uniformly spaced, largely non-coalescent bubbles, ~ 2-3 times greater than their exit pores compared to bubble generation under continuous flow state (Hanotu et al., 2011 and Zimmerman et al., 2011a; Tesar 2014d).
3.3 Effect of Membrane Pore Size (MPS)
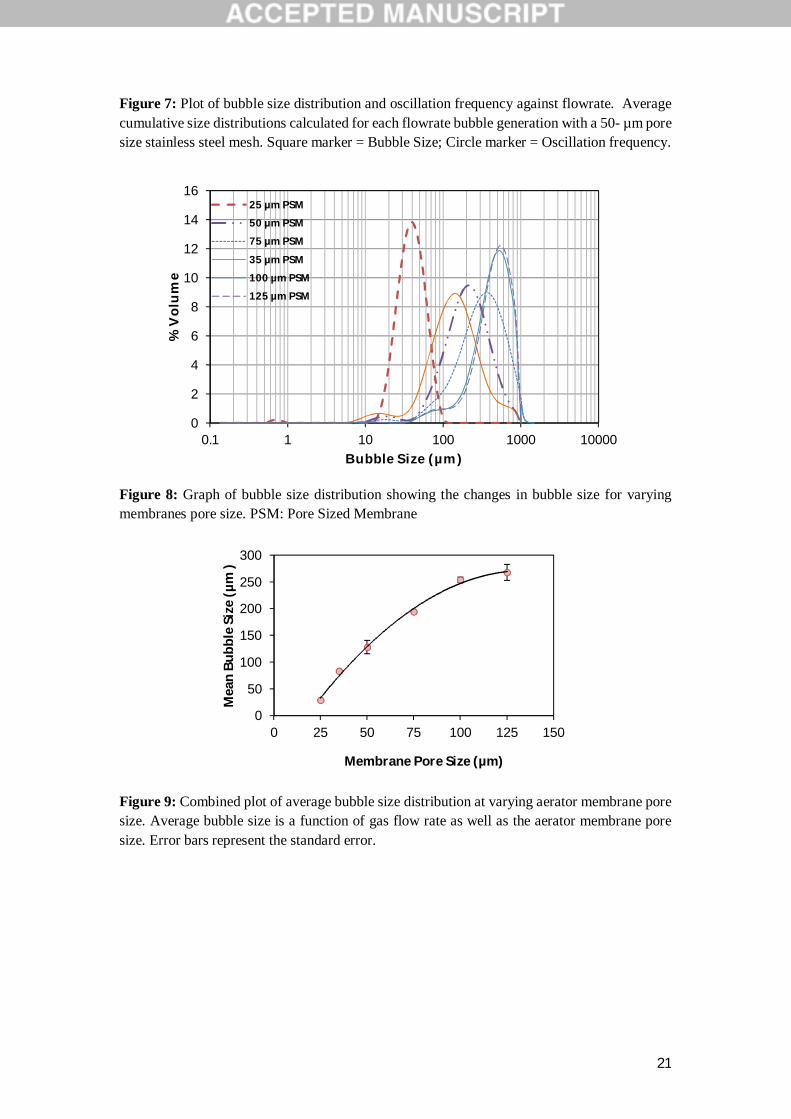
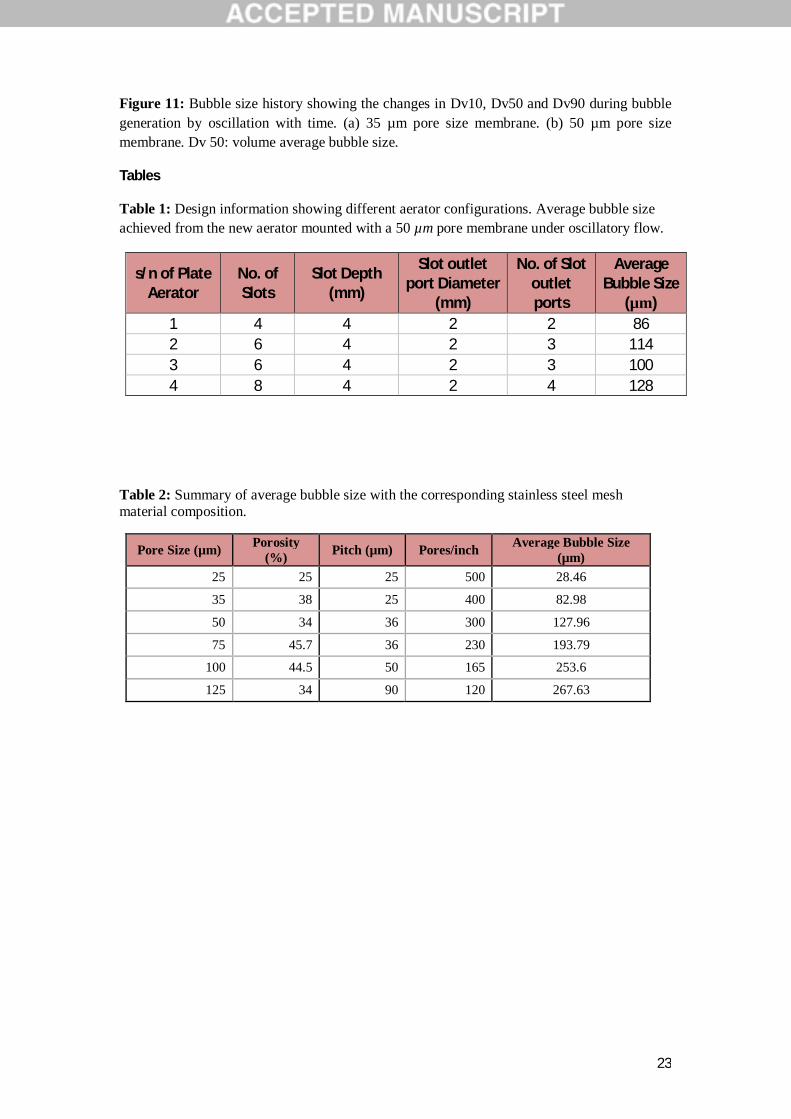
MPS is a key criterion in designing a bubble-driven reactor as it influences parameters such as critical weep velocity, pressure drop and average bubble size. These factors in turn influence the fluid phase flow patterns and consequently the reactor performance. The effect of sparger membrane pore size on bubble size was also investigated and result presented in Figures 8 and 9. The main factor responsible for the increase in mean bubble size as membrane pore size increases is obviously the membrane pore size. Bubble growth varies directly proportionate to the size of their exit pores. Also influential is the membrane pitch, which is the distance between two adjacent pores. The size of the pitch plays a significant role in bubble-bubble interaction during growth and ascent. With an increase in the pore to pitch ratio, the probability of the neighbouring bubbles coalescing or conjoining increases similarly. From Table 2, this ratio decreases with increase in membrane pore size. This further explains the increase in the mean bubble size and the variation in bubble size distribution from 25 to 125 µm pore membrane. Another factor that favours coalescence and as such influences bubble growth is the available free space. Sparger membrane porosity can induce bubble coalescence. Under conditions of high porosity, increased bubble flux is achieved, as is the interaction between bubbles.
3.4 Bubble Development
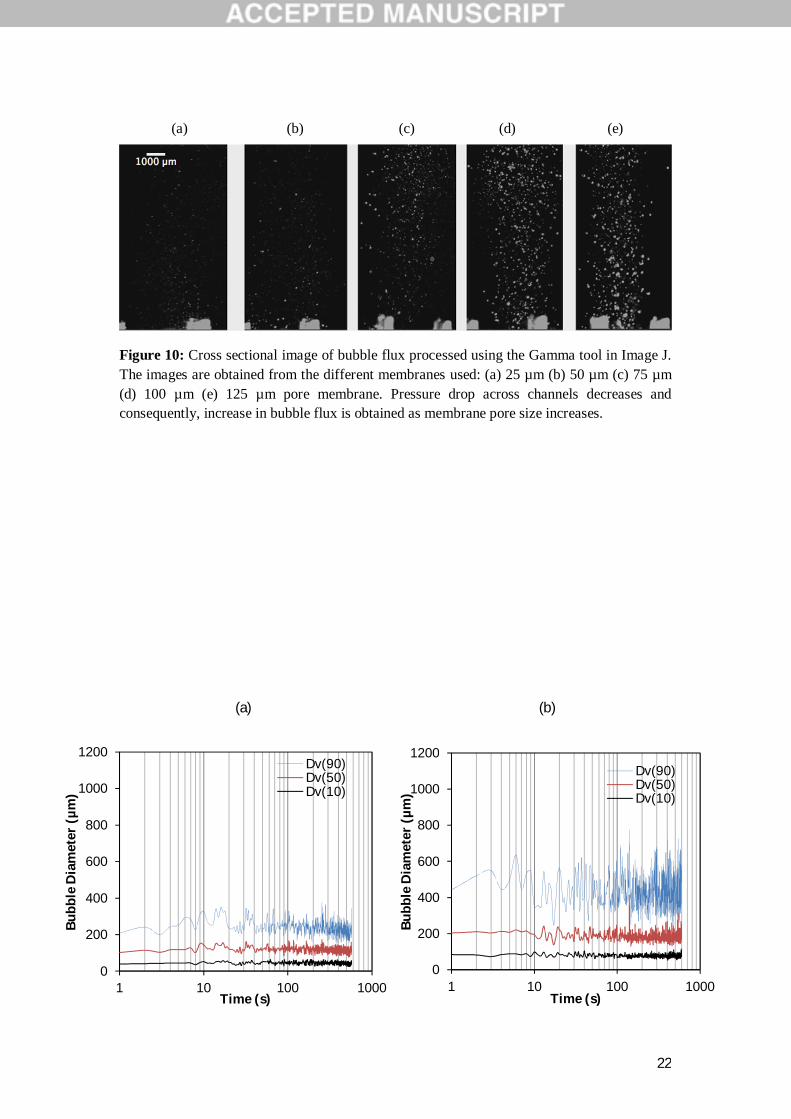
In Figure 10, a processed image of a cross-section of microbubbles is presented for the varying membrane pore sizes investigated. The photograph provides an insight to the porosity, bubble density as well as the varying nature of the bubble sizes produced from the respective membranes.
The variable nature of the bubble plume observed (under oscillation) at high membrane pore size is confirmed by examining the changes in the measured bubble size as a function of time during bubble generation. This is shown in Figure 11 for the generation
12
of microbubble from stainless steel sparger, at an oscillation frequency of ~265 Hz. The significant changes in the measured Dv90 -- size below which 90% of the volume of bubbles exists -- are observed over time, representing significant fluctuations in the coarse bubble fraction. This suggests that bubble coalescence is relatively less controlled under this condition, as the oscillation frequency is less optimal. With a smaller membrane pore, the variation in the Dv90 is considerably less, representing a more uniform bubble plume.
A key parameter in defining the efficiency of a microbubble generator is the bubble size distribution as it is an indicator of the mass transfer and transport efficiency. The smaller the bubbles, the greater the probability of high mass transfer rate achievable. The three phases considered when characterizing bubble size distributions are: pre-bubbling (formation phase), bubbling (stable phase) and post-bubbling stages (dissipation phase). The bubble passage becomes more regular due to the low bubble number. With time, the bubble passage increased, resulting in a relatively coalescent state. The stable phase shows that the rate of bubble production is constant. The average bubble size at this stage is less constant (fluctuates more) than the formation phase, due to bubble coalescence and conjunction. This fluctuation is seen to be higher in the Dv90 for the bubble cloud. 4. Conclusions
The role of sparger design is essential for a homogenous bubbly flow system in a gas-liquid reactor. A sparger with an internal gas distribution system has been designed to address the problem of gas mal-distribution during bubble generation particularly for thin multiporous membrane materials. By reducing the plenum chamber volume through the creation of distributor vanes, dead zones within the sparger plenum chamber common in traditional plate spargers are eliminated, ensuring sparging uniformity. The other benefit with the current plenum configuration is the relative decrease in the pressure drop fluctuations and consequently, reduction in the liquid weeping rate and magnitude into the sparger plenum. These attributes facilitate the formation of uniformly sized, relatively non-coalescent microbubbles. From the bubble characterisation results, it was found that the gas flowrate affect the frequency of oscillation and consequently the bubble size, yielding a fairly monotonic trend. The results obtained also showed that the bubble size can be modulated by adjusting the mesh pore size. There are questions as to the possibility of improving the bubble flux density. These concerns however, remain a task for future investigations as the demand and application of microbubble intensifies.
13
Acknowledgements WZ would like to acknowledge support from the Concept Fund of Yorkshire Forward and the EPSRC (grant no. EP/I019790/1) and K/001329/1. WZ would like to acknowledge the Royal Society for a Brian Mercer Innovation award and the Royal Academy of Engineering for an industrial secondment with AECOM Design Build. JOH would like to thank the University of Sheffield for a doctoral scholarship and the EPSRC Equipment Loan Pool for loan of equipment for research. Helpful discussions and support from Kezhen Ying and Tze Chui are acknowledged.
14
References
Akagi, Y., Okada, K., Kosaka, K., Takahashi, T., 1987. Liquid weeping accompanied by bubble formation at submerged orifices. Industrial & Engineering Chemistry Research 26, 1546-1550. Al-Mashhadani, M.K.H., Bandulasena, H.C.H., Zimmerman, W.B., 2011. CO2 Mass Transfer Induced through an Airlift Loop by a Microbubble Cloud Generated by Fluidic Oscillation. Industrial & Engineering Chemistry Research 51, 1864-1877.
Hanotu, J., Bandulasena, H.C.H., Chiu, T.Y., Zimmerman, W.B., 2013. Oil emulsion separation with fluidic oscillator generated microbubbles. International Journal of Multiphase Flow 56, 119-125. Hanotu, J., Bandulasena, H.C.H., Zimmerman, W.B., 2012. Microflotation performance for algal separation. Biotechnology and Bioengineering 109, 1663-1673. Hanotu, J., Karunakaran, E., Bandulasena, H., Biggs, C., Zimmerman, W.B., 2014. Harvesting and dewatering yeast by microflotation. Biochemical Engineering Journal 82, 174-182.
Kulkarni, A.A., Joshi, J.B., 2005. Bubble Formation and Bubble Rise Velocity in Gas-Liquid Systems: A Review. Industrial & Engineering Chemistry Research 44, 5873-5931. Kulkarni, A.V., Badgandi, S.V., Joshi, J.B., 2009. Design of ring and spider type spargers for bubble column reactor: Experimental measurements and CFD simulation of flow and weeping. Chemical Engineering Research and Design 87, 1612-1630.
Kulkarni, A.V., Joshi, J.B., 2011. Design and selection of sparger for bubble column reactor. Part I: Performance of different spargers. Chemical Engineering Research and Design 89, 1972-1985. Kulkarni, A.V., Joshi, J.B., 2011. Design and selection of sparger for bubble column reactor. Part II: Optimum sparger type and design. Chemical Engineering Research and Design 89, 1986-1995.
Kulkarni, A.V., Roy, S.S., Joshi, J.B., 2007. Pressure and flow distribution in pipe and ring spargers: Experimental measurements and CFD simulation. Chemical Engineering Journal 133, 173-186. Mersmann, A., 1980. Flooding point of liquid/liquid countercurrent columns. Chemical Engineering Technology 52, 933-942. Miyahara, T., Hayashino, T., 1995. Size of Bubbles Generated from Perforated Plates in Non-Newtonian Liquids. Journal of Chemical Engineering of Japan 28, 596-600. Miyahara, T., Iwata, M., Takahashi, T., 1984. Bubble formation pattern with weeping at a submerged orifice. Journal of Chemical Engineering of Japan 17, 592-597. Rehman, F., Medley, G.J.D., Bandulasena, H., Zimmerman, W.B.J., 2015. Fluidic oscillator-mediated microbubble generation to provide cost effective mass transfer and mixing efficiency to the wastewater treatment plants. Environmental Research 137, 32-39. Tesař, V., 2013. Microbubble smallness limited by conjunctions. Chemical Engineering Journal 231, 526-536. Tesař, V., 2014. Mechanisms of fluidic microbubble generation Part I: Growth by
15
multiple conjunctions. Chemical Engineering Science 116, 843-848. Tesař, V., 2014. Microbubble generator excited by fluidic oscillator's third harmonic frequency. Chemical Engineering Research and Design 92, 1603-1615. Tesař, V., 2014. Mechanisms of fluidic microbubble generation Part II: Suppressing the conjunctions. Chemical Engineering Science 116, 849-856. Tesař, V., 2014. Shape oscillation of microbubbles. Chemical Engineering Journal 235, 368-378. Tesař, V., Bandalusena, H., 2011. Bistable diverter valve in microfluidics. Experiments in Fluids 50, 1225-1233. Thorat, B.N., Kulkarni, A.V., Joshi, J.B., 2001. Design of Sieve Plate Spargers for Bubble Columns: Role of Weeping. Chemical Engineering & Technology 24, 815-828. Yan, Y.-d., Jameson, G.J., 2004. Application of the Jameson Cell technology for algae and phosphorus removal from maturation ponds. International Journal of Mineral Processing 73, 23-28.
Yang, G.Q., Du, B., Fan, L.S., 2007. Bubble formation and dynamics in gas - ìliquid - solid fluidization‚ A review. Chemical Engineering Science 62, 2-27.
Zimmerman, W.B., Hewakandamby, B.N., Tesař, V., Bandulasena, H.C.H., Omotowa, O.A., 2009. On the design and simulation of an airlift loop bioreactor with microbubble generation by fluidic oscillation. Food and Bioproducts Processing 87, 215-227. Zimmerman, W.B., Tesař, V., Bandulasena, H.C.H., 2011. Towards energy efficient nanobubble generation with fluidic oscillation. Current Opinion in Colloid & Interface Science 16, 350-356.
Zimmerman, W.B., Tesar, V., Butler, S., Bandulasena, H.C., 2008. Microbubble generation. Recent patents on engineering 2, 1-8.
Zimmerman, W.B., Zandi, M., Hemaka Bandulasena, H.C., Tesař, V., James Gilmour, D., Ying, K., 2011. Design of an airlift loop bioreactor and pilot scales studies with fluidic oscillator induced microbubbles for growth of a microalgae Dunaliella salina. Applied Energy 88, 3357-3369.
16
FIGURES (a)
(b)
Figure 1: Illustration and drawing of the aerator with modified distributor plate plenum chamber. (a) Left: The fully assembled microbubble aerator (a) Right: Model of the flow distributor plate. The flow distributor plate is shown upside-down to illustrate the flow of gas into the distributor plate channels. (b) Detailed drawing of the aerator with dimensions shown in millimetre.
Gas in
Gas in
Top view of the underside of distributor plate showing gas flow into the slots containing holes
17
(a) (b)
Figure 2: Computational domain and mesh for the two cases investigated (a) Plenum chamber with no flow distributor (b) Plenum chamber with a flow distributor plate
Figure 3: Schematic representation of the experimental set-up for bubble size measurement. Microfiltered compressed air is fed into the aerator under steady flow condition otherwise under oscillatory condition into the oscillator, which then feeds the microporous aerator with a portion of the air bled-off or channeled otherwise to another set of aerator.
Porous membrane
18
(a)
(b) (c)
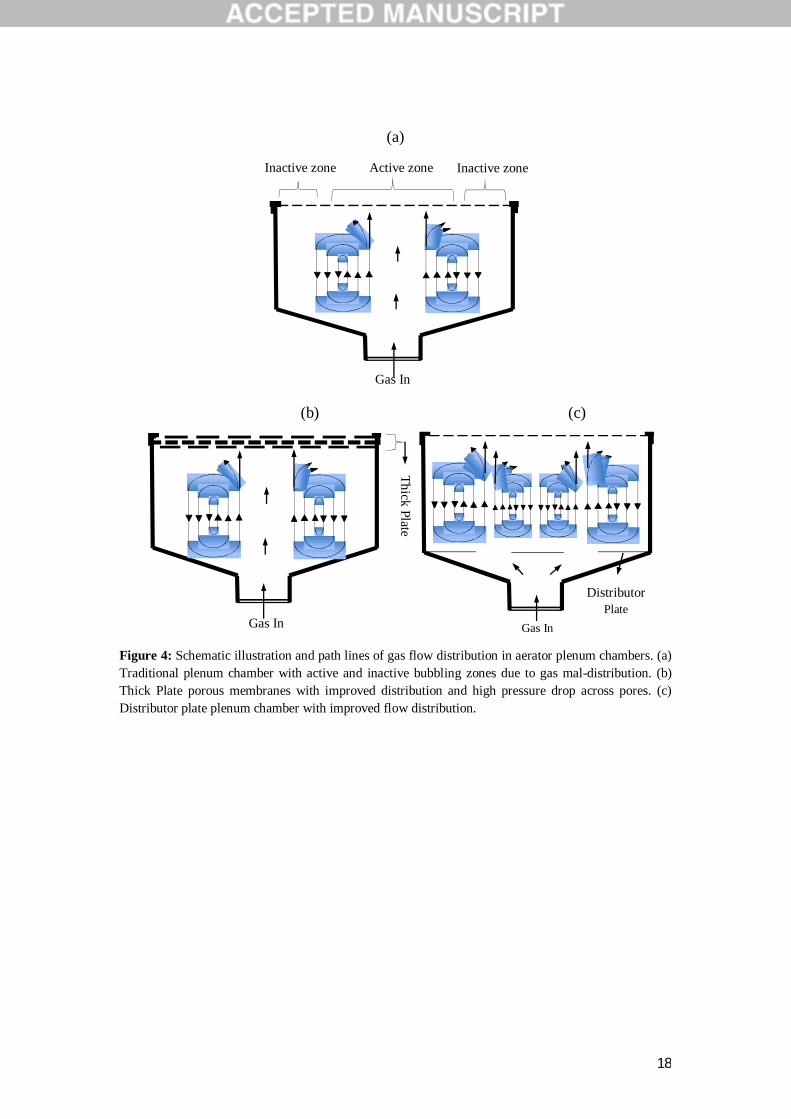
Figure 4: Schematic illustration and path lines of gas flow distribution in aerator plenum chambers. (a) Traditional plenum chamber with active and inactive bubbling zones due to gas mal-distribution. (b) Thick Plate porous membranes with improved distribution and high pressure drop across pores. (c) Distributor plate plenum chamber with improved flow distribution.
Inactive zone Inactive zone Active zone
Gas In Thick Plate
Gas In Gas In
Distributor Plate
19
Re With the flow distributor Without the flow distributor 1
5
46
Figure 5: Non-dimensional velocity magnitude at the porous membrane for various Reynolds numbers
20
Figure 6: Standard deviation of the velocity magnitude at the porous membrane for two cases, i.e. with and without the flow distributor. The average non-dimensional gas velocity through the membrane is 0.04.
0
0.005
0.01
0.015
0.02
0.025
0.03
0.035
0.04
0 10 20 30 40 50
σ
Re
with the flow distributor
without the flow distributor
264
265
266
267
268
80
100
120
140
160
180
200
220
240
61 62 63 64 65 66
Osc
illat
ion
Freq
uenc
y (H
z)
Bubb
le S
ize
(µm
)
Flowrate (L/min)
sweet spot
21
Figure 7: Plot of bubble size distribution and oscillation frequency against flowrate. Average cumulative size distributions calculated for each flowrate bubble generation with a 50- µm pore size stainless steel mesh. Square marker = Bubble Size; Circle marker = Oscillation frequency.
Figure 8: Graph of bubble size distribution showing the changes in bubble size for varying membranes pore size. PSM: Pore Sized Membrane
Figure 9: Combined plot of average bubble size distribution at varying aerator membrane pore size. Average bubble size is a function of gas flow rate as well as the aerator membrane pore size. Error bars represent the standard error.
0
2
4
6
8
10
12
14
16
0.1 1 10 100 1000 10000
% V
olu
me
Bubble Size (µm)
25 µm PSM
50 µm PSM
75 µm PSM
35 µm PSM
100 µm PSM
125 µm PSM
0
50
100
150
200
250
300
0 25 50 75 100 125 150
Mea
n Bu
bble
Siz
e (µ
m)
Membrane Pore Size (µm)
22
(a) (b) (c) (d) (e)
Figure 10: Cross sectional image of bubble flux processed using the Gamma tool in Image J. The images are obtained from the different membranes used: (a) 25 µm (b) 50 µm (c) 75 µm (d) 100 µm (e) 125 µm pore membrane. Pressure drop across channels decreases and consequently, increase in bubble flux is obtained as membrane pore size increases.
(a) (b)
0
200
400
600
800
1000
1200
1 10 100 1000
Bubb
le D
iam
eter
(µm
)
Time (s)
Dv(90)Dv(50)Dv(10)
0
200
400
600
800
1000
1200
1 10 100 1000
Bubb
le D
iam
eter
(µm
)
Time (s)
Dv(90)Dv(50)Dv(10)
23
Figure 11: Bubble size history showing the changes in Dv10, Dv50 and Dv90 during bubble generation by oscillation with time. (a) 35 µm pore size membrane. (b) 50 µm pore size membrane. Dv 50: volume average bubble size.
Tables
Table 1: Design information showing different aerator configurations. Average bubble size achieved from the new aerator mounted with a 50 µm pore membrane under oscillatory flow.
s/n of Plate Aerator
No. of Slots
Slot Depth (mm)
Slot outlet port Diameter
(mm)
No. of Slot outlet ports
Average Bubble Size
(µm) 1 4 4 2 2 86 2 6 4 2 3 114 3 6 4 2 3 100 4 8 4 2 4 128
Table 2: Summary of average bubble size with the corresponding stainless steel mesh material composition.
Pore Size (µm) Porosity (%) Pitch (µm) Pores/inch Average Bubble Size
(µm) 25 25 25 500 28.46
35 38 25 400 82.98
50 34 36 300 127.96
75 45.7 36 230 193.79
100 44.5 50 165 253.6
125 34 90 120 267.63