Embed Size (px)
Citation preview

AERATED ROCK FILTER AS A POLISHING UNIT FOR TOTAL NITROGEN & PHOSPHORUS REMOVAL FROM DOMESTIC WASTEWATER
PART l
DR. RAFIDAH BT. HAMDAN
SHORT TERM GRANT (STG) NO. VOT:0838
UNIVERSITI TUN HUSSEIN ONN MALAYSIA

ABSTRACT
Nitrogen removal from wastewater often requires a highly cost of chemical treatment
to prevent over loading of nutrient in effluent discharge to the surface water body.
Therefore, in this study a pilot-scale vertical aerated rock filter (VARF) was
principally design to remove total nitrogen fiom domestic wastewater. The influence
of aeration flow rate at different filters depth has been studied. Wastewater from
UTHM wastewater treatment plant has been collected to operate the VARF in the
FKAAS Environmental Laboratory. Throughout the experimental period, the VARF
influent and effluent samples have been sampling and analyzed for total nitrogen,
ammoniacal nitrogen (AN), BOD5, COD, TSS, turbidity, DO and pH for to monitor
the filter effectiveness. From this study, it was indicated that most of ammoniacal
nitrogen were converted to nitrate-nitrogen in the highly aerated VARF system.
However, the rate was influenced by the airflow aeration rate. More than 90% of AN
were converted to NO3-N in the system at the filter depth of 0.75m and 1.0 m.
Results fiom this study shows that at the filter depth 0.75m and air flow rate of 10
Llmin has efficiently remove 50.4%, 51.9%, 74.7%, 99.2%, 96.2%, and 97.1% of
COD, BOD5, total nitrogen, ammoniacal nitrogen, TSS, and turbidity respectively
compared to the air flow rate of 20 Llmin at the same filter depth which is remove
42%, 72.1%, 54%, 95.1%, 92.4%, and 83.5% of COD, BOD5, total nitrogen,
ammoniacal nitrogen, TSS, and turbidity respectively. For pH and DO profiles, the
effluent values was found to be higher at the air flow rate of 10 Llmin, which is
range between 8.4 t0~~9.5 and 7.6, 8.3 and 8.5 mg/L respectively. Meanwhile at air
flow rate of 20 Llmin is about 8.2 to 8.4 and 7.3, 8.1 and 7.0 mg/L respectively. By
complying with Malaysian Environment Quality (sewage) Regulations 2009, the
sample treated for all parameters are within permissible limit of standard B.

ABSTRAK ,
Penyingkiran nitrogen daripada air sisa sering memerlukan kos rawatan kimia yang
tinggi untuk mengelakkan lebih muatan nutrien dalam pelepasan efluen ke
permukaan air. Oleh itu, dalam kajian ini penapis berudara menegak berskala kecil
terutamanya direka bentuk untuk menyinghrkan jumlah nitrogen dari air sisa
domestik. Pengaruh kadar aliran pengudaraan pada kedalaman penapis yang berbeza
telah dikaji. Air sisa daripada loji rawatan kurnbahan UTHM telah dikumpulkan
untuk VARF beroperasi di Makmal Alam Sekitar FKAAS. Sepanjang tempoh
eksperimen, sampel influen dan efluen VARF telah disarnpelkan dan dianalisis bagi
jumlah nitrogen, ammonia nitrogen (AN), BOD5, COD, TSS, kekeruhan, DO dan pH . . - ,
untuk memantau keberkesanan penapis. Daripada kajian ini, ia menunjukkan bahawa
kebanyakan ammonia nitrogen telah ditukar kepada nitrate-nitrogen dalam sistem
VARF berudara. Bagaimanapun, kadar tersebut telah dipengaruhi oleh kadar
pengudaraan aliran udara. Lebih daripada 90% AN telah ditukar kepada NO3-N
dalam sistem pada kedalaman penapis 0.75m dan 1 .Om. Hasil daripada kajian ini
menunjukkan bahawa pada kedalaman penapis 0.75m dan kadar aliran udara 10
Llmin telah menyingkirkan 50.4%, 51.9%, 74.7%, 99.2%, 96.2%, dan 97.1%
masing-masing daripada COD, BOD5, jumlah nitrogen, ammonia nitrogen, TSS, dan
kekeruhan berbanding dengan kadar aliran udara 20 Llmin pada kedalaman penapis
yang sama yang menyingkirkan 42%, 72.1%, 54%, 95.1%, 92.4%, dan 83.5%
masing-masing daripada COD, BOD5, jumlah nitrogen, ammonia nitrogen, TSS, dan
kekeruhan. Untuk pH dan DO profil, nilai efluen telah ditemui untuk menjadi lebih
tinggi pada kadar aliran udara 10 Llmin, yang merupakan julat antara 8.4 hingga 9.5
dan 7.6, 8.3 dan 8.5 mgIL masing-masing. Sementara itu, pada kadar aliran udara 20
Llmin adalah antara 8.2 hingga 8.4 dan 7.3, 8.1, dan 7.0 mg/L. Dengan mematuhi

Kualiti Persekitaran Malaysia (Kumbahan) Peraturan 2009, sarnpel yang dirawat
untuk semua parameter adalah dalam had yang dibenarkan standard B.

CONTENTS -
TITLE
DECLARATION
DEDICATION
ACKNOWLEDGEMENT
ABSTRACT
TABLE OF CONTENTS
LIST OF TABLE
LIST OF FIGURES
LIST OF ABBREVIATIONS
LIST OF APPENDICES
CHAPTER 1 INTRODUCTION
1.1 Introduction
1.2 Problem Statement
iii
iv
v
viii
xi
xii
xiv
xv

CHAPTER 2
CHAPTER 3
Objective of Study
Scope of Study
Limitation of Work
LITERATURE REVIEW
Water
Forms of Nitrogen
2.2.1 Nitrification Process
2.2.2 Denitrification Process
Aeration System
2.3.1 Diffused Air Aeration
2.3.1.1 Diffuser Performance
Oxygen Dispersion Efficiency and Mixing
Dissolved Oxygen
Wastewater and Composition
Domestic Wastewater
Characteristics of Domestic Wastewater
2.8.1 Physical Characteristics
2.8.2 Chemical Characteristics
2.8.2 Biological Characteristics
Wastewater Treatment Process
MATERIALS AND METHODS
Introduction
:VARF Pilot-Scale System

3.3 Domestic Wastewater Sample Collection 4 1
3.4 Materials and Methods 4 1
3.5 Wastewater Sampling and Analyses 42-43
CHAPTER 4 RESULT AND DATA ANALYSIS
4.1 Introduction
4.2 Result and Analysis
4.3 Biochemical Oxygen Demand (BOD) Removal 48
4.4 Nitrogen Removal 49
4.4.1 Total Nitrogen (NTot) Removal , 49-50
4.4.2 Ammonia Nitrogen (AN) Removal 50-54
4.5 Total Suspended Solis (TSS) Removal 54-55
4.6 pH Profile 55-56
CHAPTER 5 CONCLUSION AND RECOMMENDATION
5.1 Conclusion
5.2 Recommendation
REFERENCES
APPENDICES

LIST OF TABLES
TABLE NO. TITLE PAGE
Unoxidized and Oxidized Nitrogen 6
Effects of Various Treatment Processes on 7
Nitrogen Compounds
Basic Physiological and Structural Features 11
of Nitvosomonas and Nitrobactev
Efficiency of Various Aeration System in Kwhlkg 14
Advantages and Disadvantages of Coarse Bubble 16
Diffuser
Advantages and Disadvantages of Fine Bubble 16
Diffuser
DO Concentration and Nitrification Achieved 20
Physical, Chemical, and Biological Characteristics 21
of Wastewater and Their Sources
Composition of Human Faeces and Urine 23
Typical Composition of Untreated Domestic 24
Wastewater
Important of Pollutants in Wastewater 3 2
The VARF Characteristics Design Data and 40
:Operating Conditions

3.2 Wastewater Sampling Parameters, Standard 42
Method and Frequency ,
4.1 (a) Result of Sample at Flow Rate 10 Llmin 46
4.1 (b) Result of Sample at Flow Rate 20 Llmin 47
4.2 (a) OTE for Air Flow Rate of 10 Llmin 54
4.2 (b) OTE for Air Flow Rate of 20 Llmin 54

LIST OF FIGURES
FIGURE NO. TITLE PAGE
Nitrogen Cycle
Coarse Bubble Diffuser
Fine Bubble Diffuser
Wastewater Treatment Process
Research Flow Chart
Schematic Diagram of the Pilot- Scale of
Vertical Aerated Rock Filter
Set-up of the VARF pilot-scale at the laboratory
Untreated Domestic Wastewater
Effluent before and after VARF Treatment
BOD5 Concentrations and Removal Efficiency
N T ~ ~ Concentrations and Removal Efficiency
Ammonia-N Concentrations and Removal
Efficiency
Nitrate-N Concentrations
Dissolved Oxygen Profiles
SS Concentrations and Removal Efficiency
pH Profiles

LIST OF ABBREVIATIONS
AN
BOD5
COD
DO
L
min
mg
ml
NO2-N
NO3-N
N~ot
OTE
Q TSS
TKN
VARF
Ammonia Nitrogen
5-days Biochemical Oxygen Demand
Chemical Oxygen Demand
Dissolved Oxygen
Liter
Meter
Minit
Miligram
Milimeter
Nitrite-Nitrogen
Nitrate-Nitrogen
Total Nitrogen
Oxygen Transfer Efficiency
Flow rate
Total Suspended Solid
Total Kjeldhal Nitrogen
Vertical Aerated Rock Filter

LIST OF APPENDICES
Calculation of optimum air flow rate due to 62
Required retention time
Compressor capacity and Oxygen Transfer 63-65
Efficiency
Table of Acceptable Conditions of Sewage 66
Discharge of Standards A and B (Malaysian
Environmental Quality (Sewage) Regulation (2009)

INTRODUCTION
1.1 Introduction
Water is the most important to all living things in the world. There are many uses of
water in daily life including for drinking, washing, cleaning, cooking, and plant.
Human need clean and fresh water to survive the life. The quality of water is very
important to be cared in order to supply clean and fresh water for human. The water
from toilet, sinks, washing machines, showers, industrial processes and agriculture
liquid waste disposed from pipe or sewer was called wastewater or sewage. It contain
of wastewater pollutant such as feces or urine. Therefore, the wastewater needs to be
treated before it can be discharged into rivers or lakes.
Wastewater treatment is a multi-stage process to renovate wastewater before
it can be used. The goal is to reduce or remove organic matter or existing
contaminants from wastewater. There are three major stages involved in domestic
wastewater treatment. It is primary treatment, secondary treatment and tertiary
treatment. In primary treatment it is including large tanks commonly called "pre-
settling basins" or "primary clarifiers", large rakes and skimming devices.
Secondary treatment is the process after primary treatment and it is biological
treatment. The last process is tertiary treatment and it was include advanced
wastewater treatment before discharge to the receiving body such as river and lake.
(Davis and Convell, 2008).

Wastewater may contain high levels of the nutrients such as nitrogen and
phosphorus, also called eutrophication which can encourage the overgrowth of
weeds, algae, and cyanobacteria (blue-green algae). This may cause an algal bloom
and may produce toxins that contaminate in drinking water. Therefore, the different
treatment processes are required such as biological process to remove nitrogen and
phosphorus (Wikipedia). There are also physical and chemical processes which can
remove nitrogen especially ammonia.
Aeration introduces air into a liquid, providing an aerobic environment for
microbial degradation of organic matter. The increased organic loading on
wastewater treatment plants using activated sludge process has necessitated changes
in aeration systems to increase the oxygenation efficiencies in aeration tanks. The
role of aeration in the activated sludge process is to provide oxygen to the
microorganisms as they assimilate the organic carbon compounds and digest a
portion of them to carbon dioxide and water, Sulfate and Nitrate compounds.
Therefore, aeration is one of the most elemental techniques frequently employed in
the improvement of the physical and chemical characteristics of water.
1.2 Problem Statement
During the last few decades, the importance of nutrient removal has increased as a
result of the necessity to avoid eutrophication of water bodies receiving untreated
wastewater and the effluent of wastewater treatment plant. Nitrogen can deplete
dissolved oxygen in receiving waters, stimulate aquatic plant growth, exhibit toxicity
toward aquatic life, present a public health hazard, and affect the suitability of
wastewater for reuse purposes in various forms.
Demand of low-cost technology for treating high nutrient wastewater is
increasing due to complex processes and expensive of conventional treatment for
nutrient removal. From previous study, it has shown that it is not always favorable to
treat different wastewaters together in one treatment work. Therefore, reactors for the
effective and economic treatment of split flows are required which are operated
either as a pre-treatment stage, before discharge to the sewer or rivers, or as a
treatment stage for process wastewaters.

To comply with the latest Malaysian effluent discharge regulation post
process units are needed. For this purpose, VARF reactor appears to be suitable
method in removing nutrients from the biological process which is more effective
than physicochemical treatments and thus has been used more often to achieve
nitrogen removal from domestic wastewaters (Khin and Annachhatre, 2004). Besides
that, the elimination of dissolved pollutants the suspended particles will be reduced
evidently.
1.3 Objective of Study
The objective of this research is to study the effects of aeration in a pilot-scale VARF
system in removing nitrogen from domestic wastewater.
1.4 Scope of Study
The scopes for this research are as the following:
a) To construct a pilot-scale VARF.
b) To study the performance of the VARF for nitrogen removal at different rate of
aeration and different filter depths (10 Llmin and 20 Llmin; 0.5m, 0.75m and
1 .Om).
c) To monitor the VARF performance by analyzed the selected parameters
including COD, BODS, Nitrate and Nitrite, Ammonia Nitrogen, Suspended
Solid, Dissolved Oxygen, pH, Turbidity and Total Nitrogen.
1.5 Limitation of Work
The sample is taken fiom domestic wastewater treatment plant at Tun Fatimah
Residential College in UTHM. This study is to focus on aeration rate at different

depth based on a pilot scale vertical aerated rock filter and to monitor the parameter
of wastewater.

CHAPTER 2
LITERATURE REVIEW
2.1 Water
Water is essential element of earth's natural environment. Without water there is no
life and industry could not operate. Different with other raw materials, there are no
materials that can be used to replace the water (Ruslan Hassan, 1988). Water is a
liquid and can be solid such ice at once level of temperature and gases when
evaporated. Hydrological water traces the successive changes of water as it moves
from the ocean through precipitation, transpiration, infiltration, run-off and back to
the sea.
There are many type of water, such as surface water and groundwater.
Surface water includes river, sea, rainfall and lake. Surface water generally are
replenished naturally by precipitation and lost through discharge to evaporation and
subsurface seepage into groundwater. Groundwater is water that located beneath the
ground surface in soil pore spaces and in the fractures of rock formations.
Other than that, water is used for drinlung water and it is essential for human,
animal, plants to survive the life. Clean and fresh water are important for avoid from
diseases. Besides that, water also uses for human activity daily for example washing,
cooking, shower, industrial and others. The water must be had a treatment process to
get the good quality of water before use.

2.2 Forms of Nitrogen
Nitrogen can occur in many forms in wastewater and undergo numerous
transformations throughout the wastewater treatment process. Although, nitrogen is
an essential nutrient for plant and algae growth, wastewater effluent containing too
much nitrogen can have adverse effects on receiving waters. In order to control
nitrogen concentrations in wastewater effluent, it is vital to understand the forms of
nitrogen found in wastewater influent and at various stages in the wastewater
treatment process.
Nitrogen is found in wastewater in two basic forms, they are unoxidized and
oxidized nitrogen as shown in Table 2.1 below.
Table 2.1 : Unoxidized and Oxidized Nitrogen
Nitrogen typically enters a wastewater treatment plant as unoxidized nitrogen,
in the form of organic nitrogen (Org-N) and ammonia. The combination of ammonia
and Org-N concentrations is reported as total Kjeldahl nitrogen (TKN).
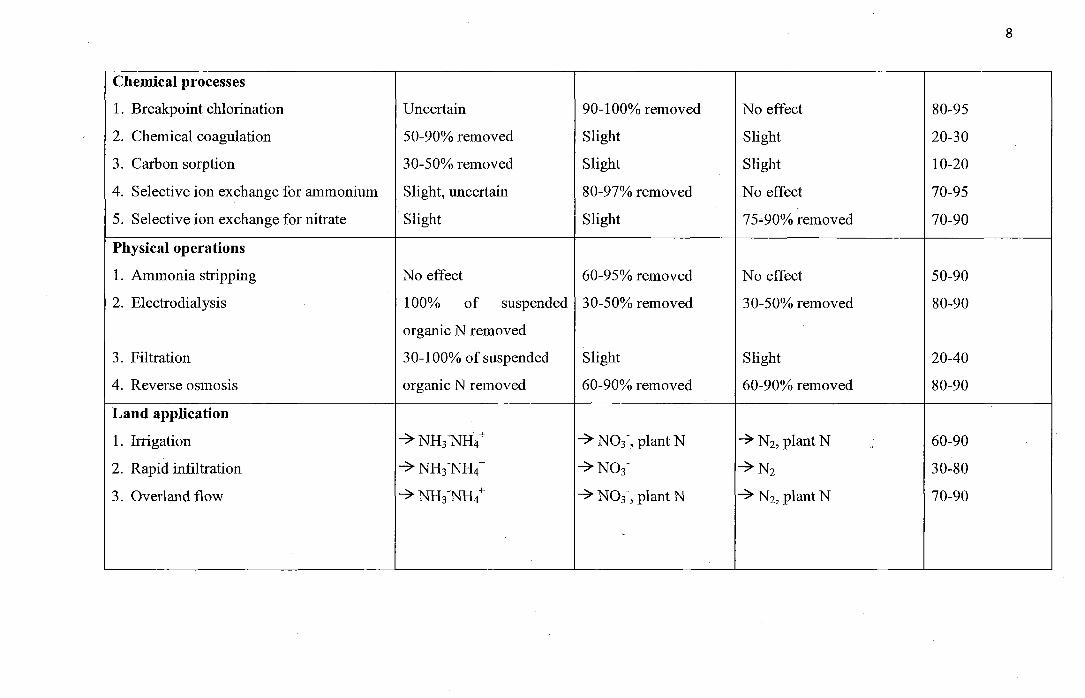
Many processes have been explored for the removal of nitrogen from water
and wastewater. Those applied to wastewater are reported in Table 2.2. The four
principal methods found feasible are biological nitrification, followed by
denitrification, air stripping of ammonia at high pH, removal of nitrate or ammonia
by ion exchange, and breakpoint chlorination. Only two methods will be discussed in
depth in this review. They are nitrification and denitrification.
Unoxidized Forms
Ammonia (NH3)
Organic nitrogen (Org-N)
Nitrogen gas (N2)
Oxidized Forms
Nitrite (NO2)
Nitrate (NO3)
Nitrous oxide (320)

Table 2.2: Effect of Various Treatment Processes on Nitrogen Compounds
Treatment operations and processes
Conventional treatment
1. Primary
2. Secondary
-- -
Biological processes
1. Bacterial assimilation
2. Denitrification
3. Harvesting of algae
4. Nitrification
5. Oxidation ponds
Removal of total
nitrogen
entering
process, %
5-10
10-30
30-70
70-95
50-80
5-20
20-90
Nitrogen compound
Organic nitrogen
10-20% removed
15-50% removed
urea + N H ~ N H ~ ~
No effect
No effect
Partial transformation to
NH~T\TH~+
10-50
Partial transformation to
NH~-NH~+
NH3- N H ~ +
No effect
<lo% removed
40-70% removed
No effect
Cells
* NO3-
Partial removal by
stripping
NO3-
No effect
Slight
Slight
80-90% removed
* Cells
No effect
Partial removal by
nitrification-denitrification
Chemical processes
1. Breakpoint chlorination
2. Chemical coagulation
3. Carbon sorption
4. Selective ion exchange for ammonium
5. Selective ion exchange for nitrate
Physical operations
1 . Ammonia stripping
2. Electrodialysis
3. Filtration
4. Reverse osmosis
Land application
1. Irrigation
2. Rapid infiltration
3. Overland flow
Uncertain
50-90% removed
30-50% removed
Slight, uncertain
Slight
No effect
100% of suspended
organic N removed
30-1 00% of suspended
organic N removed
NH~T\TH~+
N H ~ N H ~ '
NH~-NH~+
90- 100% removed
Slight
Slight
80-97% removed
Slight
60-95% removed
30-50% removed
Slight
60-90% removed
NO3-, plant N
+ NO3-
+ NO3', plant N
No effect
Slight
Slight
No effect
75-90% removed
No effect
30-50% removed
Slight
60-90% removed
N2, plant N
j N2
Nz, plant N
80-95
20-30
10-20
70-95
70-90
50-90
80-90
20-40
80-90
60-90
30-80
70-90

Nitrification alone will remove ammonia-nitrogen, but the resulting nitrite- and
nitrate-nitrogen normally will not be removed and can serve as nutrients for
undesirable algal growths in streams and lakes. However, nitrification can help to
eliminate the problems of ammonia toxicity to fish and will minimize excessive
oxygen demand exerted by ammonia nitrogen in streams.
Nitrification is the biological formation of nitrite-N (NO2-) or NO3-
from NH~' (Alexander, 1977). This process naturally occurs in the environment,
where it is carried out by specialized bacteria. Furthermore, this process requires
oxygen, hence it will use up the oxygen needed by other organism.
Figure 2.1 : Nitrogen Cycle
Figure 2.1 above shows a nitrogen cycle (Sawyer and McCarty, 1978).
Biological nitrification is the conversion or oxidation of ammonium ions to nitrite
ions and then to nitrate ions. During the oxidation of ammonium ions and nitrite ions,
oxygen is added to the ions by a unique group of organisms, the nitrifying bacteria.
Nitrification occurs in nature and in activated sludge processes and also
occurs in aerobic regions of the water column, soil-water interface, and root zone
(Reddy and D'Angelo, 1997). Dissolved oxygen levels < 1-2 mg/L in water

substantially reduces nitrification (Hammer and Knight, 1994). Nitrification in soil is
especially important in nature, because nitrogen in absorbed by plants as a nutrient in
the form of nitrate ions. Meanwhile, nitrification in water is of concern in wastewater
treatment, because nitrification may be required for regulatory purposes or may
contribute to operational problems. Domestic wastewater contains large amounts of
organic wastes, so the wastewater will have a high ammonia concentration.
Generally, there are two bacterial species involved in nitrification process. During
the nitrification process, ammonia concentrations are reduced as a result of the
conversion of ammonia to nitrite and nitrate.
In nitrification process, ammonia nitrogen is converted to nitrate utilizing two
purely aerobic autotrophs, they are Nitrosomonas and Nitrobacter bacteria. Both
bacteria are instrumental in completing nitrification. The nitrification reaction in a
two-step process as follows:
Step 1:
Nitrosomonas bacteria, which are purely aerobic autotrophs, convert ammonia
nitrogen to nitrite. During the conversion process these bacteria consume large
quantities of Dissolved Oxygen (DO) and reduce alkalinity.
Nitrosomonas NH~' + 1. 502 *- 2 ~ ' + H20 + NO2-
Step 2:
Nitrobacter bacteria, which are also purely aerobic autotrophs, convert the nitrite to
nitrate. Once again, the vital element needed for this conversion to occur is DO and
the conversion process further reduces alkalinity. Nitrobacter have a faster growth
rate than Nitrosomonos, therefore, the conversion to nitrate occurs rapidly.
Nitrobacter NO2- + 0.502 -> N03-

The overall oxidation of ammonium is obtained by adding equations (2.1) and (2.2),
thereby giving Equation (2.3):
The nitrification process produces acid [H+], as shown in Equation 2.3. This acid
formation lowers the pH of the biological population in the treatment system, and
can cause reduction of the growth rate of nitrifying bacteria. Moreover, the
nitrification reaction consumes 7.2 mg/L of bicarbonate alkalinity as CaC03 for each
mg/L of ammonia nitrogen oxidized. Thus, wastewaters with low alkalinity require
the addition of alkalinity to support uninhibited nitrification. In addition to pH,
nitrification is very sensitive to temperature, the DO concentration, and toxic
materials.
Table 2.3: Basic Physiological and Structural Features of Nitvosomonas and
Nitvobactev
Features
Carbon sources
Cell shape
Cell size, pm
Habitat
Motility
Oxygen requirement
pH growth range
Reproduction mode
Generation time
Temperature growth range
Sludge yield
Cytomembranes
Nitrosomonas
Inorganic (C02)
Coccus (spherical)
0.5 to 1.5
Soil and water
Yes
Strict aerobe
5.8 to 8.5
Binary fission
8 to 3 6 hours
5 to 30°C
0.04 to 0.13 pound d of
cells per # of NH~'
oxidized
Present
Nitrobacter
Inorganic (C02)
Bacillus (rod-shaped)
0.5 x 1.0
Soil and water
No
Strict aerobe
6.5 to 8.5
Budding
12 to 60 hours
5O to 40°C
0.02 to 0.07 pound of
cells per # of N 0 i
oxidized
Present

2.2.2 Denitrification Process
Biological denitrification is an anaerobic process by facultative heterotrophic
bacteria wherein the nitrite ion is the hydrogen ion acceptor in the electron transport
system. Facultative anaerobes make up approximately 80% of the bacteria withn an
activated sludge process. The nitrate ion permits the microbial cell to maintain
aerobic metabolism in the absence of fiee oxygen. In the process, nitrates are reduced
to nitrogen gas and carbon compounds are oxidized.
Denitrification occurs when oxygen levels are depleted and nitrate becomes
the primary oxygen source for microorganisms. So, the process is performed under
anoxic conditions, which are when the dissolved oxygen concentration is less than
0.5 mg/L, ideally less than 0.2. When bacteria break apart nitrate (NO3-) to gain the
oxygen (02), the nitrate is reduced to nitrous oxide (N20), and in turn, nitrogen gas
(N2). Since nitrogen gas has low water solubility, it escapes into the atmosphere as
gas bubbles. Denitrification must follow the nitrification process in order to achieve
total nitrogen removal.
Nitrate EdudDn : Nitrogen Gas f NO, 1 4 1 I --.-..------- +enRr"fgc&ion---------------- I
In denitrification process, nitrate, the form of nitrogen that results fiom the
completion of the nitrification process, is converted to nitrogen gas, utilizing
facultative heterotrophic bacteria. The process of denitrification occurs under anoxic
conditions as follows:
(Nitrate) NO3-N + Nitrogen Gas (N2) + Oxygen (02) + Alkalinity (HC03-)

2.3 Aeration System
Aeration is the process by which the area of contact between water and air is
increased, either by natural or by mechanical devices. Aeration is the most important
operation in the treatment process to provide oxygenation and mixing. Aeration
systems are among the most energy intensive operations in wastewater treatment
systems, consuming between 50 - 90% of the total energy costs of typical municipal
installations (Wesner et al., 1977).
Wastewater treatment plants utilizing biological treatment need to aerate the
wastewater and aeration serves two primary purposes consist of:
i. Oxygen is added to the wastewater which is critical to the microorganisms in
the biological treatment system and . . 11. Mixing of the wastewater, which is contains the food or organic load, and the
microorganisms or the mixed liquor suspended solids (MLSS), also improves
both the dispersion of the organic load in the system and facilitates contact
between the microorganisms and the food.
The others purposes of aeration is to improve their physical and chemical
characteristics, to remove or reduction of objectionable taste and odor and to
precipitate inorganic contaminants such as iron and manganese while the functions of
aeration is oxygenation of the mixed liquor, flocculation of the colloids in sewage
influent and suspension of activated sludge floc.
In wastewater treatment, the purpose of aeration is to ensure continued
aerobic conditions for the microorganism to degrade the organic matters. The
efficiency of aeration systems can be measured in different ways. Different aeration
systems have different efficiency (Metcalf and Eddy, 2004). The following Table 2.4
shows the efficiency of various aeration systems adapted to give values in kilowatt-
hour per kilogram of oxygen.

Table 2.4: Efficiency of Various Aeration Systems in kWH/kg
I Combination systems I
Aeration System
Mechanical aeration systems
Brush aerators surface aeration
Slow speed surface
High speed splash surface aeration
Induced surface aeration
kWH/kg
0.47-0.66
0.47-0.55
0.51-0.66
1.10-1.64
I Jets (pumps with compressors) I 0.47-0.82
I Submerged turbine
Diffused Aeration, Coarse Bubble
0.66-1.10
/ Static tubes I 0.47-0.82
Wide band grid
Misc. coarse bubble
Diffused Aeration, Fine Pore
Ceramic disc or ceramic dome grid
Flexible membrane disc
Advanced technology membrane
2.3.1 Diffused Air Aeration
In diffused air systems, air is introduced to the mixed liquor through 'diffusers'
located at some distance below the liquor surface. Diffused air systems are classified
as coarse or fine bubble systems, depending on the size of bubble generated.
Although the boundary between these two categories is not very sharply defined, fine
bubble diffusers typically produce bubbles in the 2-5mm size range in clean water,
while coarse bubble diffusers produce bubbles in the size range 6-10mm.
Coarse bubble diffuser is designed to introduce oxygen and provide mixing in
wastewater and sludge. For tougher applications such as sludge or industrial
wastewaters, coarse bubble is often the best solution. It is typically consist of drilled

holes or slots in a submerged air distribution system. The bubbles produced may be
smaller than the orifice size, through being sheared off by the water pressure. In
addition, the oxygen transfer efficiency (OTE) of coarse bubble systems is generally
much lower than fine bubble systems. OTE is defined as the percent of oxygen
transferred, at zero dissolved oxygen concentration.
Figure 2.2: Coarse Bubble Diffuser
Fine bubble diffusers is defined as a diffuser system that air bubbles
introduce into the wastewater with submerge diffuser. Fine bubble diffusers are
constructed from a range of materials including ceramics, porous plastics and
perforated membranes. Ceramics and porous plastics have interconnected pore
structures through which the air flows to be discharged at the diffuser surface as a
bubble stream. Size of the bubble range is 0.5mm to 5mm, but the common used of
fine bubble in wastewater treatment is 2mm. Besides that, fine bubble diffuser is one
of the method where the oxygen can be transfer into the aeration tank. The fine
bubble diffuser will produce the air fi-om the bottom and rise up to the surface of
aeration tank, therefore the efficient of oxygen transfer will occur.
Figure 2.3: Fine Bubble Diffuser

Table 2.5 and 2.6 below shows the advantages and disadvantages of coarse
bubble and fine bubble diffusers.
Table 2.5: Advantages and Disadvantages of Coarse Bubble Diffuser
Table 2.6: Advantages and Disadvantages of Fine Bubble Diffuser
Advantages
1. Useful in secondary treatment. In the
processing tanks, floc, sediment and
carbonate build up tend to plug or
clog the fine or small air release
opening.
2. Useful for a digester with high solid
concentration.
3. It has ability to shear through more
viscous wastewater.
Disadvantages
1. Only supply 10% and would required
almost 2 to 3 times more energy to
produce the same result as the fine
bubble diffusers.
2. Fine bubbles system should yield
50% energy cost savings.
Advantages
1. Delivers high oxygen transfer
efficiencies.
2. Delivers high aeration efficiencies
(mass oxygen transferred per unit
power per unit time).
3. Suitable for high oxygen demands.
4. Easily adaptable to existing setups or
for plant upgrades.
5. Flexibility of application to various
tank geometries.
6. Result in lower volatile organic
compound emissions than coarse
bubble diffusers or mechanical
aeration devices.
Disadvantages
1. Fine pore diffusers are susceptible to
chemical or biological fouling that
may impair transfer efficiency and
generate high headloss.
2. It may be susceptible to chemical
attack, especially perforated
membranes. So, it must be exercised
in the proper selection of materials for
a given wastewater.
3. It produces high efficiencies at low
airflow rates but, airflow distribution
is critical to their performance and
selection of proper airflow control
orifices is important.

4. It required airflow in an aeration
basin. Normally at the effluent end,
and maybe dictated by mixing or not
oxygen transfer.
5.Aeration basin design must
incorporate a means to easily dewater
the tank for cleaning.
2.3.1.1 Diffuser Performance
The efficiency of oxygen transfer depends on many factors, including the type, size,
and shape of the diffuser; the air flow rate; the depth of submersion; tank geometry
including the header and diffuser location; and wastewater characteristics. Aeration
devices are conventionally evaluated in clean water and the results adjusted to
process operating conditions through widely used conversion factors.
Typically, oxygen transfer rates and oxygen transfer efficiencies are
commonly given in manufacturer information and in design manuals for a depth of
4.6 m (15 ft), such as is commonly found in larger aeration tanks (Tchobanoglous
and Burton 1991; U.S. 1989). But it is anticipated that oxygen transfer rates and
efficiencies vary significantly for smaller, much shallower systems.
Oxygen transfer efficiency of an aeration system is the ration of the amount
of oxygen that actually dissolves into the water to the total amount of oxygen
pumped into the water. In wastewater, the factor called alpha is used to adjust the
clean water transfer efficiency to take into account the effects of wastewater
characteristics on transfer efficiency.
Alpha is the ratio of oxygen transfer in generic wastewater to oxygen transfer
in clean water and it is especially important because alpha factor varies with the
physical features of the diffuser system, the geometry of the reactor, and the
characteristics of the wastewater. However, wastewater-constituents may affect
porous diffuser oxygen transfer efficiencies to a greater extent than other aeration
devices, resulting in lower alpha factors. The presence of constituents such as

detergents, dissolved solids, and suspended solids can affect the bubble shape and
size and result in diminished oxygen transfer capability.
Values of alpha varying from 0.4 to 0.9 have been reported for fine-bubble
diffuser systems (Hwang and Stenstrom, 1985). Therefore, considerable care must be
implemented in the selection of the appropriate alpha factors.
2.4 Oxygen Dispersion Efficiency and Mixing
In the treatment of wastewater, an aeration system is ineffective in providing a
complete and uniform transfer of oxygen throughout the entire basin. Although many
systems are designed to aerate wastewater, they vary in their effectiveness in
providing uniform oxygen dispersion.
Other than that, diffused air, surface splashes, and rotor have limited areas of
influence, causing short-circuiting, dead zones, and only partial aeration are the
typical aeration systems. Because the mixer technology produces a horizontal and
circular flow pattern and the equipment provides for whole basin circulation.
The conventional splashing type make the system pump water upward and
throws it into the air, so it create a high aerosol environment. To overcoming gravity
also consumes large amounts of energy. The short-circuiting and dead spots may be
occurring due to inadequate basin mixing. Sludge deposits typically accumulate at
comers and between units in the basin. It is also create and even greater oxygen
demand.
Besides that, blower or diffuser systems introduce compressed air through
diffusers into the water from the bottom of the basin. More horsepower on higher
energy consumption is required to overcome the water head resistance and the
mixing pattern is a limited vertical column as air raises from the diffuser heads to the
surface of water. From time to time, the system of diffuser heads clog as solids and
biofilm accumulation and this can reduces oxygen transfer efficiency.

2.5 Dissolved Oxygen
According to Gerardi (2002), dissolved oxygen (DO) is the free or chemically
uncombined oxygen in wastewater. Since wastewater or the bacterial degradation of
wastes has avidity for oxygen, oxygen dissipated quickly in wastewater. DO is the
most important indicator of the health of a water body and its capacity to support a
balanced aquatic ecosystem of plants and animals.
The nitrification contributes to the rapid loss of oxygen within wastewater. In
other word, quantity of dissolved oxygen in the sewage will experience reductions
and it will be used by microorganisms during the decomposition process of organic
substances found in sewage that may lead to the death of marine organism.
The dynamic nature of dissolved oxygen results from interaction of three
factors (Hargreaves, 2006):
1) Oxygen is not very soluble in water so water has only a limited capacity to
trap the oxygen.
2) The rate of oxygen use by living creatures in the pond mud can be high.
3) Oxygen diffuses very slowly from the atmosphere into undisturbed water.
Hence, combination of these three factors induced limited solubility, rapid
use and slow replenishment. However, an optimal DO concentration to achieve
nitrification is relatively low from 2 to 3 mgll and unfortunately, many activated
sludge processes are over aerated to achieve nitrification.
Table 2.7 below shows the DO concentration and nitrification achieved.
Factors responsible for this limited amount of nitrification are the lack of oxygen
diffusion through the floc particle and competition for oxygen by other organisms.
Nitrification accelerates when DO concentration is increased.

Table 2.7: DO Concentration and Nitrification Achieved
2.6 Wastewater and Composition
DO Concentration
<0.5 mgll
0.5 to 1.9 mgll
2.0 to 2.9 mgll
3.0 mgll
Every community produces both liquid, solid wastes and air emissions. The liquid
waste and wastewater is essentially the water supply of the community after it has
been used in variety of applications. From the standpoint of 'sources of generation,
wastewater maybe defined as a combination of liquid or water-carried wastes
removed from residential, offices, institutions, commercial and industrial
establishments together with such groundwater, surface water and storm water as
may be present.
Wastewater is 99.97 percent water by mass. The remaining 0.03 percent is
organic and inorganic compounds of anthropogenic and natural origin that is either
dissolved or suspended in the water as shown in Table 2.8 below. The naturally
occurring constituents in wastewater were present in the source water that was
supplied to the user. Besides that, the concentration of these materials is very small
and is measured in milligrams per litre or parts per million of water (mgll). After
passed the treatment, the effluent is returned to the environment in a way that is safe
for our health and for the environment.
Nitrification Achieved
Little, if any, nitrification occurs
Nitrification occurs but inefficiently
significant nitrification occurs
Maximum nitrification

Table 2.8: Physical, Chemical, and Biological Characteristics of Wastewater and
Their Sources Wastewater Engineering. Treatment Disposal Reuse, G.
Tchobanoglous and F.L. Burton (Eds.), 1 820 pp. New York: McGraw-Hill.
Characteristics
Physical properties:
Color
Odor
Solids
Temperature
Chemical constituents:
Organic:
Carbohydrates
Fats, oils, and grease
Pesticides
Phenols
Proteins
Priority pollutants
Surfactants
Volatile organic
compounds
Other
Inorganic:
Alkalinity
Chlorides
Heavy metals
Nitrogen
PH
Sources
Domestic and industrial wastes, natural decay of
organic materials
Decomposing wastewater, industrial wastes
Domestic water supply, domestic and industrial wastes,
soil erosion, inflowlinfiltration
Domestic and industrial wastes
Domestic, commercial, and industrial wastes
Domestic, commercial, and industrial wastes
Agricultural wastes
Industrial wastes
Domestic, commercial, and industrial wastes
Domestic, commercial, and industrial wastes
Domestic, commercial, and industrial wastes
Domestic, commercial, and industrial wastes
Natural decay of organic materials
Domestic wastes, domestic water supply, groundwater
infiltration
Domestic wastes, domestic water supply, groundwater
infiltration
Industrial wastes
Domestic and agricultural wastes
Domestic, commercial, and industrial wastes

2.7 Domestic Wastewater
Phosphorus
Priority pollutants
Sulfur
Gases:
Hydrogen sulfide
Methane
Oxygen
Biological constituents:
Animals
Plants
Protists:
Eubacteria
Archaebacteria
Viruses
Domestic wastewater or sewage is the discharge fi-om domestic residences,
commercial or industrial premises into the public sewer, originated from all aspects
of human sanitary water usage. It is typically composed of human body wastes such
as faeces and urine together constitutes a combination of flows fiom bathroom,
toilets, kitchen sinks, floor traps, dishwashers and washing machines. However, apart
fiom domestic wastewater originated from residences, premises such as commercial,
institutional and industrial also contribute a domestic wastewater component. In
Malaysia, a separate sewerage conveyance system is adopted fiom the domestic use
only. The analysis of human faeces and urine is given in Table 2.9.
Domestic, commercial, and industrial wastes, natural
runoff
Domestic, commercial, and industrial waste
Domestic water supply; domestic, commercial, and
industrial wastes
Decomposition of domestic wastes
Decomposition of domestic wastes
Domestic water supply, surface-water infiltration
Open watercourses and treatment plants
Open watercourses and treatment plants
Domestic wastes, surface-water, infiltration, treatment
plants
Domestic wastes, surface-water infiltration, treatment
plants
Domestic wastes

Table 2.9: Composition of Human Faeces and Urine
2.8 Characteristic of Domestic Wastewater
Quantity of Faeces
Quantity (wet)/persodday
Quantity (dry solids)/persodday
Approximate Composition (%)
Moisture
Organic Matter
Phosphorus
Potassium
Calcium
Carbon
Moisture
Nitrogen
Domestic wastewater is a gray colour, turbid liquid or sometimes said to have an
odor of kerosene or freshly-turned earth. Wastewater characteristics generally related
with the quality of the physical, chemical and biological. For the physical
parameters, it is including color, taste and odor, temperature, turbidity and solids
content. Solids content can be categorized into suspended solids and dissolved solids
in the form of organic or inorganic.
Chemical parameters of wastewater usually viewed from two main
categories, it is in form of organic and inorganic. For organic category of chemical
parameters including biochemical oxygen demand (BOD), chemical oxygen demand
(COD), total oxygen demand (TOD), protein, oils, fats and carbohydrates. While in
inorganic form, chemical parameters are including pH (acidity, alkalinity), heavy
metals (mercury, lead, chromium and zinc), chlorine, nitrogen, phosphorus and
sulfate. Biological parameters of domestic wastewater are including coliforms, fecal
colifoms, pathogens and viruses.
Faeces
13 5-270 g
~ 35-70 g
66-80
88-97
30-5.4
1 .O-2.5
4.5
44-55
66-80
5.0-7.0
Urine
1.0-1.3 kg
50-70 g
93-96
65-85
2.5-5.0
3.0-4.5
4.5-6.0
11-17
93-96
15-19
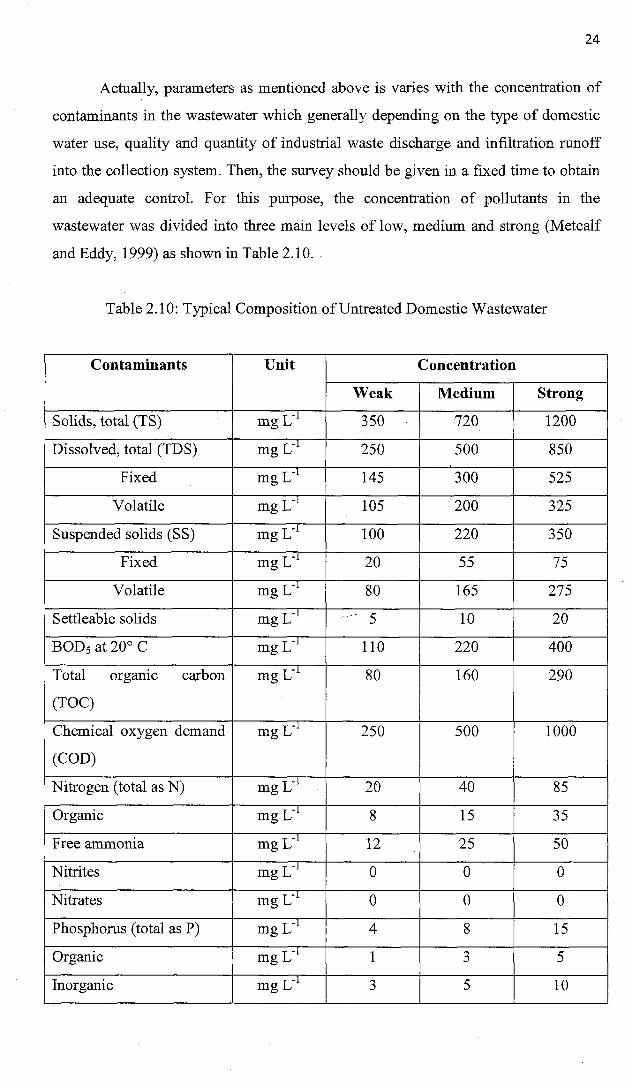
Actually, parameters as mentioned above is varies with the concentration of
contaminants in the wastewater which generally depending on the type of domestic
water use, quality and quantity of industrial waste discharge and infiltration runoff
into the collection system. Then, the survey should be given in a fixed time to obtain
an adequate control. For this purpose, the concentration of pollutants in the
wastewater was divided into three main levels of low, medium and strong (Metcalf
and Eddy, 1999) as shown in Table 2.10.
Table 2.10: Typical Composition of Untreated Domestic Wastewater
Contaminants
Solids, total (TS)
Dissolved, total (TDS)
Fixed
Volatile
Suspended solids (SS)
Fixed
Volatile
Settleable solids
BOD5 at 20' C
Total organic carbon
(TOC)
Chemical oxygen demand
(COD)
Nitrogen (total as N)
Organic
Free ammonia
Nitrites
Nitrates
Phosphorus (total as P)
Organic
Inorganic
Unit
mg L-I
mg L-I
mg L-I
mg L-'
mg L-'
mg L-'
mg L-'
mg L-I
mg L-I
mg L-'
mg L-l
mg L-I
mg L-'
mg L-'
mg L-'
mg L-'
mg L-I
mg L-'
mg L-I
Weak
3 50
250
145
105
100
20
80
5
110
8 0
250
20
8
12
0
0
4
1
3
Concentration
Medium
720
500
300
200
220
5 5
165
10
220
160
500
40
15
2 5
0
0
8
3
5
Strong
1200
850
525
325
350
75
275
20
400
290
1000
85
3 5
5 0
0
0
15
5
10

2.8.1 Physical Characteristics
Chlorides
Sulfate
Alkalinity (as CaC03)
Grease
Total coliforrn
Volatile organic
compounds (VOCs)
Physical characteristics generally related with the measurement of parameters that
can be done through the naked eye or touch. The wastewater has physical
characteristics such as temperature, solids, turbidity, colour, taste and odor.
i) Temperatute
Temperature is one of the most important parameters. Temperature is
determined as a catalyst, a depressant, an activator, a restrictor, a
stimulator, a controller and a killer. It affects the self-purification of
streams. Rise in temperature enhances toxicity of poisons and
intensity of odor besides changing the taste. Also increase in
temperature causes growth of undesirable water plants and wastewater
fungus. It influences the biological species present and their rates of
biological activity. Hence, temperature has an effect on most chemical
reactions that occur in natural water systems and also has a
pronounced effect on the solubility of gases in water. Aerobic
digestion ceases at a temperature greater than 50°C but at less than
15°C anaerobic digestion is affected as methane bacteria become
inactive.
The temperature affects the reaction rates and solubility levels of
chemicals. Most of chemical reactions involving dissolution of solids
mg L-'
mg L-'
mg L-l
mg L-I
CFU 100
mL-'
mg L-'
3 0
20
50
5 0
lo6-lo7
<lo0
50
3 0
100
100
lo7-lo8
100-400
100
5 0
200
150
lo8-lo9
>400
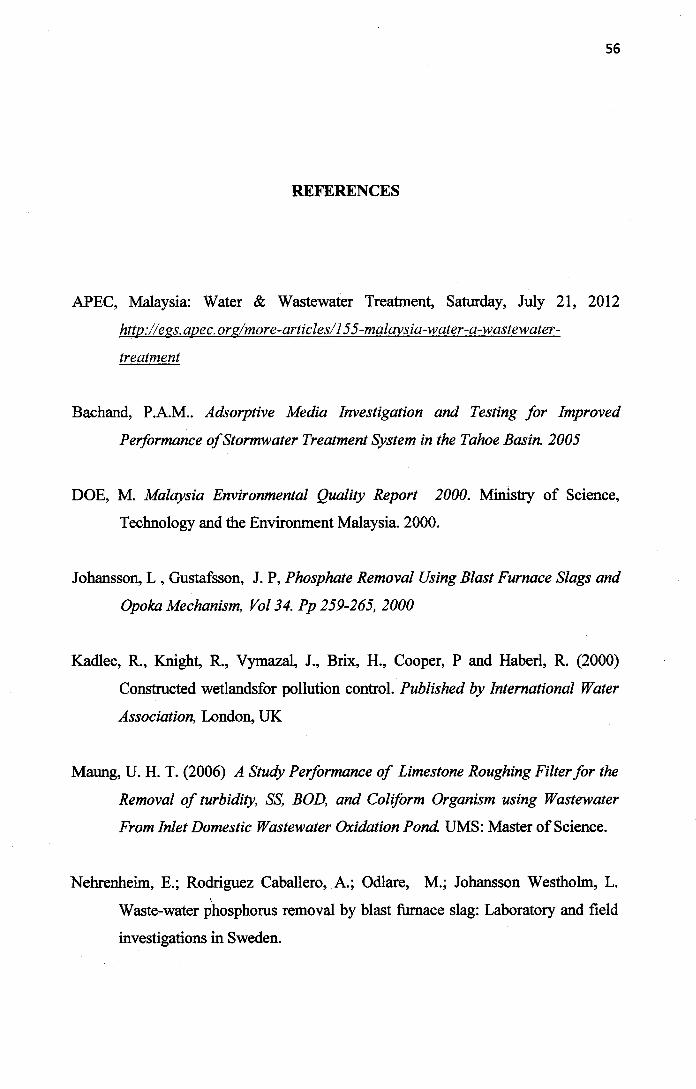
REFERENCES
APEC, Malaysia: Water & Wastewater Treatment, Saturday, July 21, 2012
http://egs. apec. or~/more-articles/l55-malaysia-water-a-wastewater-
treatment
Bachand, P.A.M.. Adsorptive Media Investigation and Testing for Improved
Performance of Stormwater Treatment System in the Tahoe Basin. 2005
DOE, M. Malaysia Environmental Quality Report 2000. Ministry of Science,
Technology and the Environment Malaysia. 2000.
Johansson, L , Gustafsson, J. P, Phosphate Removal Using Blast Furnace Slags and
Opoka Mechanism, Vol34. Pp 259-265, 2000
Kadlec, R., Knight, R., Vyrnazal, J., Brix, H., Cooper, P and Haberl, R. (2000)
Constructed wetlandsfor pollution control. Published by International Water
Association, London, UK
Maung, U. H. T. (2006) A Study Performance of Limestone Roughing Filter for the
Removal of turbidity, SS, BOD, and Coliform Organism using Wastewater
From Inlet Domestic Wastewater Oxidation Pond. UMS: Master of Science.
Nehrenheim, E.; Rodriguez Caballero, A.; Odlare, M.; Johansson Westholm, L.
Waste-water ihosphorus removal by blast h a c e slag: Laboratory and field
investigations in Sweden.

Rdmat, S.N, Zullcifli Yusop, Maketab Mohamed. Nonpoint sources pollution
assessment for residential and commercial catchment in Skudai, Johor.
Skudai: Universiti Teknologi Malaysia. 2004.
Richardson, C. (1985) Mechanisms controlling phosphorus retention capacity in
freshwater wetlands. Science, 228: 1424- 1427
Supiah, S. Reduction of Nutrient Content by Harvesting Natural Wetland
Vegetation. Universiti Teknologi Malaysia, 2004
Tebbutt, T H Y (1998) Principle of Water Quality Control, fth edition, Butterworth
Hienemann &ford
Wikipedia, Sewage Treatment, RetrieveThursday, April 12, 20 12.
hlm://en. w ikipedia. org/wiki/Sewa~etrealrnent
Wikipedia, Dead Zone, retrieve Tuesday, May 8, 2012
Zhang, W (2000) Improvement of Phosphorus and Heavy Metals Retention in
Stormwater Treatment. Nanjing University: Master of Science.