Embed Size (px)
Citation preview

AEMO RIT-T on Western Victoria Renewable Integration – Network options study
Network Planning Group
This issue Revision 0
Pages this issue 66
Author Joseph Leung, Senior Electrical Engineer
Reviewed Jahan Peiris, Network Modelling and Performance Manager
Approved Andrew Kingsmill, Manager/Network Planning
Revision History Revision 0 issued in July 2017

Executive Summary AEMO NTNDP 2016 [1] and Victorian APR 2016 [2] indicate that up to 1,500 MW of new large-scale renewable energy generation would be developed by 2020 and up to 5,400 MW by 2025 in Victoria primarily as a result of the Victorian Renewable Energy Targets. AEMO has identified a shortage of transmission capacity in the North West Victorian subsystem to connect this additional generation. In April 2017, AEMO published a RIT-T Project Specification Consultation Report (PSCR) [3] for the Western Victoria Renewable Integration project, considering minor network augmentations, major network augmentations, and non-network options to address the identified need.
TransGrid is exploring opportunities available for connecting these renewable generations by extending the NSW transmission network. This report aims to examine the capacities of a range of network augmentation options.
The studies have not taken into account the proposed expansion of Snowy Hydro to add pumped storage. This is expected to deliver additional benefits to those identified in these studies and will be considered in an assessment of the feasibility and benefits of the proposed expansion of Snowy Hydro.
Study Options These options include:
• Scenario 1 – Base case • Scenario 2 – New 330 kV double circuit from Darlington Point to Kerang initially strung one side • Scenario 3 – New 330 kV double circuit line from Darlington Point to Kerang with a second 330
kV line from Darlington Point to Wagga • Scenario 4 – AEMO VIC RIT-T line reinforcements: 220 kV line reinforcements in western Victoria
and Ballarat – Sydenham/Moorabool 500 kV (a variant on 220kV and 500kV options in the PSCR) • Scenario 5 – Darlington Point to Kerang loop to Ballarat double circuit 330kV, and Ballarat to
Sydenham/Moorabool single circuit 500kV, double circuit 220kV from Ararat to Ballarat • Scenario 6 – Snowy to South Morang 330 kV double circuit and Victorian system option 2
(Partial, i.e. Scenario 9) • Scenario 7 – Scenario 5 + new medium capacity NSW-SA interconnector • Scenario 8 – Scenario 5 + new medium capacity SA-VIC interconnector • Scenario 9 – Victorian system option 2 (Partial RIT-T augmentation)
Renewable connections considered Renewable generation connections to the following six nodes in the regional VIC network are considered:
• Kerang (600 MW) • Ararat (300 MW) • Mortlake (400 MW) • Ballarat (534 MW) • Horsham (386 MW) • Moorabool (321 MW)
In addition, for Scenario 5, new renewable generation (300 MW) connecting to a new 330 kV mid-point substation between Kerang and Ballarat is also considered.

For the Kerang node, a sensitivity study was performed to examine the loading on the new 330 kV lines (from Kerang to Darlington point) for renewable connections either on the 220 kV or the 330 kV buses.
Key results
Renewable generation capacity in western Victoria The table below summarises the maximum renewable generation capacity that can be accommodated while ensuring system security1 under system normal (N) and contingency (N-1) conditions for each scenario.
Scenario Maximum VIC renewables (MW)
N capacity2 Increase above base case N-1 capacity3 Increase above base case
1 1,621 - 1,381 - 24 1,841 220 1,523 142
3 1,941 320 1,661 280
4 2,564 943 2,464 1,083
5 2,444 823 2,284 903
6 2,324 703 2,004 623
7 1,864 243 1,684 303
8 2,043 422 1,944 563
9 2,324 703 1,904 523
Summary on VIC-NSW transfer capacity
Scenario Additional
VIC export to NSW (MW)
Additional VIC import from NSW
(MW)
Comment
1 No change No change VIC renewables displace existing thermal generators. No interconnector augmentation
2 420 310 Single circuit 330 kV KER-DLP increases the transfer limit. This scenario assumes transfer trip of new renewable generation for trip of Kerang – Darlington Point line.
2B 570 155 Connecting additional 300 MW renewables at Kerang 330 kV bus will increase VIC export by approx. 150 MW and reduce VIC import by approx. 150 MW, compared to scenario 2. This scenario assumes transfer trip of new renewable generation for trip of Kerang – Darlington Point line.
1 Avoiding thermal overloads and maintain voltage profile 2 This capacity can be accommodated if generation runback/transfer tripping can be implemented to manage line overloads in the event of a contingency 3 This is the maximum allowed if AEMO generation dispatch is utilised to manage line loading in the event of contingencies 4 This scenario assumes inter-tripping Kerang generation for trip of Kerang-Darlington Point line

Scenario Additional
VIC export to NSW (MW)
Additional VIC import from NSW
(MW)
Comment
3 540 420 Double circuit 330 kV KER-DLP increases the transfer limit. Note that the additional flow path encourages extra power flow from Ballarat to Kerang via Bendigo, therefore creating higher line overload. Remedial action (e.g. phase-shifting transformer or series reactor limiting the flow, or increase the line thermal capacity) will facilitate higher transfers.
3B 740 220 Connecting additional 300 MW renewables at Kerang 330 kV bus will increase VIC export by approx. 200 MW and reduce VIC import by approx. 200 MW, compared to Scenario 3.
4 No change No change VIC renewables displace existing thermal generators. No interconnector augmentation. Regional VIC transmission network augmentation has no thermal impact to VIC-NSW interconnectors.
5 670 465 Double circuit 330 kV DLP-KER-MPT-BAL increases the transfer limit.
6 480 500 Additional double 330kV circuit from South Morang to Murray via Dederang increases the generation from Snowy (e.g. Snowy 2.0) to VIC. VIC export is limited due to the thermal constraints north of Murray/Snowy.
7 670 465 Inter-connector flow increases due to the Scenario 5 augmentation. However, it cannot increase further as some VIC 220 kV lines will be overloaded. NSI and the corresponding upgrade from Buronga to Wagga via Darlington Point can increase the flow to/from VIC via OX1. However, the flow cannot be increase from current level unless OX1 is upgraded.
8 670 465 Inter-connector flow increases due to the Scenario 5 augmentation. However, it cannot increase further as some VIC 220 kV lines will be overloaded. Horshamlink can increase the transfer between VIC and SA but not with NSW.
9 No change No change VIC renewables displace existing thermal generators. No interconnector augmentation. Regional VIC transmission network augmentation has no thermal impact to VIC-NSW interconnectors.

Contents Executive Summary ....................................................................................................................... 2
1. Introduction ........................................................................................................................... 7
1.1. Integration of renewables in Victoria ..................................................................................... 7
1.2. AEMO’s network augmentation options................................................................................. 8
2. Study objectives ..................................................................................................................... 9
3. TransGrid’s network augmentation scenarios ........................................................................ 9
3.1. Scenario 2 — New 330 kV double circuit from Darlington Point to Kerang strung on one side 12
3.2. Scenario 3 — 330 kV double circuit from Darlington Point to Kerang.................................... 12
3.3. Scenario 4 — AEMO RIT-T regional Victorian network reinforcement ................................... 13
3.4. Scenario 5 — New 330 kV double circuit from Darlington Point to Ballarat with 500 kV single circuits to Sydenham and Moorabool .......................................................................................... 13
3.5. Scenario 6 — Snowy to South Morang variation ................................................................... 14
3.6. Scenario 7 — NSI variation ................................................................................................... 14
3.7. Scenario 8 — Horshamlink variation..................................................................................... 15
3.8. Scenario 9 — Partial VIC RIT-T option ................................................................................... 15
4. Future VIC renewable connections to be considered ............................................................ 16
5. Study snapshots ................................................................................................................... 17
5.1. Line ratings .......................................................................................................................... 18
6. Methodology ....................................................................................................................... 18
7. Study results ........................................................................................................................ 20
7.1. Reactive power compensation requirement at System Normal ............................................ 20
7.2. Thermal loading during System Normal................................................................................ 23
7.3. Detailed congestion analyses – Scenario 1, 4 and 5 .............................................................. 28
7.3.1. Probability of overloading ............................................................................................ 28
7.3.2. Analysis of other operating conditions leading to overloading the selected regional VIC transmission lines ........................................................................................................................ 32
7.3.3. Contribution factor of each renewable generation location to the line loading ............. 33
7.4. Amount of VIC renewable integration without overloading the network during system normal 35
7.5. Maximum VIC renewable generation based on N-1 contingency consideration .................... 36
7.6. Augmentation impact on VIC-NSW transfer capacity ............................................................ 38
8. Additional sensitivity studies ................................................................................................ 39
9. Further issues to consider .................................................................................................... 42
10. Conclusions .......................................................................................................................... 44
References .................................................................................................................................. 44

Appendix A – Single line diagrams................................................................................................ 45
Appendix C – Detailed study case information ............................................................................. 54
Appendix D – Results of regression analysis – Scenario 1 ............................................................. 55
Appendix E – Results of regression analysis – Scenario 4 .............................................................. 59
Appendix F – Results of regression analysis – Scenario 5 .............................................................. 63

1. Introduction
1.1. Integration of renewables in Victoria AEMO NTNDP 2016 [1] and Victorian APR 2016 [2] indicate that up to 1,500 MW of new large-scale renewable energy generation would be developed by 2020 and up to 5,400 MW by 2025 in Victoria primarily as a result of the Victorian Renewable Energy Targets.
Victorian APR [2] lists the following potential renewable generation connections in the North West Victorian network.
Table 1: Potential renewable connections in the regional Victorian network [2]
The above includes a total of about 2,640 MW renewable generators. About 1,500 MW of this generation is in the Ballarat – Horsham corridor (refer to the geographical representation in Figure 1).

Figure 1: Geographic diagram of the regional Victorian network and the proposed renewable connections
1.2. AEMO’s network augmentation options AEMO has identified a shortage of transmission capacity in the North West Victorian subsystem to connect this additional generation and is undertaking a RIT-T to identify the most suitable options (network and/or non-network) for avoiding constraints on these new renewable generations.
AEMO published a RIT-T Project Specification Consultation Report (PSCR) [3] for the Western Victoria Renewable Integration project in April 2017. AEMO is considering minor network augmentations, major network augmentations, and non-network options to address the identified need. Key network options include:
• Minor network augmentations options: These involve transmission line upgrades that can be carried out at the terminal station, rather than along the transmission line. It involves replacing primary plant that is currently limiting transmission line ratings, and installing dynamic wind monitoring.
• 220kV network augmentations options: This option involves progressively adding new 220 kV transmission line capacity to congested parts of the Western Victorian network. Figure 2 shows the proposed transmission augmentations.
• 275 kV or 330 kV network augmentations: This option as presented in the PSCR is contingent on a new interconnector from Robertstown in South Australia to Buronga in New South Wales (i.e. NSI), with a voltage of either 275 kV or 330 kV.
• 500 kV network augmentations: This option involves building a new 500 kV transmission backbone at the most congested parts of the Western Victoria network, most likely between Horsham, Ballarat, and Moorabool, or between Horsham, Ballarat, and Sydenham.
TransGrid is considering further options to extend the NSW transmission network to enable the connection of renewable generation.

Figure 2: Potential 220 kV network augmentations in Western Victoria [3]
2. Study objectives The focus of this study is to investigate options for extending the NSW network to connect Victorian renewables. The studies will:
1. identify optimal high level staging of network developments 2. identify appropriate circuit configurations (voltage levels, conductors, etc.) and capacity levels 3. determine maximum western Victorian renewable generation that can be accommodated by
different options 4. determine potential impacts on the interconnector transfer capacity (NSW – VIC) and factors
affecting the transfer limits 5. identify deep network limitations and remedial measures 6. identify the sensitivity of other factors such as new interconnectors (Riverlink or Horshamlink)
and existing interconnector reinforcements on the developments.
3. TransGrid’s network augmentation scenarios TransGrid carried out independent technical and economic analyses in response to AEMO’s RIT-T report [3]. TransGrid’s proposed network augmentations are summarised in Table 2.

Table 2: Study scenarios
Scenario Description Commission Date Augmentation Details
1 Base case Present No change.
2 New 330 kV double circuit from Darlington Point to Kerang initially strung one side
2021 Augmentation from Darlington Point to Kerang (stage 1) – single circuit 330kV (e.g. strung one side of double circuit towers) directly from Darlington Point to Kerang (bypassing Deniliquin). Assumed transfer trip of new generation to cover contingencies (to avoid any overloads on Victorian 220 kV network).
3 New 330 kV double circuit line from Darlington Point to Kerang with a second 330 kV line from Darlington Point to Wagga
2021 Augmentation from Darlington Point to Kerang (stage 2) – double circuit 330kV direct from Darlington Point to Kerang (bypassing Deniliquin)
• Add a new 330 kV line from Darlington Point to Wagga
4 AEMO VIC RIT-T 220 kV line reinforcement: Ballarat – Sydenham/Moorabool 500 kV and Western Victoria upgrades only (a variant on 220 kV and 500 kV options in the PSCR)
2021 Augmentation from Ballarat to Sydenham – single circuit 500kV. Ballarat to Moorabool single circuit 500kV
• Red Cliffs – Horsham new 220kV single circuit • Red Cliffs – Wemen – Kerang – Bendigo – Shepparton/Ballarat new
220kV single circuits • Horsham – Ararat new 220kV single circuit • Ararat – Waubra – Ballarat new double circuit 220kV • Terang – Ballarat new single circuit 220kV • Terang – Moorabool new single circuit 220kV
5 Complete Darlington Point to Kerang loop to Ballarat double circuit 330kV (via a new substation near Mid Point), and Ballarat to Sydenham/Moorabool 500kV single circuits
2023 Complete Darlington Point to Kerang loop to Ballarat double circuit 330kV (via Mid Point), and Ballarat to Sydenham single circuit 500kV
• Ballarat to Moorabool single circuit 500kV • Double circuit 220kV from Ararat to Ballarat
6 Snowy to South Morang upgrade 2023 Scenario 9 plus augmentation from Snowy to South Morang double circuit

Scenario Description Commission Date Augmentation Details
330kV. New double circuit 330 kV line from Murray via Dederang to South Morang.
7 Scenario 5 + new medium capacity NSW-SA interconnector
2023 Scenario 5 + NSI (275 kV double circuit between Robertstown and Buronga)
New 275 kV line from Buronga to Darlington Point
This is to compare differences with NSI (Sensitivity study)
8 Scenario 5 + new medium capacity SA-VIC interconnector
2023 Scenario 5 + double circuit 275 kV Horshamlink circuit. This is to compare differences with Horshamlink. Extend scenario 5 network from Mid-Point to Horsham as well. (Sensitivity study)
Horsham – Ararat new 220kV single circuit
9 Victorian system option 2 (Partial) - Ballarat – Sydenham/Moorabool 500 kV and limited Western Victoria upgrades only
2021 Ballarat – Sydenham single circuit 500kV
Ballarat – Moorabool single circuit 500kV
Ararat – Waubra – Ballarat new double circuit 220kV
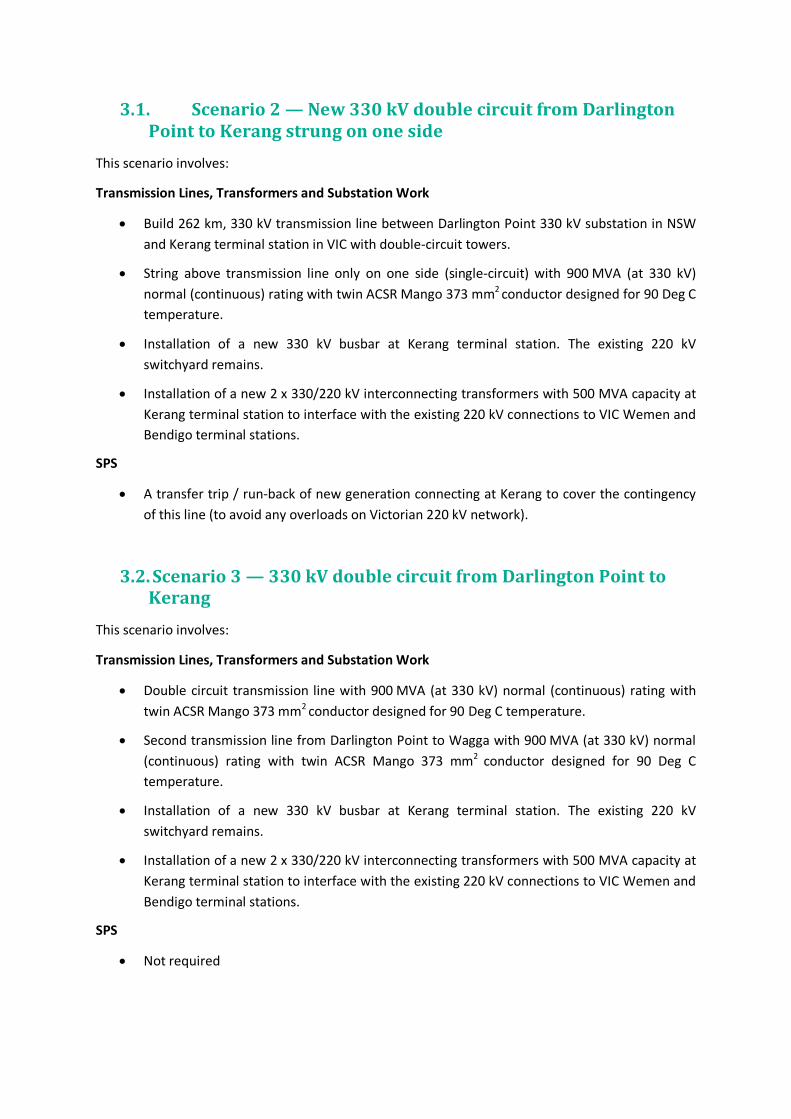
3.1. Scenario 2 — New 330 kV double circuit from Darlington Point to Kerang strung on one side
This scenario involves:
Transmission Lines, Transformers and Substation Work
• Build 262 km, 330 kV transmission line between Darlington Point 330 kV substation in NSW and Kerang terminal station in VIC with double-circuit towers.
• String above transmission line only on one side (single-circuit) with 900 MVA (at 330 kV) normal (continuous) rating with twin ACSR Mango 373 mm2 conductor designed for 90 Deg C temperature.
• Installation of a new 330 kV busbar at Kerang terminal station. The existing 220 kV switchyard remains.
• Installation of a new 2 x 330/220 kV interconnecting transformers with 500 MVA capacity at Kerang terminal station to interface with the existing 220 kV connections to VIC Wemen and Bendigo terminal stations.
SPS
• A transfer trip / run-back of new generation connecting at Kerang to cover the contingency of this line (to avoid any overloads on Victorian 220 kV network).
3.2. Scenario 3 — 330 kV double circuit from Darlington Point to Kerang
This scenario involves:
Transmission Lines, Transformers and Substation Work
• Double circuit transmission line with 900 MVA (at 330 kV) normal (continuous) rating with twin ACSR Mango 373 mm2 conductor designed for 90 Deg C temperature.
• Second transmission line from Darlington Point to Wagga with 900 MVA (at 330 kV) normal (continuous) rating with twin ACSR Mango 373 mm2 conductor designed for 90 Deg C temperature.
• Installation of a new 330 kV busbar at Kerang terminal station. The existing 220 kV switchyard remains.
• Installation of a new 2 x 330/220 kV interconnecting transformers with 500 MVA capacity at Kerang terminal station to interface with the existing 220 kV connections to VIC Wemen and Bendigo terminal stations.
SPS
• Not required

3.3. Scenario 4 — AEMO RIT-T regional Victorian network reinforcement
This scenario involves:
Transmission Lines, Transformers and Substation Work
• Installation of a new 500 kV busbar at Ballarat substation. The existing 220 kV switchyard remains (Cost to be estimated)
• Two new 500 MVA 220/500 kV transformers at Ballarat 220 kV terminal station (Cost to be estimated)
• Ballarat to Moorabool single circuit 500kV ($57M)
• Ballarat to Sydenham single circuit 500kV (Cost to be estimated)
• Red Cliffs – Horsham new 220kV single circuit ($144M)
• Red Cliffs – Wemen – Kerang – Bendigo – Shepparton/Ballarat new 220kV single circuit ($127M)
• Horsham – Ararat new 220kV single circuit ($54M)
• Ararat – Waubra – Ballarat new double circuit 220kV ($75M)
• Terang – Ballarat new single circuit 220kV ($63M)
• Terang – Moorabool new single circuit 220kV ($72M)
SPS
• Not required
3.4. Scenario 5 — New 330 kV double circuit from Darlington Point to Ballarat with 500 kV single circuits to Sydenham and Moorabool
This scenario involves:
Transmission Lines, Transformers and Substation Work
• Developments under Scenario 3 above
• Installation of a new 330 kV mid-point terminal station which is in the mid-point of Kerang, Horsham, Red Cliffs and Ballarat
• Installation of a new 330 busbar at Ballarat 220 kV terminal station
• Build 265 km, 330 kV transmission line between Kerang terminal station to Ballarat terminal station via the above new mid point terminal station with double-circuit towers. Provide separate cost estimate for:
- Kerang – Mid point section of the line, which is approx. 95 km;
- Mid point – Ballarat section of the line, which is approx. 170 km.

• String above transmission line on both sides with 900 MVA (at 330 kV) normal (continuous) rating with twin ACSR Mango 373 mm2 conductor designed for 90 Deg C temperature
• Installation of two new 330/500 kV transformers with 500 MVA capacity at Ballarat terminal station
• Build 91 km, single circuit transmission line (from Ballarat to Sydenham) with 2400 MVA (at 500 kV) normal (continuous) rating with 4 x Orange 438 mm2 conductor designed for 90 Deg C temperature
• Build 77 km, single circuit transmission line (from Ballarat to Moorabool) with 2400 MVA (at 500 kV) normal (continuous) rating with 4 x Orange 438 mm2 conductor designed for 90 Deg C temperature
• Installation of a new 500 kV busbar at Ballarat substation. The existing 220 kV switchyard remains
• Two new 500 MVA 220/500 kV transformers at Ballarat 220 kV terminal station
SPS
• Not required
3.5. Scenario 6 — Snowy to South Morang variation This scenario involves:
Transmission Lines, Transformers and Substation Work
• Build new 330 kV double-circuit transmission line between Murray 330 kV substation in NSW and Dederang terminal station in VIC with double-circuit towers.
• String above transmission line on both side (double-circuit) with 900 MVA (at 330 kV) normal (continuous) rating with twin ACSR Mango 373 mm2 conductor designed for 90 Deg C temperature.
• Build new 330 kV double-circuit transmission line between Dederang 330 kV substation in VIC and South Morang terminal station in VIC with double-circuit towers.
• String above transmission line on both side (double-circuit) with 900 MVA (at 330 kV) normal (continuous) rating with twin ACSR Mango 373 mm2 conductor designed for 90 Deg C temperature.
• One new 1000 MVA 330/500 kV transformer at South Morang 330 kV terminal station
SPS
• Not required
3.6. Scenario 7 — NSI variation This scenario involves:
Transmission Lines, Transformers and Substation Work
• Developments under Scenario 5 above

• NSI Option G (Buronga 275 kV double circuit medium – high capacity connection):
o Two 275 kV lines from Buronga to Robertstown
o Three 400 MVA PST’s at Buronga 275 kV substation
o One 400 MVA 275/220 kV transformer at Buronga substation
o New single circuit 275 kV line from Buronga to Darlington Point (X5 to remain 220 kV)
o New 330 kV single circuit from Wagga to Darlington Point
SPS
• Not required
3.7. Scenario 8 — Horshamlink variation This scenario involves:
Transmission Lines, Transformers and Substation Work
• Developments under Scenario 5 above
• Installation of a new 220 kV busbar at Mid-point substation. The existing 330 kV switchyard remains
• Two new 400 MVA 220/330 kV transformers at Mid-point 330 kV terminal station
• Build 95 km, double circuit transmission line between Mid-point terminal station to Horsham terminal station with 400 MVA (at 220 kV) normal (continuous) rating with twin lemon 207 mm2 conductor designed for 90 degrees Celsius temperature
• Horshamlink (two 220 kV transmission lines from Horsham terminal station in VIC to Tungkillo substation in SA)
SPS
• Not required
3.8. Scenario 9 — Partial VIC RIT-T option This scenario involves:
Transmission Lines, Transformers and Substation Work
• Installation of a new 500 kV busbar at Ballarat substation. The existing 220 kV switchyard remains (Cost to be estimated)
• Two new 500 MVA 220/500 kV transformers at Ballarat 220 kV terminal station (Cost to be estimated)
• Ballarat to Moorabool single circuit 500kV ($57M)
• Ballarat to Sydenham single circuit 500kV (Cost to be estimated)
• Horsham – Ararat new 220kV single circuit ($54M)

• Ararat – Waubra – Ballarat new double circuit 220kV ($75M)
• Terang – Ballarat new single circuit 220kV ($63M)
• Terang – Moorabool new single circuit 220kV ($72M)
SPS
• Not required
4. Future VIC renewable connections to be considered The following VIC renewable generation connections were considered in this report. It should be noted that while these projects are publicly announced, most of their in-service dates are not yet known.
Table 3: VIC Renewables considered in this study
Item Renewable nodes Project Assumed Capacity5 (MW)
1 Kerang
Gannawarra SF: 300 MW Iraak Solar Farm: 112 MW Wemen Solar Farm: 109 MW Yatpool Solar Farm: 112 MW Bannerton Solar Park: 51 MW Mildura Solar Farm: 100 MW
600
2 Ararat Ararat WF 300
3 Mortlake Mortlake South WF: 76.5 MW Dundonnell WF: 312 MW 400
4 Ballarat Stockyard Hill WF 534
5 Horsham Murra Warra WF 386
6 Moorabool Moorabool WF 321
76 Mid point Crowlands WF: 82 Bulgana WF: 189 MW 300
The total assumed power generated from the above renewable connections is 2,541 MW (items 1 to 6 of last column). In addition to the above projects, the following variations are also considered:
1. For Scenarios 2, 3 and 5, apart from having 600 MW renewables connecting to Kerang 220 kV bus, an additional 300 MW of renewables are connected directly to the 330 kV Kerang bus (scenarios 2b, 3b, 5b). This is to test the sensitivity of renewable connection to the 220 kV and 330 kV Kerang buses.
2. For Scenario 5, an additional 300 MW (5c) is connected to the newly created mid-point 330 kV bus to capture the additional renewables available in the new transmission corridor.
Note:
5 Assumed capacities are sometimes different to the total available to allow for uncertainties with future renewables 6 This renewable connection is only applicable for Scenario 5c when the new mid point 330 kV substation is developed.
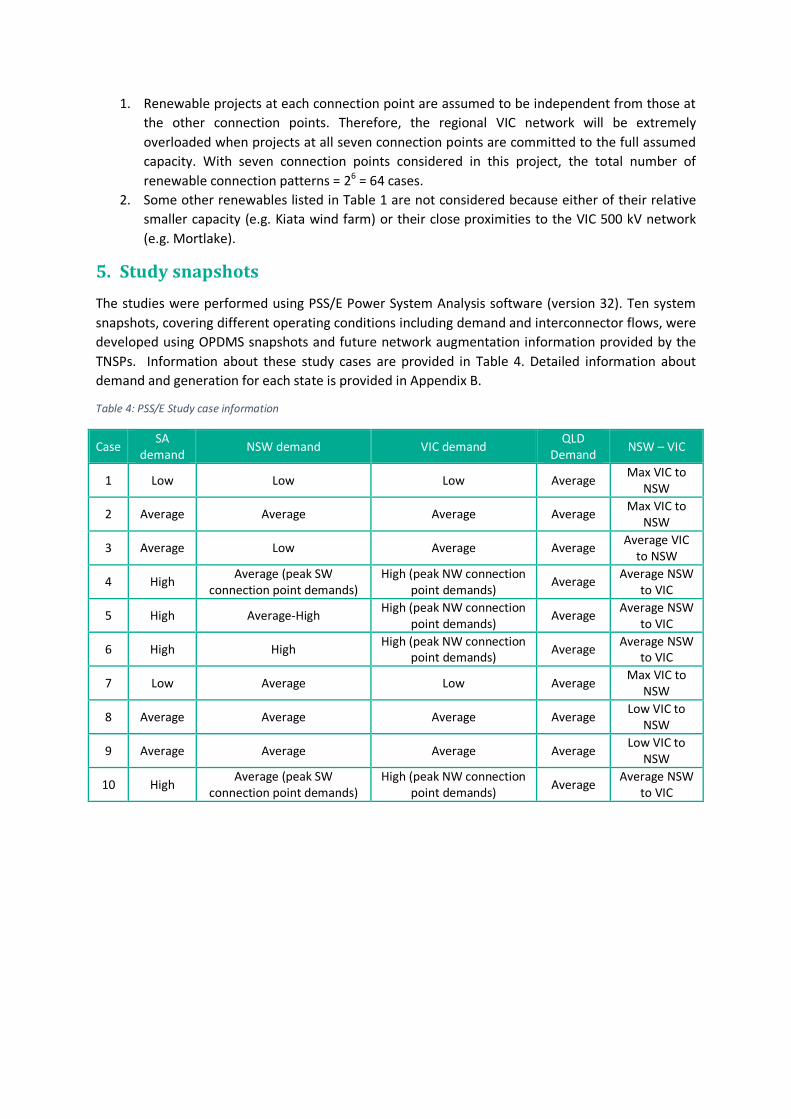
1. Renewable projects at each connection point are assumed to be independent from those at the other connection points. Therefore, the regional VIC network will be extremely overloaded when projects at all seven connection points are committed to the full assumed capacity. With seven connection points considered in this project, the total number of renewable connection patterns = 26 = 64 cases.
2. Some other renewables listed in Table 1 are not considered because either of their relative smaller capacity (e.g. Kiata wind farm) or their close proximities to the VIC 500 kV network (e.g. Mortlake).
5. Study snapshots The studies were performed using PSS/E Power System Analysis software (version 32). Ten system snapshots, covering different operating conditions including demand and interconnector flows, were developed using OPDMS snapshots and future network augmentation information provided by the TNSPs. Information about these study cases are provided in Table 4. Detailed information about demand and generation for each state is provided in Appendix B.
Table 4: PSS/E Study case information
Case SA demand NSW demand VIC demand QLD
Demand NSW – VIC
1 Low Low Low Average Max VIC to NSW
2 Average Average Average Average Max VIC to NSW
3 Average Low Average Average Average VIC to NSW
4 High Average (peak SW connection point demands)
High (peak NW connection point demands) Average Average NSW
to VIC
5 High Average-High High (peak NW connection point demands) Average Average NSW
to VIC
6 High High High (peak NW connection point demands) Average Average NSW
to VIC
7 Low Average Low Average Max VIC to NSW
8 Average Average Average Average Low VIC to NSW
9 Average Average Average Average Low VIC to NSW
10 High Average (peak SW connection point demands)
High (peak NW connection point demands) Average Average NSW
to VIC

5.1. Line ratings The thermal ratings of the VIC 220 kV transmission lines considered in this study are extracted from “AEMO Transmission Equipment Ratings” spreadsheet on the AEMO website. 40 degrees Celsius is used as the reference temperature. Note that the normal ratings and emergency ratings of these lines are the same.
Table 5: Regional VIC transmission line ratings
Line Description Voltage (kV) Reference Rating (MVA)
1 Wemen - Kerang 220 WET-KER 205
2 Bendigo - Kerang 220 BEN-KER 302
3 Ballarat - Bendigo 220 BAL-BEN 240
4 Horsham - Red Cliffs 220 HOR-RED 302
5 Horsham - Ararat 220 HOR-ART 301
6 Ararat - Waubra 220 ART-WBT 301
7 Waubra - Ballarat 220 WBT-BAL 376
8 Ballarat - Moorabool 220 BAL-MOO 240
6. Methodology This study report is based on the following methodologies.
Stage 1 – Creation of loadflow cases
Given:
• 9 scenarios
• 64 combination of generation patterns (2 to the power of 6 locations)
• 10 system snapshots
More than 5,760 loadflow cases7 were created. These cases were set up based on the following methodology:
1. The slack bus was transferred to Bayswater generator 1 in NSW.
2. The increase in VIC renewable generation will be balanced by the corresponding decrease in VIC synchronous generation, such that the VIC-NSW and Snowy to Canberra/Yass cut-set will not be substantially overloaded by the additional VIC renewable power.
3. The new renewable generations are all modelled as PV buses in PSS/E with terminal voltage controlled to 1.0 pu.
4. Additional switched shunt (reactor or capacitor) will be added to the load flow case to ensure the 220 kV bus voltages are within 0.9 pu to 1.1 pu.
7 The additional cases are the case variations (2b, 3b, 5b and 5c) for sensitivity testing.

Stage 2 – Reactive power compensation assessment
As described from Note No. 3 above, all the additional VIC renewable generations are modelled as PV buses in PSS/E, with the terminal voltage controlled to 1.0 pu. Reactive power compensation requirements for different scenarios were identified, based on the reactive power generated or absorbed at the PV buses, in order to ensure appropriate voltage range (0.9 – 1.1 pu) during system normal and following contingencies.
Stage 3 – Thermal assessment
This includes calculation of the 220 kV regional Victoria transmission line loadings for both system normal and N-1 contingency, for all the scenarios considered.
Probability8 of thermal overloading of Scenarios 1 (base case), 4 (AEMO RIT-T case) and 5 (TransGrid complete case) were also calculated for the same set of sampled cases. This will provide a fairer comparison among different scenarios not just for the overloading magnitude, but also probability of occurrence.
Calculation of the sensitivities of line loading to different renewable connections is performed for Scenarios 1, 4 and 5. The results are used to better understand how to maximise the transfer of renewable power from the regional Victoria network without causing thermal constraints.
Stage 4 – Contingency analysis
AEMO is required to ensure secure operation of the power system after a credible N-1 contingency. It is therefore important to re-evaluate the transfer limits based on N-1 contingency criteria.
As for the regional Victoria network, two important flow paths are:
• Upper flow path: from Red Cliffs to Wemen, Kerang, Bendigo, Ballarat to Moorabool;
• Lower flow path: from Red Cliffs to Horsham, Ararat, Waubra, Ballarat to Moorabool.
The loss of one of the BEN-BAL, WBT-BAL or BAL-MOO lines are therefore considered as the more critical cases and will be used for determining the N-1 contingency limit.
Stage 5 – VIC-NSW transfer limit evaluation
Additional interconnection to the NSW network exists for Scenarios 2, 3, 5, 6, 7 and 8. The benefits of these Scenarios in terms of the additional transfer were calculated and reported.
8 This is not a probability based on historic loading data but rather on the line loading distributions in the sampled cases.

7. Study results This section presents the results for the nine main scenarios described in Table 2.
7.1. Reactive power compensation requirement at System Normal
Table 6 and Table 7 show the shunt reactor and shunt capacitor requirements for each scenario under system normal situation. Key observations are:
• For all scenarios, only 200 MVAr Shunt capacitor at Ballarat 220 kV, or 150 MVAr at Ballarat 500 kV bus is required for voltage support as this is the key intersection point for the regional VIC renewable generation to the VIC 500 kV main grid.
• Shunt reactors will be required for most of the regional VIC 220 kV buses where augmentation (new line) is built. This is because these new lines introduce additional charging capacitance and will create over-voltage in light load operating conditions.
• Scenarios 4 and 5 have similar reactive power compensation requirements.

Table 6: Shunt reactor requirement (MVAr) for each scenario
Scenario Darlington Point 330 Kerang 330 Kerang 220 Ballarat 220 Ballarat 500 Horsham 220 Midpoint 330 Moorabool 500 Ararat 220
1 0 0 0 0 0 0 0 0 0
2 0 0 0 0 0 0 0 0 0
2B 0 0 0 0 0 0 0 0 0
3 0 0 0 0 0 0 0 0 0
3B 0 0 0 0 0 0 0 0 0
4 0 0 100 300 400 0 0 300 0
5 100 0 100 200 400 0 0 300 0
5B 200 250 0 200 300 0 0 300 0
5C 0 0 0 200 300 0 0 300 0
5B_5C 50 50 0 200 300 0 0 300 0
6 0 0 0 300 350 0 0 400 0
7 0 0 100 300 400 0 0 400 0
8 0 0 100 300 400 200 0 400 0
9 0 0 0 300 350 0 0 400 0

Table 7: Shunt capacitor requirement (MVAr) for each scenario
Scenario Darlington Point 330 Kerang 330 Kerang 220 Ballarat 220 Ballarat 500 Horsham 220 Midpoint 330 Moorabool 500 Ararat 220
1 0 0 0 200 0 0 0 0 0
2 0 0 0 200 0 0 0 0 0
2B 0 0 0 200 0 0 0 0 0
3 0 0 0 200 0 0 0 0 0
3B 0 0 0 200 0 0 0 0 0
4 0 0 0 0 150 0 0 0 0
5 0 0 0 0 150 0 0 0 0
5B 0 0 0 0 150 0 0 0 0
5C 0 0 0 0 150 0 0 0 0
5B_5C 0 0 0 0 150 0 0 0 0
6 0 0 0 0 150 0 0 0 0
7 0 0 0 0 150 0 0 0 0
8 0 0 0 0 150 0 0 0 0
9 0 0 0 0 150 0 0 0 0

7.2. Thermal loading during System Normal Table 8 and Table 9 summarise the maximum loadings for each transmission lines of interest in both forward (VIC export) and reverse (VIC import) directions respectively. Key observations are as follows:
Scenario 1 (Base case):
• If 600 MW of renewable generations are injecting at the Kerang 220 kV terminal, on top of its existing flow, both KER-WET and KER-BEN lines will be overloaded (139% and 152% respectively).
• In presence of other renewable connections, further renewable generations connecting at Ballarat will lead to congestions at BAL-BEN (133%), BAL-MOO1 (141%) and BAL-MOO2 (182%).
• Murra Warra wind farm at Horsham is likely to consume most of the HOR-ART transfer capacity (98%).
• On top of power generated from Murra Warra wind farm, Ararat wind farm output will overload the ART-WBT line (209%), and Waubra wind farm output will overload the WBT-BAL line (201%).
Scenario 2 (Single 330 kV circuit from Kerang to Darlington Point):
• Compared with Scenario 1, this scenario does not significantly relieve the VIC 220 line overloads.
• A maximum of 420 MW flows from Kerang to Darlington Pont, and 310 MW from Darlington Pont to Kerang. Less than 50% capacity of the 330 kV line can be utilised.
Scenario 2B [Sensitivity study] (Single 330 kV circuit from Kerang to Darlington Point, additional 300 MW injection at Kerang 330 kV bus):
• Compared with Scenario 2, this scenario reduces the power flow from Horsham and Ballarat towards Red Cliffs/Kerang, thus reducing the thermal overloads of the related lines.
• A maximum of 570 MW flows from Kerang to Darlington Pont, and 150 MW from Darlington Pont to Kerang. About 50% capacity of the 330 kV line can be utilised.
Scenario 3 (Double 330 kV circuit from Kerang to Darlington Point):
• Compared with Scenario 1, overloads at HOR-RED, ART-WBT, WBT-BAL, BAL-MOO1 and BAL-MOO2 are slightly reduced. However, overloads at BAL-BEN is further increased (from 133% to 179%).
•
Scenario 3B [Sensitivity study] (Double 330 kV circuit from Kerang to Darlington Point, additional 300 MW injection at Kerang 330 kV bus):
• Compared with Scenario 3, the 300 MW Kerang renewable injection at 330 kV bus increases the Kerang to Darlington Point line flow from 540 MW to 740 MW, but reduces the Darlington Point to Kerang line flow from 420 MW to 220 MW.
Scenario 4 (AEMO VRET RIT-T augmentation):
• No VIC 220 kV line is overloaded in both directions under system normal condition.

• The highly loaded lines are BAL-BEN (88%) and BEN-KER (85%).
Scenario 5: Complete Darlington Point to Kerang loop to Ballarat double circuit 330kV (via Mid Point), and Ballarat to Sydenham single circuit 500kV and Ballarat to Moorabool single circuit 500 kV):
• This option can relieve the thermal overloading for most of the VIC 220kV lines except BAL-BEN (115%) and KER-WET (135%).
• A maximum of 680 MW flows from Kerang to Darlington Pont, and 460 MW from Darlington Pont to Kerang. More than 50% capacity of the 330 kV line can be utilized.
Scenario 5B [Sensitivity study] (Scenario 5, additional 300 MW injection at Kerang 330 kV bus):
• Compared with Scenario 5, the additional 300 MW Kerang renewable generation connecting to Kerang 330 kV bus reduces the BAL-BEN overload from 115% to 111%, but increases the KER-WET overloads from 135% to 141%.
• A maximum of 820 MW flows from Kerang to Darlington Pont (in case when VIC demand is low), and 300 MW from Darlington Pont to Kerang (in case when VIC demand is high). More than 80% capacity of the 330 kV line can be utilized for the flow from Kerang to Darlington Point.
Scenario 5C [Sensitivity study] (Scenario 5, additional 300 MW injection at Mid Point 330 kV bus):
• Compared with Scenario 5, the additional 300 MW Mid Point renewable generation marginally increases the BAL-BEN overloads from 115% to 116%, and KER-WET overloads from 135% to 140%.
• A maximum of 800 MW flows from Kerang to Darlington Pont, and 340 MW from Darlington Pont to Kerang. (Note this is less than 820 MW as reported in Scenario 5B because the mid point is further away from Kerang.) More than 80% capacity of the 330 kV line can be utilized for the flow from Kerang to Darlington Point.
Scenario 5B_5C [Sensitivity study] (Scenario 5, additional 300 MW injection at Kerang 330 kV bus, additional 300 MW injection at Mid Point 330 kV bus):
• Compared with Scenario 5, the additional 600 MW of combined renewable generations reduce the BAL-BEN overloads from 115% to 103%, and increase KER-WET overloads from 135% to 146%
• A maximum of 880 MW flows from Kerang to Darlington Point, and 180 MW from Darlington Pont to Kerang. Close to 90% capacity of the 330 kV line can be utilized for the flow from Kerang to Darlington Point.
Scenario 6 (Victorian system option 2 (Partial, i.e. Scenario 9) and Snowy to South Morang upgrade):
• Results of this scenario are similar to those for Scenario 9 (refer to comments for Scenario 9 below.) The Murray-Dederang-South Morang line augmentation does not significantly relieve the VIC constraints. The partial VIC network augmentation relieves the constraints from Ararat to Moorabool only.
Scenario 7 (Scenario 5 + new medium capacity NSW-SA interconnector):
• Compared with Scenario 5, the NSW-SA interconnector increases the thermal overloading at HOR-RED (from 82% to 119%), the WET-KER overloading also increases from 135% to 189%.
Scenario 8 (Scenario 5 + new medium capacity SA-VIC interconnector):
• Compared with Scenario 5, the VIC-SA interconnector decreases the thermal overloading at BAL-BEN (from 115% to 101%), the WET-KER overloading also decreases from 135% to 127%.
• A maximum of 760 MW flows from Kerang to Darlington Point, and 500 MW from Darlington Point to Kerang. More than 50% capacity of the 330 kV line can be utilized for the flow from Kerang to Darlington Point.
Scenario 9 (Victorian system option 2 (Partial RIT-T augmentation)):
• Compared with Scenario 1, this partial VIC augmentation option can relieve the thermal overloads for ART-WBT, WBT-BAL, BAL-MOO1, BAL-MOO2 lines.
• This option cannot relieve the overload at WET-KER (139%), BEN-BAL (128%), BEN-KER (146%) and HOR-ART (117%) lines.

Table 8: Thermal loadings of the transmission lines with VIC renewables connected (forward direction)
Scenario From:
To:
OX1: NSW VIC
X5: BRG BRD
X5: BRD DLP
63: DLP
WAG KER
DLP1 KER
DLP2 WET KER
BEN KER
BAL BEN
FOS BEN
HOR RED
HOR ART
ART WBT
WBT BAL
BAL MOO1
BAL MOO2
DED SM1
DED SM2
Rating (MVA) 417 417 417 915 1000 1000 205 302 240 556 302 301 301 376 240 240 1145 1145
1 51% 72% 66% 17% - - 58% 68% 133% 53% 106% 98% 209% 201% 141% 182% 75% 74%
2 34% 40% 39% 44% 42% - 73% 48% 148% 36% 105% 93% 203% 195% 129% 166% 74% 74%
2B 32% 44% 42% 56% 57% - 54% 12% 126% 27% 97% 101% 211% 201% 137% 176% 72% 72%
3 32% 36% 35% 29% 27% 27% 84% 59% 179% 29% 105% 90% 200% 192% 124% 159% 74% 74%
3B 31% 39% 37% 39% 37% 37% 73% 34% 163% 23% 99% 96% 206% 197% 130% 168% 73% 72%
4 41% 66% 62% 16% - - 31% 36% 88% 29% 53% 58% 77% 74% 60% 76% 71% 70%
5 30% 35% 34% 35% 34% 34% 52% 13% 115% 27% 82% 98% 70% 70% 62% 79% 62% 62%
5B 29% 38% 36% 42% 41% 41% 44% 1% 111% 22% 80% 101% 71% 70% 63% 81% 59% 58%
5C 29% 38% 37% 41% 40% 40% 47% 6% 116% 23% 82% 99% 71% 70% 63% 81% 58% 57%
5B_5C 27% 38% 37% 45% 44% 44% 39% -8% 103% 18% 80% 102% 72% 71% 65% 84% 54% 54%
6 48% 67% 63% 16% - - 45% 68% 123% 50% 92% 118% 76% 74% 63% 81% 73% 72%
7 -12% 23% 22% 36% 31% 31% 35% 36% 114% 29% 119% 88% 66% 67% 58% 75% 54% 54%
8 29% 33% 32% 39% 38% 38% 52% 18% 101% 28% 57% 98% 74% 70% 60% 76% 58% 58%
9 49% 68% 63% 16% - - 45% 65% 128% 47% 93% 117% 76% 74% 63% 81% 73% 73%

Table 9: Thermal loadings of the transmission lines with VIC renewables connected (reversed direction)
Scenario From:
To:
OX1: NSW VIC
X5: BRG BRD
X5: BRD DLP
63: DLP
WAG KER
DLP1 KER
DLP2 WET KER
BEN KER
BAL BEN
FOS BEN
HOR RED
HOR ART
ART WBT
WBT BAL
BAL MOO1
BAL MOO2
DED SM1
DED SM2
Rating (MVA) 417 417 417 915 1000 1000 205 302 240 556 302 301 301 376 240 240 1145 1145
1 -80% -64% -69% -38% - - -139% -152% -85% -72% -26% -85% -61% -42% -51% -64% -66% -65%
2 -49% -46% -49% -58% -31% - -153% -116% -86% -50% -21% -80% -59% -36% -45% -57% -52% -52%
2B -52% -45% -48% -42% -15% - -168% -145% -100% -57% -30% -73% -52% -30% -37% -46% -55% -55%
3 -45% -44% -47% -37% -21% -21% -157% -121% -88% -44% -19% -79% -57% -31% -46% -58% -59% -59%
3B -47% -43% -46% -25% -11% -11% -167% -139% -97% -50% -25% -74% -52% -27% -40% -50% -61% -60%
4 -75% -54% -57% -33% - - -75% -85% -61% -47% -16% -44% -24% -16% -14% -15% -64% -63%
5 -44% -42% -44% -38% -23% -23% -135% -71% -40% -43% -15% -66% -17% -12% -12% -13% -54% -54%
5B -46% -41% -43% -29% -15% -15% -141% -85% -44% -47% -18% -65% -17% -11% -10% -11% -58% -58%
5C -47% -41% -43% -31% -17% -17% -140% -80% -40% -47% -17% -66% -17% -12% -10% -12% -59% -59%
5B_5C -47% -40% -42% -23% -9% -9% -146% -93% -44% -49% -19% -65% -16% -11% -8% -9% -58% -58%
6 -75% -60% -65% -36% - - -141% -146% -84% -67% -32% -81% -22% -16% -12% -13% -68% -68%
7 -71% -51% -55% -48% -14% -14% -189% -65% -10% -41% -5% -100% -29% -21% -20% -24% -53% -53%
8 -42% -41% -43% -39% -25% -25% -127% -79% -30% -46% -11% -64% -34% -20% -18% -21% -53% -53%
9 -77% -62% -66% -37% - - -139% -146% -84% -65% -31% -79% -22% -15% -12% -14% -68% -68%

7.3. Detailed congestion analyses – Scenario 1, 4 and 5 Section 7.2 summarises the worst case loading at each relevant VIC 220 kV transmission line. It does not, however, provides sufficient insights into the contribution factors to each overloading conditions, or the probability of overloading in general. It is the aim of this section to further explore the line loading sensitivity to the renewable connections at different 220 kV buses, and to provide an overview of the relative probability of thermal congestion.
The methodology of congestion study is as follows:
1. For each scenario, connect the renewable generation (with all combinations) to the study case and observe the loadings of the VIC transmission line of interests
2. Plot the “load duration curve” of each transmission line based on all the load flow cases studied. Note that this is not a true representation of the real load duration curve (based on historical loading), but the possibility of overloading under all sampled cases which contain different possible combinations of network demand and renewable generation dispatch scenarios.
3. Compare the load duration curve for Scenario 4 (AEMO RIT-T) and Scenario 5 (TransGrid complete augmentation) against Scenario 1 (Base case, no augmentation) and report findings.
4. Carry out regression analysis to identify correlation of the loading of selected VIC transmission line to the VIC renewable injection. Report the coefficients to each renewable injection.
The results are presented in the following sub-sections.
7.3.1. Probability of overloading The probability of overloading for the respective regional VIC 220 kV transmission lines, based on the sampled test cases, are shown in Table 10. Key observations are:
• Most of the regional VIC 220 kV lines of interest will experience up to 38% of probability being thermally overloaded in Scenario 1 (Base case, no augmentation).
• The AEMO RIT-T full augmentation option (Scenario 4) can resolve the thermal overloads with the amount of renewable generations (2,541 MW) are connected.
• There is a 30% probability for the WET-KER line to experience up to 135% (see Table 9) thermal overloading under TransGrid’s complete option (Scenario 5). It is however not much different from the existing (Scenario 1) situation. Additional augmentations can be introduced to scenario 5 to address these overloads which will result in higher economic benefits compared to what is calculated with the presently identified scenario 5 augmentations.
Figure 3 to Figure 10 show the line loading for each of the regional VIC 220 kV lines considered in this study.
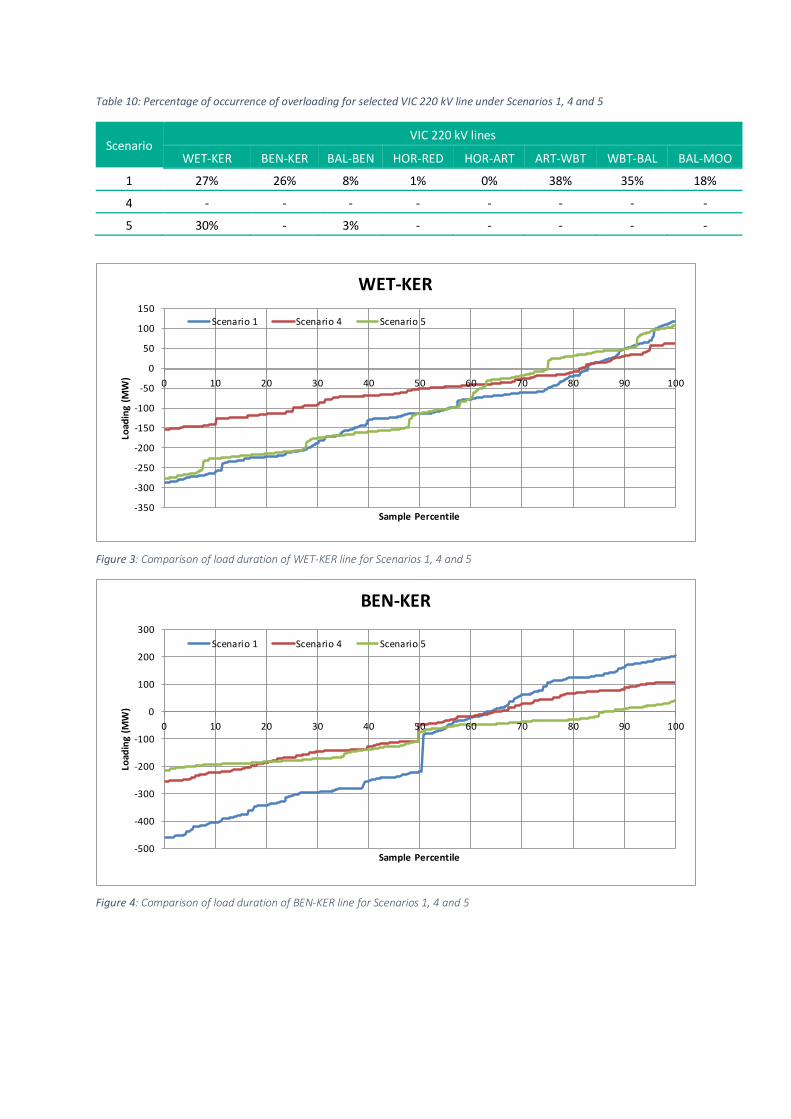
Table 10: Percentage of occurrence of overloading for selected VIC 220 kV line under Scenarios 1, 4 and 5
Scenario VIC 220 kV lines
WET-KER BEN-KER BAL-BEN HOR-RED HOR-ART ART-WBT WBT-BAL BAL-MOO
1 27% 26% 8% 1% 0% 38% 35% 18%
4 - - - - - - - -
5 30% - 3% - - - - -
Figure 3: Comparison of load duration of WET-KER line for Scenarios 1, 4 and 5
Figure 4: Comparison of load duration of BEN-KER line for Scenarios 1, 4 and 5
-350
-300
-250
-200
-150
-100
-50
0
50
100
150
0 10 20 30 40 50 60 70 80 90 100
Load
ing
(MW
)
Sample Percentile
WET-KER
Scenario 1 Scenario 4 Scenario 5
-500
-400
-300
-200
-100
0
100
200
300
0 10 20 30 40 50 60 70 80 90 100
Load
ing
(MW
)
Sample Percentile
BEN-KER
Scenario 1 Scenario 4 Scenario 5

Figure 5: Comparison of load duration of BAL-BEN line for Scenarios 1, 4 and 5
Figure 6: Comparison of load duration of HOR-RED line for Scenarios 1, 4 and 5
-300
-200
-100
0
100
200
300
400
0 10 20 30 40 50 60 70 80 90 100Load
ing
(MW
)
Sample Percentile
BAL-BEN
Scenario 1 Scenario 4 Scenario 5
-100
-50
0
50
100
150
200
250
300
350
0 10 20 30 40 50 60 70 80 90 100
Load
ing
(MW
)
Sample Percentile
HOR-RED
Scenario 1 Scenario 4 Scenario 5
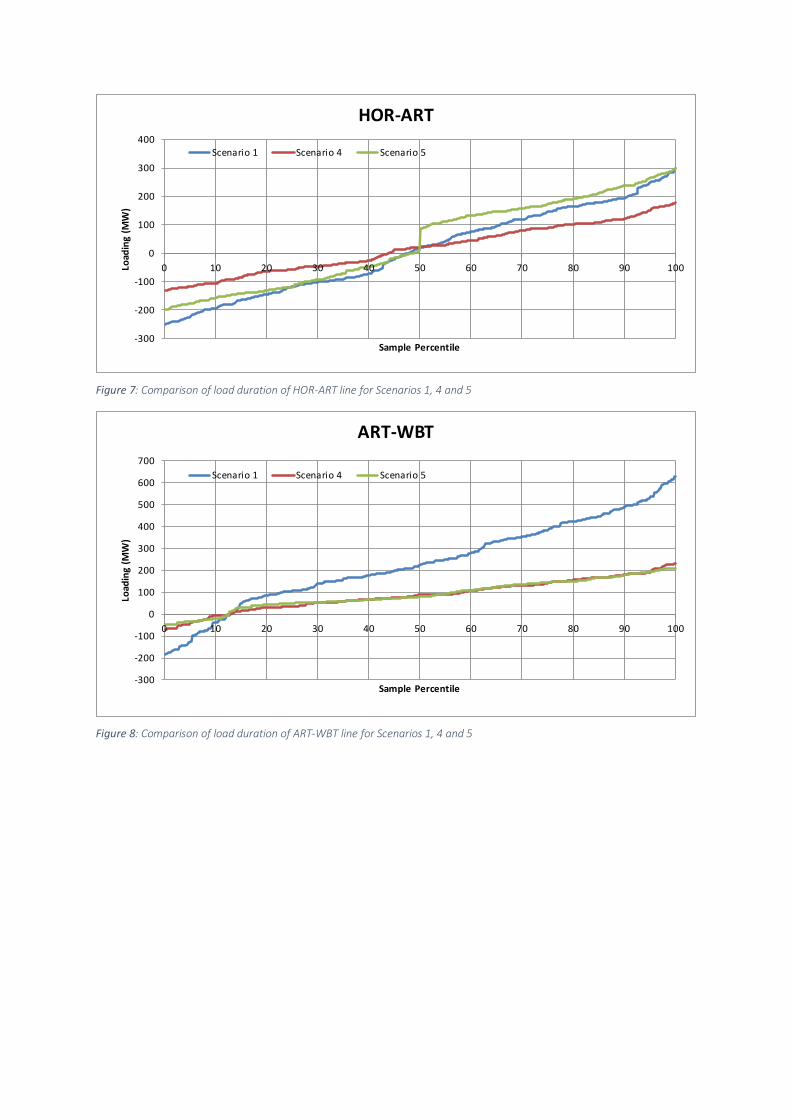
Figure 7: Comparison of load duration of HOR-ART line for Scenarios 1, 4 and 5
Figure 8: Comparison of load duration of ART-WBT line for Scenarios 1, 4 and 5
-300
-200
-100
0
100
200
300
400
0 10 20 30 40 50 60 70 80 90 100Load
ing
(MW
)
Sample Percentile
HOR-ART
Scenario 1 Scenario 4 Scenario 5
-300
-200
-100
0
100
200
300
400
500
600
700
0 10 20 30 40 50 60 70 80 90 100
Load
ing
(MW
)
Sample Percentile
ART-WBT
Scenario 1 Scenario 4 Scenario 5

Figure 9: Comparison of load duration of WBT-BAL line for Scenarios 1, 4 and 5
Figure 10: Comparison of load duration of BAL-MOO line for Scenarios 1, 4 and 5
7.3.2. Analysis of other operating conditions leading to overloading the selected regional VIC transmission lines
While additional renewable generation is the primary cause for overloading some of the regional VIC 220 kV lines, it is also important to understand the influence from other factors, such as region demand, other generation in the regions and interconnector transfers.
From the sampled cases in Scenario 1 (base case), Table 11 shows the cases in which selected line overloading occurs. Key observations are:
• The three regional VIC lines, ART-WBT, WBT-BAL and BAL-MOO are always overloaded irrespective of network operating conditions.
• HOR-RED line will be overloaded when local demand is low and Horsham renewable generation is high.
-400
-200
0
200
400
600
800
0 10 20 30 40 50 60 70 80 90 100
Load
ing
(MW
)
Sample Percentile
WBT-BAL
Scenario 1 Scenario 4 Scenario 5
-200
-100
0
100
200
300
400
500
0 10 20 30 40 50 60 70 80 90 100
Load
ing
(MW
)
Sample Percentile
BAL-MOO
Scenario 1 Scenario 4 Scenario 5

• BAL-BEN line will be overloaded when local demand is low and Ballarat (e.g. Stockyard Hills WF) renewable generation is high.
• WET-KER and BEN-KER lines will be overloaded when Kerang renewable generation is high.
Table 11: Case distribution of overloaded lines
Case WET-KER BEN-KER BAL-BEN HOR-RED ART-WBT WBT-BAL BAL-MOO
1 - Y Y - Y Y Y
2 - Y Y - Y Y Y
3 Y Y Y Y Y Y Y
4 Y - - - Y Y Y
5 Y - - - Y Y Y
6 Y - - - Y Y Y
7 - Y Y - Y Y Y
8 - Y - - Y Y Y
9 Y Y - - Y Y Y
10 Y Y - - Y Y Y
7.3.3. Contribution factor of each renewable generation location to the line loading
Regression analysis over a number of variables was performed to identify the relative contribution of each variable to the loading of the selected line. The general formula is shown in equation 1 below:
𝑦 = ∑ 𝑎𝑖𝑥𝑖𝑛1 (1)
where:
y = output variable (i.e. line loading),
x = input variable (e.g. renewable generation, region demand, interconnector flows), and
a = coefficient of the corresponding variable
n = No. of variables
The coefficient factor of each renewable generator to the corresponding line loading is shown in Table 12, Table 13, and Table 14 for Scenarios 1, 4 and 5 respectively. The multiplication of the renewable generation (in MW) with the corresponding coefficient will be the MW change in the selected line. For example, in Scenario 1, for every 100 MW change in Kerang generation, approximately 41.6 MW will flow to the Kerang-Wemen line. Note that high correlation (R-squared from 97% to 99%) is obtained for all cases suggesting good correlation between the inputs and output variables. Detailed statistics are included in Appendices D to F.

Table 12: Sensitivity of renewable generation to the VIC 220 kV lines (Scenario 1)
Generation Variable
VIC 220 kV lines WET-KER BEN-KER BAL-BEN HOR-RED HOR-ART ART-WBT WBT-BAL BAL-MOO
Kerang -0.416 -0.488 -0.181 0.053 -0.043 -0.023 0.286 0.184
Ararat 0.057 -0.060 0.001 0.072 -0.087 0.679 0.628 0.201
Mortlake -0.148 0.198 0.257 0.230 -0.210 -0.200 0.140 -0.008
Stockyard -0.141 0.190 0.325 0.240 -0.219 -0.215 0.116 0.294
Horsham 0.000 0.039 0.193 0.475 0.501 0.529 0.810 0.236
Moorabool -0.146 0.200 0.281 0.234 -0.213 -0.216 0.151 -0.008
Table 13: Sensitivity of renewable generation to the VIC 220 kV lines (Scenario 4)
Generation Variable
VIC 220 kV lines WET-KER BEN-KER BAL-BEN HOR-RED HOR-ART ART-WBT WBT-BAL BAL-MOO
Kerang -0.225 -0.237 -0.065 0.045 -0.037 -0.050 0.079 0.058
Ararat 0.028 -0.029 -0.010 0.017 -0.020 0.232 0.215 0.065
Mortlake -0.094 0.119 0.196 0.152 -0.142 -0.123 0.009 -0.023
Stockyard -0.088 0.113 0.213 0.151 -0.140 -0.131 -0.002 0.074
Horsham -0.015 0.038 0.148 0.253 0.247 0.143 0.268 0.073
Moorabool -0.089 0.114 0.201 0.148 -0.137 -0.130 -0.001 -0.092
Table 14: Sensitivity of renewable generation to the VIC 220 kV lines (Scenario 5)
Generation Variable
VIC 220 kV lines WET-KER BEN-KER BAL-BEN HOR-RED HOR-ART ART-WBT WBT-BAL BAL-MOO
Kerang -0.392 -0.154 -0.008 0.203 -0.176 -0.125 0.117 0.092
Ararat 0.033 -0.005 0.008 0.030 -0.034 0.248 0.252 0.087
Mortlake -0.270 0.088 0.206 0.278 -0.249 -0.128 0.069 0.016
Stockyard -0.261 0.097 0.238 0.288 -0.258 -0.133 0.077 0.135
Horsham -0.119 0.048 0.190 0.485 0.511 0.125 0.311 0.114
Moorabool -0.266 0.087 0.216 0.280 -0.250 -0.130 0.081 -0.043

7.4. Amount of VIC renewable integration without overloading the network during system normal
The coefficient factors obtained in Section 7.3.3 do not only show the relative loading sensitivity to each renewable generation, but also provide a mechanism to prioritise the reducing renewable generation in order to avoid thermal overloading, i.e. the generation that causes the largest increase in line loading will be reduced first9. Using a set of load flow cases where all 6 renewable sites initially generate maximum active power, the renewable generators that are more responsible for line overloading are gradually reduced until all VIC 220 kV lines no longer overloaded. Table 15 shows the maximum regional VIC renewable generations that can be integrated into the network without causing congestion. Note that the actual renewable generation will be dependent on other variables such as local demand and interconnector flows. The values calculated in this study provide a comparison among the nine scenarios based on the same set of load flow cases.
Key observations are:
• The maximum of 1,621 MW of renewable generation permissible in regional VIC area without being constrained for Scenario 1 (base case). The result shows that without augmentation, Ararat has to be constrained to 0 (if Horsham is to be dispatched more), Stockyard Hill will also be constrained. Similarly, Kerang generation will be limited to 320 MW.
• The interconnection to NSW (Scenarios 2 and 3) can increase the VIC renewable generation by permitting more power generated in Kerang. However, the renewable generation in the Horsham-Ararat-Waubra-Ballarat-Moorabool path is still restricted due to no network augmentations in the area.
• With no transmission line being overloaded, Scenario 4 can achieve a maximum of 2,564 MW of renewable generation. This is followed by Scenario 5 (2,444 MW)10.
• Scenarios 6 and 9 enable similar amount of renewable generation. The additional Snowy upgrade does not have any direct influence on the western VIC renewable generation.
• The development of NSI (Scenario 7) will enable more power flow from VIC through Kerang, Wemen, Red Cliffs to Buronga and Robertstown. Therefore, the Kerang generation has to be reduced (from case 1) to avoid overloading, resulting in a reduction in total VIC renewable generation allowable without being constrained.
• Similarly, the development of Horshamlink (Scenario 8) will encourage VIC renewable power flow from Ballarat to Tungkillo via Horsham. Reduction in the VIC renewable generation is needed to make room for the additional power flow to/from South Australia. Alternatively, further reinforcement is needed to accommodate the additional renewable generation from the two states.
9 This is similar to the effect of coefficients in constraint equations used in NEMDE. However, actual generation dispatch process involves marginal loss factor (MLF) which is not modelled in this report 10 Additional augmentations in the Victorian 220 kV network will increase this

Table 15: Maximum allowable VIC renewable generation without causing thermal overloading
Scenario Estimated maximum regional VIC renewable generation (MW)
Kerang Ararat Mortlake Stockyard Horsham Moorabool Total
1 320 0 400 234 346 321 1,621
2 560 0 400 214 346 321 1,841
3 600 0 400 274 346 321 1,941
4 600 323 400 534 386 321 2,564
5 480 323 400 534 386 321 2,444
6 360 323 400 534 386 321 2,324
7 0 323 400 534 286 321 1,864
8 80 323 400 534 386 321 2,043
9 360 323 400 534 386 321 2,324
7.5. Maximum VIC renewable generation based on N-1 contingency consideration
Three critical line contingencies are used to determine the maximum VIC renewable generation allowable before overloading any of the regional VIC 220 kV transmission lines. These lines are:
• Contingency 1: Ballarat – Waubra (BAL-WBT)
• Contingency 2: Ballarat – Bendigo (BAL-BEN)
• Contingency 3: Ballarat – Moorabool (BAL-MOO)
The same set of load flow cases used for determining the maximum VIC renewable generation under system intact condition were used. The renewable generations were progressively scaled back until no line is overloaded after the corresponding contingency. The results are summarized in Table 16 below:
Table 16: Maximum allowable VIC renewable generation under N-1 contingency
Scenario Maximum RE generation N
(MW)
Contingency 1 BAL-WBT (MW)
Contingency 2 BAL-BEN (MW)
Contingency 3 BAL-MOO (MW)
Maximum RE generation N-1
(MW) 1 1,621 1,585 1,601 1,381 1,381
2 1,841 1,661 1,800 1,523 1,523
3 1,941 1,701 1,921 1,661 1,661
4 2,564 2,464 2,464 2,464 2,464
5 2,444 2,344 2,284 2,324 2,284
6 2,324 2,004 2,204 2,204 2,004
7 1,864 1,764 1,684 1,784 1,684
8 2,043 1,944 1,964 1,944 1,944
9 2,324 2,003 1,904 2,204 1,904

Key observations are:
• All scenarios enable higher renewable integration to the regional VIC network under both system intact and N-1 contingencies.
• While Scenario 4 can export all VIC renewables studied in this report at system intact condition, there is a 200 MW reduction for N-1 contingency due to the trip of one of the three WBT-BAL lines. The N-1 contingency capacities between Scenarios 4 and 5 are similar.
The limiting factors for each scenario are explained in Table 17 as follows:
Table 17: Limiting factor of each scenario under N-1 contingency
Scenario Critical contingency Constraint mechanism
1 BAL-MOO The trip of one of the two BAL-MOO lines will reduce the VIC generation by the amount similar to the line rating (240 MVA).
2 BAL-MOO The trip of one of the two BAL-MOO lines will reduce the VIC generation by the amount similar to the line rating (240 MVA).
3 BAL-MOO The trip of one of the two BAL-MOO lines will reduce the VIC generation by the amount similar to the line rating (240 MVA).
4 BAL-WBT The remaining two BAL-WBT lines can only carry a maximum of 752 MVA (376 MVA each). The sum of Horsham (386 MW) and Ararat (300 MW) and the existing Waubra WF will exceed this limit.
5 BAL-BEN The trip of the only one BAL-BEN line will divert all power flow north of Bendigo (e.g. Kerang plus power from DLP) to KER-WET line which has a capacity of 205 MVA only.
6 BAL-WBT This is the partial AEMO RIT-T option plus Snowy upgrade and the constraint mechanism is similar to that for Scenario 4.
7 BAL-BEN Similar to Scenario 5.
8 BAL-BEN HOR-RED is the limiting element as Horshamlink will increase flow into Horsham.
9 BAL-BEN This partial AEMO-RIT-T relieves the thermal constraint in the ART-WAU-BAL corridor and therefore the trip of BAL-BEN which causes the KER-WET line to become the limiting factor.
Note that the maximum renewable generation is dependent on the local demand near the renewable generation sources, i.e. consumption of generation locally will reduce the network export to VIC load centre via the 220 kV network.

7.6. Augmentation impact on VIC-NSW transfer capacity The impact of VIC renewable integration under the various scenarios on the VIC-NSW transfer capacity is discussed in Table 1811.
Table 18: Summary on VIC-NSW transfer capacity
Scenario Additional
VIC export to NSW (MW)
Additional VIC import from NSW
(MW)Comment
1 No change No change VIC renewables displace existing thermal generators. No interconnector augmentation
2 420 310 Single circuit 330 kV KER-DLP increases the transfer limit. This scenario assumes transfer trip of new renewable generation for trip of Kerang – Darlington Point line.
2B 570 155 Connecting additional 300 MW renewables at Kerang 330 kV bus will increase VIC export by approx. 150 MW and reduce VIC import by approx. 150 MW, compared to scenario 2. This scenario assumes transfer trip of new renewable generation for trip of Kerang – Darlington Point line.
3 540 420 Double circuit 330 kV KER-DLP increases the transfer limit. Note that the additional flow path encourages extra power flow from Ballarat to Kerang via Bendigo, therefore creating higher line overload. Remedial action (e.g. phase-shifting transformer or series reactor limiting the flow, or increase the line thermal capacity) will facilitate higher transfers.
3B 740 220 Connecting additional 300 MW renewables at Kerang 330 kV bus will increase VIC export by approx. 200 MW and reduce VIC import by approx. 200 MW, compared to Scenario 3.
4 No change No change VIC renewables displace existing thermal generators. No interconnector augmentation. Regional VIC transmission network augmentation has no thermal impact to VIC-NSW interconnectors.
5 670 465 Double circuit 330 kV DLP-KER-MPT-BAL increases the transfer limit.
6 480 500 Additional double 330kV circuit from South Morang to Murray via Dederang increases the generation from Snowy (e.g. Snowy 2.0) to VIC. VIC export is limited due to the thermal constraints north of Murray/Snowy.
7 670 465 Inter-connector flow increases due to the Scenario 5 augmentation. However, it cannot increase further as some VIC 220 kV lines will be overloaded. NSI and the corresponding upgrade from Buronga to Wagga via Darlington Point can increase the flow to/from VIC via OX1. However, the flow cannot be increase from current level unless OX1 is upgraded.
8 670 465 Inter-connector flow increases due to the Scenario 5 augmentation. However, it cannot increase further as some VIC 220 kV lines will be overloaded. Horshamlink can increase the transfer between VIC and SA but not with NSW.
11 Note that the transfer limit is based on thermal loading and voltage stability after N-1 contingency, and no transient stability is considered in this report.

Scenario Additional
VIC export to NSW (MW)
Additional VIC import from NSW
(MW)Comment
9 No change No change VIC renewables displace existing thermal generators. No interconnector augmentation. Regional VIC transmission network augmentation has no thermal impact to VIC-NSW interconnectors.
Note that the above transfer limits were derived using a limited number of system snapshots. Although effort is made to cover a wide range of operating conditions, the above transfer limits may vary under extreme operating conditions due to deep network limitations.
8. Additional sensitivity studies Section 7 identified the capability of each scenario for accommodating renewable generations in the regional VIC network and the limiting factors. This section aims to refine the configurations of some of these options in order to optimize the performance. Table 19 shows the modifications made to selected scenarios.
Table 19: List of modifications of the scenarios selected for additional studies
Scenario Modifications
2 Convert the originally proposed 330 kV KER-DLP single circuit to 220 kV single circuit of 417 MVA rating
3 Convert the originally proposed 330 kV KER-DLP double circuit to 220 kV double circuit of 417 MVA rating each circuit
5 Double circuit WET-KER and BEN-BAL lines to relieve the thermal constraints identified
7 Increase the OX1 rating from 300 MVA to 417 MVA
Change in KER-DLP utilisation
Table 20 shows the maximum active power flows for different KER-DLP line options (e.g. 330 kV or 220 kV). The results show that:
• The 330 kV options give more power flow as the line impedance reduces • The 220 kV options, however, achieve higher utilisation as the capacities for 330 kV and 220
kV line options are assumed to be 1,000 MVA and 400 MVA respectively.
It is worth nothing that further connection of renewables along the KER-DLP path will directly increase the utilisation of the line(s).

Table 20: Comparison of maximum power flow and percentage utilization of different KER-DLP line configurations
Scenario KER-DLP line(s) loading
KER-DLP line(s) utilisation
(export / import) (export / import)
2 (330 kV KER-DLP single cct) 422 MW / 312 MW 42% / 31%
2 (modified, 220 kV KER-DLP single cct)) 292 MW / 217 MW 70% / 52%
3 (330 kV KER-DLP double cct) 539 MW / 427 MW 27 % / 21%
3 (modified, 220 kV KER-DLP double cct)) 428 MW / 331 MW 51% / 40%
Change in VIC renewable generation and NSW-VIC transfers
Table 21 shows the renewable generation that can be accommodated with the modified scenarios 2, 3, 5 and 7. Table 22 gives change in VIC-NSW transfers with the identified modifications. Key observations are:
• With the 330 kV KER-DLP lines converted to 220 kV, impedance increases, resulting in reduction in VIC export from the regional VIC renewables. This is seen in the modified cases of Scenario 2 and 3.
• In the modified Scenario 5, after removing the constraints from WET-KER and KER-BEN lines, the maximum VIC renewable generation is the similar to Scenario 4.
• Modification made for Scenario 7 results in increasing VIC renewable generation as well as NSW-VIC transfers (in both directions).
Table 21: Sensitivity study: Comparing maximum allowable VIC renewable generation under N-1 contingency
Scenario System Intact
Contingency 1 BAL-WBT
Contingency 2 BAL-BEN
Contingency 3 BAL-MOO
Maximum RE generation (N-1)
2 1,841 1,661 1,800 1,523 1,523
2 (mod) 1,741 1,637 1,740 1,467 1,467
3 1,941 1,701 1,921 1,661 1,661
3 (mod) 1,881 1,661 1,923 1,560 1,560
5 2,444 2,344 2,284 2,324 2,284
5 (mod) 2,564 2,364 2,464 2,464 2,364
7 1,864 1,764 1,684 1,784 1,684
7 (mod) 1,964 1,864 1,924 1,864 1,864

Table 22: Sensitivity Study: Change in VIC-NSW transfers
Scenario
VIC export to NSW (MW)
VIC import from NSW (MW) Comment
2 420 310
2 (mod) 290 220 DLP-KER flow reduces for higher impedance
3 540 420
3 (mod) 430 330 DLP-KER flow reduces for higher impedance
5 670 465
5 (mod) 670 465 No significant change from Scenario 5 as it's more internal VIC augmentation.
7 670 465
7 (mod) 750 550 Higher OX1 rating allow more interconnector flow

9. Further issues to consider This study examines the steady state performance of each scenario and the corresponding steady state capacity available for transferring the proposed renewable generations in the regional VIC network. Some further points for consideration are:
1. This study considers only about 2,500 MW of renewable integrating into the regional VIC transmission network. According to AEMO’s RIT-T PSCR document [3], this level will be reached in either 2021 (base case) or 2020 (sensitivity) scenarios – see Figure 11. It will take more than 5 years to complete any of the transmission augmentation project. Therefore, it is likely that some of the Western VIC renewable generations are to be constrained.
2. Scenario 4, which is proposed by AEMO, will be unable to address the potential overloading issue beyond 2021, based on the thermal capacity calculated in this study.
Figure 11: AEMO projected Western VIC renewable generation [3]
3. AEMO proposes to reinforce the network by either rebuilding double circuits or building extra single circuits on the existing easement for the regional VIC network. Circuit rebuild will cause considerable period of power disruption. In addition, having two single circuits in the same easement cannot have risk diversity, i.e. a bush fire or thunderstorm may take out both circuits in the same area.
4. TransGrid’s complete scenario (Scenario 5) provides the following additional benefits:
a. Geographical diversity: the new flow path can make the network less prone to common mode of failure.
b. Increase interconnection between NSW and VIC, thus reducing the difference in regional electricity prices.
c. New path for renewable connections: the proposed route can enable new renewable sites to connect to the network more economically.

5. Thermal congestions at KER-WET and BAL-BEN lines are seen in Scenario 5. Further upgrade of these two lines will relieve the overloading situation and further increase the capacity of this option for connecting more renewable generations.

10. Conclusions Based on the analysis performed, the following key conclusions can be made.
Renewable generation capacity in western Victoria With over 2,500 MW of renewable generations connecting to regional VIC network:
• The renewable generation will be constrained with no augmentation (Scenario 1) • No constraint for Scenario 4, and small constraint for Scenario 5 • No constraint for Scenario 5 if additional KER-WET and KER-BAL lines are installed
Impact on VIC-NSW transfer capacity • All scenarios with NSW connection augmentation (e.g. Scenarios 2, 3, 5, 6, 7 and 8) have
increased the VIC-NSW interconnector transfers.
References
[1] AEMO, “National transmission network development plan (NTNDP),” December 2016.
[2] AEMO, Victorian Annual Planning Report, June 2016.
[3] AEMO, “Project Specification Consultation Report (PSCR) - Western Victoria Renewable Integration project,” April 2017.

Appendix A – Single line diagrams
Figure 12: Scenario 1 – Original regional Victoria network (Base case)
SOUTH AUSTRALIAN TRANSMISSION NETWORK 2015/2016SA LOAD = 1500 MW IMPORT = 28 MWMON, JUL 03 2017 17:02Scenario 1
53900SEAS
1.041286.331.2
SW
111.5
353403HEY500A
0.987493.518.8
373423HEY_22C
1.05023.122.0
373443HEY_22E
354903MRT500A
1.000500.018.0
127.3
185.5 127.0
88.9 357913TYR500B
0.999499.717.8
291.4
273.6
290.7
229.1
354833MOO500D
1.022511.213.3
520.4
128.1524.0
245.2
230102BRD220A
1.071235.711.2
230812BRG220B
1.055232.212.4
63.5
222012DLP220B
1.038228.310.1
SW
0.0
17.4
41.4
17.6
7.1
212002DLP330A
1.038342.69.9
230402BKH220A
1.034227.611.8
1 14.2
R1
R20.0
26.8
8.8
35.4
8.9
14.6
326103RED220A
1.058232.712.6
SW
0.0
27.9
12.327.9
7.7
1.051289.021.8
SW
173.4
407.4
108.8417.3
58.2
407.4
108.8417.3
58.2
1.0000 1.0000
272.2
19.1
* 269.9
33.9
* 2.1
0.4
HEY: -814.7 MW
365.1
44.1
367.5
225.9
1.052347.310.6
0.9350
1.05023.122.0
0.4
SW
306213MLK_DC2
0.996164.315.4
144.2
92.8R
C10.0
29.7
C20.0
29.7
C30.0
14.9
0.94
85
1.00
00144.2
18.4
144.2
25.7
328313WET220B
1.069235.210.9
73.4
53.5
72.7
43.3
323803KER220A
1.070235.37.4
62.9 0.1
63.9 31.7
30.8 57.8
30.9 4.1
QNI: -307.4 MW
218932WAG330D
343413HEY275B
N S W S u m m a r y : G e n e r a t i o n : 8 0 6 0 . 3 6 M W L o a d s : 8 4 0 8 . 4 9 M W L o s s e s : 1 5 4 . 5 5 M W L o a d + l o s s e s : 8 5 6 3 . 0 4 M W
V I C S u m m a r y : G e n e r a t i o n : 4 4 1 3 . 7 2 M W L o a d s : 5 6 9 8 . 6 0 M W L o s s e s : 1 4 0 . 1 3 M W L o a d + l o s s e s : 5 8 3 8 . 7 3 M W S A S u m m a r y : G e n e r a t i o n : 2 4 3 8 . 2 5 M W L o a d s : 1 4 4 5 . 5 8 M W L o s s e s : 1 6 9 . 4 3 M W L o a d + l o s s e s : 1 6 1 5 . 0 0 M W
322803HOR220A
1.049230.916.7
42 .3
40 .9
41 .6
12 .4
65,66: -102.0 MW
OX1: -27.9 MW060:0.8 MW
272002DLP_33A
1.03834.310.8S
W
17.2
1.0000
1.0000 1.0000
10 .5
43 .3
* 10.4
26.0* 0
.0
17
.2
272012DLP_33B
1.03634.210.4S
W
0.0
1.0000
1.0000 1.0000
6.9
1. 9
* 6.9
1.9
* 0
.0
0. 0
19 .0 36.5
18.8
7.5
32817ARTS
1.000220.020.6
86.1
94.7
88.7
103.4
392833HOR220R
1.062233.716.7
0.1
44.4
0.1
44.9
320803BEN220A
1.054231.96.4
30.2
27.0
30.4
1.9
393803KER220R
1.070235.57.4
0.0
2. 7
0. 0
2.7320403BAL220A
1.008221.711.8
11 4.7
79 .4
11 2.3
79 .6
322303FOS220A
1.059232.96.1
16 .5
29 .3
16 .4
25 .8
302803HOR_S1
1.172257.816.6
1 0.0
49.5R
0. 0
49 .5
0.1
44 .9
303803KER_S1
1.077236.97.4
1 0.0
2.8R
0.0
2.8
0.0
2.7
328163WBT220B
1.002220.516.5
273.9
81.0
278.6
68.1
319.2
109.1
325.6
88.9
1.0
000
0.9
350
27 3.0
19 .2 27 2.8
33 .8
355833APD500C
0.980489.818.4
R10.0
96.0
R20.0
96.0
197.3
186.2
197.1
215.9
196.1
185.1
195.9
214.7
1.0000
0.9375 1.0000
* 269 .3
20 .2
26 9.5
5. 9
* 0.0
0. 0
200402BKH_22A
1.00822.212.1
2 22.8
3.4
C1
C2
SW
0.0
1.0000
1.0200
2.7
4. 1
2. 7
4.1
1.0000
1.0200
2.7
4. 1
2. 7
4.1
SW
107.8
324803MOO220A
1.007221.611.2
R10.0
101.4
SW
0.0
19 .4
6. 7
19 .4
2. 1
24 .9
10 .5
24 .8
1. 5
Bus - VOLTAGE (kV/PU)/ANGLEBranch - MW/MvarEquipment - MW/Mvar
kV: <=150.000 <=240.000 <=280.000 <=350.000 <=550.000>550.000

Figure 13: Scenario 2 – New 330 kV double circuit from Darlington Point to Kerang initially strung one side
SOUTH AUSTRALIAN TRANSMISSION NETWORK 2015/2016SA LOAD = 800 MW EXPORT = 510 MWMON, JUL 03 2017 17:01Scenario 2
53900SEAS
SW
353403HEY500A
373423HEY_22C
373443HEY_22E
354903MRT500A
357913TYR500B
354833MOO500D
230102BRD220A
230812BRG220B
222012DLP220BSW
212002DLP330A
230402BKH220A
1
R1
R2
326103RED220A
SW
SW
1.0000 1.0000
HEY: -933.9 MW
0.9625
SW
306213MLK_DC2
C1
C2
C3
0.94
81
1.00
00
328313WET220B
323803KER220A
QNI: -269.2 MW
218932WAG330D
343413HEY275B
N S W S u m m a r y : G e n e r a t i o n : 6 4 6 9 . 0 6 M W L o a d s : 7 6 1 6 . 6 4 M W L o s s e s : 3 6 9 . 1 8 M W L o a d + l o s s e s : 7 9 8 5 . 8 3 M W
V I C S u m m a r y : G e n e r a t i o n : 2 5 2 8 . 7 4 M W L o a d s : 4 4 2 1 . 9 8 M W L o s s e s : 3 3 9 . 1 5 M W L o a d + l o s s e s : 4 7 6 1 . 1 3 M W S A S u m m a r y : G e n e r a t i o n : 1 9 3 3 . 9 7 M W L o a d s : 7 5 0 . 1 3 M W L o s s e s : 2 4 7 . 4 6 M W L o a d + l o s s e s : 9 9 7 . 5 9 M W
322803HOR220A
65,66: -765.1 MW
OX1: -147.7 MW060:129.7 MW
272002DLP_33A S
W
1.0000
1.0000 1.0000
272012DLP_33B S
W
1.0000
1.0000 1.0000
32817ARTS
392833HOR220R
320803BEN220A
393803KER220R
320403BAL220A
322303FOS220A
302803HOR_S1
1
303803KER_S1
1
328163WBT220B
1.0
000
0.9
901
355833APD500C
R1
R21.0000
0.9875 1.0000
200402BKH_22A
2
C1
C2
SW
1.0000
1.0000
1.0000
1.0000
333803KER330A
1.0000
1.0000
SW
324803MOO220A
R1
SW
Bus - NONEBranch - NONEEquipment -
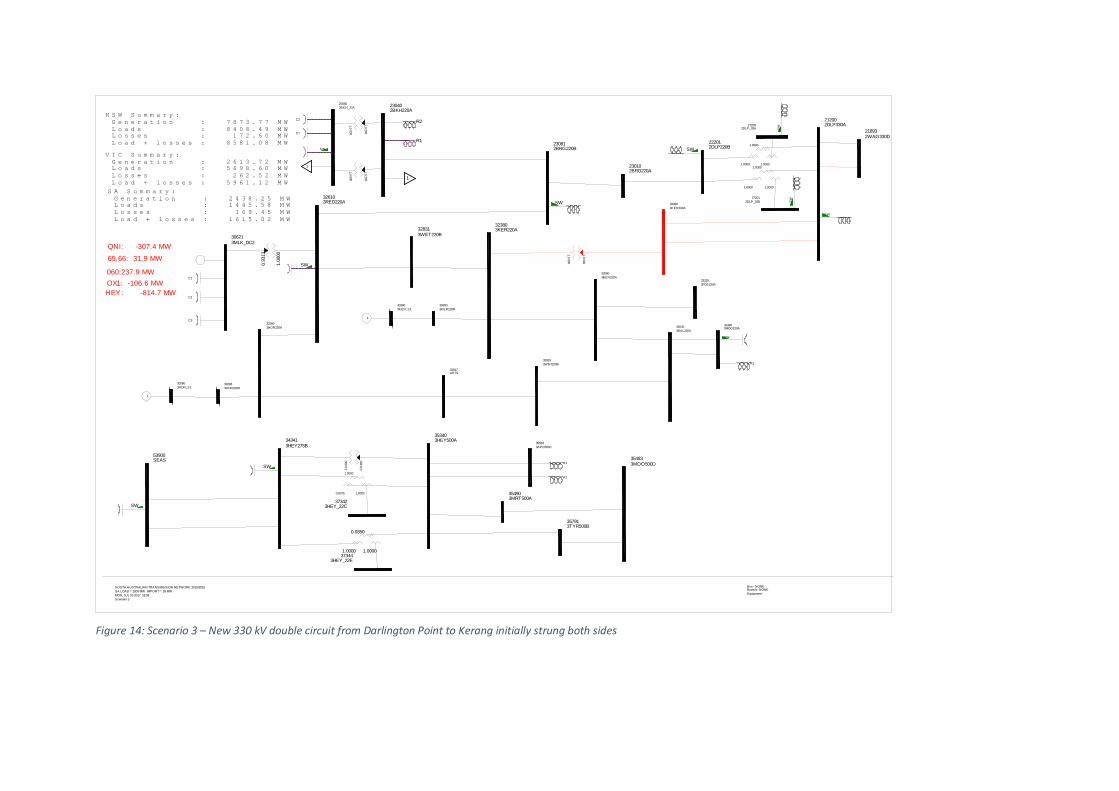
Figure 14: Scenario 3 – New 330 kV double circuit from Darlington Point to Kerang initially strung both sides
SOUTH AUSTRALIAN TRANSMISSION NETWORK 2015/2016SA LOAD = 1500 MW IMPORT = 28 MWMON, JUL 03 2017 16:58Scenario 3
53900SEAS
SW
353403HEY500A
373423HEY_22C
373443HEY_22E
354903MRT500A
357913TYR500B
354833MOO500D
230102BRD220A
230812BRG220B
222012DLP220BSW
212002DLP330A
230402BKH220A
1
R1
R2
326103RED220A
SW
SW
1.0000 1.0000
HEY: -814.7 MW
0.9350
SW
306213MLK_DC2
C1
C2
C3
0.93
13
1.00
00
328313WET220B
323803KER220A
QNI: -307.4 MW
218932WAG330D
343413HEY275B
N S W S u m m a r y : G e n e r a t i o n : 7 8 7 3 . 7 7 M W L o a d s : 8 4 0 8 . 4 9 M W L o s s e s : 1 7 2 . 6 0 M W L o a d + l o s s e s : 8 5 8 1 . 0 8 M W
V I C S u m m a r y : G e n e r a t i o n : 2 6 1 3 . 7 2 M W L o a d s : 5 6 9 8 . 6 0 M W L o s s e s : 2 6 2 . 5 2 M W L o a d + l o s s e s : 5 9 6 1 . 1 2 M W S A S u m m a r y : G e n e r a t i o n : 2 4 3 8 . 2 5 M W L o a d s : 1 4 4 5 . 5 8 M W L o s s e s : 1 6 9 . 4 5 M W L o a d + l o s s e s : 1 6 1 5 . 0 2 M W
322803HOR220A
65,66: 31.9 MW
OX1: -106.6 MW060:237.9 MW
272002DLP_33A S
W
1.0000
1.0000 1.0000
272012DLP_33B S
W
1.0000
1.0000 1.0000
32817ARTS
392833HOR220R
320803BEN220A
393803KER220R
320403BAL220A
322303FOS220A
302803HOR_S1
1
303803KER_S1
1
328163WBT220B
1.0
000
0.9
350
355833APD500C
R1
R21.0000
0.9375 1.0000
200402BKH_22A
2
C1
C2
SW
1.0000
1.0200
1.0000
1.0200
333803KER330A
1.0000
1.0000
SW
324803MOO220A
R1
SW
Bus - NONEBranch - NONEEquipment -

Figure 15: Scenario 4 – AEMO VIC RIT-T 220 kV line reinforcement
SOUTH AUSTRALIAN TRANSMISSION NETWORK 2015/2016SA LOAD = 1500 MW IMPORT = 28 MWMON, JUL 03 2017 17:06 Scenario 4
53900SEAS
1.047288.09.2
SW
353403HEY500A
1.054526.921.4
373423HEY_22C
1.04523.018.1
373443HEY_22E
354903MRT500A
1.065532.325.7
357913TYR500B
1.067533.623.3
354833MOO500D
1.070534.827.7
230102BRD220A
1.074236.221.9
230812BRG220B
1.062233.721.6
222012DLP220B
1.032226.923.2
SW
212002DLP330A
1.038342.723.3
230402BKH220A
1.024225.318.3
1
R1
R2
326103RED220A
1.067234.721.8
SW
1.043286.918.3
SW
1.0000 1.0000
HEY: 803.8 MW
1.058349.224.7
1.0250
1.04523.018.1
SW
306213MLK_DC2
1.000165.017.7
C1
C2
C3
0.91
37
1.00
00
328313WET220B
1.066234.524.7
323803KER220A
1.052231.433.6
QNI: -13.2 MW
218932WAG330D
343413HEY275B
N S W S u m m a r y : G e n e r a t i o n : 5 9 6 1 . 7 4 M W L o a d s : 6 5 5 4 . 7 2 M W L o s s e s : 9 9 . 0 8 M W L o a d + l o s s e s : 6 6 5 3 . 8 0 M W
V I C S u m m a r y : G e n e r a t i o n : 5 1 0 1 . 8 7 M W L o a d s : 4 5 4 2 . 2 1 M W L o s s e s : 1 0 1 . 9 4 M W L o a d + l o s s e s : 4 6 4 4 . 1 5 M W S A S u m m a r y : G e n e r a t i o n : 7 4 5 . 2 0 M W L o a d s : 1 4 0 7 . 6 7 M W L o s s e s : 1 3 4 . 1 0 M W L o a d + l o s s e s : 1 5 4 1 . 7 7 M W
322803HOR220A
1.075236.525.2
65,66: -474.5 MW
OX1: -31.7 MW060:-143.2 MW
272002DLP_33A
1.02333.823.3S
W
1.0000
1.0000 1.0000
272012DLP_33B
1.02133.722.9S
W
1.0000
1.0000 1.0000
32817ARTS
1.067234.827.3
392833HOR220R
1.068234.925.2
320803BEN220A
1.068234.928.4
393803KER220R
1.065234.233.6
320403BAL220A
1.061233.427.6
322303FOS220A
1.073236.127.8
302803HOR_S1
1.003220.625.3
1
303803KER_S1
1.175258.633.4
1
328163WBT220B
1.065234.327.7
1.0
000
1.0
268
355833APD500C
1.045522.721.0
R1
R21.0000
1.0250 1.0000
200402BKH_22A
1.05823.317.5
2
C1
C2
SW
1.0
000
0.9
800
1.0
000
0.9
800
SW
324803MOO220A
1.050230.927.7
R1
SW
350403BAL500A
1.058528.828.0
1.00
00
1.00
00
1.00
00
1.00
00
357603SYD500A
1.069534.528.7
Bus - VOLTAGE (kV/PU)/ANGLEBranch - NONEEquipment -
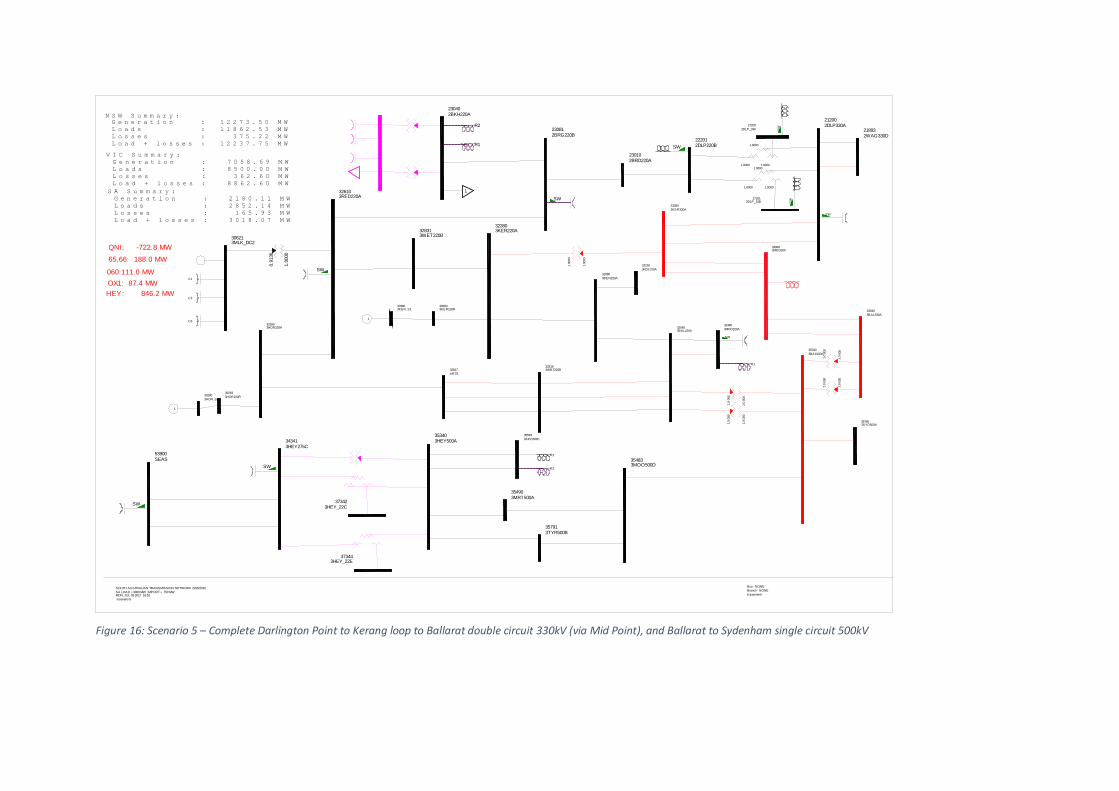
Figure 16: Scenario 5 – Complete Darlington Point to Kerang loop to Ballarat double circuit 330kV (via Mid Point), and Ballarat to Sydenham single circuit 500kV
SOUTH AUSTRALIAN TRANSMISSION NETWORK 2015/2016SA LOAD = 3000 MW IMPORT = 750 MWMON, JUL 03 2017 16:52 Scenario 5
53900SEAS
SW
353403HEY500A
373423HEY_22C
373443HEY_22E
354903MRT500A
357913TYR500B
354833MOO500D
230102BRD220A
230812BRG220B
222012DLP220BSW
212002DLP330A
230402BKH220A
1
R1
R2
326103RED220A
SW
SW
HEY: 846.2 MW
SW
306213MLK_DC2
C1
C2
C3
0.91
36
1.00
00
328313WET220B
323803KER220A
QNI: -722.8 MW
218932WAG330D
343413HEY275C
N S W S u m m a r y : G e n e r a t i o n : 1 2 2 7 3 . 5 0 M W L o a d s : 1 1 8 6 2 . 5 3 M W L o s s e s : 3 7 5 . 2 2 M W L o a d + l o s s e s : 1 2 2 3 7 . 7 5 M W
V I C S u m m a r y : G e n e r a t i o n : 7 0 5 8 . 6 9 M W L o a d s : 8 5 0 0 . 0 0 M W L o s s e s : 3 6 2 . 6 0 M W L o a d + l o s s e s : 8 8 6 2 . 6 0 M W S A S u m m a r y : G e n e r a t i o n : 2 1 8 0 . 1 1 M W L o a d s : 2 8 5 2 . 1 4 M W L o s s e s : 1 6 5 . 9 3 M W L o a d + l o s s e s : 3 0 1 8 . 0 7 M W
322803HOR220A
65,66: 188.0 MW
OX1: 87.4 MW060:111.0 MW
272002DLP_33A S
W
1.0000
1.0000 1.0000
272012DLP_33B S
W
1.0000
1.0000 1.0000
32817ARTS
392833HOR220R
320803BEN220A
393803KER220R
320403BAL220A
322303FOS220A
302803HOR_S1
1
303803KER_S1
1
328163WBT220B
355833APD500C
R1
R2
333803KER330A
1.00
00
1.00
00
SW
324803MOO220A
R1
SW
350403BAL500A
1.0
000
1.0
000
1.0
000
1.0
000
357603SYD500A
339803MID330A
330403BAL330A
1.0
000
1.0
000
1.0
000
1.0
000
Bus - NONEBranch - NONEEquipment -
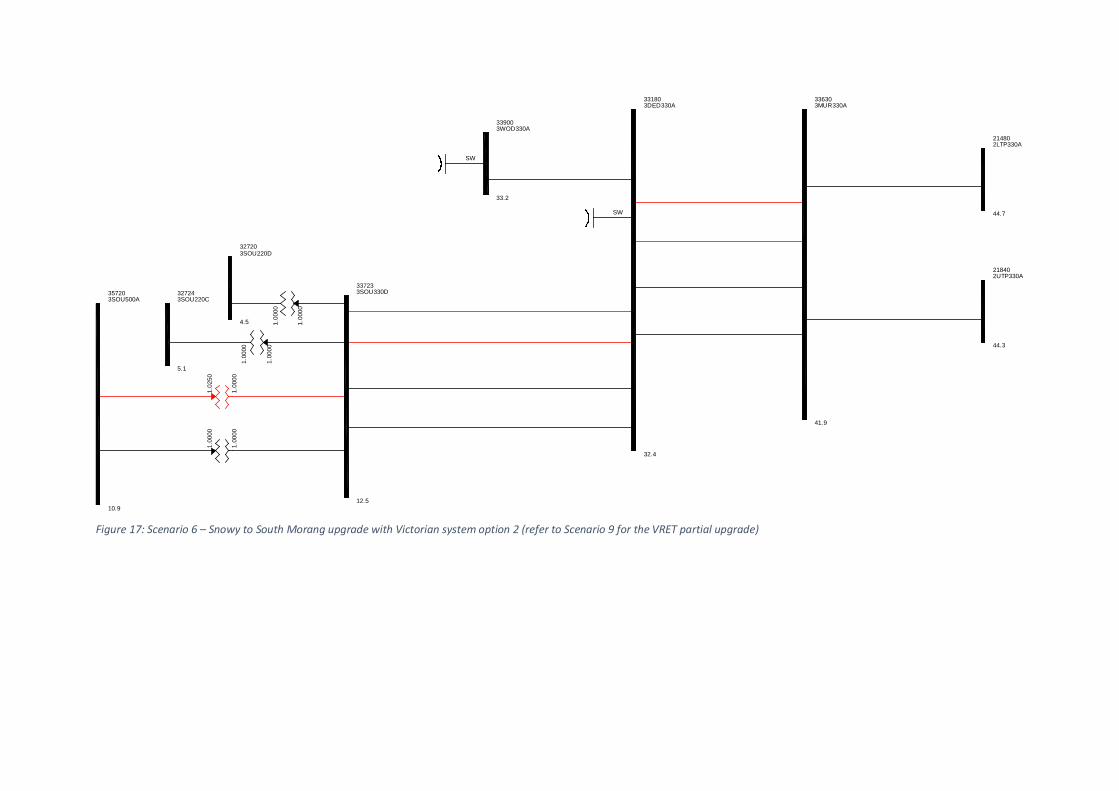
Figure 17: Scenario 6 – Snowy to South Morang upgrade with Victorian system option 2 (refer to Scenario 9 for the VRET partial upgrade)
336303MUR330A
41.9
214802LTP330A
44.7
218402UTP330A
44.3
331803DED330A
32.4
SW
339003WOD330A
33.2
SW
337233SOU330D
12.5
357203SOU500A
10.9
1.00
00
1.00
00
1.00
00
1.02
50
327203SOU220D
4.5 1.00
00
1.00
00327243SOU220C
5.1
1.00
00
1.00
00

Figure 18: Scenario 7 – Scenario 5 + new medium capacity NSW-SA interconnector
SOUTH AUSTRALIAN TRANSMISSION NETWORK 2015/2016SA LOAD = 1500 MW IMPORT = 28 MWMON, JUL 03 2017 16:42Scenario7
53900SEAS
SW
353403HEY500A
373423HEY_22C
373443HEY_22E
354903MRT500A
357913TYR500B
354833MOO500D
230102BRD220A
230812BRG220B
222012DLP220BSW
212002DLP330A
230402BKH220A
1
R1
R2
326103RED220A
SW
SW
1.0000 1.0000
HEY: 241.5 MW
1.0375
SW
306213MLK_DC2
C1
C2
C3
0.96
55
1.00
00
328313WET220B
323803KER220A
QNI: -13.2 MW
218932WAG330D
343413HEY275B
N S W S u m m a r y : G e n e r a t i o n : 6 0 2 3 . 5 8 M W L o a d s : 6 5 5 4 . 7 2 M W L o s s e s : 1 1 6 . 4 0 M W L o a d + l o s s e s : 6 6 7 1 . 1 3 M W
V I C S u m m a r y : G e n e r a t i o n : 5 0 0 1 . 8 7 M W L o a d s : 4 5 4 2 . 2 1 M W L o s s e s : 1 5 3 . 4 4 M W L o a d + l o s s e s : 4 6 9 5 . 6 4 M W S A S u m m a r y : G e n e r a t i o n : 7 4 5 . 2 0 M W L o a d s : 1 4 0 7 . 6 7 M W L o s s e s : 6 3 . 5 3 M W L o a d + l o s s e s : 1 4 7 1 . 2 1 M W
322803HOR220A
65,66: -494.1 MW
OX1: -181.4 MW060:-197.6 MW
272002DLP_33A S
W
1.0000
1.0000 1.0000
272012DLP_33B S
W
1.0000
1.0000 1.0000
32817ARTS
392833HOR220R
320803BEN220A
393803KER220R
320403BAL220A
322303FOS220A
302803HOR_S1
1
303803KER_S1
1
328163WBT220B
1.0
000
1.0
375
355833APD500C
R1
R21.0000
1.0375 1.0000
200402BKH_22A
2
C1
C2
SW
1.0000
0.9800
1.0000
0.9800
333803KER330A
1.0000
1.0000
SW
324803MOO220A
R1
SW
350403BAL500A
1.0
000
1.0
000
1.0
000
1.0
000
357603SYD500A
339803MID330A
330403BAL330A
1.0000
1.0000
1.0000
1.0000
240822BRGPSTSW
1.00
00
1.00
00
212022DLP275A
240832BUR_SVC
1
24084PST
1.00
00
1.00
0060
.00
1.00
00
1.00
0060
.00
1.00
00
1.00
0060
.00
53155ROBT
1.00
00
1.00
00
Bus - NONEBranch - NONEEquipment -

Figure 19: Scenario 8 – Scenario 5 + new medium capacity SA-VIC interconnector
SOUTH AUSTRALIAN TRANSMISSION NETWORK 2015/2016SA LOAD = 800 MW EXPORT = 510 MWMON, JUL 03 2017 15:08 Scenario 8
53900SEAS
SW
353403HEY500A
373423HEY_22C
373443HEY_22E
354903MRT500A
357913TYR500B
354833MOO500D
230102BRD220A
230812BRG220B
222012DLP220BSW
212002DLP330A
230402BKH220A
1
R1
R2
326103RED220A
SW
SW
1.0000 1.0000
HEY: -636.4 MW
0.9250
SW
306213MLK_DC2
C1
C2
C3
0.89
64
1.00
00
328313WET220B
323803KER220A
QNI: 86.2 MW
218932WAG330D
343413HEY275B
N S W S u m m a r y : G e n e r a t i o n : 3 5 3 3 . 1 8 M W L o a d s : 5 2 7 7 . 7 3 M W L o s s e s : 2 3 9 . 3 8 M W L o a d + l o s s e s : 5 5 1 7 . 1 1 M W
V I C S u m m a r y : G e n e r a t i o n : 1 7 9 7 . 3 7 M W L o a d s : 2 6 6 2 . 3 4 M W L o s s e s : 2 4 0 . 8 6 M W L o a d + l o s s e s : 2 9 0 3 . 2 1 M W S A S u m m a r y : G e n e r a t i o n : 1 8 9 3 . 0 0 M W L o a d s : 7 4 3 . 7 7 M W L o s s e s : 1 4 5 . 9 8 M W L o a d + l o s s e s : 8 8 9 . 7 5 M W
322803HOR220A
65,66: -955.1 MW
OX1: -173.7 MW060:-211.4 MW
272002DLP_33A SW
1.0000
1.0000 1.0000
272012DLP_33B SW
1.0000
1.0000 1.0000
32817ARTS
392833HOR220R
320803BEN220A
393803KER220R
320403BAL220A
322303FOS220A
302803HOR_S1
1
303803KER_S1
1
328163WBT220B
1.00
00
0.92
65
355833APD500C
R1
R21.0000
0.9250 1.0000
200402BKH_22A
2
C1
C2
SW
1.00
00
0.98
00
1.00
00
0.98
00
333803KER330A
1.00
00
1.00
00
SW
324803MOO220A
R1
SW
350403BAL500A
1.00
00
1.00
00
1.00
00
1.00
00
357603SYD500A
339803MID330A
330403BAL330A
1.00
00
1.00
00
1.00
00
1.00
00
1 329803MID220A
1.00
00
1.00
00
1.00
00
1.00
00
SW322863HOR_PST
1.0000
1.0000
1.0000
1.0000
32287
1.00
00
1.00
00
1.00
00
1.00
00
53272TUNGSW
Bus - NONEBranch - NONEEquipment -

Figure 20: Scenario 9 – Partial Victoria VRET RIT-T option
SOUTH AUSTRALIAN TRANSMISSION NETWORK 2015/2016SA LOAD = 800 MW EXPORT = 510 MWMON, JUL 03 2017 15:34 Scenario 9
53900SEAS
SW
353403HEY500A
373423HEY_22C
373443HEY_22E
354903MRT500A
357913TYR500B
354833MOO500D
230102BRD220A
230812BRG220B
222012DLP220BSW
212002DLP330A
230402BKH220A
1
R1
R2
326103RED220A
SW
SW
1.0000 1.0000
HEY: -926.8 MW
0.9250
SW
306213MLK_DC2
C1
C2
C3
0.93
09
1.00
00
328313WET220B
323803KER220A
QNI: 86.2 MW
218932WAG330D
343413HEY275B
N S W S u m m a r y : G e n e r a t i o n : 3 8 2 8 . 9 4 M W L o a d s : 5 2 7 7 . 7 3 M W L o s s e s : 1 9 7 . 4 9 M W L o a d + l o s s e s : 5 4 7 5 . 2 2 M W
V I C S u m m a r y : G e n e r a t i o n : 1 8 9 7 . 3 7 M W L o a d s : 2 6 6 2 . 3 4 M W L o s s e s : 3 4 9 . 2 2 M W L o a d + l o s s e s : 3 0 1 1 . 5 6 M W S A S u m m a r y : G e n e r a t i o n : 1 8 9 3 . 0 0 M W L o a d s : 7 4 3 . 7 7 M W L o s s e s : 2 1 4 . 8 5 M W L o a d + l o s s e s : 9 5 8 . 6 2 M W
322803HOR220A
65,66: -998.6 MW
OX1: -300.4 MW060:-432.9 MW
272002DLP_33A S
W
1.0000
1.0000 1.0000
272012DLP_33B S
W
1.0000
1.0000 1.0000
32817ARTS
392833HOR220R
320803BEN220A
393803KER220R
320403BAL220A
322303FOS220A
302803HOR_S1
1
303803KER_S1
1
328163WBT220B
1.0
000
0.9
265
355833APD500C
R1
R21.0000
0.9250 1.0000
200402BKH_22A
2
C1
C2
SW
1.0
000
0.9
800
1.0
000
0.9
800
SW
324803MOO220A
R1
SW
350403BAL500A
1.0
000
1.0
000
1.0
000
1.0
000
357603SYD500A
Bus - NONEBranch - NONEEquipment -

Appendix C – Detailed study case information
Case Gen - QLD Gen - NSW Gen - VIC Gen - SA Gen - TAS Load - QLD Load - NSW Load - VIC Load - SA Load - TASFlow -
QLD>NSWFlow -
NSW>VICFlow - SA>VIC
Flow - VIC>TAS
1 5103.6 4278.4 3798.2 1162.5 722.3 5032.4 5277.7 2784.2 747.6 703.6 -85.7 -1193.0 333.7 0.0
2 6685.7 7396.2 6866.1 1474.5 1593.8 6608.3 8483.7 5479.2 1423.0 1345.8 -94.6 -1377.1 -25.3 -189.3
3 5617.7 6039.4 6027.3 828.7 971.7 5418.1 6554.7 4618.1 1435.8 873.3 42.6 -570.7 -739.6 -74.6
4 7289.8 10046.5 7497.5 2288.4 1669.1 6267.7 9819.9 7857.2 2896.4 1013.3 814.8 787.9 -763.1 -566.8
5 7289.8 10429.2 8151.1 2132.1 1669.1 6267.7 9819.9 8500.0 2896.4 1013.3 814.8 782.3 -908.5 -566.8
6 7289.8 12470.7 8151.1 2180.1 1669.1 6267.7 11862.5 8500.0 2896.4 1013.3 814.8 698.6 -845.7 -566.8
7 7240.0 6340.2 5363.0 1184.1 1210.2 6710.8 7616.6 4480.1 747.6 835.0 319.0 -1314.5 359.5 -297.9
8 6810.2 7979.4 5835.3 1488.0 1460.7 6254.6 8408.5 5795.6 1423.0 1035.7 373.7 -222.1 -11.8 -339.3
9 6810.2 8080.5 6136.2 1104.1 1460.7 6254.6 8408.5 5795.6 1435.8 1035.7 373.7 -121.4 -398.8 -339.3
10 6808.6 8905.4 7175.0 2339.5 1165.7 6368.6 8262.9 6942.2 2896.4 1049.1 204.3 612.3 -695.1 -84.5
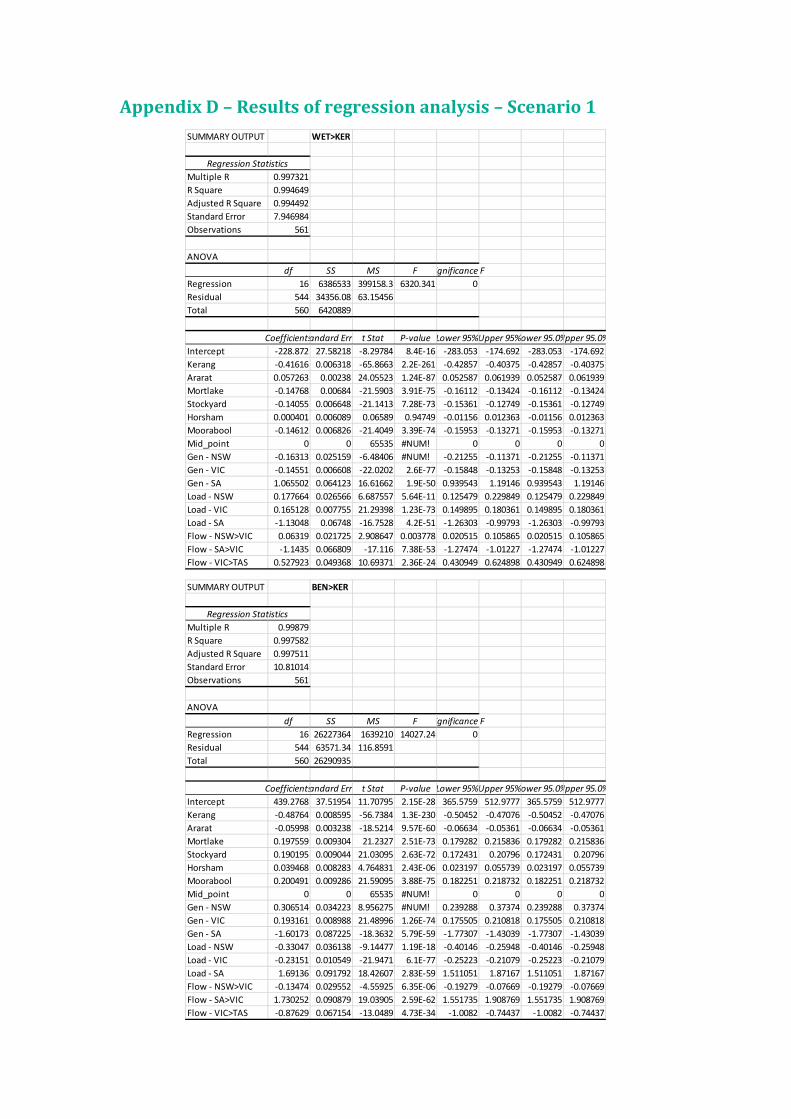
Appendix D – Results of regression analysis – Scenario 1
SUMMARY OUTPUT WET>KER
Regression StatisticsMultiple R 0.997321R Square 0.994649Adjusted R Square 0.994492Standard Error 7.946984Observations 561
ANOVAdf SS MS F ignificance F
Regression 16 6386533 399158.3 6320.341 0Residual 544 34356.08 63.15456Total 560 6420889
Coefficientsandard Erro t Stat P-value Lower 95%Upper 95%ower 95.0%Upper 95.0%Intercept -228.872 27.58218 -8.29784 8.4E-16 -283.053 -174.692 -283.053 -174.692Kerang -0.41616 0.006318 -65.8663 2.2E-261 -0.42857 -0.40375 -0.42857 -0.40375Ararat 0.057263 0.00238 24.05523 1.24E-87 0.052587 0.061939 0.052587 0.061939Mortlake -0.14768 0.00684 -21.5903 3.91E-75 -0.16112 -0.13424 -0.16112 -0.13424Stockyard -0.14055 0.006648 -21.1413 7.28E-73 -0.15361 -0.12749 -0.15361 -0.12749Horsham 0.000401 0.006089 0.06589 0.94749 -0.01156 0.012363 -0.01156 0.012363Moorabool -0.14612 0.006826 -21.4049 3.39E-74 -0.15953 -0.13271 -0.15953 -0.13271Mid_point 0 0 65535 #NUM! 0 0 0 0Gen - NSW -0.16313 0.025159 -6.48406 #NUM! -0.21255 -0.11371 -0.21255 -0.11371Gen - VIC -0.14551 0.006608 -22.0202 2.6E-77 -0.15848 -0.13253 -0.15848 -0.13253Gen - SA 1.065502 0.064123 16.61662 1.9E-50 0.939543 1.19146 0.939543 1.19146Load - NSW 0.177664 0.026566 6.687557 5.64E-11 0.125479 0.229849 0.125479 0.229849Load - VIC 0.165128 0.007755 21.29398 1.23E-73 0.149895 0.180361 0.149895 0.180361Load - SA -1.13048 0.06748 -16.7528 4.2E-51 -1.26303 -0.99793 -1.26303 -0.99793Flow - NSW>VIC 0.06319 0.021725 2.908647 0.003778 0.020515 0.105865 0.020515 0.105865Flow - SA>VIC -1.1435 0.066809 -17.116 7.38E-53 -1.27474 -1.01227 -1.27474 -1.01227Flow - VIC>TAS 0.527923 0.049368 10.69371 2.36E-24 0.430949 0.624898 0.430949 0.624898
SUMMARY OUTPUT BEN>KER
Regression StatisticsMultiple R 0.99879R Square 0.997582Adjusted R Square 0.997511Standard Error 10.81014Observations 561
ANOVAdf SS MS F ignificance F
Regression 16 26227364 1639210 14027.24 0Residual 544 63571.34 116.8591Total 560 26290935
Coefficientsandard Erro t Stat P-value Lower 95%Upper 95%ower 95.0%Upper 95.0%Intercept 439.2768 37.51954 11.70795 2.15E-28 365.5759 512.9777 365.5759 512.9777Kerang -0.48764 0.008595 -56.7384 1.3E-230 -0.50452 -0.47076 -0.50452 -0.47076Ararat -0.05998 0.003238 -18.5214 9.57E-60 -0.06634 -0.05361 -0.06634 -0.05361Mortlake 0.197559 0.009304 21.2327 2.51E-73 0.179282 0.215836 0.179282 0.215836Stockyard 0.190195 0.009044 21.03095 2.63E-72 0.172431 0.20796 0.172431 0.20796Horsham 0.039468 0.008283 4.764831 2.43E-06 0.023197 0.055739 0.023197 0.055739Moorabool 0.200491 0.009286 21.59095 3.88E-75 0.182251 0.218732 0.182251 0.218732Mid_point 0 0 65535 #NUM! 0 0 0 0Gen - NSW 0.306514 0.034223 8.956275 #NUM! 0.239288 0.37374 0.239288 0.37374Gen - VIC 0.193161 0.008988 21.48996 1.26E-74 0.175505 0.210818 0.175505 0.210818Gen - SA -1.60173 0.087225 -18.3632 5.79E-59 -1.77307 -1.43039 -1.77307 -1.43039Load - NSW -0.33047 0.036138 -9.14477 1.19E-18 -0.40146 -0.25948 -0.40146 -0.25948Load - VIC -0.23151 0.010549 -21.9471 6.1E-77 -0.25223 -0.21079 -0.25223 -0.21079Load - SA 1.69136 0.091792 18.42607 2.83E-59 1.511051 1.87167 1.511051 1.87167Flow - NSW>VIC -0.13474 0.029552 -4.55925 6.35E-06 -0.19279 -0.07669 -0.19279 -0.07669Flow - SA>VIC 1.730252 0.090879 19.03905 2.59E-62 1.551735 1.908769 1.551735 1.908769Flow - VIC>TAS -0.87629 0.067154 -13.0489 4.73E-34 -1.0082 -0.74437 -1.0082 -0.74437

SUMMARY OUTPUT BAL>BEN
Regression StatisticsMultiple R 0.998528R Square 0.997057Adjusted R Square 0.996971Standard Error 7.789445Observations 561
ANOVAdf SS MS F ignificance F
Regression 16 11184395 699024.7 11520.72 0Residual 544 33007.45 60.67546Total 560 11217403
Coefficientsandard Err t Stat P-value Lower 95%Upper 95%ower 95.0%Upper 95.0%Intercept 115.7427 27.0354 4.281154 2.2E-05 62.63613 168.8493 62.63613 168.8493Kerang -0.18143 0.006193 -29.2958 6.1E-114 -0.19359 -0.16926 -0.19359 -0.16926Ararat 0.000557 0.002333 0.238547 0.811547 -0.00403 0.00514 -0.00403 0.00514Mortlake 0.257177 0.006705 38.35882 7.9E-157 0.244007 0.270347 0.244007 0.270347Stockyard 0.324959 0.006517 49.86688 4.8E-205 0.312158 0.33776 0.312158 0.33776Horsham 0.192743 0.005969 32.29291 1.5E-128 0.181019 0.204467 0.181019 0.204467Moorabool 0.28097 0.006691 41.99149 8.2E-173 0.267826 0.294114 0.267826 0.294114Mid_point 0 0 65535 #NUM! 0 0 0 0Gen - NSW -0.09401 0.02466 -3.81219 #NUM! -0.14245 -0.04557 -0.14245 -0.04557Gen - VIC 0.244686 0.006477 37.77886 3.3E-154 0.231963 0.257409 0.231963 0.257409Gen - SA -0.60392 0.062851 -9.60864 2.7E-20 -0.72738 -0.48046 -0.72738 -0.48046Load - NSW 0.096489 0.02604 3.70545 0.000233 0.045338 0.14764 0.045338 0.14764Load - VIC -0.2287 0.007601 -30.088 7.7E-118 -0.24363 -0.21377 -0.24363 -0.21377Load - SA 0.592385 0.066142 8.956234 5.33E-18 0.46246 0.722311 0.46246 0.722311Flow - NSW>VIC 0.233738 0.021294 10.97659 1.85E-25 0.191909 0.275567 0.191909 0.275567Flow - SA>VIC 0.842501 0.065485 12.86563 2.93E-33 0.713867 0.971135 0.713867 0.971135Flow - VIC>TAS -0.12782 0.048389 -2.64147 0.008492 -0.22287 -0.03277 -0.22287 -0.03277
SUMMARY OUTPUT HOR>RED
Regression StatisticsMultiple R 0.993769R Square 0.987577Adjusted R Square 0.987211Standard Error 9.633031Observations 561
ANOVAdf SS MS F ignificance F
Regression 16 4012885 250805.3 2702.781 0Residual 544 50480.64 92.79529Total 560 4063366
Coefficientsandard Err t Stat P-value Lower 95%Upper 95%ower 95.0%Upper 95.0%Intercept -157.87 33.43407 -4.72185 2.98E-06 -223.546 -92.1948 -223.546 -92.1948Kerang 0.052766 0.007659 6.889713 1.55E-11 0.037722 0.06781 0.037722 0.06781Ararat 0.071858 0.002886 24.9028 6.29E-92 0.06619 0.077526 0.06619 0.077526Mortlake 0.230096 0.008291 27.75146 2.9E-106 0.213809 0.246383 0.213809 0.246383Stockyard 0.239647 0.008059 29.73708 4.1E-116 0.223816 0.255477 0.223816 0.255477Horsham 0.475033 0.007381 64.35703 1.5E-256 0.460534 0.489532 0.460534 0.489532Moorabool 0.233676 0.008275 28.23959 1.1E-108 0.217421 0.24993 0.217421 0.24993Mid_point 0 0 65535 #NUM! 0 0 0 0Gen - NSW -0.28636 0.030497 -9.3897 #NUM! -0.34626 -0.22645 -0.34626 -0.22645Gen - VIC 0.227199 0.00801 28.36542 2.5E-109 0.211465 0.242932 0.211465 0.242932Gen - SA -0.1156 0.077727 -1.48723 0.137535 -0.26828 0.037084 -0.26828 0.037084Load - NSW 0.297952 0.032203 9.252395 4.99E-19 0.234695 0.361209 0.234695 0.361209Load - VIC -0.18352 0.0094 -19.5233 9.94E-65 -0.20198 -0.16505 -0.20198 -0.16505Load - SA 0.097061 0.081797 1.186613 0.235898 -0.06361 0.257737 -0.06361 0.257737Flow - NSW>VIC 0.396088 0.026334 15.04087 5.25E-43 0.344359 0.447817 0.344359 0.447817Flow - SA>VIC 0.291366 0.080983 3.597855 0.00035 0.132288 0.450445 0.132288 0.450445Flow - VIC>TAS 0.273168 0.059842 4.564858 6.19E-06 0.15562 0.390717 0.15562 0.390717
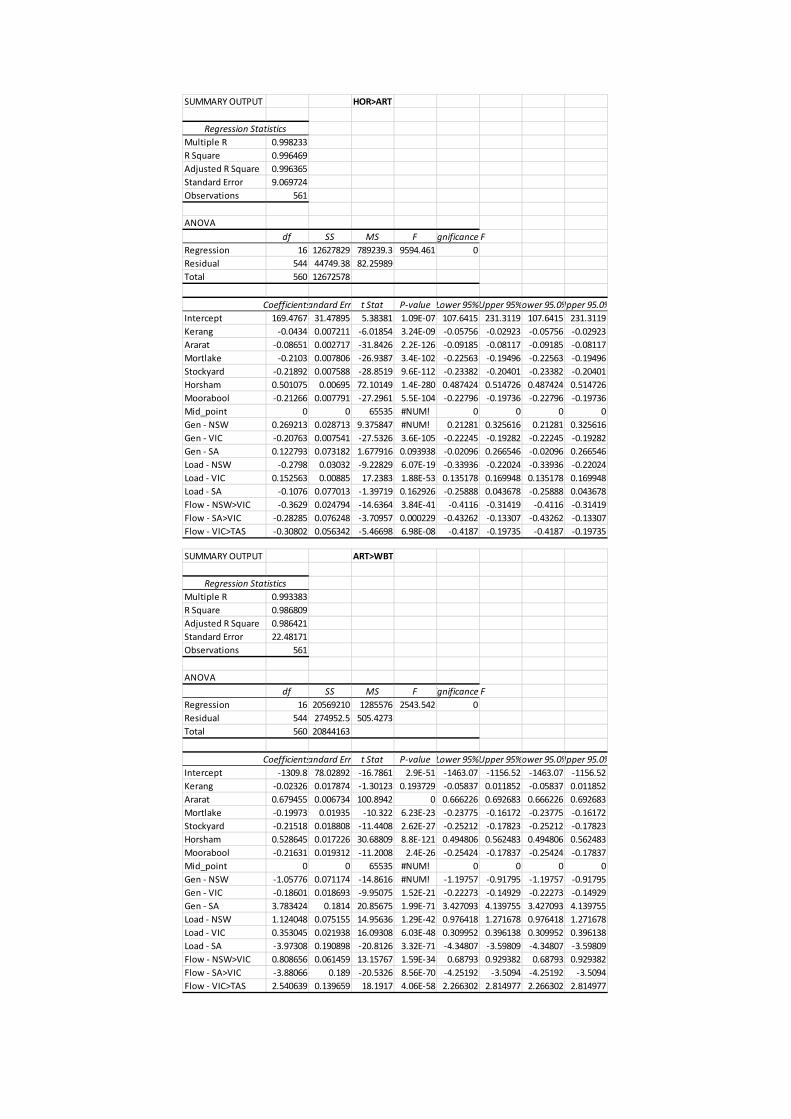
SUMMARY OUTPUT HOR>ART
Regression StatisticsMultiple R 0.998233R Square 0.996469Adjusted R Square 0.996365Standard Error 9.069724Observations 561
ANOVAdf SS MS F ignificance F
Regression 16 12627829 789239.3 9594.461 0Residual 544 44749.38 82.25989Total 560 12672578
Coefficientsandard Err t Stat P-value Lower 95%Upper 95%ower 95.0%Upper 95.0%Intercept 169.4767 31.47895 5.38381 1.09E-07 107.6415 231.3119 107.6415 231.3119Kerang -0.0434 0.007211 -6.01854 3.24E-09 -0.05756 -0.02923 -0.05756 -0.02923Ararat -0.08651 0.002717 -31.8426 2.2E-126 -0.09185 -0.08117 -0.09185 -0.08117Mortlake -0.2103 0.007806 -26.9387 3.4E-102 -0.22563 -0.19496 -0.22563 -0.19496Stockyard -0.21892 0.007588 -28.8519 9.6E-112 -0.23382 -0.20401 -0.23382 -0.20401Horsham 0.501075 0.00695 72.10149 1.4E-280 0.487424 0.514726 0.487424 0.514726Moorabool -0.21266 0.007791 -27.2961 5.5E-104 -0.22796 -0.19736 -0.22796 -0.19736Mid_point 0 0 65535 #NUM! 0 0 0 0Gen - NSW 0.269213 0.028713 9.375847 #NUM! 0.21281 0.325616 0.21281 0.325616Gen - VIC -0.20763 0.007541 -27.5326 3.6E-105 -0.22245 -0.19282 -0.22245 -0.19282Gen - SA 0.122793 0.073182 1.677916 0.093938 -0.02096 0.266546 -0.02096 0.266546Load - NSW -0.2798 0.03032 -9.22829 6.07E-19 -0.33936 -0.22024 -0.33936 -0.22024Load - VIC 0.152563 0.00885 17.2383 1.88E-53 0.135178 0.169948 0.135178 0.169948Load - SA -0.1076 0.077013 -1.39719 0.162926 -0.25888 0.043678 -0.25888 0.043678Flow - NSW>VIC -0.3629 0.024794 -14.6364 3.84E-41 -0.4116 -0.31419 -0.4116 -0.31419Flow - SA>VIC -0.28285 0.076248 -3.70957 0.000229 -0.43262 -0.13307 -0.43262 -0.13307Flow - VIC>TAS -0.30802 0.056342 -5.46698 6.98E-08 -0.4187 -0.19735 -0.4187 -0.19735
SUMMARY OUTPUT ART>WBT
Regression StatisticsMultiple R 0.993383R Square 0.986809Adjusted R Square 0.986421Standard Error 22.48171Observations 561
ANOVAdf SS MS F ignificance F
Regression 16 20569210 1285576 2543.542 0Residual 544 274952.5 505.4273Total 560 20844163
Coefficientsandard Err t Stat P-value Lower 95%Upper 95%ower 95.0%Upper 95.0%Intercept -1309.8 78.02892 -16.7861 2.9E-51 -1463.07 -1156.52 -1463.07 -1156.52Kerang -0.02326 0.017874 -1.30123 0.193729 -0.05837 0.011852 -0.05837 0.011852Ararat 0.679455 0.006734 100.8942 0 0.666226 0.692683 0.666226 0.692683Mortlake -0.19973 0.01935 -10.322 6.23E-23 -0.23775 -0.16172 -0.23775 -0.16172Stockyard -0.21518 0.018808 -11.4408 2.62E-27 -0.25212 -0.17823 -0.25212 -0.17823Horsham 0.528645 0.017226 30.68809 8.8E-121 0.494806 0.562483 0.494806 0.562483Moorabool -0.21631 0.019312 -11.2008 2.4E-26 -0.25424 -0.17837 -0.25424 -0.17837Mid_point 0 0 65535 #NUM! 0 0 0 0Gen - NSW -1.05776 0.071174 -14.8616 #NUM! -1.19757 -0.91795 -1.19757 -0.91795Gen - VIC -0.18601 0.018693 -9.95075 1.52E-21 -0.22273 -0.14929 -0.22273 -0.14929Gen - SA 3.783424 0.1814 20.85675 1.99E-71 3.427093 4.139755 3.427093 4.139755Load - NSW 1.124048 0.075155 14.95636 1.29E-42 0.976418 1.271678 0.976418 1.271678Load - VIC 0.353045 0.021938 16.09308 6.03E-48 0.309952 0.396138 0.309952 0.396138Load - SA -3.97308 0.190898 -20.8126 3.32E-71 -4.34807 -3.59809 -4.34807 -3.59809Flow - NSW>VIC 0.808656 0.061459 13.15767 1.59E-34 0.68793 0.929382 0.68793 0.929382Flow - SA>VIC -3.88066 0.189 -20.5326 8.56E-70 -4.25192 -3.5094 -4.25192 -3.5094Flow - VIC>TAS 2.540639 0.139659 18.1917 4.06E-58 2.266302 2.814977 2.266302 2.814977

SUMMARY OUTPUT WBT>BAL
Regression StatisticsMultiple R 0.986696R Square 0.973569Adjusted R Square 0.972792Standard Error 32.56835Observations 561
ANOVAdf SS MS F ignificance F
Regression 16 21254432 1328402 1252.386 0Residual 544 577019.2 1060.697Total 560 21831451
Coefficientsandard Err t Stat P-value Lower 95%Upper 95%ower 95.0%Upper 95.0%Intercept -1493.51 113.0373 -13.2126 9.16E-35 -1715.56 -1271.47 -1715.56 -1271.47Kerang 0.286344 0.025893 11.05863 8.8E-26 0.235481 0.337207 0.235481 0.337207Ararat 0.627899 0.009756 64.36194 1.5E-256 0.608735 0.647063 0.608735 0.647063Mortlake 0.139583 0.028032 4.979392 8.58E-07 0.084518 0.194647 0.084518 0.194647Stockyard 0.115991 0.027246 4.257156 2.44E-05 0.062471 0.169512 0.062471 0.169512Horsham 0.810127 0.024955 32.4633 2.2E-129 0.761106 0.859147 0.761106 0.859147Moorabool 0.150876 0.027976 5.393024 1.03E-07 0.095921 0.20583 0.095921 0.20583Mid_point 0 0 65535 #NUM! 0 0 0 0Gen - NSW -1.55615 0.103107 -15.0927 #NUM! -1.75869 -1.35362 -1.75869 -1.35362Gen - VIC 0.151018 0.02708 5.576738 3.87E-08 0.097824 0.204213 0.097824 0.204213Gen - SA 4.267604 0.262788 16.23975 1.21E-48 3.751402 4.783807 3.751402 4.783807Load - NSW 1.649469 0.108874 15.15021 1.63E-43 1.435603 1.863334 1.435603 1.863334Load - VIC 0.085463 0.03178 2.689186 0.007382 0.023036 0.14789 0.023036 0.14789Load - SA -4.64454 0.276546 -16.7948 2.63E-51 -5.18777 -4.10131 -5.18777 -4.10131Flow - NSW>VIC 1.604559 0.089033 18.02205 2.78E-57 1.429668 1.77945 1.429668 1.77945Flow - SA>VIC -4.04364 0.273797 -14.7688 9.48E-42 -4.58147 -3.50581 -4.58147 -3.50581Flow - VIC>TAS 3.12489 0.202319 15.44538 6.86E-45 2.727468 3.522311 2.727468 3.522311
SUMMARY OUTPUT BAL>MOO2
Regression StatisticsMultiple R 0.994011R Square 0.988057Adjusted R Square 0.987706Standard Error 13.45555Observations 561
ANOVAdf SS MS F ignificance F
Regression 16 8148444 509277.8 2812.883 0Residual 544 98492.22 181.0519Total 560 8246936
Coefficientsandard Err t Stat P-value Lower 95%Upper 95%ower 95.0%Upper 95.0%Intercept -646.76 46.70117 -13.8489 1.41E-37 -738.497 -555.024 -738.497 -555.024Kerang 0.184487 0.010698 17.24536 1.74E-53 0.163473 0.205501 0.163473 0.205501Ararat 0.200601 0.004031 49.76992 1.1E-204 0.192684 0.208519 0.192684 0.208519Mortlake -0.00811 0.011581 -0.70035 0.484007 -0.03086 0.014639 -0.03086 0.014639Stockyard 0.293912 0.011257 26.10997 5.01E-98 0.2718 0.316024 0.2718 0.316024Horsham 0.235934 0.01031 22.88363 1.09E-81 0.215682 0.256187 0.215682 0.256187Moorabool -0.00849 0.011558 -0.7344 0.463019 -0.03119 0.014216 -0.03119 0.014216Mid_point 0 0 65535 #NUM! 0 0 0 0Gen - NSW -0.57401 0.042598 -13.4749 #NUM! -0.65769 -0.49033 -0.65769 -0.49033Gen - VIC 0.000207 0.011188 0.018479 0.985264 -0.02177 0.022184 -0.02177 0.022184Gen - SA 2.168166 0.10857 19.97018 5.75E-67 1.954898 2.381434 1.954898 2.381434Load - NSW 0.612177 0.044981 13.60962 1.64E-36 0.523819 0.700535 0.523819 0.700535Load - VIC 0.063612 0.01313 4.844822 1.65E-06 0.037821 0.089404 0.037821 0.089404Load - SA -2.30516 0.114255 -20.1757 5.34E-68 -2.5296 -2.08073 -2.5296 -2.08073Flow - NSW>VIC 0.571539 0.036784 15.53776 2.53E-45 0.499283 0.643794 0.499283 0.643794Flow - SA>VIC -2.14188 0.113119 -18.9348 8.53E-62 -2.36408 -1.91967 -2.36408 -1.91967Flow - VIC>TAS 1.168837 0.083588 13.98338 3.52E-38 1.004643 1.333031 1.004643 1.333031

Appendix E – Results of regression analysis – Scenario 4
SUMMARY OUTPUT WET>KER
Regression StatisticsMultiple R 0.997627R Square 0.995259Adjusted R Square 0.995137Standard Error 4.026035Observations 636
ANOVAdf SS MS F ignificance F
Regression 16 2106409 131650.6 8122.088 0Residual 619 10033.34 16.20896Total 635 2116442
Coefficientsandard Erro t Stat P-value Lower 95%Upper 95%ower 95.0%Upper 95.0%Intercept -70.0614 18.30428 -3.8276 0.000143 -106.007 -34.1154 -106.007 -34.1154Kerang -0.22525 0.003664 -61.4745 9.5E-266 -0.23244 -0.21805 -0.23244 -0.21805Ararat 0.028003 0.001147 24.40688 1.11E-92 0.02575 0.030256 0.02575 0.030256Mortlake -0.09414 0.003821 -24.6369 6.32E-94 -0.10164 -0.08663 -0.10164 -0.08663Stockyard -0.08803 0.003829 -22.9871 5.24E-85 -0.09555 -0.08051 -0.09555 -0.08051Horsham -0.015 0.003622 -4.14201 3.92E-05 -0.02212 -0.00789 -0.02212 -0.00789Moorabool -0.08914 0.003943 -22.6072 5.86E-83 -0.09688 -0.0814 -0.09688 -0.0814Mid_point 0 0 65535 #NUM! 0 0 0 0Gen - NSW -0.04121 0.016727 -2.46369 #NUM! -0.07406 -0.00836 -0.07406 -0.00836Gen - VIC -0.09364 0.003699 -25.3154 1.35E-97 -0.1009 -0.08637 -0.1009 -0.08637Gen - SA 0.478248 0.041145 11.62352 2.18E-28 0.397448 0.559049 0.397448 0.559049Load - NSW 0.047069 0.017635 2.669116 0.007805 0.012438 0.0817 0.012438 0.0817Load - VIC 0.094892 0.004894 19.39004 8.35E-66 0.085281 0.104502 0.085281 0.104502Load - SA -0.50649 0.043518 -11.6387 1.89E-28 -0.59195 -0.42103 -0.59195 -0.42103Flow - NSW>VIC -0.02028 0.013585 -1.49309 0.135923 -0.04696 0.006395 -0.04696 0.006395Flow - SA>VIC -0.53168 0.043109 -12.3334 2.09E-31 -0.61634 -0.44702 -0.61634 -0.44702Flow - VIC>TAS 0.201491 0.033181 6.072492 2.2E-09 0.13633 0.266651 0.13633 0.266651
SUMMARY OUTPUT BEN>KER
Regression StatisticsMultiple R 0.998986R Square 0.997974Adjusted R Square 0.997921Standard Error 5.301653Observations 636
ANOVAdf SS MS F ignificance F
Regression 16 8568461 535528.8 19052.86 0Residual 619 17398.56 28.10752Total 635 8585860
Coefficientsandard Erro t Stat P-value Lower 95%Upper 95%ower 95.0%Upper 95.0%Intercept 99.55971 24.10385 4.130448 4.12E-05 52.22448 146.895 52.22448 146.895Kerang -0.23726 0.004825 -49.1731 5.8E-216 -0.24674 -0.22778 -0.24674 -0.22778Ararat -0.02943 0.001511 -19.4797 2.82E-66 -0.0324 -0.02646 -0.0324 -0.02646Mortlake 0.11898 0.005032 23.64628 1.44E-88 0.109099 0.128862 0.109099 0.128862Stockyard 0.112736 0.005043 22.35639 1.31E-81 0.102833 0.122639 0.102833 0.122639Horsham 0.038068 0.00477 7.981337 7.05E-15 0.028702 0.047435 0.028702 0.047435Moorabool 0.113936 0.005192 21.94362 2.18E-79 0.103739 0.124132 0.103739 0.124132Mid_point 0 0 65535 #NUM! 0 0 0 0Gen - NSW 0.047472 0.022026 2.155247 #NUM! 0.004217 0.090728 0.004217 0.090728Gen - VIC 0.118228 0.004871 24.2734 5.86E-92 0.108663 0.127793 0.108663 0.127793Gen - SA -0.58118 0.054181 -10.7267 9.74E-25 -0.68759 -0.47478 -0.68759 -0.47478Load - NSW -0.05443 0.023222 -2.34382 0.019403 -0.10003 -0.00882 -0.10003 -0.00882Load - VIC -0.11888 0.006444 -18.4464 7.04E-61 -0.13153 -0.10622 -0.13153 -0.10622Load - SA 0.612962 0.057306 10.6962 1.29E-24 0.500423 0.725501 0.500423 0.725501Flow - NSW>VIC 0.039344 0.017889 2.199326 0.028224 0.004213 0.074476 0.004213 0.074476Flow - SA>VIC 0.6592 0.056768 11.61217 2.43E-28 0.547719 0.770681 0.547719 0.770681Flow - VIC>TAS -0.24778 0.043694 -5.6707 2.18E-08 -0.33358 -0.16197 -0.33358 -0.16197

SUMMARY OUTPUT BAL>BEN
Regression StatisticsMultiple R 0.999075R Square 0.998151Adjusted R Square 0.998103Standard Error 3.934631Observations 636
ANOVAdf SS MS F ignificance F
Regression 16 5173499 323343.7 20886.05 0Residual 619 9582.939 15.48132Total 635 5183082
Coefficientsandard Err t Stat P-value Lower 95%Upper 95%ower 95.0%Upper 95.0%Intercept 72.66006 17.88872 4.061781 5.5E-05 37.53013 107.79 37.53013 107.79Kerang -0.06527 0.003581 -18.2286 9.43E-60 -0.07231 -0.05824 -0.07231 -0.05824Ararat -0.00977 0.001121 -8.71717 2.61E-17 -0.01198 -0.00757 -0.01198 -0.00757Mortlake 0.195593 0.003734 52.37795 1.2E-229 0.18826 0.202926 0.18826 0.202926Stockyard 0.212948 0.003742 56.90106 4.3E-248 0.205599 0.220298 0.205599 0.220298Horsham 0.148351 0.00354 41.90901 6.5E-183 0.141399 0.155302 0.141399 0.155302Moorabool 0.200872 0.003853 52.12857 1.3E-228 0.193305 0.20844 0.193305 0.20844Mid_point 0 0 65535 #NUM! 0 0 0 0Gen - NSW -0.08141 0.016347 -4.98 #NUM! -0.11351 -0.04931 -0.11351 -0.04931Gen - VIC 0.185447 0.003615 51.30239 4.1E-225 0.178349 0.192546 0.178349 0.192546Gen - SA -0.44136 0.040211 -10.9761 9.84E-26 -0.52032 -0.36239 -0.52032 -0.36239Load - NSW 0.083505 0.017234 4.845279 1.6E-06 0.04966 0.11735 0.04966 0.11735Load - VIC -0.17011 0.004783 -35.5678 9.5E-152 -0.1795 -0.16072 -0.1795 -0.16072Load - SA 0.42348 0.04253 9.95717 9.17E-22 0.339959 0.507 0.339959 0.507Flow - NSW>VIC 0.184175 0.013277 13.87213 2.69E-38 0.158102 0.210247 0.158102 0.210247Flow - SA>VIC 0.625359 0.04213 14.84339 7.35E-43 0.542623 0.708095 0.542623 0.708095Flow - VIC>TAS -0.0613 0.032428 -1.89026 0.05919 -0.12498 0.002385 -0.12498 0.002385
SUMMARY OUTPUT HOR>RED
Regression StatisticsMultiple R 0.996198R Square 0.99241Adjusted R Square 0.992214Standard Error 4.05382Observations 636
ANOVAdf SS MS F ignificance F
Regression 16 1330136 83133.53 5058.798 0Residual 619 10172.31 16.43345Total 635 1340309
Coefficientsandard Err t Stat P-value Lower 95%Upper 95%ower 95.0%Upper 95.0%Intercept -89.7699 18.43061 -4.8707 1.41E-06 -125.964 -53.5758 -125.964 -53.5758Kerang 0.045148 0.003689 12.23744 5.43E-31 0.037903 0.052393 0.037903 0.052393Ararat 0.0166 0.001155 14.36927 1.3E-40 0.014332 0.018869 0.014332 0.018869Mortlake 0.152112 0.003847 39.53635 1.7E-171 0.144556 0.159667 0.144556 0.159667Stockyard 0.150938 0.003856 39.14565 1.4E-169 0.143366 0.15851 0.143366 0.15851Horsham 0.25342 0.003647 69.48606 1.6E-294 0.246258 0.260582 0.246258 0.260582Moorabool 0.147958 0.00397 37.26774 2.6E-160 0.140161 0.155754 0.140161 0.155754Mid_point 0 0 65535 #NUM! 0 0 0 0Gen - NSW -0.16495 0.016842 -9.79367 #NUM! -0.19802 -0.13187 -0.19802 -0.13187Gen - VIC 0.14941 0.003724 40.11778 2.5E-174 0.142096 0.156724 0.142096 0.156724Gen - SA -0.12502 0.041429 -3.01767 0.002652 -0.20638 -0.04366 -0.20638 -0.04366Load - NSW 0.170119 0.017756 9.580717 2.29E-20 0.135249 0.204989 0.135249 0.204989Load - VIC -0.1205 0.004928 -24.4535 6.21E-93 -0.13017 -0.11082 -0.13017 -0.11082Load - SA 0.111661 0.043818 2.548257 0.011067 0.02561 0.197712 0.02561 0.197712Flow - NSW>VIC 0.239568 0.013679 17.51384 4.42E-56 0.212705 0.26643 0.212705 0.26643Flow - SA>VIC 0.2427 0.043407 5.591299 3.38E-08 0.157458 0.327942 0.157458 0.327942Flow - VIC>TAS 0.140799 0.03341 4.214287 2.88E-05 0.075188 0.206409 0.075188 0.206409

SUMMARY OUTPUT HOR>ART
Regression StatisticsMultiple R 0.998987R Square 0.997976Adjusted R Square 0.997923Standard Error 3.849809Observations 636
ANOVAdf SS MS F ignificance F
Regression 16 4522488 282655.5 19071.25 0Residual 619 9174.215 14.82103Total 635 4531662
Coefficientsandard Err t Stat P-value Lower 95%Upper 95%ower 95.0%Upper 95.0%Intercept 90.91252 17.50307 5.194089 2.8E-07 56.53992 125.2851 56.53992 125.2851Kerang -0.03733 0.003504 -10.655 1.87E-24 -0.04421 -0.03045 -0.04421 -0.03045Ararat -0.01981 0.001097 -18.055 7.42E-59 -0.02196 -0.01765 -0.02196 -0.01765Mortlake -0.14164 0.003654 -38.7642 1E-167 -0.14881 -0.13446 -0.14881 -0.13446Stockyard -0.14013 0.003662 -38.2698 2.7E-165 -0.14733 -0.13294 -0.14733 -0.13294Horsham 0.246881 0.003464 71.28051 1.3E-300 0.24008 0.253683 0.24008 0.253683Moorabool -0.13727 0.00377 -36.4086 5.3E-156 -0.14468 -0.12987 -0.14468 -0.12987Mid_point 0 0 65535 #NUM! 0 0 0 0Gen - NSW 0.152485 0.015994 9.533573 #NUM! 0.121075 0.183895 0.121075 0.183895Gen - VIC -0.13903 0.003537 -39.3098 2.1E-170 -0.14598 -0.13209 -0.14598 -0.13209Gen - SA 0.147935 0.039344 3.760055 0.000186 0.070672 0.225199 0.070672 0.225199Load - NSW -0.15688 0.016863 -9.30325 2.32E-19 -0.18999 -0.12376 -0.18999 -0.12376Load - VIC 0.105024 0.00468 22.44293 4.49E-82 0.095835 0.114214 0.095835 0.114214Load - SA -0.13794 0.041613 -3.31469 0.000971 -0.21966 -0.05621 -0.21966 -0.05621Flow - NSW>VIC -0.21776 0.01299 -16.7634 2.79E-52 -0.24327 -0.19225 -0.24327 -0.19225Flow - SA>VIC -0.25609 0.041222 -6.21234 9.58E-10 -0.33704 -0.17513 -0.33704 -0.17513Flow - VIC>TAS -0.14869 0.031728 -4.68632 3.42E-06 -0.211 -0.08638 -0.211 -0.08638
SUMMARY OUTPUT ART>WBT
Regression StatisticsMultiple R 0.995551R Square 0.991123Adjusted R Square 0.990893Standard Error 6.774703Observations 636
ANOVAdf SS MS F ignificance F
Regression 16 3171815 198238.4 4319.241 0Residual 619 28409.99 45.8966Total 635 3200225
Coefficientsandard Err t Stat P-value Lower 95%Upper 95%ower 95.0%Upper 95.0%Intercept -813.975 30.80104 -26.4269 1.3E-103 -874.463 -753.488 -874.463 -753.488Kerang -0.05017 0.006166 -8.13743 2.22E-15 -0.06228 -0.03806 -0.06228 -0.03806Ararat 0.231659 0.001931 119.9889 0 0.227868 0.235451 0.227868 0.235451Mortlake -0.12327 0.00643 -19.1719 1.16E-64 -0.1359 -0.11064 -0.1359 -0.11064Stockyard -0.13103 0.006444 -20.3347 8.57E-71 -0.14369 -0.11838 -0.14369 -0.11838Horsham 0.14273 0.006095 23.41787 2.47E-87 0.130761 0.154699 0.130761 0.154699Moorabool -0.13019 0.006635 -19.6227 4.99E-67 -0.14322 -0.11716 -0.14322 -0.11716Mid_point 0 0 65535 #NUM! 0 0 0 0Gen - NSW -0.68912 0.028146 -24.4837 #NUM! -0.7444 -0.63385 -0.7444 -0.63385Gen - VIC -0.11748 0.006224 -18.8761 4.09E-63 -0.12971 -0.10526 -0.12971 -0.10526Gen - SA 2.146596 0.069235 31.00429 4.3E-128 2.010631 2.282561 2.010631 2.282561Load - NSW 0.730036 0.029674 24.60162 9.81E-94 0.671761 0.78831 0.671761 0.78831Load - VIC 0.223997 0.008235 27.20076 8.8E-108 0.207825 0.240169 0.207825 0.240169Load - SA -2.26347 0.073229 -30.9094 1.4E-127 -2.40727 -2.11966 -2.40727 -2.11966Flow - NSW>VIC 0.500027 0.02286 21.87363 5.17E-79 0.455135 0.544919 0.455135 0.544919Flow - SA>VIC -2.23764 0.072541 -30.8466 2.9E-127 -2.3801 -2.09519 -2.3801 -2.09519Flow - VIC>TAS 1.548759 0.055834 27.73852 1.1E-110 1.439111 1.658406 1.439111 1.658406

SUMMARY OUTPUT WBT>BAL
Regression StatisticsMultiple R 0.990975R Square 0.982031Adjusted R Square 0.981567Standard Error 9.893886Observations 636
ANOVAdf SS MS F ignificance F
Regression 16 3311542 206971.4 2114.348 0Residual 619 60593.28 97.88898Total 635 3372135
Coefficientsandard Err t Stat P-value Lower 95%Upper 95%ower 95.0%Upper 95.0%Intercept -1034.54 44.98234 -22.9989 4.52E-85 -1122.88 -946.208 -1122.88 -946.208Kerang 0.078986 0.009004 8.771952 1.7E-17 0.061303 0.096669 0.061303 0.096669Ararat 0.215154 0.00282 76.30697 0 0.209617 0.220691 0.209617 0.220691Mortlake 0.009034 0.00939 0.962033 0.336409 -0.00941 0.027474 -0.00941 0.027474Stockyard -0.00198 0.009411 -0.21077 0.833138 -0.02046 0.016497 -0.02046 0.016497Horsham 0.268329 0.008901 30.14546 1.5E-123 0.250849 0.285809 0.250849 0.285809Moorabool -0.00053 0.00969 -0.05451 0.956547 -0.01956 0.0185 -0.01956 0.0185Mid_point 0 0 65535 #NUM! 0 0 0 0Gen - NSW -0.99702 0.041105 -24.2552 #NUM! -1.07774 -0.91629 -1.07774 -0.91629Gen - VIC 0.015488 0.00909 1.703967 0.088889 -0.00236 0.033339 -0.00236 0.033339Gen - SA 2.638553 0.101113 26.0952 8.2E-102 2.439988 2.837119 2.439988 2.837119Load - NSW 1.053546 0.043337 24.31064 3.68E-92 0.968441 1.138651 0.968441 1.138651Load - VIC 0.137592 0.012026 11.44075 1.25E-27 0.113974 0.16121 0.113974 0.16121Load - SA -2.83938 0.106945 -26.5499 2.9E-104 -3.04939 -2.62936 -3.04939 -2.62936Flow - NSW>VIC 0.900901 0.033385 26.98531 1.3E-106 0.835339 0.966462 0.835339 0.966462Flow - SA>VIC -2.60351 0.10594 -24.5753 1.36E-93 -2.81155 -2.39546 -2.81155 -2.39546Flow - VIC>TAS 2.002274 0.081541 24.55537 1.75E-93 1.842144 2.162405 1.842144 2.162405
SUMMARY OUTPUT BAL>MOO2
Regression StatisticsMultiple R 0.994075R Square 0.988186Adjusted R Square 0.98788Standard Error 4.779786Observations 636
ANOVAdf SS MS F ignificance F
Regression 16 1182857 73928.58 3235.903 0Residual 619 14141.89 22.84635Total 635 1196999
Coefficientsandard Err t Stat P-value Lower 95%Upper 95%ower 95.0%Upper 95.0%Intercept -372.765 21.73119 -17.1535 3E-54 -415.441 -330.089 -415.441 -330.089Kerang 0.057567 0.00435 13.23362 2.21E-35 0.049024 0.06611 0.049024 0.06611Ararat 0.064649 0.001362 47.46063 2E-208 0.061974 0.067324 0.061974 0.067324Mortlake -0.02309 0.004536 -5.09055 4.74E-07 -0.032 -0.01418 -0.032 -0.01418Stockyard 0.074131 0.004546 16.30582 5.41E-50 0.065203 0.083059 0.065203 0.083059Horsham 0.073479 0.0043 17.08751 6.48E-54 0.065035 0.081924 0.065035 0.081924Moorabool -0.0923 0.004681 -19.7186 1.56E-67 -0.1015 -0.08311 -0.1015 -0.08311Mid_point 0 0 65535 #NUM! 0 0 0 0Gen - NSW -0.33325 0.019858 -16.7814 #NUM! -0.37225 -0.29425 -0.37225 -0.29425Gen - VIC -0.01505 0.004391 -3.42768 0.000649 -0.02368 -0.00643 -0.02368 -0.00643Gen - SA 1.089871 0.048848 22.31148 2.29E-81 0.993943 1.185799 0.993943 1.185799Load - NSW 0.353487 0.020936 16.88396 6.9E-53 0.312372 0.394601 0.312372 0.394601Load - VIC 0.063959 0.00581 11.00826 7.3E-26 0.052549 0.075368 0.052549 0.075368Load - SA -1.15443 0.051666 -22.3442 1.53E-81 -1.25589 -1.05297 -1.25589 -1.05297Flow - NSW>VIC 0.297108 0.016128 18.42145 9.48E-61 0.265435 0.328781 0.265435 0.328781Flow - SA>VIC -1.0991 0.05118 -21.4752 7.08E-77 -1.19961 -0.9986 -1.19961 -0.9986Flow - VIC>TAS 0.679163 0.039393 17.24072 1.08E-54 0.601803 0.756523 0.601803 0.756523

Appendix F – Results of regression analysis – Scenario 5
SUMMARY OUTPUT WET>KER
Regression StatisticsMultiple R 0.995816R Square 0.99165Adjusted R Square 0.991435Standard Error 10.50064Observations 636
ANOVAdf SS MS F ignificance F
Regression 16 8106110 506631.9 4594.736 0Residual 619 68253.13 110.2635Total 635 8174363
Coefficientsandard Err t Stat P-value Lower 95%Upper 95%ower 95.0%Upper 95.0%Intercept -588.842 27.88212 -21.119 5.7E-75 -643.597 -534.087 -643.597 -534.087Kerang -0.39151 0.012505 -31.3087 1.1E-129 -0.41606 -0.36695 -0.41606 -0.36695Ararat 0.033126 0.002917 11.35631 2.79E-27 0.027398 0.038855 0.027398 0.038855Mortlake -0.26954 0.012579 -21.4273 1.28E-76 -0.29424 -0.24483 -0.29424 -0.24483Stockyard -0.26085 0.012601 -20.7005 9.73E-73 -0.2856 -0.23611 -0.2856 -0.23611Horsham -0.11896 0.011846 -10.042 4.38E-22 -0.14222 -0.09569 -0.14222 -0.09569Moorabool -0.26573 0.012915 -20.5759 4.48E-72 -0.29109 -0.24037 -0.29109 -0.24037Mid_point 0 0 65535 #NUM! 0 0 0 0Gen - NSW -0.46868 0.021935 -21.3665 #NUM! -0.51175 -0.4256 -0.51175 -0.4256Gen - VIC -0.26241 0.012256 -21.4101 1.58E-76 -0.28648 -0.23834 -0.28648 -0.23834Gen - SA 1.996785 0.070802 28.20219 3.6E-113 1.857743 2.135827 1.857743 2.135827Load - NSW 0.498626 0.023196 21.49591 5.49E-77 0.453073 0.544179 0.453073 0.544179Load - VIC 0.325486 0.014436 22.54725 1.23E-82 0.297137 0.353834 0.297137 0.353834Load - SA -2.10901 0.072755 -28.9877 2.2E-117 -2.25189 -1.96613 -2.25189 -1.96613Flow - NSW>VIC 0.235034 0.017358 13.54073 8.94E-37 0.200947 0.269121 0.200947 0.269121Flow - SA>VIC -2.19625 0.08138 -26.9876 1.2E-106 -2.35606 -2.03644 -2.35606 -2.03644Flow - VIC>TAS 1.202178 0.048442 24.81696 6.71E-95 1.107048 1.297308 1.107048 1.297308
SUMMARY OUTPUT BEN>KER
Regression StatisticsMultiple R 0.999287R Square 0.998575Adjusted R Square 0.998539Standard Error 2.988421Observations 636
ANOVAdf SS MS F ignificance F
Regression 16 3875126 242195.3 27119.54 0Residual 619 5528.078 8.930659Total 635 3880654
Coefficientsandard Err t Stat P-value Lower 95%Upper 95%ower 95.0%Upper 95.0%Intercept 61.85407 7.935086 7.79501 2.74E-14 46.27112 77.43702 46.27112 77.43702Kerang -0.15357 0.003559 -43.152 9E-189 -0.16056 -0.14658 -0.16056 -0.14658Ararat -0.00528 0.00083 -6.36267 3.86E-10 -0.00691 -0.00365 -0.00691 -0.00365Mortlake 0.087943 0.00358 24.56543 1.54E-93 0.080912 0.094973 0.080912 0.094973Stockyard 0.096868 0.003586 27.01093 9.3E-107 0.089825 0.103911 0.089825 0.103911Horsham 0.048353 0.003371 14.34256 1.73E-40 0.041732 0.054973 0.041732 0.054973Moorabool 0.087377 0.003675 23.77309 2.98E-89 0.080159 0.094595 0.080159 0.094595Mid_point 0 0 65535 #NUM! 0 0 0 0Gen - NSW 0.049187 0.006243 7.879169 #NUM! 0.036927 0.061446 0.036927 0.061446Gen - VIC 0.087711 0.003488 25.14587 1.11E-96 0.080861 0.094561 0.080861 0.094561Gen - SA -0.40012 0.02015 -19.857 2.9E-68 -0.43969 -0.36055 -0.43969 -0.36055Load - NSW -0.05414 0.006602 -8.20161 1.37E-15 -0.06711 -0.04118 -0.06711 -0.04118Load - VIC -0.09589 0.004108 -23.3415 6.4E-87 -0.10396 -0.08783 -0.10396 -0.08783Load - SA 0.421041 0.020706 20.3345 8.59E-71 0.380379 0.461703 0.380379 0.461703Flow - NSW>VIC -0.00349 0.00494 -0.70673 0.48 -0.01319 0.00621 -0.01319 0.00621Flow - SA>VIC 0.464777 0.02316 20.06786 2.22E-69 0.419295 0.510259 0.419295 0.510259Flow - VIC>TAS -0.1638 0.013786 -11.8814 1.8E-29 -0.19087 -0.13673 -0.19087 -0.13673

SUMMARY OUTPUT BAL>BEN
Regression StatisticsMultiple R 0.999337R Square 0.998675Adjusted R Square 0.998641Standard Error 3.146659Observations 636
ANOVAdf SS MS F ignificance F
Regression 16 4620359 288772.5 29164.63 0Residual 619 6129.004 9.90146Total 635 4626488
Coefficientsandard Err t Stat P-value Lower 95%Upper 95%ower 95.0%Upper 95.0%Intercept 75.3876 8.355251 9.022781 2.29E-18 58.97953 91.79567 58.97953 91.79567Kerang -0.00781 0.003747 -2.0829 0.03767 -0.01516 -0.00045 -0.01516 -0.00045Ararat 0.008383 0.000874 9.589757 2.12E-20 0.006666 0.010099 0.006666 0.010099Mortlake 0.206052 0.00377 54.66302 4.3E-239 0.19865 0.213455 0.19865 0.213455Stockyard 0.237584 0.003776 62.91721 4E-271 0.230169 0.245 0.230169 0.245Horsham 0.190108 0.00355 53.55452 1.5E-234 0.183136 0.197079 0.183136 0.197079Moorabool 0.21623 0.00387 55.87253 5.5E-244 0.20863 0.22383 0.20863 0.22383Mid_point 0 0 65535 #NUM! 0 0 0 0Gen - NSW -0.04219 0.006573 -6.41878 #NUM! -0.0551 -0.02928 -0.0551 -0.02928Gen - VIC 0.197845 0.003673 53.86806 7.8E-236 0.190633 0.205058 0.190633 0.205058Gen - SA -0.31767 0.021217 -14.9723 1.77E-43 -0.35933 -0.276 -0.35933 -0.276Load - NSW 0.042677 0.006951 6.139588 1.48E-09 0.029026 0.056327 0.029026 0.056327Load - VIC -0.18686 0.004326 -43.1959 5.6E-189 -0.19535 -0.17836 -0.19535 -0.17836Load - SA 0.307135 0.021802 14.08739 2.7E-39 0.26432 0.34995 0.26432 0.34995Flow - NSW>VIC 0.204699 0.005201 39.35451 1.3E-170 0.194485 0.214914 0.194485 0.214914Flow - SA>VIC 0.516743 0.024387 21.18962 2.39E-75 0.468852 0.564633 0.468852 0.564633Flow - VIC>TAS -0.15723 0.014516 -10.8316 3.73E-25 -0.18574 -0.12873 -0.18574 -0.12873
SUMMARY OUTPUT HOR>RED
Regression StatisticsMultiple R 0.992774R Square 0.9856Adjusted R Square 0.985228Standard Error 7.895725Observations 636
ANOVAdf SS MS F ignificance F
Regression 16 2641363 165085.2 2648.037 0Residual 619 38589.99 62.34248Total 635 2679953
Coefficientsandard Err t Stat P-value Lower 95%Upper 95%ower 95.0%Upper 95.0%Intercept 403.923 20.96534 19.26623 3.73E-65 362.7512 445.0949 362.7512 445.0949Kerang 0.202535 0.009403 21.54016 3.18E-77 0.18407 0.221 0.18407 0.221Ararat 0.029553 0.002193 13.47362 1.81E-36 0.025245 0.03386 0.025245 0.03386Mortlake 0.277951 0.009459 29.38611 1.7E-119 0.259376 0.296526 0.259376 0.296526Stockyard 0.288496 0.009475 30.44731 3.8E-125 0.269889 0.307104 0.269889 0.307104Horsham 0.485066 0.008907 54.45714 3E-238 0.467573 0.502558 0.467573 0.502558Moorabool 0.280398 0.009711 28.87451 9.1E-117 0.261328 0.299468 0.261328 0.299468Mid_point 0 0 65535 #NUM! 0 0 0 0Gen - NSW 0.277963 0.016494 16.85276 #NUM! 0.245573 0.310354 0.245573 0.310354Gen - VIC 0.271249 0.009216 29.43281 9.4E-120 0.253151 0.289348 0.253151 0.289348Gen - SA -1.35216 0.053238 -25.3983 4.8E-98 -1.45671 -1.24761 -1.45671 -1.24761Load - NSW -0.29727 0.017442 -17.0435 1.08E-53 -0.33152 -0.26302 -0.33152 -0.26302Load - VIC -0.31186 0.010855 -28.7305 5.3E-116 -0.33318 -0.29054 -0.33318 -0.29054Load - SA 1.416774 0.054707 25.89761 9.6E-101 1.309341 1.524208 1.309341 1.524208Flow - NSW>VIC -0.03041 0.013052 -2.32993 0.020131 -0.05604 -0.00478 -0.05604 -0.00478Flow - SA>VIC 1.585215 0.061192 25.90566 8.7E-101 1.465047 1.705384 1.465047 1.705384Flow - VIC>TAS -0.84396 0.036425 -23.17 5.39E-86 -0.91549 -0.77243 -0.91549 -0.77243

SUMMARY OUTPUT HOR>ART
Regression StatisticsMultiple R 0.998917R Square 0.997835Adjusted R Square 0.997779Standard Error 7.226734Observations 636
ANOVAdf SS MS F ignificance F
Regression 16 14902139 931383.7 17833.82 0Residual 619 32327.7 52.22569Total 635 14934466
Coefficientsandard Err t Stat P-value Lower 95%Upper 95%ower 95.0%Upper 95.0%Intercept -329.139 19.18898 -17.1525 3.04E-54 -366.822 -291.455 -366.822 -291.455Kerang -0.17602 0.008606 -20.4526 2.03E-71 -0.19292 -0.15911 -0.19292 -0.15911Ararat -0.03438 0.002008 -17.1267 4.1E-54 -0.03832 -0.03044 -0.03832 -0.03044Mortlake -0.24937 0.008657 -28.8048 2.1E-116 -0.26637 -0.23237 -0.26637 -0.23237Stockyard -0.25796 0.008672 -29.7446 2.1E-121 -0.27499 -0.24093 -0.27499 -0.24093Horsham 0.510935 0.008153 62.67149 3.2E-270 0.494925 0.526945 0.494925 0.526945Moorabool -0.25021 0.008888 -28.151 6.8E-113 -0.26766 -0.23275 -0.26766 -0.23275Mid_point 0 0 65535 #NUM! 0 0 0 0Gen - NSW -0.23392 0.015096 -15.4952 #NUM! -0.26356 -0.20427 -0.26356 -0.20427Gen - VIC -0.24331 0.008435 -28.8453 1.3E-116 -0.25988 -0.22675 -0.25988 -0.22675Gen - SA 1.239841 0.048728 25.44435 2.7E-98 1.14415 1.335532 1.14415 1.335532Load - NSW 0.250968 0.015964 15.72078 4.18E-47 0.219618 0.282319 0.219618 0.282319Load - VIC 0.263343 0.009935 26.50683 4.9E-104 0.243833 0.282853 0.243833 0.282853Load - SA -1.30005 0.050072 -25.9638 4.2E-101 -1.39838 -1.20172 -1.39838 -1.20172Flow - NSW>VIC 0.021594 0.011946 1.807628 0.07115 -0.00187 0.045053 -0.00187 0.045053Flow - SA>VIC -1.44503 0.056007 -25.8007 3.2E-100 -1.55501 -1.33504 -1.55501 -1.33504Flow - VIC>TAS 0.690497 0.033339 20.7117 8.48E-73 0.625027 0.755968 0.625027 0.755968
SUMMARY OUTPUT ART>WBT
Regression StatisticsMultiple R 0.992112R Square 0.984286Adjusted R Square 0.98388Standard Error 8.52192Observations 636
ANOVAdf SS MS F ignificance F
Regression 16 2815796 175987.3 2423.295 0Residual 619 44953.72 72.62313Total 635 2860750
Coefficientsandard Err t Stat P-value Lower 95%Upper 95%ower 95.0%Upper 95.0%Intercept -327.688 22.62806 -14.4815 3.84E-41 -372.125 -283.251 -372.125 -283.251Kerang -0.12491 0.010148 -12.3084 2.69E-31 -0.14484 -0.10498 -0.14484 -0.10498Ararat 0.248495 0.002367 104.9693 0 0.243846 0.253144 0.243846 0.253144Mortlake -0.12803 0.010209 -12.5416 2.6E-32 -0.14808 -0.10799 -0.14808 -0.10799Stockyard -0.13296 0.010227 -13.0011 2.43E-34 -0.15304 -0.11287 -0.15304 -0.11287Horsham 0.125148 0.009614 13.01762 2.05E-34 0.106268 0.144027 0.106268 0.144027Moorabool -0.12973 0.010481 -12.3778 1.34E-31 -0.15032 -0.10915 -0.15032 -0.10915Mid_point 0 0 65535 #NUM! 0 0 0 0Gen - NSW -0.23149 0.017802 -13.0036 #NUM! -0.26645 -0.19653 -0.26645 -0.19653Gen - VIC -0.12315 0.009947 -12.3813 1.3E-31 -0.14269 -0.10362 -0.14269 -0.10362Gen - SA 1.088074 0.057461 18.93601 1.99E-63 0.975233 1.200915 0.975233 1.200915Load - NSW 0.246873 0.018825 13.11393 7.61E-35 0.209904 0.283842 0.209904 0.283842Load - VIC 0.161688 0.011715 13.80128 5.72E-38 0.138682 0.184695 0.138682 0.184695Load - SA -1.12365 0.059045 -19.0303 6.41E-64 -1.23961 -1.0077 -1.23961 -1.0077Flow - NSW>VIC 0.128711 0.014087 9.137044 9.07E-19 0.101047 0.156375 0.101047 0.156375Flow - SA>VIC -1.18971 0.066045 -18.0137 1.21E-58 -1.31941 -1.06001 -1.31941 -1.06001Flow - VIC>TAS 0.644502 0.039313 16.39392 1.97E-50 0.567299 0.721706 0.567299 0.721706

SUMMARY OUTPUT WBT>BAL
Regression StatisticsMultiple R 0.979184R Square 0.958801Adjusted R Square 0.957736Standard Error 14.19558Observations 636
ANOVAdf SS MS F ignificance F
Regression 16 2902933 181433.3 900.349 0Residual 619 124737.4 201.5144Total 635 3027671
Coefficientsandard Err t Stat P-value Lower 95%Upper 95%ower 95.0%Upper 95.0%Intercept 344.3821 37.69319 9.136452 9.11E-19 270.36 418.4041 270.36 418.4041Kerang 0.116918 0.016905 6.916259 1.16E-11 0.083721 0.150116 0.083721 0.150116Ararat 0.252276 0.003943 63.97412 5.2E-275 0.244532 0.26002 0.244532 0.26002Mortlake 0.069225 0.017005 4.070768 5.29E-05 0.03583 0.10262 0.03583 0.10262Stockyard 0.0773 0.017035 4.537614 6.84E-06 0.043846 0.110754 0.043846 0.110754Horsham 0.310542 0.016014 19.39158 8.2E-66 0.279093 0.34199 0.279093 0.34199Moorabool 0.08055 0.017459 4.613622 4.81E-06 0.046263 0.114836 0.046263 0.114836Mid_point 0 0 65535 #NUM! 0 0 0 0Gen - NSW 0.27571 0.029654 9.297685 #NUM! 0.217476 0.333944 0.217476 0.333944Gen - VIC 0.066203 0.016569 3.995552 7.23E-05 0.033664 0.098741 0.033664 0.098741Gen - SA -0.34409 0.095716 -3.59487 0.00035 -0.53205 -0.15612 -0.53205 -0.15612Load - NSW -0.28981 0.031359 -9.2417 3.85E-19 -0.35139 -0.22822 -0.35139 -0.22822Load - VIC -0.10614 0.019515 -5.43906 7.72E-08 -0.14447 -0.06782 -0.14447 -0.06782Load - SA 0.342128 0.098356 3.478459 0.00054 0.148976 0.535281 0.148976 0.535281Flow - NSW>VIC -0.14817 0.023465 -6.3144 5.18E-10 -0.19425 -0.10209 -0.19425 -0.10209Flow - SA>VIC 0.460207 0.110016 4.183106 3.29E-05 0.244158 0.676257 0.244158 0.676257Flow - VIC>TAS -0.47614 0.065487 -7.27064 1.08E-12 -0.60474 -0.34753 -0.60474 -0.34753
SUMMARY OUTPUT BAL>MOO2
Regression StatisticsMultiple R 0.990321R Square 0.980735Adjusted R Square 0.980237Standard Error 6.111892Observations 636
ANOVAdf SS MS F ignificance F
Regression 16 1177130 73570.6 1969.486 0Residual 619 23122.89 37.35523Total 635 1200253
Coefficientsandard Err t Stat P-value Lower 95%Upper 95%ower 95.0%Upper 95.0%Intercept 216.5466 16.22877 13.34338 7.05E-36 184.6765 248.4167 184.6765 248.4167Kerang 0.091657 0.007278 12.59305 1.55E-32 0.077364 0.10595 0.077364 0.10595Ararat 0.086766 0.001698 51.10401 2.9E-224 0.083432 0.0901 0.083432 0.0901Mortlake 0.016445 0.007322 2.24613 0.025048 0.002067 0.030824 0.002067 0.030824Stockyard 0.135216 0.007335 18.43547 8.02E-61 0.120813 0.14962 0.120813 0.14962Horsham 0.113743 0.006895 16.49663 6.05E-51 0.100203 0.127283 0.100203 0.127283Moorabool -0.04255 0.007517 -5.66029 2.31E-08 -0.05731 -0.02779 -0.05731 -0.02779Mid_point 0 0 65535 #NUM! 0 0 0 0Gen - NSW 0.198931 0.012767 15.58121 #NUM! 0.173858 0.224003 0.173858 0.224003Gen - VIC 0.019398 0.007134 2.719104 0.006729 0.005388 0.033407 0.005388 0.033407Gen - SA -0.17502 0.041211 -4.24702 2.5E-05 -0.25595 -0.09409 -0.25595 -0.09409Load - NSW -0.20769 0.013501 -15.3827 1.86E-45 -0.2342 -0.18117 -0.2342 -0.18117Load - VIC -0.05283 0.008402 -6.28747 6.1E-10 -0.06933 -0.03633 -0.06933 -0.03633Load - SA 0.189139 0.042347 4.466385 9.46E-06 0.105977 0.2723 0.105977 0.2723Flow - NSW>VIC -0.13776 0.010103 -13.6356 3.3E-37 -0.1576 -0.11792 -0.1576 -0.11792Flow - SA>VIC 0.217952 0.047367 4.601335 5.09E-06 0.124932 0.310972 0.124932 0.310972Flow - VIC>TAS -0.36036 0.028196 -12.7807 2.31E-33 -0.41573 -0.30499 -0.41573 -0.30499


![AEMO/Ten… · Web viewWithin [six] months of the New Completion Date, AEMO may request the Consultant to provide AEMO with details of the Consultancy Fee the Consultant proposes](https://img.pdfslide.us/doc/110x75/5b30716f7f8b9adc6e8e1fe4/aemoten-web-viewwithin-six-months-of-the-new-completion-date-aemo-may-request.jpg)