Embed Size (px)
Citation preview

Title: Natural product biosynthetic gene diversity in geographically distinct soil microbiomes. 1
Authors: Boojala Vijay B. Reddy, Dimitris Kallifidas, Jeffrey H. Kim, Zachary Charlop-2
Powers, Zhiyang Feng and Sean F. Brady* 3
Author affiliation: Laboratory of Genetically Encoded Small Molecules, Howard Hughes Medical 4
Institute, The Rockefeller University, 1230 York Avenue, New York, NY 10065. 5
*Corresponding Author: Sean F. Brady 6
Contact: Laboratory of Genetically Encoded Small Molecules 7
The Rockefeller University 8
1230 York Avenue 9
New York, NY 10065 10
Phone: 212-327-8280 11
Fax: 212-327-8281 12
Email: [email protected] 13 14
Running Title: Biosynthetic gene diversity in soil microbiomes 15
16
Key Words: 17
Metagenome; Microbiome; Natural products; Secondary metabolites; NRPS Adenylation domain; 18
Type-I Polyketide ketosynthase domain; Type-II Polyketide ketosynthase alpha domain; Natural 19
product diversity; 16S sequences 20
21
Copyright © 2012, American Society for Microbiology. All Rights Reserved.Appl. Environ. Microbiol. doi:10.1128/AEM.00102-12 AEM Accepts, published online ahead of print on 16 March 2012
on Novem
ber 23, 2018 by guesthttp://aem
.asm.org/
Dow
nloaded from

ABSTRACT 22
The number of bacterial species estimated to exist on Earth has increased dramatically in 23
recent years. This newly recognized species diversity has raised the possibility that bacterial 24
natural product biosynthetic diversity has also been significantly underestimated by previous culture 25
based studies. Here, we compare 454-pyrosequenced nonribosomal peptide adenylation domain, 26
type I polyketide ketosynthase domain and type II polyketide ketosynthase alpha gene fragments 27
amplified from cosmid libraries constructed using DNA isolated from three different arid soils. While 28
16S rRNA gene sequence analysis indicates these cloned metagenomes contain DNA from similar 29
distributions of major bacterial phyla, we found that they contain almost completely distinct 30
collections of secondary metabolite biosynthetic gene sequences. When grouped at 85% identity 31
only 1.5% of the adenylation domain, 1.2% of the ketosynthase and 9.3% of the ketosynthase alpha 32
sequence clusters contained sequences from all three metagenomes. Although there is unlikely to 33
be a simple correlation between biosynthetic gene sequence diversity and the diversity of 34
metabolites encoded by the gene clusters in which these genes reside, our analysis further 35
suggests that sequences in one soil metagenome are so distantly related to sequences in another 36
metagenome that they are, in most cases, likely to arise from functionally distinct gene clusters. 37
The marked differences observed among collections of biosynthetic genes found in even 38
ecologically similar environments suggest that prokaryotic natural product biosynthetic diversity is, 39
like bacterial species diversity, potentially much larger than appreciated from culture based studies. 40
41
on Novem
ber 23, 2018 by guesthttp://aem
.asm.org/
Dow
nloaded from
INTRODUCTION 42
Phylogenetic analyses based on 16S rRNA gene sequences show that environmental 43
samples can contain thousands of unique bacterial species, only a small fraction of which are grown 44
using traditional culturing techniques (27). Contrary to the century-old tenant in microbiology that 45
“everything is everywhere; but the environment selects,”(4) recent molecular phylogenetic based 46
biogeography studies have found that ecologically similar yet geographically distant environments 47
can contain distinct consortia of bacterial species (24, 34, 35). Extrapolations from these and other 48
studies have led to predictions that there may be as many as 107 to 109 unique bacterial species on 49
Earth (12, 30). As bacteria are considered one of the world’s richest sources of bioactive natural 50
products, such predictions could have profound implications for future drug discovery efforts. 51
However, whether this newly recognized bacterial species diversity corresponds to a modest 52
increase in secondary metabolite biosynthetic diversity or to a radical increase in the number of 53
unexplored biosynthetic systems is currently unknown. 54
It is possible that there exists a relatively small global collection of secondary metabolite 55
gene clusters that is largely conserved from one location to the next, or conversely, that secondary 56
metabolite gene clusters are to some extent geographically and environmentally constrained, 57
resulting in the presence of largely orthogonal collections of gene clusters in geographically distinct 58
microbiomes. Here we have sought to begin to address this issue by determining whether the 59
collections of biosynthetic genes found in ecologically similar but geographically distinct soil 60
microbiomes differ from sample to sample or whether they are largely conserved across geographic 61
boundaries. The number and diversity of novel natural products that remains to be examined for 62
potentially useful bioactivities is likely to depend heavily on which of these two possibilities is 63
dominant throughout the biosphere. 64
Secondary metabolite biosynthetic diversity encoded within a soil metagenome is difficult to 65
assess using standard microbiology methods because the majority of environmental bacteria are 66
not readily cultured. Culture independent, or metagenomic methods, which rely on cloning DNA 67
directly from environmental samples, provide a means of exploring secondary metabolism in natural 68
on Novem
ber 23, 2018 by guesthttp://aem
.asm.org/
Dow
nloaded from

bacterial populations (19). To compare the biosynthetic potentials of different soil microbiomes, 69
environmental DNA (eDNA) extracted directly from three geographically distinct arid soils collected 70
in the American Southwest [the Sonoran desert of Arizona (AZ), the Anza-Borrego region of the 71
Sonoran desert of California (AB) and the Great Basin desert of Utah (UT)] was used to construct 72
three independent eDNA cosmid libraries. Each library contains in excess of 350 GB of DNA 73
(~100,000 bacterial genome equivalents) and is predicted to provide sufficient sequence coverage 74
to capture the major constituents of the respective soil metagenome (2, 3, 6, 16, 17, 21, 22). The 75
enormous size of these cloned soil metagenomes makes it difficult to shotgun sequence to a depth 76
that would provide statistically relevant comparisons of differences in secondary metabolite genes. 77
We have therefore compared secondary metabolism in different soils by pyrosequencing PCR 78
amplified fragments of conserved sequences found in nonribosomal peptide synthetase (NRPS), 79
type I polyketide synthase (PKSI) ketosynthase and type II polyketide synthases gene clusters, 80
three of the most common bacterial natural product biosynthetic systems (Fig. 1A). 81
MATERIALS AND METHODS 82
Sample collection, DNA isolation and library construction. Topsoil including cryptobiotic 83
crust was collected from three sites in the Southwestern United States: the Sonoran desert of 84
Arizona (AZ), the Anza-Borrego section of the Sonoran desert of California (AB) and the Great 85
Basin desert of Utah (UT). All samples were collected in the summer months from undisturbed 86
environments that were representative of the most common terrain and vegetation seen in these 87
three deserts. Each sample was sifted through fine mesh to break up large dirt particles and 88
remove rocks and large vegetative material. DNA was then extracted directly from the sifted soils. 89
DNA extraction and library construction were carried out using published protocols (5)(2, 3, 22). 90
Briefly: Each dirt sample was incubated at 70 °C in lysis buffer [2% sodium dodecyl sulfate (w/v), 91
100 mM Tris-HCl, 100 mM ethylenediaminetetraacetic acid (EDTA), 1.5 M NaCl, 1% cetyl trimethyl-92
ammonium bromide (w/v)] for two hours. Large particulates were then removed by centrifugation 93
on Novem
ber 23, 2018 by guesthttp://aem
.asm.org/
Dow
nloaded from
(4,000xg, 30 min) and crude eDNA was precipitated from the resulting supernatant with the addition 94
of 0.6 volumes of isopropyl alcohol. Precipitated DNA was collected by centrifugation (4,000 x g 30 95
min), washed with 70% ethanol and resuspended in a minimum volume of TE (10 mM Tris, 1 mM 96
EDTA, pH 8). The remaining soil material was separated from the DNA by preparative agarose gel 97
electrophoresis (1% agarose, 0.5x Tris/Borate/EDTA, 16 hours, 20 V). High-molecular-weight DNA 98
was electroeluted from the agarose, blunt ended (Epicentre, End-It), ligated into the SmaI site of 99
either pWEB or pWEB:TNC, packaged into lambda phage, and transfected into E. coli EC100. 100
Each library was expanded to contain at least 10,000,000 unique eDNA cosmid clones. To facilitate 101
future clone recovery efforts libraries were arrayed as unique 5,000-membered sublibraries 102
consisting of matching minipreps and glycerol stock pairs. Cosmid DNA miniprepped from the pool 103
of clones contained in each library was used for PCR screening as described below. Individual KSα 104
containing clones were recovered from libraries pools by successive rounds of PCR screening and 105
then sequenced using 454 pyrosequencing. 106
PCR amplification of domains from each library. Numerous secondary metabolite 107
biosynthetic gene specific degenerate primers can be found in the literature. From this pool of 108
degenerate primers we selected primers designed to recognize conserved regions in nonribosomal 109
peptide synthetase (NRPS) adenylation domain (AD), type I polyketide synthase (PKSI) 110
ketosynthase domain (KS) and type II polyketide synthases (PKSII) ketosynthase alpha (KSα) 111
sequences (1, 25, 28). Important features we considered when selecting from the degenerate 112
primers that have appeared in the literature included: amplicon length below 1,000 base pairs (bp), 113
limited homonucleotide stretches in known sequences of the region to be amplified, and robust 114
amplification using standard PCR conditions. 115
Adenylation domain fragments (~795 bp) were PCR amplified using primers A3F (5’-116
GCSTACSYSATSTACACSTCSGG) and A7R (5’-SASGTCVCCSGTSCGGTA) (1). These primers 117
were designed to recognize the conserved regions A3 and A7 in NRPS adenylation domains. 118
Within the bpsA gene from the Amycalopsis balhimycina derived balhimycin biosynthetic gene 119
cluster the amplified region corresponds to nucleotides 15217 through 15909 (GenBank accession 120
on Novem
ber 23, 2018 by guesthttp://aem
.asm.org/
Dow
nloaded from

number: Y16952.3). KSα gene fragments (~672 bp) were amplified using primers KSα-F (5’-121
TSGCSTGCTTCGAYGCSATC) and KSα-R (5’-TGGAANCCGCCGAABCCGCT) (25). These 122
primers were designed to amplify the most conserved region of KSα genes. In the KSα gene from 123
the Streptomyces coelicolor actinorhodin biosynthesis pathway the amplified region corresponds to 124
nucleotides 720 through 1332 (GenBank accession number: X63449.1). KS domain fragments 125
(~760 bp) were amplified using primers: degKS2F.i (5’-GCIATGGAYCCICARCARMGIVT) and 126
degKS2R.i (5’- GTICCIGTICCRTGISCYTCIAC) (28). These primers were designed to amplify the 127
most conserved regions of type I PKS ketosynthase domains, including the active site residues. In 128
the case of the eryAIII gene from erythromycin biosynthesis in Streptomyces erythraea this 129
amplicon spans nucleotide 11056 through 11735 (GenBank accession number: M63677). The 16S 130
rRNA gene V4 hypervariable region (~207 bp) was amplified using primers 16S-F (5’-131
AYTGGGYDTAAAGNG) and 16S-R (5’-TACNVGGGTATCTAATCC) (10, 11). Forward and reverse 132
primers incorporated 454-sequencing adapters (forward primer “A adaptor” 5’-133
CGTATCGCCTCCCTCGCGCCATCAG; reverse primer “B adaptor” 5’-CTATGCGCCTTGCCA 134
GCCCGCTCAG). To allow for sequencing of different genes in the same region of a 454 plate 135
sample specific tags were added between either the reverse or forward degenerate primer and the 136
454-sequencing adapter. 137
For AD, KSα and 16S rRNA genes, amplification reactions were carried out using two 138
distinct PCR conditions in an attempt to amplify the most diverse set of eDNA gene sequences. 139
The first reaction mix (20 μl/reaction) contained 100 ng cosmid DNA, 0.5 μM each primer, 200 μM 140
each dNTP, 1x Phusion GC buffer (New England Biolabs), 0.2 U Phusion polymerase (New 141
England Biolabs) and 3% DMSO. The second reaction mix contained 1x G buffer (Epicentre), 50 142
pmol of each primer, 2.5 U Taq polymerase (New England Biolabs) and 100 ng cosmid DNA. For 143
amplification with the AD and KSα primers with the first reaction mix followed a PCR protocol of 30 144
cycles consisting of 10 sec at 98 °C, 30 sec at 70 °C, and 30 sec at 72 °C, followed by a final 145
extension at 72 °C for 5 min and the second reaction mix followed a PCR protocol of 35 cycles 146
consisting of 1 min at 95 °C, 3 min at 72 °C, followed by a final extension at 72 °C for 5 min. For 147
on Novem
ber 23, 2018 by guesthttp://aem
.asm.org/
Dow
nloaded from
amplifications with the 16S primers the first reaction mix followed a PCR protocol of 25 cycles 148
consisting of 10 sec at 98 °C, 30 sec at 55 °C, and 30 sec at 72 °C, followed by extension at 72 °C 149
for 5 min. The second reaction mix followed a PCR protocol of 35 cycles consisting of 40 sec at 95 150
°C, 40 sec at 55 °C, 40 sec at 72 °C, followed by extension step at 72 °C for 5 min. While AD, KSα 151
and 16S primers worked successfully under multiple PCR conditions, we could only identify a single 152
condition that worked with the KS domain specific primers. PCR reactions (20 μl) using KS domain 153
specific primers contained 1x G buffer, 50 pmol of each primer, 2.5 U Taq polymerase and 100 ng 154
cosmid DNA. The amplification reactions performed for 35 cycles consisting of 40 sec at 95 °C, 40 155
sec at 50 °C, 75 sec at 72 °C, followed by a final extension step at 72 °C for 5 min. 156
454 sequencing and data processing. PCR products were run on crystal violet stained 157
gels and amplicons of correct predicted size were gel-purified using a Qiagen MinElute columns 158
following the manufacturer’s instructions. The purified PCR products were fluorometrically 159
quantified (PicoGreen QuantIT Invitrogen) and analyzed via capillary electrophoresis (DNA 7500 160
Agilent Technologies). Each purified amplicon was diluted to 109 molecules/μl. Amplicons of the 161
same gene from different libraries were pooled and used as a template for emulsion PCR (emPCR). 162
Parallel pyrosequencing (454 GS-FLX Titanium) of beads from these independent emPCR 163
reactions was performed according to manufacturer’s protocol and processed as described below. 164
Base calls and quality scores were extracted using the 454 GS-FLX Titanium shotgun processing 165
software. Sequences are deposited in the NCBI Sequence Read Archive (SRA) database under 166
accession number SRP008112. 167
The number of sequences carried forward after each processing step is shown in 168
Supplementary Table 1. Sequences obtained from 454 pyrosequencing (Supplementary Table 1, 169
454 Reads) were initially processed and cleaned using the ribosomal database project (RDP) 170
pyrosequencing pipeline (10). This included removal of the primers, removal of reads less than 300 171
bp, removal of reads containing ambiguous calls and the trimming of the remaining reads to 300 bp 172
out from the forward primer site (Supplementary Table 1, RDPP Trim). Potential chimeric 173
sequences were removed using UCHIME (Supplementary Table 1, No Chimes) (15). Identical 174
on Novem
ber 23, 2018 by guesthttp://aem
.asm.org/
Dow
nloaded from

sequences were then removed (Supplementary Table 1, Non-redundant). Each set of sequences 175
was then compared to the appropriate reference sequence database (NRPS-REF, PKSI-REF and 176
PKSII-REF, see below) and any reads that did not align to a reference over at least 90% of the read 177
with an E-value of <10e-10 were removed (Supplementary Table 1, Ref-Homologs). AD sequences 178
were found to be much more divergent than KS or KSα sequences, and therefore an E-value cutoff 179
of 10e-5 was used in AD reference database searches. For some analyses redundant sequences 180
removed early on (Supplementary Table 1, Non-redundant) were added back to the dataset 181
(Supplementary Table 1, Ref-Hom-Redun). The Ref-Hom-Redun sequences were clustered at 97% 182
identity using USEARCH to compensate for potential sequencing errors (Supplementary Table 1, 183
97% Unique) (14). To search for sequences related to functionally characterized gene clusters we 184
used unique sequences clustered at 100% identity (Ref- Homologs). Fig. 5 was constructed using 185
R and gplot (36). 186
Reference sequence database preparation for NRPS, Type-I PKS and Type-II PKS 187
genes (NRPS-REF, PKSI-REF and PKSII-REF). To generate a database of known AD, KS and 188
KSα sequences that could be used to clean our 454 data sets, a primer-based pattern search on 189
NCBI-NT database was performed with forward degenerate primers. From this search, in each 190
case, 300 bp out from the site recognized by the forward primer was cut from the NCBI-NT 191
sequence and this collection of 300 bp fragments was then used in BLASTX queries against all 192
NCBI-NR protein sequences. All BLASTX hits meeting the following criteria were collected and 193
used as reference sequence databases: 1. E-value of <10e-10, 2. Alignment of greater than 90% of 194
the length of the translated NCBI-NT derived query sequence, and 3. Greater than 50% identity to 195
the query sequence. 196
NRPS AD domains, Type I polyketide KS domains and Type II polyketide KSα domain are 197
all distantly related to sequences used outside secondary metabolism. In an attempt to avoid 198
populating our reference library with sequences from primary metabolism, annotation data from any 199
sequence that showed an E-value of less <10e-10 and >90% alignment coverage but lower than 50% 200
identity to a query sequence was manually scrutinized. Among these sequences only the 201
on Novem
ber 23, 2018 by guesthttp://aem
.asm.org/
Dow
nloaded from

sequences that were explicitly annotated in the NCBI-NT database as nonribosomal peptide 202
adenylation domains, polyketide type I ketosynthases or polyketide type II ketosynthases were 203
included in our reference sequence databases (NRPS-REF, PKSI-REF and PKSII-REF). 204
16S phylogenetic analysis. 16S rRNA gene hypervariable region reads were processed as 205
described above with a few modifications: 1. Reads that did not contain both primers were removed, 206
2. Chimeric sequences were removed using chimera_bellerophon (MOTHUR) and UCHIME and 3. 207
E. coli 16S rRNA gene sequences were explicitly removed from the data set (31). Cleaned 16S 208
reads were classified using RDP classifier. For each 16S dataset, a single representative sequence 209
from each of the clusters that formed when grouped at 97% identify (Supplementary Table 2, 97% 210
Unique) was used for RDP-based phylum level classification. The number of sequences carried 211
forward after each processing step is shown in Supplementary Table 2. 212
Assignment to similarity-based OTUs and sequence-type richness estimators. To 213
compute rarefaction curves and sequence type richness estimation with DOTUR we needed to 214
generate a multiple sequence alignment of each 454 data set (29). There were too many 215
sequences to align efficiently using ClustalW. We therefore elected to initially cluster each group of 216
sequences (Supplementary Table 1, Ref-Hom-Redun) at 85% identity using USEARCH. 217
Representative sequences from each of the resulting clusters were then used to generate multiple 218
sequence alignment. The alignments of KS and KSα sequences were carried out using ClustalW 219
and for the larger AD data sets the alignments were carried out using MUSCLE (13). Reference 220
alignments were then used as templates to finally align all of the cleaned reads (Supplementary 221
Table 1, Ref-Hom-Redun) using the align_seqs module in MOTHUR (31). Distance matrices were 222
calculated from the resulting alignments using the dist_seqs module in MOTHUR and then these 223
matrices were used as inputs to compute Shannon-Weaver diversity indices, Chao1 richness 224
estimates and rarefaction curves with DOTUR (29). 225
Comparative sequence analyses. The Ref-Hom-Redun sequence sets for individual genes 226
from different libraries were combined and clustered at 97%, 90% and 85% sequence identities 227
using USEARCH. The origin of the sequences in each cluster was recorded and this data is 228
on Novem
ber 23, 2018 by guesthttp://aem
.asm.org/
Dow
nloaded from

displayed as Venn diagrams in Fig. 3. BioinfoRx. Inc’s Venndiagram.php web tool 229
(http://bioinforx.com/free/bxarrays/venndiagram.php) was used for drawing Venn diagrams. The 230
exact number of clades that appears when sequences from each library are clustered at various 231
percent identities is shown in Supplementary Table 4. The number of OTUs generated by DOTUR 232
and USEARCH differ slightly. This is likely due to the different clustering algorithms used by the two 233
programs. DOTUR uses distance matrices based on multiple sequence alignments as a basis for 234
clustering whereas USEARCH uses pairwise alignments and nearest neighbor joining for clustering. 235
The number of clusters predicted by these programs can also vary slightly when starting with 236
different sized populations of closely related sequences. 237
Molecular phylogenetic tree construction. The sets of 97% Unique sequences obtained 238
for each gene from all three libraries were pooled and clustered at 85% sequence identity using 239
USEARCH (14). Representative sequences from each clade were aligned and phylogenetic trees 240
were calculated using the neighbor-joining algorithm of ClustalW (32). Circular phylogenetic trees 241
were plotted using the interactive Tree of Life (iTOL) (23). For KSα all 492 clusters are drawn on 242
the final tree. Representative sequences from only 500 most populated clusters were used for the 243
construction of AD and KS trees (Fig. S1). 244
RESULTS 245
454-pyrosequencing of cloned AD, KS and KSα domains. Degenerate primers designed 246
to recognize conserved sequences found in gene clusters encoding nonribosomal peptides, type I 247
polyketides and type II polyketides were used to PCR amplify secondary metabolite specific gene 248
sequences from three cloned metagenomes (Fig. 1) (1, 25, 28). The resulting amplicons, 249
corresponding to NRPS adenylation domain (AD), PKSI ketosynthase domain (KS) and PKSII 250
ketosynthase alpha (KSα) gene fragments were then pyrosequenced using 454-GS-FLX technology 251
(Fig. 1). In each case, we continued sequencing until Chao1 sequence richness estimates 252
predicted that at least half of the unique genes present within each metagenome had been 253
on Novem
ber 23, 2018 by guesthttp://aem
.asm.org/
Dow
nloaded from

sequenced (see discussion below and Fig. 2A). In total, between 22,000 and 79,000 reads were 254
obtained for each metagenome specific amplicon (Fig. 2A). 255
454 pyrosequencing error rates have been reported to range from less than 1% to as high 256
as 4%.(20). Studies looking specifically at 454 GS-FLX sequencing technology report error rates 257
below 3%, even over long read lengths (8). We therefore clustered all processed reads at 97% 258
identity to correct for potential sequencing errors and obtain unique sets of non-redundant gene 259
sequences from each metagenome/amplicon pair. This analysis led to the identification of, on 260
average, 13,177 AD, 2,960 KS and 666 KSα unique sequences per cloned metagenome (Fig 2A). 261
If pyrosequencing error rates exceed 3%, the true diversity would be lower than that predicted here. 262
At this depth of sequencing, rarefaction curves for both KS and KSα domains appear to be reaching 263
asymptotes (Fig. 2B). For AD domains, which the Shannon diversity index predicts are the most 264
diverse set of sequences, this does not appear to be the case even though we acquired more than 265
60,000 AD reads per cloned metagenome (Fig. 2). Chao1 sequence richness estimates calculated 266
at a cutoff of 3% predict that each cloned metagenome contains on average 23,884, 4,493 and 267
1,016 unique AD, KS and KSα sequences, respectively (7). As stated above, based on these 268
richness estimates, we have sequenced deep enough to identify over 50% of the unique domains 269
that are accessible from each metagenome using this set of degenerate primers. 270
454-pyrosequencing and comparison of cloned 16S sequences: For each library, the 271
percentage of unique 16S rRNA gene fragments corresponding to different major bacterial phyla 272
was calculated (Table S3) and is shown as bar graphs in Fig 1B. Although these libraries were 273
constructed from soils collected in geographical distinct locations they contain very similar 274
distributions of major bacterial phyla. Based on 16S rRNA gene sequences, Proteobacteria, 275
Actinobacteria, Verucomicrobia, Acidobacteria and Bacteroidetes are the most common phyla 276
represented in each library. 277
Global comparisons of metagenome derived AD, KS and KSα amplicons. For 278
comparison purposes, all of the sequences obtained for a given domain were pooled and then 279
clustered based on sequence identity. The resulting clusters were grouped according to whether 280
on Novem
ber 23, 2018 by guesthttp://aem
.asm.org/
Dow
nloaded from

they contained sequences from one, two or all three metagenomes. These relationships are 281
depicted as Venn diagrams in Fig. 3. When sequences from all three soils were clustered at 97% 282
identity, almost all of the resulting clusters were populated with sequences from a single 283
metagenome indicating that these three soils contain essentially orthogonal sets of secondary 284
metabolite biosynthetic gene sequences. Three percent divergence is commonly used to define 285
unique bacterial species in 16S rRNA gene based molecular phylogenetic analyses; however, for 286
less conserved sequences like secondary metabolite biosynthetic genes this metric likely has little 287
functional relevance. It would be more informative to group sequences at similarities corresponding 288
to the point at which two gene sequences have a high likelihood of being derived from gene clusters 289
that encode for the production of structurally distinct metabolites. Although for many genes there is 290
unlikely to be a simple linear correlation between sequence divergence and differences in the 291
metabolites encoded by the gene clusters these genes are associated with, molecular phylogenetic 292
comparisons of microbiome-derived gene sets at different identities should be a useful strategy for 293
comparing secondary metabolite genes derived from different microbiomes (Fig. 3). Even when 294
gene sets from the three metagenomes were clustered at identities as low as 90 and 85%, only a 295
small number of the resulting clusters contained sequences from all three metagenomes (Fig. 3). 296
When clustered at 85% identity only 1.5% of AD, 1.2% of KS and 9.3% of KSα clusters contained 297
sequences from all three metagenomes. When grouped at 85% identity 50% of AD, 37% KS and 298
17% KSα clusters are populated with a single pyrosequencing read. While many of these likely 299
represent distinct environmental sequences, it is also possible that some sequences are due to 300
undetected chimera events or higher than predicted sequencing error rates. Venn diagrams 301
constructed using representative sequences from only the 500 most populated AD and KS clades 302
are shown in Fig. 3B. Each of these clades contains more than 20 unique pyrosequencing reads. 303
This subset of clusters shows more extensive metagenome to metagenome overlap than the entire 304
population of KS and AD sequences; however, even among these more highly populated clusters 305
we see significant metagenome specific differences. Although sequence divergence estimates will 306
vary with the length of the sequences being compared as well as the specific region of the gene that 307
on Novem
ber 23, 2018 by guesthttp://aem
.asm.org/
Dow
nloaded from

is surveyed, the gene fragments examined in this study suggest that these three environments not 308
only contain very few identical sequences, but that they actually contain few sequences that are 309
even closely related to each other. 310
Comparison of eDNA and NCBI-NT database derived sequences: Forward degenerate 311
primers were used in silico to search fully sequenced cultured bacterial genomes deposited in 312
NCBI-NT for AD, KS and KSα sequences. In total, 636 AD, 1455 KS and 180 KSα sequences were 313
found in this search. These sequences were then computationally rescreened using the appropriate 314
reverse degenerate primers. The remaining 334 AD, 1303 KS and 79 KSα were used to assess the 315
phylogenetic specificities of each primer set (Table S5). Sequences recovered with the forward 316
primers were also compared in a clustering analysis with the eDNA derived sequences. NCBI-NT 317
sequences were trimmed to include 300 nucleotides out from the position of the primer and then 318
they were clustered at different identities together with the eDNA sequences we obtained from all 319
three libraries (Table 1). Even when grouped at identities as low as 85% only a small fraction (<2%) 320
of clades contained both eDNA and NCBI-NT derived sequences. Secondary metabolite gene 321
sequences found in these three metagenomes not only differ from each other but they also largely 322
differ from genes previously sequenced from cultured bacteria. 323
AD, KS and KSα phylogenies: Although the individual soil microbiomes explored in this 324
study contain largely orthogonal sets of biosynthetic gene sequences, genes from these different 325
soil samples do not appear to have radically different evolutionary origins. Clustering KSα 326
sequences from all three metagenomes at 85% identity resulted in 492 unique OTUs. A ClustalW 327
derived phylogenetic tree of a single representative sequence from each OTU is shown in Fig. 3C 328
(23, 32). Environmental DNA derived KSαs fall into clades containing KSα sequences that are 329
known to encode structurally diverse aromatic metabolites, as well as several clades without any 330
functionally characterized KSα sequences (Fig. 3C). Sequences from different metagenomes do 331
not group into metagenome specific clades but instead distribute throughout the tree, suggesting 332
that KSα sequences from different soils share a common set of diverse ancestors. AD and KS 333
sequences were so numerous that even when grouped at a molecular distance of 0.15 it is difficult 334
on Novem
ber 23, 2018 by guesthttp://aem
.asm.org/
Dow
nloaded from

to display these data as phylogenetic trees. Supplementary Fig. 1 contains phylogenetic trees of 335
the 500 most populated AD and KS OTUs. AD and KS sequences show the same general trend as 336
KSα sequences, where sequences from different metagenomes largely distribute uniformly 337
throughout the combined phylogenetic trees. 338
339
on Novem
ber 23, 2018 by guesthttp://aem
.asm.org/
Dow
nloaded from

340
DISCUSSION 341
When the degenerate primers used in this study were computationally screened against the 342
NCBI-NT database for AD, KS and KSα genes, approximately two-thirds of the AD and KS 343
sequences and all of the KSα sequences we identified are from Actinobacteria. The remaining AD 344
and KS sequences are from Proteobacteria, in particular Pseudomonas and Burkholderia spp. This 345
coincides with the sources of the deposited sequences encoding these three gene families. 346
Approximately 50% of the AD and KS sequences in the Uniprot database are from Actinobacteria, 347
with Proteobacteria being the next most common source (26) and the vast majority of deposited 348
KSα sequences are also from Actinobacteria. Even though amplification bias introduced by the 349
degenerate primers has undoubtedly led us to underestimate the true sequence diversity present in 350
each metagenome, the set of eDNA derived gene sequences amplified by these primers should be 351
representative of the genetic loci encoding secondary metabolism in each soil sample and therefore 352
permit useful comparisons of biosynthetic capacities of these metagenomes. 353
Although 16S rRNA gene sequence analysis (Fig 1B, Table S3) indicate that the three 354
cloned metagenomes analyzed in this study contain DNA from similar distributions of major 355
bacterial phyla, we found that they contain almost completely distinct collections of secondary 356
metabolite biosynthetic gene sequences. Soil to soil differences seen in secondary metabolite gene 357
sequences do not appear to be artifacts of the sequencing method, the result of generic variations 358
in DNA sequence makeup such as GC content or very high natural polymorphism rates as when 359
16S amplicons from these three metagenomes are clustered in the same manner as the 360
biosynthetic genes they show significantly higher sample to sample overlap at this same range of 361
identities (Fig. 3). In fact the observed sample to sample species overlap of 5-10% correlates very 362
well with species overlaps that have been reported in other 16S-based analyses of distantly 363
sampled soils (18). 364
on Novem
ber 23, 2018 by guesthttp://aem
.asm.org/
Dow
nloaded from

Correlating the observed sequence differences with differences found in the actual 365
secondary metabolites encoded by different metagenomes is complicated by a number of factors, 366
including variations in the rate of evolution of different genes, horizontal gene transfer between 367
bacteria and the possibility of convergent evolution. In spite of these potential complications, the 368
divergence of functionally characterized KSα gene sequences has been observed to correlate quite 369
well with the production of different structural families by the PKSII gene clusters in which these 370
genes reside, with closely related sequences involved in the biosynthesis of related polyketides and 371
distantly related sequences encoding structurally distinct polyketides (16, 25). While not perfect, the 372
inverse relationship seen between KSα sequence identity and natural product structural diversity is 373
quite robust for functionally characterized KSα gene sequences (Fig. 4A). Although there are 374
outliers to this general trend (37) the functional divergence of characterized Type II PKS gene 375
clusters correlates well with the divergence of KSα gene sequences by 10-15% in identity (Fig. 4A). 376
To see if this observation extended into our metagenomic data set we recovered and sequenced 377
cosmid clones containing KSα genes that were both closely related (>85% identity) and distantly 378
related (<85% identity) to KSα genes found in functionally characterized gene clusters. In each 379
case where we recovered a cosmid containing a KSα gene that showed high identity (>85%) to a 380
functionally characterized sequence we found these clones to contain gene clusters that closely 381
resemble the clusters associated with the previously characterized KSα gene in this clade (Fig. 4B). 382
On the other hand, when we examined eDNA clones with KSα genes that diverged by more than 383
15% from functionally characterized KSα genes did not identify any sequences that closely 384
resembled in gene sequence, gene content or gene organization these functionally characterized 385
gene clusters (Fig. S2). 386
The observed correlation between sequence and small molecule diversity, clustering KSα 387
sequences at 85% identity may provide a means of estimating the natural product biosynthetic 388
potential associated with different collections of KSα gene sequences, much in the same way that 389
the clustering 16S sequences at 97% identity is used to gain insights into the species composition 390
of different environmental samples. Based on this metric, the clustering of KSα sequences from a 391
on Novem
ber 23, 2018 by guesthttp://aem
.asm.org/
Dow
nloaded from

single metagenome at 85% identity could provide a rough estimate of the number of different 392
aromatic polyketides a metagenome might encode, whereas the Venn diagram describing the 393
composition of KSα clades observed when sequences from different metagenomes are clustered 394
together at this same identity (Fig. 3) would represent the relationship between the different 395
collections of Type II polyketides encoded by these metagenomes. The 236, 294 and 186 distinct 396
clades (Table S4) observed when AB, AZ and UT KSα gene sequences were clustered at 85% 397
identity, respectively suggests that soil metagenomes might encode hundreds of structurally distinct 398
aromatic polyketides each, and the 85% identity Venn diagram further suggests that: 1. 399
approximately 10% of the metabolites could be common to all three metagenomes (which is 400
represented by the intersection of the three samples in the Venn diagram), 2. another 5-10% could 401
be shared by any two metagenomes, and 3. the remainder could be specific to an individual 402
metagenome. 403
Correlations between sequence divergence and gene cluster function for KS and AD 404
domains are complicated by the fact that multiple KS and AD domains often appear in a single 405
biosynthetic gene cluster. Therefore, even though sequence-type richness and diversity estimates 406
(Fig. 2A) indicate environmental KS and AD sequences are more divergent and numerous than KSα 407
sequences, we cannot directly correlate these differences to global differences in the natural 408
product structural diversity a metagenome might encode. Although it is not possible to predict 409
differences in the structures encoded by these metagenomes, a comparison of our eDNA derived 410
AD and KS sequences to the collection of corresponding domain sequences found in individual 411
functionally characterized Type I PKS and NRPS gene clusters suggests significant functional 412
differences in the three soil metagenomes (Fig. 5). Domains from some functionally characterized 413
gene clusters only have relatives showing high sequence identity (>75%) in one library (i.e. 414
putsolvin, pyoverdine, mycinamucin, rifamycin, aurafuron, triostin A, etc.), others have relatives in 415
two of the three libraries (i.e. dihydrochalcomycin, bacillibactin, A47934, α-lipomycin, epothilone, 416
etc.) and others have relatives in all three libraries (i.e. balhimycin, chloroeremomycin, tetrocarcin, 417
etc.). 418
on Novem
ber 23, 2018 by guesthttp://aem
.asm.org/
Dow
nloaded from

Soils contain highly diverse collections of bacteria making them very attractive starting points 419
for both culture-dependent and culture-independent small molecule discovery efforts. We chose to 420
investigate secondary metabolism in geographically distinct yet ecologically similar soils based on 421
the belief that ecologically similar soils would have the highest likelihood of containing related sets 422
of biosynthetic gene sequences. We found, however, that even metagenomes from ecologically 423
similar environments with similar 16S rRNA makeups (Fig. 1B and 3) can contain almost completely 424
distinct collections of biosynthetic gene sequences. This is likely reflective of the fact that natural 425
product biosynthetic gene content can differ not only between species but also between strains of 426
the same species. In those cases where, based on studies from cultured bacteria, it is possible to 427
speculate about the relationship between gene sequence diversity and secondary metabolite 428
structural diversity our data suggests that sequences in one soil metagenome are so distantly 429
related to sequences in another metagenome that in most cases they are unlikely to be found in 430
gene clusters that encode the same metabolites. If this holds true for other soil types, the 431
unexplored bacterial biosynthetic diversity present in the Earth's biosphere is potentially much larger 432
than predicted previously from fermentation-based analyses (9, 33). 433
434
ACKNOWLEDGEMENTS 435
This work was supported by NIH GM077516. SFB is an HHMI Early Career Scientist. 436
437
REFERENCES 438
1. Ayuso-Sacido, A., and O. Genilloud. 2005. New PCR primers for the screening of NRPS 439
and PKS-I systems in actinomycetes: detection and distribution of these biosynthetic gene 440
sequences in major taxonomic groups. Microb Ecol 49:10-24. 441
2. Banik, J. J., and S. F. Brady. 2008. Cloning and characterization of new glycopeptide gene 442
clusters found in an environmental DNA megalibrary. Proc Natl Acad Sci U S A 105:17273-443
17277. 444
on Novem
ber 23, 2018 by guesthttp://aem
.asm.org/
Dow
nloaded from

3. Banik, J. J., J. W. Craig, P. Y. Calle, and S. F. Brady. 2010. Tailoring enzyme-rich 445
environmental DNA clones: a source of enzymes for generating libraries of unnatural natural 446
products. J Am Chem Soc 132:15661-15670. 447
4. Beijerinck, M. W. 1913. De infusies en de ontdekking der backterie�n. In Jaarboek van de 448
Koninklijke Akademie van Wetenschappen. Mu�ller, Amsterdam. 449
5. Brady, S. F. 2007. Construction of soil environmental DNA cosmid libraries and screening 450
for clones that produce biologically active small molecules. Nature Protocols 2:1297-1305. 451
6. Chang, F. Y., and S. F. Brady. 2011. Cloning and characterization of an environmental 452
DNA-derived gene cluster that encodes the biosynthesis of the antitumor substance BE-453
54017. J Am Chem Soc 133:9996-9999. 454
7. Chao, A. 1987. Estimating the population size for capture-recapture data with unequal 455
catchability. Biometrics 43:783-791. 456
8. Claesson, M. J., Q. Wang, O. O'Sullivan, R. Greene-Diniz, J. R. Cole, R. P. Ross, and P. 457
W. O'Toole. 2010. Comparison of two next-generation sequencing technologies for 458
resolving highly complex microbiota composition using tandem variable 16S rRNA gene 459
regions. Nucleic Acids Res 38:e200. 460
9. Clardy, J., M. A. Fischbach, and C. T. Walsh. 2006. New antibiotics from bacterial natural 461
products. Nat Biotechnol 24:1541-1550. 462
10. Cole, J. R., B. Chai, R. J. Farris, Q. Wang, S. A. Kulam, D. M. McGarrell, G. M. Garrity, 463
and J. M. Tiedje. 2005. The Ribosomal Database Project (RDP-II): sequences and tools for 464
high-throughput rRNA analysis. Nucleic Acids Res 33:D294-296. 465
11. Cole, J. R., Q. Wang, E. Cardenas, J. Fish, B. Chai, R. J. Farris, A. S. Kulam-Syed-466
Mohideen, D. M. McGarrell, T. Marsh, G. M. Garrity, and J. M. Tiedje. 2009. The 467
Ribosomal Database Project: improved alignments and new tools for rRNA analysis. Nucleic 468
Acids Res 37:D141-145. 469
12. Curtis, T. P., W. T. Sloan, and J. W. Scannell. 2002. Estimating prokaryotic diversity and 470
its limits. Proc Natl Acad Sci U S A 99:10494-10499. 471
on Novem
ber 23, 2018 by guesthttp://aem
.asm.org/
Dow
nloaded from

13. Edgar, R. C. 2004. MUSCLE: multiple sequence alignment with high accuracy and high 472
throughput. Nucleic Acids Res 32:1792-1797. 473
14. Edgar, R. C. 2010. Search and clustering orders of magnitude faster than BLAST. 474
Bioinformatics 26:2460-2461. 475
15. Edgar, R. C., B. J. Haas, J. C. Clemente, C. Quince, and R. Knight. 2011. UCHIME 476
improves sensitivity and speed of chimera detection. Bioinformatics 27:2194-2200. 477
16. Feng, Z., D. Kallifidas, and S. F. Brady. 2011. Functional analysis of environmental DNA-478
derived type II polyketide synthases reveals structurally diverse secondary metabolites. Proc 479
Natl Acad Sci U S A. 480
17. Feng, Z., J. H. Kim, and S. F. Brady. 2010. Fluostatins produced by the heterologous 481
expression of a TAR reassembled environmental DNA derived type II PKS gene cluster. J 482
Am Chem Soc 132:11902-11903. 483
18. Fulthorpe, R. R., L. F. Roesch, A. Riva, and E. W. Triplett. 2008. Distantly sampled soils 484
carry few species in common. The ISME journal 2:901-910. 485
19. Handelsman, J., M. R. Rondon, S. F. Brady, J. Clardy, and R. M. Goodman. 1998. 486
Molecular biological access to the chemistry of unknown soil microbes: a new frontier for 487
natural products. Chem Biol 5:R245-249. 488
20. Huse, S. M., J. A. Huber, H. G. Morrison, M. L. Sogin, and D. M. Welch. 2007. Accuracy 489
and quality of massively parallel DNA pyrosequencing. Genome biology 8:R143. 490
21. Kim, J. H., Z. Feng, J. D. Bauer, D. Kallifidas, P. Y. Calle, and S. F. Brady. 2010. Cloning 491
large natural product gene clusters from the environment: piecing environmental DNA gene 492
clusters back together with TAR. Biopolymers 93:833-844. 493
22. King, R. W., J. D. Bauer, and S. F. Brady. 2009. An environmental DNA-derived type II 494
polyketide biosynthetic pathway encodes the biosynthesis of the pentacyclic polyketide 495
erdacin. Angew Chem Int Ed Engl 48:6257-6261. 496
23. Letunic, I., and P. Bork. 2007. Interactive Tree Of Life (iTOL): an online tool for 497
phylogenetic tree display and annotation. Bioinformatics 23:127-128. 498
on Novem
ber 23, 2018 by guesthttp://aem
.asm.org/
Dow
nloaded from

24. Martiny, J. B., B. J. Bohannan, J. H. Brown, R. K. Colwell, J. A. Fuhrman, J. L. Green, 499
M. C. Horner-Devine, M. Kane, J. A. Krumins, C. R. Kuske, P. J. Morin, S. Naeem, L. 500
Ovreas, A. L. Reysenbach, V. H. Smith, and J. T. Staley. 2006. Microbial biogeography: 501
putting microorganisms on the map. Nature reviews. Microbiology 4:102-112. 502
25. Metsa-Ketela, M., L. Halo, E. Munukka, J. Hakala, P. Mantsala, and K. Ylihonko. 2002. 503
Molecular evolution of aromatic polyketides and comparative sequence analysis of 504
polyketide ketosynthase and 16S ribosomal DNA genes from various streptomyces species. 505
Appl Environ Microbiol 68:4472-4479. 506
26. Minowa, Y., M. Araki, and M. Kanehisa. 2007. Comprehensive analysis of distinctive 507
polyketide and nonribosomal peptide structural motifs encoded in microbial genomes. J Mol 508
Biol 368:1500-1517. 509
27. Rappe, M. S., and S. J. Giovannoni. 2003. The uncultured microbial majority. Annu Rev 510
Microbiol 57:369-394. 511
28. Schirmer, A., R. Gadkari, C. D. Reeves, F. Ibrahim, E. F. DeLong, and C. R. 512
Hutchinson. 2005. Metagenomic analysis reveals diverse polyketide synthase gene 513
clusters in microorganisms associated with the marine sponge Discodermia dissoluta. Appl 514
Environ Microbiol 71:4840-4849. 515
29. Schloss, P. D., and J. Handelsman. 2005. Introducing DOTUR, a computer program for 516
defining operational taxonomic units and estimating species richness. Applied and 517
environmental microbiology 71:1501-1506. 518
30. Schloss, P. D., and J. Handelsman. 2004. Status of the microbial census. Microbiology 519
and molecular biology reviews : MMBR 68:686-691. 520
31. Schloss, P. D., S. L. Westcott, T. Ryabin, J. R. Hall, M. Hartmann, E. B. Hollister, R. A. 521
Lesniewski, B. B. Oakley, D. H. Parks, C. J. Robinson, J. W. Sahl, B. Stres, G. G. 522
Thallinger, D. J. Van Horn, and C. F. Weber. 2009. Introducing mothur: open-source, 523
platform-independent, community-supported software for describing and comparing 524
microbial communities. Applied and environmental microbiology 75:7537-7541. 525
on Novem
ber 23, 2018 by guesthttp://aem
.asm.org/
Dow
nloaded from

32. Thompson, J. D., D. G. Higgins, and T. J. Gibson. 1994. CLUSTAL W: improving the 526
sensitivity of progressive multiple sequence alignment through sequence weighting, position-527
specific gap penalties and weight matrix choice. Nucleic Acids Res 22:4673-4680. 528
33. Watve, M. G., R. Tickoo, M. M. Jog, and B. D. Bhole. 2001. How many antibiotics are 529
produced by the genus Streptomyces? Archives of microbiology 176:386-390. 530
34. Whitaker, R. J., D. W. Grogan, and J. W. Taylor. 2003. Geographic barriers isolate 531
endemic populations of hyperthermophilic archaea. Science 301:976-978. 532
35. Whitfield, J. 2005. Biogeography. Is everything everywhere? Science 310:960-961. 533
36. Wickham, H. 2009. Ggplot2 : elegant graphics for data analysis. Springer, New York. 534
37. Zaleta-Rivera, K., L. K. Charkoudian, C. P. Ridley, and C. Khosla. 2010. Cloning, 535
sequencing, heterologous expression, and mechanistic analysis of A-74528 biosynthesis. J 536
Am Chem Soc 132:9122-9128. 537
538
539
540
on Novem
ber 23, 2018 by guesthttp://aem
.asm.org/
Dow
nloaded from

TABLES: 541
542
TABLE 1: Number of clades that appear when eDNA sequences and NCBI-NT sequences are 543
clustered at different percent identities. 544
545
Number of clades (% of total)
%ID Total NCBI-NT eDNA Shared
AD 97% 43,299 596 (1.4%) 42,703 (98.6%) 0 (0.00%)
90% 26,454 517 (2.0%) 25,937 (98.1%) 11 (0.04%)
85% 21,534 461 (2.1%) 21,073 (97.1%) 14 (0.07%)
KS 97% 10,083 1,278 (12.7%) 8,805 (87.3%) 4 (0.04%)
90% 7,915 1,125 (14.2%) 6,790 (85.8%) 4 (0.05%)
85% 6,818 994 (14.6%) 5,824 (85.4%) 8 (0.12%)
KSα 97% 1,651 113 (8.1%) 1,518 (91.9%) 0 (0.00%)
90% 853 102 (12.0%) 751 (88.0%) 7 (0.82%)
85% 578 65 (11.2%) 513 (88.8%) 12 (2.08%)
546
547
548
on Novem
ber 23, 2018 by guesthttp://aem
.asm.org/
Dow
nloaded from

FIGURES AND LEGENDS 549
550
FIG. 1: A. Overview of the approach used to compare secondary metabolism in different soil 551
microbiomes. Independent environmental DNA libraries were constructed from three different arid 552
soils. DNA from each library was used as templates in PCR reactions with degenerate primers 553
designed to recognize nonribosomal peptide synthetase AD domains, Type I polyketide KS domains 554
and Type II polyketide KSα genes. The resulting amplicons were 454 sequenced, processed and 555
compared to assess the similarity of the three gene sets derived from different microbiomes. KS, 556
ketosynthase; ACP, acyl carrier protein; AT, acyltransferase; C, condensation domain; A or AD, 557
adenylation domain; PCP, peptide carrier protein. B. Bar graphs show the frequency at which 16S 558
rRNA genes from different major phyla appeared in each library. As might be expected for 559
metagenomic libraries constructed from ecologically similar soils, 16S rRNA gene analyses indicate 560
that DNA from a very similar distribution of major bacterial phyla was captured in each library. 561
562
on Novem
ber 23, 2018 by guesthttp://aem
.asm.org/
Dow
nloaded from

563
FIG. 2. Sequence richness and diversity estimates. A. The number of raw reads (reads), 564
unique cleaned reads (unique) and OTUs when grouped at 97% identity are shown for AD, KS and 565
KSα sequences amplified from each cloned metagenome (AB, AZ and UT). Chao1 sequence 566
richness estimates are reported at a cutoff of 3%. Shan = Shannon diversity index. Sequences are 567
deposited in the NCBI-SRA database under accession number SRA045798.2. B. Rarefaction 568
curves (using a 3% cutoff value) for AD, KS and KSα sequences amplified from each eDNA library. 569
570
571
on Novem
ber 23, 2018 by guesthttp://aem
.asm.org/
Dow
nloaded from
FIG. 3. Comparison of secondary metabolite gene sequences found in three cloned 573
metagenomes. A. Sequences from all three metagenomes were clustered at various identities and 574
Venn diagrams were then made to show the percent of clades containing sequences from each 575
cloned metagenome. Venn diagrams are drawn to scale whenever possible. B. Even when 576
clustered at 85% identify a large number of AD and KS clades are sparsely populated. Venn 577
diagrams representing the clustering analysis of only the top 500 most populated AD and KS is 578
shown. Each of these clades contains >20 unique pyrosequencing reads. KSα phylogenetic tree. 579
C. Functionally characterized KSα sequences (pink) and representative sequences from each OTU 580
that formed when eDNA sequences were clustered at 85% identity were aligned using ClustalW and 581
plotted with iTol. Branches are color coded according to the soil sample that had the most unique 582
sequences in that branch. The KSα gene from resistomycin biosynthesis was used to root the tree. 583
A key advantage of using large libraries rather than crude eDNA to compare microbiomes is that 584
gene clusters associated with novel biosynthetic genes can be recovered and functionally studied. 585
Marked in purple are KSα sequences associated with eDNA derived gene clusters that have yielded 586
novel secondary metabolites. 587
588
on Novem
ber 23, 2018 by guesthttp://aem
.asm.org/
Dow
nloaded from
589
590
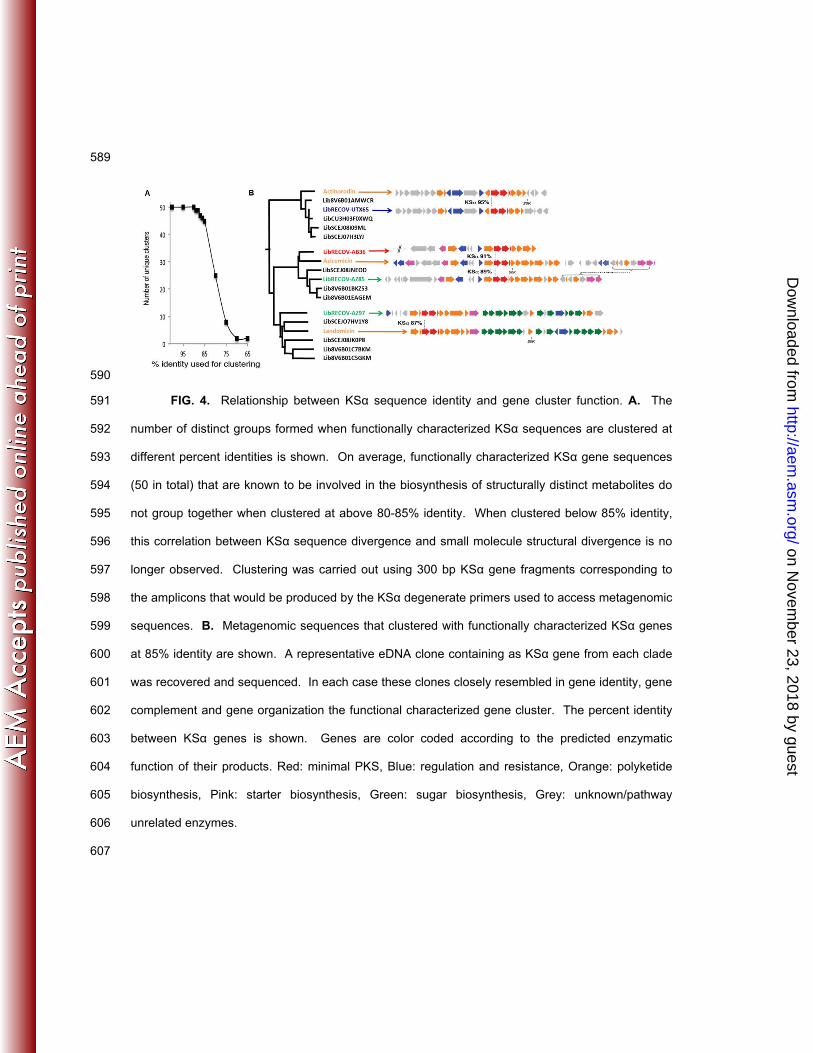
FIG. 4. Relationship between KSα sequence identity and gene cluster function. A. The 591
number of distinct groups formed when functionally characterized KSα sequences are clustered at 592
different percent identities is shown. On average, functionally characterized KSα gene sequences 593
(50 in total) that are known to be involved in the biosynthesis of structurally distinct metabolites do 594
not group together when clustered at above 80-85% identity. When clustered below 85% identity, 595
this correlation between KSα sequence divergence and small molecule structural divergence is no 596
longer observed. Clustering was carried out using 300 bp KSα gene fragments corresponding to 597
the amplicons that would be produced by the KSα degenerate primers used to access metagenomic 598
sequences. B. Metagenomic sequences that clustered with functionally characterized KSα genes 599
at 85% identity are shown. A representative eDNA clone containing as KSα gene from each clade 600
was recovered and sequenced. In each case these clones closely resembled in gene identity, gene 601
complement and gene organization the functional characterized gene cluster. The percent identity 602
between KSα genes is shown. Genes are color coded according to the predicted enzymatic 603
function of their products. Red: minimal PKS, Blue: regulation and resistance, Orange: polyketide 604
biosynthesis, Pink: starter biosynthesis, Green: sugar biosynthesis, Grey: unknown/pathway 605
unrelated enzymes. 606
607
on Novem
ber 23, 2018 by guesthttp://aem
.asm.org/
Dow
nloaded from

608 609
FIG. 5. Comparison of metagenome derived KS and AD domain sequences with those found 610
in functionally characterized gene clusters. Each metagenomic data set was searched by BLAST 611
for KS and AD amplicons that show high sequence identity to similar domains found in functionally 612
characterized Type I PKS and NRPS gene clusters. Individual spokes of the graph correspond to 613
the collection of identify scores for eDNA derived amplicons that show greater than 75% identity to 614
at least one AD or KS domain found in the designated gene cluster. 615
616
on Novem
ber 23, 2018 by guesthttp://aem
.asm.org/
Dow
nloaded from