Embed Size (px)
Citation preview
Sarah Russell Sander Maatman
CEO CFO
Analyst & Investor Conference - London - January 13, 2016
Aegon Asset Management
2
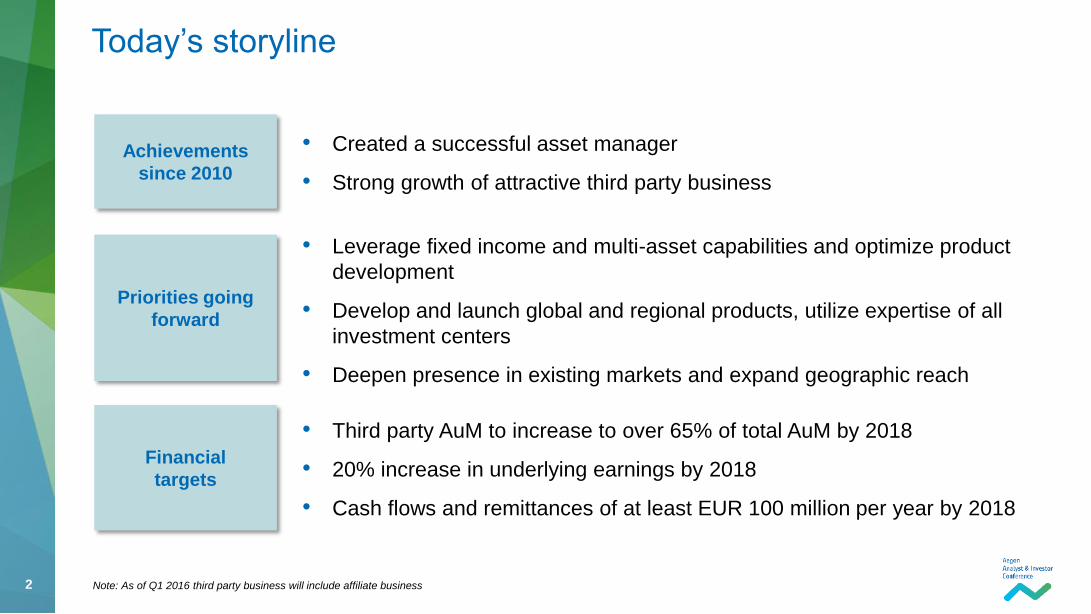
• Created a successful asset manager
• Strong growth of attractive third party business
Today’s storyline
Achievements
since 2010
• Leverage fixed income and multi-asset capabilities and optimize product
development
• Develop and launch global and regional products, utilize expertise of all
investment centers
• Deepen presence in existing markets and expand geographic reach
• Third party AuM to increase to over 65% of total AuM by 2018
• 20% increase in underlying earnings by 2018
• Cash flows and remittances of at least EUR 100 million per year by 2018
Priorities going
forward
Financial
targets
Note: As of Q1 2016 third party business will include affiliate business
3
Achievements since 2010
4
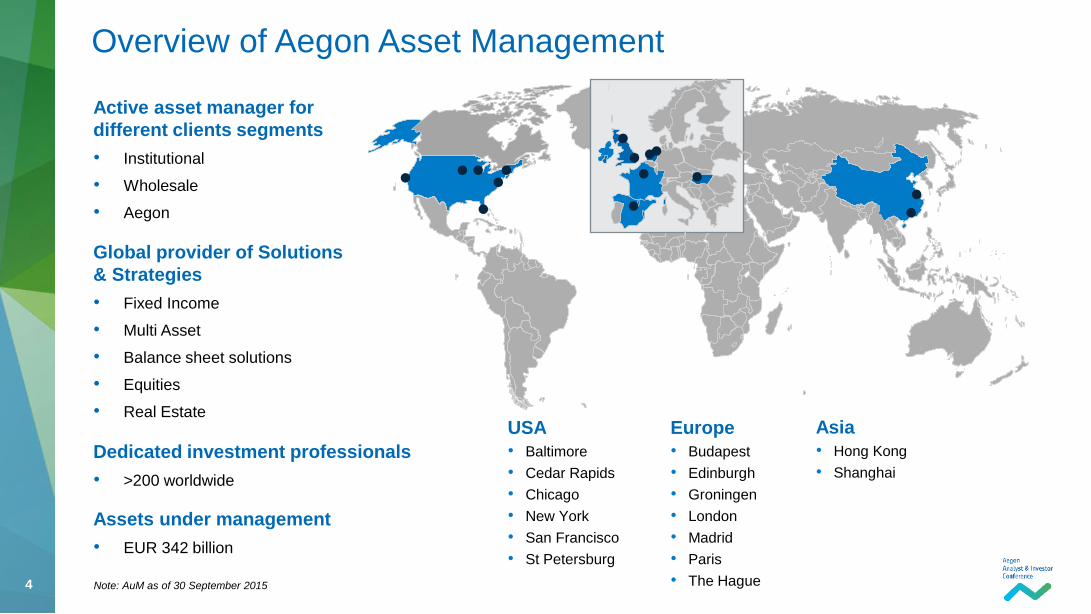
Overview of Aegon Asset Management
Active asset manager for
different clients segments
• Institutional
• Wholesale
• Aegon
Global provider of Solutions
& Strategies
• Fixed Income
• Multi Asset
• Balance sheet solutions
• Equities
• Real Estate
Dedicated investment professionals
• >200 worldwide
Assets under management
• EUR 342 billion
USA
• Baltimore
• Cedar Rapids
• Chicago
• New York
• San Francisco
• St Petersburg
Europe
• Budapest
• Edinburgh
• Groningen
• London
• Madrid
• Paris
• The Hague
Asia
• Hong Kong
• Shanghai
Note: AuM as of 30 September 2015
5
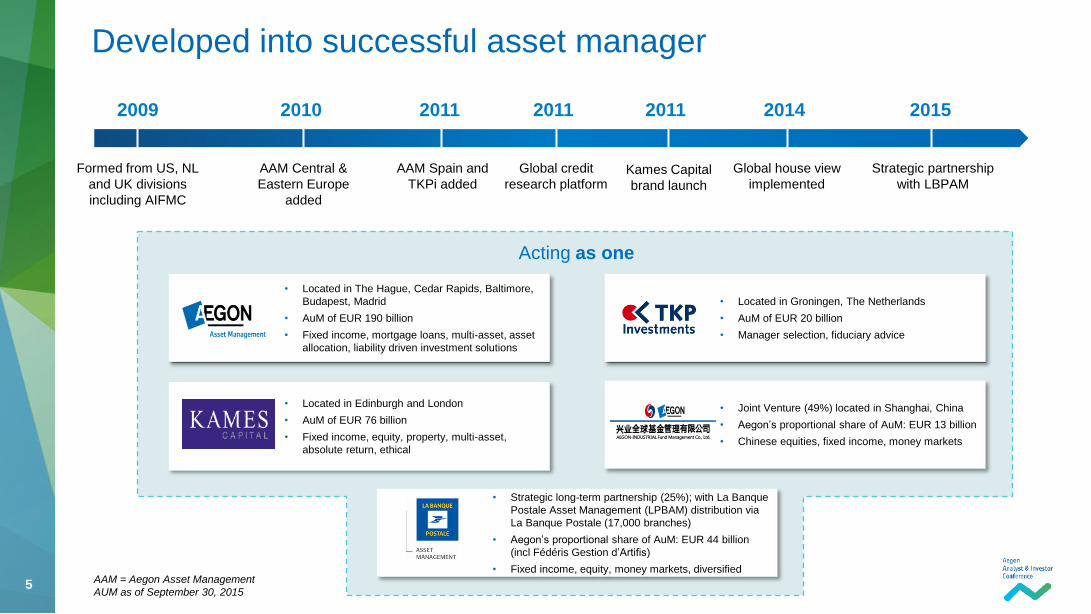
Developed into successful asset manager
Acting as one
Formed from US, NL
and UK divisions
including AIFMC
Global house view
implemented
AAM Central &
Eastern Europe
added
AAM Spain and
TKPi added
Global credit
research platform
2009 2010 2011 2014
Strategic partnership
with LBPAM
2015 2011
• Located in The Hague, Cedar Rapids, Baltimore,
Budapest, Madrid
• AuM of EUR 190 billion
• Fixed income, mortgage loans, multi-asset, asset
allocation, liability driven investment solutions
• Located in Edinburgh and London
• AuM of EUR 76 billion
• Fixed income, equity, property, multi-asset,
absolute return, ethical
• Located in Groningen, The Netherlands
• AuM of EUR 20 billion
• Manager selection, fiduciary advice
• Joint Venture (49%) located in Shanghai, China
• Aegon’s proportional share of AuM: EUR 13 billion
• Chinese equities, fixed income, money markets
• Strategic long-term partnership (25%); with La Banque
Postale Asset Management (LPBAM) distribution via
La Banque Postale (17,000 branches)
• Aegon’s proportional share of AuM: EUR 44 billion
(incl Fédéris Gestion d’Artifis)
• Fixed income, equity, money markets, diversified AAM = Aegon Asset Management
AUM as of September 30, 2015
2011
Kames Capital
brand launch
6
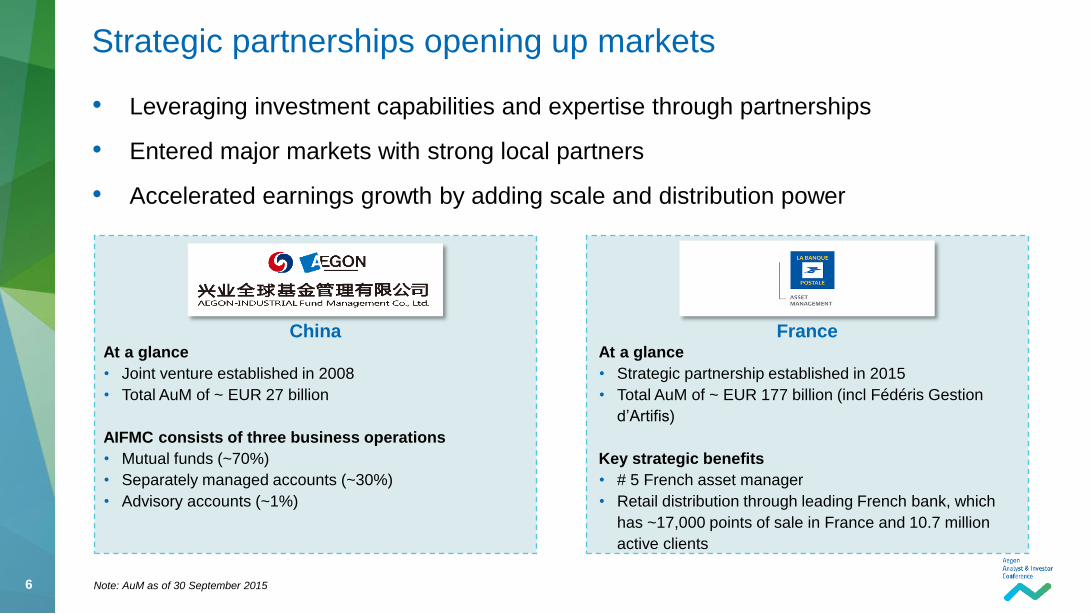
• Leveraging investment capabilities and expertise through partnerships
• Entered major markets with strong local partners
• Accelerated earnings growth by adding scale and distribution power
Strategic partnerships opening up markets
China At a glance
• Joint venture established in 2008
• Total AuM of ~ EUR 27 billion
AIFMC consists of three business operations
• Mutual funds (~70%)
• Separately managed accounts (~30%)
• Advisory accounts (~1%)
France At a glance
• Strategic partnership established in 2015
• Total AuM of ~ EUR 177 billion (incl Fédéris Gestion
d’Artifis)
Key strategic benefits
• # 5 French asset manager
• Retail distribution through leading French bank, which
has ~17,000 points of sale in France and 10.7 million
active clients
Note: AuM as of 30 September 2015
7
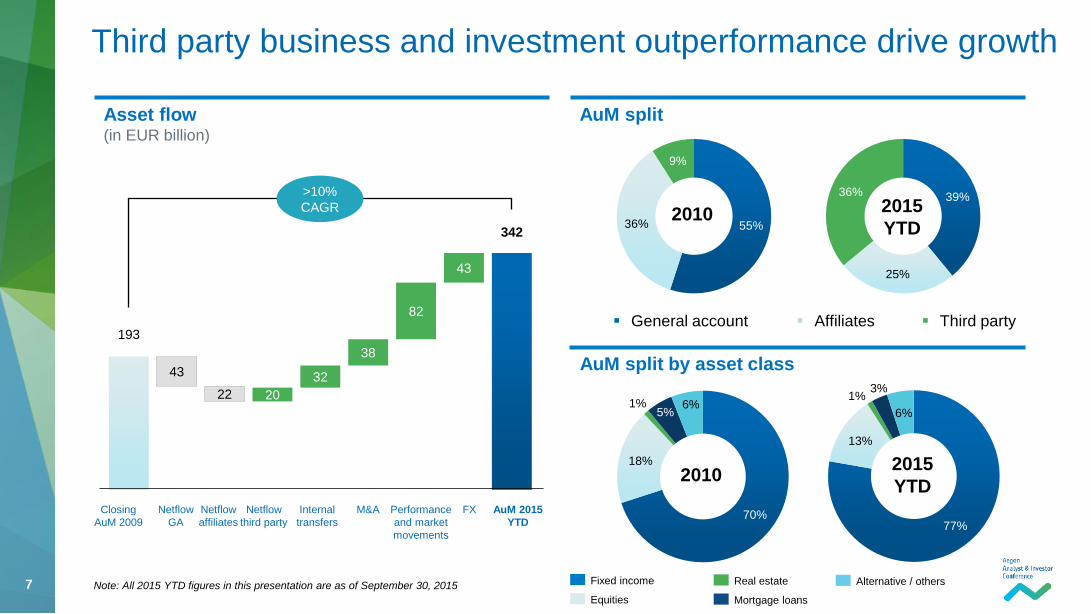
70%
18%
1% 5%
6%
77%
13%
1% 3%
6%
2015
YTD
AuM split by asset class
193
43
22 20
32
38
82
43
342
Third party business and investment outperformance drive growth
AuM split
55% 36%
9%
2010 39%
25%
36%
2015
YTD
General account Affiliates Third party
>10%
CAGR
Closing
AuM 2009
Netflow
GA
Netflow
affiliates
Netflow
third party
Internal
transfers
M&A Performance
and market
movements
FX AuM 2015
YTD
Asset flow (in EUR billion)
2010
Fixed income
Equities Mortgage loans
Real estate Alternative / others Note: All 2015 YTD figures in this presentation are as of September 30, 2015
8
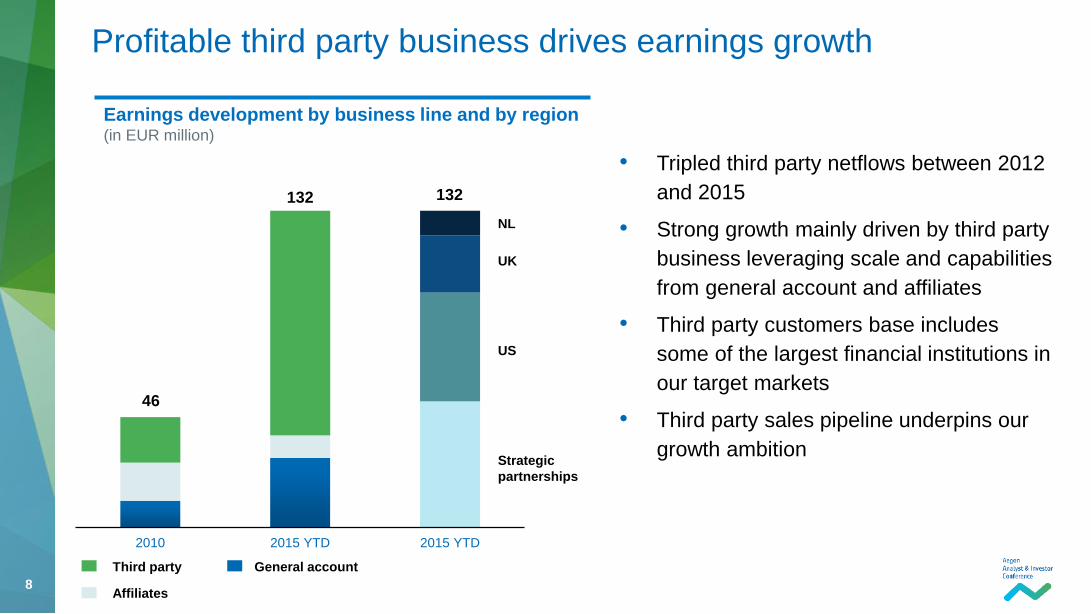
2010 2015 YTD 2015 YTD
Profitable third party business drives earnings growth
Earnings development by business line and by region (in EUR million)
Third party
Affiliates
General account
132
46
132
US
NL
UK
Strategic
partnerships
• Tripled third party netflows between 2012
and 2015
• Strong growth mainly driven by third party
business leveraging scale and capabilities
from general account and affiliates
• Third party customers base includes
some of the largest financial institutions in
our target markets
• Third party sales pipeline underpins our
growth ambition
9
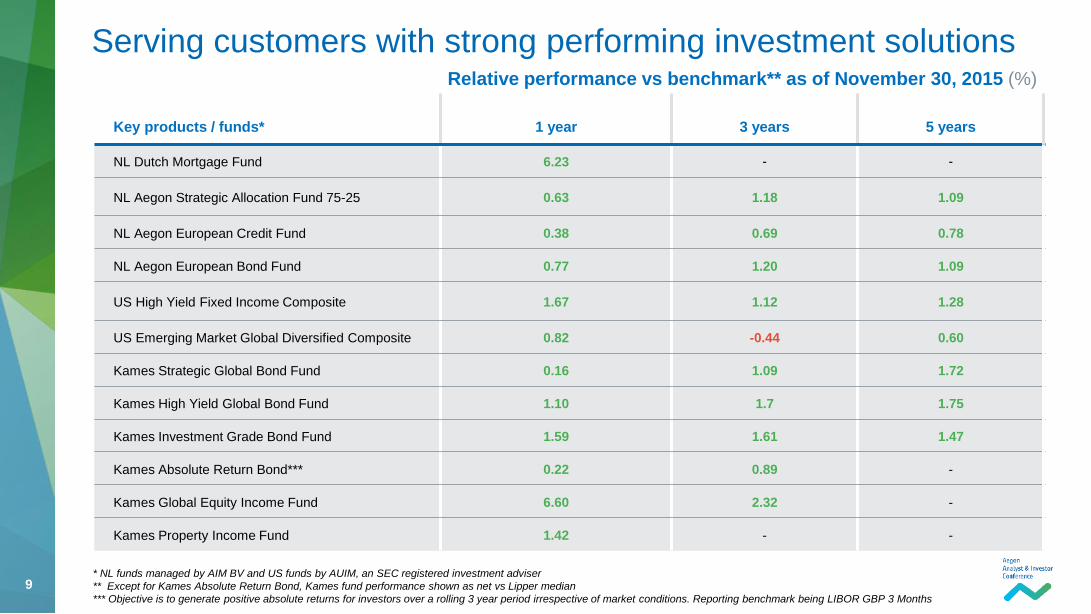
Serving customers with strong performing investment solutions
Key products / funds*
Relative performance vs benchmark** as of November 30, 2015 (%)
1 year 3 years 5 years
NL Dutch Mortgage Fund 6.23 - -
NL Aegon Strategic Allocation Fund 75-25 0.63 1.18 1.09
NL Aegon European Credit Fund 0.38 0.69 0.78
NL Aegon European Bond Fund 0.77 1.20 1.09
US High Yield Fixed Income Composite 1.67 1.12 1.28
US Emerging Market Global Diversified Composite 0.82 -0.44 0.60
Kames Strategic Global Bond Fund 0.16 1.09 1.72
Kames High Yield Global Bond Fund 1.10 1.7 1.75
Kames Investment Grade Bond Fund 1.59 1.61 1.47
Kames Absolute Return Bond*** 0.22 0.89 -
Kames Global Equity Income Fund 6.60 2.32 -
Kames Property Income Fund 1.42 - -
* NL funds managed by AIM BV and US funds by AUIM, an SEC registered investment adviser
** Except for Kames Absolute Return Bond, Kames fund performance shown as net vs Lipper median
*** Objective is to generate positive absolute returns for investors over a rolling 3 year period irrespective of market conditions. Reporting benchmark being LIBOR GBP 3 Months
10
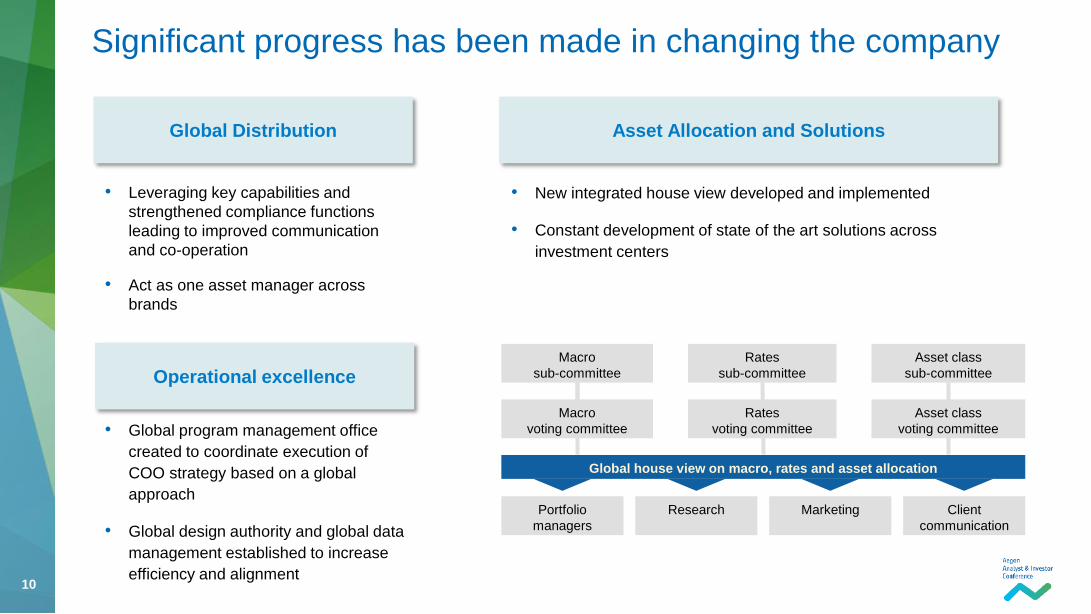
Significant progress has been made in changing the company
Global Distribution
Operational excellence
• Global program management office
created to coordinate execution of
COO strategy based on a global
approach
• Global design authority and global data
management established to increase
efficiency and alignment
• Leveraging key capabilities and
strengthened compliance functions
leading to improved communication
and co-operation
• Act as one asset manager across
brands
Asset Allocation and Solutions
• New integrated house view developed and implemented
• Constant development of state of the art solutions across
investment centers
Macro
sub-committee
Rates
sub-committee
Asset class
sub-committee
Macro
voting committee
Rates
voting committee
Asset class
voting committee
Global house view on macro, rates and asset allocation
Portfolio
managers
Research
Marketing
Client
communication
11
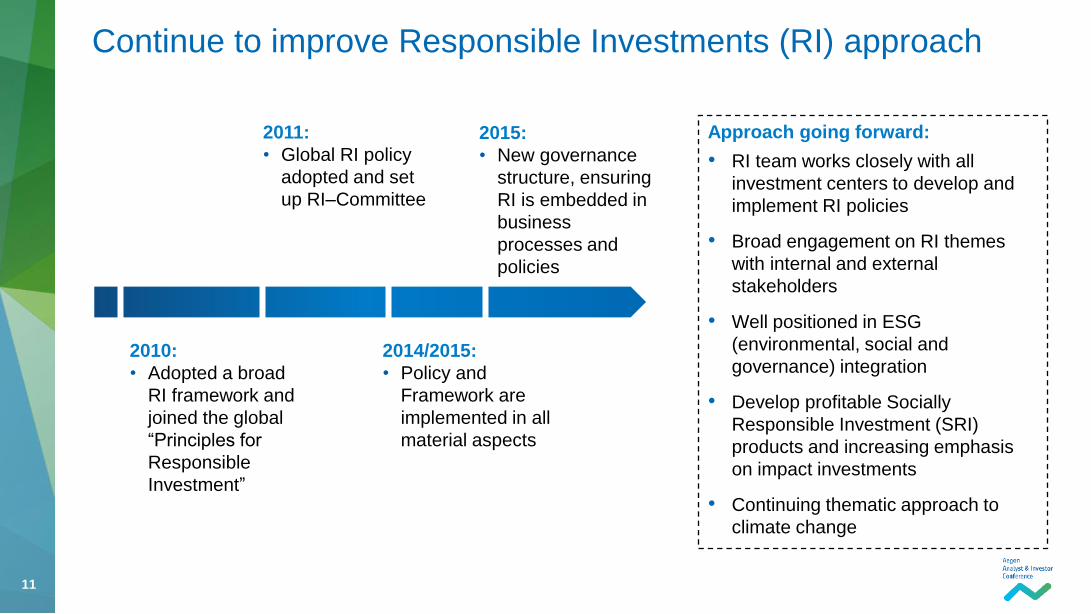
Continue to improve Responsible Investments (RI) approach
2010:
• Adopted a broad
RI framework and
joined the global
“Principles for
Responsible
Investment”
2011:
• Global RI policy
adopted and set
up RI–Committee
2014/2015:
• Policy and
Framework are
implemented in all
material aspects
2015:
• New governance
structure, ensuring
RI is embedded in
business
processes and
policies
Approach going forward:
• RI team works closely with all
investment centers to develop and
implement RI policies
• Broad engagement on RI themes
with internal and external
stakeholders
• Well positioned in ESG
(environmental, social and
governance) integration
• Develop profitable Socially
Responsible Investment (SRI)
products and increasing emphasis
on impact investments
• Continuing thematic approach to
climate change

12
Priorities going forward
13
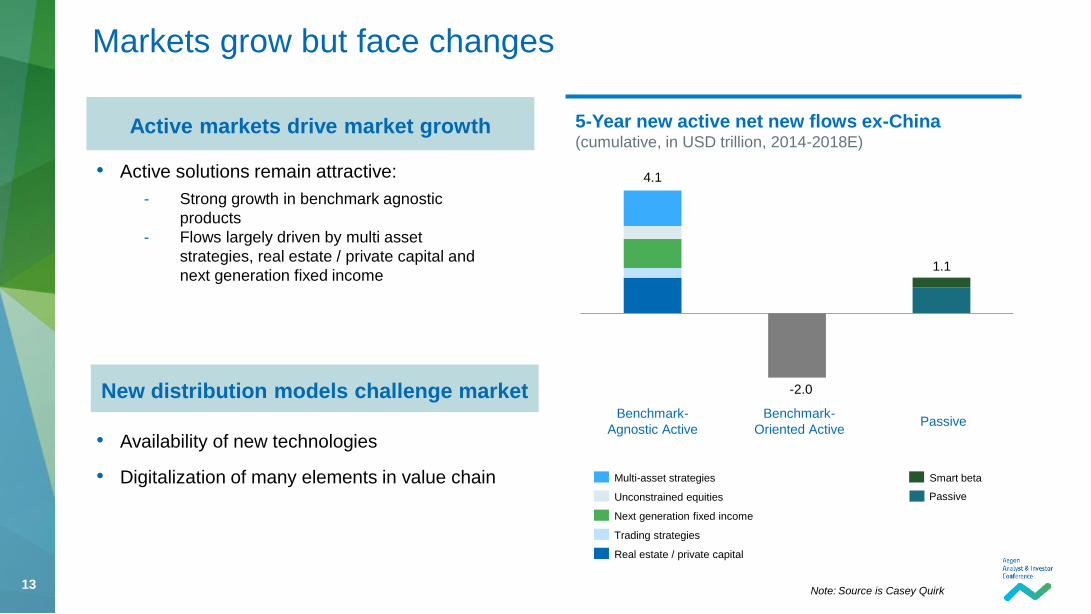
Markets grow but face changes
Active markets drive market growth
New distribution models challenge market
• Availability of new technologies
• Digitalization of many elements in value chain
5-Year new active net new flows ex-China (cumulative, in USD trillion, 2014-2018E)
Passive Benchmark-
Agnostic Active
Benchmark-
Oriented Active
1.1
4.1
Multi-asset strategies
Unconstrained equities
Trading strategies
Next generation fixed income
Smart beta
Real estate / private capital
• Active solutions remain attractive:
- Strong growth in benchmark agnostic
products
- Flows largely driven by multi asset
strategies, real estate / private capital and
next generation fixed income
-2.0
Passive
Note: Source is Casey Quirk
14
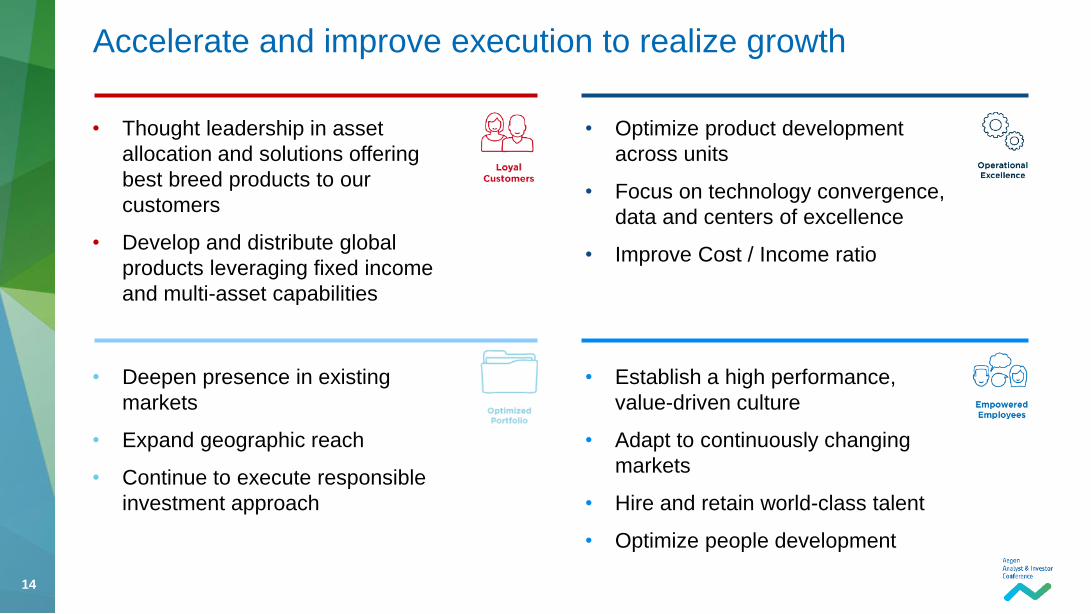
Accelerate and improve execution to realize growth
• Thought leadership in asset
allocation and solutions offering
best breed products to our
customers
• Develop and distribute global
products leveraging fixed income
and multi-asset capabilities
• Optimize product development
across units
• Focus on technology convergence,
data and centers of excellence
• Improve Cost / Income ratio
• Deepen presence in existing
markets
• Expand geographic reach
• Continue to execute responsible
investment approach
• Establish a high performance,
value-driven culture
• Adapt to continuously changing
markets
• Hire and retain world-class talent
• Optimize people development
15
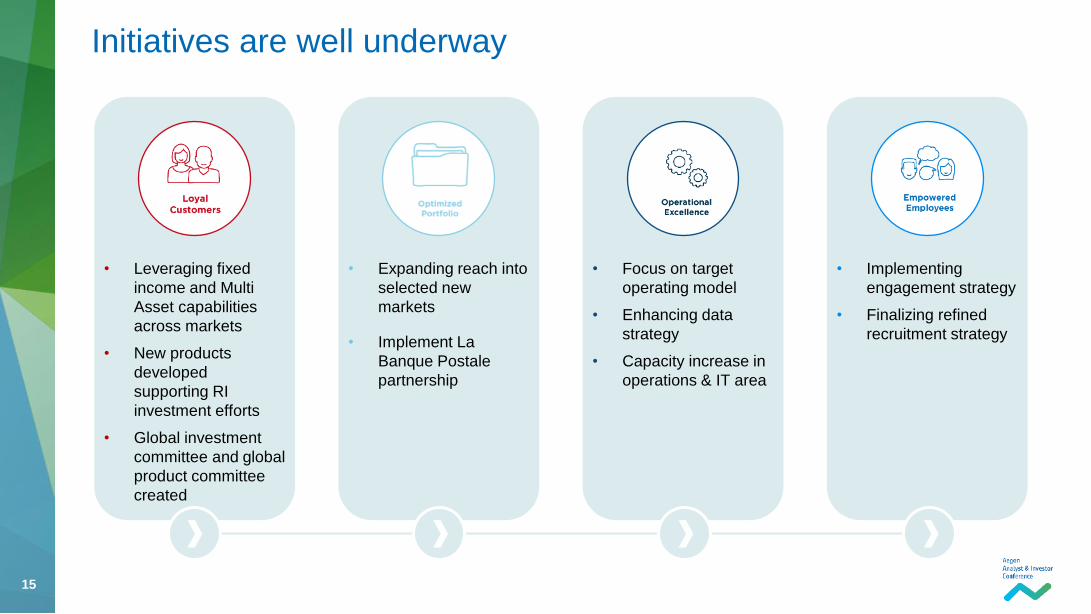
Initiatives are well underway
• Leveraging fixed
income and Multi
Asset capabilities
across markets
• New products
developed
supporting RI
investment efforts
• Global investment
committee and global
product committee
created
• Focus on target
operating model
• Enhancing data
strategy
• Capacity increase in
operations & IT area
• Implementing
engagement strategy
• Finalizing refined
recruitment strategy
• Expanding reach into
selected new
markets
• Implement La
Banque Postale
partnership
16
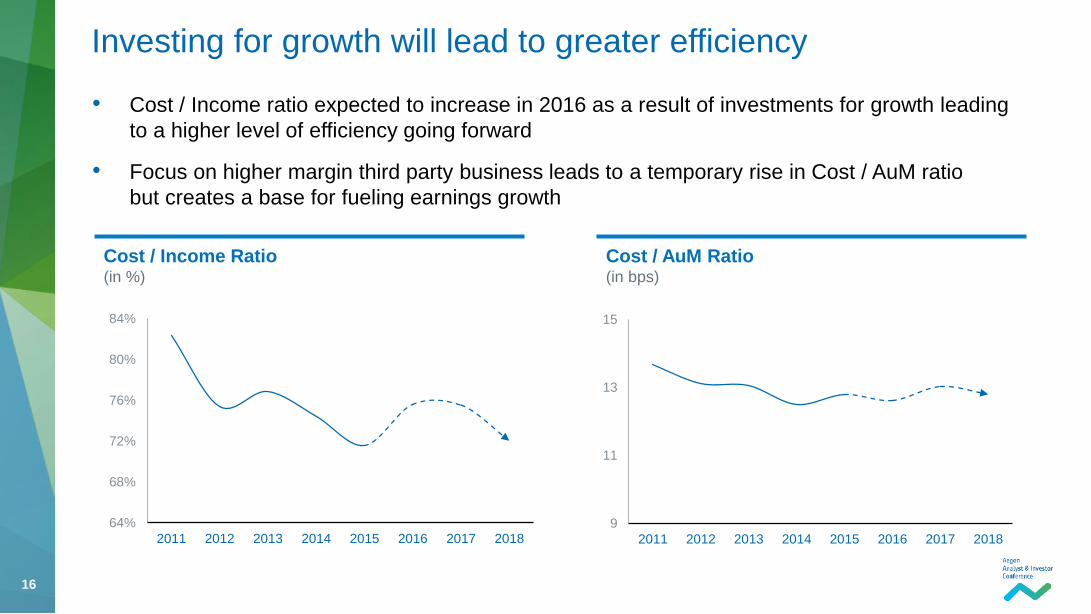
• Cost / Income ratio expected to increase in 2016 as a result of investments for growth leading
to a higher level of efficiency going forward
• Focus on higher margin third party business leads to a temporary rise in Cost / AuM ratio but creates a base for fueling earnings growth
Investing for growth will lead to greater efficiency
Cost / Income Ratio (in %)
Cost / AuM Ratio (in bps)
64%
68%
72%
76%
80%
84%
2011 2012 2013 2014 2015 2016 2017 20189
11
13
15
2011 2012 2013 2014 2015 2016 2017 2018
17
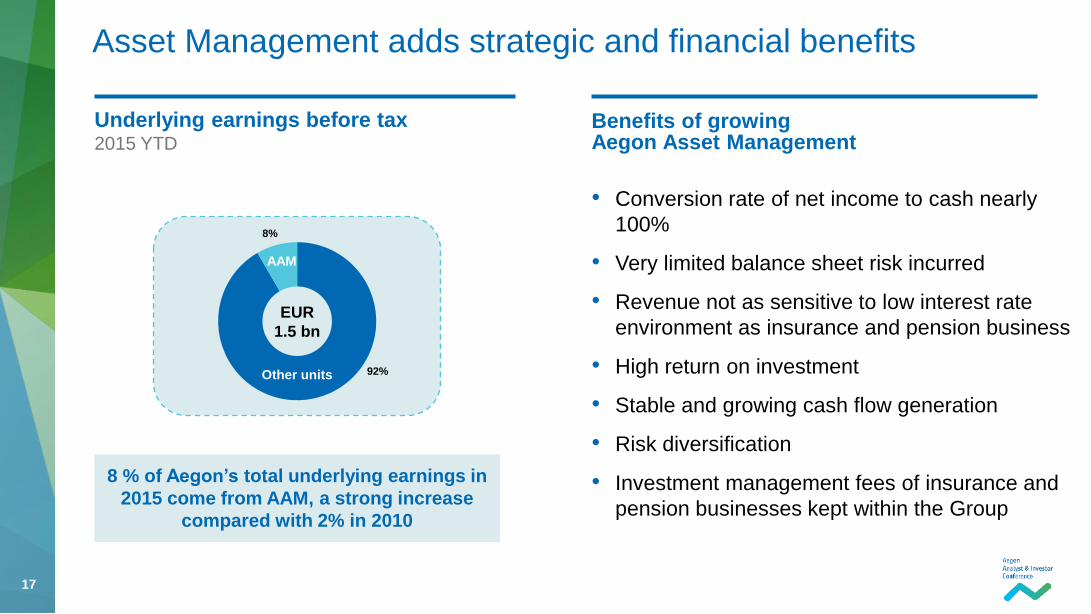
Asset Management adds strategic and financial benefits
Benefits of growing Aegon Asset Management
• Conversion rate of net income to cash nearly
100%
• Very limited balance sheet risk incurred
• Revenue not as sensitive to low interest rate
environment as insurance and pension business
• High return on investment
• Stable and growing cash flow generation
• Risk diversification
• Investment management fees of insurance and
pension businesses kept within the Group
8 % of Aegon’s total underlying earnings in
2015 come from AAM, a strong increase
compared with 2% in 2010
Underlying earnings before tax 2015 YTD
92%
8%
EUR
1.5 bn
Other units
AAM

18
2018 targets
19
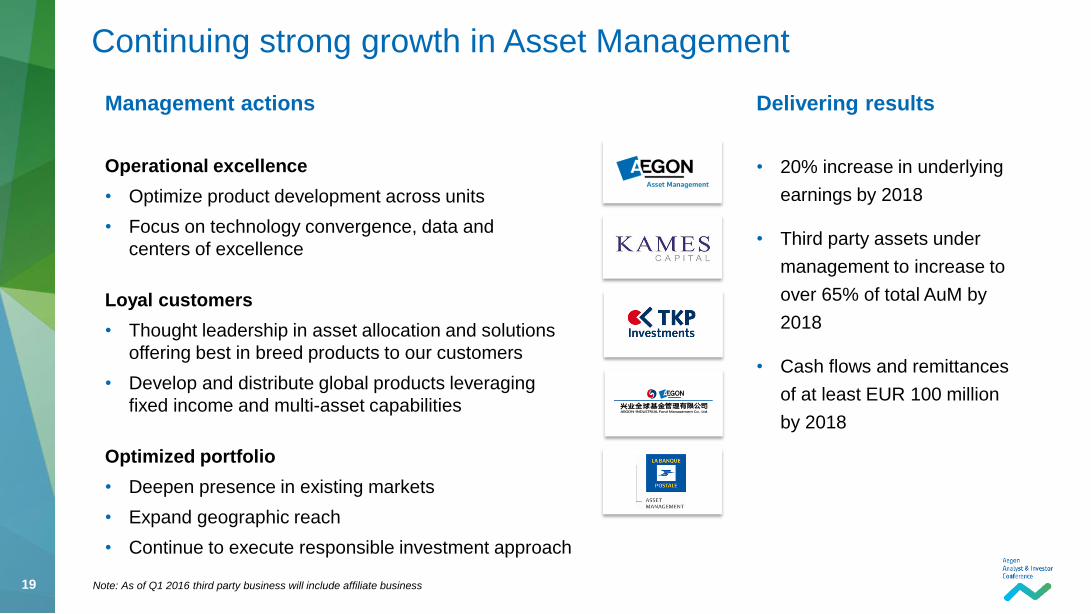
Continuing strong growth in Asset Management
• 20% increase in underlying
earnings by 2018
• Third party assets under
management to increase to
over 65% of total AuM by
2018
• Cash flows and remittances
of at least EUR 100 million
by 2018
Operational excellence
• Optimize product development across units
• Focus on technology convergence, data and
centers of excellence
Loyal customers
• Thought leadership in asset allocation and solutions
offering best in breed products to our customers
• Develop and distribute global products leveraging
fixed income and multi-asset capabilities
Optimized portfolio
• Deepen presence in existing markets
• Expand geographic reach
• Continue to execute responsible investment approach
Delivering results Management actions
Note: As of Q1 2016 third party business will include affiliate business
For questions please contact Investor Relations
+31 70 344 8305
P.O.Box 85
2501 CB The Hague
The Netherlands
21
Cautionary note regarding non-IFRS measures
This document includes the following non-IFRS financial measures: underlying earnings before tax, income tax and income before tax. These non-IFRS measures are calculated by consolidating on a proportionate basis Aegon’s joint ventures and associated
companies. The reconciliation of these measures to the most comparable IFRS measure is provided in note 3 ‘Segment information’ of Aegon’s Condensed Consolidated Interim Financial Statements. Aegon believes that these non-IFRS measures, together
with the IFRS information, provide meaningful information about the underlying operating results of Aegon’s business including insight into the financial measures that senior management uses in managing the business.
Currency exchange rates
This document contains certain information about Aegon’s results , financial condition and revenue generating investments presented in USD for the Americas and GBP for the United Kingdom, because those businesses operate and are managed primarily in
those currencies. None of this information is a substitute for or superior to financial information about Aegon presented in EUR, which is the currency of Aegon’s primary financial statements.
Forward-looking statements
The statements contained in this document that are not historical facts are forward-looking statements as defined in the US Private Securities Litigation Reform Act of 1995. The following are words that identify such forward-looking statements: aim, believe,
estimate, target, intend, may, expect, anticipate, predict, project, counting on, plan, continue, want, forecast, goal, should, would, is confident, will, and similar expressions as they relate to Aegon. These statements are not guarantees of future performance and
involve risks, uncertainties and assumptions that are difficult to predict. Aegon undertakes no obligation to publicly update or revise any forward-looking statements. Readers are cautioned not to place undue reliance on these forward-looking statements, which
merely reflect company expectations at the time of writing. Actual results may differ materially from expectations conveyed in forward-looking statements due to changes caused by various risks and uncertainties. Such risks and uncertainties include but are not
limited to the following:
• Changes in general economic conditions, particularly in the United States, the Netherlands and the United Kingdom;
• Changes in the performance of financial markets, including emerging markets, such as with regard to:
- The frequency and severity of defaults by issuers in Aegon’s fixed income investment portfolios;
- The effects of corporate bankruptcies and/or accounting restatements on the financial markets and the resulting decline in the value of equity and debt securities Aegon holds; and
- The effects of declining creditworthiness of certain private sector securities and the resulting decline in the value of sovereign exposure that Aegon holds;
• Changes in the performance of Aegon’s investment portfolio and decline in ratings of Aegon’s counterparties;
• Consequences of a potential (partial) break-up of the euro or the potential exit of the United Kingdom from the European Union;
• The frequency and severity of insured loss events;
• Changes affecting longevity, mortality, morbidity, persistence and other factors that may impact the profitability of Aegon’s insurance products;
• Reinsurers to whom Aegon has ceded significant underwriting risks may fail to meet their obligations;
• Changes affecting interest rate levels and continuing low or rapidly changing interest rate levels;
• Changes affecting currency exchange rates, in particular the EUR/USD and EUR/GBP exchange rates;
• Changes in the availability of, and costs associated with, liquidity sources such as bank and capital markets funding, as wel l as conditions in the credit markets in general such as changes in borrower and counterparty creditworthiness;
• Increasing levels of competition in the United States, the Netherlands, the United Kingdom and emerging markets;
• Changes in laws and regulations, particularly those affecting Aegon’s operations’ ability to hire and retain key personnel, the products Aegon sells, and the attractiveness of certain products to its consumers;
• Regulatory changes relating to the pensions, investment, and insurance industries in the jurisdictions in which Aegon operates;
• Standard setting initiatives of supranational standard setting bodies such as the Financial Stability Board and the International Association of Insurance Supervisors or changes to such standards that may have an impact on regional (such as EU), national
or US federal or state level financial regulation or the application thereof to Aegon, including the designation of Aegon by the Financial Stability Board as a Global Systemically Important Insurer (G-SII).
• Changes in customer behavior and public opinion in general related to, among other things, the type of products also Aegon sells, including legal, regulatory or commercial necessity to meet changing customer expectations;
• Acts of God, acts of terrorism, acts of war and pandemics;
• Changes in the policies of central banks and/or governments;
• Lowering of one or more of Aegon’s debt ratings issued by recognized rating organizations and the adverse impact such action may have on Aegon’s ability to raise capital and on its liquidity and financial condition;
• Lowering of one or more of insurer financial strength ratings of Aegon’s insurance subsidiaries and the adverse impact such action may have on the premium writings, policy retention, profitability and liquidity of its insurance subsidiaries;
• The effect of the European Union’s Solvency II requirements and other regulations in other jurisdictions affecting the capita l Aegon is required to maintain;
• Litigation or regulatory action that could require Aegon to pay significant damages or change the way Aegon does business;
• As Aegon’s operations support complex transactions and are highly dependent on the proper functioning of information technology, a computer system failure or security breach may disrupt Aegon’s business, damage its reputation and adversely affect its
results of operations, financial condition and cash flows;
• Customer responsiveness to both new products and distribution channels;
• Competitive, legal, regulatory, or tax changes that affect profitability, the distribution cost of or demand for Aegon’s products;
• Changes in accounting regulations and policies or a change by Aegon in applying such regulations and policies, voluntarily or otherwise, which may affect Aegon’s reported results and shareholders’ equity;
• The impact of acquisitions and divestitures, restructurings, product withdrawals and other unusual items, including Aegon’s ability to integrate acquisitions and to obtain the anticipated results and synergies from acquisitions;
• Catastrophic events, either manmade or by nature, could result in material losses and significantly interrupt Aegon’s business; and
• Aegon’s failure to achieve anticipated levels of earnings or operational efficiencies as well as other cost saving and excess capital and leverage ratio management initiatives.
Further details of potential risks and uncertainties affecting Aegon are described in its filings with the Netherlands Authority for the Financial Markets and the US Securities and Exchange Commission, including the Annual Report. These forward-looking
statements speak only as of the date of this document. Except as required by any applicable law or regulation, Aegon expressly disclaims any obligation or undertaking to release publicly any updates or revisions to any forward-looking statements contained
herein to reflect any change in Aegon’s expectations with regard thereto or any change in events, conditions or circumstances on which any such statement is based.
This document is strictly for information and illustrative purposes only and should not be considered to be an offer, or solicitation of an offer, to buy or sell any securities or funds or to enter into any investment agreements.
Disclaimer