Embed Size (px)
Citation preview
Aegis Logistics Limited
Investor PresentationNovember 2016
“Positioned for growth”
Safe Harbour
This presentation and the accompanying slides (the “Presentation”), which have been prepared by Aegis Logistics Limited (the“Company”), have been prepared solely for information purposes and do not constitute any offer, recommendation or invitationto purchase or subscribe for any securities, and shall not form the basis or be relied on in connection with any contract or bindingcommitment whatsoever. No offering of securities of the Company will be made except by means of a statutory offeringdocument containing detailed information about the Company.
This Presentation has been prepared by the Company based on information and data which the Company considers reliable, butthe Company makes no representation or warranty, express or implied, whatsoever, and no reliance shall be placed on, the truth,accuracy, completeness, fairness and reasonableness of the contents of this Presentation. This Presentation may not be allinclusive and may not contain all of the information that you may consider material. Any liability in respect of the contents of, orany omission from, this Presentation is expressly excluded.
This presentation contains certain forward looking statements concerning the Company’s future business prospects and businessprofitability, which are subject to a number of risks and uncertainties and the actual results could materially differ from those insuch forward looking statements. The risks and uncertainties relating to these statements include, but are not limited to, risks anduncertainties regarding fluctuations in earnings, our ability to manage growth, competition (both domestic and international),economic growth in India and abroad, ability to attract and retain highly skilled professionals, time and cost over runs oncontracts, our ability to manage our international operations, government policies and actions regulations, interest and otherfiscal costs generally prevailing in the economy. The Company does not undertake to make any announcement in case any ofthese forward looking statements become materially incorrect in future or update any forward looking statements made fromtime to time by or on behalf of the Company.
2
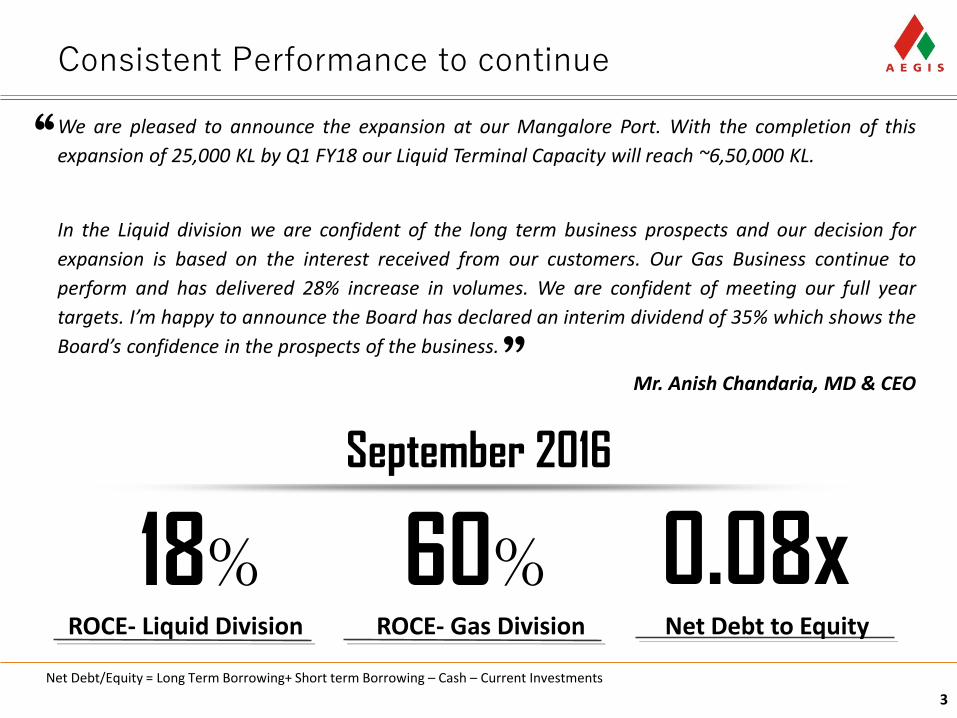
Consistent Performance to continue
3
18%ROCE- Liquid Division
0.08xNet Debt to Equity
60%ROCE- Gas Division
September 2016
Net Debt/Equity = Long Term Borrowing+ Short term Borrowing – Cash – Current Investments
We are pleased to announce the expansion at our Mangalore Port. With the completion of this
expansion of 25,000 KL by Q1 FY18 our Liquid Terminal Capacity will reach ~6,50,000 KL.
In the Liquid division we are confident of the long term business prospects and our decision for
expansion is based on the interest received from our customers. Our Gas Business continue to
perform and has delivered 28% increase in volumes. We are confident of meeting our full year
targets. I’m happy to announce the Board has declared an interim dividend of 35% which shows the
Board’s confidence in the prospects of the business.
Mr. Anish Chandaria, MD & CEO
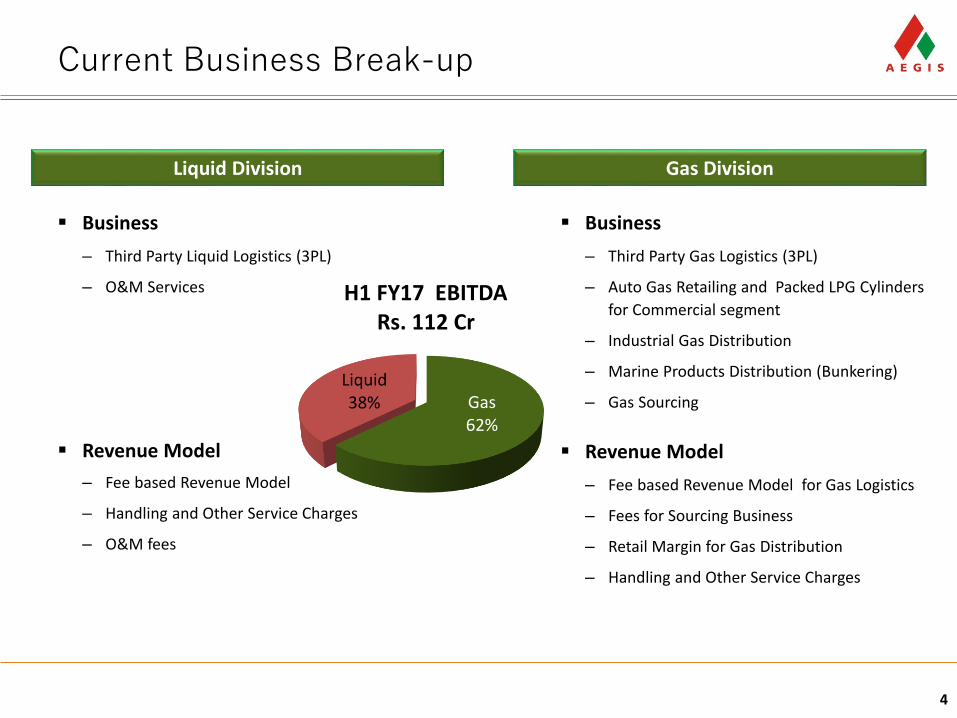
Current Business Break-up
4
Business
– Third Party Liquid Logistics (3PL)
– O&M Services
Revenue Model
– Fee based Revenue Model
– Handling and Other Service Charges
– O&M fees
Business
– Third Party Gas Logistics (3PL)
– Auto Gas Retailing and Packed LPG Cylinders
for Commercial segment
– Industrial Gas Distribution
– Marine Products Distribution (Bunkering)
– Gas Sourcing
Revenue Model
– Fee based Revenue Model for Gas Logistics
– Fees for Sourcing Business
– Retail Margin for Gas Distribution
– Handling and Other Service Charges
Liquid Division Gas Division
Gas62%
Liquid38%
H1 FY17 EBITDARs. 112 Cr
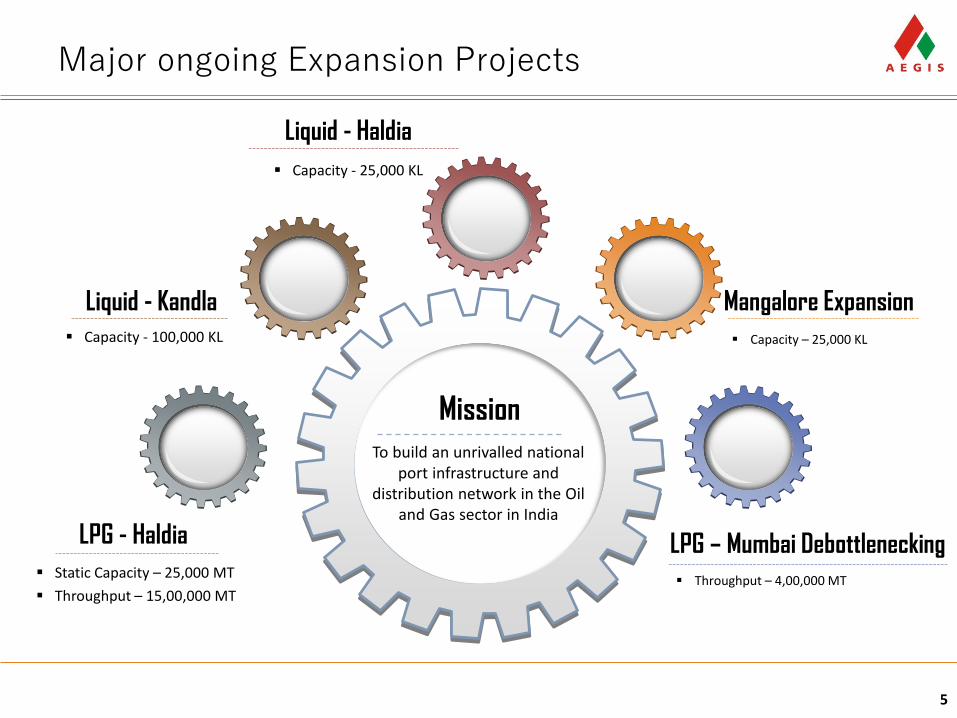
Major ongoing Expansion Projects
5
Mangalore Expansion
Capacity – 25,000 KL
LPG – Mumbai Debottlenecking
Throughput – 4,00,000 MT
LPG - Haldia
Static Capacity – 25,000 MT
Throughput – 15,00,000 MT
Mission
To build an unrivalled national port infrastructure and
distribution network in the Oil and Gas sector in India
Liquid - Kandla
Capacity - 100,000 KL
Liquid - Haldia
Capacity - 25,000 KL
6
Gas Logistics
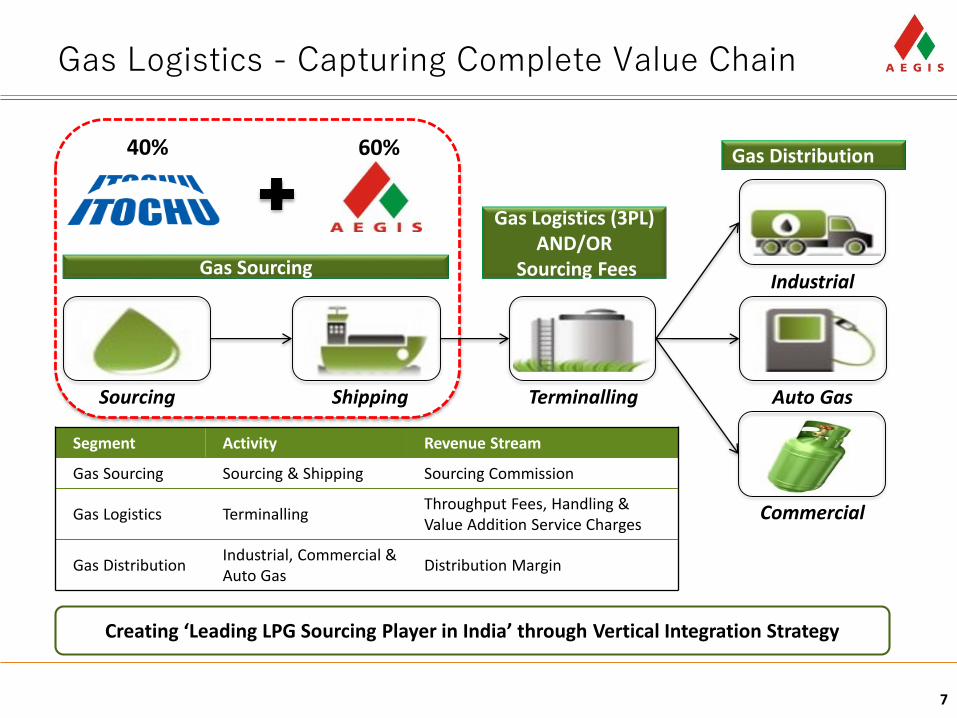
Gas Logistics - Capturing Complete Value Chain
7
Commercial
Sourcing Shipping Terminalling Auto Gas
IndustrialGas Sourcing
Gas Logistics (3PL) AND/OR
Sourcing Fees
Gas Distribution60%40%
Creating ‘Leading LPG Sourcing Player in India’ through Vertical Integration Strategy
Segment Activity Revenue Stream
Gas Sourcing Sourcing & Shipping Sourcing Commission
Gas Logistics TerminallingThroughput Fees, Handling & Value Addition Service Charges
Gas DistributionIndustrial, Commercial & Auto Gas
Distribution Margin
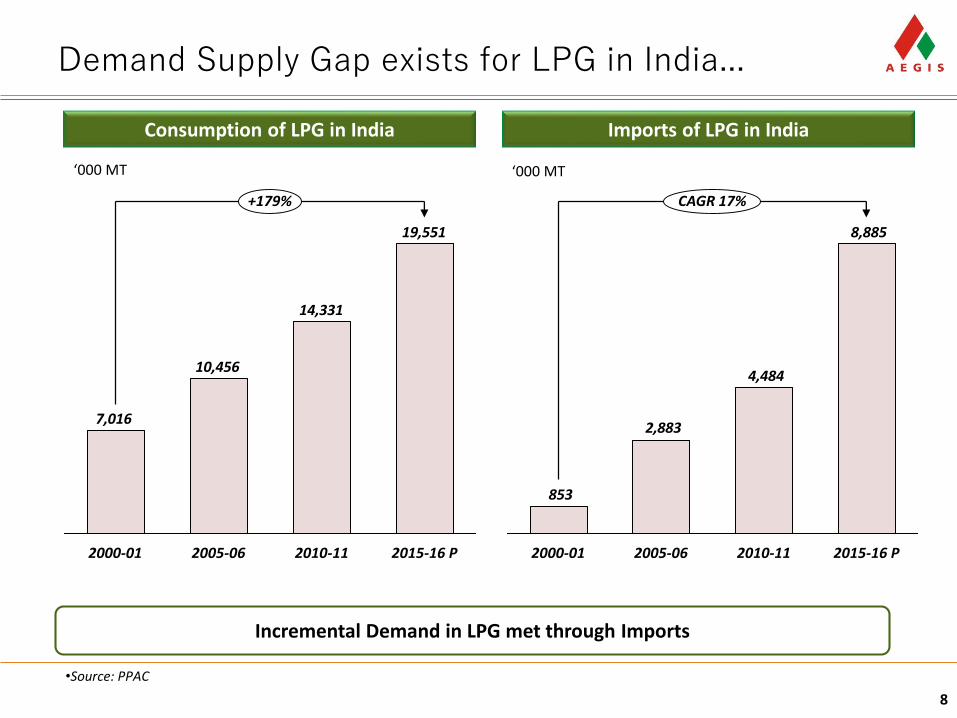
Demand Supply Gap exists for LPG in India...
8
Imports of LPG in India
•Source: PPAC
Consumption of LPG in India
Incremental Demand in LPG met through Imports
‘000 MT
19,551
14,331
10,456
7,016
+179%
2000-01 2010-11 2015-16 P2005-06
8,885
4,484
2,883
853
2005-062000-01 2015-16 P2010-11
CAGR 17%
‘000 MT
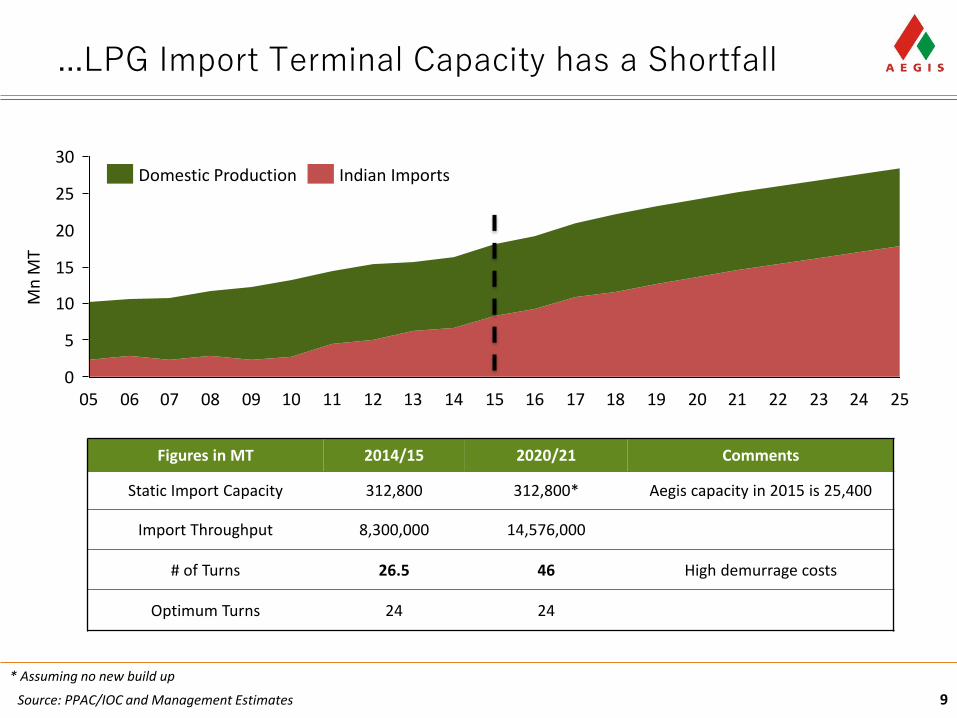
...LPG Import Terminal Capacity has a Shortfall
9
20
0
30
10
15
25
5
13 17 19 2422 2316151006 110705 09 14 18 21 2508 2012
Domestic Production Indian Imports
Figures in MT 2014/15 2020/21 Comments
Static Import Capacity 312,800 312,800* Aegis capacity in 2015 is 25,400
Import Throughput 8,300,000 14,576,000
# of Turns 26.5 46 High demurrage costs
Optimum Turns 24 24
Source: PPAC/IOC and Management Estimates
* Assuming no new build up
Mn
MT
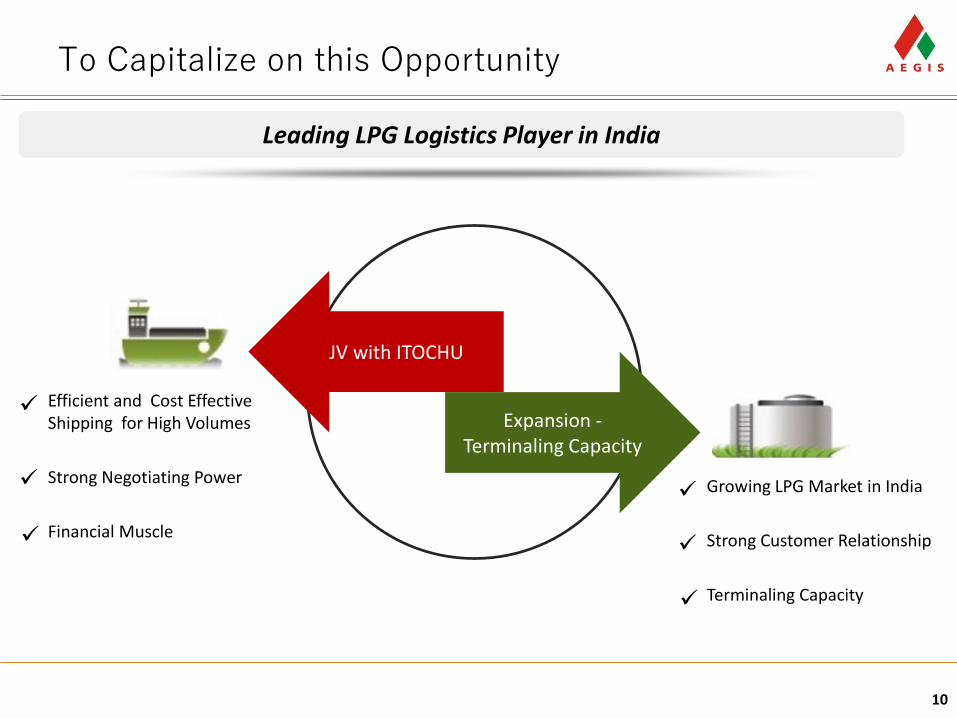
To Capitalize on this Opportunity
10
Leading LPG Logistics Player in India
Expansion -Terminaling Capacity
JV with ITOCHU
Efficient and Cost Effective Shipping for High Volumes
Strong Negotiating Power
Financial Muscle
Growing LPG Market in India
Strong Customer Relationship
Terminaling Capacity
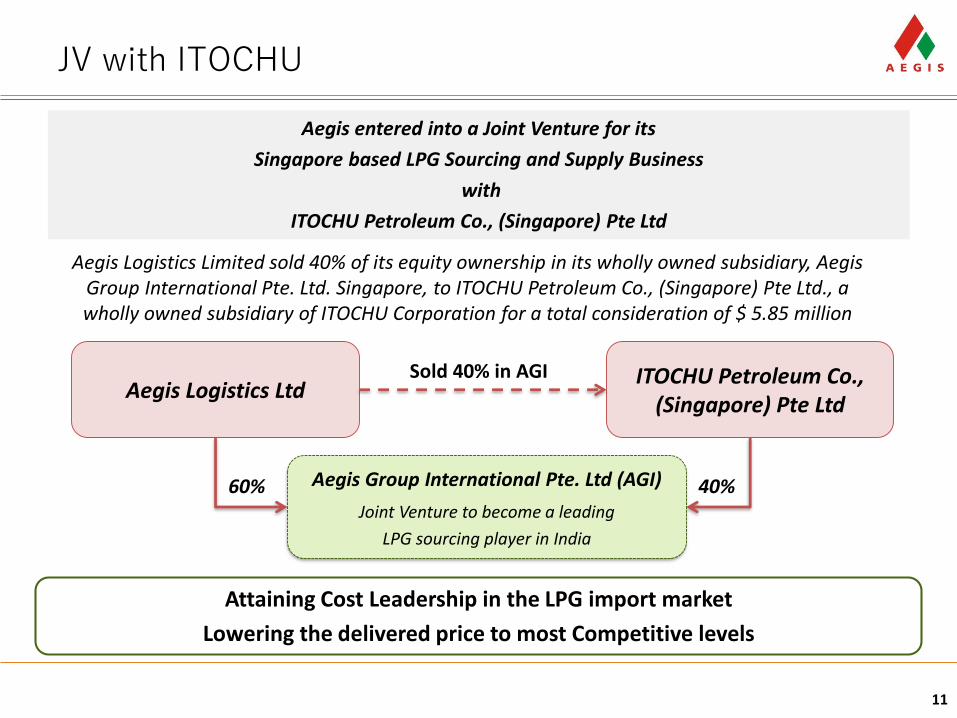
JV with ITOCHU
11
Aegis Logistics LtdITOCHU Petroleum Co.,
(Singapore) Pte Ltd
Aegis Group International Pte. Ltd (AGI)
Joint Venture to become a leading
LPG sourcing player in India
Aegis Logistics Limited sold 40% of its equity ownership in its wholly owned subsidiary, Aegis Group International Pte. Ltd. Singapore, to ITOCHU Petroleum Co., (Singapore) Pte Ltd., a wholly owned subsidiary of ITOCHU Corporation for a total consideration of $ 5.85 million
60% 40%
Attaining Cost Leadership in the LPG import market
Lowering the delivered price to most Competitive levels
Sold 40% in AGI
Aegis entered into a Joint Venture for its
Singapore based LPG Sourcing and Supply Business
with
ITOCHU Petroleum Co., (Singapore) Pte Ltd
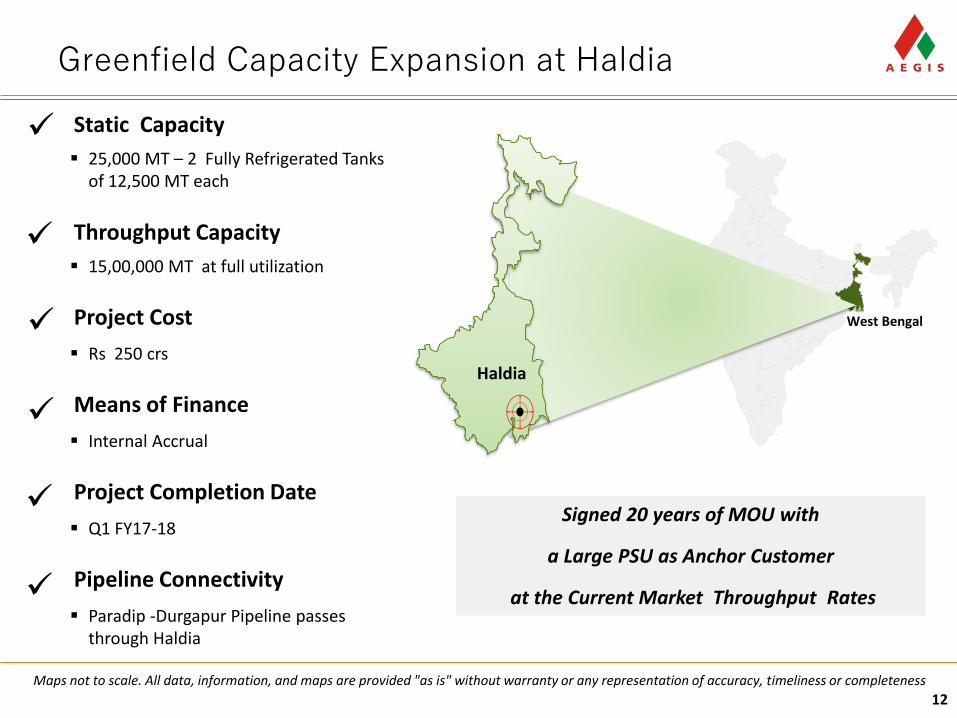
Greenfield Capacity Expansion at Haldia
12
25,000 MT – 2 Fully Refrigerated Tanks of 12,500 MT each
Static Capacity
Rs 250 crs
Project Cost
Internal Accrual
Means of Finance
Haldia
Q1 FY17-18
Project Completion Date
15,00,000 MT at full utilization
Throughput Capacity
Signed 20 years of MOU with
a Large PSU as Anchor Customer
at the Current Market Throughput Rates Paradip -Durgapur Pipeline passes
through Haldia
Pipeline Connectivity
West Bengal
Maps not to scale. All data, information, and maps are provided "as is" without warranty or any representation of accuracy, timeliness or completeness
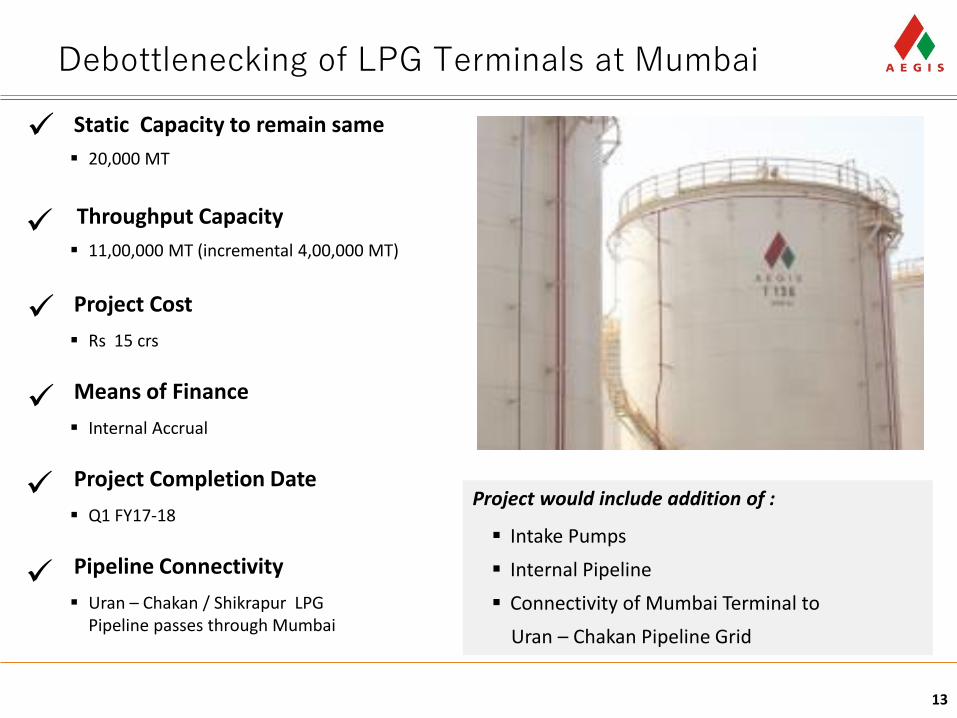
Debottlenecking of LPG Terminals at Mumbai
13
20,000 MT
Static Capacity to remain same
Rs 15 crs
Project Cost
Internal Accrual
Means of Finance
Q1 FY17-18
Project Completion Date
11,00,000 MT (incremental 4,00,000 MT)
Throughput Capacity
Uran – Chakan / Shikrapur LPG Pipeline passes through Mumbai
Pipeline Connectivity
Project would include addition of :
Intake Pumps
Internal Pipeline
Connectivity of Mumbai Terminal to
Uran – Chakan Pipeline Grid
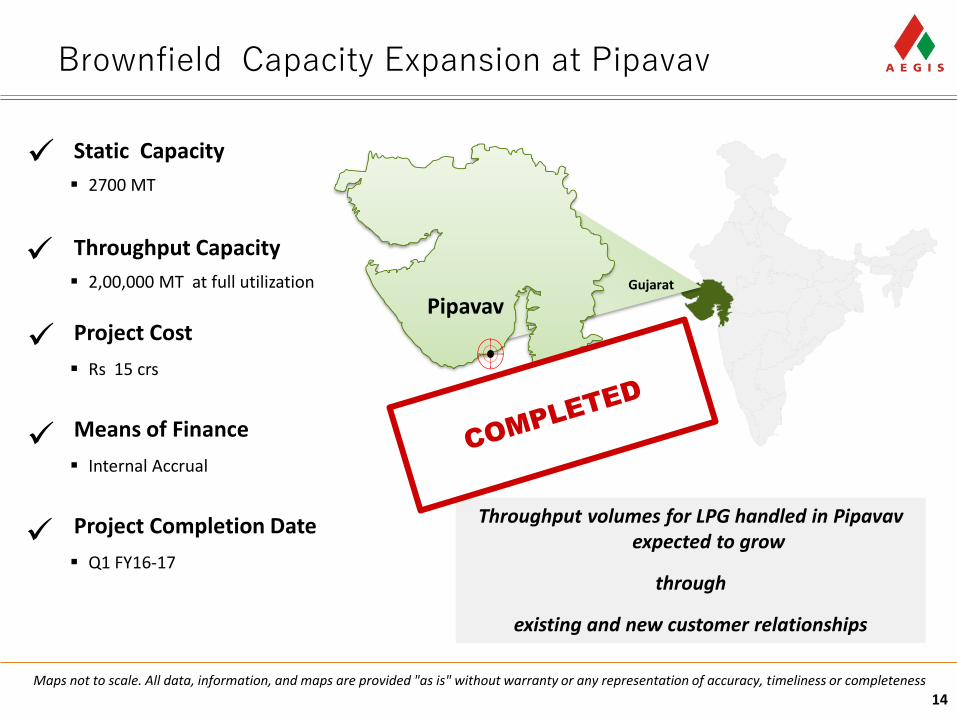
Brownfield Capacity Expansion at Pipavav
14
Pipavav
2700 MT
Static Capacity
Rs 15 crs
Project Cost
Internal Accrual
Means of Finance
Q1 FY16-17
Project Completion Date
2,00,000 MT at full utilization
Throughput Capacity
Throughput volumes for LPG handled in Pipavavexpected to grow
through
existing and new customer relationships
Gujarat
Maps not to scale. All data, information, and maps are provided "as is" without warranty or any representation of accuracy, timeliness or completeness
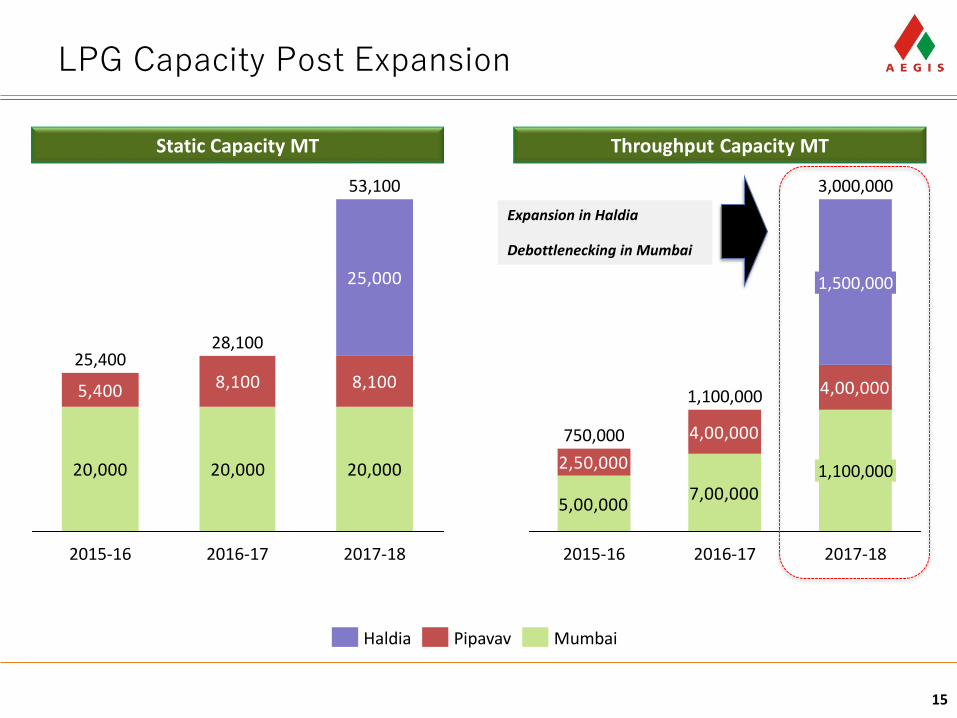
LPG Capacity Post Expansion
15
Static Capacity MT Throughput Capacity MT
20,000 20,000 20,000
5,400 8,100 8,100
25,000
2016-17 2017-18
28,10025,400
53,100
2015-16
MumbaiHaldia Pipavav
5,00,0007,00,000
2,50,000
4,00,000
4,00,000
2015-16
1,100,000
2016-17 2017-18
750,000
1,100,000
3,000,000
1,500,000
Expansion in Haldia
Debottlenecking in Mumbai
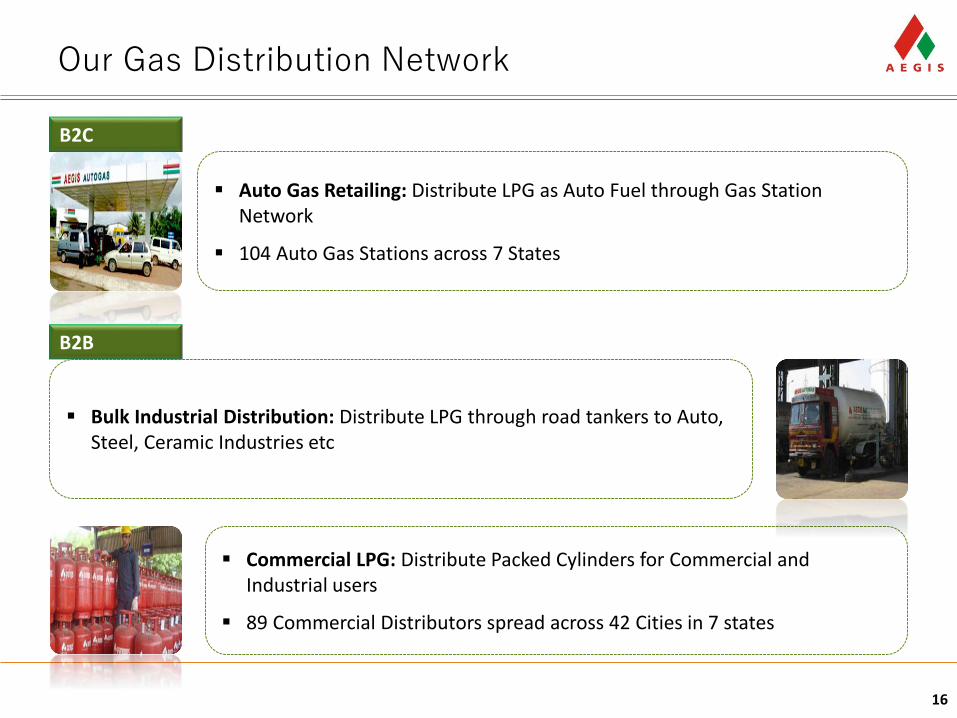
Our Gas Distribution Network
16
B2C
Auto Gas Retailing: Distribute LPG as Auto Fuel through Gas Station Network
104 Auto Gas Stations across 7 States
Bulk Industrial Distribution: Distribute LPG through road tankers to Auto, Steel, Ceramic Industries etc
Commercial LPG: Distribute Packed Cylinders for Commercial and Industrial users
89 Commercial Distributors spread across 42 Cities in 7 states
B2B
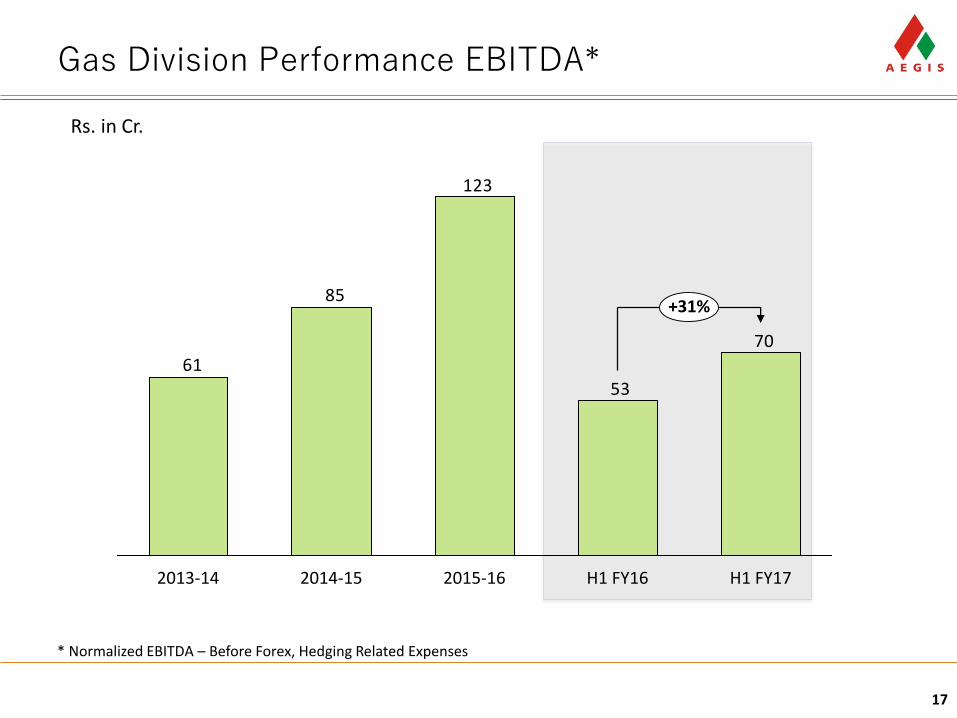
Gas Division Performance EBITDA*
17
53
123
85
61
70
H1 FY172015-162014-15 H1 FY162013-14
+31%
* Normalized EBITDA – Before Forex, Hedging Related Expenses
Rs. in Cr.
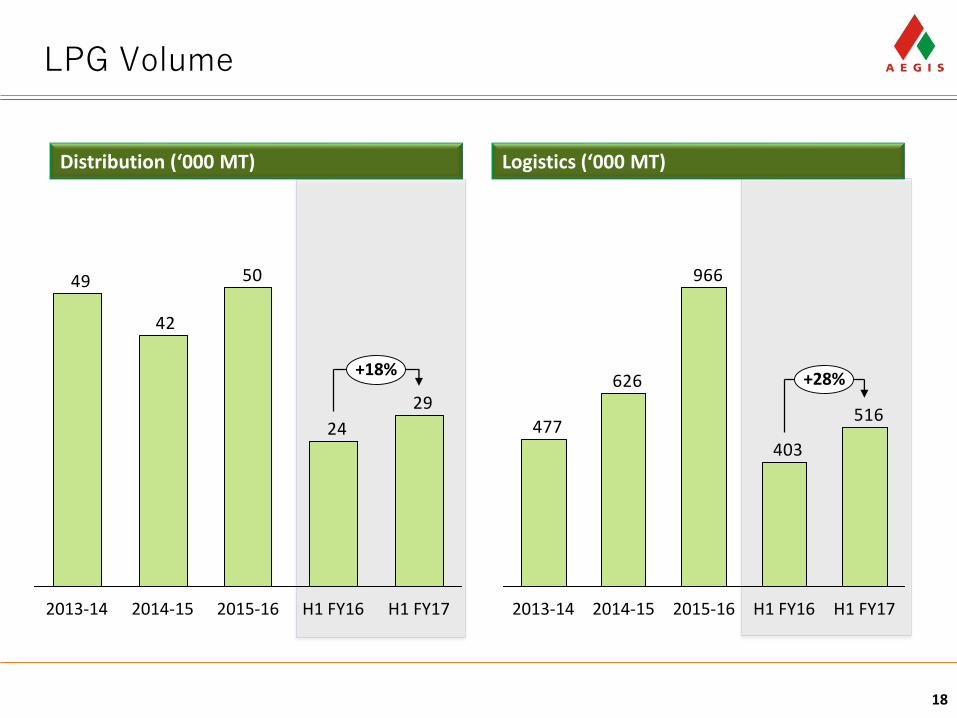
LPG Volume
18
Logistics (‘000 MT)Distribution (‘000 MT)
24
50
42
49
29
H1 FY162015-16 H1 FY17
+18%
2013-14 2014-15
403
966
626
477516
H1 FY172013-14
+28%
H1 FY162015-162014-15
New Growth Drivers
• Throughput volumes for LPG handled in Pipavav and Mumbai Terminals expected to grow 30-40% on YoY basis through existing and new customer relationships
• Commissioning of second chemical berth in Mumbai Port which will result in additional port handling capacity of 2.5 mn MT per year
• An agreement has been reached with ESSAR to sell ESSAR branded petrol and diesel in up-to 60 existing auto gas stations and potentially all new sites
• Order Book for LPG sourcing of FY 2017 is the highest in the history of Aegis Group International PTE Ltd
19
20
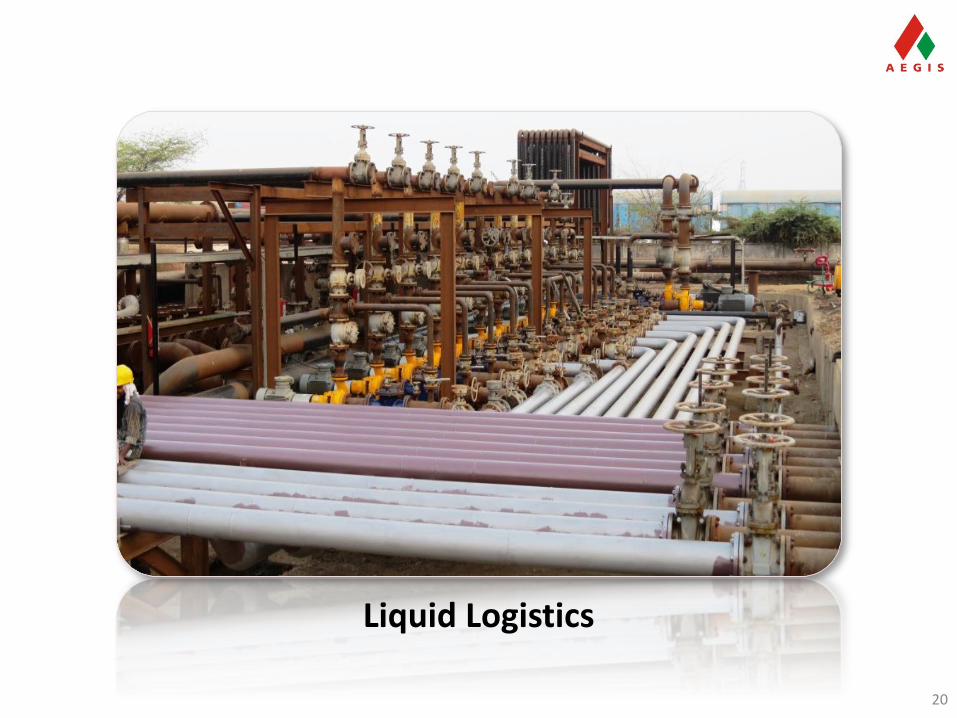
Liquid Logistics
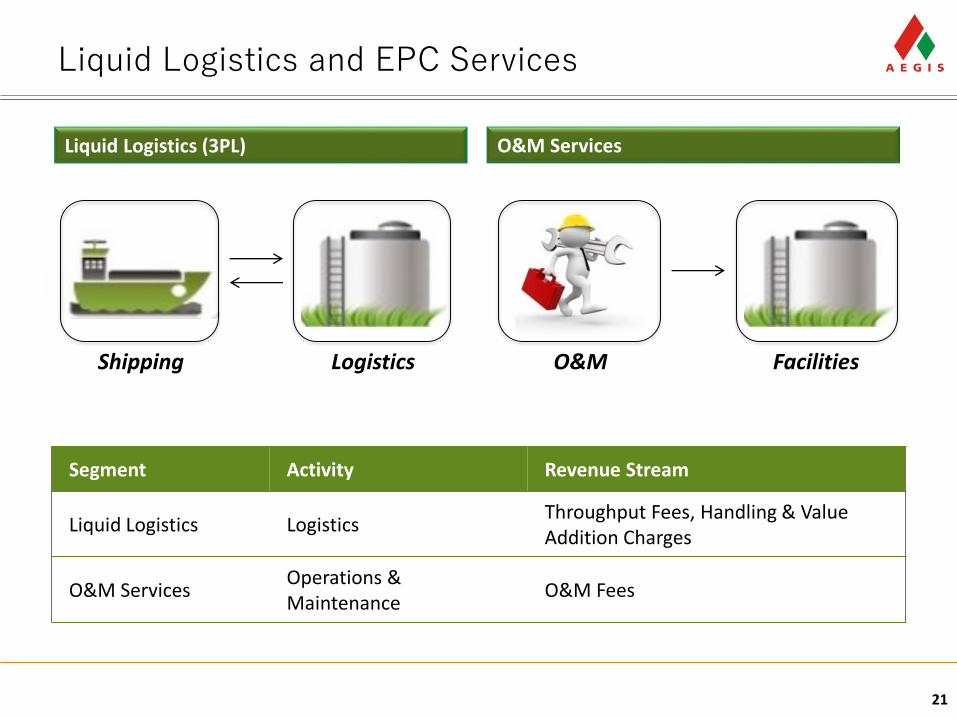
Liquid Logistics and EPC Services
21
Shipping Logistics
Segment Activity Revenue Stream
Liquid Logistics LogisticsThroughput Fees, Handling & Value Addition Charges
O&M ServicesOperations & Maintenance
O&M Fees
O&M ServicesLiquid Logistics (3PL)
O&M Facilities
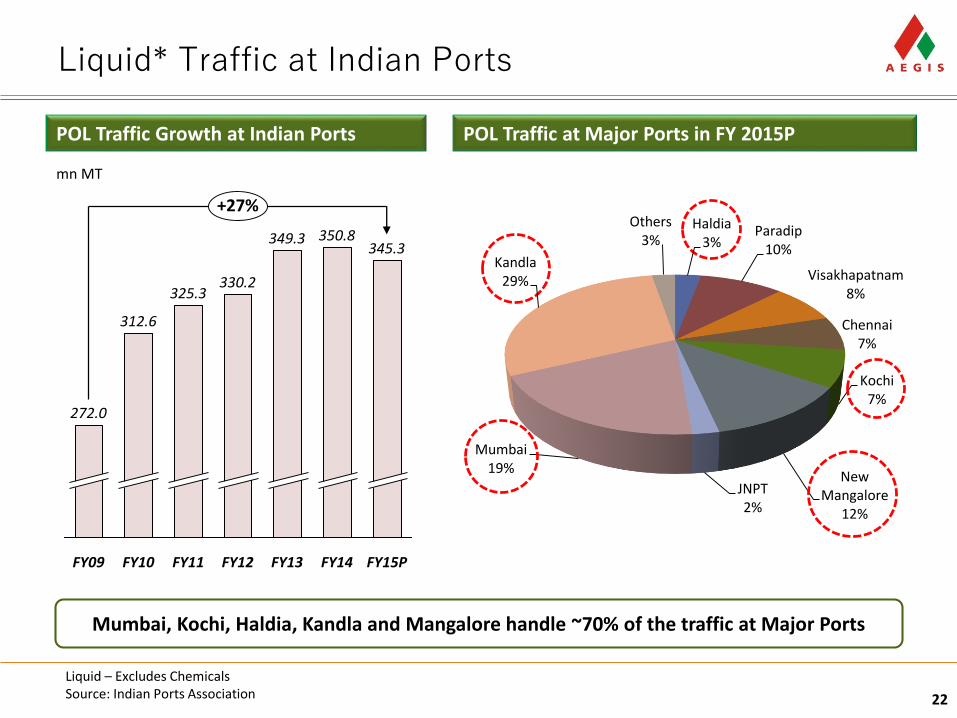
Liquid* Traffic at Indian Ports
22
POL Traffic at Major Ports in FY 2015P
Liquid – Excludes ChemicalsSource: Indian Ports Association
POL Traffic Growth at Indian Ports
Mumbai, Kochi, Haldia, Kandla and Mangalore handle ~70% of the traffic at Major Ports
mn MT
Haldia3%
Paradip10%
Visakhapatnam8%
Chennai7%
Kochi7%
New Mangalore
12%
JNPT2%
Mumbai19%
Kandla29%
Others3%350.8
330.2
272.0
325.3
FY09 FY11
312.6
FY15PFY10
+27%
FY14FY13
349.3345.3
FY12
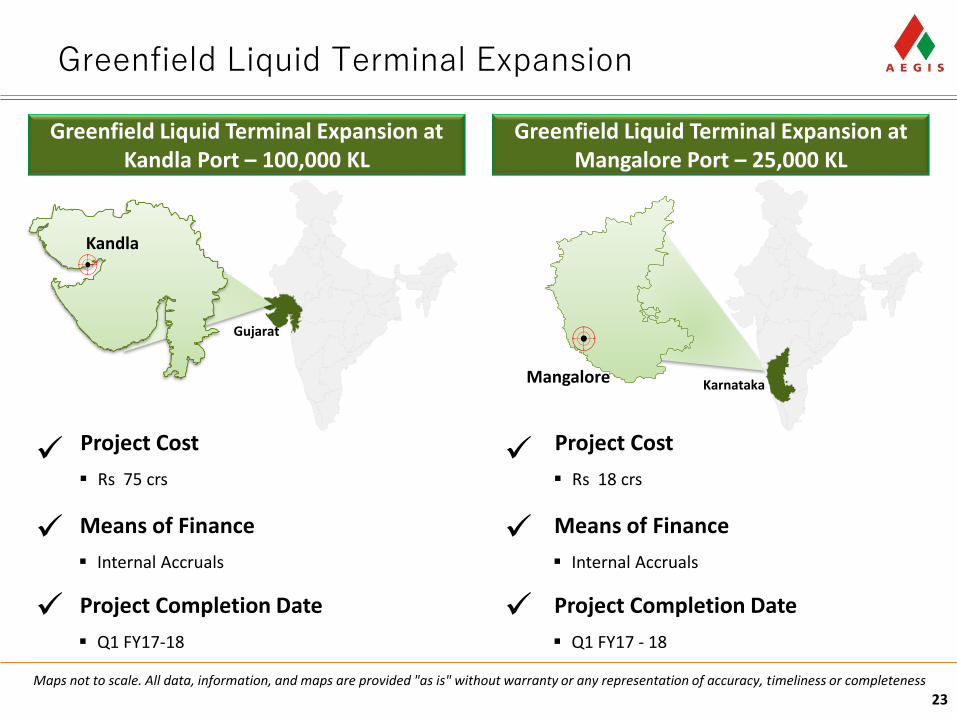
Greenfield Liquid Terminal Expansion
23
Internal Accruals
Means of Finance
Q1 FY17-18
Project Completion Date
Kandla
Greenfield Liquid Terminal Expansion at Mangalore Port – 25,000 KL
Greenfield Liquid Terminal Expansion at Kandla Port – 100,000 KL
Internal Accruals
Means of Finance
Q1 FY17 - 18
Project Completion Date
Rs 75 crs
Project Cost
Rs 18 crs
Project Cost
Mangalore
Gujarat
Karnataka
Maps not to scale. All data, information, and maps are provided "as is" without warranty or any representation of accuracy, timeliness or completeness
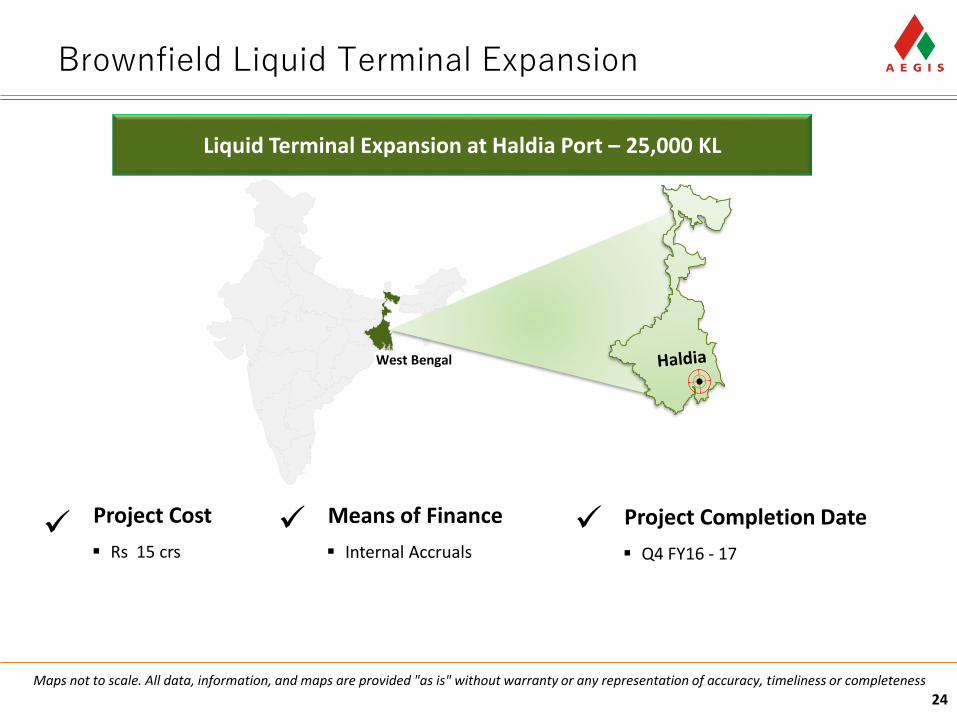
Brownfield Liquid Terminal Expansion
24
Liquid Terminal Expansion at Haldia Port – 25,000 KL
Internal Accruals
Means of Finance
Q4 FY16 - 17
Project Completion Date
Rs 15 crs
Project Cost
West Bengal
Maps not to scale. All data, information, and maps are provided "as is" without warranty or any representation of accuracy, timeliness or completeness
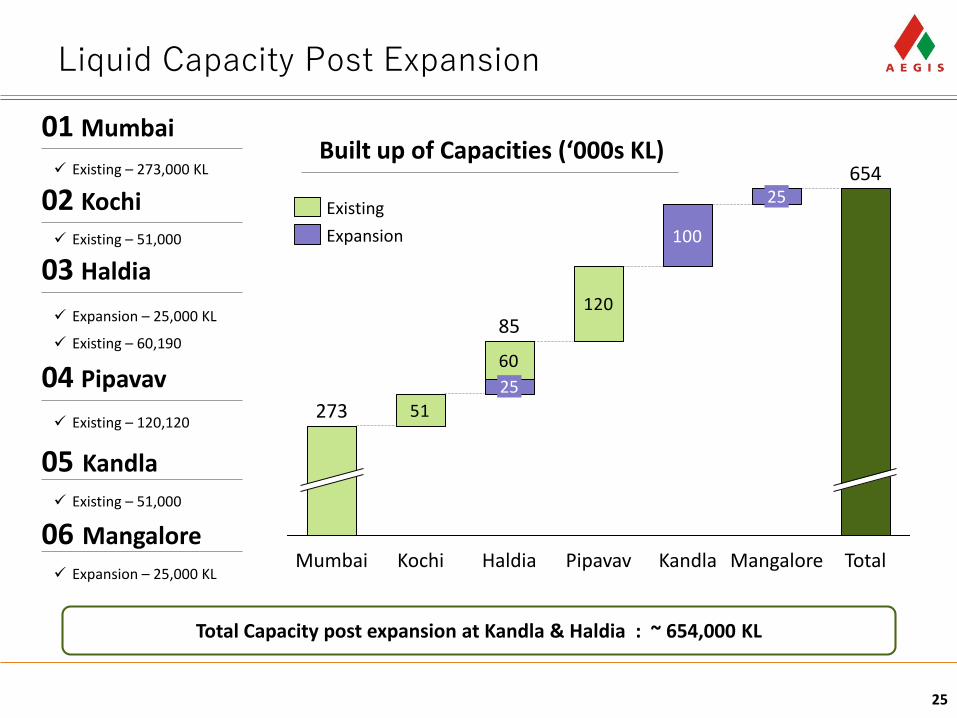
Liquid Capacity Post Expansion
25
Existing – 273,000 KL
01 Mumbai
Existing – 51,000
02 Kochi
Expansion – 25,000 KL
Existing – 60,190
03 Haldia
Existing – 120,120
04 Pipavav
Existing – 51,000
05 Kandla
51
120
100
60
Mumbai
273
654
Pipavav Kandla TotalHaldia
85
25
Kochi
25
Mangalore
Built up of Capacities (‘000s KL)
Existing
Expansion
Total Capacity post expansion at Kandla & Haldia : ~ 654,000 KL
Expansion – 25,000 KL
06 Mangalore
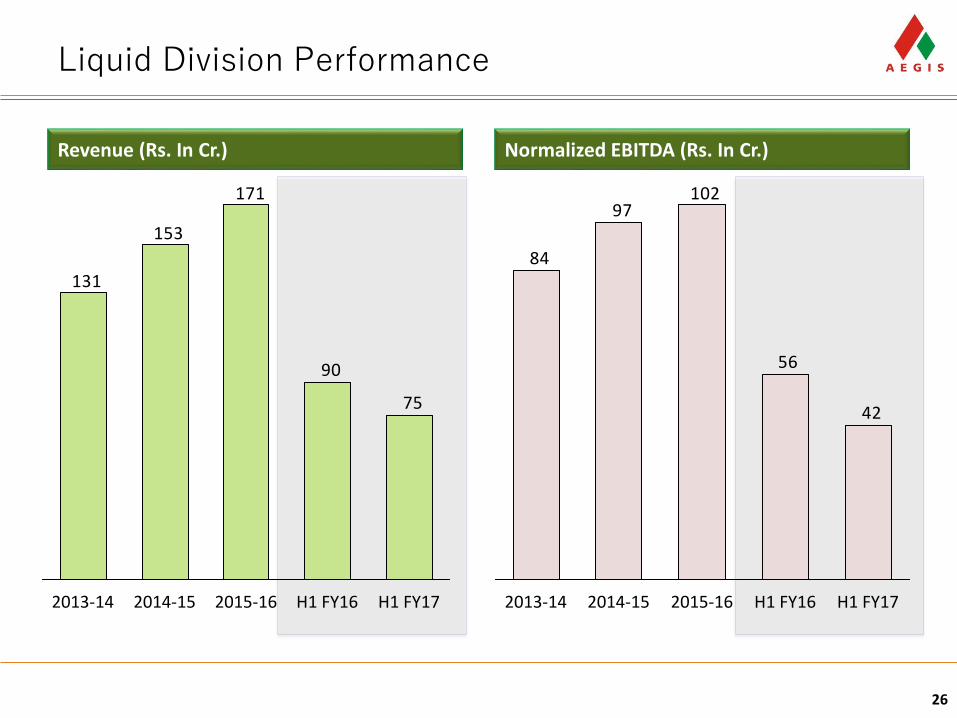
Liquid Division Performance
26
90
171
153
131
75
2013-14 2015-16 H1 FY16 H1 FY172014-15
56
10297
84
42
2014-15 H1 FY172015-162013-14 H1 FY16
Revenue (Rs. In Cr.) Normalized EBITDA (Rs. In Cr.)
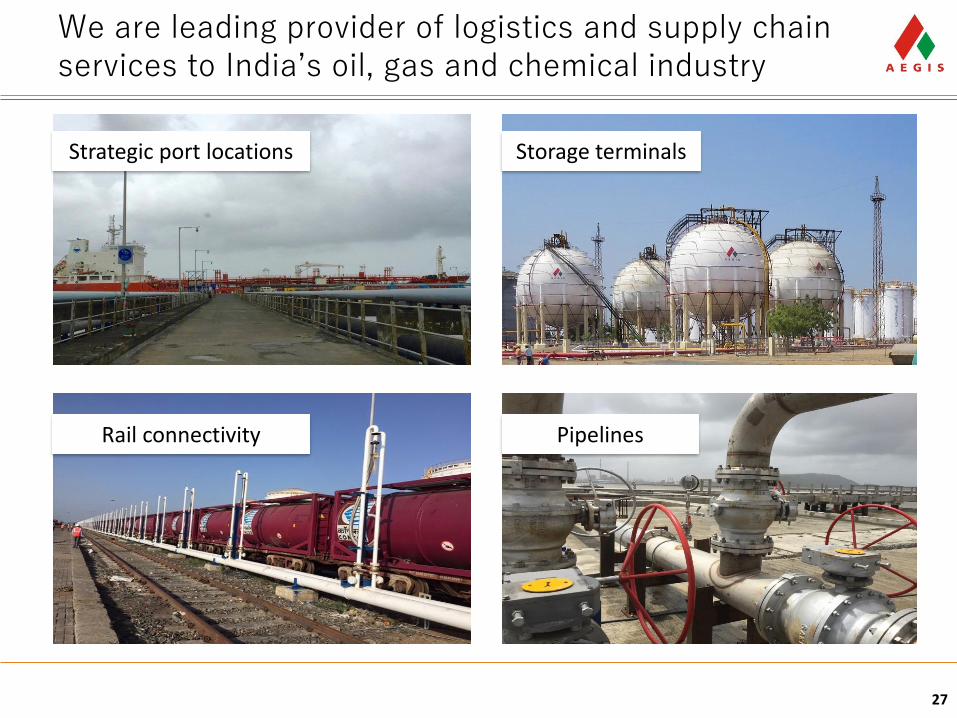
We are leading provider of logistics and supply chain services to India’s oil, gas and chemical industry
27
Rail connectivity
Storage terminalsStrategic port locations
Pipelines
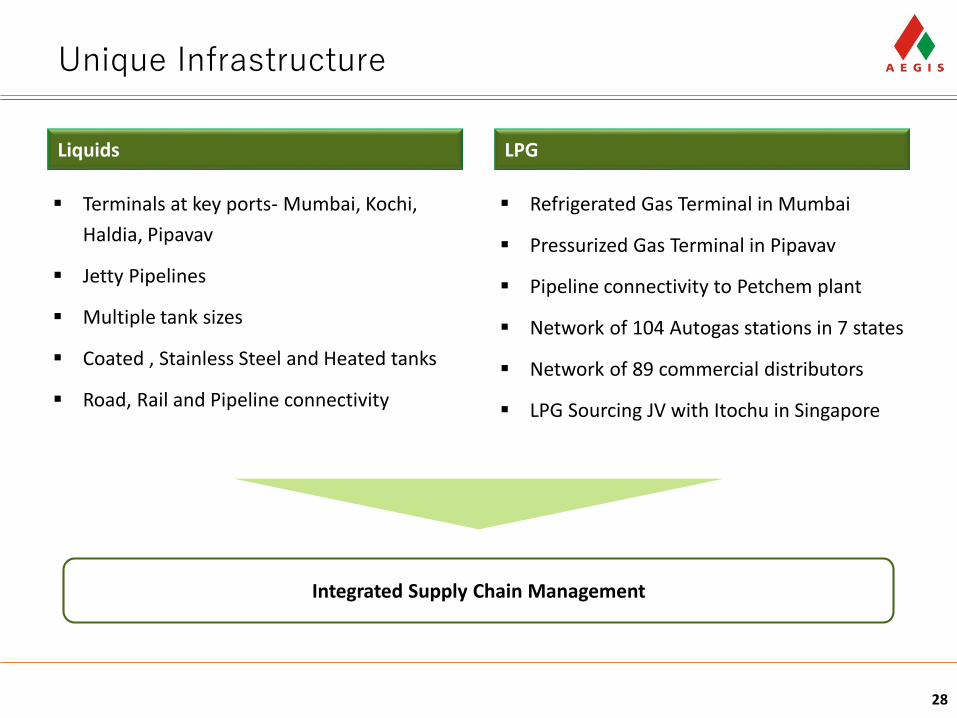
Unique Infrastructure
28
Integrated Supply Chain Management
Terminals at key ports- Mumbai, Kochi,
Haldia, Pipavav
Jetty Pipelines
Multiple tank sizes
Coated , Stainless Steel and Heated tanks
Road, Rail and Pipeline connectivity
Refrigerated Gas Terminal in Mumbai
Pressurized Gas Terminal in Pipavav
Pipeline connectivity to Petchem plant
Network of 104 Autogas stations in 7 states
Network of 89 commercial distributors
LPG Sourcing JV with Itochu in Singapore
Liquids LPG
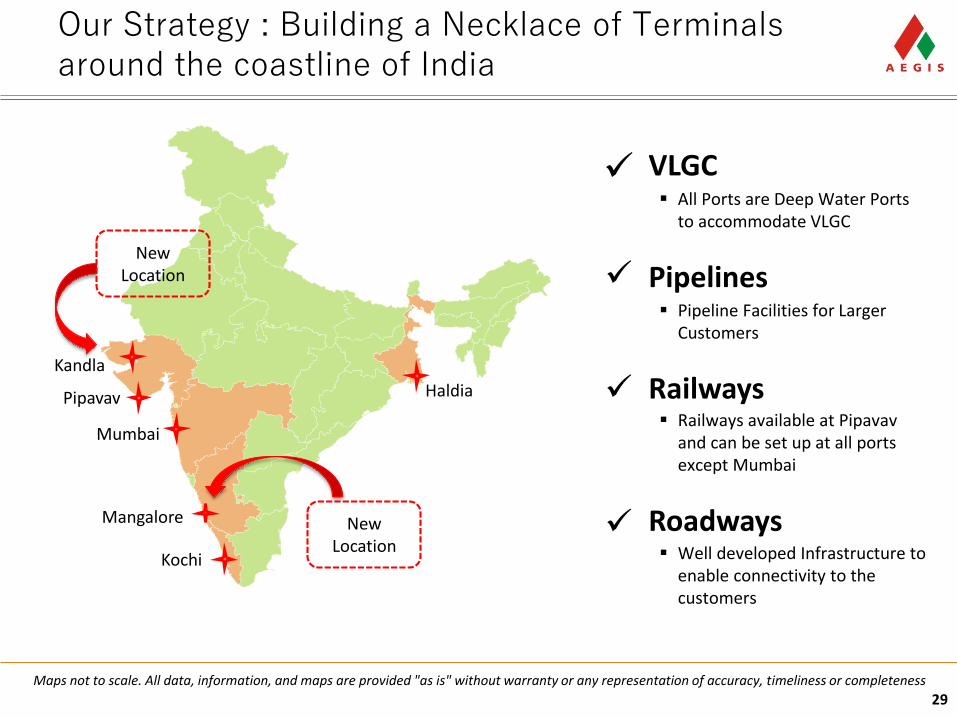
Our Strategy : Building a Necklace of Terminals around the coastline of India
29
Kochi
Pipavav
Mumbai
Haldia
Kandla
New Location
All Ports are Deep Water Ports
to accommodate VLGC
VLGC
Pipeline Facilities for Larger Customers
Pipelines
Railways available at Pipavavand can be set up at all ports except Mumbai
Railways
Well developed Infrastructure to enable connectivity to the customers
Roadways
Mangalore New
Location
Maps not to scale. All data, information, and maps are provided "as is" without warranty or any representation of accuracy, timeliness or completeness
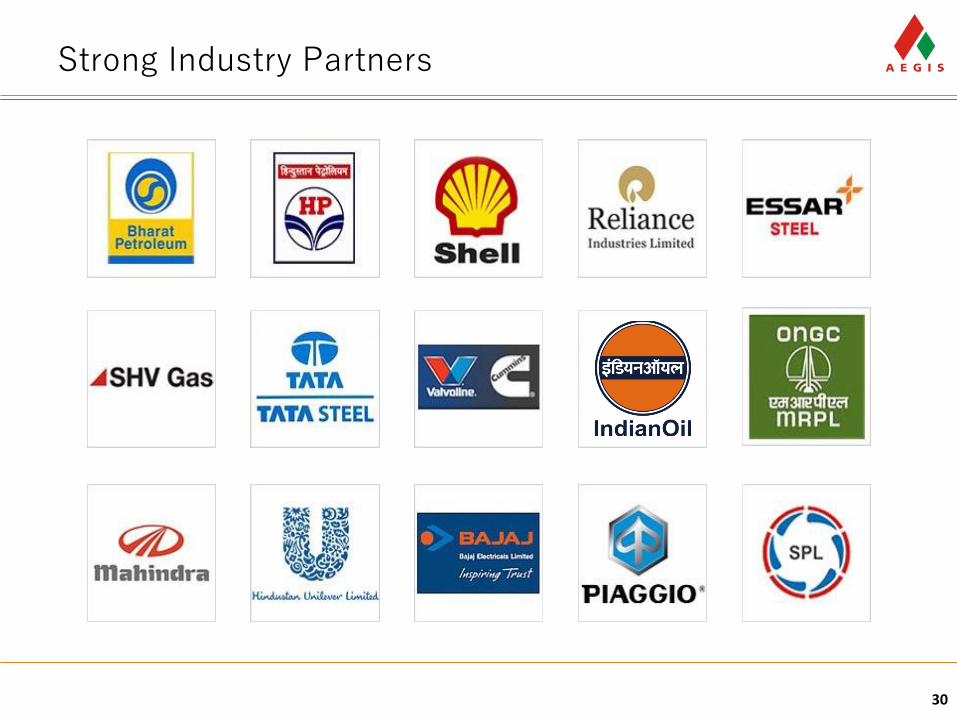
Strong Industry Partners
30
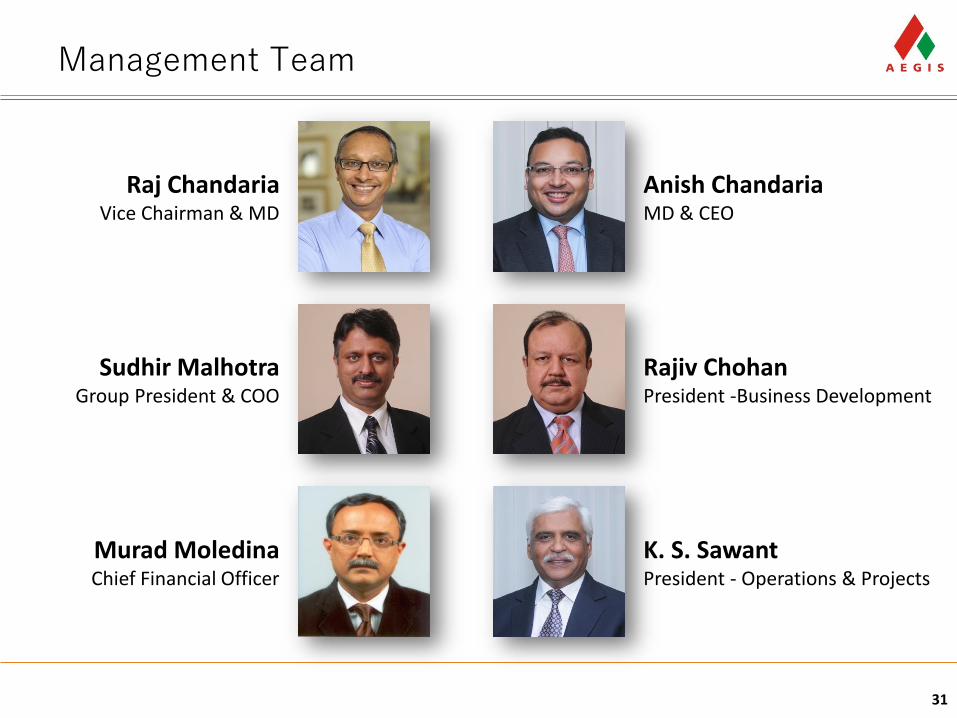
Management Team
31
Raj ChandariaVice Chairman & MD
Anish ChandariaMD & CEO
Sudhir MalhotraGroup President & COO
Rajiv ChohanPresident -Business Development
Murad MoledinaChief Financial Officer
K. S. SawantPresident - Operations & Projects
Financial Performance
32
Solid Foundations
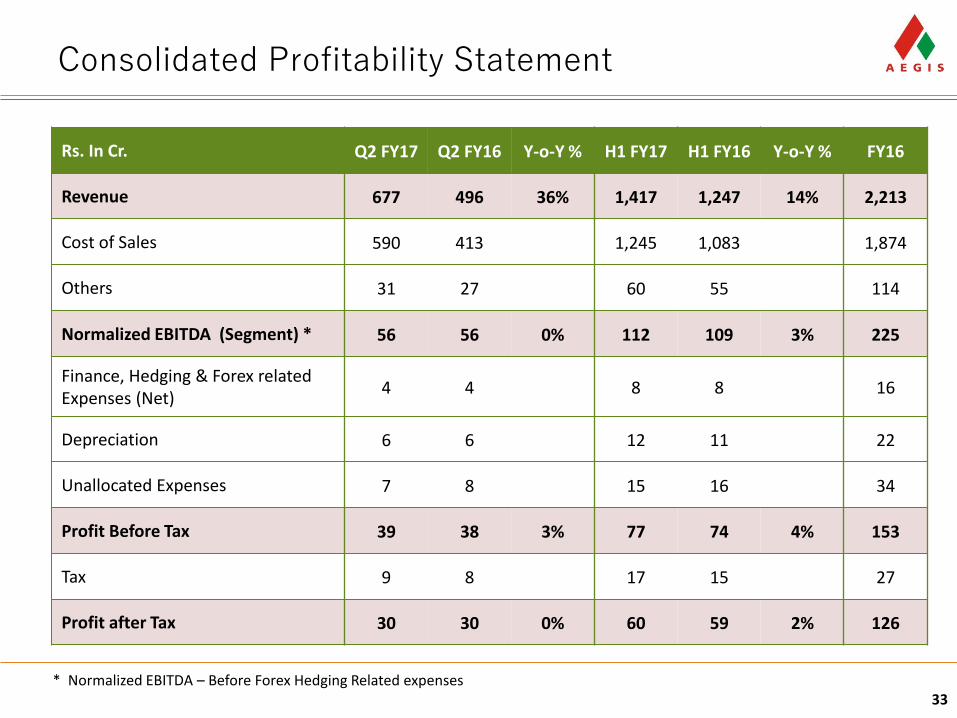
Consolidated Profitability Statement
33* Normalized EBITDA – Before Forex Hedging Related expenses
Rs. In Cr. Q2 FY17 Q2 FY16 Y-o-Y % H1 FY17 H1 FY16 Y-o-Y % FY16
Revenue 677 496 36% 1,417 1,247 14% 2,213
Cost of Sales 590 413 1,245 1,083 1,874
Others 31 27 60 55 114
Normalized EBITDA (Segment) * 56 56 0% 112 109 3% 225
Finance, Hedging & Forex related Expenses (Net)
4 4 8 8 16
Depreciation 6 6 12 11 22
Unallocated Expenses 7 8 15 16 34
Profit Before Tax 39 38 3% 77 74 4% 153
Tax 9 8 17 15 27
Profit after Tax 30 30 0% 60 59 2% 126
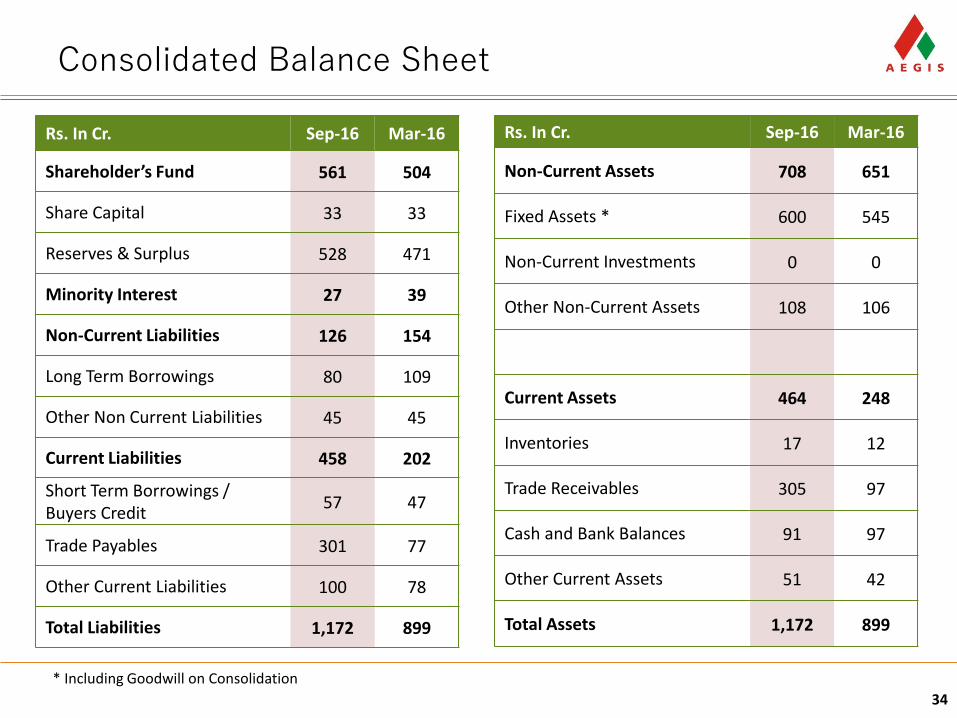
Rs. In Cr. Sep-16 Mar-16
Shareholder’s Fund 561 504
Share Capital 33 33
Reserves & Surplus 528 471
Minority Interest 27 39
Non-Current Liabilities 126 154
Long Term Borrowings 80 109
Other Non Current Liabilities 45 45
Current Liabilities 458 202
Short Term Borrowings / Buyers Credit
57 47
Trade Payables 301 77
Other Current Liabilities 100 78
Total Liabilities 1,172 899
Consolidated Balance Sheet
34
* Including Goodwill on Consolidation
Rs. In Cr. Sep-16 Mar-16
Non-Current Assets 708 651
Fixed Assets * 600 545
Non-Current Investments 0 0
Other Non-Current Assets 108 106
Current Assets 464 248
Inventories 17 12
Trade Receivables 305 97
Cash and Bank Balances 91 97
Other Current Assets 51 42
Total Assets 1,172 899
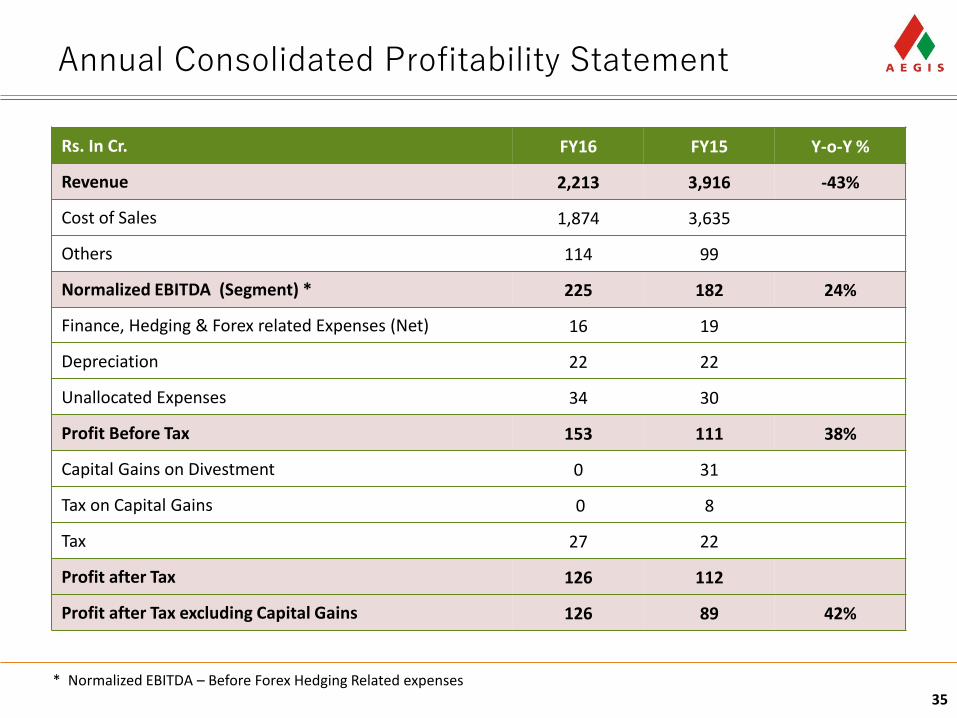
Annual Consolidated Profitability Statement
35* Normalized EBITDA – Before Forex Hedging Related expenses
Rs. In Cr. FY16 FY15 Y-o-Y %
Revenue 2,213 3,916 -43%
Cost of Sales 1,874 3,635
Others 114 99
Normalized EBITDA (Segment) * 225 182 24%
Finance, Hedging & Forex related Expenses (Net) 16 19
Depreciation 22 22
Unallocated Expenses 34 30
Profit Before Tax 153 111 38%
Capital Gains on Divestment 0 31
Tax on Capital Gains 0 8
Tax 27 22
Profit after Tax 126 112
Profit after Tax excluding Capital Gains 126 89 42%
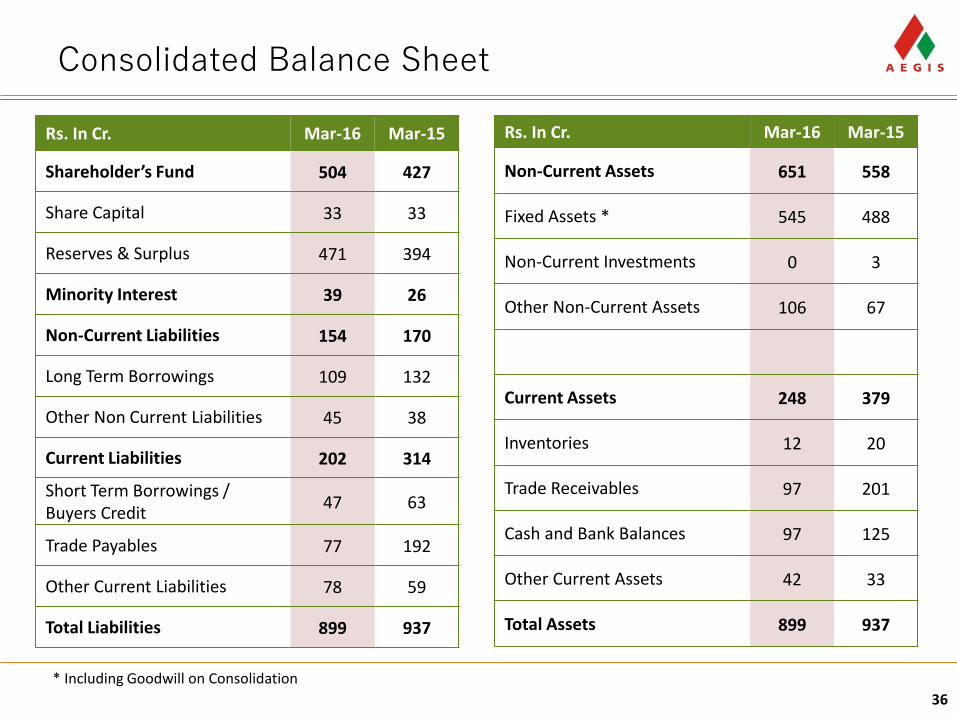
Rs. In Cr. Mar-16 Mar-15
Shareholder’s Fund 504 427
Share Capital 33 33
Reserves & Surplus 471 394
Minority Interest 39 26
Non-Current Liabilities 154 170
Long Term Borrowings 109 132
Other Non Current Liabilities 45 38
Current Liabilities 202 314
Short Term Borrowings / Buyers Credit
47 63
Trade Payables 77 192
Other Current Liabilities 78 59
Total Liabilities 899 937
Consolidated Balance Sheet
36
* Including Goodwill on Consolidation
Rs. In Cr. Mar-16 Mar-15
Non-Current Assets 651 558
Fixed Assets * 545 488
Non-Current Investments 0 3
Other Non-Current Assets 106 67
Current Assets 248 379
Inventories 12 20
Trade Receivables 97 201
Cash and Bank Balances 97 125
Other Current Assets 42 33
Total Assets 899 937
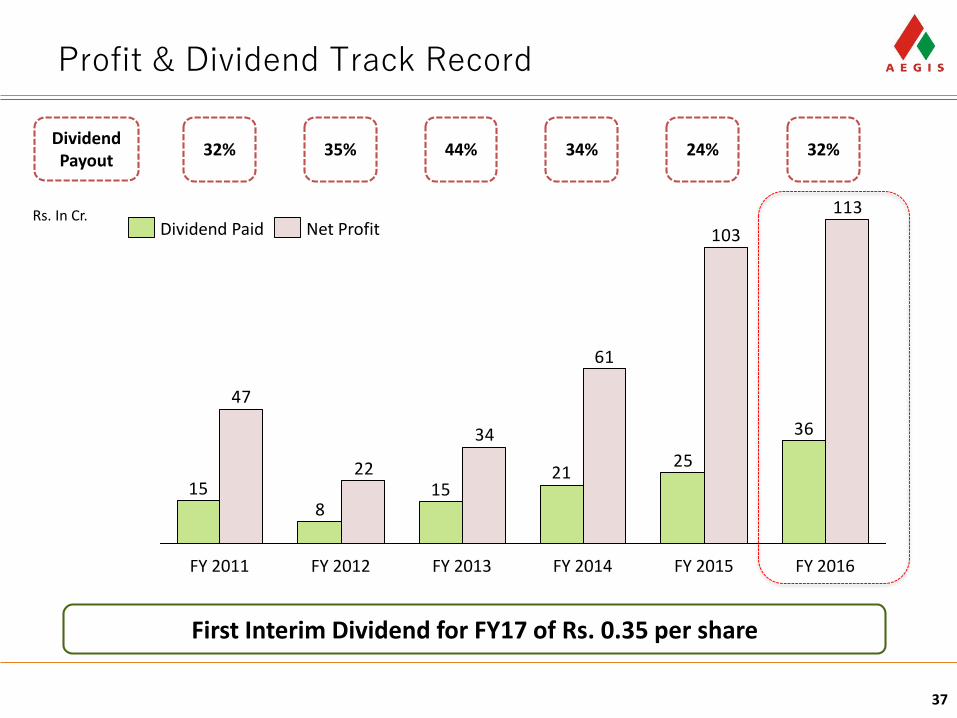
Profit & Dividend Track Record
37
32% 35% 44% 34% 24%DividendPayout
36
2521
158
15
113
103
61
34
22
47
FY 2011 FY 2016FY 2013 FY 2014 FY 2015FY 2012
Dividend Paid Net Profit
32%
Rs. In Cr.
First Interim Dividend for FY17 of Rs. 0.35 per share
38
For further information, please contact:
Company : Investor Relations Advisors :
Aegis Logistics LimitedCIN: L63090GJ1956PLC001032
Mr. Murad Moledina, [email protected]
www.aegisindia.com
Strategic Growth Advisors Pvt. Ltd.CIN: U74140MH2010PTC204285
Ms. Payal Dave / Mr. Jigar [email protected] / [email protected]
www.sgapl.net