Embed Size (px)
Citation preview
AEGIS LOGISTICS
LIMITED
Investor Presentation
December 2012
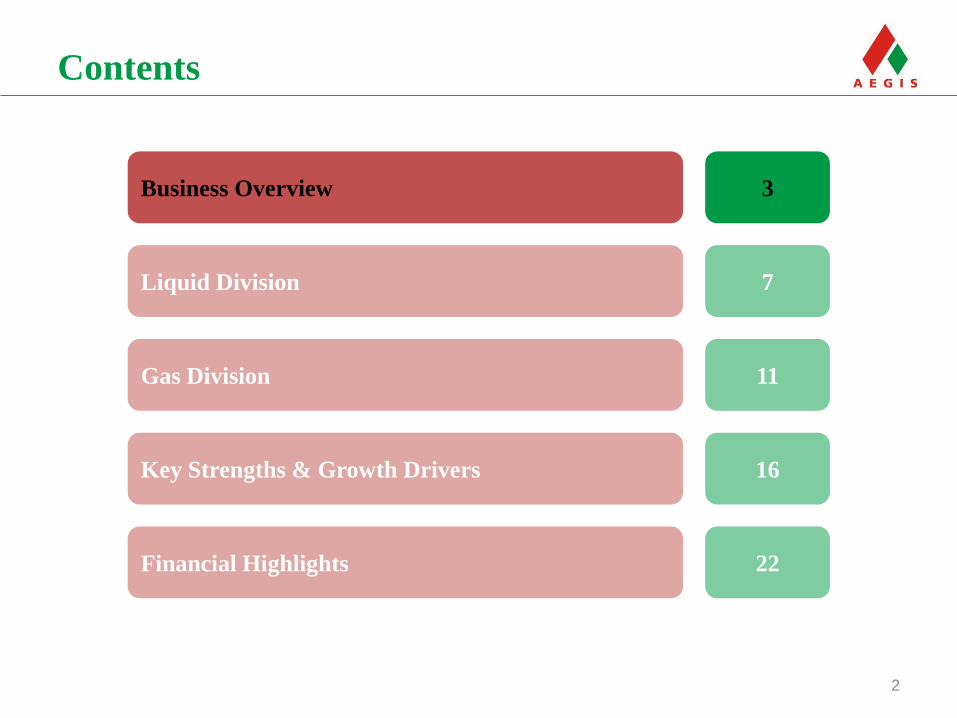
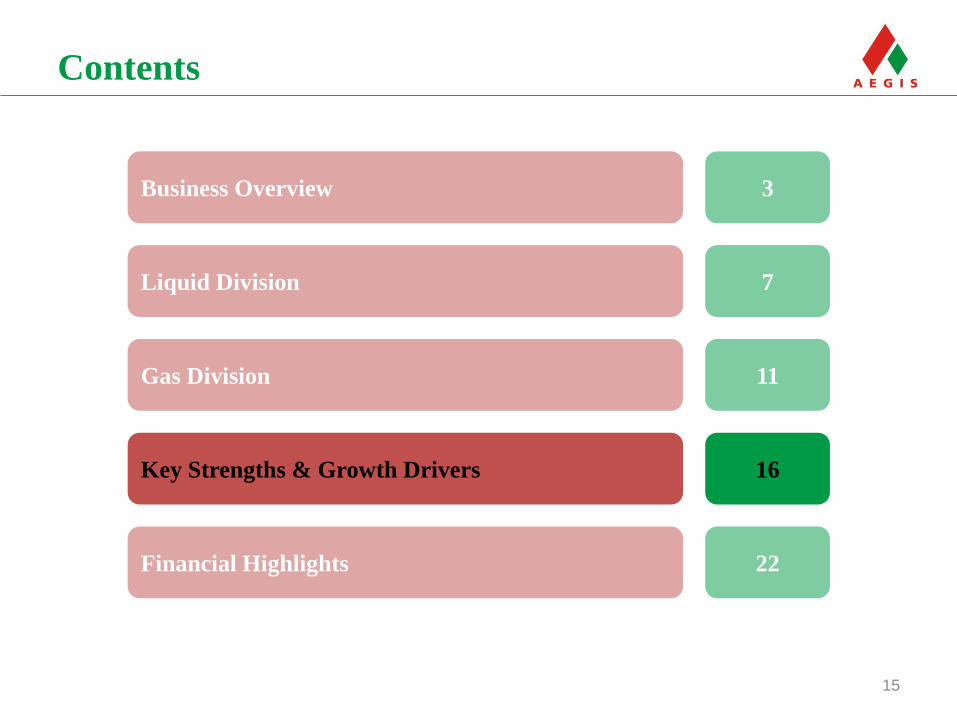
Liquid Division 7
Contents
2
Gas Division 11
Key Strengths & Growth Drivers 16
Financial Highlights 22
Business Overview 3
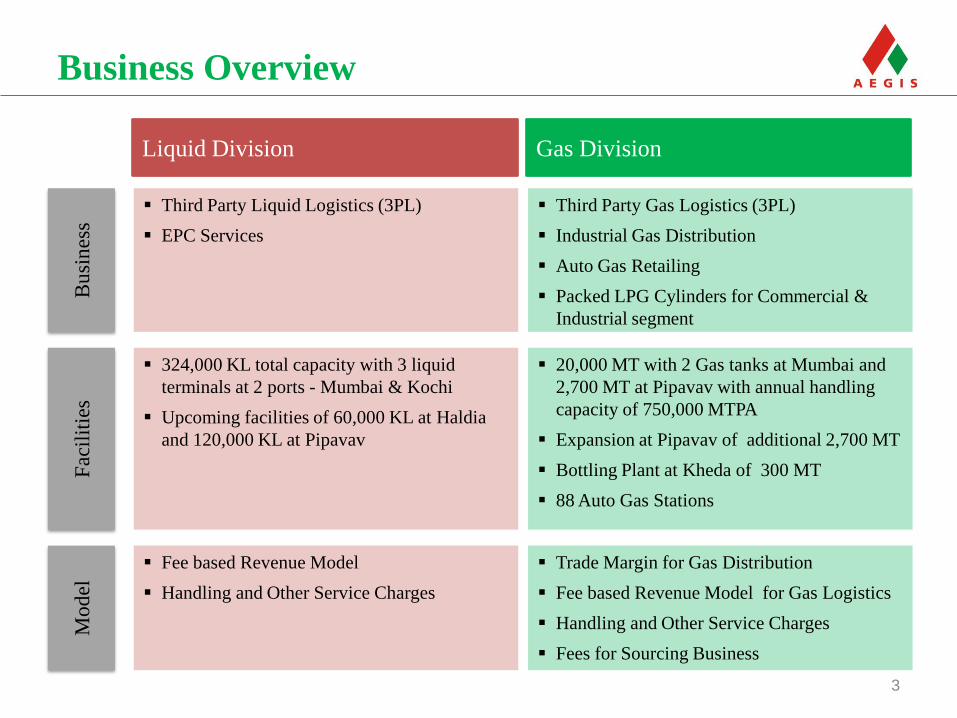
Business Overview
3
Third Party Liquid Logistics (3PL)
EPC Services
Liquid Division
Third Party Gas Logistics (3PL)
Industrial Gas Distribution
Auto Gas Retailing
Packed LPG Cylinders for Commercial &
Industrial segment
Gas Division
324,000 KL total capacity with 3 liquid
terminals at 2 ports - Mumbai & Kochi
Upcoming facilities of 60,000 KL at Haldia
and 120,000 KL at Pipavav
20,000 MT with 2 Gas tanks at Mumbai and
2,700 MT at Pipavav with annual handling
capacity of 750,000 MTPA
Expansion at Pipavav of additional 2,700 MT
Bottling Plant at Kheda of 300 MT
88 Auto Gas Stations
Fee based Revenue Model
Handling and Other Service Charges
Trade Margin for Gas Distribution
Fee based Revenue Model for Gas Logistics
Handling and Other Service Charges
Fees for Sourcing Business
Bu
sin
ess
Fac
ilit
ies
Mo
del
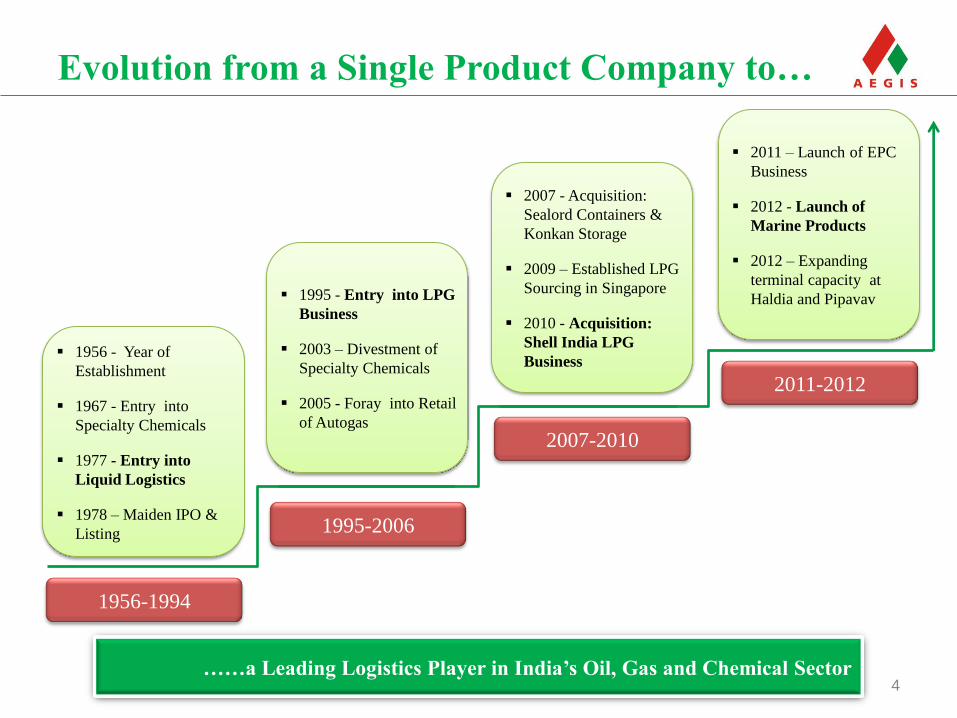
Evolution from a Single Product Company to…
4
1956-1994
1995-2006
2007-2010
2011-2012
1956 - Year of
Establishment
1967 - Entry into
Specialty Chemicals
1977 - Entry into
Liquid Logistics
1978 – Maiden IPO &
Listing
1995 - Entry into LPG
Business
2003 – Divestment of
Specialty Chemicals
2005 - Foray into Retail
of Autogas
2007 - Acquisition:
Sealord Containers &
Konkan Storage
2009 – Established LPG
Sourcing in Singapore
2010 - Acquisition:
Shell India LPG
Business
2011 – Launch of EPC
Business
2012 - Launch of
Marine Products
2012 – Expanding
terminal capacity at
Haldia and Pipavav
……a Leading Logistics Player in India’s Oil, Gas and Chemical Sector
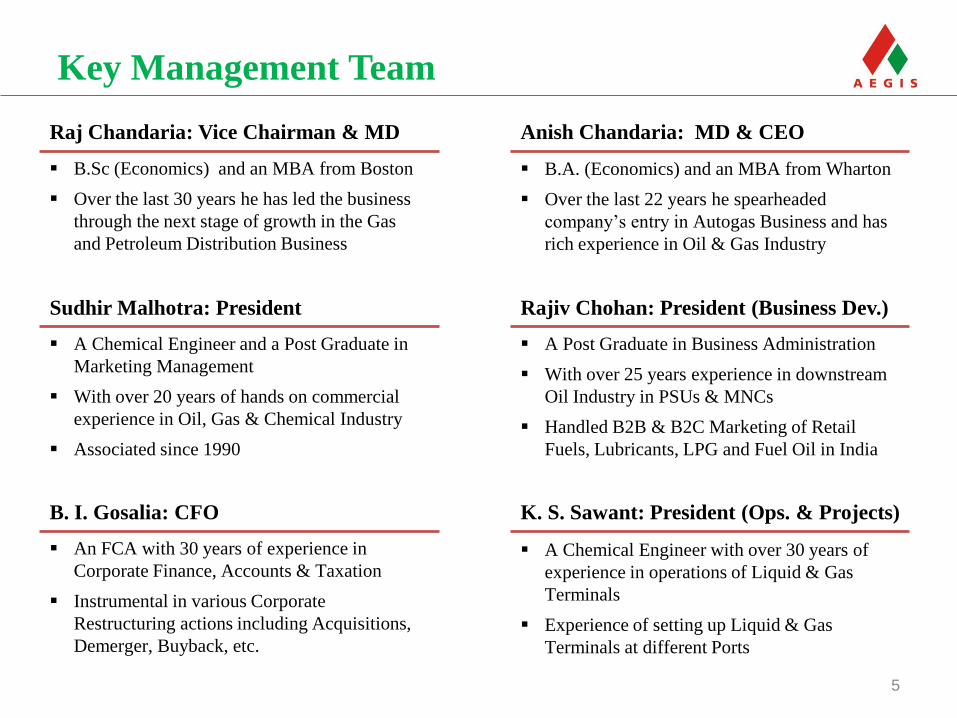
Key Management Team
5
B.Sc (Economics) and an MBA from Boston
Over the last 30 years he has led the business
through the next stage of growth in the Gas
and Petroleum Distribution Business
Raj Chandaria: Vice Chairman & MD
B.A. (Economics) and an MBA from Wharton
Over the last 22 years he spearheaded
company’s entry in Autogas Business and has
rich experience in Oil & Gas Industry
Anish Chandaria: MD & CEO
A Chemical Engineer and a Post Graduate in
Marketing Management
With over 20 years of hands on commercial
experience in Oil, Gas & Chemical Industry
Associated since 1990
Sudhir Malhotra: President
A Post Graduate in Business Administration
With over 25 years experience in downstream
Oil Industry in PSUs & MNCs
Handled B2B & B2C Marketing of Retail
Fuels, Lubricants, LPG and Fuel Oil in India
Rajiv Chohan: President (Business Dev.)
An FCA with 30 years of experience in
Corporate Finance, Accounts & Taxation
Instrumental in various Corporate
Restructuring actions including Acquisitions,
Demerger, Buyback, etc.
B. I. Gosalia: CFO
A Chemical Engineer with over 30 years of
experience in operations of Liquid & Gas
Terminals
Experience of setting up Liquid & Gas
Terminals at different Ports
K. S. Sawant: President (Ops. & Projects)
Liquid Division 7
Contents
6
Gas Division 11
Key Strengths & Growth Drivers 16
Financial Highlights 22
Business Overview 3
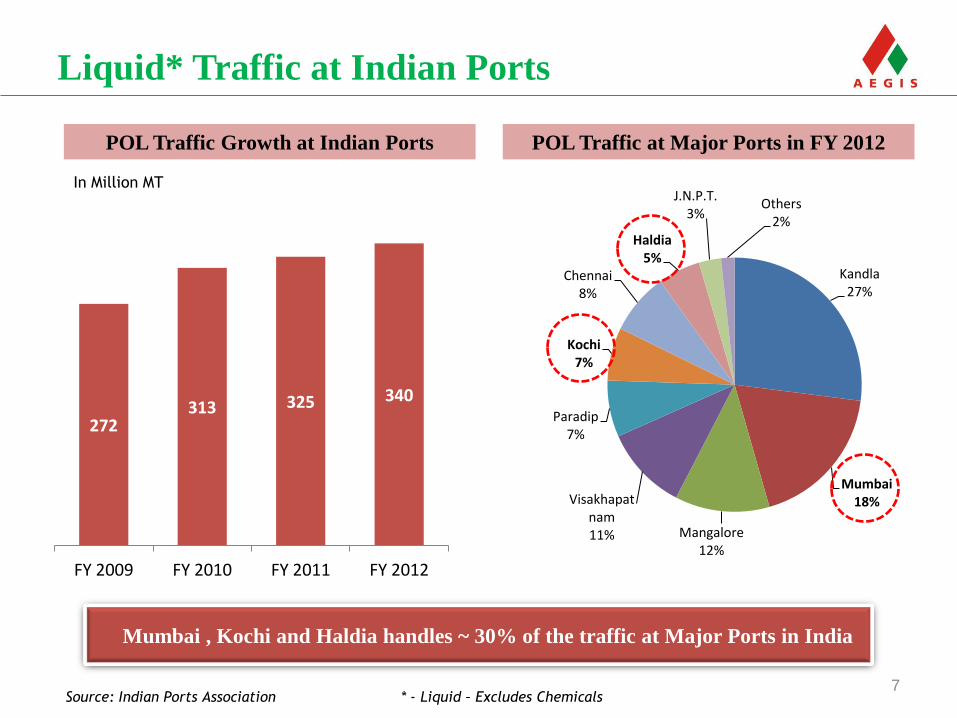
Liquid* Traffic at Indian Ports
7
POL Traffic at Major Ports in FY 2012
Kandla 27%
Mumbai 18%
Mangalore 12%
Visakhapatnam 11%
Paradip 7%
Kochi 7%
Chennai 8%
Haldia 5%
J.N.P.T. 3%
Others 2%
Source: Indian Ports Association
272 313 325 340
FY 2009 FY 2010 FY 2011 FY 2012
POL Traffic Growth at Indian Ports
Mumbai , Kochi and Haldia handles ~ 30% of the traffic at Major Ports in India
In Million MT
* - Liquid – Excludes Chemicals
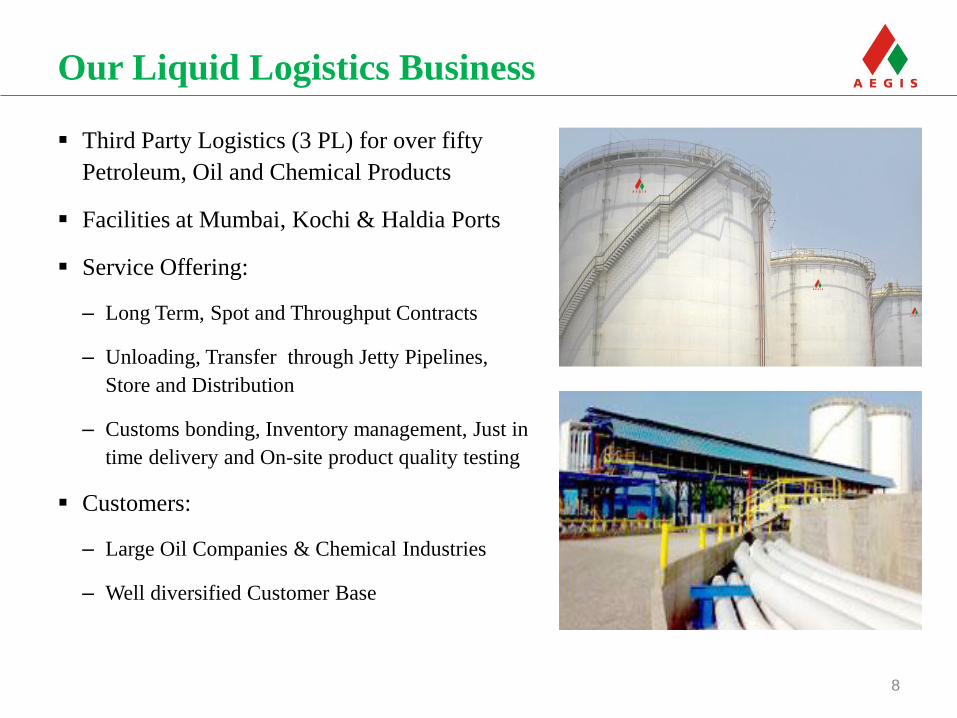
Our Liquid Logistics Business
8
Third Party Logistics (3 PL) for over fifty
Petroleum, Oil and Chemical Products
Facilities at Mumbai, Kochi & Haldia Ports
Service Offering:
– Long Term, Spot and Throughput Contracts
– Unloading, Transfer through Jetty Pipelines,
Store and Distribution
– Customs bonding, Inventory management, Just in
time delivery and On-site product quality testing
Customers:
– Large Oil Companies & Chemical Industries
– Well diversified Customer Base
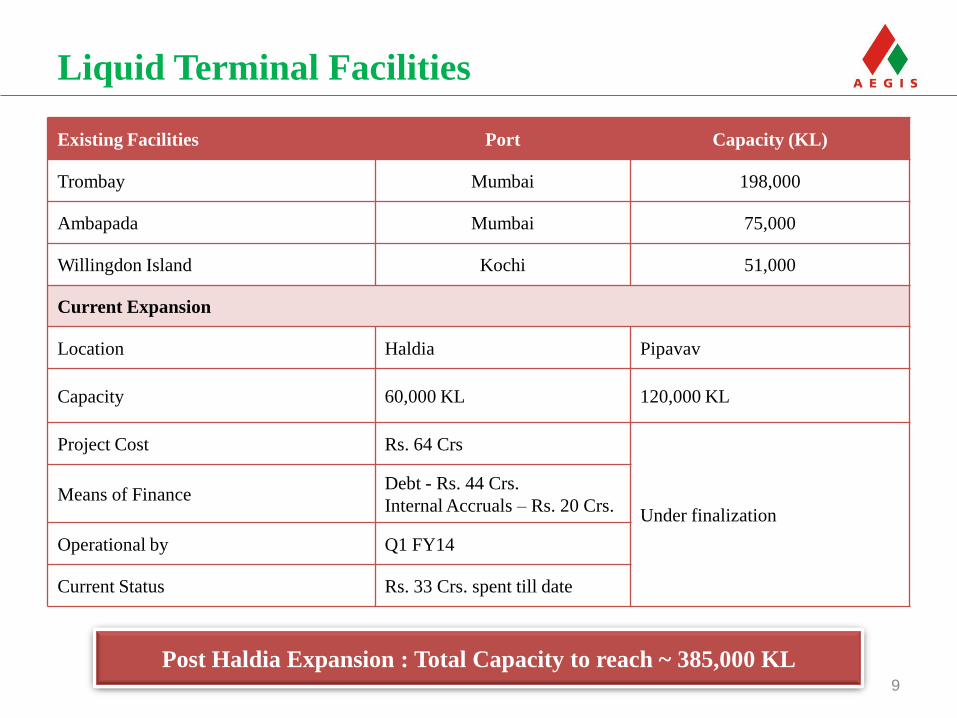
Liquid Terminal Facilities
9
Existing Facilities Port Capacity (KL)
Trombay Mumbai 198,000
Ambapada Mumbai 75,000
Willingdon Island Kochi 51,000
Current Expansion
Location Haldia Pipavav
Capacity 60,000 KL 120,000 KL
Project Cost Rs. 64 Crs
Under finalization Means of Finance
Debt - Rs. 44 Crs.
Internal Accruals – Rs. 20 Crs.
Operational by Q1 FY14
Current Status Rs. 33 Crs. spent till date
Post Haldia Expansion : Total Capacity to reach ~ 385,000 KL
Liquid Division 7
Contents
10
Gas Division 11
Key Strengths & Growth Drivers 16
Financial Highlights 22
Business Overview 3
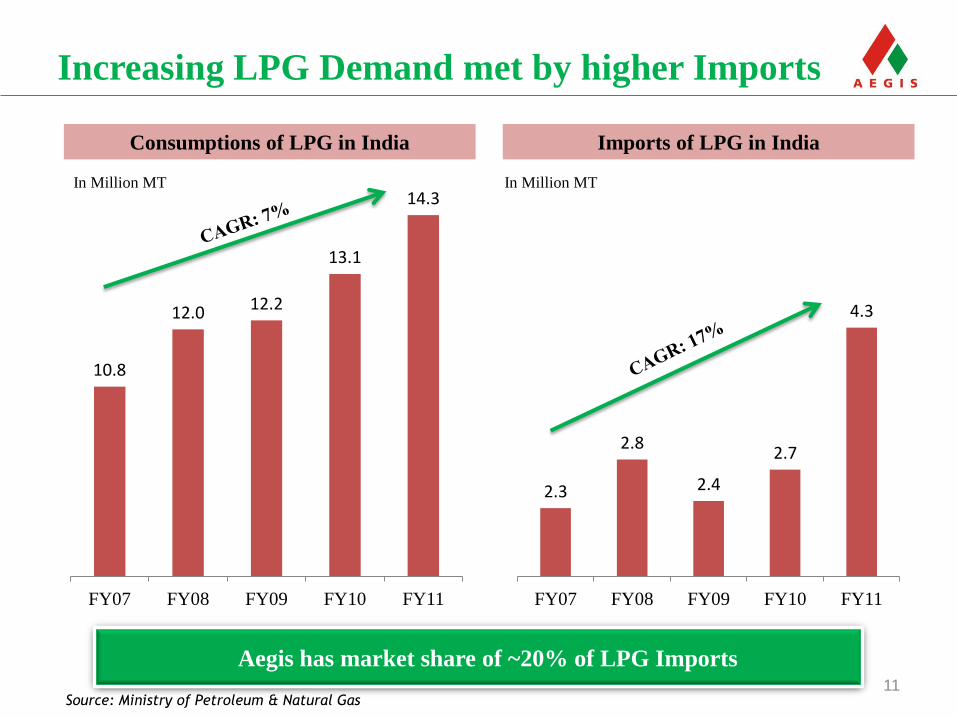
Increasing LPG Demand met by higher Imports
11
Imports of LPG in India Consumptions of LPG in India
Aegis has market share of ~20% of LPG Imports
10.8
12.0 12.2
13.1
14.3
FY07 FY08 FY09 FY10 FY11
2.3
2.8
2.4
2.7
4.3
FY07 FY08 FY09 FY10 FY11
In Million MT In Million MT
Source: Ministry of Petroleum & Natural Gas
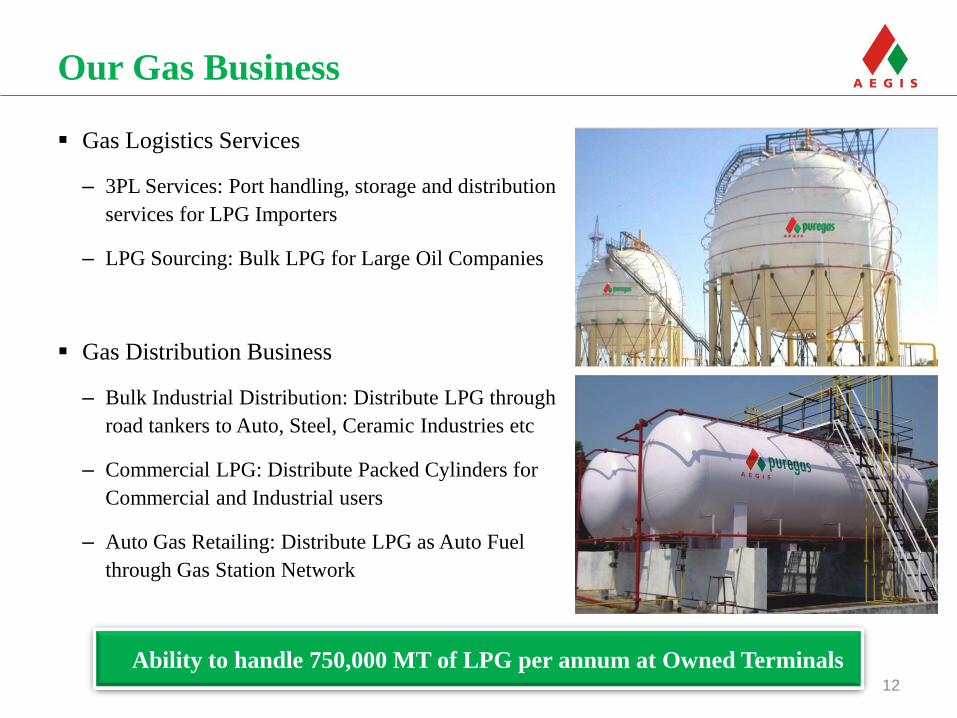
Our Gas Business
12
Gas Logistics Services
– 3PL Services: Port handling, storage and distribution
services for LPG Importers
– LPG Sourcing: Bulk LPG for Large Oil Companies
Gas Distribution Business
– Bulk Industrial Distribution: Distribute LPG through
road tankers to Auto, Steel, Ceramic Industries etc
– Commercial LPG: Distribute Packed Cylinders for
Commercial and Industrial users
– Auto Gas Retailing: Distribute LPG as Auto Fuel
through Gas Station Network
Ability to handle 750,000 MT of LPG per annum at Owned Terminals
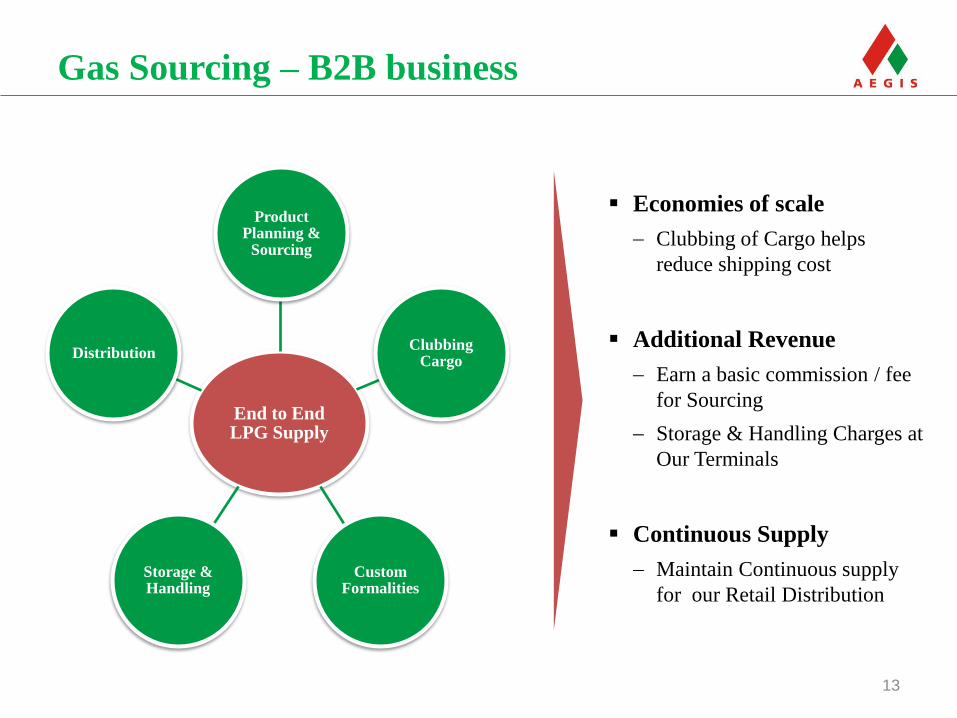
Gas Sourcing – B2B business
Economies of scale
Clubbing of Cargo helps
reduce shipping cost
Additional Revenue
Earn a basic commission / fee
for Sourcing
Storage & Handling Charges at
Our Terminals
Continuous Supply
Maintain Continuous supply
for our Retail Distribution
13
End to End LPG Supply
Product Planning &
Sourcing
Clubbing Cargo
Custom Formalities
Storage & Handling
Distribution
14
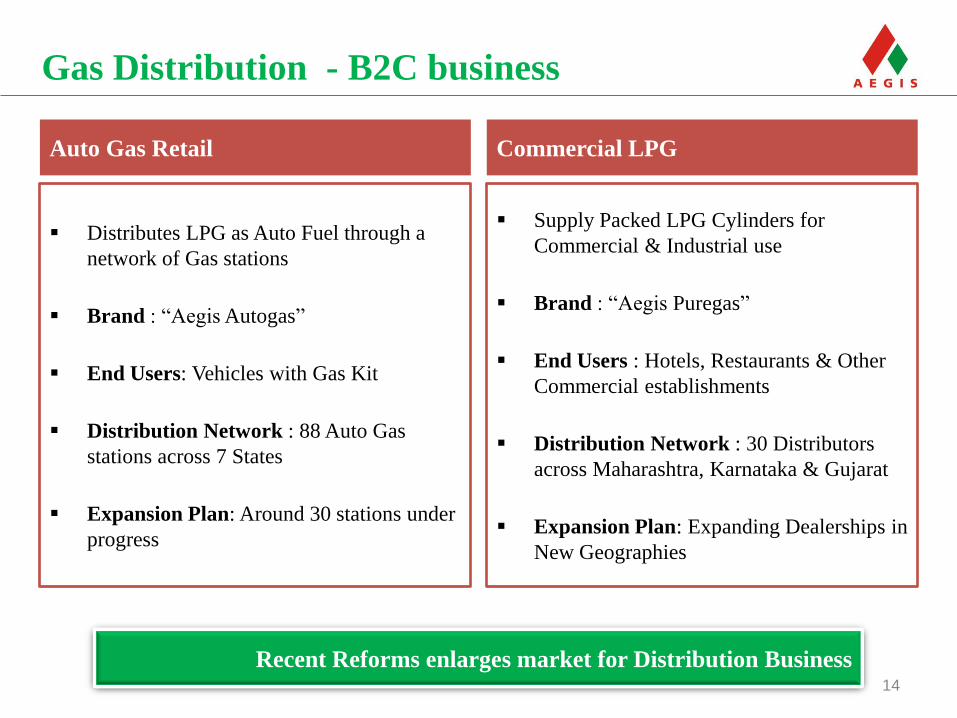
Distributes LPG as Auto Fuel through a
network of Gas stations
Brand : “Aegis Autogas”
End Users: Vehicles with Gas Kit
Distribution Network : 88 Auto Gas
stations across 7 States
Expansion Plan: Around 30 stations under
progress
Auto Gas Retail
Supply Packed LPG Cylinders for
Commercial & Industrial use
Brand : “Aegis Puregas”
End Users : Hotels, Restaurants & Other
Commercial establishments
Distribution Network : 30 Distributors
across Maharashtra, Karnataka & Gujarat
Expansion Plan: Expanding Dealerships in
New Geographies
Commercial LPG
Gas Distribution - B2C business
Recent Reforms enlarges market for Distribution Business
Liquid Division 7
Contents
15
Gas Division 11
Key Strengths & Growth Drivers 16
Financial Highlights 22
Business Overview 3
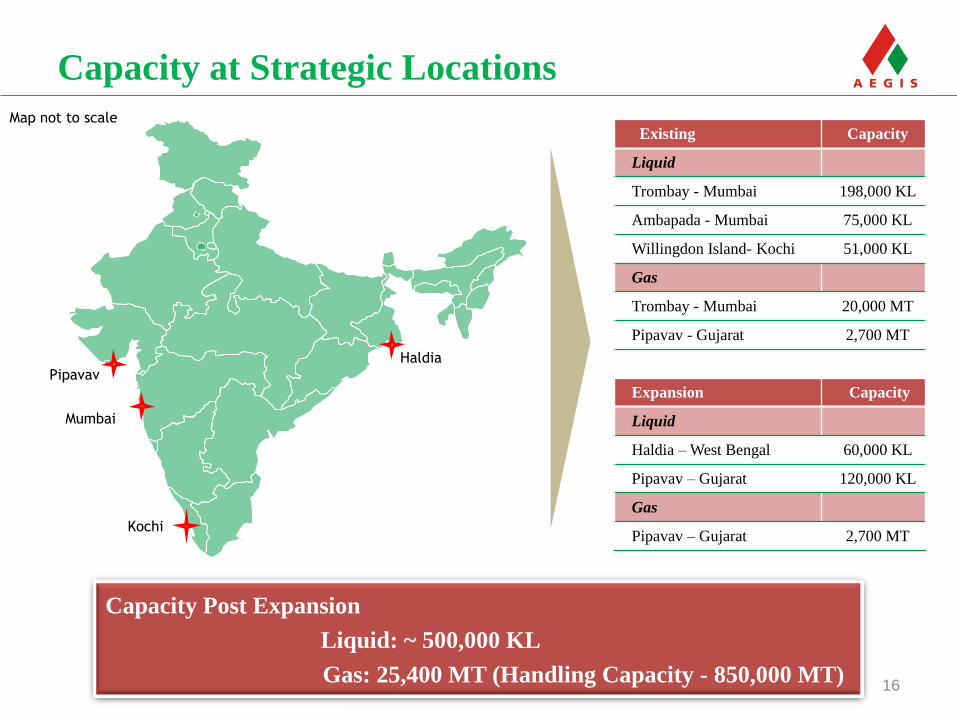
Capacity at Strategic Locations
16
Kochi
Pipavav
Mumbai
Haldia
Map not to scale
Capacity Post Expansion
Liquid: ~ 500,000 KL
Gas: 25,400 MT (Handling Capacity - 850,000 MT)
Existing Capacity
Liquid
Trombay - Mumbai 198,000 KL
Ambapada - Mumbai 75,000 KL
Willingdon Island- Kochi 51,000 KL
Gas
Trombay - Mumbai 20,000 MT
Pipavav - Gujarat 2,700 MT
Expansion Capacity
Liquid
Haldia – West Bengal 60,000 KL
Pipavav – Gujarat 120,000 KL
Gas
Pipavav – Gujarat 2,700 MT
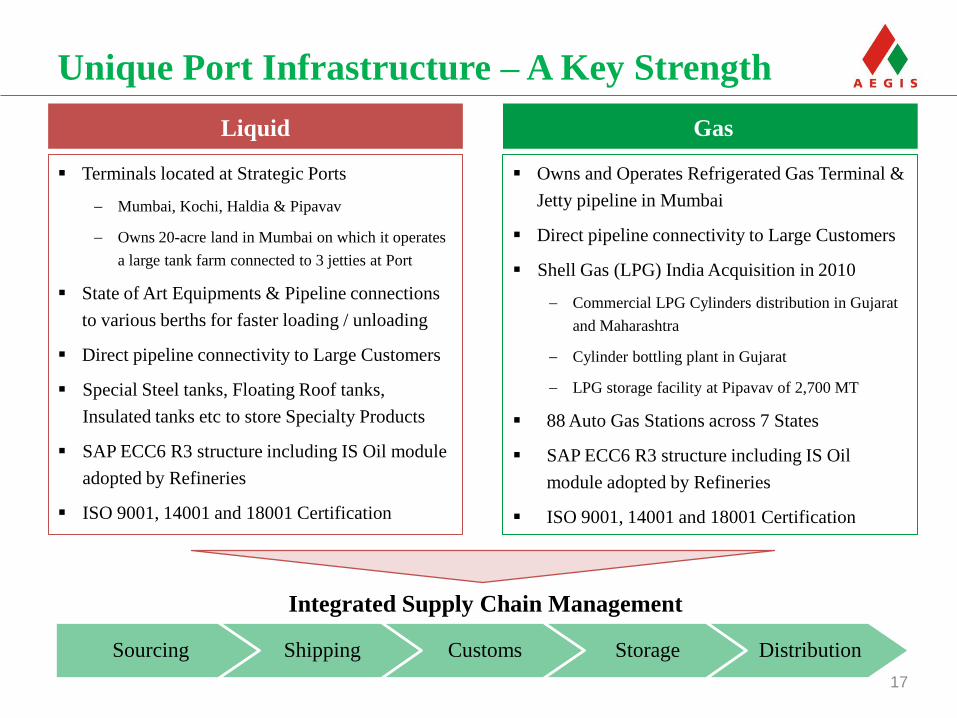
Unique Port Infrastructure – A Key Strength
17
Sourcing Shipping Customs Storage Distribution
Liquid Gas
Terminals located at Strategic Ports
Mumbai, Kochi, Haldia & Pipavav
Owns 20-acre land in Mumbai on which it operates
a large tank farm connected to 3 jetties at Port
State of Art Equipments & Pipeline connections
to various berths for faster loading / unloading
Direct pipeline connectivity to Large Customers
Special Steel tanks, Floating Roof tanks,
Insulated tanks etc to store Specialty Products
SAP ECC6 R3 structure including IS Oil module
adopted by Refineries
ISO 9001, 14001 and 18001 Certification
Owns and Operates Refrigerated Gas Terminal &
Jetty pipeline in Mumbai
Direct pipeline connectivity to Large Customers
Shell Gas (LPG) India Acquisition in 2010
Commercial LPG Cylinders distribution in Gujarat
and Maharashtra
Cylinder bottling plant in Gujarat
LPG storage facility at Pipavav of 2,700 MT
88 Auto Gas Stations across 7 States
SAP ECC6 R3 structure including IS Oil
module adopted by Refineries
ISO 9001, 14001 and 18001 Certification
Integrated Supply Chain Management
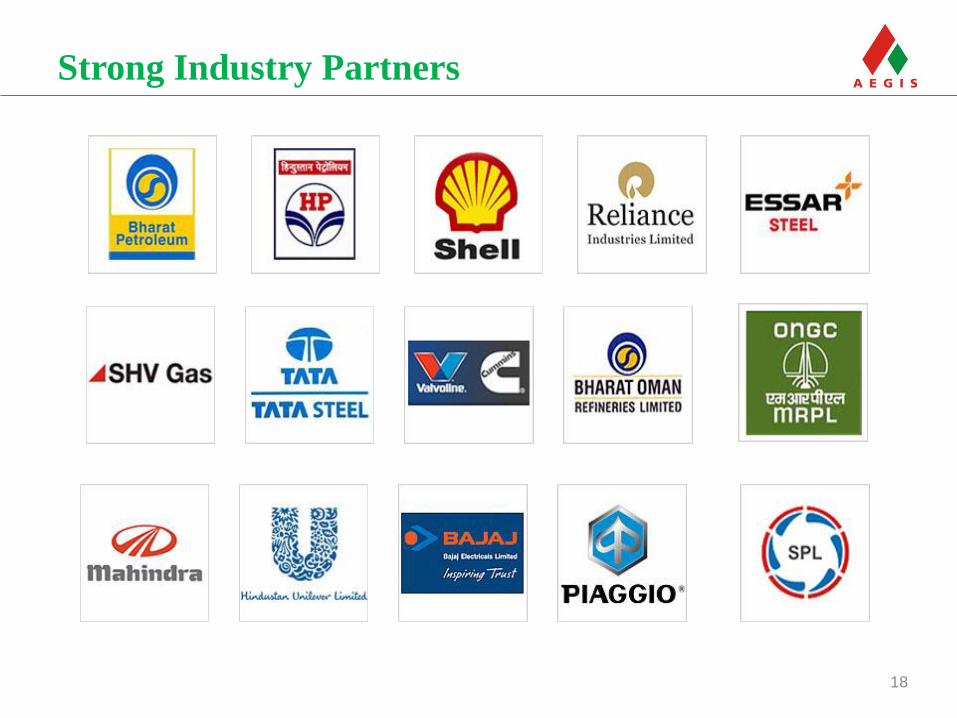
Strong Industry Partners
18
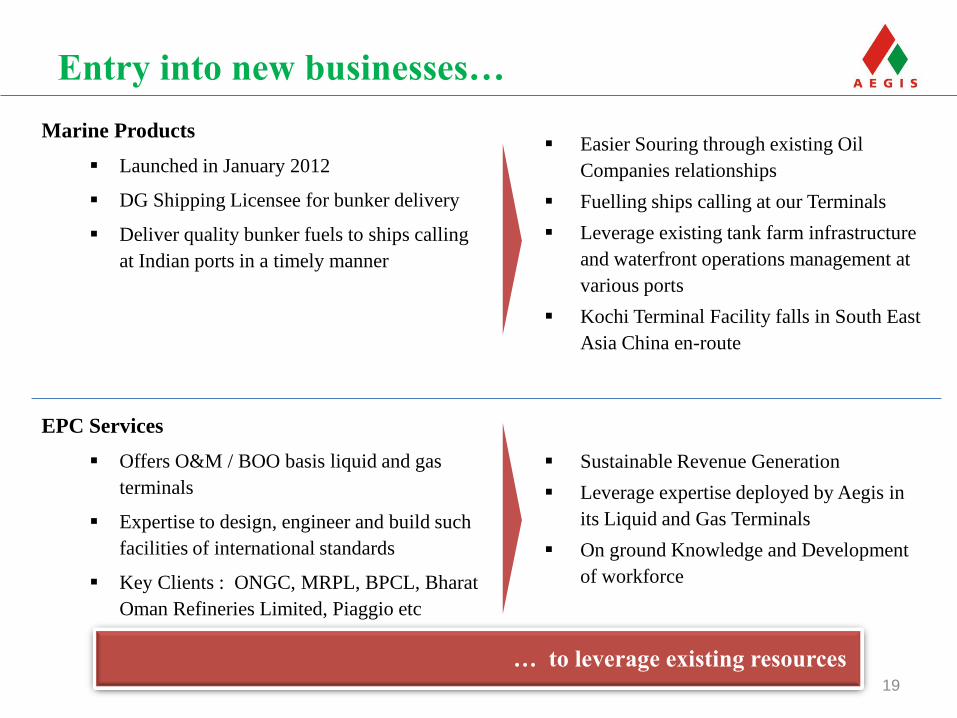
Entry into new businesses…
Marine Products
Launched in January 2012
DG Shipping Licensee for bunker delivery
Deliver quality bunker fuels to ships calling
at Indian ports in a timely manner
19
Easier Souring through existing Oil
Companies relationships
Fuelling ships calling at our Terminals
Leverage existing tank farm infrastructure
and waterfront operations management at
various ports
Kochi Terminal Facility falls in South East
Asia China en-route
EPC Services
Offers O&M / BOO basis liquid and gas
terminals
Expertise to design, engineer and build such
facilities of international standards
Key Clients : ONGC, MRPL, BPCL, Bharat
Oman Refineries Limited, Piaggio etc
Sustainable Revenue Generation
Leverage expertise deployed by Aegis in
its Liquid and Gas Terminals
On ground Knowledge and Development
of workforce
… to leverage existing resources
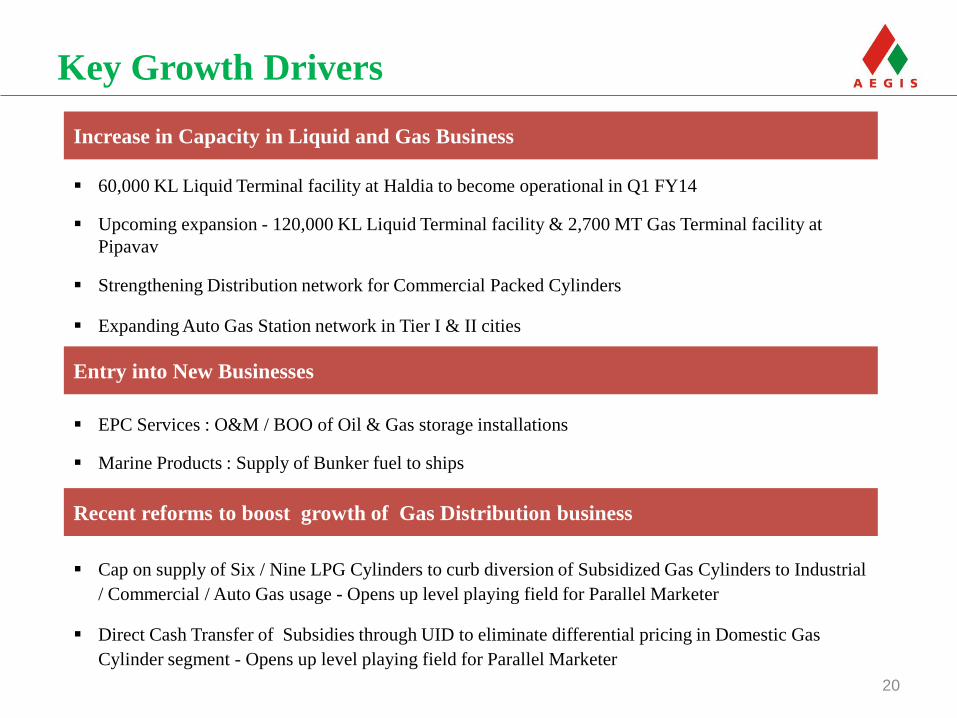
Key Growth Drivers
Cap on supply of Six / Nine LPG Cylinders to curb diversion of Subsidized Gas Cylinders to Industrial
/ Commercial / Auto Gas usage - Opens up level playing field for Parallel Marketer
Direct Cash Transfer of Subsidies through UID to eliminate differential pricing in Domestic Gas
Cylinder segment - Opens up level playing field for Parallel Marketer
20
Increase in Capacity in Liquid and Gas Business
Entry into New Businesses
Recent reforms to boost growth of Gas Distribution business
60,000 KL Liquid Terminal facility at Haldia to become operational in Q1 FY14
Upcoming expansion - 120,000 KL Liquid Terminal facility & 2,700 MT Gas Terminal facility at
Pipavav
Strengthening Distribution network for Commercial Packed Cylinders
Expanding Auto Gas Station network in Tier I & II cities
EPC Services : O&M / BOO of Oil & Gas storage installations
Marine Products : Supply of Bunker fuel to ships
Liquid Division 7
Contents
21
Gas Division 11
Key Strengths & Growth Drivers 16
Financial Highlights 22
Business Overview 3
22
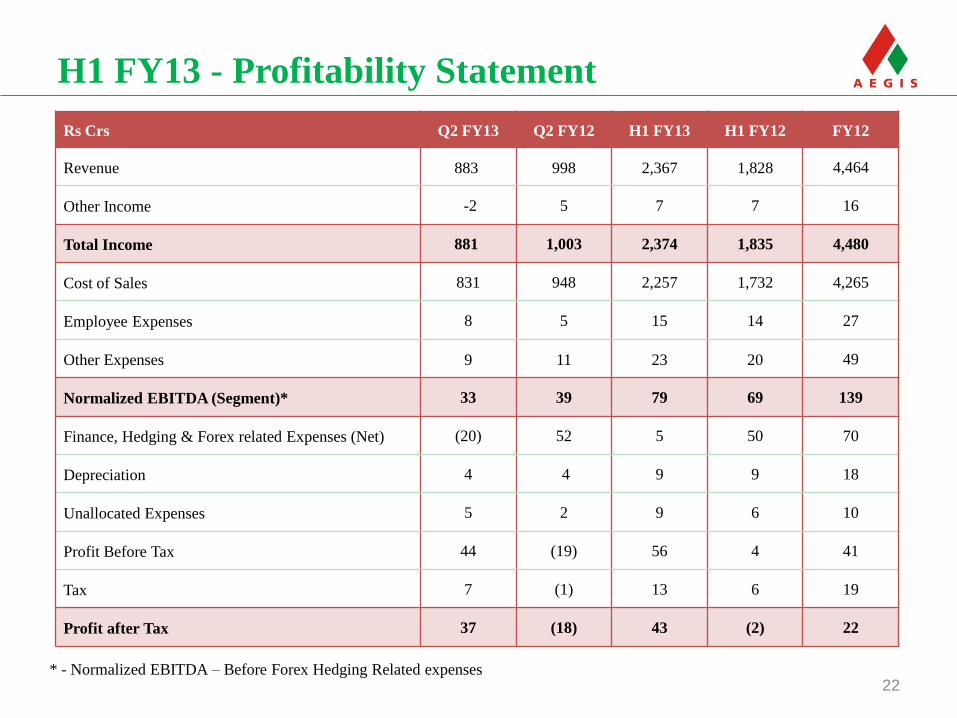
H1 FY13 - Profitability Statement
Rs Crs Q2 FY13 Q2 FY12 H1 FY13 H1 FY12 FY12
Revenue 883 998 2,367 1,828 4,464
Other Income -2 5 7 7 16
Total Income 881 1,003 2,374 1,835 4,480
Cost of Sales 831 948 2,257 1,732 4,265
Employee Expenses 8 5 15 14 27
Other Expenses 9 11 23 20 49
Normalized EBITDA (Segment)* 33 39 79 69 139
Finance, Hedging & Forex related Expenses (Net) (20) 52 5 50 70
Depreciation 4 4 9 9 18
Unallocated Expenses 5 2 9 6 10
Profit Before Tax 44 (19) 56 4 41
Tax 7 (1) 13 6 19
Profit after Tax 37 (18) 43 (2) 22
* - Normalized EBITDA – Before Forex Hedging Related expenses
23
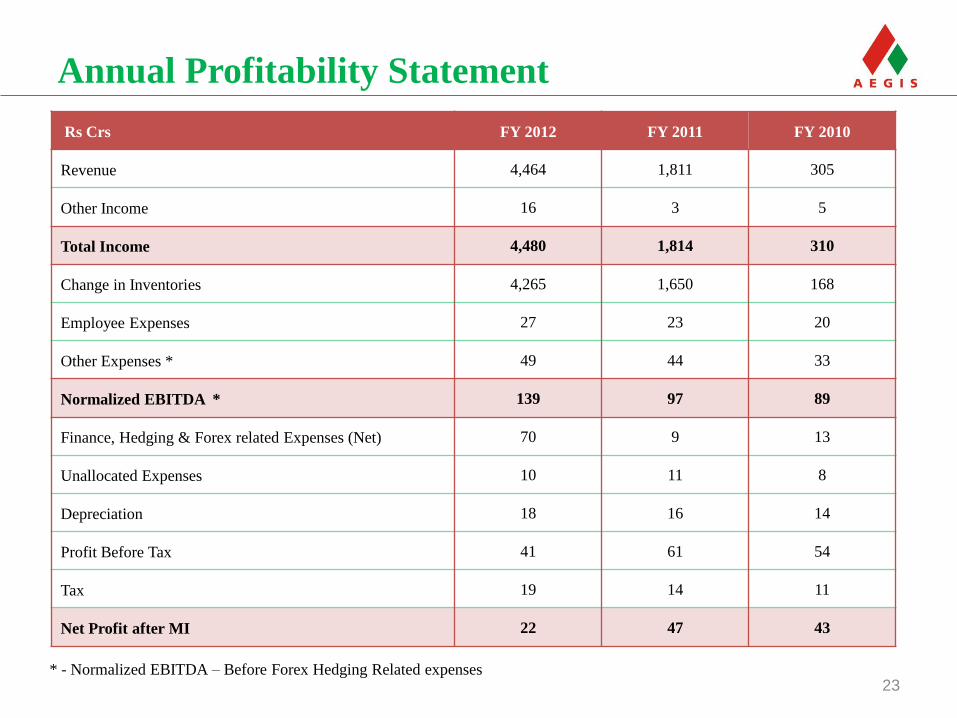
Annual Profitability Statement
Rs Crs FY 2012 FY 2011 FY 2010
Revenue 4,464 1,811 305
Other Income 16 3 5
Total Income 4,480 1,814 310
Change in Inventories 4,265 1,650 168
Employee Expenses 27 23 20
Other Expenses * 49 44 33
Normalized EBITDA * 139 97 89
Finance, Hedging & Forex related Expenses (Net) 70 9 13
Unallocated Expenses 10 11 8
Depreciation 18 16 14
Profit Before Tax 41 61 54
Tax 19 14 11
Net Profit after MI 22 47 43
* - Normalized EBITDA – Before Forex Hedging Related expenses
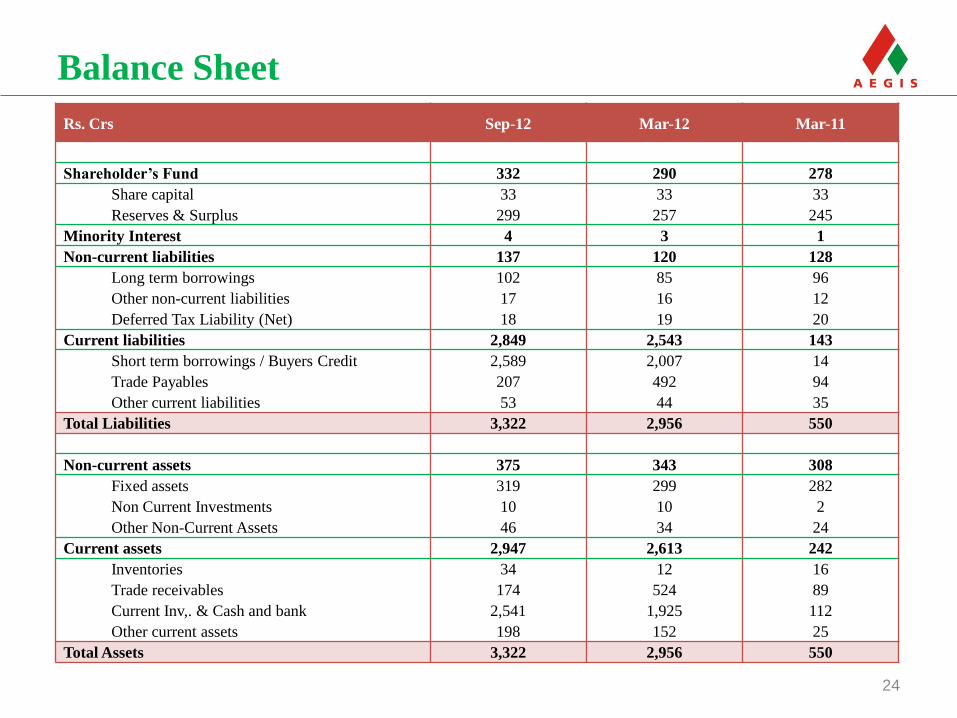
Balance Sheet
Rs. Crs Sep-12 Mar-12 Mar-11
Shareholder’s Fund 332 290 278
Share capital 33 33 33
Reserves & Surplus 299 257 245
Minority Interest 4 3 1
Non-current liabilities 137 120 128
Long term borrowings 102 85 96
Other non-current liabilities 17 16 12
Deferred Tax Liability (Net) 18 19 20
Current liabilities 2,849 2,543 143
Short term borrowings / Buyers Credit 2,589 2,007 14
Trade Payables 207 492 94
Other current liabilities 53 44 35
Total Liabilities 3,322 2,956 550
Non-current assets 375 343 308
Fixed assets 319 299 282
Non Current Investments 10 10 2
Other Non-Current Assets 46 34 24
Current assets 2,947 2,613 242
Inventories 34 12 16
Trade receivables 174 524 89
Current Inv,. & Cash and bank 2,541 1,925 112
Other current assets 198 152 25
Total Assets 3,322 2,956 550
24
25
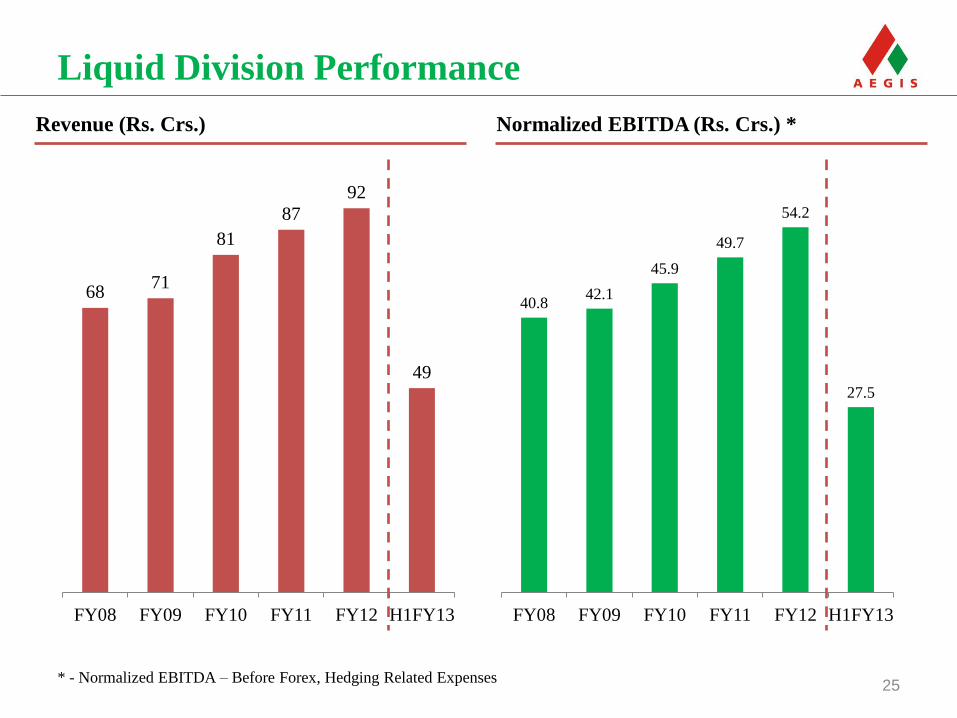
Liquid Division Performance
68 71
81
87
92
49
FY08 FY09 FY10 FY11 FY12 H1FY13
40.8 42.1
45.9
49.7
54.2
27.5
FY08 FY09 FY10 FY11 FY12 H1FY13
Revenue (Rs. Crs.) Normalized EBITDA (Rs. Crs.) *
* - Normalized EBITDA – Before Forex, Hedging Related Expenses
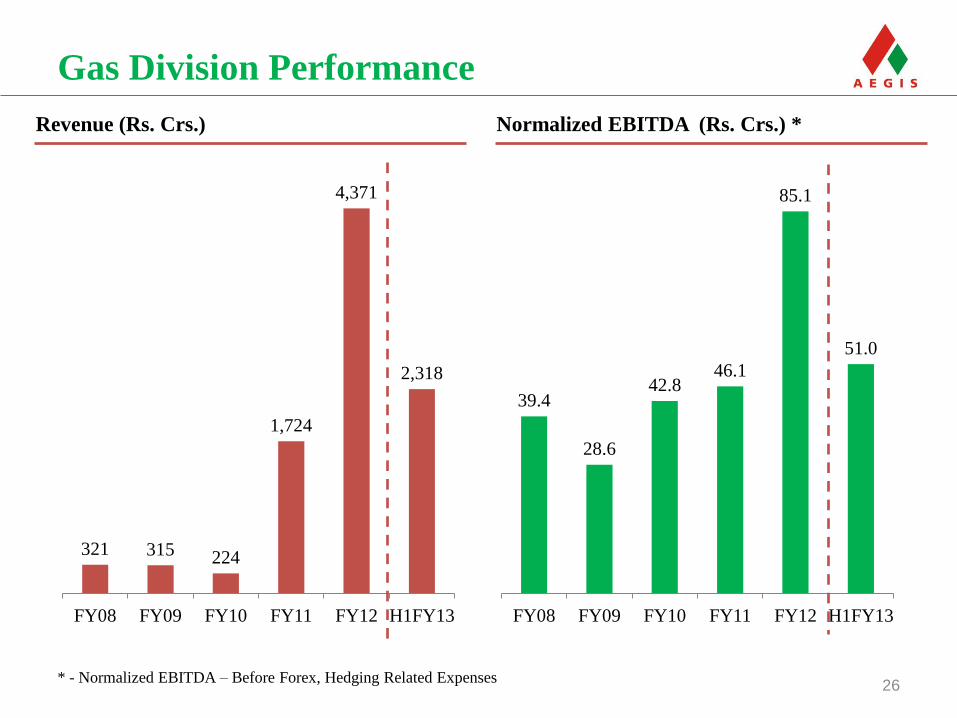
39.4
28.6
42.8 46.1
85.1
51.0
FY08 FY09 FY10 FY11 FY12 H1FY13
321 315 224
1,724
4,371
2,318
FY08 FY09 FY10 FY11 FY12 H1FY13
26
Gas Division Performance
Revenue (Rs. Crs.) Normalized EBITDA (Rs. Crs.) *
* - Normalized EBITDA – Before Forex, Hedging Related Expenses
27
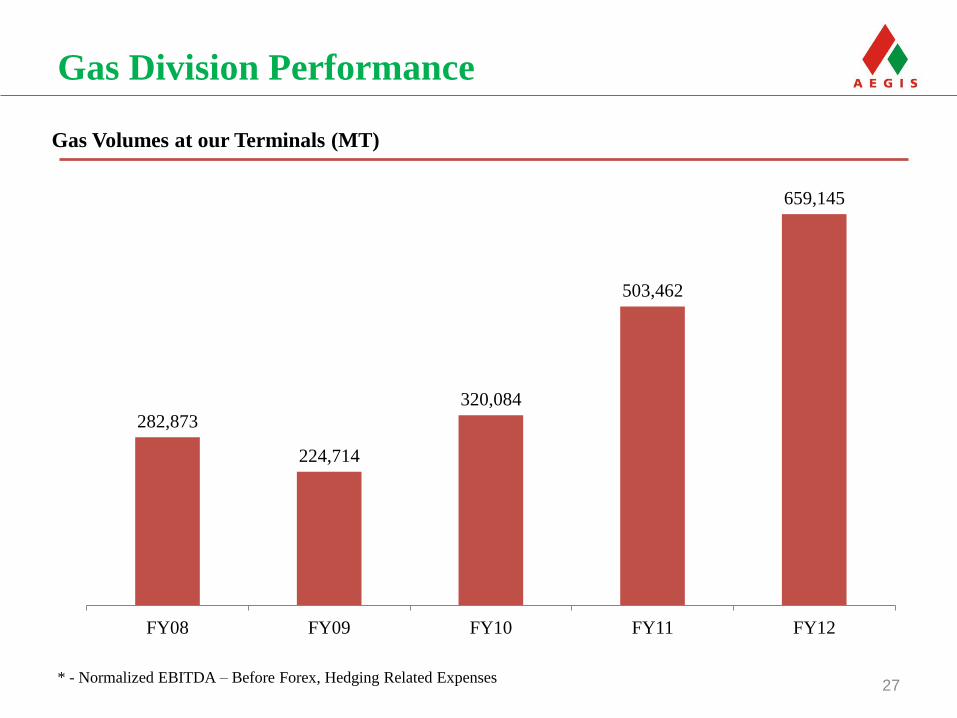
Gas Division Performance
* - Normalized EBITDA – Before Forex, Hedging Related Expenses
282,873
224,714
320,084
503,462
659,145
FY08 FY09 FY10 FY11 FY12
Gas Volumes at our Terminals (MT)
28
For further information, please contact:
Company : Investor Relations Advisors :
Aegis Logistics Limited
Mr. B. I. Gosalia, CFO
www.aegisindia.com
Strategic Growth Advisors Pvt. Ltd.
Mr. Gaurang Vasani/Ms. Payal Dave
www.sgapl.net