Embed Size (px)
Citation preview
AEGEAN MARINE PETROLEUM NETWORK INC. 2
Cautionary Statement
This presentation contains forward-looking statements concerning plans, objectives, goals, strategies, future events or performance, and underlying assumptions and other statements, which are other than statements of historical facts. The Private Securities Litigation Reform Act of 1995 provides safe harbor protections for forward-looking statements and we desire to take advantage of such safe harbor legislation. The forward-looking statements in this report are based upon various assumptions, many of which are based, in turn, upon further assumptions, including without limitation, management's examination of historical operating trends, data contained in our records and other data available from third parties. Important assumptions relating to the forward-looking statements include, among other things, assumptions regarding demand for our products, the cost and availability of refined marine fuel from suppliers, pricing levels, the timing and cost of capital expenditures, competitive conditions, and general economic conditions. These assumptions could prove inaccurate. Although we believe that these assumptions were reasonable when made, because these assumptions are inherently subject to significant uncertainties and contingencies which are difficult or impossible to predict and are beyond our control, we cannot assure you that we will achieve or accomplish these expectations, beliefs or projections.
For a more comprehensive discussion of the risk factors affecting our business please see our Annual Report on Form 20-F and other reports filed with the U.S. Securities and Exchange Commission, a copy of which can be found on our website www.ampni.com. Unless required by law, we disclaim any obligation to update any forward-looking statements contained in this presentation, whether as a result of new information, future events, a change in our views or expatiations, to conform them to actual results or otherwise.
In addition, this presentation contains unaudited financial information related to our financial statements. The information provided is for indicative purposes only. Unless required by law, we undertake no obligation to update or revise any such information.
Non-GAAP Financial Measures
Within this presentation, the Company makes reference to certain non-GAAP financial measures, which have directly comparable GAAP financial measures as identified in this presentation. These non-GAAP measures are provided because they are used as standard metrics by the investment community. We believe these measures will assist the investment community in properly assessing the underlying performance of the Company.
AEGEAN MARINE PETROLEUM NETWORK INC.
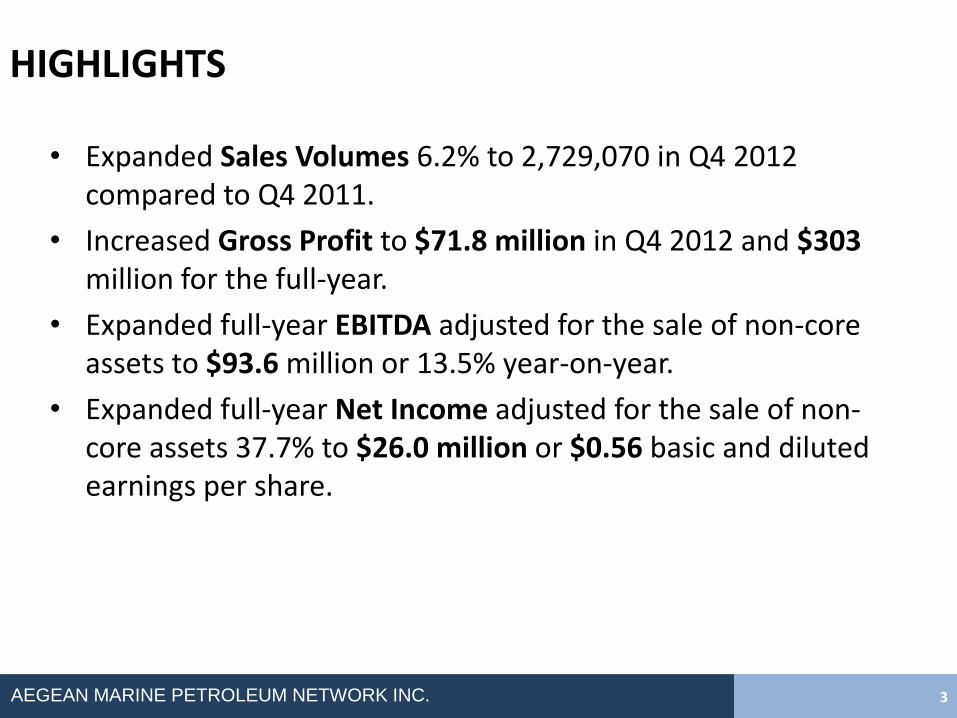
HIGHLIGHTS
• Expanded Sales Volumes 6.2% to 2,729,070 in Q4 2012 compared to Q4 2011.
• Increased Gross Profit to $71.8 million in Q4 2012 and $303 million for the full-year.
• Expanded full-year EBITDA adjusted for the sale of non-core assets to $93.6 million or 13.5% year-on-year.
• Expanded full-year Net Income adjusted for the sale of non-core assets 37.7% to $26.0 million or $0.56 basic and diluted earnings per share.
3
AEGEAN MARINE PETROLEUM NETWORK INC.
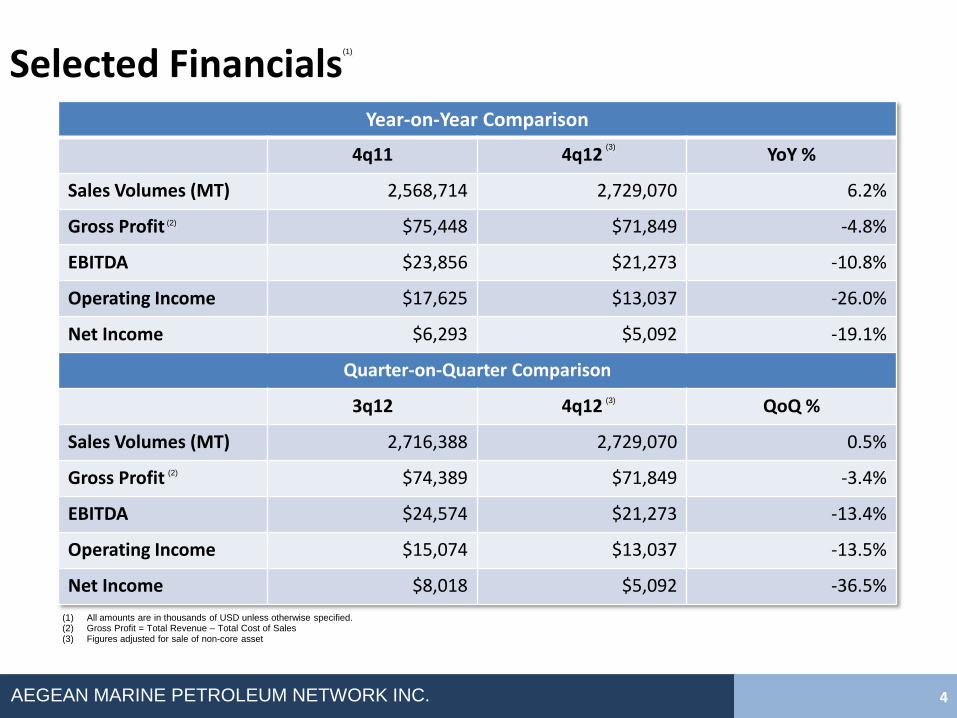
Selected Financials
4
Year-on-Year Comparison
4q11 4q12 YoY %
Sales Volumes (MT) 2,568,714 2,729,070 6.2%
Gross Profit $75,448 $71,849 -4.8%
EBITDA $23,856 $21,273 -10.8%
Operating Income $17,625 $13,037 -26.0%
Net Income $6,293 $5,092 -19.1%
Quarter-on-Quarter Comparison
3q12 4q12 QoQ %
Sales Volumes (MT) 2,716,388 2,729,070 0.5%
Gross Profit $74,389 $71,849 -3.4%
EBITDA $24,574 $21,273 -13.4%
Operating Income $15,074 $13,037 -13.5%
Net Income $8,018 $5,092 -36.5%
(1) All amounts are in thousands of USD unless otherwise specified. (2) Gross Profit = Total Revenue – Total Cost of Sales (3) Figures adjusted for sale of non-core asset
(2)
(2)
(1)
(3)
(3)
AEGEAN MARINE PETROLEUM NETWORK INC.
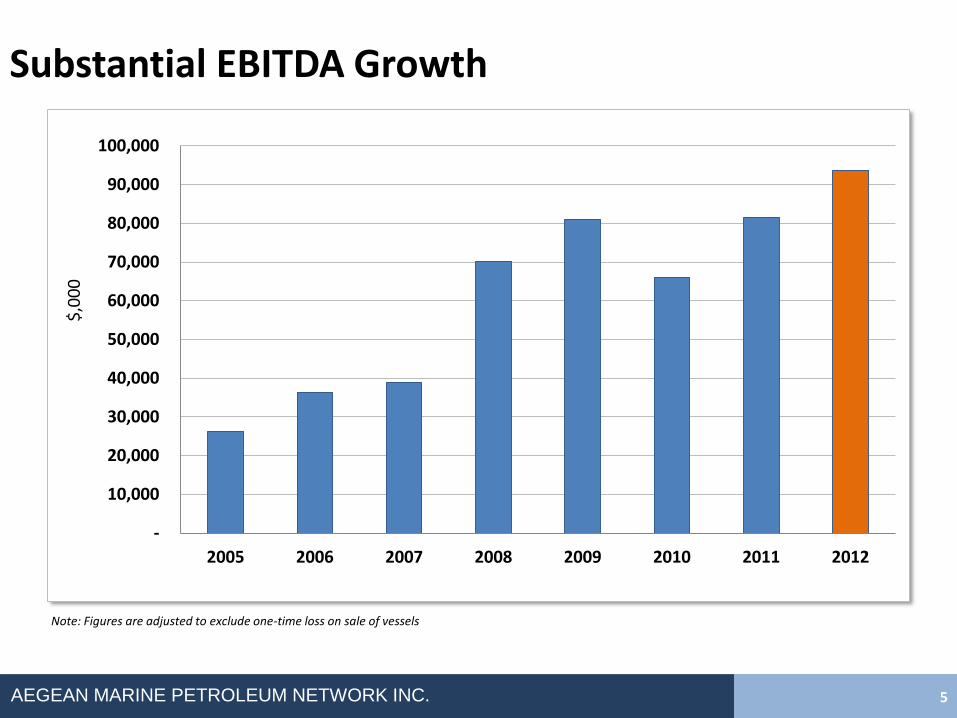
Substantial EBITDA Growth
-
10,000
20,000
30,000
40,000
50,000
60,000
70,000
80,000
90,000
100,000
2005 2006 2007 2008 2009 2010 2011 2012
$,0
00
5
Note: Figures are adjusted to exclude one-time loss on sale of vessels
AEGEAN MARINE PETROLEUM NETWORK INC.
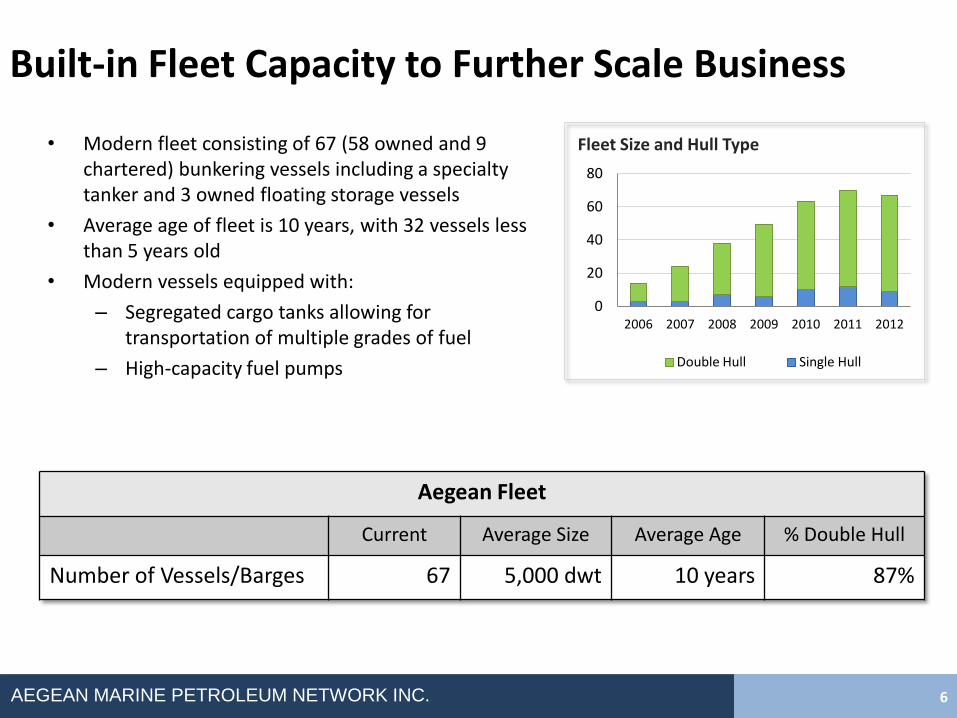
Built-in Fleet Capacity to Further Scale Business
• Modern fleet consisting of 67 (58 owned and 9 chartered) bunkering vessels including a specialty tanker and 3 owned floating storage vessels
• Average age of fleet is 10 years, with 32 vessels less than 5 years old
• Modern vessels equipped with:
– Segregated cargo tanks allowing for transportation of multiple grades of fuel
– High-capacity fuel pumps
6
Aegean Fleet
Current Average Size Average Age % Double Hull
Number of Vessels/Barges 67 5,000 dwt 10 years 87%
0
20
40
60
80
2006 2007 2008 2009 2010 2011 2012
Fleet Size and Hull Type
Double Hull Single Hull
AEGEAN MARINE PETROLEUM NETWORK INC.
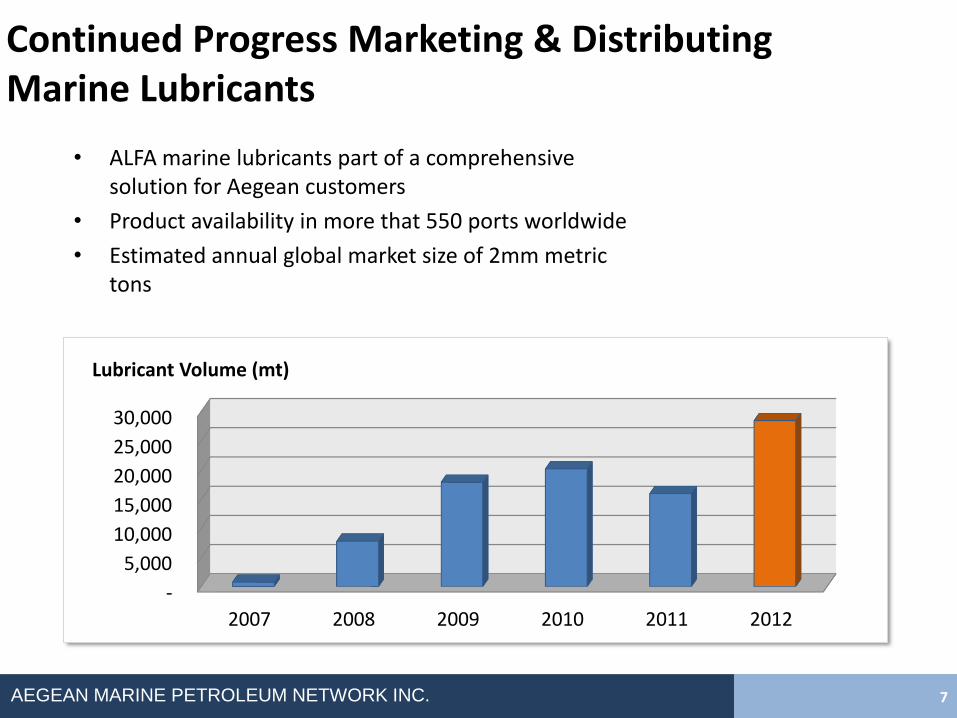
Continued Progress Marketing & Distributing Marine Lubricants
-
5,000
10,000
15,000
20,000
25,000
30,000
2007 2008 2009 2010 2011 2012
Lubricant Volume (mt)
7
• ALFA marine lubricants part of a comprehensive solution for Aegean customers
• Product availability in more that 550 ports worldwide
• Estimated annual global market size of 2mm metric tons
AEGEAN MARINE PETROLEUM NETWORK INC.
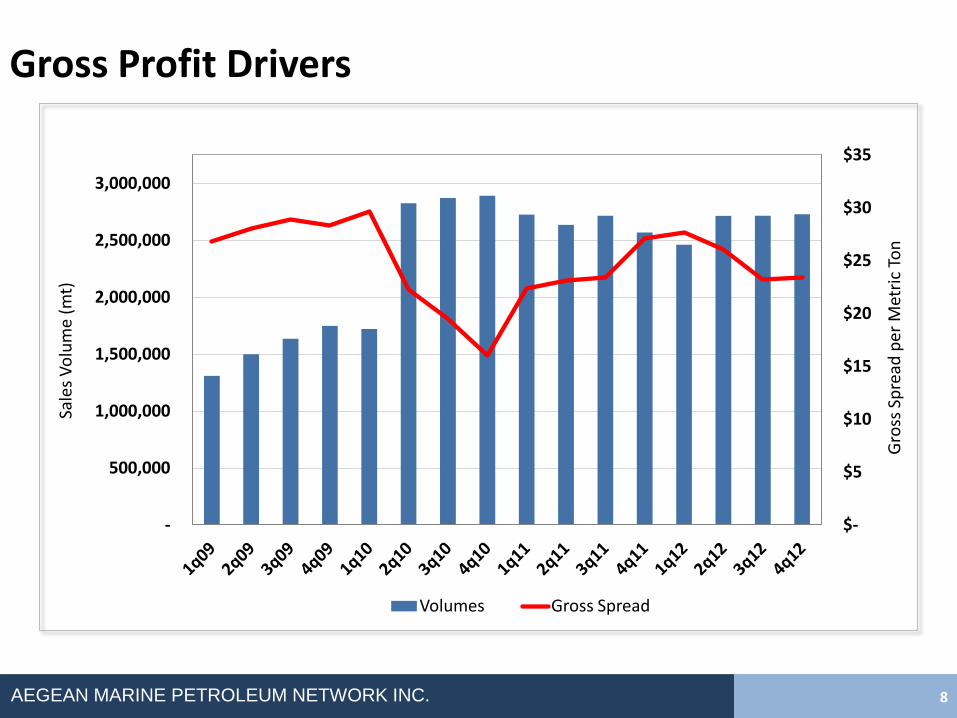
Gross Profit Drivers
$-
$5
$10
$15
$20
$25
$30
$35
-
500,000
1,000,000
1,500,000
2,000,000
2,500,000
3,000,000
Gro
ss S
pre
ad p
er M
etri
c To
n
Sale
s V
olu
me
(mt)
Volumes Gross Spread
8
AEGEAN MARINE PETROLEUM NETWORK INC.
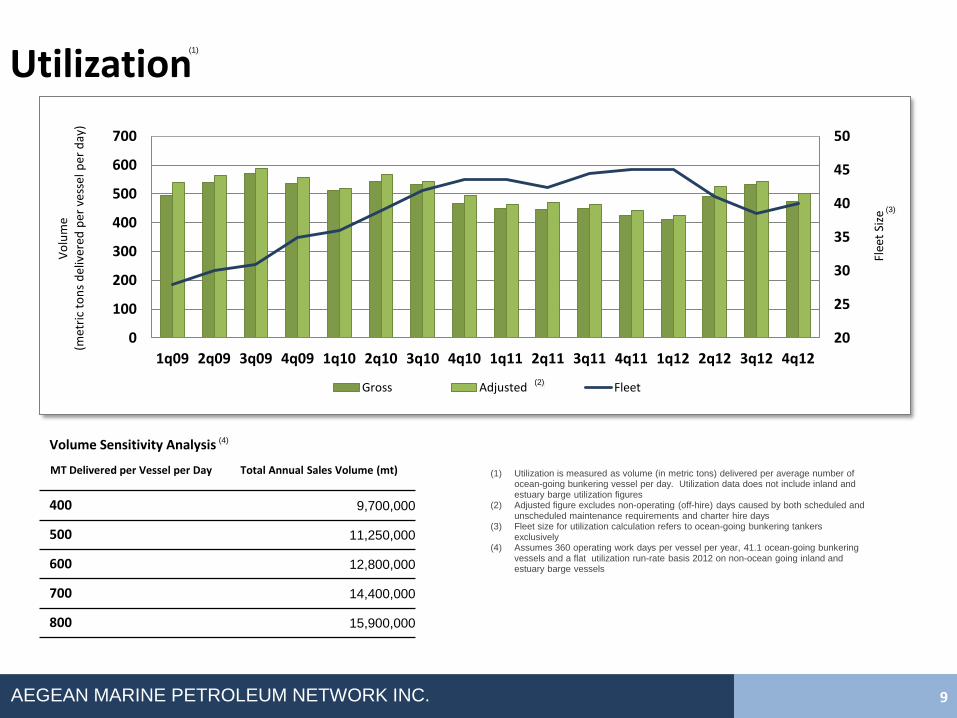
Utilization
20
25
30
35
40
45
50
0
100
200
300
400
500
600
700
1q09 2q09 3q09 4q09 1q10 2q10 3q10 4q10 1q11 2q11 3q11 4q11 1q12 2q12 3q12 4q12
Flee
t Si
ze
Vo
lum
e
(met
ric
ton
s d
eliv
ered
per
ves
sel p
er d
ay)
Gross Adjusted Fleet
9
(1) Utilization is measured as volume (in metric tons) delivered per average number of
ocean-going bunkering vessel per day. Utilization data does not include inland and estuary barge utilization figures
(2) Adjusted figure excludes non-operating (off-hire) days caused by both scheduled and unscheduled maintenance requirements and charter hire days
(3) Fleet size for utilization calculation refers to ocean-going bunkering tankers exclusively
(4) Assumes 360 operating work days per vessel per year, 41.1 ocean-going bunkering vessels and a flat utilization run-rate basis 2012 on non-ocean going inland and estuary barge vessels
(1)
(2)
(3)
(4) Volume Sensitivity Analysis
MT Delivered per Vessel per Day Total Annual Sales Volume (mt)
400 9,700,000
500 11,250,000
600 12,800,000
700 14,400,000
800 15,900,000
AEGEAN MARINE PETROLEUM NETWORK INC.
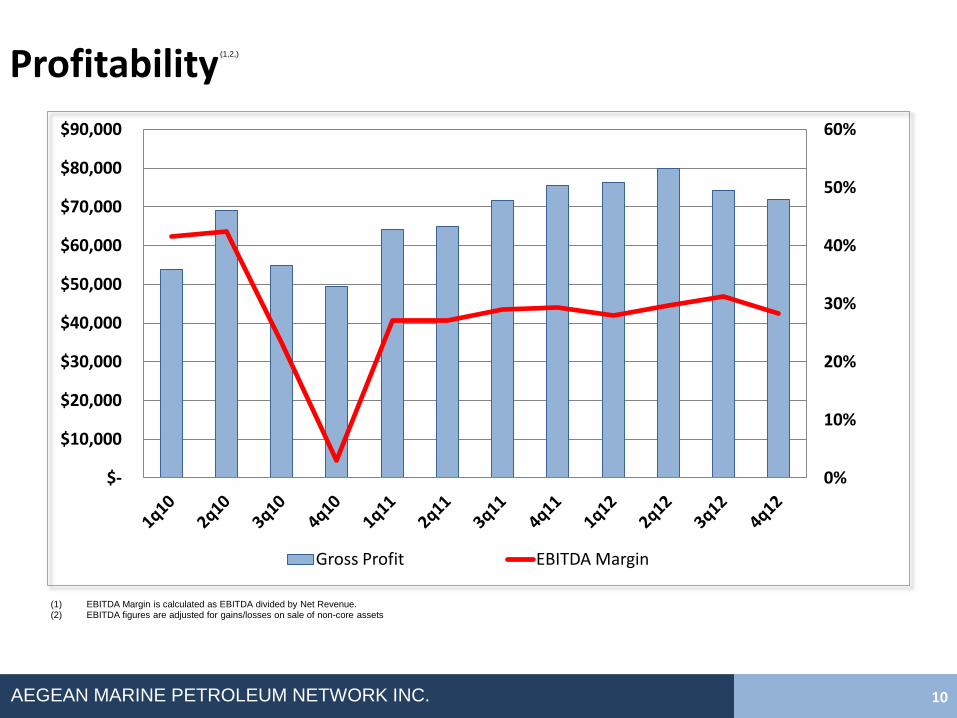
Profitability
0%
10%
20%
30%
40%
50%
60%
$-
$10,000
$20,000
$30,000
$40,000
$50,000
$60,000
$70,000
$80,000
$90,000
Gross Profit EBITDA Margin
10
(1) EBITDA Margin is calculated as EBITDA divided by Net Revenue. (2) EBITDA figures are adjusted for gains/losses on sale of non-core assets
(1,2,)
AEGEAN MARINE PETROLEUM NETWORK INC.
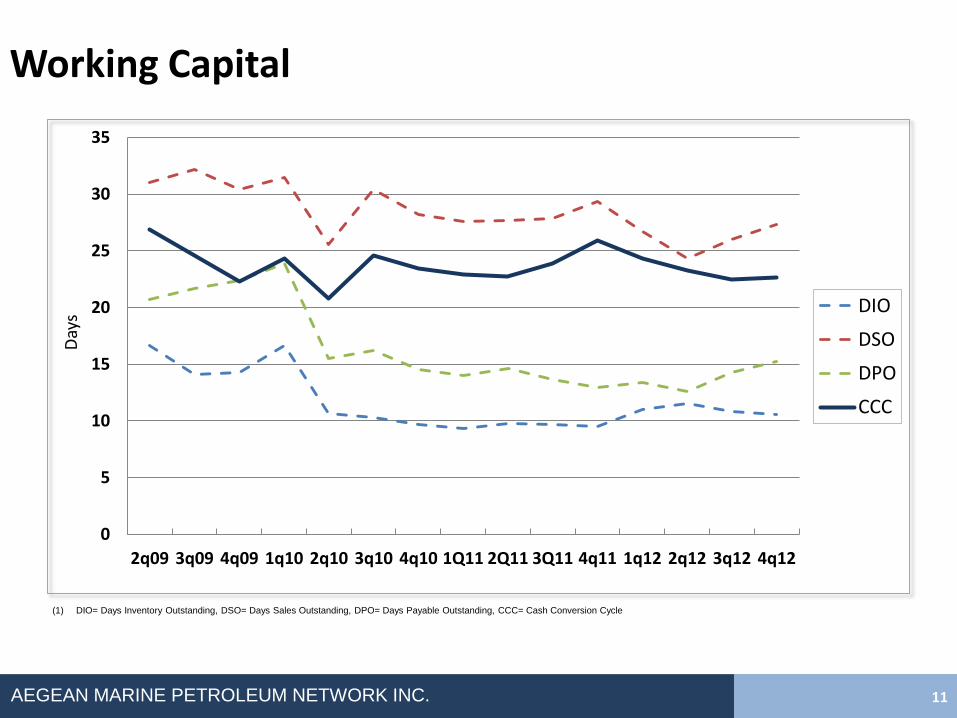
Working Capital
0
5
10
15
20
25
30
35
2q09 3q09 4q09 1q10 2q10 3q10 4q10 1Q11 2Q11 3Q11 4q11 1q12 2q12 3q12 4q12
Day
s
DIO
DSO
DPO
CCC
11
(1) DIO= Days Inventory Outstanding, DSO= Days Sales Outstanding, DPO= Days Payable Outstanding, CCC= Cash Conversion Cycle
AEGEAN MARINE PETROLEUM NETWORK INC.
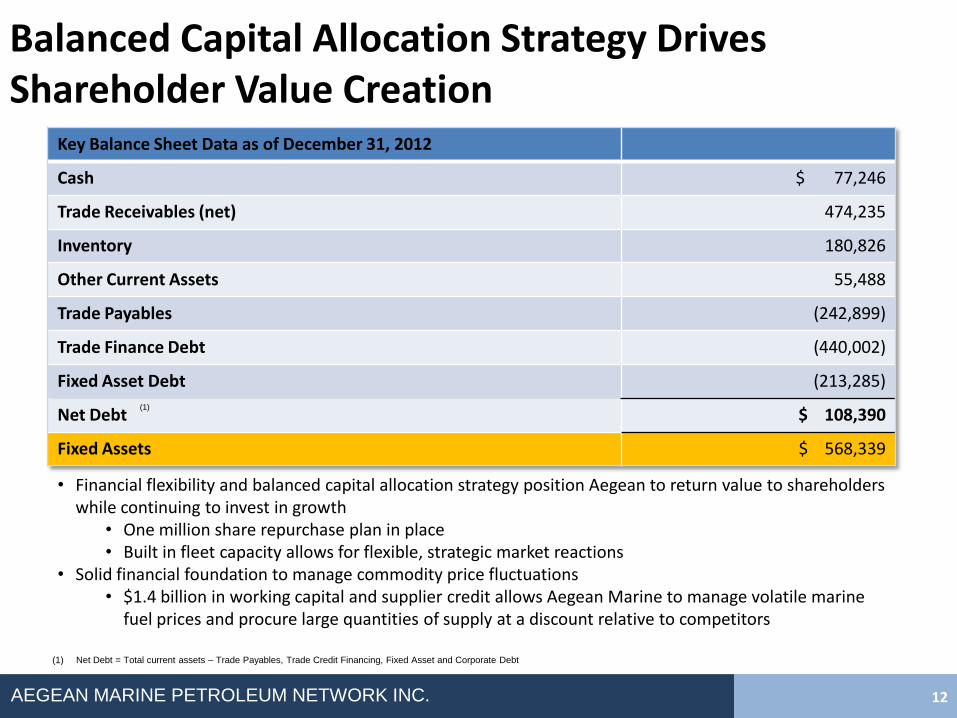
Balanced Capital Allocation Strategy Drives Shareholder Value Creation
Key Balance Sheet Data as of December 31, 2012
Cash $ 77,246
Trade Receivables (net) 474,235
Inventory 180,826
Other Current Assets 55,488
Trade Payables (242,899)
Trade Finance Debt (440,002)
Fixed Asset Debt (213,285)
Net Debt $ 108,390
Fixed Assets $ 568,339
12
• Financial flexibility and balanced capital allocation strategy position Aegean to return value to shareholders while continuing to invest in growth
• One million share repurchase plan in place • Built in fleet capacity allows for flexible, strategic market reactions
• Solid financial foundation to manage commodity price fluctuations • $1.4 billion in working capital and supplier credit allows Aegean Marine to manage volatile marine
fuel prices and procure large quantities of supply at a discount relative to competitors
(1)
(1) Net Debt = Total current assets – Trade Payables, Trade Credit Financing, Fixed Asset and Corporate Debt
AEGEAN MARINE PETROLEUM NETWORK INC.
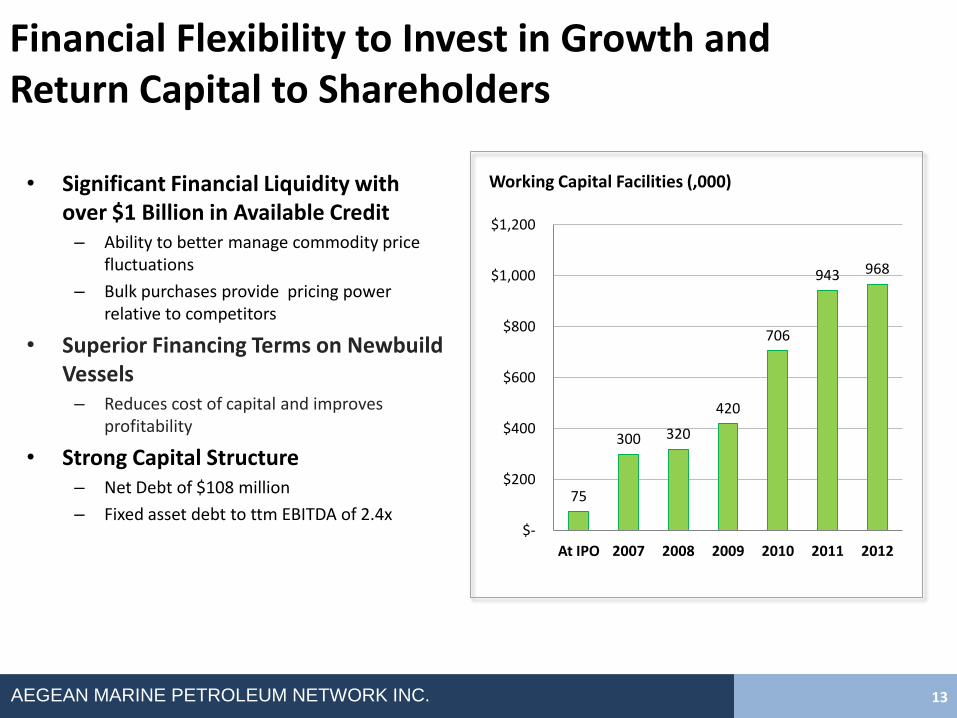
Financial Flexibility to Invest in Growth and Return Capital to Shareholders
13
• Significant Financial Liquidity with over $1 Billion in Available Credit
– Ability to better manage commodity price fluctuations
– Bulk purchases provide pricing power relative to competitors
• Superior Financing Terms on Newbuild Vessels
– Reduces cost of capital and improves profitability
• Strong Capital Structure – Net Debt of $108 million
– Fixed asset debt to ttm EBITDA of 2.4x 75
300 320
420
706
943 968
$-
$200
$400
$600
$800
$1,000
$1,200
At IPO 2007 2008 2009 2010 2011 2012
Working Capital Facilities (,000)
AEGEAN MARINE PETROLEUM NETWORK INC.
Creating Long Term Value by Entering New Markets, Diversifying Revenue and Enhancing Flexibility
• Strategically expanding global footprint, driving business revenues and increasing global market share
• Scalable global network allows for increased asset utilization and flexibility as macro conditions improve
• Strategically located storage capacity diversifies business by providing opportunities to generate substantial income from leasing storage space to third parties
• Strengthening integrated marine fuel logistics chain via strategic expansion and disposition of older non-core assets
– 10 vessels sold to date yielding a savings of approximately $20m in annual operating expense
14
AEGEAN MARINE PETROLEUM NETWORK INC.
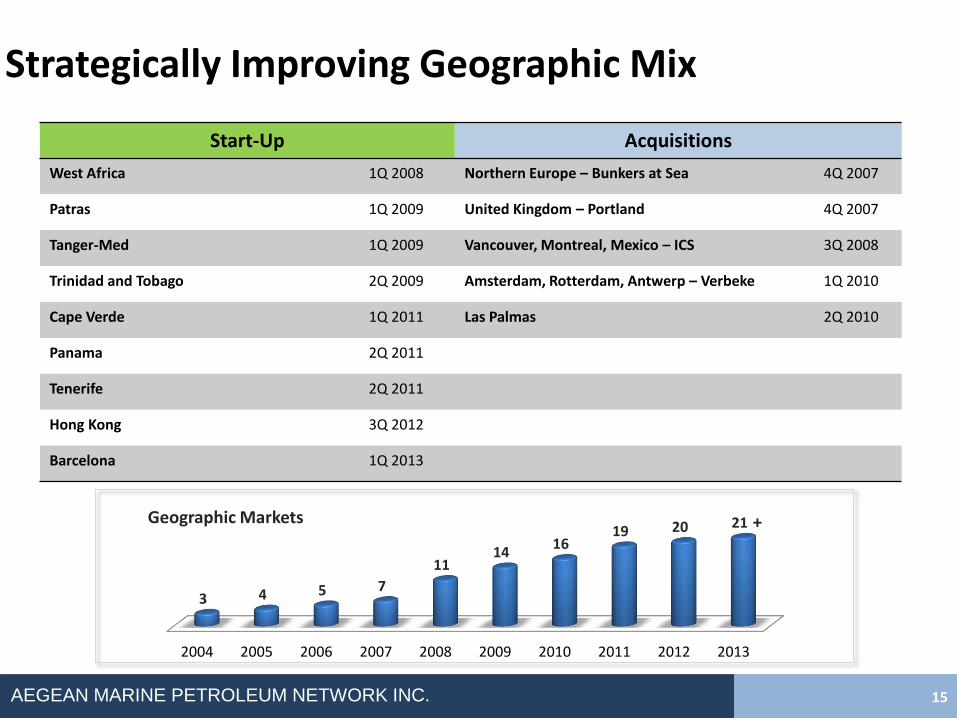
Strategically Improving Geographic Mix
15
Start-Up Acquisitions
West Africa 1Q 2008 Northern Europe – Bunkers at Sea 4Q 2007
Patras 1Q 2009 United Kingdom – Portland 4Q 2007
Tanger-Med 1Q 2009 Vancouver, Montreal, Mexico – ICS 3Q 2008
Trinidad and Tobago 2Q 2009 Amsterdam, Rotterdam, Antwerp – Verbeke 1Q 2010
Cape Verde 1Q 2011 Las Palmas 2Q 2010
Panama 2Q 2011
Tenerife 2Q 2011
Hong Kong 3Q 2012
Barcelona 1Q 2013
2004 2005 2006 2007 2008 2009 2010 2011 2012 2013
3 4 5 7
11 14
16 19 20 21 Geographic Markets +
AEGEAN MARINE PETROLEUM NETWORK INC.
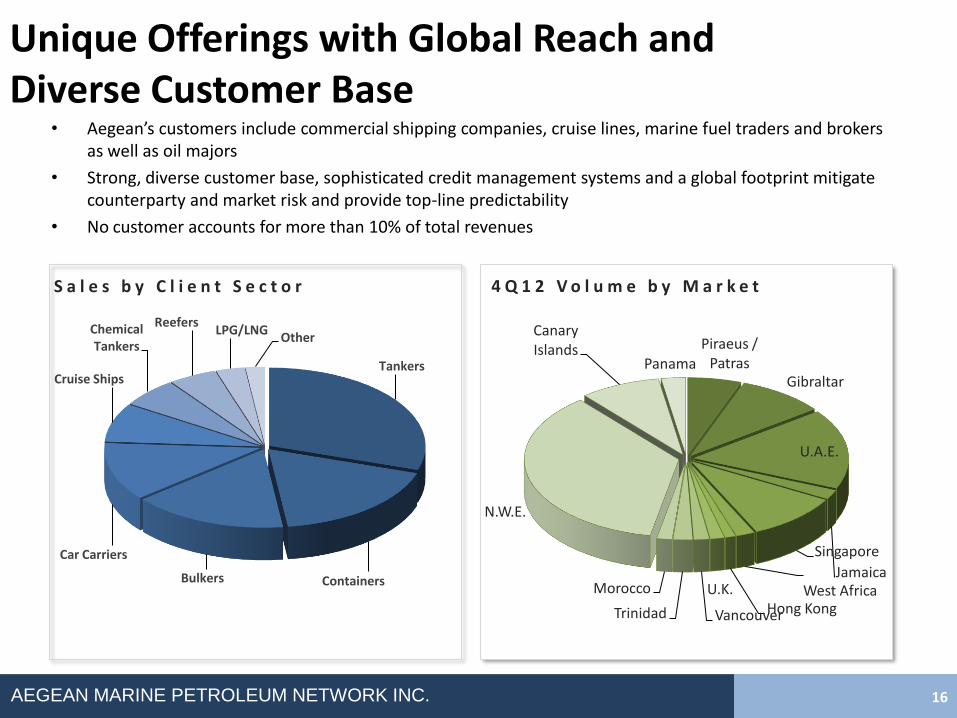
Unique Offerings with Global Reach and Diverse Customer Base
16
Tankers
Containers Bulkers
Car Carriers
Cruise Ships
Chemical Tankers
Reefers LPG/LNG
Other
S a l e s b y C l i e n t S e c t o r
• Aegean’s customers include commercial shipping companies, cruise lines, marine fuel traders and brokers as well as oil majors
• Strong, diverse customer base, sophisticated credit management systems and a global footprint mitigate counterparty and market risk and provide top-line predictability
• No customer accounts for more than 10% of total revenues
Piraeus / Patras
Gibraltar
U.A.E.
Jamaica
Singapore
West Africa Hong Kong
U.K.
Vancouver Trinidad
Morocco
N.W.E.
Canary Islands
Panama
4 Q 1 2 V o l u m e b y M a r k e t
AEGEAN MARINE PETROLEUM NETWORK INC.
Streamlining Cost Structure and Leveraging Fixed Costs
• Successfully reduced operating expenses in three
consecutive quarters
• Sale of ten older, non-core vessels yields approximately
$20m in annual operating savings
• Movement from floating to land based storage capacity
mitigates costly ongoing operating and maintenance
expense while enhancing purchasing power and providing
additional revenue streams
17
AEGEAN MARINE PETROLEUM NETWORK INC.
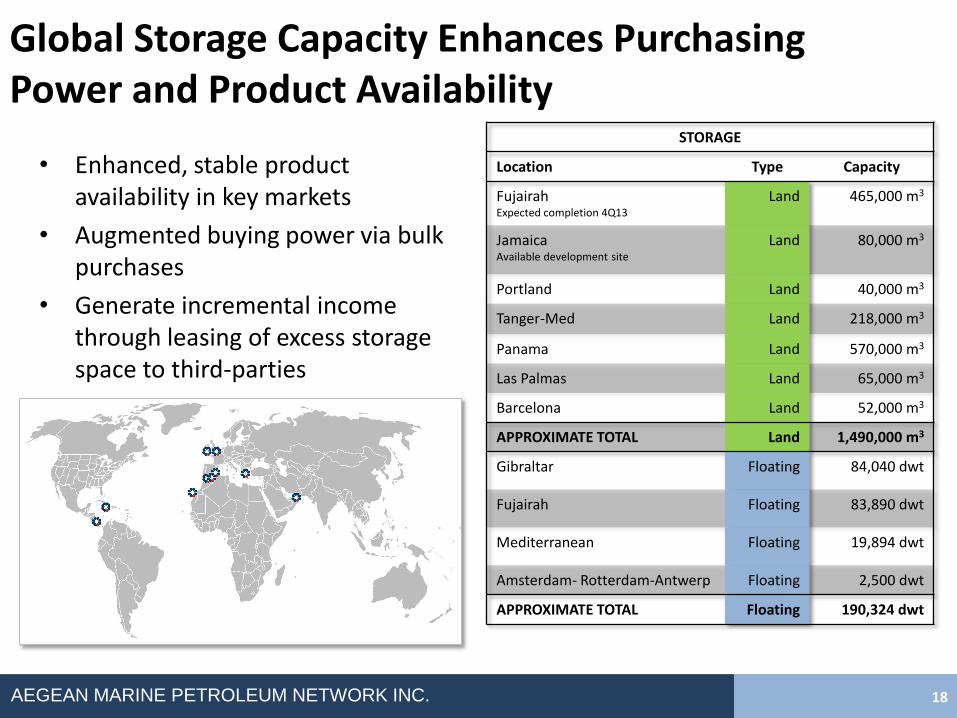
Global Storage Capacity Enhances Purchasing Power and Product Availability
18
STORAGE
Location Type Capacity
Fujairah Expected completion 4Q13
Land 465,000 m3
Jamaica Available development site
Land 80,000 m3
Portland Land 40,000 m3
Tanger-Med Land 218,000 m3
Panama Land 570,000 m3
Las Palmas Land 65,000 m3
Barcelona Land 52,000 m3
APPROXIMATE TOTAL Land 1,490,000 m3
Gibraltar Floating 84,040 dwt
Fujairah Floating 83,890 dwt
Mediterranean Floating 19,894 dwt
Amsterdam- Rotterdam-Antwerp Floating 2,500 dwt
APPROXIMATE TOTAL Floating 190,324 dwt
• Enhanced, stable product availability in key markets
• Augmented buying power via bulk purchases
• Generate incremental income through leasing of excess storage space to third-parties
AEGEAN MARINE PETROLEUM NETWORK INC.
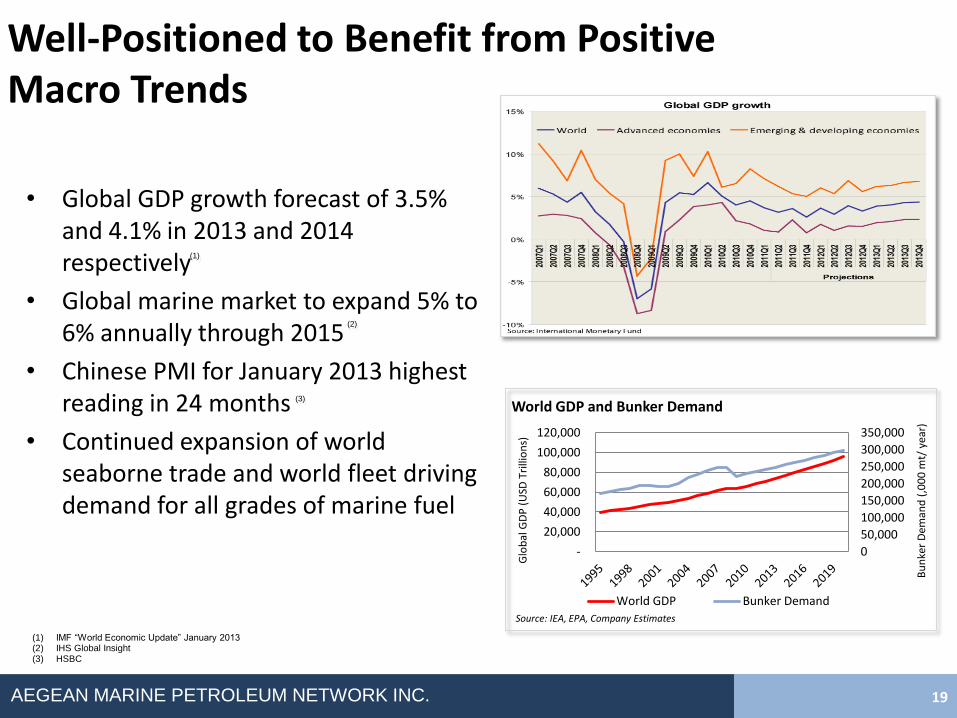
Well-Positioned to Benefit from Positive Macro Trends
• Global GDP growth forecast of 3.5% and 4.1% in 2013 and 2014 respectively
• Global marine market to expand 5% to 6% annually through 2015
• Chinese PMI for January 2013 highest reading in 24 months
• Continued expansion of world seaborne trade and world fleet driving demand for all grades of marine fuel
19
0
50,000
100,000
150,000
200,000
250,000
300,000
350,000
-
20,000
40,000
60,000
80,000
100,000
120,000
Bu
nke
r D
eman
d (
,00
0 m
t/ y
ear)
Glo
bal
GD
P (
USD
Tri
llio
ns)
World GDP and Bunker Demand
World GDP Bunker Demand
(1) IMF “World Economic Update” January 2013 (2) IHS Global Insight (3) HSBC
(1)
Source: IEA, EPA, Company Estimates
(2)
(3)
AEGEAN MARINE PETROLEUM NETWORK INC.
Uniquely Positioned to Drive Profitability
• Well-positioned to capitalize on emerging trends
• Poised for long-term, sustainable growth; immune to many headwinds facing shipping industry
• Diversified revenue streams, market leadership and operational infrastructure create significant barriers to entry
• Track record of strong financial results
• Capital allocation strategy focused on driving shareholder value
• Creating long term value by entering new markets and further diversifying revenue
20