Embed Size (px)
Citation preview
U.S. Department of Transportation Federal Aviation Administration
Advisory Circular
Subject: HANDBOOK FOR IDENTIFICATION OF ALKALI-SILICA REACTIVITY IN AIRFIELD PAVEMENTS
Date: 2/2/04 Initiated by: AAS-100
AC No: 150/5380-8 Change:
1. PURPOSE. This Advisory Circular (AC) provides guidance on understanding, identifying, preventing, and mitigating alkali-silica reactivity (ASR) in fresh and hardened Portland cement concrete airfield pavements. 2. BACKGROUND. The Federal Aviation Administration (FAA) conducted a study on the impact of ASR distress on airport runways and taxiways in response to Section 743 of the Wendall H. Ford Aviation Investment and Reform Act for the 21st Century (P.L. 106-181). The study involved a determination of ASR distress based on in-the-field inspections followed by petrographic analysis and other techniques. The study confirmed that ASR distress can negatively impact the long-term performance of airfield pavements. This handbook was developed as an integral part of the study. It was prepared by the Texas Transportation Institute, Texas A&M University, through a cooperative agreement between the FAA and the National Safe Skies Alliance.
3. APPLICATION. The handbook provides decisionmakers with a framework for the definite identification of ASR in airfield pavements. It summarizes ways to prevent and mitigate these effects, including using lithium. It also discusses a new rapid test method that could be routinely applied during construction. The FAA recommends the information and procedures contained in the handbook for use during the engineering and design phase of paving projects. The handbook is included in this AC as Appendix 1. 4. RELATED READING MATERIAL. AC 150/5380-6, Guidelines and Procedures for Maintenance of Airport Pavements, provides further guidance and technical information for identifying distresses in airfield pavements. 5. ONLINE AVAILABILITY. To view and download this AC, visit the FAA Web site at http://www.faa.gov/arp/150acs.cfm.
DAVID L. BENNETT Director, Office of Airport Safety and Standards

2/2/04 AC 150/5380-8 Appendix 1
APPENDIX 1—HANDBOOK FOR IDENTIFICATION OF ALKALI-SILICA REACTIVITY IN AIRFIELD PAVEMENT
S
A
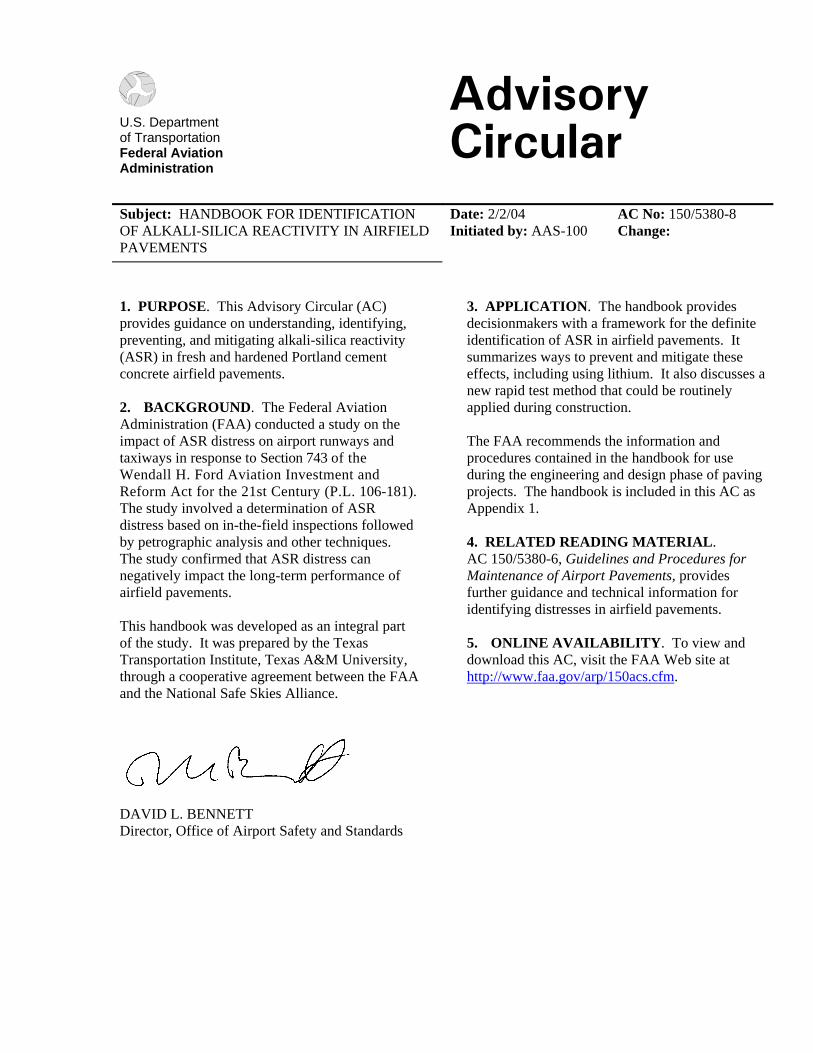
Map Cracking Due to Alkali-Silica Reactivity (ASR) in an Airfield Pavement
hondeep L. Sarkar, Ph.D., P.E. Research Scientist
nal Kanti Mukhopadhyay, Ph.D.
Research Associate
Dan G. Zollinger, Ph.D., P.E. Associate Research Engineer
Lim Seungwook
Graduate Research Assistant
Chang-Seon Shon Graduate Research Assistant
Texas Transportation Institute Texas A&M University
College Station, Texas 77843-3135
i

AC 150/5380-8 2/2/04 Appendix 1
ii
DISCLAIMER The contents of this handbook reflect the views of the authors, who are responsible for the facts and accuracy of the data presented herein. The contents do not necessarily reflect the official view or policies of the sponsors or Texas Transportation Institute. This handbook does not constitute a standard, specification, or regulation.
2/2/04 AC 150/5380-8 Appendix 1
iii
FOREWORD This handbook has been prepared for airfield engineers and other personnel associated with maintenance of airfield pavements. Alkali-silica reactivity (ASR) continues to be a detriment to the long-term performance of airfield pavements. Deleterious reaction between alkali and reactive aggregate in concrete causes expansion and subsequent cracking in pavements. However, damage due to ASR is often difficult to differentiate from damage caused by other deleterious mechanisms. The objective of this handbook is to provide step-by-step guidance on how to identify ASR in airfield pavements based on field inspection and laboratory investigation, and then perform ASR distress rating. Total reliance on field observation for identification of ASR is not recommended. Laboratory investigation, particularly petrography of core samples, needs to be performed to precisely identify ASR and to assess the extent of damage caused by ASR. This handbook essentially consists of a framework for definite identification of ASR and ASR-induced damage in airfield concrete pavements. The use of a special dye can often help to indicate the possible existence of ASR but must not be accepted as a decision-making tool for assessing damage caused by ASR. Following identification of ASR and evaluation of the degree of distress, it is then necessary to consider mitigation and preventive measures. These are summarized in Chapter 5. A new rapid method for testing the reactivity of as-received aggregates from different sources, developed at the Texas Transportation Institute, Texas A&M University, is also described in this handbook. A brief description of this new rapid method is given in Chapter 8.

2/2/04 AC 150/5380-8 Appendix 1
v
Table of Contents
Chapter 1: Understanding Alkali-Silica Reactivity .................................................... 1-1 1.1 Definition .................................................................................................... 1-1 1.2 Essential parameters for ASR ..................................................................... 1-1 1.3 Mechanism of ASR..................................................................................... 1-5
Chapter 2: Field Diagnosis of ASR............................................................................... 2-1
2.1 Background information ............................................................................. 2-1 2.2 Visual manifestation of ASR in airfield pavements ................................... 2-1 2.3 Structural evidence of expansion due to ASR ............................................ 2-7 2.4 Distinction between ASR distress features and other type of distress features in airfield pavements ..................................................................... 2-9 2.5 Application of dyes to detect ASR gel in the field ................................... 2-13 2.6 Selection of coring locations for further laboratory investigation ............ 2-14 2.7 Summary ................................................................................................... 2-17
Chapter 3: Laboratory Investigations ......................................................................... 3-1 3.1 Use of dye .................................................................................................. 3-1 3.2 Optical microscopic techniques to identify ASR ....................................... 3-2 3.3 Scanning electron microscopy/energy dispersive X-ray analysis............... 3-7
Chapter 4: ASR Distress Analysis in Airfield Pavements.......................................... 4-1
4.1 ASR condition survey ................................................................................. 4-1 4.2 Scoring of ASR distress .............................................................................. 4-3 4.3 Detailed explanation of the survey sheet .................................................... 4-9
Chapter 5: Mitigation and Prevention of ASR............................................................ 5-1 5.1 Common preventive measures for ASR ..................................................... 5-1 5.2 Lithium use in new concrete ....................................................................... 5-2 5.3 Mitigation of ASR in existing concrete ...................................................... 5-2
Chapter 6: References and Further Reading .............................................................. 6-1 Chapter 7: Test Methods for ASR................................................................................ 7-1 Chapter 8: Dilatometer ⎯ A Rapid Method for Testing the Reactivity of As-Received Aggregates ............................................................................................ 8-1
8.1 Introduction.................................................................................................8–1 8.2 Experimental ...............................................................................................8–2 Test Device. ................................................................................................8–2 Test Procedure. ...........................................................................................8–4 8.3 Test Results and Discussion........................................................................8–6 Expansion-Age Relationship. .....................................................................8–6 Effect of Lithium Nitrate (LiNO3). ...........................................................8–10

AC 150/5380-8 2/2/04 Appendix 1
vi
Effect of Calcium Hydroxide, Ca(OH)2....................................................8–11 Repeatability. ............................................................................................8–11 8.4 Conclusions...............................................................................................8–12 Advantages of this Method .......................................................................8–12 8.5 References.................................................................................................8–14
2/2/04 AC 150/5380-8 Appendix 1
vii
List of Figures Figure 1-1. Non-reactive quartz.................................................................................. 1-2 Figure 1-2. Reactive or strained quartz exhibits dark (A) and light bands (B) within a
single grain............................................................................................... 1-3 Figure 1-3. Photomicrograph of a very fine grained (cryptocrystalline) chalcedony
aggregate in concrete.. ............................................................................. 1-3 Figure 1-4. Attack of alkali solution on silica lattice.................................................. 1-6 Figure 2-1. Laddering (→) along a joint due to ASR................................................. 2-2 Figure 2-2. A close-up view of laddering (→) ........................................................... 2-2 Figure 2-3. Only a few map cracks (→) ..................................................................... 2-3 Figure 2-4. Widespread map cracking (→) ................................................................ 2-3 Figure 2-5. Severe map cracking ................................................................................ 2-4 Figure 2-6. Aggregate pop-out (→)............................................................................ 2-4 Figure 2-7. Several aggregate particles (A) have been dislodged (→) along with some
neighboring paste ..................................................................................... 2-5 Figure 2-8. An open internal crack (→) in an ASR-affected aggregate particle (A) . 2-5 Figure 2-9. Gel exudation through cracks .................................................................. 2-6 Figure 2-10. Gel exudation (→) through cracks........................................................... 2-6 Figure 2-11. Joint compression due (→) to slab movement......................................... 2-7 Figure 2-12. Heaving (→) of an asphalt shoulder due to movement of adjoining
concrete slab affected by ASR................................................................. 2-7 Figure 2-13. Misalignment of joint caused by slab movement .................................... 2-8 Figure 2-14. Heaving of a slab relative to another ....................................................... 2-8 Figure 2-15. D-cracking (→) in an airfield pavement ................................................ 2-10 Figure 2-16. Corner break (→) in an airfield pavement ............................................. 2-11 Figure 2-17. Corner spall in another airfield pavement.............................................. 2-11 Figure 2-18. Longitudinal joint spall (→) .................................................................. 2-12 Figure 2-19. Longitudinal cracks (→) in an airfield pavement .................................. 2-12 Figure 2-20. Cracks (→) in the central part of a pavement section............................ 2-15 Figure 2-21. Different cracking pattern (→) near the joint of the same pavement section .................................................................................................... 2-15 Figure 2-22. Full-depth cores from sections of an airfield pavement sharing different
distress features...................................................................................... 2-16 Figure 3-1. A slice of a concrete core collected from an airfield pavement under plain
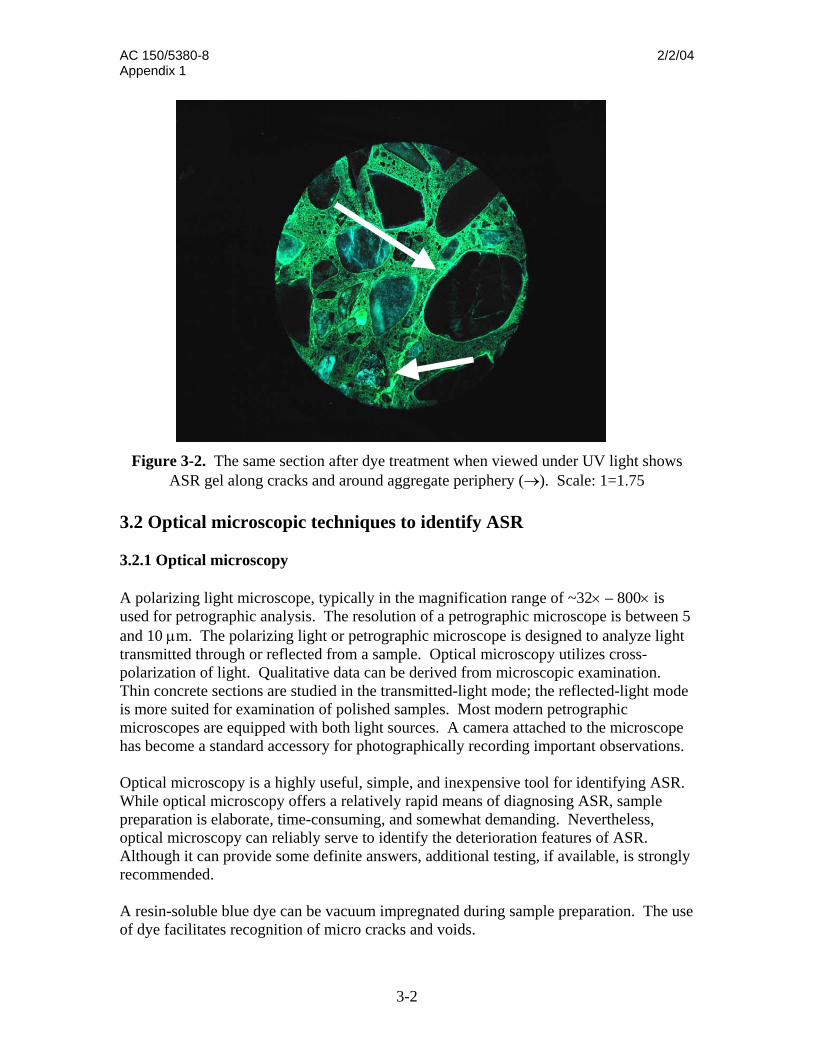
light .......................................................................................................... 3-1 Figure 3-2. The same section after dye treatment when viewed under UV light shows
ASR gel along cracks and around aggregate periphery (→) ................... 3-2 Figure 3-3. Reaction rim (→) around an aggregate (A) particle due to ASR ............ 3-3 Figure 3-4. Peripheral discoloration (→) of an opaline limestone aggregate (A) particle ............................................................................................... 3-4 Figure 3-5. A severely cracked opaline siliceous fine aggregate due to ASR............ 3-4 Figure 3-6. Transgranular cracks passing through paste and a reactive fine aggregate
particle...................................................................................................... 3-5
AC 150/5380-8 2/2/04 Appendix 1
viii
Figure 3-7. Presence of gel with transverse cracks (→) at the interface between reactive aggregate (A) and cement paste (B)........................................... 3-5
Figure 3-8. Accumulation of gel (→) at the periphery of an air void ........................ 3-6 Figure 3-9. ASR gel with transverse cracks (→) inside a reactive aggregate ........... 3-6 Figure 3-10. SEM image of rosette like crystalline ASR gel product .......................... 3-8 Figure 3-11. Crystalline lamellar gel at the surface of aggregate................................. 3-8 Figure 3-12. SEM image of massive type amorphous ASR gel ................................... 3-9 Figure 8-1. Test equipment showing the principal parts, such as the container,
linear variable differential transducer (LVDT), float, and tower ............ 8-3 Figure 8-2. Reactive aggregate and non-reactive aggregate....................................... 8-5 Figure 8-3. Expansion curves of aggregate at 14 days ............................................... 8-7 Figure 8-4. Effect of operating temperature on development of ASR expansion ...... 8-8 Figure 8-5. Expansion of reactive aggregate in 1N and 0.5N NaOH solution ........... 8-9 Figure 8-6. Expansion of reactive and non-reactive aggregate in 0.25N NaOH
solution..................................................................................................... 8-9 Figure 8-7. Effect of lithium nitrate on ASR expansion of reactive aggregate at
three different operating temperatures ................................................... 8-10 Figure 8-8. Effect of calcium hydroxide on ASR expansion of reactive aggregate . 8-11 Figure 8-9. Repeatability of dilatometer test ............................................................ 8-12
2/2/04 AC 150/5380-8 Appendix 1
1-1
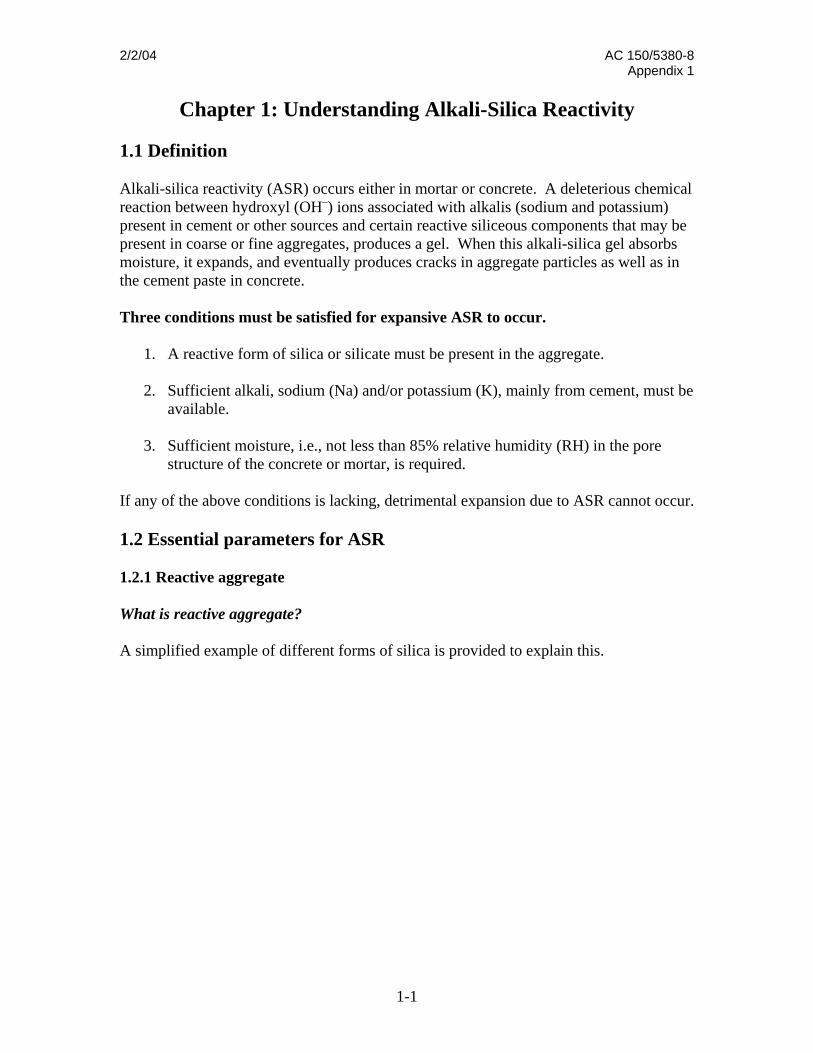
Chapter 1: Understanding Alkali-Silica Reactivity 1.1 Definition Alkali-silica reactivity (ASR) occurs either in mortar or concrete. A deleterious chemical reaction between hydroxyl (OH–) ions associated with alkalis (sodium and potassium) present in cement or other sources and certain reactive siliceous components that may be present in coarse or fine aggregates, produces a gel. When this alkali-silica gel absorbs moisture, it expands, and eventually produces cracks in aggregate particles as well as in the cement paste in concrete. Three conditions must be satisfied for expansive ASR to occur.
1. A reactive form of silica or silicate must be present in the aggregate.
2. Sufficient alkali, sodium (Na) and/or potassium (K), mainly from cement, must be available.
3. Sufficient moisture, i.e., not less than 85% relative humidity (RH) in the pore
structure of the concrete or mortar, is required. If any of the above conditions is lacking, detrimental expansion due to ASR cannot occur. 1.2 Essential parameters for ASR 1.2.1 Reactive aggregate What is reactive aggregate? A simplified example of different forms of silica is provided to explain this.
AC 150/5380-8 2/2/04 Appendix 1
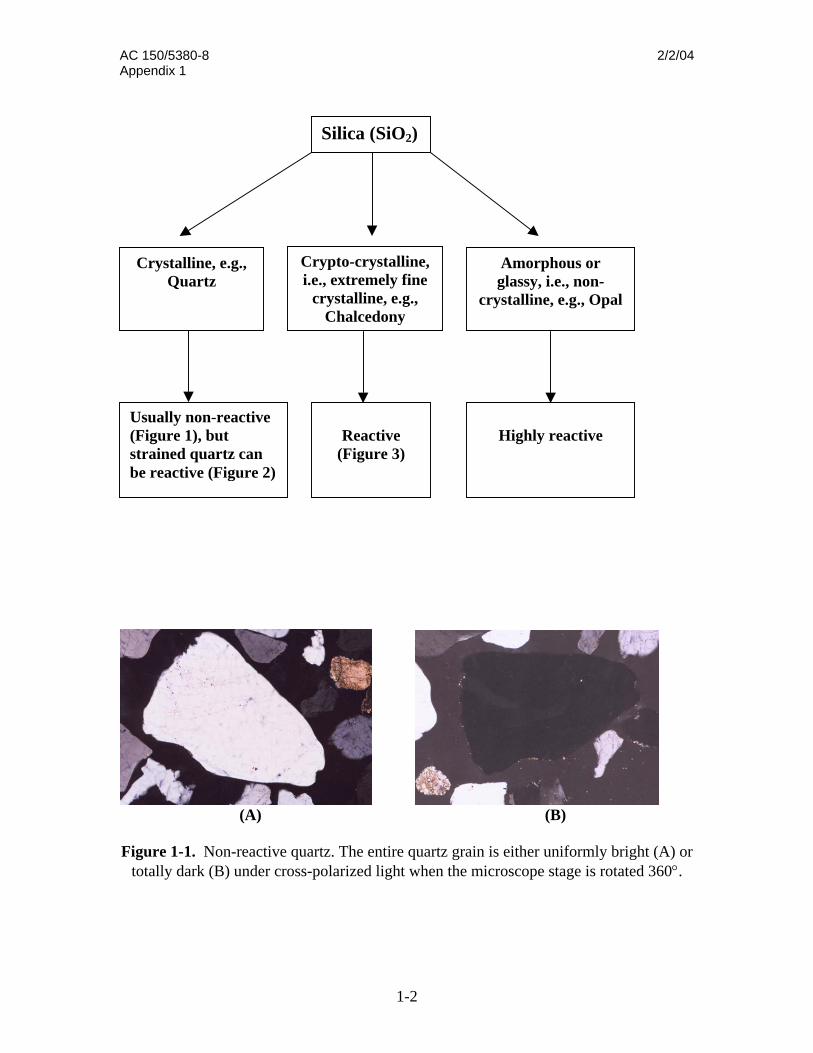
(A) Figure 1-1. Non-reactive q
totally dark (B) under cro
Silica (SiO2)
Crystalline, e.g., Quartz
cr
Usually non-reactive (Figure 1), but strained quartz can be reactive (Figure 2)
Crypto-crystalline,i.e., extremely fine
crystalline, e.g., Chalcedony
1-2
uartz. The entire quartz grain iss-polarized light when the mic
Reactive
(Figure 3)
Amorphous or glassy, i.e., non-
ystalline, e.g., Opal
(B)
s either uniformly bright (A) or roscope stage is rotated 360°.
Highly reactive
2/2/04 AC 150/5380-8 Appendix 1
1-3
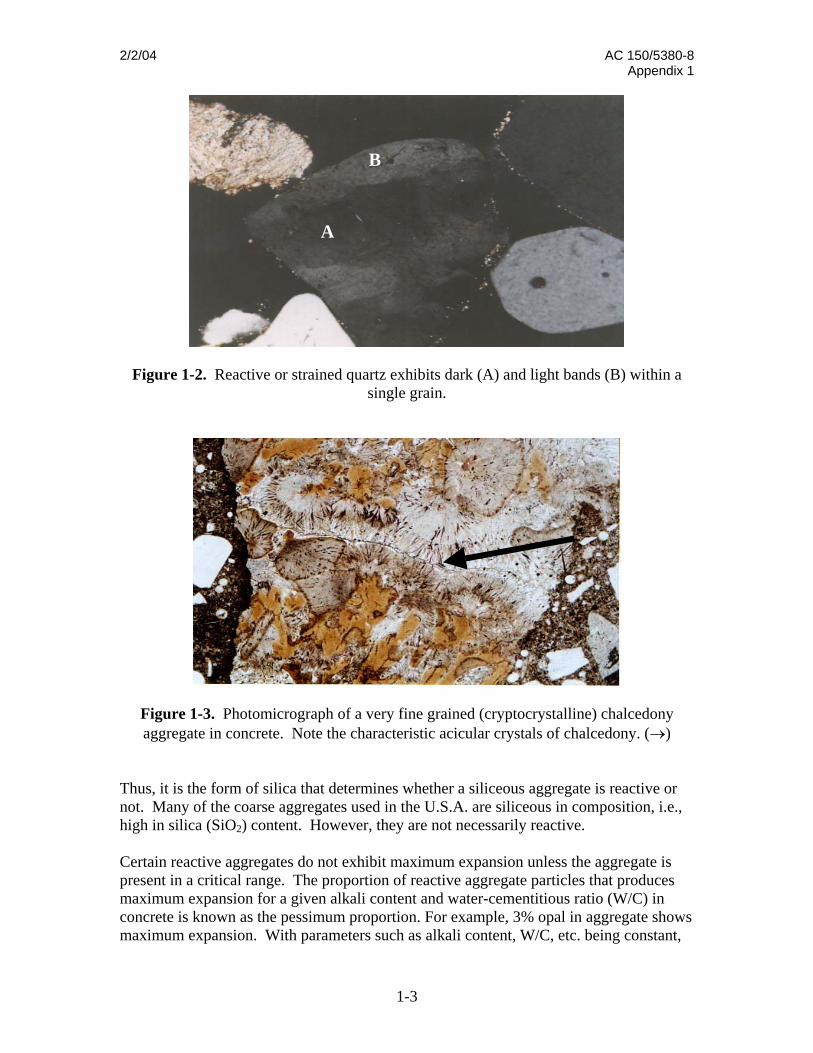
Figure 1-2. Reactive or strained quartz exhibits dark (A) and light bands (B) within a single grain.
Figure 1-3. Photomicrograph of a very fine grained (cryptocrystalline) chalcedony aggregate in concrete. Note the characteristic acicular crystals of chalcedony. (→)
Thus, it is the form of silica that determines whether a siliceous aggregate is reactive or not. Many of the coarse aggregates used in the U.S.A. are siliceous in composition, i.e., high in silica (SiO2) content. However, they are not necessarily reactive. Certain reactive aggregates do not exhibit maximum expansion unless the aggregate is present in a critical range. The proportion of reactive aggregate particles that produces maximum expansion for a given alkali content and water-cementitious ratio (W/C) in concrete is known as the pessimum proportion. For example, 3% opal in aggregate shows maximum expansion. With parameters such as alkali content, W/C, etc. being constant,
A
B
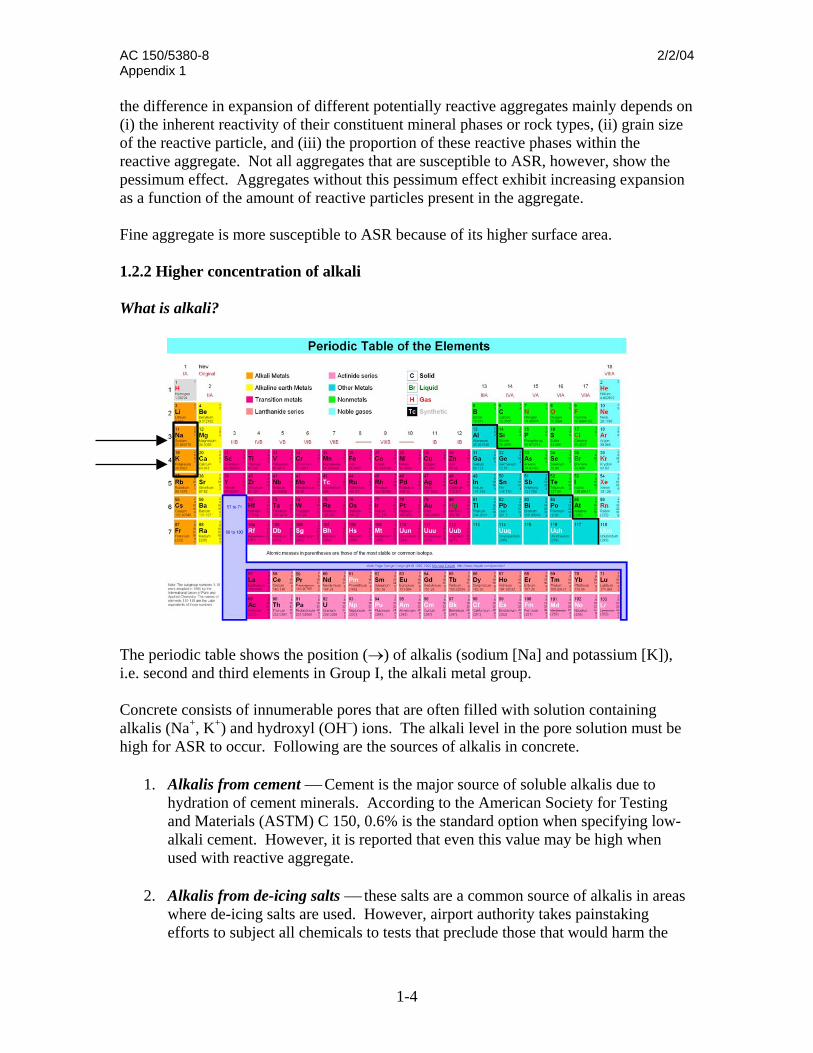
AC 150/5380-8 2/2/04 Appendix 1 the difference in expansion of different potentially reactive aggregates mainly depends on (i) the inherent reactivity of their constituent mineral phases or rock types, (ii) grain size of the reactive particle, and (iii) the proportion of these reactive phases within the reactive aggregate. Not all aggregates that are susceptible to ASR, however, show the pessimum effect. Aggregates without this pessimum effect exhibit increasing expansion as a function of the amount of reactive particles present in the aggregate. Fine aggregate is more susceptible to ASR because of its higher surface area. 1.2.2 Higher concentration of alkali What is alkali?
The pei.e. sec Concralkalishigh fo
1.
2.
1-4
riodic table shows the position (→) of alkalis (sodium [Na] and potassium [K]), ond and third elements in Group I, the alkali metal group.
ete consists of innumerable pores that are often filled with solution containing (Na+, K+) and hydroxyl (OH–) ions. The alkali level in the pore solution must be r ASR to occur. Following are the sources of alkalis in concrete.
Alkalis from cement ⎯ Cement is the major source of soluble alkalis due to hydration of cement minerals. According to the American Society for Testing and Materials (ASTM) C 150, 0.6% is the standard option when specifying low-alkali cement. However, it is reported that even this value may be high when used with reactive aggregate.
Alkalis from de-icing salts ⎯ these salts are a common source of alkalis in areas where de-icing salts are used. However, airport authority takes painstaking efforts to subject all chemicals to tests that preclude those that would harm the
2/2/04 AC 150/5380-8 Appendix 1
1-5
aircraft and airport support infrastructure. This potential is minimal to rare on the airside.
3. Supplementary cementing materials ⎯ For example, fly ash with a high alkali
content can introduce alkali.
4. Aggregates ⎯ Some aggregates themselves may be a potential source of alkalis. Typically, alkalis are released when the aggregate’s lattice structure begins to break down during ASR. These alkalis later provide an additional source for further ASR.
1.2.3 Environmental factors Availability of sufficient moisture ⎯ Moisture is an essential ingredient for ASR; this reaction cannot occur in the absence of moisture. Moisture can have a significant impact on the severity of distress as well. The ASR gel is hygroscopic, i.e., it absorbs moisture. Therefore, higher humidity can increase moisture absorption and thus cause greater expansion in concrete. Effect of temperature ⎯ The rate of ASR development increases with increasing temperature. Combination of factors ⎯ ASR-induced deterioration is more severe in portions of a concrete structure subjected to repeated wetting and drying or freeze-thaw cycles, in addition to the effects of higher temperature and higher moisture. 1.3 Mechanism of ASR Broadly, the ASR mechanism can be divided into two parts: (1) the actual chemical reaction, and (2) distress arising from the chemical reaction. (1) Reaction mechanism The chemical reaction between the alkali hydroxides and reactive silica is essentially a dissolution reaction, i.e., solubility of reactive silica in high-alkaline (high pH) solution. Basically, the hydroxyl (OH–) ions attack the stronger siloxane bridge (Si-O-Si) near the surface of the reactive siliceous component and break it down. The negative charge created by this breakdown is balanced by the positively charged alkali ions, such as Na+ or K+. Si-O-Si + 2NaOH (KOH) 2 Si-O–-Na+ (K+) + H2O ------------------(i) As the reaction proceeds, alkali hydroxides penetrate into the siliceous particle, thus loosening the lattice structure. This type of breakdown of the lattice structure by alkali hydroxide is practically impossible in well-crystallized silica (quartz), but is much greater

AC 150/5380-8 2/2/04 Appendix 1
1-6
in crypto-crystalline and amorphous silica because of increased surface area and a disordered, open lattice structure. The breakdown of the silica lattice due to alkali attack is illustrated in Figure 1-4.
Figure 1-4. Attack of alkali solutio In the case of non-reactive quartz, the alkali ions canncrystal lattice. However, silica minerals with poorly clattice such as strained quartz, chalcedony are susceptFigure 1-4.
Si
O
OH–
Na+
Ordered/Well Crystallized
Disordered/Poorly Crystallized
n on silica lattice.
ot penetrate the well-ordered rystallized, disordered crystal ible to alkali attack, as shown in
2/2/04 AC 150/5380-8 Appendix 1
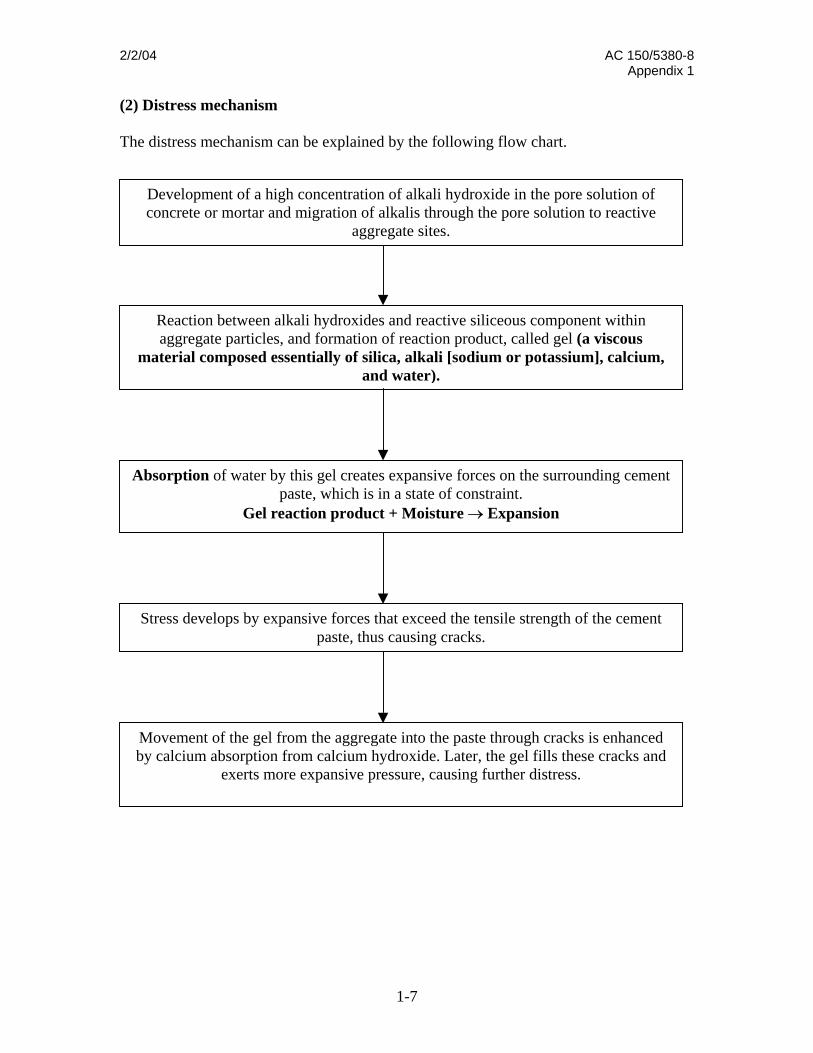
(2) Distress mechanism The distress mechanism can be explained by the following flow chart.
m
A
Development of a high concentration of alkali hydroxide in the pore solution of concrete or mortar and migration of alkalis through the pore solution to reactive
aggregate sites.
b
S
Reaction between alkali hydroxides and reactive siliceous component within aggregate particles, and formation of reaction product, called gel (a viscous
aterial composed essentially of silica, alkali [sodium or potassium], calcium,and water).
sorption of water by this gel creates expansive forces on the surrounding cement paste, which is in a state of constraint.
Gel reaction product + Moisture → Expansion
tress develops by expansive forces that exceed the tensile strength of the cement paste, thus causing cracks.
Movement of the gel from the aggregate into the paste through cracks is enhanced by calcium absorption from calcium hydroxide. Later, the gel fills these cracks and
exerts more expansive pressure, causing further distress.
1-7

2/2/04 AC 150/5380-8 Appendix 1
2-1
Chapter 2: Field Diagnosis of ASR It is preferable that qualified personnel carry out diagnosis in the field. In order to undertake field inspection of airfield pavement, it is essential for the inspector to have a basic knowledge of the different types of distress that occur in pavements. The most readily identifiable distress feature is cracking. Cracking, however, can be of several types, such as:
Linear or longitudinal/transverse cracking Map cracking Corner break D-cracking Each of these has been cited later in this chapter. One must recognize that several
factors can cause cracking in pavement. 2.1 Background information The following data should be recorded before inspection.
1. Concrete mixture proportions, if available. Otherwise, whether fly ash or slag was used in the concrete.
2. Approximate dates of construction, because segments of airfield pavements may have been constructed at different times.
3. Average relative humidity at the airfield. 4. Annual precipitation. 5. Temperature variation. 6. Use of de-icing chemicals and type, if any. 7. Water runoff. 8. Freezing and thawing, if any.
2.2 Visual manifestation of ASR in airfield pavements A detailed field survey is normally the first stage for identifying the possible presence of ASR, and the extent of deterioration. The visual signs to be considered in an airfield pavement include the following.
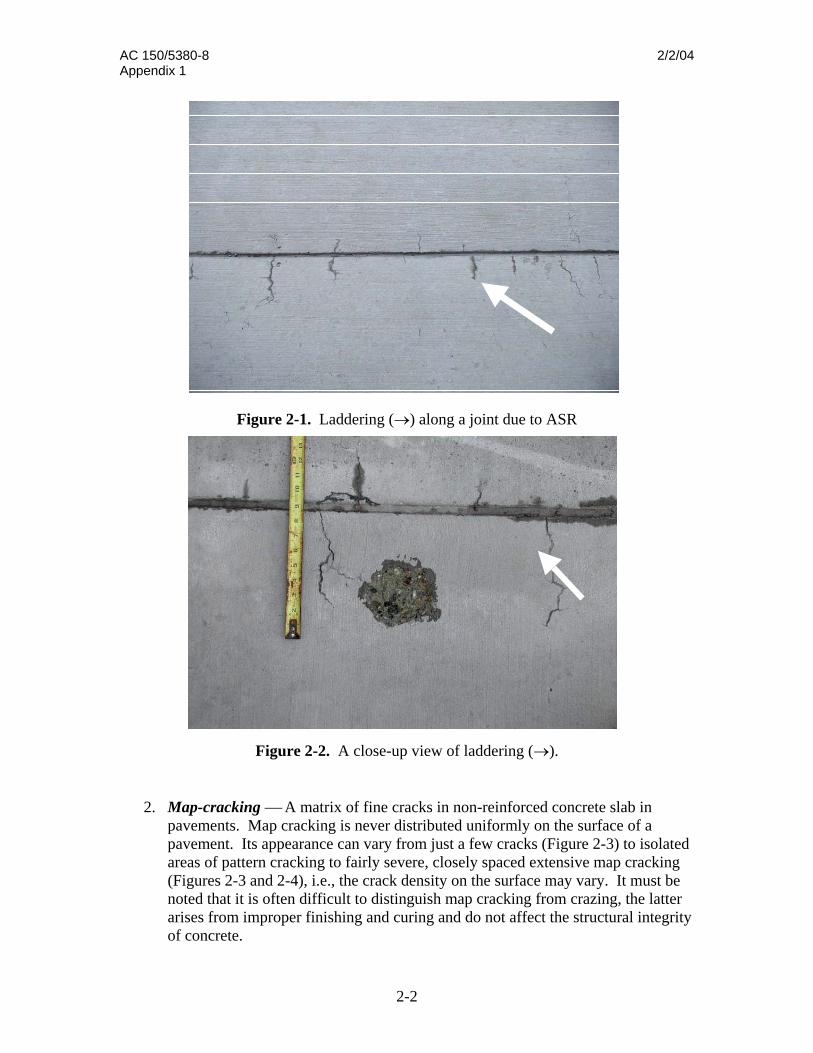
1. Laddering ⎯ Fine, short, parallel cracks that are perpendicular to joints and normally appear on both sides of a joint at the initial stage of ASR (Figures 2-1 and 2-2).
AC 150/5380-8 2/2/04 Appendix 1
2. Mpapaar(Fnoarof
2-2
Figure 2-1. Laddering (→) along a joint due to ASR
Figure 2-2. A close-up view of laddering (→).
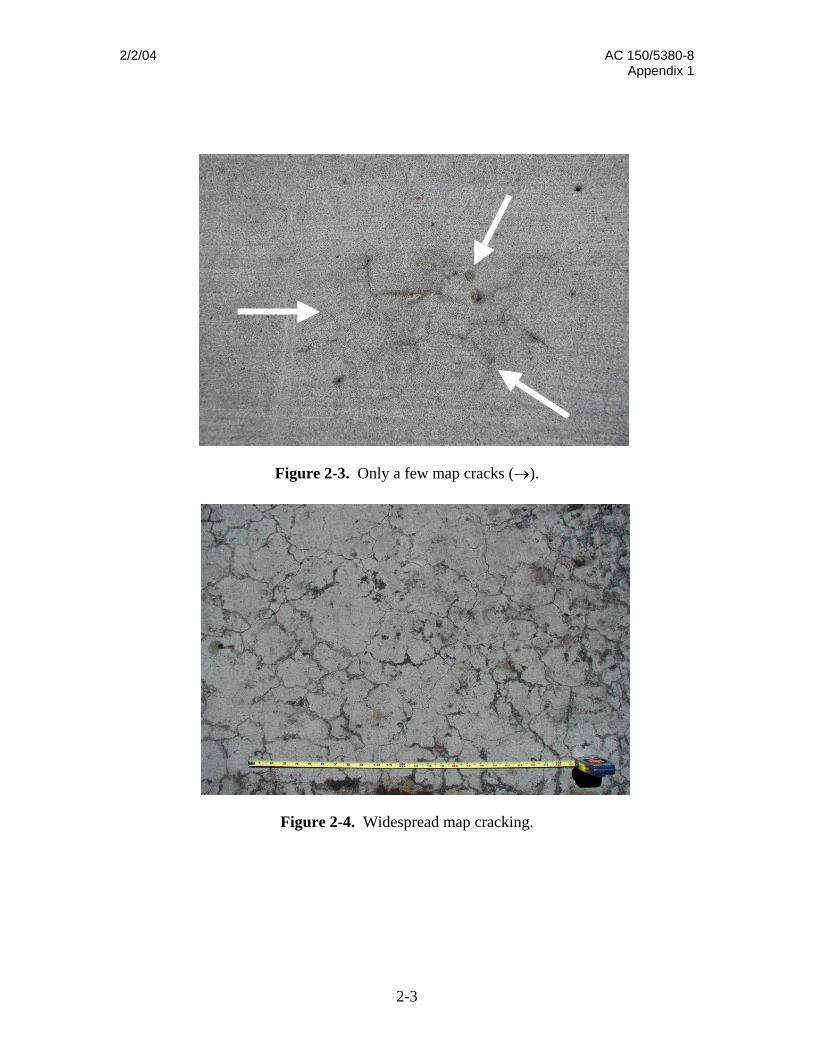
ap-cracking ⎯ A matrix of fine cracks in non-reinforced concrete slab in vements. Map cracking is never distributed uniformly on the surface of a vement. Its appearance can vary from just a few cracks (Figure 2-3) to isolated eas of pattern cracking to fairly severe, closely spaced extensive map cracking igures 2-3 and 2-4), i.e., the crack density on the surface may vary. It must be ted that it is often difficult to distinguish map cracking from crazing, the latter ises from improper finishing and curing and do not affect the structural integrity concrete.
2/2/04 AC 150/5380-8 Appendix 1
Figure 2-3. Only a few map cracks (→).
2-3
Figure 2-4. Widespread map cracking.
AC 150/5380-8 2/2/04 Appendix 1
3. AggeSolea2-fro
2-4
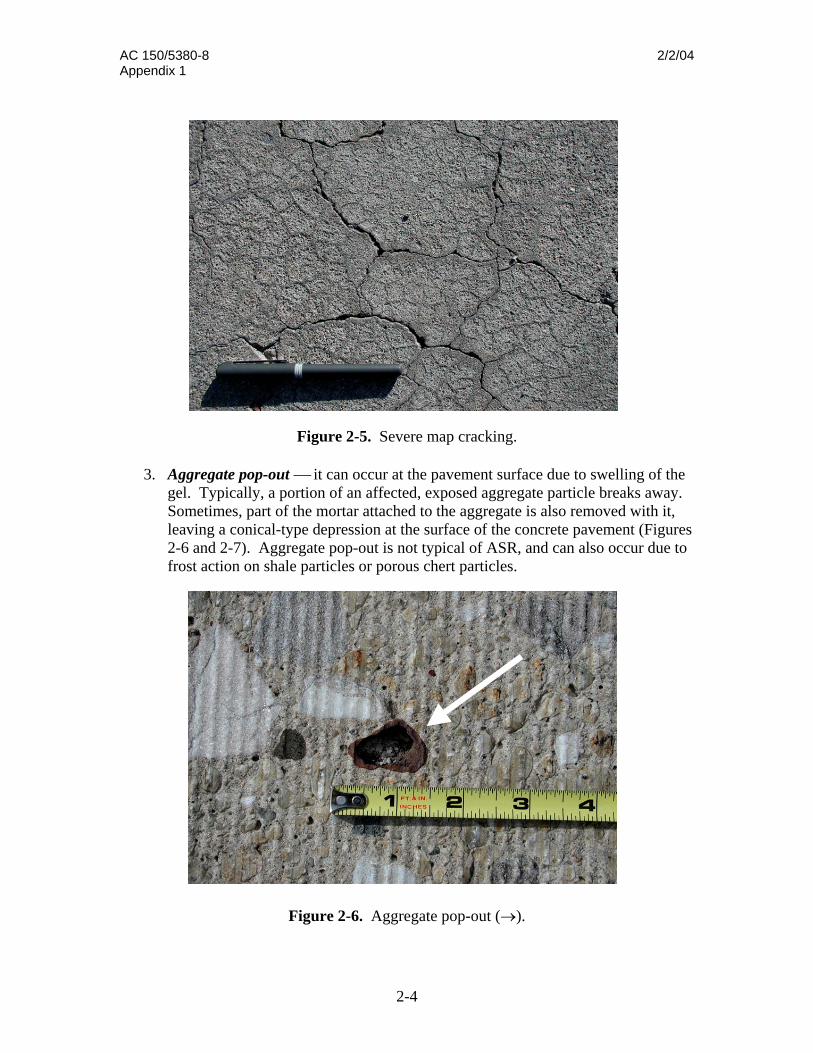
Figure 2-5. Severe map cracking.
gregate pop-out ⎯ it can occur at the pavement surface due to swelling of the l. Typically, a portion of an affected, exposed aggregate particle breaks away. metimes, part of the mortar attached to the aggregate is also removed with it, ving a conical-type depression at the surface of the concrete pavement (Figures
6 and 2-7). Aggregate pop-out is not typical of ASR, and can also occur due to st action on shale particles or porous chert particles.
Figure 2-6. Aggregate pop-out (→).
2/2/04 AC 150/5380-8 Appendix 1
Figu
4. Re
a peyre
5. Op
an
Figure
2-5
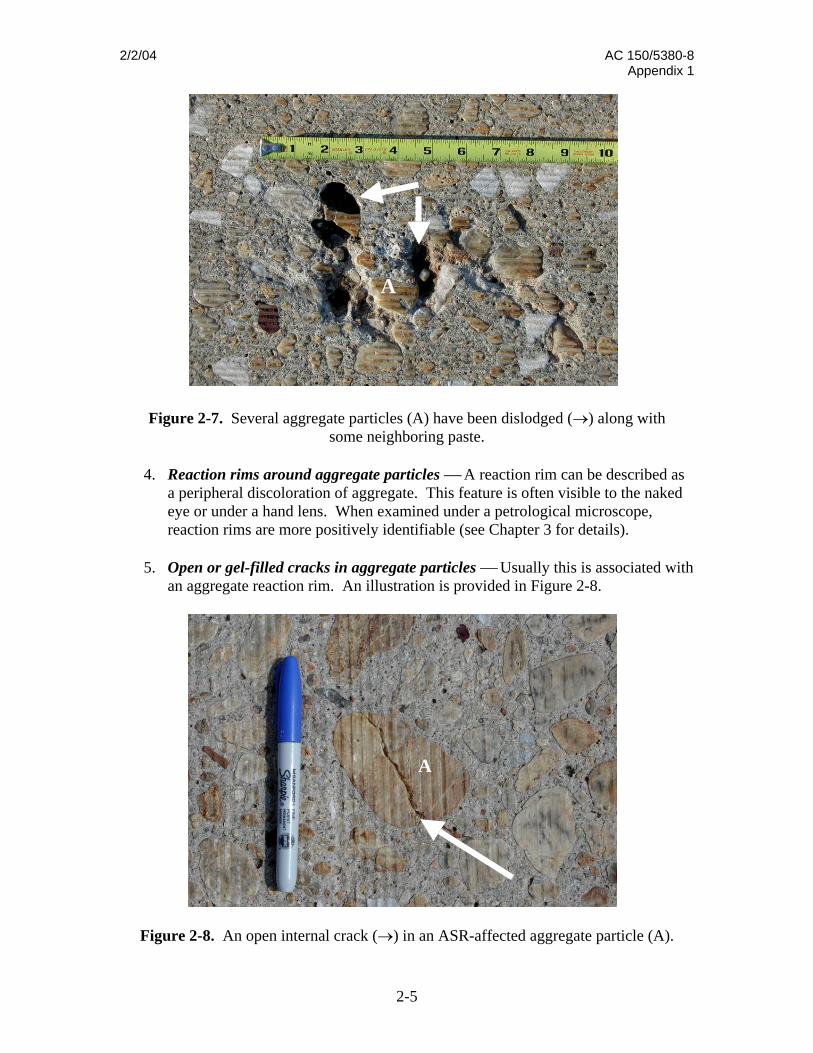
re 2-7. Several aggregate particles (A) have been dislodged (→) along with some neighboring paste.
action rims around aggregate particles ⎯ A reaction rim can be described as eripheral discoloration of aggregate. This feature is often visible to the naked e or under a hand lens. When examined under a petrological microscope, action rims are more positively identifiable (see Chapter 3 for details).
en or gel-filled cracks in aggregate particles ⎯ Usually this is associated with aggregate reaction rim. An illustration is provided in Figure 2-8.
2-8. An open internal crack (→) in an ASR-affected aggregate particle (A).
A
A
AC 150/5380-8 2/2/04 Appendix 1
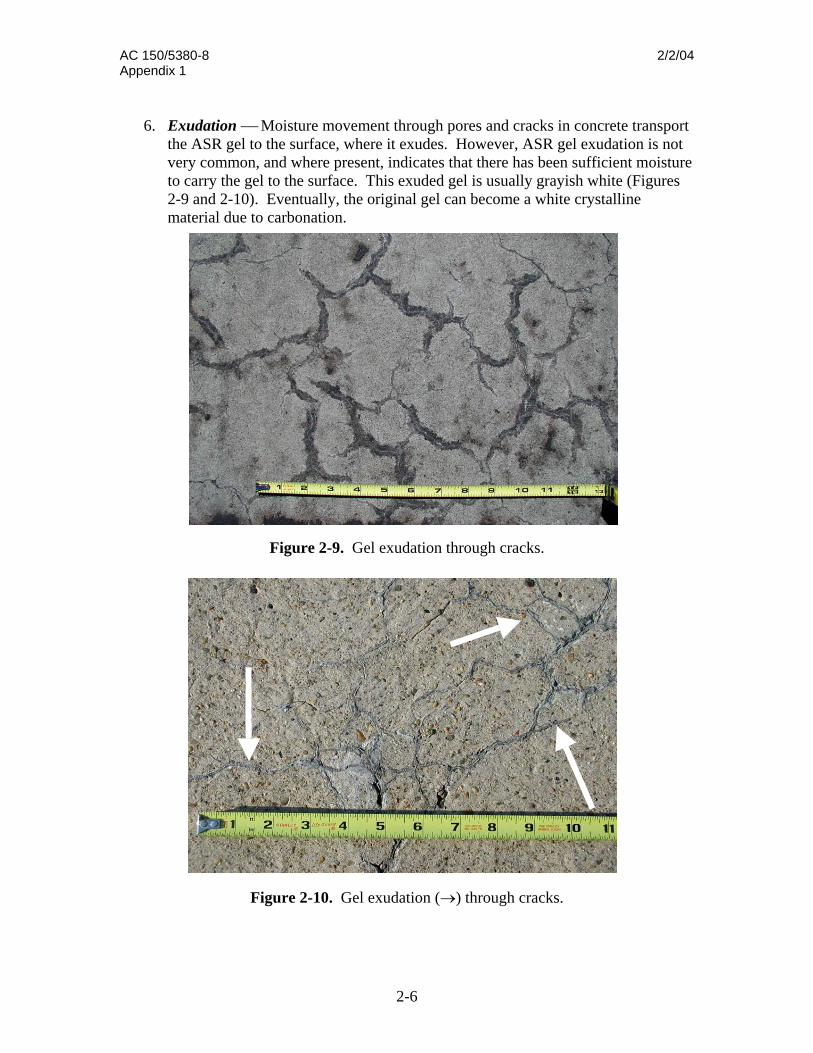
6. Exudation ⎯ Moisture movement through pores and cracks in concrete transport
the ASR gel to the surface, where it exudes. However, ASR gel exudation is not very common, and where present, indicates that there has been sufficient moisture to carry the gel to the surface. This exuded gel is usually grayish white (Figures 2-9 and 2-10). Eventually, the original gel can become a white crystalline material due to carbonation.
2-6
Figure 2-9. Gel exudation through cracks.
Figure 2-10. Gel exudation (→) through cracks.
2/2/04 AC 150/5380-8 Appendix 1
2.3 Structural evidence of expansion due to ASR
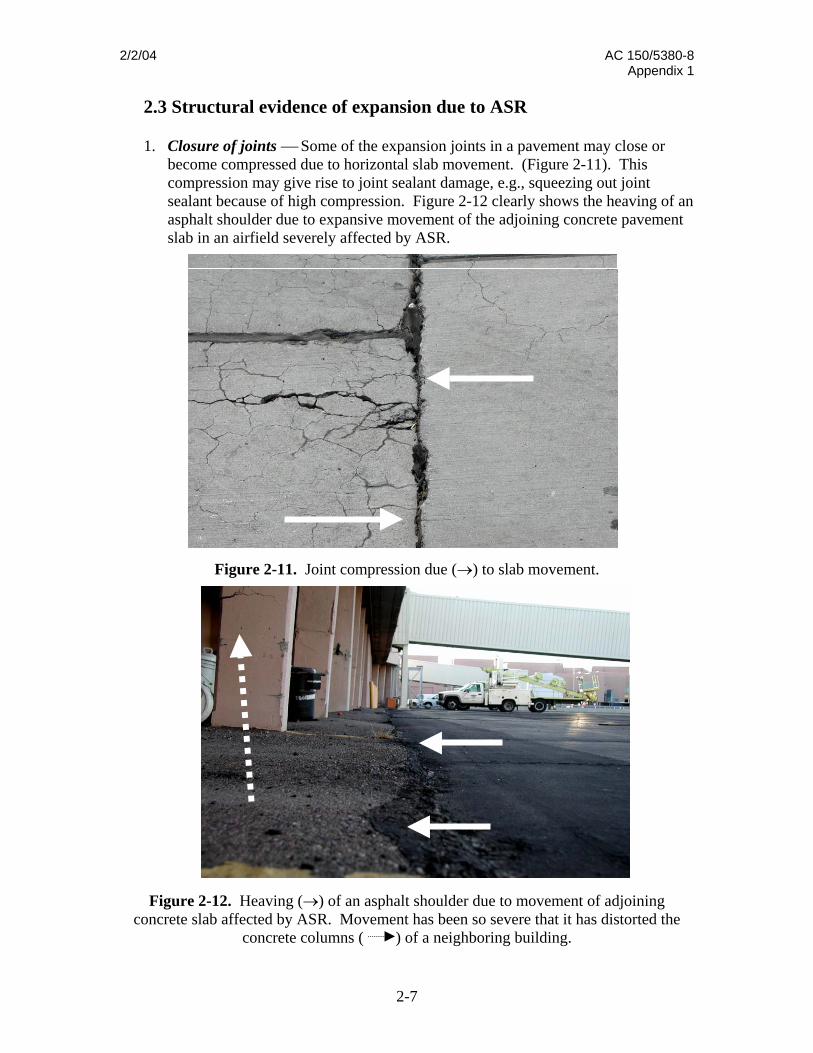
1. Closure of joints ⎯ Some of the expansion joints in a pavement may close or become compressed due to horizontal slab movement. (Figure 2-11). This compression may give rise to joint sealant damage, e.g., squeezing out joint sealant because of high compression. Figure 2-12 clearly shows the heaving of an asphalt shoulder due to expansive movement of the adjoining concrete pavement slab in an airfield severely affected by ASR.
Figure 2-11. Joint compression due (→) to slab movement.
Figureconcrete
2-7
2-12. Heaving (→) of an asphalt shoulder due to movement of adjoining slab affected by ASR. Movement has been so severe that it has distorted the
concrete columns ( ) of a neighboring building.
AC 150/5380-8 2/2/04 Appendix 1
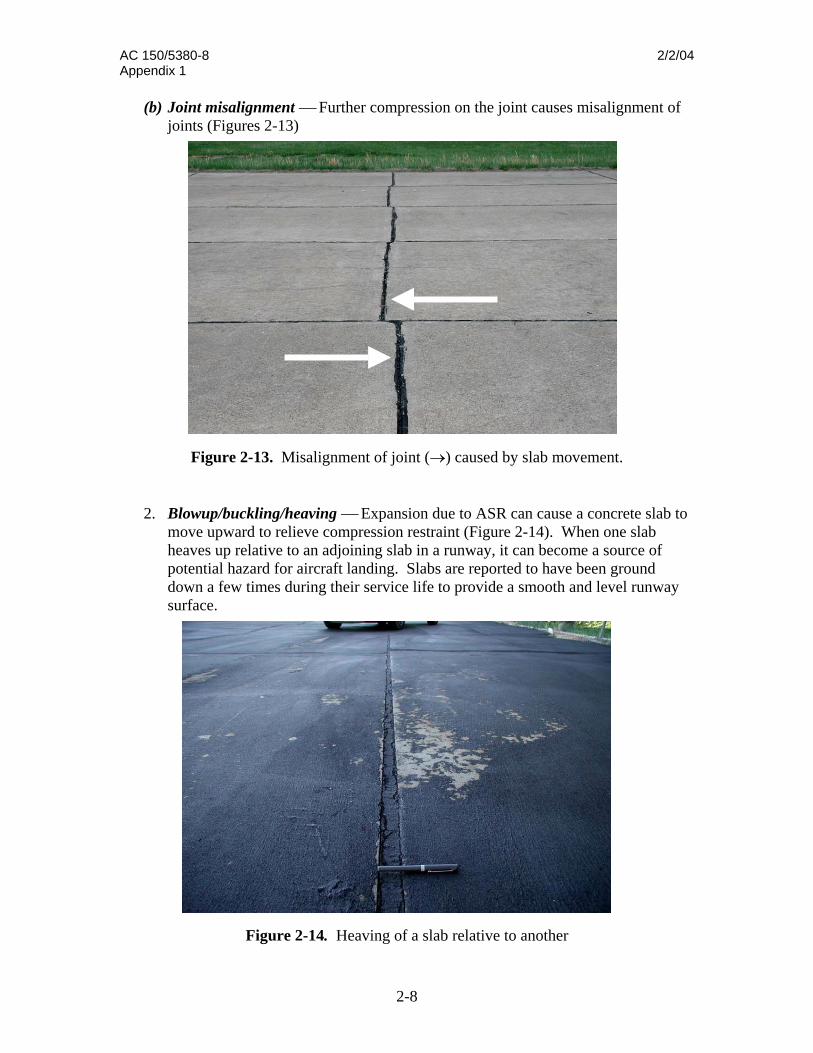
(b) Joint misalignment ⎯ Further compression on the joint causes misalignment of joints (Figures 2-13)
Figure 2-13. Misalignment of joint (→) caused by slab movement.
2. Blowup/buckling/heaving ⎯ Expansion due to ASR can cause a concrete slab to move upward to relieve compression restraint (Figure 2-14). When one slab heaves up relative to an adjoining slab in a runway, it can become a source of potential hazard for aircraft landing. Slabs are reported to have been ground down a few times during their service life to provide a smooth and level runway surface.
2-8
Figure 2-14. Heaving of a slab relative to another
2/2/04 AC 150/5380-8 Appendix 1
2-9
Restraint can influence the development of cracks due to ASR. Cracking may not occur uniformly throughout a structure if expansive forces are less than restraining forces. Most commonly, cracking will be partially or completely suppressed in the direction of the restraint (e.g. steel reinforcement in one direction). 2.4 Distinction between ASR distress features and other types of distress features in airfield pavements Deterioration arising from ASR and other mechanisms often looks very similar. This similarity makes positive identification of ASR virtually impossible from visual inspection alone. Nevertheless, the visual indicators of ASR listed in sections 2.2 and 2.3 should be considered as preliminary evidence. However, laboratory investigation is essential to confirm ASR. The roles of structural design of the pavement, concrete mixture proportions, age of the pavement, and climatic factors in the deterioration process should be evaluated before considering the influence of other major distress mechanisms, such as freeze-thaw, sulfate attack, carbonation, leaching, etc. One deterioration mechanism often complements another to accelerate concrete deterioration, e.g., (a) initial cracks formed by freeze-thaw or shrinkage can generate better access for moisture to migrate deeper, and thus increase the risk of further damage; (b) portland cement may provide the alkali necessary for ASR to initiate, but the reaction may be aggravated by other sources of alkalis described earlier in Section 1.2.2 (Chapter 1), and (c) in airfield pavements, it is necessary to consider the stresses induced during aircraft landing and maneuvering. 2.4.1 Distress criteria The following features can be helpful to distinguish other distress mechanisms.
1. Sub parallel cracking and cracking restricted to the near surface with scaling and spalling of the exposed surface and edges are primarily associated with freeze-thaw damage. A surface attacked by frost is rough and irregular.
2. Alkali-silica reactivity by itself does not usually cause disintegration of the
surface, except for aggregate pop-outs.
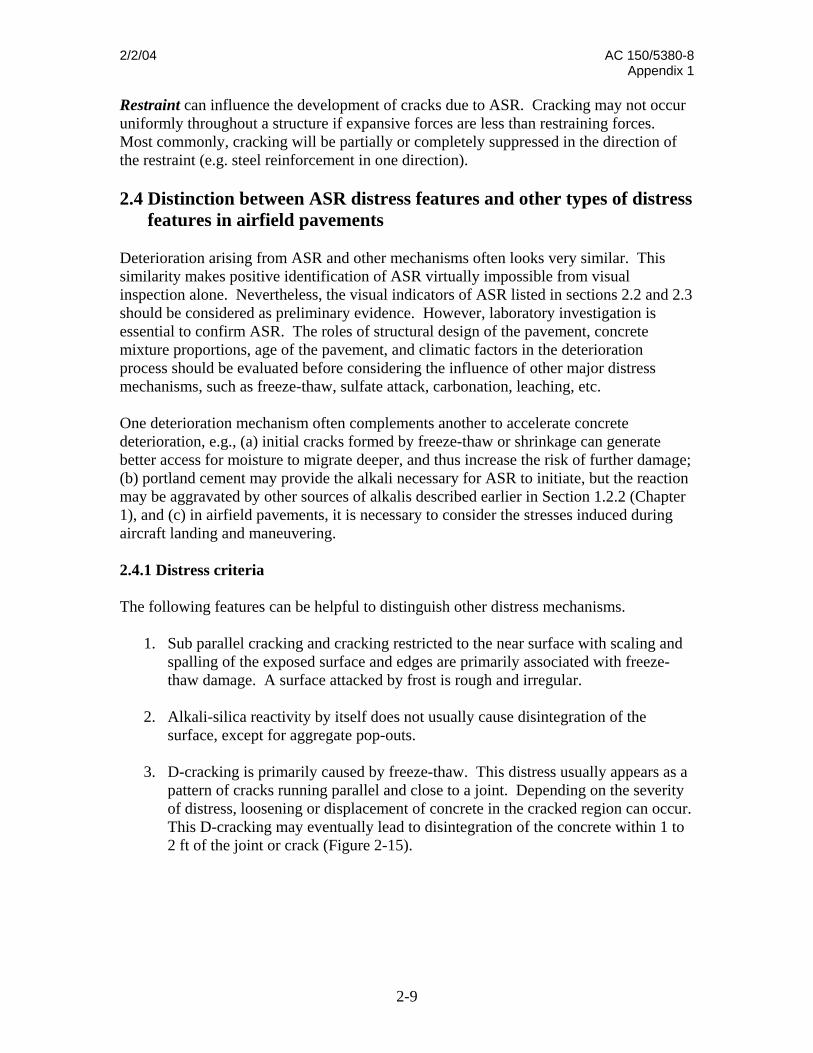
3. D-cracking is primarily caused by freeze-thaw. This distress usually appears as a pattern of cracks running parallel and close to a joint. Depending on the severity of distress, loosening or displacement of concrete in the cracked region can occur. This D-cracking may eventually lead to disintegration of the concrete within 1 to 2 ft of the joint or crack (Figure 2-15).
AC 150/5380-8 2/2/04 Appendix 1
If repr
4. Sege(XEDgy
5. Po
caresyar
6. Co
anm
2-10
Figure 2-15. D-cracking (→) in an airfield pavement.
any of these distress criteria are present in an airfield pavement located in a gion vulnerable to freeze-thaw, then one must exercise caution in identifying the imary cause of distress.
vere exfoliation, that is, when layers of concrete are detached from the surface, nerally caused by sulfate attack. However, chemical analysis, x-ray diffraction RD) or scanning electron microscope-energy dispersive spectroscopy (SEM-S) is essential for proper identification of reaction products, e.g., abundance of
psum, ettringite, etc., to confirm sulfate attack.
rous aggregates that undergo freeze-thaw attack can also cause pop-outs. In the se of ASR, the gel, if present, can be identified from visual inspection of the gion of the crater created by pop-out. Typically, one or two additional mptoms of ASR, such as map cracking, laddering, misalignment of joints, etc. e associated with the pop-out.
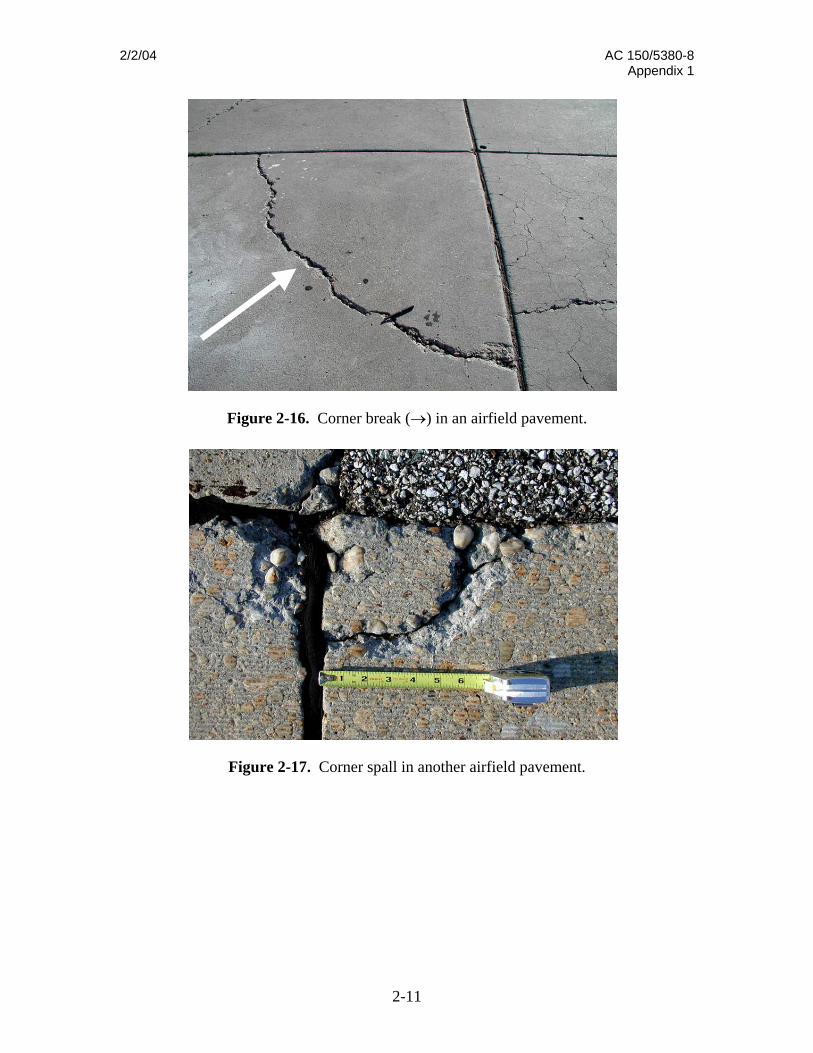
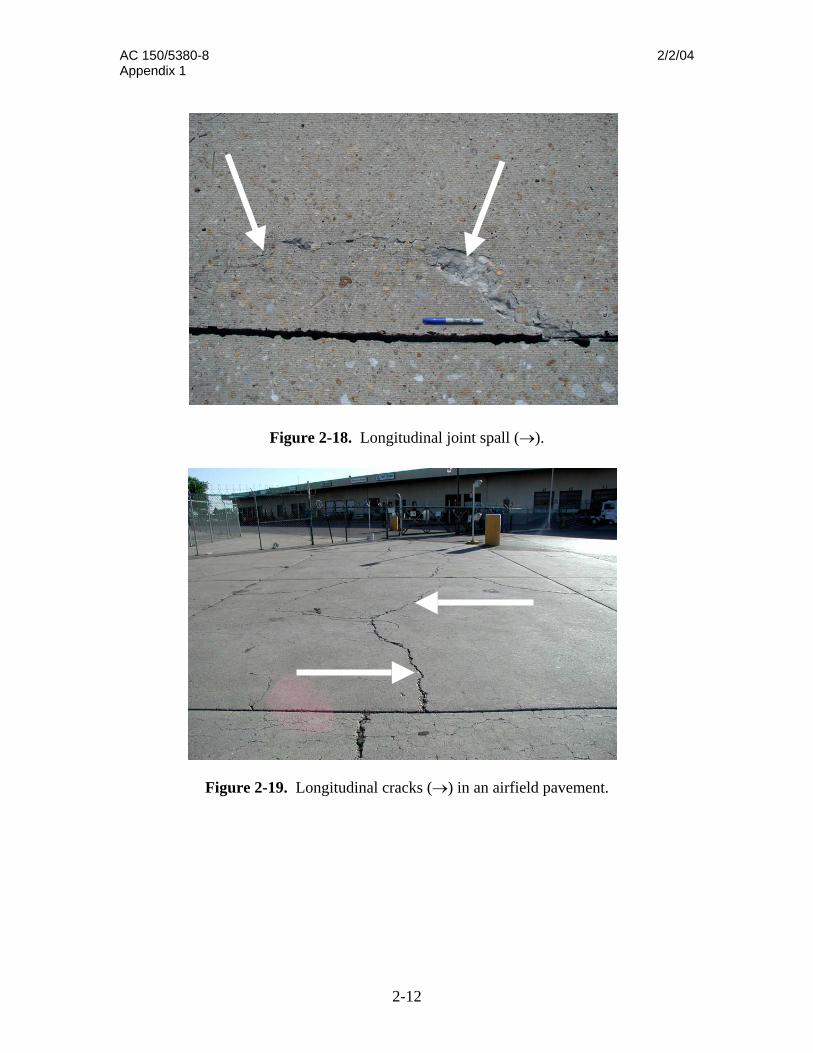
rner breaks (Figure 2-16), corner spall (Figure 2-17), joint spall (Figure 2-18), d transverse/longitudinal cracks (Figure 2-19) are caused by other distress echanisms.
2/2/04 AC 150/5380-8 Appendix 1
Figure 2-16. Corner break (→) in an airfield pavement.
2-11
Figure 2-17. Corner spall in another airfield pavement.
AC 150/5380-8 2/2/04 Appendix 1
2-12
Figure 2-18. Longitudinal joint spall (→).
Figure 2-19. Longitudinal cracks (→) in an airfield pavement.
2/2/04 AC 150/5380-8 Appendix 1
2-13
2.5 Application of dyes to detect ASR gel in the field Use of the uranyl (uranium) acetate fluorescence method (UAFM) ⎯ Often it is not very easy to identify ASR gel in the field with the unaided eye. The surface of the pavement may be covered with dirt and grime deposited over many years. The dye method can be used on any concrete surface to identify ASR gel. The gel may be present in varying proportions in aggregate rims and cracks, air voids, fractures, and on the exposed surface of concrete as exudation. By applying uranyl acetate solution to the surface, the gel, if present in an unaltered state, imparts a characteristic yellowish green glow in ultraviolet (UV) light (254 nm) because of uranyl ion substitution for alkali in the gel. The gel fluoresces much more brightly than cement paste due to the higher concentration of alkali. The following steps are recommended for use of this method. All safety precautions must be followed while preparing and using this solution. Gloves must be worn when using some of these dyes. The Material Safety Data Sheet (MSDS) must be consulted before using dyes. Step 1: Uranyl acetate solution ⎯ Prepare a dilute acetic acid solution by adding 5 mL of glacial acetic acid to distilled water to make up 200 mL of solution. Add 5 g uranyl acetate powder to the dilute acetic acid solution. Warm but do not boil to dissolve the powder. The process will not work properly if the solution boils. Step 2: A fresh concrete surface free of laitance and carbonation is required. This can be exposed at approximately ¼ inch depth using a rotary hammer, hammering by hand, or by sawing. Step 3: Powder concrete must be rinsed off the surface with water. Step 4: The uranyl acetate solution is sprayed on the fresh concrete surface, allowed to react for 5 minutes, and the surface is rinsed with water. Step 5: A light-excluding viewing box (portable darkroom) containing ultra violet (UV) light is used because the fluorescence of the silica gel due to absorption of uranium ions is too faint to see in daylight. Source: Uranyl acetate is available from any chemical supplier. Ultra violet light box – A viewing box that can be placed over the surface to be viewed. Provision must be made for a UV light lamp and for excluding ordinary light. Use of other dyes such as cuprammonium sulfate solution does not provide very effective coloration to enable clear distinction of ASR.
AC 150/5380-8 2/2/04 Appendix 1
2-14
2.6 Selection of coring locations for further laboratory investigation If some definite indications of ASR are obtained from visual inspection of the pavement, then the next step is to collect cores from strategic locations for further laboratory investigation. Airfield pavements generally consist of a series of slabs. Very often these slabs were constructed at different times. So it is likely that different concrete mixture proportions were used. Background information about the different slabs in a concrete pavement, if available, can be useful for selecting coring locations. The location and number of cores should depend on the following:
1. Severity of distress ⎯ The severity of external cracking may not necessarily correlate with the severity of internal damage. So, collecting a full-depth core is always desirable. In general, it is recommended to collect one core per each distress feature. If the severity of a distress feature varies, e.g., from low to high then the engineer has the option to collect more than one core, for example, one from high-severity area and another from low severity area. Similarly, if the distribution pattern of a particular distress feature (such as map-cracking) is repetitive from one sample unit to another, then the engineer has the option to reduce the coring rating.
In fact, cores from adjacent pavements without visual distress may be appropriate when attempting to determine the severity of distress. In some instances, ASR distress can be very localized and limited to small pockets where reactive aggregates were used (see Figure 2-3). 2. Age of concrete ⎯ If possible, cores from sections of different construction ages
should be selected. 3. Concrete mixture proportions/Presence or absence of fly ash or slag ⎯ Cores
from slabs/sections with different mixture proportions or at least whether fly ash/slag was used in the concrete should be included in the coring plan.
4. Variation in concentration of cracking within a slab ⎯ the concentration of
cracking may vary from one section to another within the same slab as shown in Figures 2-20 and 2-21. If necessary, cores should be collected from different affected parts of the same slab to determine if ASR is localized or global distress.
2/2/04 AC 150/5380-8 Appendix 1
2-15
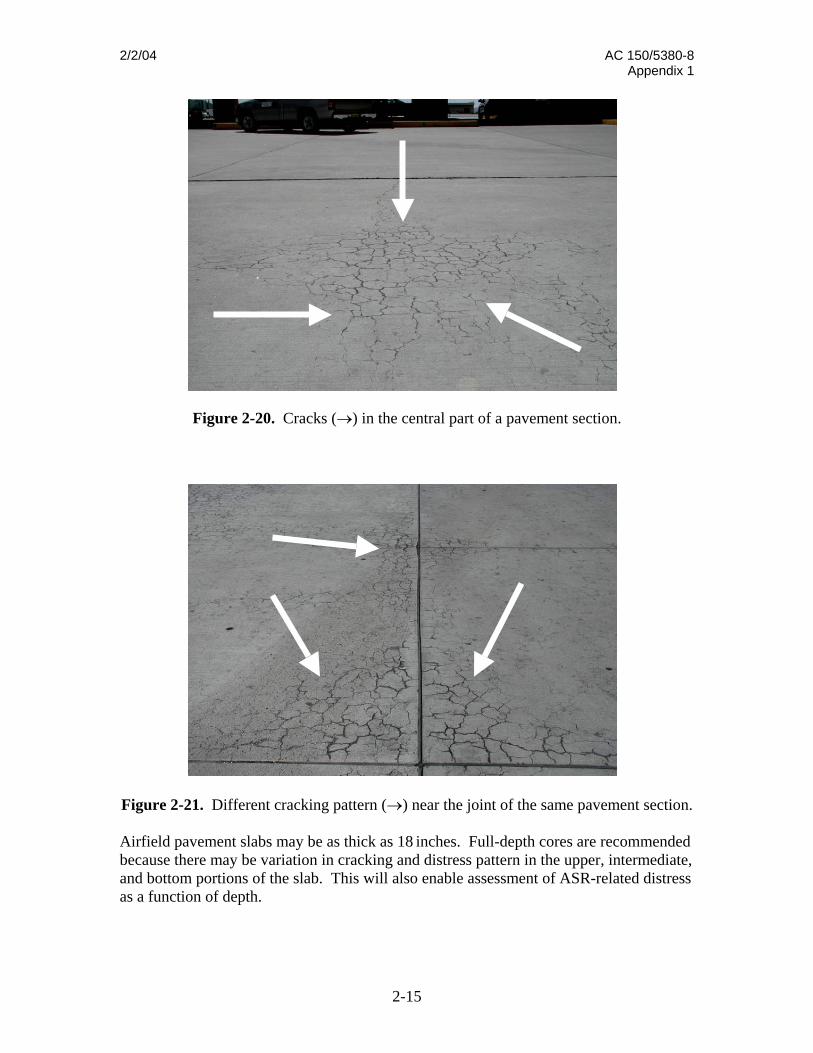
Figure 2-20. Cracks (→) in the central part of a pavement section.
Figure 2-21. Different cracking pattern (→) near the joint of the same pavement section. Airfield pavement slabs may be as thick as 18 inches. Full-depth cores are recommended because there may be variation in cracking and distress pattern in the upper, intermediate, and bottom portions of the slab. This will also enable assessment of ASR-related distress as a function of depth.
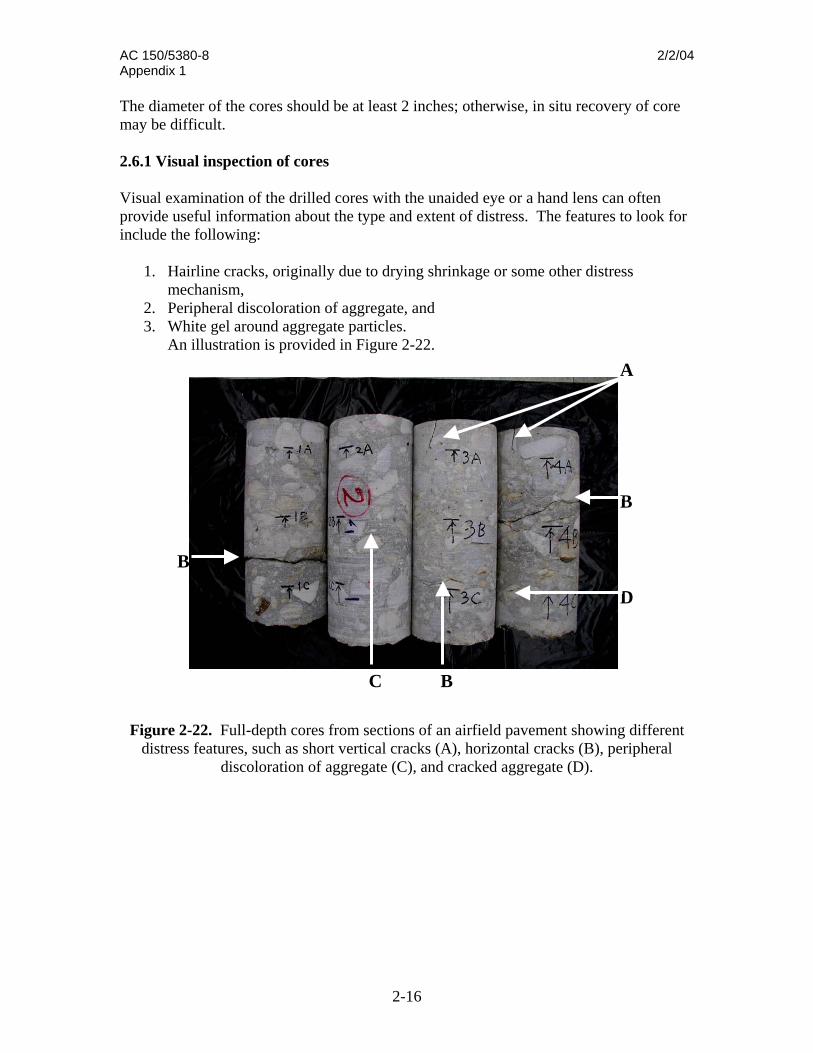
AC 150/5380-8 2/2/04 Appendix 1 The diameter of the cores should be at least 2 inches; otherwise, in situ recovery of core may be difficult. 2.6.1 Visual inspection of cores Visual examination of the drilled cores with the unaided eye or a hand lens can often provide useful information about the type and extent of distress. The features to look for include the following:
1. Hairline cracks, originally due to drying shrinkage or some other distress mechanism,
2. Peripheral discoloration of aggregate, and 3. White gel around aggregate particles.
An illustration is provided in Figure 2-22.
Figure 2distres
A
B
2-16
-22. Full-depth cores from sections of an airfield pavement showing different s features, such as short vertical cracks (A), horizontal cracks (B), peripheral
discoloration of aggregate (C), and cracked aggregate (D).
B
BC
D
2/2/04 AC 150/5380-8 Appendix 1
2-17
2.7 Summary A summary is presented in order to reinforce the steps involved in a performing a thorough field investigation.
• Visual signs to be considered: map-cracking, laddering, aggregate pop-out, reaction rim around aggregate particle, open or gel-filled cracks in aggregate particle, gel exudation.
• Structural evidence of expansion due to ASR to be considered – joint closure, joint seal damage, joint misalignment, blowup/heaving.
• UAFM dye test method in field to detect ASR gel in visible cracks (applicable only if gel is present in an unaltered state). Unaltered gel if present, can be identified in cracks, and fractures on the exposed surface of pavement by its characteristic yellowish-green glow under UV light.
Coring for further laboratory investigation:
• In general, it is recommended to collect one core per distress feature. • If the severity of a distress feature varies, e.g., from low to high then the engineer
has the option to collect more than one core, for example, one from high-severity area and another from low severity area. Similarly, if the distribution pattern of a particular distress feature (such as map-cracking) is repetitive from one sample unit to another, then the engineer has the option to reduce the coring rating.
• Collect full-depth cores with diameter of at least 2 inch., but not larger than 4 inch.

2/2/04 AC 150/5380-8 Appendix 1
3-1
Chapter 3: Laboratory Investigations
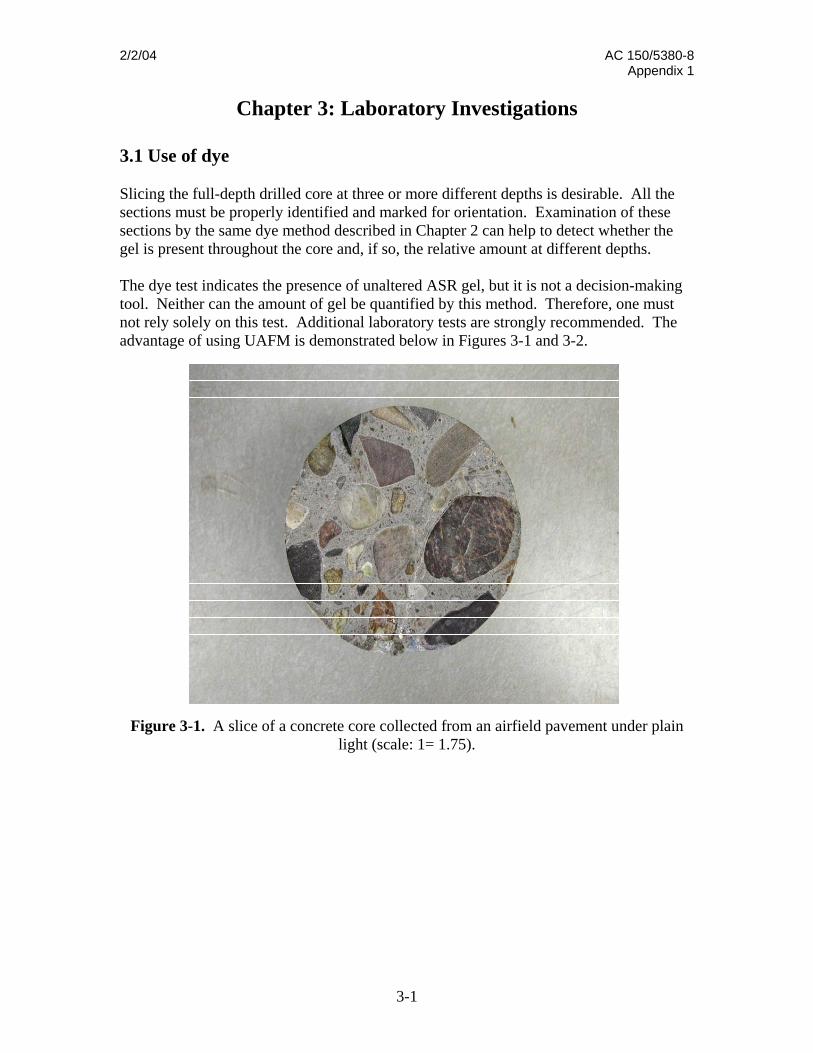
3.1 Use of dye Slicing the full-depth drilled core at three or more different depths is desirable. All the sections must be properly identified and marked for orientation. Examination of these sections by the same dye method described in Chapter 2 can help to detect whether the gel is present throughout the core and, if so, the relative amount at different depths. The dye test indicates the presence of unaltered ASR gel, but it is not a decision-making tool. Neither can the amount of gel be quantified by this method. Therefore, one must not rely solely on this test. Additional laboratory tests are strongly recommended. The advantage of using UAFM is demonstrated below in Figures 3-1 and 3-2.
Figure 3-1. A slice of a concrete core collected from an airfield pavement under plain light (scale: 1= 1.75).
AC 150/5380-8 2/2/04 Appendix 1
3-2
Figure 3-2. The same section after dye treatment when viewed under UV light shows ASR gel along cracks and around aggregate periphery (→). Scale: 1=1.75
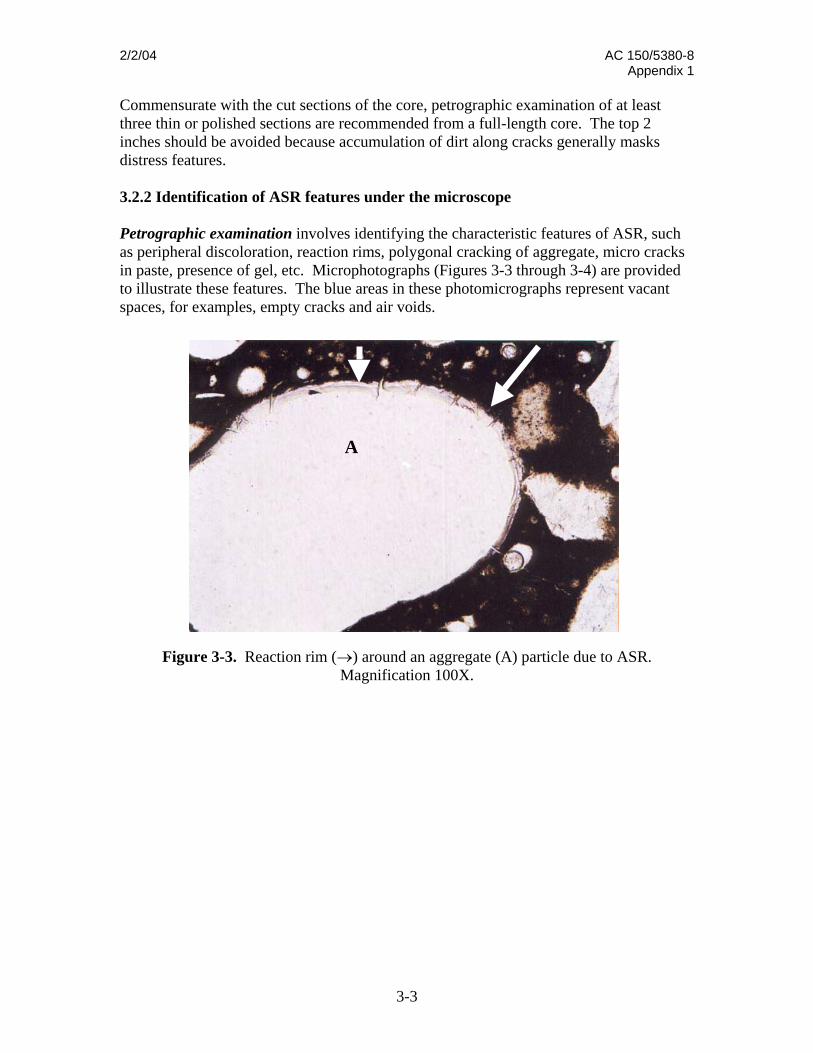
3.2 Optical microscopic techniques to identify ASR 3.2.1 Optical microscopy A polarizing light microscope, typically in the magnification range of ~32× – 800× is used for petrographic analysis. The resolution of a petrographic microscope is between 5 and 10 µm. The polarizing light or petrographic microscope is designed to analyze light transmitted through or reflected from a sample. Optical microscopy utilizes cross-polarization of light. Qualitative data can be derived from microscopic examination. Thin concrete sections are studied in the transmitted-light mode; the reflected-light mode is more suited for examination of polished samples. Most modern petrographic microscopes are equipped with both light sources. A camera attached to the microscope has become a standard accessory for photographically recording important observations. Optical microscopy is a highly useful, simple, and inexpensive tool for identifying ASR. While optical microscopy offers a relatively rapid means of diagnosing ASR, sample preparation is elaborate, time-consuming, and somewhat demanding. Nevertheless, optical microscopy can reliably serve to identify the deterioration features of ASR. Although it can provide some definite answers, additional testing, if available, is strongly recommended. A resin-soluble blue dye can be vacuum impregnated during sample preparation. The use of dye facilitates recognition of micro cracks and voids.
2/2/04 AC 150/5380-8 Appendix 1
3-3
Commensurate with the cut sections of the core, petrographic examination of at least three thin or polished sections are recommended from a full-length core. The top 2 inches should be avoided because accumulation of dirt along cracks generally masks distress features. 3.2.2 Identification of ASR features under the microscope Petrographic examination involves identifying the characteristic features of ASR, such as peripheral discoloration, reaction rims, polygonal cracking of aggregate, micro cracks in paste, presence of gel, etc. Microphotographs (Figures 3-3 through 3-4) are provided to illustrate these features. The blue areas in these photomicrographs represent vacant spaces, for examples, empty cracks and air voids.
Figure 3-3. Reaction rim (→) around an aggregate (A) particle due to ASR. Magnification 100X.
A
AC 150/5380-8 2/2/04 Appendix 1
3-4
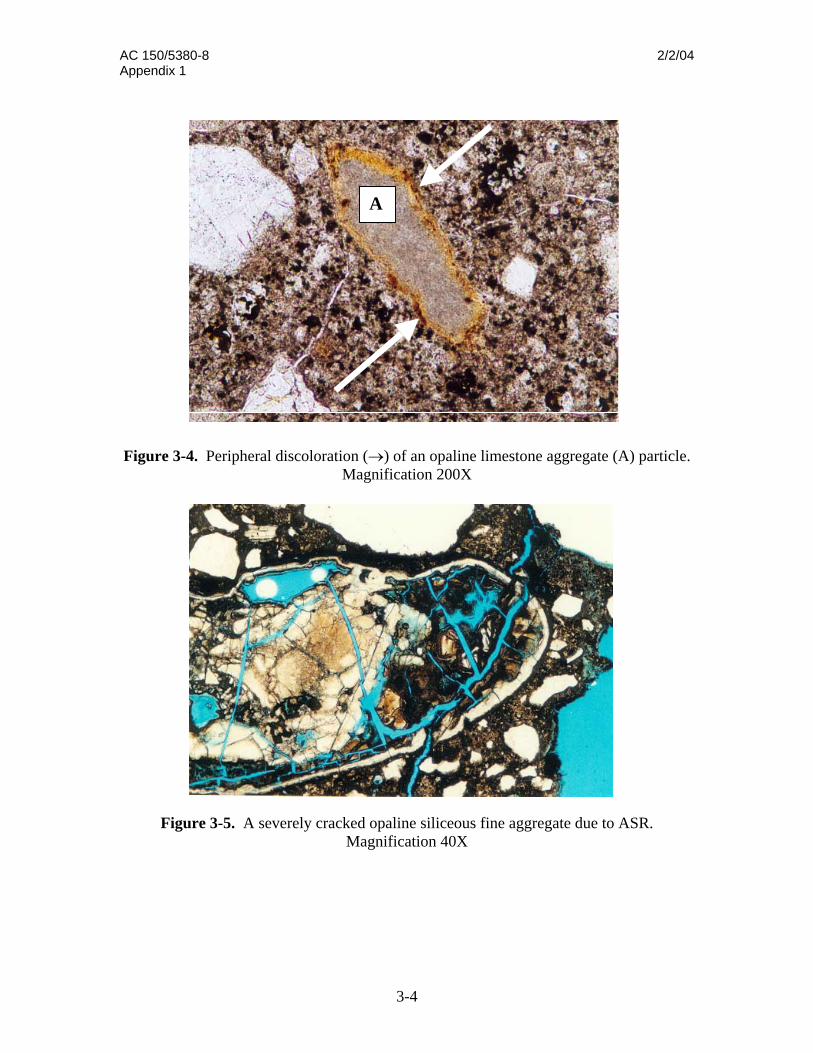
Figure 3-4. Peripheral discoloration (→) of an opaline limestone aggregate (A) particle. Magnification 200X
Figure 3-5. A severely cracked opaline siliceous fine aggregate due to ASR. Magnification 40X
A
2/2/04 AC 150/5380-8 Appendix 1
3-5
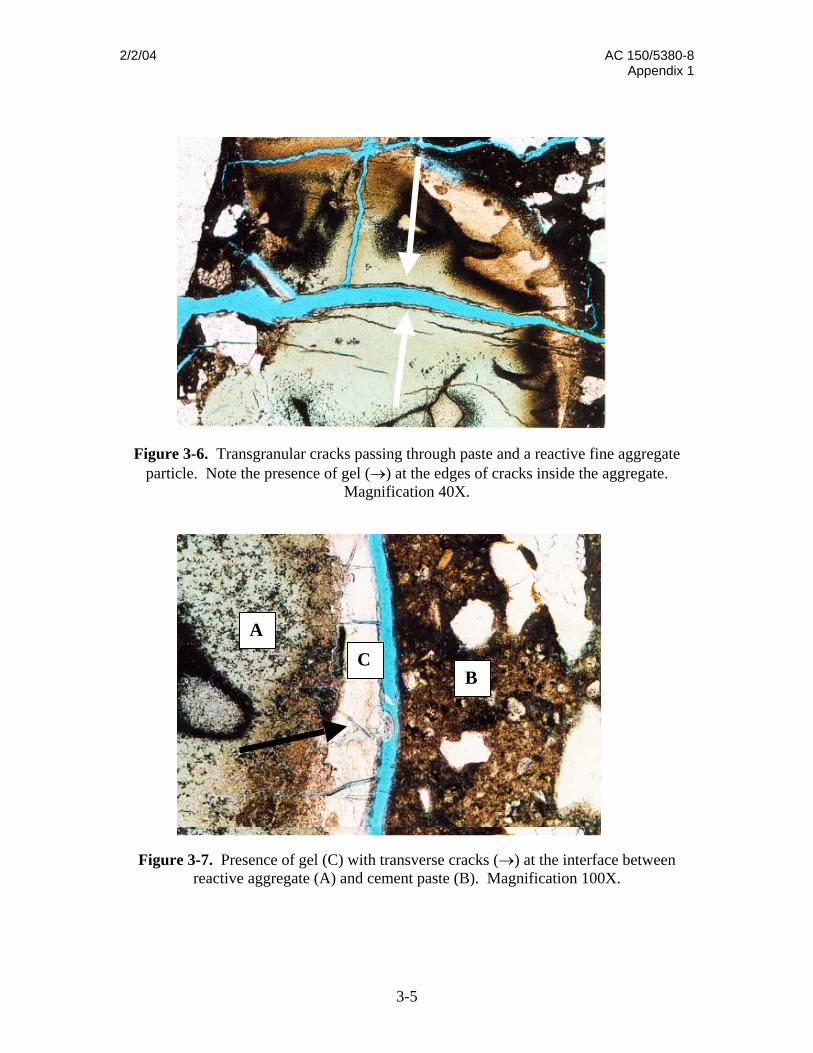
Figure 3-6. Transgranular cracks passing through paste and a reactive fine aggregate particle. Note the presence of gel (→) at the edges of cracks inside the aggregate.
Magnification 40X.
Figure 3-7. Presence of gel (C) with transverse cracks (→) at the interface between reactive aggregate (A) and cement paste (B). Magnification 100X.
A
BC
AC 150/5380-8 2/2/04 Appendix 1
3-6
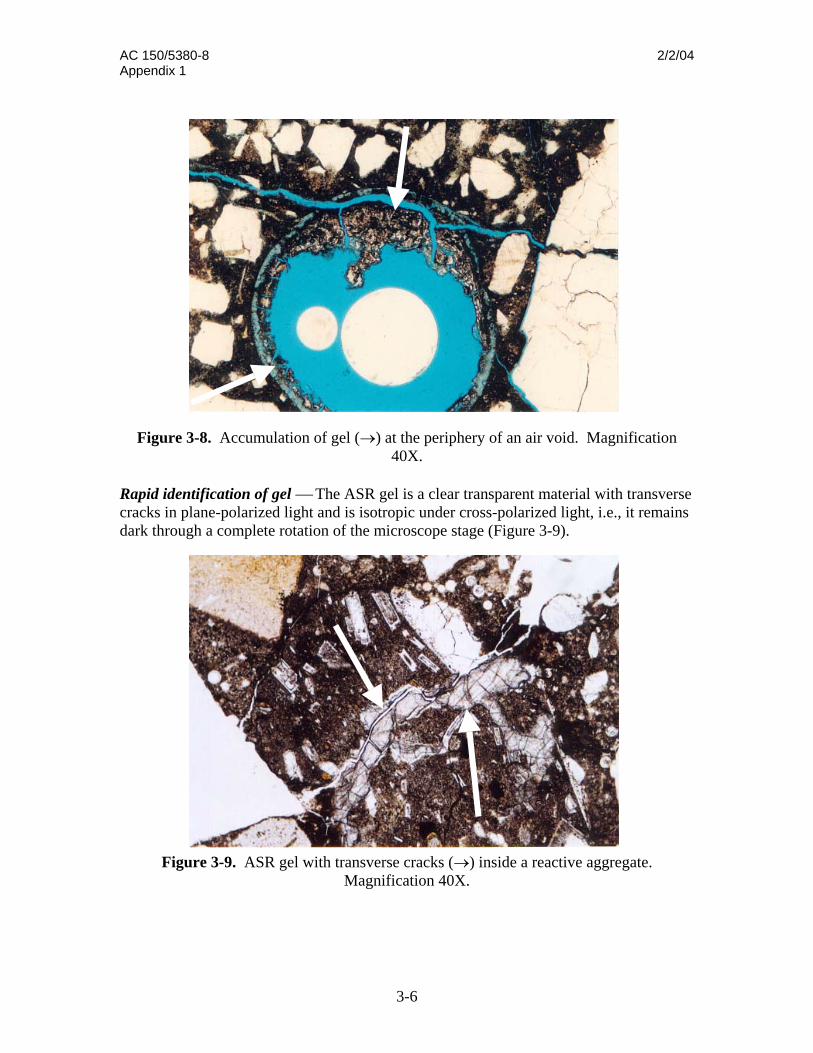
Figure 3-8. Accumulation of gel (→) at the periphery of an air void. Magnification
40X.
Rapid identification of gel ⎯ The ASR gel is a clear transparent material with transverse cracks in plane-polarized light and is isotropic under cross-polarized light, i.e., it remains dark through a complete rotation of the microscope stage (Figure 3-9).
Figure 3-9. ASR gel with transverse cracks (→) inside a reactive aggregate. Magnification 40X.

2/2/04 AC 150/5380-8 Appendix 1
3-7
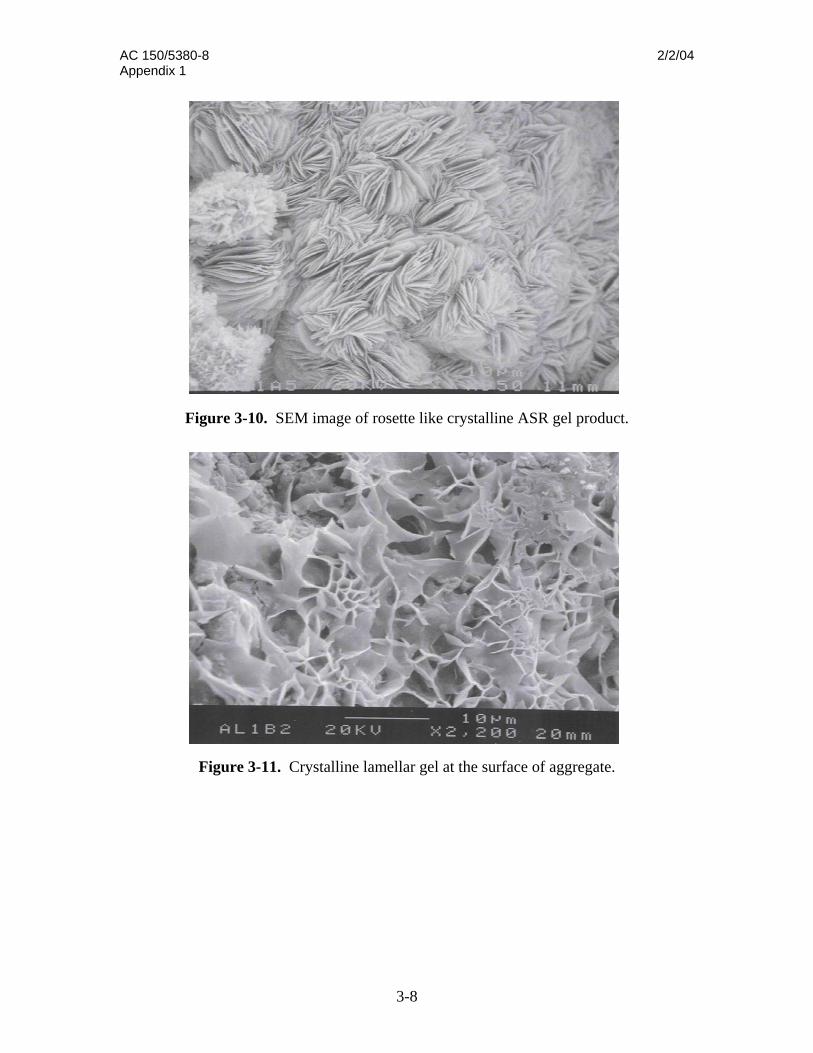
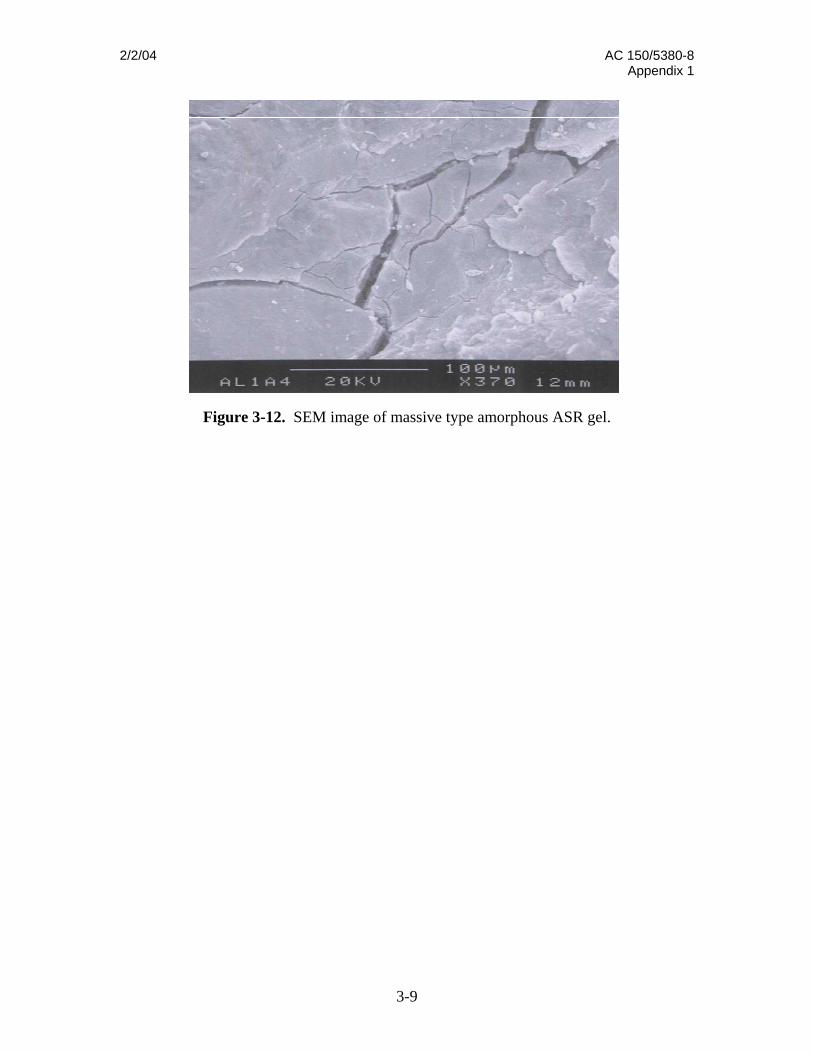
Identification of reactive aggregates ⎯ Both coarse and fine aggregates may be reactive. Therefore, both should be carefully examined petrographically. Figures 1-2 and 1-3 presented in Chapter 1 show a few examples of different forms of reactive silica. 3.3 Scanning electron microscopy/energy dispersive X-ray analysis A scanning electron microscope (SEM) uses a primary electron beam to scan the specimen surface. SEM allows direct observation of surface topography. Very low (20×) to very high (50, 000×) magnification can be selected. SEM provides a much greater depth of field than optical microscopes, creating a three dimensional effect. In addition, SEM imagery is easy to interpret, especially in combination with energy dispersive X-ray analyzer (EDXA). One of SEM’s greatest advantages lies in the possibility of examining fractured concrete specimens, although flat polished specimens can also be observed with relative ease. Samples can be in any form, provided they can withstand the high vacuum required in the specimen chamber for the operation of the microscope. Concrete samples must be treated with a thin conductive coating of gold (Au), gold-palladium (Au-Pd), or carbon (C) prior to observation under the microscope to prevent charge build up on the surface. EDXA is used in conjunction with SEM. EDXA determines the elemental analysis of the phases by analyzing the characteristic X-rays generated by an electron beam. Therefore, confirmation of the presence of ASR gel and its composition can be ascertained by SEM-EDXA. Crystalline and amorphous gel can be clearly distinguished by SEM. Since EDXA analysis cannot be restricted to an arbitrary small volume, spurious contributions as a result of the beam passing through the crystal being analyzed may jeopardize accurate analysis. Scanning electron microscopy involves identifying ASR gel by its characteristic morphology. Typical morphologies of gel, namely rosette types (Figure 3-10), lamellar types (Figure 3-11) which are the crystalline variety, and massive cracked types (Figure 3-12) which is non-crystalline, can be used as diagnostic features to confirm ASR.
AC 150/5380-8 2/2/04 Appendix 1
3-8
Figure 3-10. SEM image of rosette like crystalline ASR gel product.
Figure 3-11. Crystalline lamellar gel at the surface of aggregate.
2/2/04 AC 150/5380-8 Appendix 1
3-9
Figure 3-12. SEM image of massive type amorphous ASR gel.

2/2/04 AC 150/5380-8 Appendix 1
4-1
Chapter 4: ASR Distress Analysis in Airfield Pavements
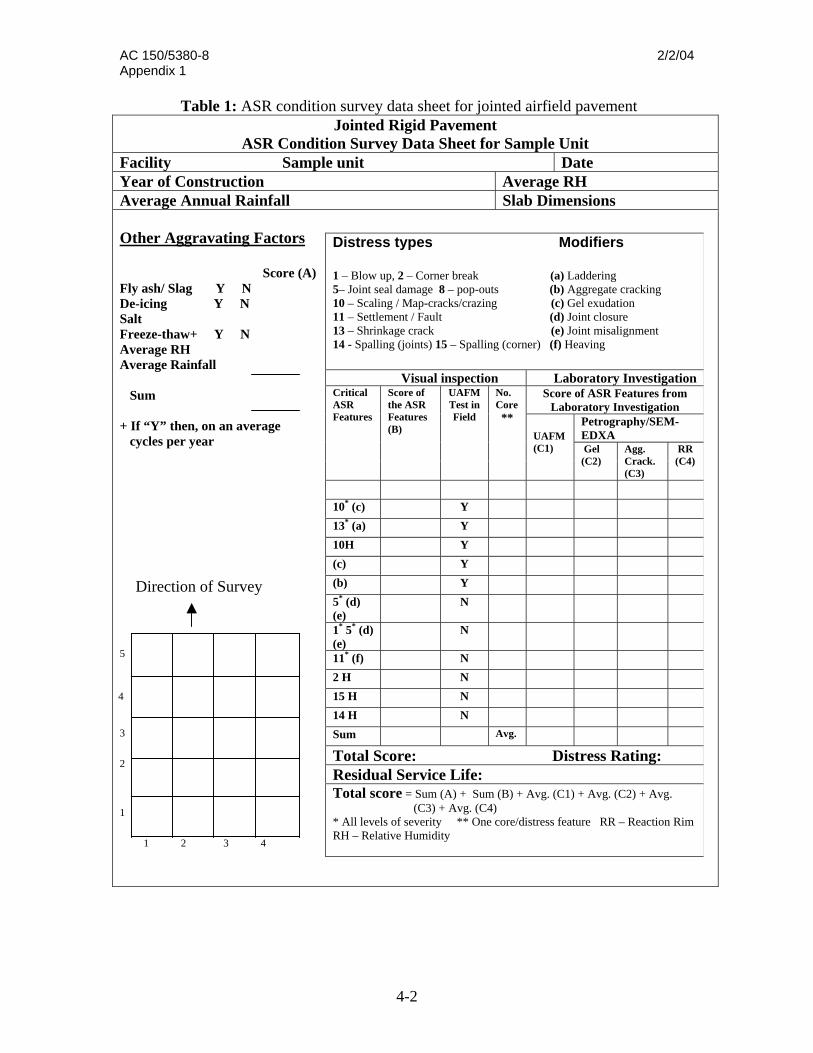
4.1 ASR condition survey The condition survey of ASR in airfield pavements is based on identification of critical distress features from visual inspection, followed by laboratory investigation, if any symptoms of ASR are detected. The modified survey data sheet, which is based on the original condition survey of distress data sheet in ASTM 5340 Airport Pavement Condition Index Surveys, is presented in Table 1. Modifiers, that is, characteristic features related to ASR distress, have been in added to the original list of distress types in the survey sheet in order to provide a more authentic ASR distress rating.
AC 150/5380-8 2/2/04 Appendix 1
Table 1: ASR condition survey data sheet for jointed airfield pavement Jointed Rigid Pavement
ASR Condition Survey Data Sheet for Sample Unit Facility Sample unit Date Year of Construction Average RH Average Annual Rainfall Slab Dimensions Other Aggravating Factors
Score (A) Fly ash/ Slag Y N De-icing Y N Salt Freeze-thaw+ Y N Average RH Average Rainfall Sum + If “Y” then, on an average cycles per year Direction of Survey 5
4 3 2 1 1 2 3 4
Distress types Modifiers 1 – Blow up, 2 – Corner break (a) Laddering 5– Joint seal damage 8 – pop-outs (b) Aggregate cracking 10 – Scaling / Map-cracks/crazing (c) Gel exudation 11 – Settlement / Fault (d) Joint closure 13 – Shrinkage crack (e) Joint misalignment 14 - Spalling (joints) 15 – Spalling (corner) (f) Heaving
Visual inspection Laboratory Investigation Score of ASR Features from
Laboratory Investigation Petrography/SEM-EDXA
Critical ASR Features
Score of the ASR Features (B)
UAFM Test in Field
No. Core **
UAFM (C1) Gel
(C2) Agg. Crack. (C3)
RR (C4)
10* (c) Y 13* (a) Y 10H Y (c) Y (b) Y 5* (d) (e)
N 1* 5* (d) (e)
N 11* (f) N 2 H N 15 H N 14 H N Sum Avg. Total Score: Distress Rating: Residual Service Life: Total score = Sum (A) + Sum (B) + Avg. (C1) + Avg. (C2) + Avg.
4-2
(C3) + Avg. (C4) * All levels of severity ** One core/distress feature RR – Reaction Rim RH – Relative Humidity
2/2/04 AC 150/5380-8 Appendix 1
4-3
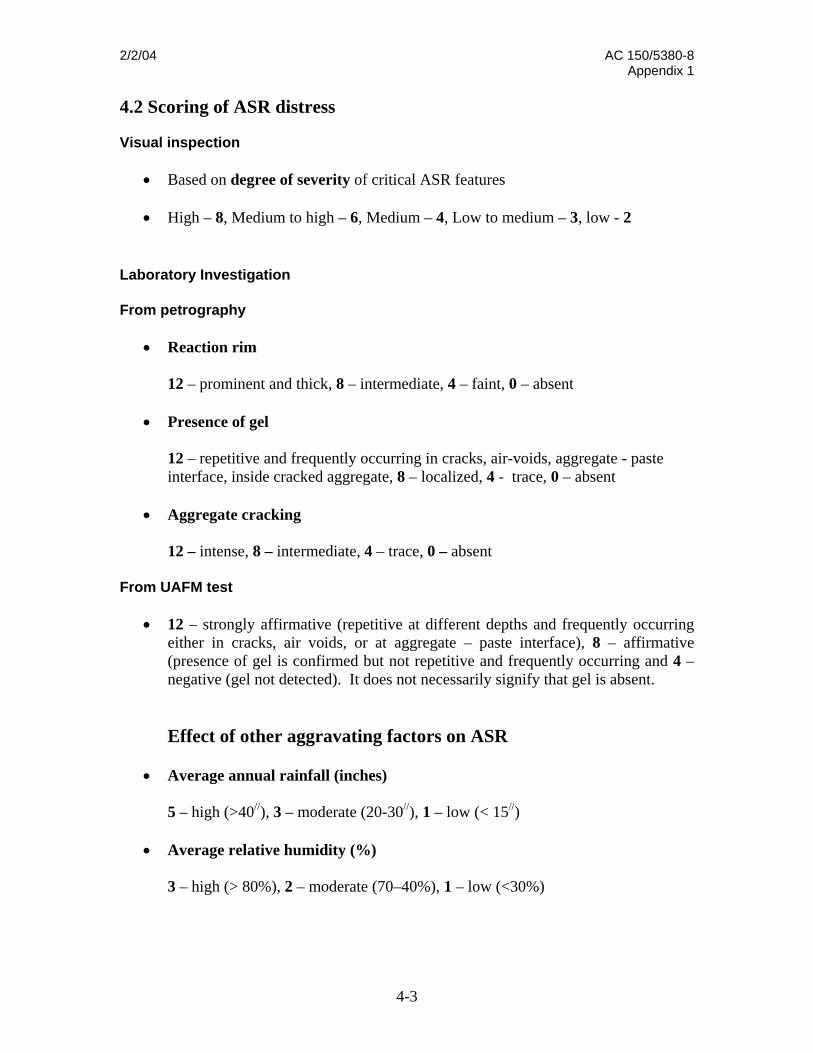
4.2 Scoring of ASR distress Visual inspection
• Based on degree of severity of critical ASR features
• High – 8, Medium to high – 6, Medium – 4, Low to medium – 3, low - 2 Laboratory Investigation From petrography
• Reaction rim 12 – prominent and thick, 8 – intermediate, 4 – faint, 0 – absent
• Presence of gel 12 – repetitive and frequently occurring in cracks, air-voids, aggregate - paste interface, inside cracked aggregate, 8 – localized, 4 - trace, 0 – absent
• Aggregate cracking 12 – intense, 8 – intermediate, 4 – trace, 0 – absent From UAFM test
• 12 – strongly affirmative (repetitive at different depths and frequently occurring either in cracks, air voids, or at aggregate – paste interface), 8 – affirmative (presence of gel is confirmed but not repetitive and frequently occurring and 4 – negative (gel not detected). It does not necessarily signify that gel is absent.
Effect of other aggravating factors on ASR
• Average annual rainfall (inches) 5 – high (>40//), 3 – moderate (20-30//), 1 – low (< 15//)
• Average relative humidity (%)
3 – high (> 80%), 2 – moderate (70–40%), 1 – low (<30%)
AC 150/5380-8 2/2/04 Appendix 1
4-4
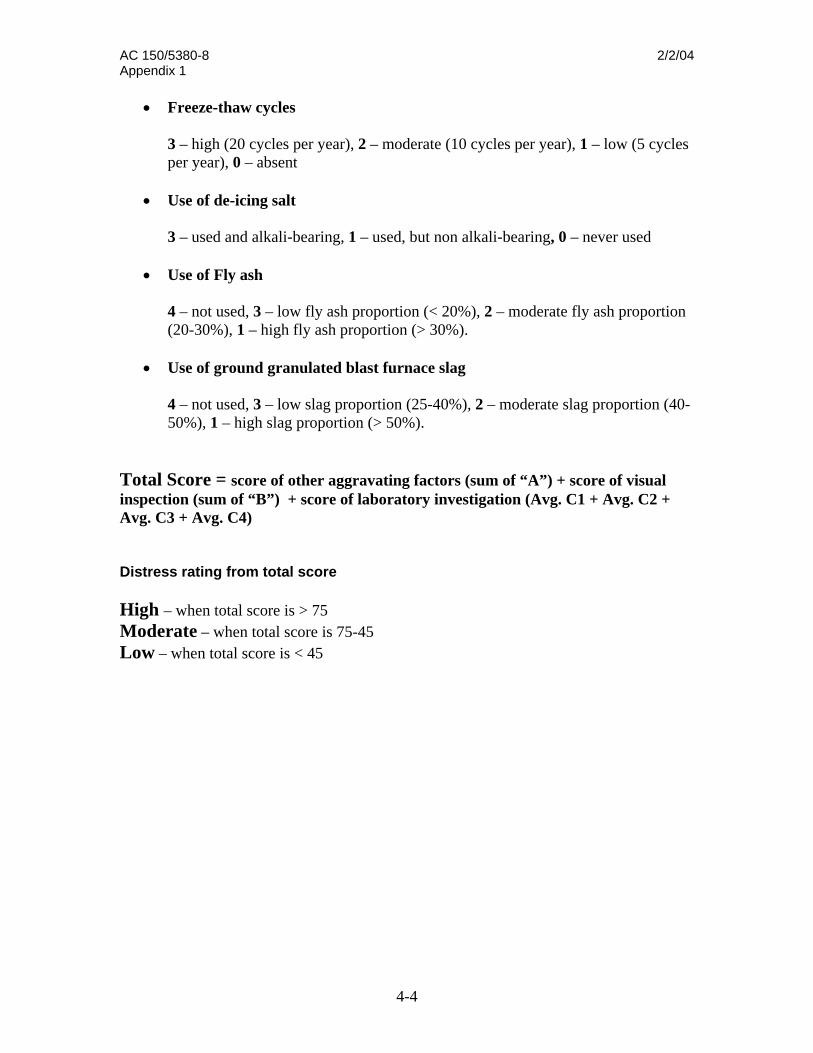
• Freeze-thaw cycles 3 – high (20 cycles per year), 2 – moderate (10 cycles per year), 1 – low (5 cycles per year), 0 – absent
• Use of de-icing salt
3 – used and alkali-bearing, 1 – used, but non alkali-bearing, 0 – never used
• Use of Fly ash
4 – not used, 3 – low fly ash proportion (< 20%), 2 – moderate fly ash proportion (20-30%), 1 – high fly ash proportion (> 30%).
• Use of ground granulated blast furnace slag 4 – not used, 3 – low slag proportion (25-40%), 2 – moderate slag proportion (40- 50%), 1 – high slag proportion (> 50%). Total Score = score of other aggravating factors (sum of “A”) + score of visual inspection (sum of “B”) + score of laboratory investigation (Avg. C1 + Avg. C2 + Avg. C3 + Avg. C4) Distress rating from total score High – when total score is > 75 Moderate – when total score is 75-45 Low – when total score is < 45
2/2/04 AC 150/5380-8 Appendix 1
4-5
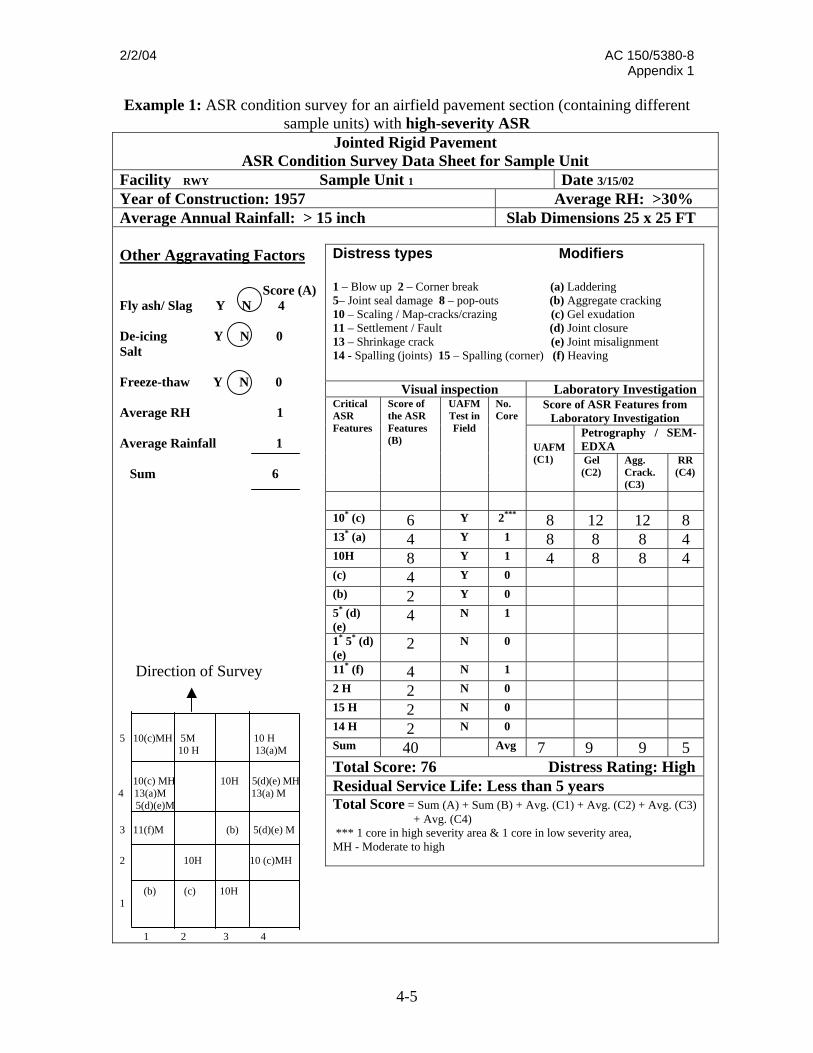
Example 1: ASR condition survey for an airfield pavement section (containing different sample units) with high-severity ASR
Jointed Rigid Pavement ASR Condition Survey Data Sheet for Sample Unit
Facility RWY Sample Unit 1 Date 3/15/02 Year of Construction: 1957 Average RH: >30% Average Annual Rainfall: > 15 inch Slab Dimensions 25 x 25 FT
Other Aggravating Factors
Score (A) Fly ash/ Slag Y N 4 De-icing Y N 0 Salt Freeze-thaw Y N 0 Average RH 1 Average Rainfall 1 Sum 6 Direction of Survey 5 10(c)MH 5M 10 H 10 H 13(a)M 10(c) MH 10H 5(d)(e) MH
4 13(a)M 13(a) M 5(d)(e)M 3 11(f)M (b) 5(d)(e) M 2 10H 10 (c)MH (b) (c) 10H 1 1 2 3 4
Distress types Modifiers 1 – Blow up 2 – Corner break (a) Laddering 5– Joint seal damage 8 – pop-outs (b) Aggregate cracking 10 – Scaling / Map-cracks/crazing (c) Gel exudation 11 – Settlement / Fault (d) Joint closure 13 – Shrinkage crack (e) Joint misalignment 14 - Spalling (joints) 15 – Spalling (corner) (f) Heaving
Visual inspection Laboratory Investigation Score of ASR Features from
Laboratory Investigation Petrography / SEM-EDXA
Critical ASR Features
Score of the ASR Features (B)
UAFM Test in Field
No. Core
UAFM (C1) Gel
(C2) Agg. Crack. (C3)
RR (C4)
10* (c) 6 Y 2*** 8 12 12 8 13* (a) 4 Y 1 8 8 8 4 10H 8 Y 1 4 8 8 4 (c) 4 Y 0 (b) 2 Y 0 5* (d) (e)
4 N 1 1* 5* (d) (e)
2 N 0 11* (f) 4 N 1 2 H 2 N 0 15 H 2 N 0 14 H 2 N 0 Sum 40 Avg 7 9 9 5 Total Score: 76 Distress Rating: High Residual Service Life: Less than 5 years Total Score = Sum (A) + Sum (B) + Avg. (C1) + Avg. (C2) + Avg. (C3) + Avg. (C4) *** 1 core in high severity area & 1 core in low severity area, MH - Moderate to high
AC 150/5380-8 2/2/04 Appendix 1
4-6
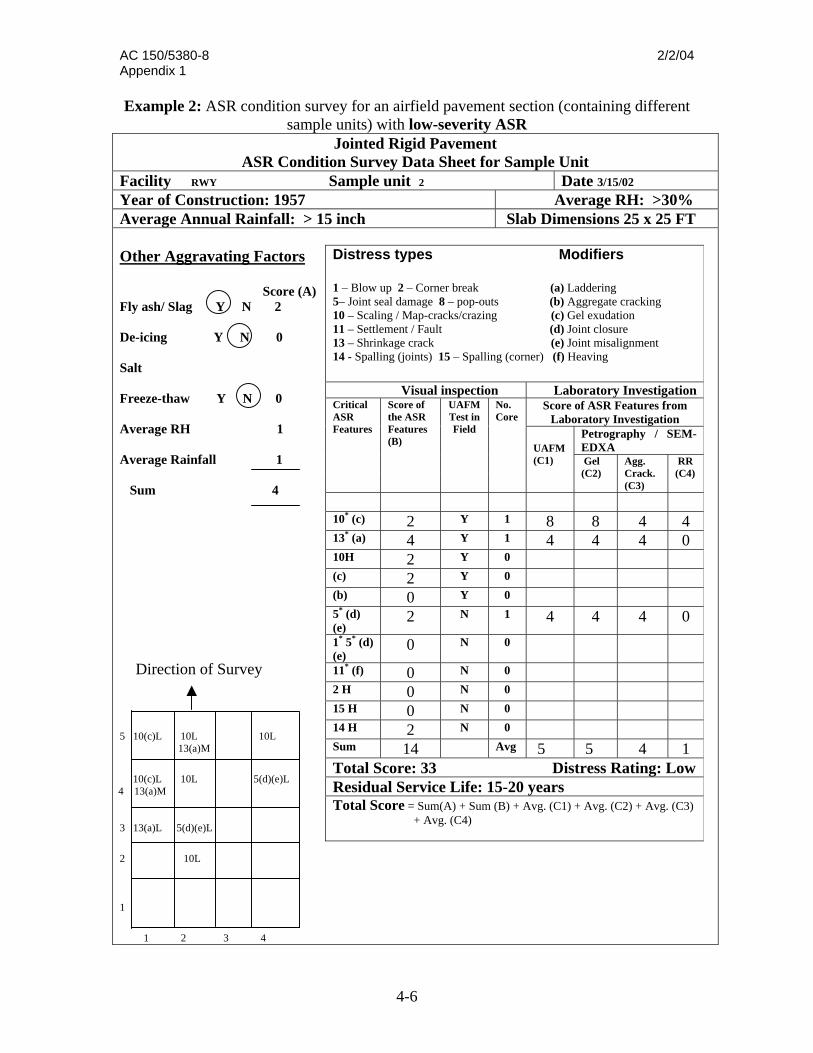
Example 2: ASR condition survey for an airfield pavement section (containing different sample units) with low-severity ASR
Jointed Rigid Pavement ASR Condition Survey Data Sheet for Sample Unit
Facility RWY Sample unit 2 Date 3/15/02 Year of Construction: 1957 Average RH: >30% Average Annual Rainfall: > 15 inch Slab Dimensions 25 x 25 FT
Other Aggravating Factors
Score (A) Fly ash/ Slag Y N 2 De-icing Y N 0 Salt Freeze-thaw Y N 0 Average RH 1 Average Rainfall 1 Sum 4 Direction of Survey 5 10(c)L 10L 10L 13(a)M 10(c)L 10L 5(d)(e)L
4 13(a)M 3 13(a)L 5(d)(e)L 2 10L 1 1 2 3 4
Distress types Modifiers 1 – Blow up 2 – Corner break (a) Laddering 5– Joint seal damage 8 – pop-outs (b) Aggregate cracking 10 – Scaling / Map-cracks/crazing (c) Gel exudation 11 – Settlement / Fault (d) Joint closure 13 – Shrinkage crack (e) Joint misalignment 14 - Spalling (joints) 15 – Spalling (corner) (f) Heaving
Visual inspection Laboratory Investigation Score of ASR Features from
Laboratory Investigation Petrography / SEM-EDXA
Critical ASR Features
Score of the ASR Features (B)
UAFM Test in Field
No. Core
UAFM (C1) Gel
(C2) Agg. Crack. (C3)
RR (C4)
10* (c) 2 Y 1 8 8 4 4 13* (a) 4 Y 1 4 4 4 0 10H 2 Y 0 (c) 2 Y 0 (b) 0 Y 0 5* (d) (e)
2 N 1 4 4 4 0 1* 5* (d) (e)
0 N 0 11* (f) 0 N 0 2 H 0 N 0 15 H 0 N 0 14 H 2 N 0 Sum 14 Avg 5 5 4 1 Total Score: 33 Distress Rating: LowResidual Service Life: 15-20 years Total Score = Sum(A) + Sum (B) + Avg. (C1) + Avg. (C2) + Avg. (C3) + Avg. (C4)
2/2/04 AC 150/5380-8 Appendix 1
4-7
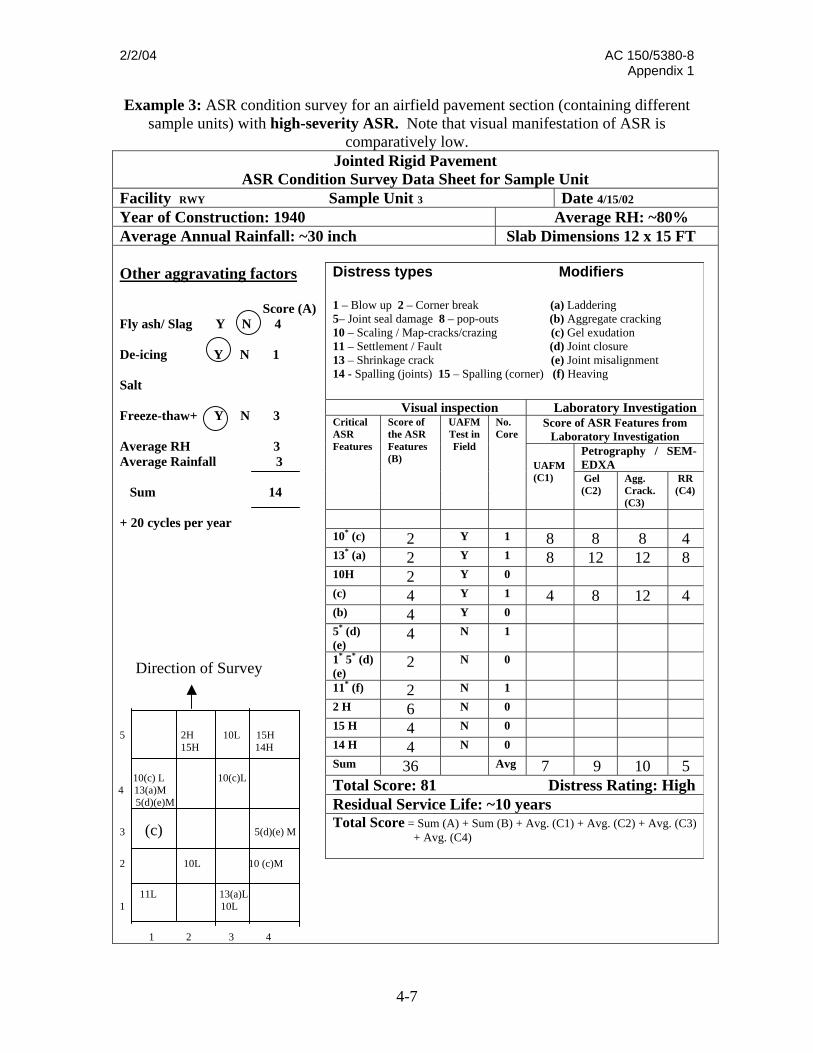
Example 3: ASR condition survey for an airfield pavement section (containing different sample units) with high-severity ASR. Note that visual manifestation of ASR is
comparatively low. Jointed Rigid Pavement
ASR Condition Survey Data Sheet for Sample Unit Facility RWY Sample Unit 3 Date 4/15/02 Year of Construction: 1940 Average RH: ~80% Average Annual Rainfall: ~30 inch Slab Dimensions 12 x 15 FT
Other aggravating factors
Score (A) Fly ash/ Slag Y N 4 De-icing Y N 1 Salt Freeze-thaw+ Y N 3 Average RH 3 Average Rainfall 3 Sum 14 + 20 cycles per year Direction of Survey 5 2H 10L 15H 15H 14H 10(c) L 10(c)L
4 13(a)M 5(d)(e)M 3 (c) 5(d)(e) M 2 10L 10 (c)M 11L 13(a)L 1 10L 1 2 3 4
Distress types Modifiers 1 – Blow up 2 – Corner break (a) Laddering 5– Joint seal damage 8 – pop-outs (b) Aggregate cracking 10 – Scaling / Map-cracks/crazing (c) Gel exudation 11 – Settlement / Fault (d) Joint closure 13 – Shrinkage crack (e) Joint misalignment 14 - Spalling (joints) 15 – Spalling (corner) (f) Heaving
Visual inspection Laboratory Investigation Score of ASR Features from
Laboratory Investigation Petrography / SEM-EDXA
Critical ASR Features
Score of the ASR Features (B)
UAFM Test in Field
No. Core
UAFM (C1) Gel
(C2) Agg. Crack. (C3)
RR (C4)
10* (c) 2 Y 1 8 8 8 4 13* (a) 2 Y 1 8 12 12 8 10H 2 Y 0 (c) 4 Y 1 4 8 12 4 (b) 4 Y 0 5* (d) (e)
4 N 1 1* 5* (d) (e)
2 N 0 11* (f) 2 N 1 2 H 6 N 0 15 H 4 N 0 14 H 4 N 0 Sum 36 Avg 7 9 10 5 Total Score: 81 Distress Rating: High Residual Service Life: ~10 years Total Score = Sum (A) + Sum (B) + Avg. (C1) + Avg. (C2) + Avg. (C3) + Avg. (C4)
AC 150/5380-8 2/2/04 Appendix 1
4-8
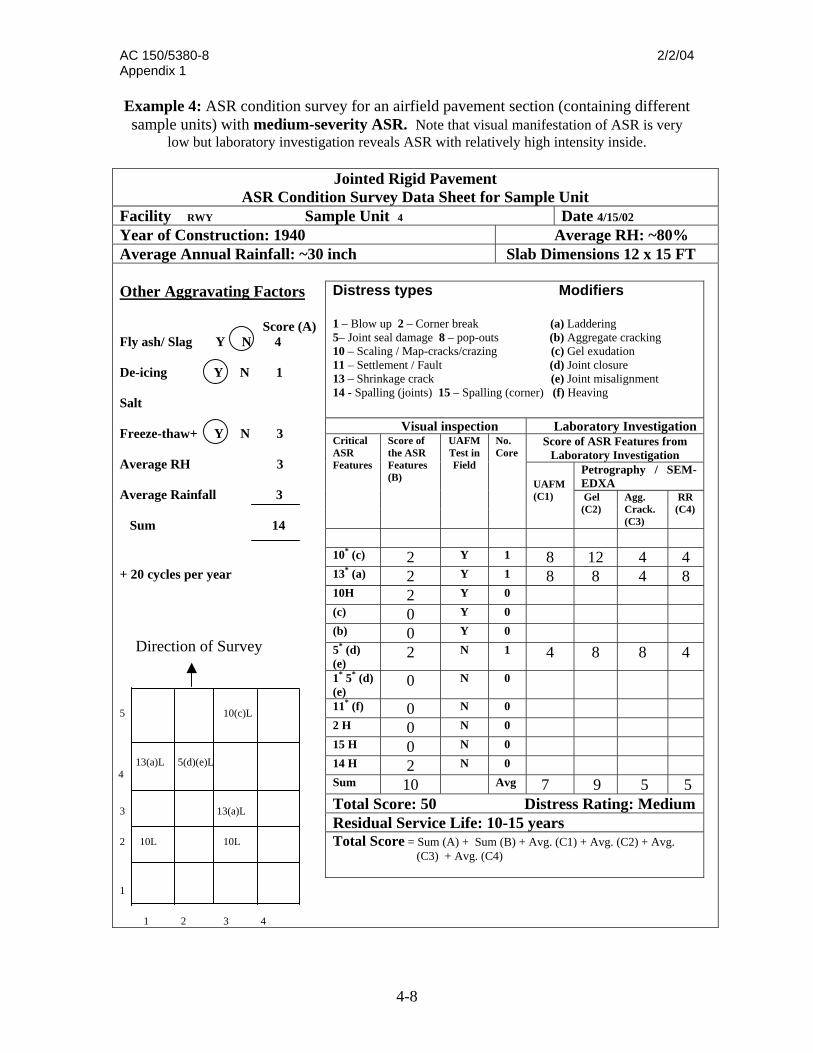
Example 4: ASR condition survey for an airfield pavement section (containing different sample units) with medium-severity ASR. Note that visual manifestation of ASR is very
low but laboratory investigation reveals ASR with relatively high intensity inside.
Jointed Rigid Pavement ASR Condition Survey Data Sheet for Sample Unit
Facility RWY Sample Unit 4 Date 4/15/02 Year of Construction: 1940 Average RH: ~80% Average Annual Rainfall: ~30 inch Slab Dimensions 12 x 15 FT
Other Aggravating Factors
Score (A) Fly ash/ Slag Y N 4 De-icing Y N 1 Salt Freeze-thaw+ Y N 3 Average RH 3 Average Rainfall 3 Sum 14 + 20 cycles per year Direction of Survey 5 10(c)L 13(a)L 5(d)(e)L
4 3 13(a)L 2 10L 10L 1 1 2 3 4
Distress types Modifiers 1 – Blow up 2 – Corner break (a) Laddering 5– Joint seal damage 8 – pop-outs (b) Aggregate cracking 10 – Scaling / Map-cracks/crazing (c) Gel exudation 11 – Settlement / Fault (d) Joint closure 13 – Shrinkage crack (e) Joint misalignment 14 - Spalling (joints) 15 – Spalling (corner) (f) Heaving
Visual inspection Laboratory Investigation Score of ASR Features from
Laboratory Investigation Petrography / SEM-EDXA
Critical ASR Features
Score of the ASR Features (B)
UAFM Test in Field
No. Core
UAFM (C1) Gel
(C2) Agg. Crack. (C3)
RR (C4)
10* (c) 2 Y 1 8 12 4 4 13* (a) 2 Y 1 8 8 4 8 10H 2 Y 0 (c) 0 Y 0 (b) 0 Y 0 5* (d) (e)
2 N 1 4 8 8 4 1* 5* (d) (e)
0 N 0 11* (f) 0 N 0 2 H 0 N 0 15 H 0 N 0 14 H 2 N 0 Sum 10 Avg 7 9 5 5 Total Score: 50 Distress Rating: Medium Residual Service Life: 10-15 years Total Score = Sum (A) + Sum (B) + Avg. (C1) + Avg. (C2) + Avg. (C3) + Avg. (C4)
2/2/04 AC 150/5380-8 Appendix 1
4-9
4.3 Detailed explanation of the survey sheet 4.3.1 Other aggravating factors: Data collection and scoring Although high moisture, sufficient alkali, reactive aggregate are the essential parameters for ASR to occur, other factors related to climate and materials can aggravate ASR. For example, supplementary cementitious materials such as fly ash, slag or combination thereof in concrete when used in appropriate proportions, have been demonstrated to control expansion due to ASR. On the other hand, the use of de-icing salt, or repeated occurrence of freeze-thaw cycles can aggravate ASR. Alkali-bearing de-icing salt that was used in the past, can act as a source of additional alkali. The frequency of cracks can increase as a result of regular freeze-thaw cycles. This in turn can act as passage for moisture to penetrate the concrete. Similarly, high relative humidity (RH) condition and heavy rainfall can also aggravate ASR. 4.3.2 Visual inspection Identification of critical ASR features and scoring based on degree of severity
• Visual signs to be considered: map-cracking, laddering, aggregate pop-out, reaction rim around aggregate particle, open or gel-filled cracks in aggregate particle, gel exudation
• Structural evidence of expansion due to ASR to be considered: joint closure, joint seal damage, joint misalignment, blowup/heaving
UAFM dye test method in field to detect ASR gel in visible cracks (applicable only if gel is present in an unaltered state)
• Unaltered gel if present, can be identified in cracks, and fractures on the exposed surface of pavement by its characteristic yellowish-green glow under UV light.
Coring for further laboratory investigation
• In general, it is recommended to collect one core per distress feature. • If the severity of a distress feature varies, e.g., from low to high then the engineer
has the option to collect more than one core, for example, one from high-severity area and another from low severity area. Similarly, if the distribution pattern of a particular distress feature (such as map-cracking) is repetitive from one sample unit to another, then the engineer has the option to reduce the coring rating.
• Collect full-depth cores with diameter of at least 2 inch., but not larger than 4 inch.
AC 150/5380-8 2/2/04 Appendix 1
4-10
4.3.3 Laboratory Investigation of critical ASR features Visual inspection of cores
• Inspect type of cracks, whether they are due to shrinkage or due to other causes, peripheral discoloration of aggregate, white gel around aggregate particle, internal cracks in aggregate particles.
Repeat UAFM dye test method on core samples and scoring based on test result
• Slice the full-depth drilled core at three or more different depths, example, top, middle, and bottom.
• Examine these sections by the UAFM dye method to detect presence of unaltered ASR gel at different depths.
Gel can be identified (if present) in aggregate rims, cracks, and fractures by its characteristic yellowish-green glow under UV light. If the glow is observed then ASR is affirmative. Application of optical microscopic techniques for confirmation of ASR as indicated from visual inspection and scoring Identification of critical ASR features
• Presence of gel inside aggregate, at the cement paste – aggregate interface, in air voids and along cracks
• Cracking of aggregate and micro-cracks in paste • Reaction rim around aggregate
Scanning electron microscopy / energy dispersive X-ray analysis
• Involves identifying ASR gel by its characteristic morphology, namely rosette structure, massive or lamellar type etc. at higher magnification SEM
• Confirmation of the elemental composition of ASR gel from EDXA
Complete survey sheet, and assign ASR distress rating in survey sheet. The distress rating, e.g., low, medium and high will be based on the combined results of visual inspection, laboratory investigation and other aggravating factors related to materials and climate.
2/2/04 AC 150/5380-8 Appendix 1
5-1
Chapter 5: Mitigation and Prevention of ASR 5.1 Common preventive measures for ASR
1. Use non-reactive aggregate, if possible. According to ASTM C1260 test (Chapter 7) expansion less than 0.10% at 14 days is indicative of innocuous behavior of most aggregates and can be considered as diagnostic feature of non-reactive aggregate. Furthermore, petrographic examination according to ASTM C 295 method is desirable to confirm this (Chapter 1, Section 1.2.1).
2. Use low-alkali cement – typically but not always, less than 0.6% sodium oxide (Na2O) cement controls ASR.
3. Limiting the alkali content of the concrete mixture – 3 kg/m3 alkalis in concrete can be a limit for potentially reactive aggregate where aggregate reactivity is defined as (i) reactive when expansion is greater than 0.20% at 14 days, and potentially reactive when it is between 0.10% and 0.20% at 14 days according to ASTM C 1260 test method.
4. Use supplementary cementing materials.
(a) Fly ash replacement: 30% to 35% fly ash replacement by mass of cement is an effective way to reduce expansion due to ASR. The reaction can be slowed down to the point where it will prevent ASR for the design life of a concrete pavement. However, reduction in expansion due to fly ash incorporation varies with aggregate type, class and chemical composition of fly ash, especially the alkali content, and amount of fly ash replacement. In general higher the amount of fly ash replacement, the better the effect of controlling expansion. Higher the pozzolanic activity of fly ash, the higher the preventive effect on ASR provided fly ash does not contribute any extra alkali. Reduction in expansion incorporating class F fly ash, regardless of the replacement percentage, is higher than that of class C fly ash. Increasing the level of replacement of fly ash or slag can produce greater reduction in expansion, but may lead to poor resistance to deicer salt scaling. The use of an appropriately proportioned ternary mix results in a marked reduction in expansion equal to, or greater than influences of a single supplementary cementing material. Pessimum effect of fly ash to control ASR possibly does not exist.
(b) Silica fume: The addition of 10% silica fume by mass of cement can completely
suppress ASR, possibly because of reduction in OH– concentration. (c) Ternary blend cement with appropriate proportions of fly ash, slag or silica fume
in combination causes a marked reduction in expansion due to ASR that exceeds the influence of a single supplementary cementing material.
(d) Use lithium nitrate: Lithium is the lightest metal in the elemental periodic table,
with an atomic number of 3, atomic weight of 6.94, and density of 0.53 g/cm3 (about half that of water). It is a naturally occurring substance and is a silvery-white metal, slightly harder than sodium, but softer than lead. Lithium nitrate
AC 150/5380-8 2/2/04 Appendix 1
5-2
(LiNO3) is the most effective form of Li used in mitigation of ASR. When lithium is used, although silica gel is still formed, the gel remains innocuous, i.e., it does not cause cracking. There are two aspects of mitigating ASR with the use of lithium compounds in concrete, i.e., (a) prevent expansion by adding lithium compound in new concrete and (b) mitigate further expansion in concrete that has already been affected by ASR.
5.2 Lithium use in new concrete When a concrete is designed to last 50-75 years or more, incorporation of lithium in the mixture to prevent the future occurrence of ASR can be beneficial. The alkali content of cement in a concrete mixture determines the dosage of lithium nitrate that needs to be incorporated. The standard dose is 0.55 gallons of lithium per pound of alkali per unit of concrete. The minimum dosage of lithium should be based on aggregate reactivity tested according to the modified ASTM C 1260 method. The effect of lithium in reducing ASR expansion cannot be tested by the standard ASTM C 1260 method by adding lithium in the mortar mix, because lithium leaches out in the 1N NaOH solution. The sodium in the soak solution swamps the amount of lithium necessary. To overcome this problem, lithium is added to the soak solution at levels to match the alkali equivalent (Na2Oeq). Standard dose of lithium present in most commonly used lithium-bearing compounds are (1) LiNO3 - 30% LiNO3 in solution, and (2) lithia glass –the dose is based on Li/Na molar ratio. 100% lithia glass dose represents the amount of glass that supplies 0.74 Li/Na molar ratio. The lithium content is calculated from lithia or LiO2 concentration in glass, and sodium from the Na2Oeq of the cement. Lithia glass is a new type of solid admixture now commercially available. It is basically glass made from a mixture of recycled soda-lime glass and lithium. Lithium is added to the glass, and the mixture is re-melted. The resulting glass is then ground to a fine powder suitable for use as a supplementary cementing material. The glass is formulated to react in the concrete over a period of time, that is, slowly release lithium into the cementitious system. Typically, the dosage of lithia glass is 1.85 kg per cubic yard of concrete. Lithia glass in combination with other supplementary cementing materials (especially fly ash) has demonstrated expansion lower than either lithia glass or fly ash alone in the laboratory. These combinations have suppressed ASR expansion to a very low level. The combined use of lithium and supplementary cementing materials is recommended for economic reasons and for improving concrete quality. 5.3 Mitigation of ASR in existing concrete Lithium is effective in controlling further expansion in concrete structures with existing ASR and, therefore, can extend the service life of the ASR affected concrete. The effectiveness of lithium treatment depends on the depth of penetration. The following are the common application methods for treating ASR affected concrete.
2/2/04 AC 150/5380-8 Appendix 1
5-3
1. Electrochemical chloride extraction, 2. Topical application, such as ponding and spraying 3. Vacuum impregnation, and 4. Pressure injection
However, the dosage and application technique may vary according to conditions such as extent of damage and type of structure. In case of airfield pavements, the most practical methods of application are (a) topical application, such as ponding and spraying, (b) vacuum permeation, and (c) pressure injection. These methods are briefly described below.
Spray Application. This is most common for flatwork such as pavements, and bridge decks. Tests will have to be performed on the spray rate, which can be varied from 3.0 to 4.5 gal/1,000ft2, and the soak time required. Additionally, the effect of multiple passes needs to be evaluated. This of course can increase the total amount of lithium nitrate required from 3.0 to 9.0 gal/1,000ft2. Ponding. The pavement structure needs to be ponded with lithium nitrate solution so as to maintain contact with the structure for at least 24 hours to get sufficient penetration into the surface. Vacuum Permeation. This is a fairly recent and distinctive technology, which was originally developed in Europe. The basic process has been used in North America since 1985. Unlike pressure injection, the vacuum permeation process withdraws air and moisture from cracks and pores prior to impregnation of the repair solution or resin, which in this case will be lithium nitrate. The tendency for the damaged structure to burst, so characteristic of conventional pressure injection methods, can be eliminated by the vacuum permeation process. Some of the possible advantages of this process include the removal of residual moisture, and stress concentrations at the ends of cracks. The process can be expected to eliminate the internal damages caused by induced high pressures that normally arise when using pressure injection techniques. Pressure injection – The principle of this method is the same as that for injecting grout or slurry through cracks. This method is not recommended if structural integrity has been severely compromised due to advanced ASR, as the pressure applied to inject the lithium solution is likely to cause the structure to burst open. Another method in existence is electrochemical chloride extraction. This method was originally developed to remove chloride and thus reduce corrosion. However, the process can trigger ASR by introducing alkalis if the aggregate is reactive. The use of lithium in the electrolyte prevents ASR and therefore, the method is applicable to ASR remediation. Lithium ions can prevent ASR, regardless of the pH, at high dosages. However, this method may not very economical for airfield pavements.

2/2/04 AC 150/5380-8 Appendix 1
6-1
Chapter 6: References and Further Reading
ASTM C 441-89, 1989: Standard test method for effectiveness of mineral admixtures or
ground blast-furnace slag in preventing excessive expansion of concrete due to
alkali-silica reaction. Philadelphia.
ASTM C 227-90, 1990: Standard test method for potential alkali reactivity of cement-
aggregate combinations (mortar-bar method). Philadelphia.
ASTM C 295-90, 1990: Standard guide for petrographic examination of aggregates for
concrete. Philadelphia.
ASTM C289-94, 1994: Standard test method for potential alkali-silica reactivity of
aggregates (chemical method). Philadelphia.
ASTM C 1260-94, 1994: Standard test method for potential alkali reactivity of
aggregates (mortar-bar method). Philadelphia.
ASTM C 1293-01, 2001: Standard test method for concrete aggregates by determination
of length change of concrete due to alkali silica reaction. Philadelphia.
ASTM 5340-98, 1998: Chapter 7. Airport Pavement Condition Index Surveys 1982
AASHTO T 303, 1996. Accelerated detection of potentially deleterious expansion of
mortar bars due to alkali-silica reaction, AASHTO Standard Specifications for
Transportation Materials and Methods of Sampling and Testing. Nineteenth
Edition, 1998.
DeMerchant, D.P., Fournier, B., and Malhotra V.M., 1995. Alkali-aggregate
reactivity in New Brunswick, Canada – New Brunswick cooperation agreement
on mineral development, CANMET.
FHWA-SHRP showcase, 1995. Workshop on alkali-silica reactivity in highway
Structures. U.S. Department of Transportation, Federal Aviation Administration.
Publication No. FHWA-SA-95-039.
Helmuth, R. “Alkali-silica reactivity: An overview of research”, 1998. SHRP-C-342,
Strategic Highway Research Program, National Research Council, Washington,
D.C.
AC 150/5380-8 2/2/04 Appendix 1
6-2
Helmuth, R., Stark, D., and Diamond, S., 1992. Alkali-silica reactivity in concrete: an
overview of research, SHRP Report C/FR-92-000, Part II, pp. 3-6.
Johnston, D.P., Surdahl, R., and Stokes, D.B., 2000. A case study of a lithium-based
treatment of an ASR-affected pavement. Proceedings of the 11th International
Alkali-Aggregate Reaction (B. Fournier Ed.), Quebec, pp. 1149-1158.
Langley, W.S., and Fournier, B., 1993. Alkali-aggregate reactivity in Nova Scotia.
Canada -Nova Scotia cooperation agreement on mineral development, CANMET.
Paver Concrete Distress Manual. Pavement distress identification guide for jointed
concrete roads and parking lots. US Army Corps of Engineers, Construction
Engineering Research Laboratories, TR 97/105, June, 1997.
Shehata M.H., and Thomas M.D.A., 2002. Use of ternary blends containing silica fume
and fly ash to suppress expansion due to alkali-silica reaction in concrete, Cem.
Concr. Res. 32, pp. 341-349.
Stark, D., Morgan, B., Okarnoto, P., and Diamond, S., 1993. Eliminating or minimizing
alkali-silica reactivity. SHRP-C-343, Strategic Highway Research Program,
National Research Council, Washington, D.C., 266 p.
Stark D., 1993. Eliminating or minimizing alkali-silica reactivity, SHRP Report C-343,
National Research Council, Washington D.C.
Stark, D., 1991. “Handbook for identification of alkali-silica reactivity in highway
structures.” SHRP-C-315, Strategic Highway Research Program. National
Research Council, Washington, D.C.
Stokes, D.B., Thomas, M.D.A., and Shashiprakash, S.G., 2000. “Development of a
lithium-based material for decreasing ASR-induced expansion in hardened
concrete,” Proceedings of the 11th International Conference on Alkali-Aggregate
Reaction in Concrete (B. Fournier Ed.), Quebec, pp. 1079-1087.
2/2/04 AC 150/5380-8 Appendix 1
7-1
Chapter 7: Test Methods for ASR ASTM C 289: Standard test method for potential alkali-silica reactivity of aggregates (chemical method). This method is a quick chemical test to estimate potential reactivity of siliceous aggregate. This test identifies highly reactive aggregates fairly rapidly and is useful for initial screening of aggregate. Drawbacks: This test fails to identify slowly reactive aggregates. Certain aggregates produce a high amount of soluble silica in this test but do not necessarily produce expansion in service. The test does not always give reliable results and cannot be used to test carbonate rocks.
ASTM C 227: Standard test method for potential alkali reactivity of cement-aggregate combinations (mortar-bar method). This is a useful method for testing ASR susceptibility of cement-aggregate combinations. It measures expansion of mortars made with the test aggregate. Aggregate should conform to standard grading. Longer testing periods are preferred for differentiating reactivity of aggregate. Drawbacks: Unless highly reactive aggregates are tested, meaningful results require one year or more. Even after a long testing period, not all deleterious aggregates exhibit expansive behavior. Sometimes this method fails to distinguish between slowly reacting and innocuous aggregates. ASTM C 295: Standard guide for petrographic examination of aggregates for concrete. This method is a comparatively quick way to predict aggregate reactivity based on microscopic examination of aggregate samples. Mineral properties in aggregate determine aggregate reactivity. This method is used as a screening method for aggregates. Correlating petrographic analysis of aggregate with service record in concrete can derive useful information. Drawbacks: This method does not give any quantitative information about aggregate’s actual behavior in concrete and is time consuming. Results will not reveal if an aggregate will cause deleterious expansion in concrete.
AC 150/5380-8 2/2/04 Appendix 1
7-2
ASTM C 441: Standard test method for effectiveness of mineral admixtures or slag in preventing excessive expansion of concrete due to alkali-silica reaction. This method is based on expansion developed in mortar bars and uses a combination of cement, mineral admixtures, and a reactive crushed Pyrex glass. The method can be used for preliminary screening to evaluate the relative effectiveness of different materials used to prevent excessive expansion due to ASR. Drawbacks: This method is considered unsatisfactory because Pyrex is highly reactive and may contain significant levels of alkalis. Moreover, it is not adaptable for testing aggregates from different sources, since it is mainly a test for cement ASR reactivity.
ASTM C 1260: Standard test method for potential alkali reactivity of aggregates (mortar-bar method). This is one of the most commonly used test methods for assessing the potential reactivity of aggregates. Expansion data of mortar can be obtained within as little as 16 days. The test method was developed because of the shortcomings of ASTM C 227 and ASTM C 289. This method, however, does not replace lengthier test methods. Drawbacks: Severe test conditions are applied which do not conform to field conditions. Aggregates with good field track records and no history of ASR can sometimes be classified as reactive when tested according to this method.
ASTM C 1293: Standard test method for concrete aggregates by determination of length change of concrete due to alkali silica reaction. This method measures expansion of concrete prisms made with the coarse and fine aggregates in question. Total alkali content of concrete should be 5.25 kg/m3. Drawbacks: This method involves cement-aggregate combinations and requires up to one year to complete.
2/2/04 AC 150/5380-8 Appendix 1
8-1
Chapter 8: Dilatometer ⎯ A Rapid Method for Testing Reactivity of As-Received Aggregates
8.1 Introduction
The undesirable expansion of concrete due to reaction between alkali and certain types of
reactive siliceous aggregates, known as alkali silica reaction (ASR) continues to be a detriment
to the long-term performance of airfield pavements. Recent interest to minimize distress
resulting from ASR has culminated in a need to predict concrete aggregate’s behavior relative to
ASR expansion.
A testing apparatus called “dilatometer” has been developed to test alkali reactivity potential of
concrete aggregates. The dilatometer is instrumented to monitor the volumetric expansion of
siliceous gel produced by ASR of aggregate placed in it within a relatively short period of time.
Various aspects of the proposed test procedure were explored with comprehensive laboratory
tests related to aggregate type, temperature, and normality of test solution. A clear distinction
between reactive, potentially reactive, and non-reactive aggregates can be made in less than 30
hours using this method. Furthermore, it also enables one to predict the dosage of lithium
nitrate, which is now being used as an ASR mitigating agent, needed for a particular aggregate to
control expansion due to ASR. Based on the test results, it is anticipated that this test method
will be useful for predicting ASR potential of aggregates from a wide range of sources in
different parts of the country that are used in concrete for the construction of airfield pavements.
Alkali-silica reaction occurs in concrete when alkalis from the cement, or from other
sources, react with free silica present in certain aggregates to form alkali-silica gel. This has the
property of absorbing water and expanding. This expansion can cause the aggregate particles
and the cement paste to crack, and this can ultimately damage the concrete [1, 2].
The two current methods for identifying potential for ASR in aggregates are ASTM C
295 petrographic method [3] and ASTM C 289 chemical method [4]. While the former is
considered strictly a screening method, the criticism of ASTM C 289 method is that some
AC 150/5380-8 2/2/04 Appendix 1
8-2
aggregates produce soluble silica, which does not necessarily produce expansion in concrete, and
therefore, the method is not capable of predicting the behavior of aggregate in terms of potential
ASR damage.
Another test method, ASTM C 441 [5] which is a mortar bar test using Pyrex glass, is
considered unsatisfactory because Pyrex is highly reactive and contains significant levels of
alkali. Moreover, it is not adaptable for testing aggregates from different sources since it is
mainly a test for cement ASR reactivity.
The ASTM C 1260, Test Method for Potential Alkali Reactivity of Aggregates (Mortar-
Bar Method) [6], is one of the most commonly used methods, because expansion data of mortar
can be obtained within as little as 16 days. The test measures the potential aggregate reactivity.
However, aggregates with good field track record and no history of ASR can sometimes be
classified as reactive when tested according to ASTM C 1260 method.
Stark [7] had suggested improvement of ASTM C 1260 test by varying the concentration
of the NaOH solution to match the pore solution of concrete. By varying concentrations of
NaOH solution, the test could then determine safe cement or concrete alkali levels for a
particular aggregate.
The concept of the new rapid test method is based on measuring the expansion produced
by siliceous gel when siliceous aggregate reacts with alkali. The procedure is relatively rapid,
and is able to reliably discriminate between innocuous, potentially reactive, and highly reactive
aggregates.
8.2 Experimental
Test device
The apparatus referred to as dilatometer, is illustrated in Figure 8-1. It consists of a
stainless steel cylindrical container, a Teflon-coated brass lid, a hollow tower installed on the lid,
and a float. The inner surface of the lid is configured at a certain angle so that air bubbles can be
easily removed. The device is prepared by placing the aggregate sample and NaOH test solution
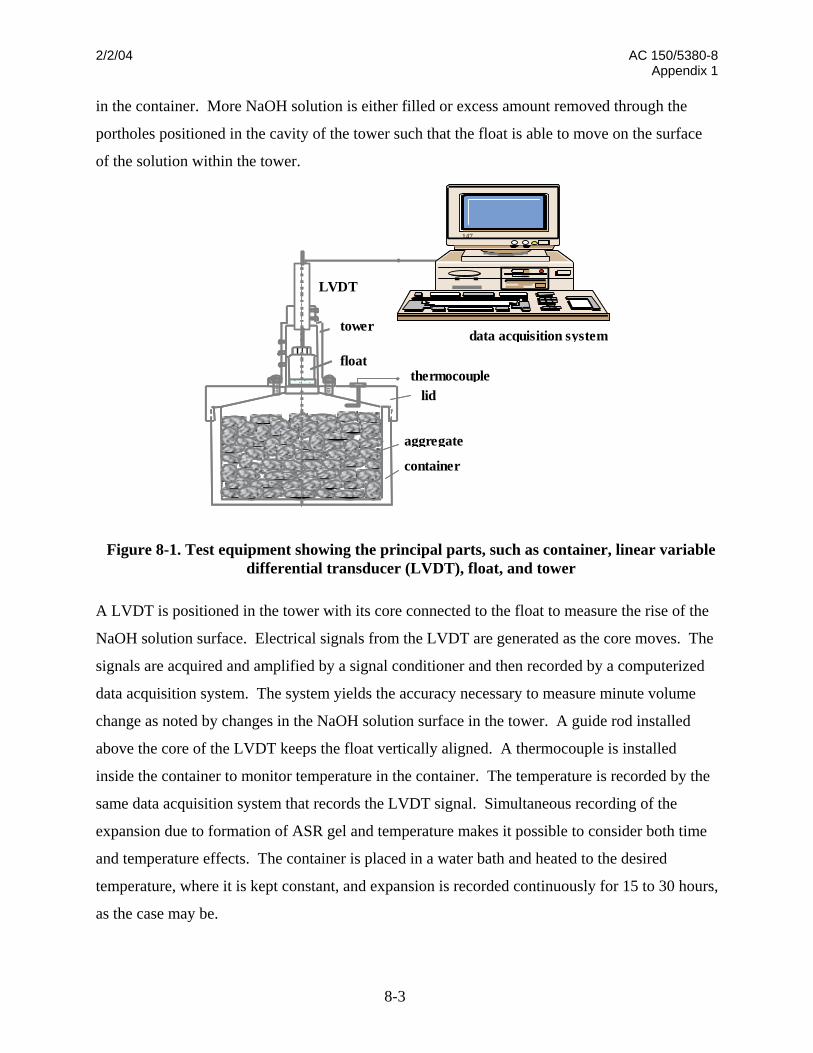
2/2/04 AC 150/5380-8 Appendix 1
8-3
LVDT
tower
thermocouplefloat
lid
aggregate
container
147
data acquisition system
147
Figure 8-1. Test equipment showing the principal parts, such as container, linear variable differential transducer (LVDT), float, and tower
in the container. More NaOH solution is either filled or excess amount removed through the
portholes positioned in the cavity of the tower such that the float is able to move on the surface
of the solution within the tower.
A LVDT is positioned in the tower with its core connected to the float to measure the rise of the
NaOH solution surface. Electrical signals from the LVDT are generated as the core moves. The
signals are acquired and amplified by a signal conditioner and then recorded by a computerized
data acquisition system. The system yields the accuracy necessary to measure minute volume
change as noted by changes in the NaOH solution surface in the tower. A guide rod installed
above the core of the LVDT keeps the float vertically aligned. A thermocouple is installed
inside the container to monitor temperature in the container. The temperature is recorded by the
same data acquisition system that records the LVDT signal. Simultaneous recording of the
expansion due to formation of ASR gel and temperature makes it possible to consider both time
and temperature effects. The container is placed in a water bath and heated to the desired
temperature, where it is kept constant, and expansion is recorded continuously for 15 to 30 hours,
as the case may be.
AC 150/5380-8 2/2/04 Appendix 1
8-4
Test procedure
Aggregate is placed in the chamber in a dry condition and then NaOH solution at room
temperature is added in the container. The lid is securely screwed on and sealed to the container.
This is important as the equipment is highly sensitive even to minor volume change, and
therefore even a small leak can adversely affect the test.
A vacuum is applied for a short period of time to remove entrapped air between
aggregates. The container is also shaken periodically to facilitate removal of entrapped air.
After vacuuming, the prepared dilatometer is placed in a water bath in which the water
temperature is first equilibrated to room temperature. Then the tower access port is opened to
drain any excess solution. The core of the LVDT with the guide rod is inserted, and the float is
positioned on the surface of the NaOH solution. If necessary, more NaOH solution is added in
the cavity of the tower until the float is positioned properly.
The water bath is heated to the desired temperature, where it is held constant. As ASR
expansion of aggregate inside the specimen chamber begins, the float rises, and LVDT signals
are recorded by the computerized data acquisition system. The volume of aggregates used and
test solution are kept constant for each test. The test is terminated arbitrarily at 20 or 30 hours.
However, it can be run for longer periods. The exact length of test period has not been decided
yet. Additional research is required to establish this criterion.
The chemical compositions of these aggregates are given in Table 8-1. Chemical
analysis of aggregates shows very little difference in chemical composition. Although variation
in SiO2 in the three aggregates is minimal, it is the non-reactive aggregate, which contains the
highest amount of non-siliceous constituents. Actually, the reactivity of an aggregate needs to be
evaluated by an experienced petrographer, not from its chemical make-up alone. The
mineralogy of the aggregates was established from X-ray diffraction (XRD) analysis. Quartz
was identified as the principal mineral, with small amounts of calcite, microcline feldspar and
other silicate minerals present. This confirmed the chemical analysis results that yielded over
90% SiO2.
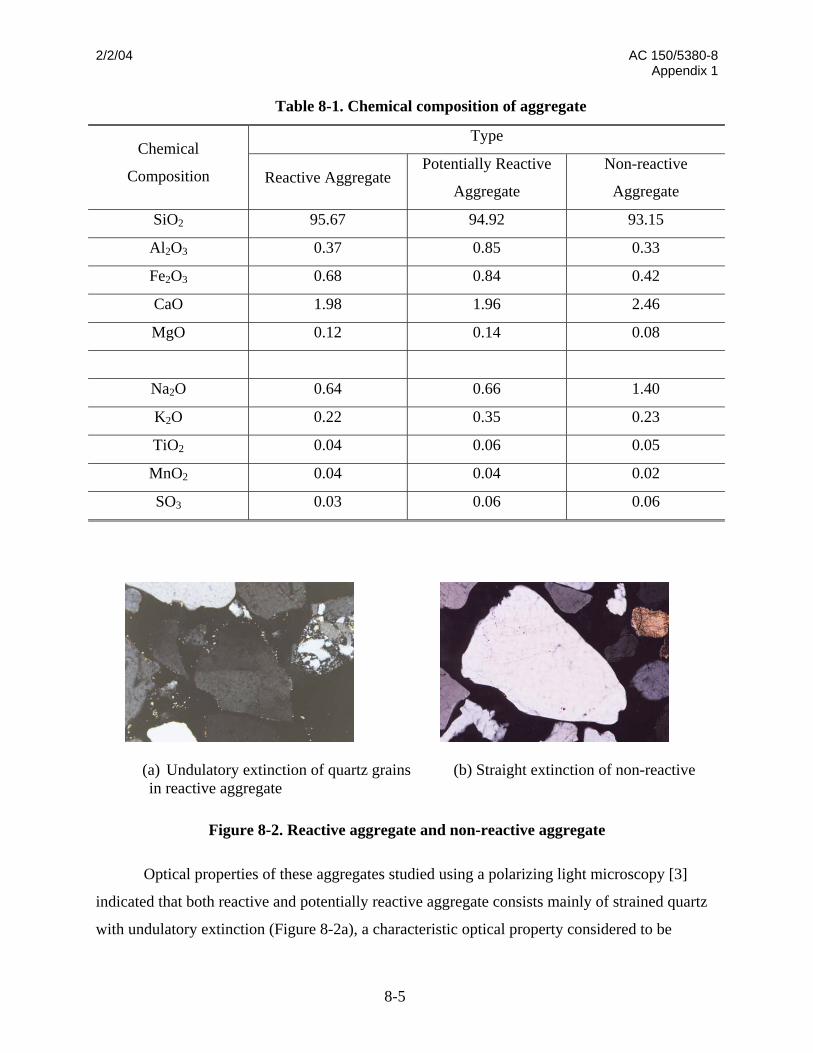
2/2/04 AC 150/5380-8 Appendix 1
8-5
(a) Undulatory extinction of quartz grains (b) Straight extinction of non-reactive in reactive aggregate
Figure 8-2. Reactive aggregate and non-reactive aggregate
Table 8-1. Chemical composition of aggregate
Type Chemical
Composition Reactive Aggregate Potentially Reactive
Aggregate
Non-reactive
Aggregate
SiO2 95.67 94.92 93.15
Al2O3 0.37 0.85 0.33
Fe2O3 0.68 0.84 0.42
CaO 1.98 1.96 2.46
MgO 0.12 0.14 0.08
Na2O 0.64 0.66 1.40
K2O 0.22 0.35 0.23
TiO2 0.04 0.06 0.05
MnO2 0.04 0.04 0.02
SO3 0.03 0.06 0.06
Optical properties of these aggregates studied using a polarizing light microscopy [3]
indicated that both reactive and potentially reactive aggregate consists mainly of strained quartz
with undulatory extinction (Figure 8-2a), a characteristic optical property considered to be
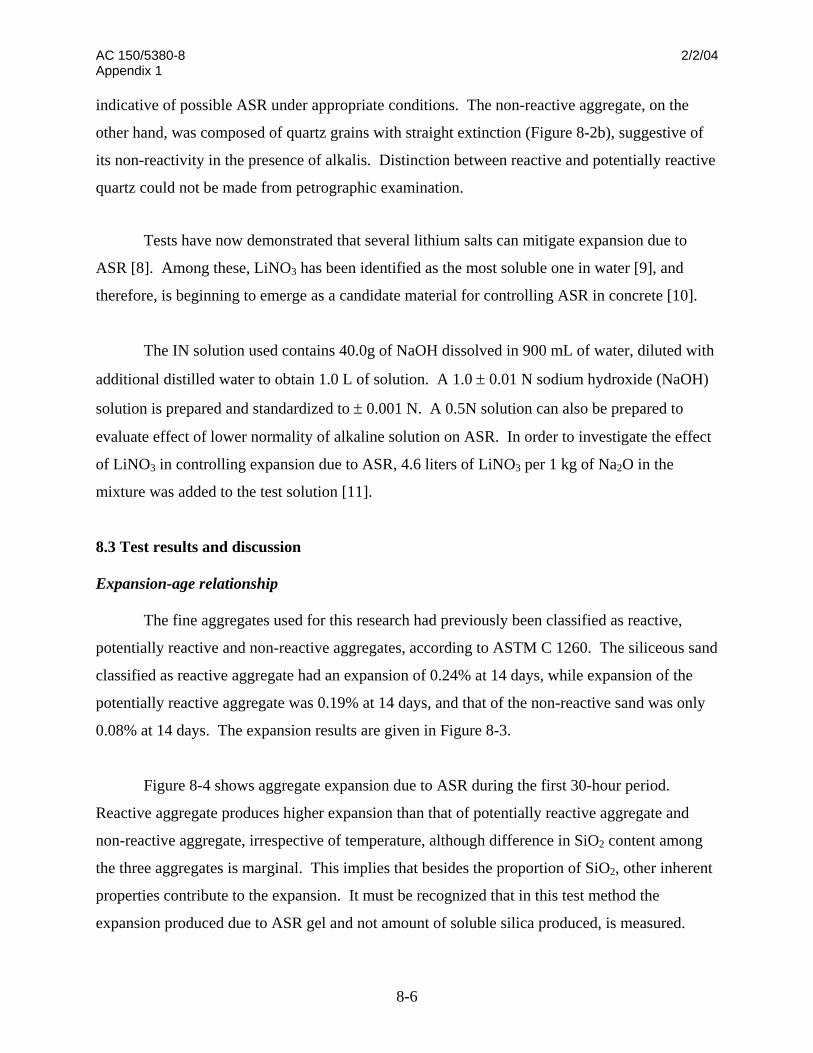
AC 150/5380-8 2/2/04 Appendix 1
8-6
indicative of possible ASR under appropriate conditions. The non-reactive aggregate, on the
other hand, was composed of quartz grains with straight extinction (Figure 8-2b), suggestive of
its non-reactivity in the presence of alkalis. Distinction between reactive and potentially reactive
quartz could not be made from petrographic examination.
Tests have now demonstrated that several lithium salts can mitigate expansion due to
ASR [8]. Among these, LiNO3 has been identified as the most soluble one in water [9], and
therefore, is beginning to emerge as a candidate material for controlling ASR in concrete [10].
The IN solution used contains 40.0g of NaOH dissolved in 900 mL of water, diluted with
additional distilled water to obtain 1.0 L of solution. A 1.0 ± 0.01 N sodium hydroxide (NaOH)
solution is prepared and standardized to ± 0.001 N. A 0.5N solution can also be prepared to
evaluate effect of lower normality of alkaline solution on ASR. In order to investigate the effect
of LiNO3 in controlling expansion due to ASR, 4.6 liters of LiNO3 per 1 kg of Na2O in the
mixture was added to the test solution [11].
8.3 Test results and discussion
Expansion-age relationship
The fine aggregates used for this research had previously been classified as reactive,
potentially reactive and non-reactive aggregates, according to ASTM C 1260. The siliceous sand
classified as reactive aggregate had an expansion of 0.24% at 14 days, while expansion of the
potentially reactive aggregate was 0.19% at 14 days, and that of the non-reactive sand was only
0.08% at 14 days. The expansion results are given in Figure 8-3.
Figure 8-4 shows aggregate expansion due to ASR during the first 30-hour period.
Reactive aggregate produces higher expansion than that of potentially reactive aggregate and
non-reactive aggregate, irrespective of temperature, although difference in SiO2 content among
the three aggregates is marginal. This implies that besides the proportion of SiO2, other inherent
properties contribute to the expansion. It must be recognized that in this test method the
expansion produced due to ASR gel and not amount of soluble silica produced, is measured.
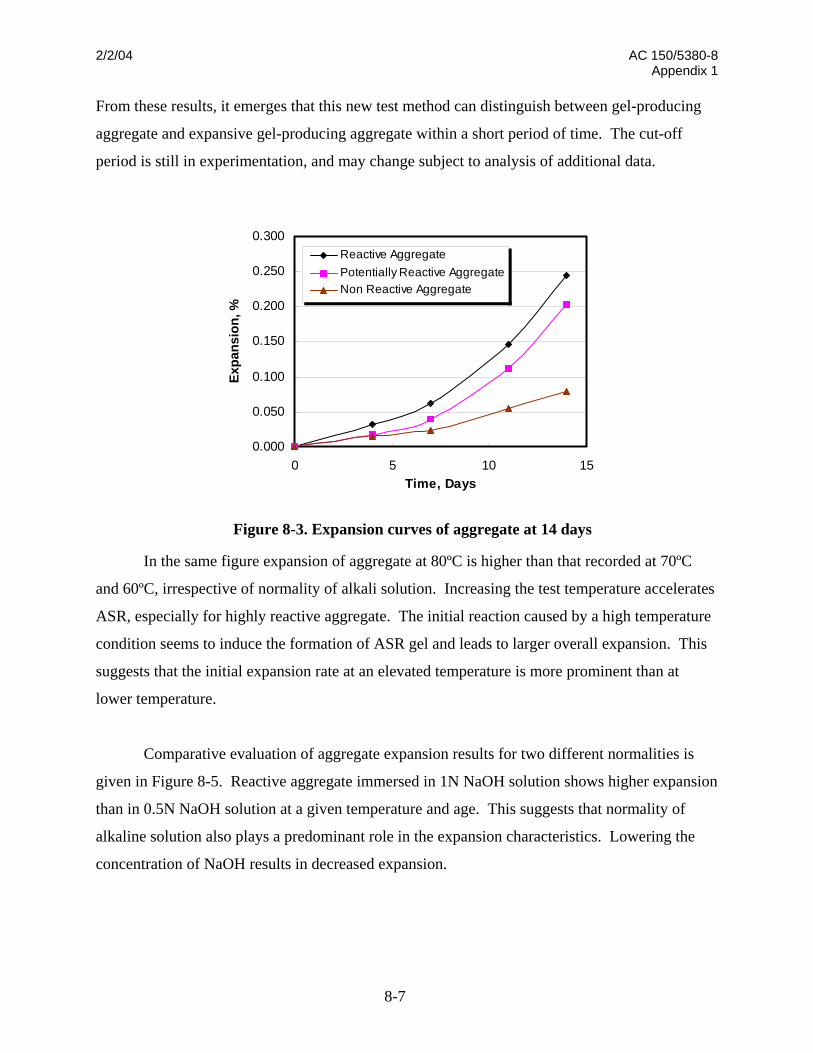
2/2/04 AC 150/5380-8 Appendix 1
8-7
From these results, it emerges that this new test method can distinguish between gel-producing
aggregate and expansive gel-producing aggregate within a short period of time. The cut-off
period is still in experimentation, and may change subject to analysis of additional data.
In the same figure expansion of aggregate at 80ºC is higher than that recorded at 70ºC
and 60ºC, irrespective of normality of alkali solution. Increasing the test temperature accelerates
ASR, especially for highly reactive aggregate. The initial reaction caused by a high temperature
condition seems to induce the formation of ASR gel and leads to larger overall expansion. This
suggests that the initial expansion rate at an elevated temperature is more prominent than at
lower temperature.
Comparative evaluation of aggregate expansion results for two different normalities is
given in Figure 8-5. Reactive aggregate immersed in 1N NaOH solution shows higher expansion
than in 0.5N NaOH solution at a given temperature and age. This suggests that normality of
alkaline solution also plays a predominant role in the expansion characteristics. Lowering the
concentration of NaOH results in decreased expansion.
0.000
0.050
0.100
0.150
0.200
0.250
0.300
0 5 10 15Time, Days
Expa
nsio
n, %
Reactive AggregatePotentially Reactive AggregateNon Reactive Aggregate
Figure 8-3. Expansion curves of aggregate at 14 days
AC 150/5380-8 2/2/04 Appendix 1
8-8
0.000
0.005
0.010
0.015
0.020
0.025
0.030
0 5 10 15 20 25
Time (hours)
Expa
nsio
n (%
)
Reactive aggr. 80CReactive aggr. 70CReactive aggr. 60C
(a) Reactive aggregate
0.000
0.005
0.010
0.015
0.020
0.025
0.030
0 5 10 15 20 25Time (hours)
Expa
nsio
n (%
)
P-reactive aggr. 80CP-reactive aggr. 70CP-reactive aggr. 60C
(b) Potentially reactive aggregate
0.000
0.005
0.010
0.015
0.020
0.025
0.030
0 5 10 15 20 25
Time (hours)
Expa
nsio
n (%
)
Non-reactive aggr. 80CNon-reactive aggr. 70CNon-reactive aggr. 60C
(c) Non-reactive aggregate
Figure 8-4. Effect of operating temperature on development of ASR expansion
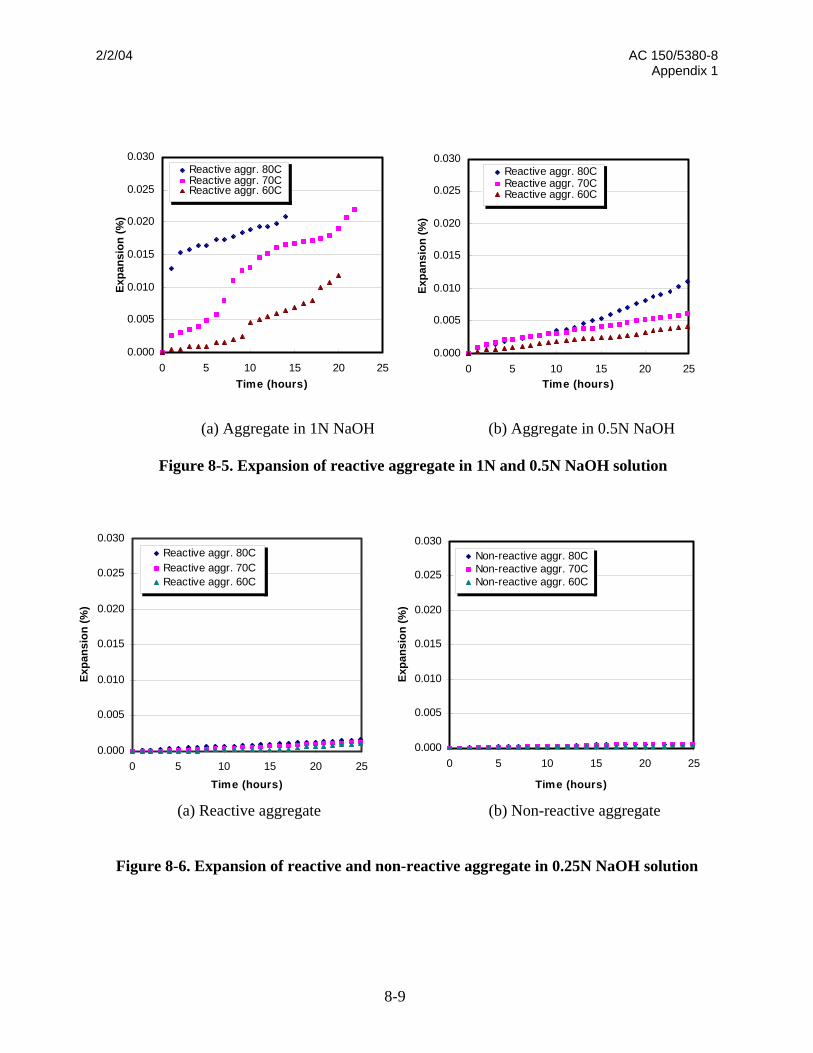
2/2/04 AC 150/5380-8 Appendix 1
8-9
0.000
0.005
0.010
0.015
0.020
0.025
0.030
0 5 10 15 20 25Time (hours)
Expa
nsio
n (%
)
Reactive aggr. 80CReactive aggr. 70CReactive aggr. 60C
0.000
0.005
0.010
0.015
0.020
0.025
0.030
0 5 10 15 20 25Time (hours)
Expa
nsio
n (%
)
Reactive aggr. 80CReactive aggr. 70CReactive aggr. 60C
(a) Aggregate in 1N NaOH (b) Aggregate in 0.5N NaOH
Figure 8-5. Expansion of reactive aggregate in 1N and 0.5N NaOH solution
0.000
0.005
0.010
0.015
0.020
0.025
0.030
0 5 10 15 20 25
Time (hours)
Expa
nsio
n (%
)
Reactive aggr. 80CReactive aggr. 70CReactive aggr. 60C
0.000
0.005
0.010
0.015
0.020
0.025
0.030
0 5 10 15 20 25
Time (hours)
Expa
nsio
n (%
)
Non-reactive aggr. 80CNon-reactive aggr. 70CNon-reactive aggr. 60C
(a) Reactive aggregate (b) Non-reactive aggregate
Figure 8-6. Expansion of reactive and non-reactive aggregate in 0.25N NaOH solution
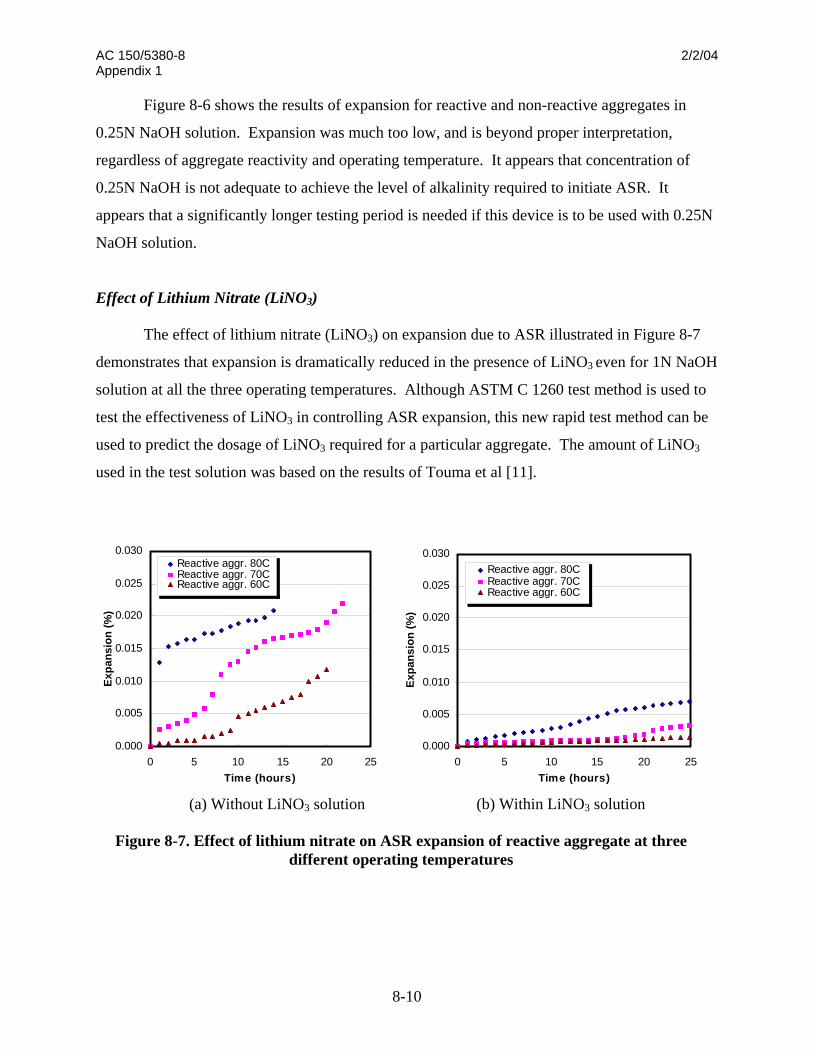
AC 150/5380-8 2/2/04 Appendix 1
8-10
Figure 8-6 shows the results of expansion for reactive and non-reactive aggregates in
0.25N NaOH solution. Expansion was much too low, and is beyond proper interpretation,
regardless of aggregate reactivity and operating temperature. It appears that concentration of
0.25N NaOH is not adequate to achieve the level of alkalinity required to initiate ASR. It
appears that a significantly longer testing period is needed if this device is to be used with 0.25N
NaOH solution.
Effect of Lithium Nitrate (LiNO3)
The effect of lithium nitrate (LiNO3) on expansion due to ASR illustrated in Figure 8-7
demonstrates that expansion is dramatically reduced in the presence of LiNO3 even for 1N NaOH
solution at all the three operating temperatures. Although ASTM C 1260 test method is used to
test the effectiveness of LiNO3 in controlling ASR expansion, this new rapid test method can be
used to predict the dosage of LiNO3 required for a particular aggregate. The amount of LiNO3
used in the test solution was based on the results of Touma et al [11].
0.000
0.005
0.010
0.015
0.020
0.025
0.030
0 5 10 15 20 25Time (hours)
Expa
nsio
n (%
)
Reactive aggr. 80CReactive aggr. 70CReactive aggr. 60C
0.000
0.005
0.010
0.015
0.020
0.025
0.030
0 5 10 15 20 25Time (hours)
Expa
nsio
n (%
)
Reactive aggr. 80CReactive aggr. 70CReactive aggr. 60C
(a) Without LiNO3 solution (b) Within LiNO3 solution
Figure 8-7. Effect of lithium nitrate on ASR expansion of reactive aggregate at three different operating temperatures
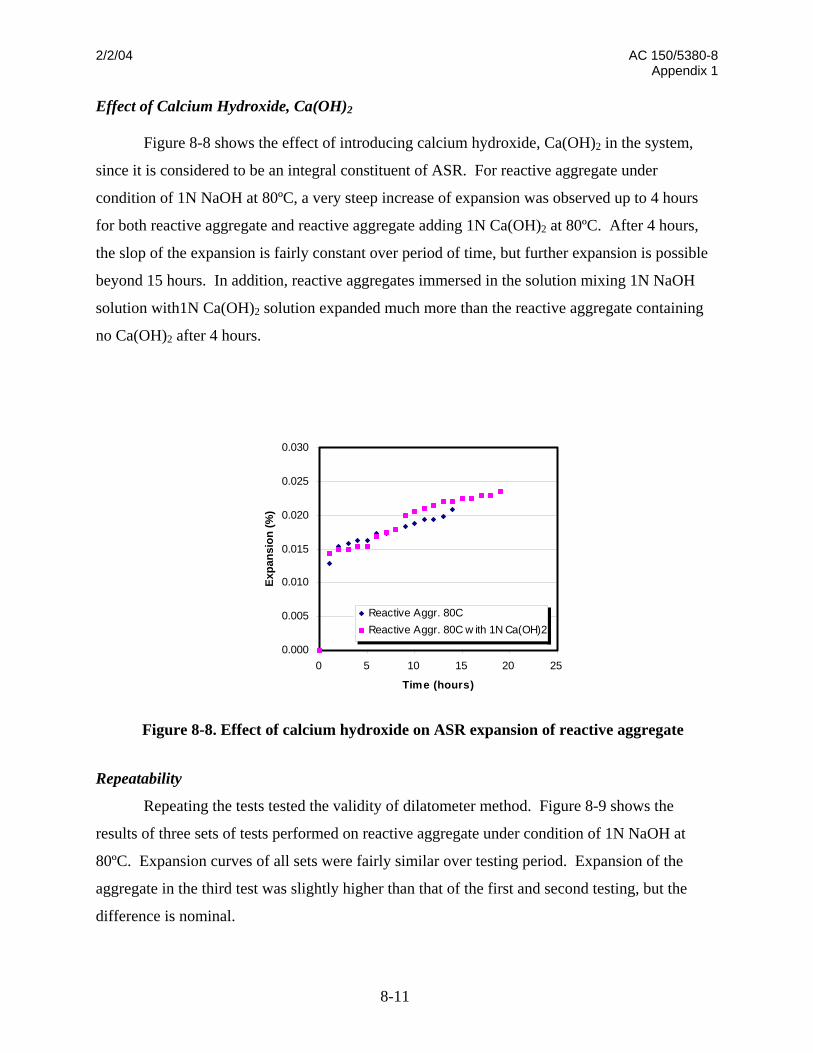
2/2/04 AC 150/5380-8 Appendix 1
8-11
Effect of Calcium Hydroxide, Ca(OH)2
Figure 8-8 shows the effect of introducing calcium hydroxide, Ca(OH)2 in the system,
since it is considered to be an integral constituent of ASR. For reactive aggregate under
condition of 1N NaOH at 80ºC, a very steep increase of expansion was observed up to 4 hours
for both reactive aggregate and reactive aggregate adding 1N Ca(OH)2 at 80ºC. After 4 hours,
the slop of the expansion is fairly constant over period of time, but further expansion is possible
beyond 15 hours. In addition, reactive aggregates immersed in the solution mixing 1N NaOH
solution with1N Ca(OH)2 solution expanded much more than the reactive aggregate containing
no Ca(OH)2 after 4 hours.
Repeatability
Repeating the tests tested the validity of dilatometer method. Figure 8-9 shows the
results of three sets of tests performed on reactive aggregate under condition of 1N NaOH at
80ºC. Expansion curves of all sets were fairly similar over testing period. Expansion of the
aggregate in the third test was slightly higher than that of the first and second testing, but the
difference is nominal.
0.000
0.005
0.010
0.015
0.020
0.025
0.030
0 5 10 15 20 25
Time (hours)
Expa
nsio
n (%
)
Reactive Aggr. 80CReactive Aggr. 80C w ith 1N Ca(OH)2
Figure 8-8. Effect of calcium hydroxide on ASR expansion of reactive aggregate
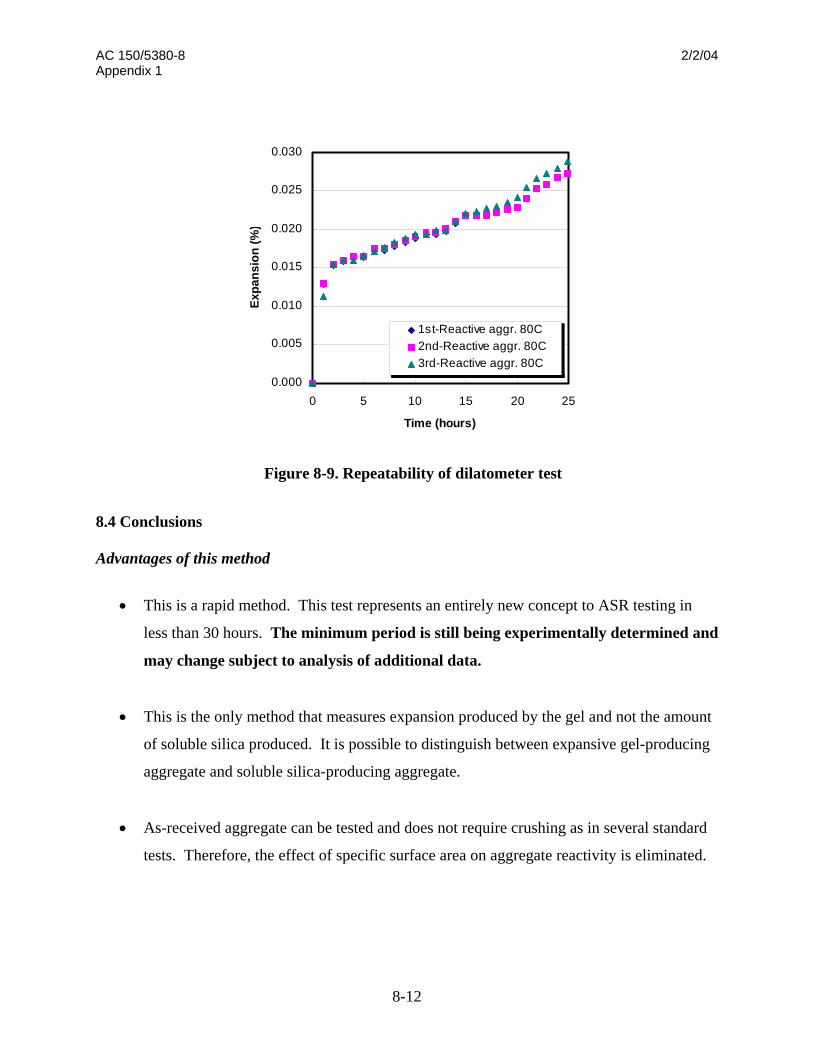
AC 150/5380-8 2/2/04 Appendix 1
8-12
8.4 Conclusions
Advantages of this method
• This is a rapid method. This test represents an entirely new concept to ASR testing in
less than 30 hours. The minimum period is still being experimentally determined and
may change subject to analysis of additional data.
• This is the only method that measures expansion produced by the gel and not the amount
of soluble silica produced. It is possible to distinguish between expansive gel-producing
aggregate and soluble silica-producing aggregate.
• As-received aggregate can be tested and does not require crushing as in several standard
tests. Therefore, the effect of specific surface area on aggregate reactivity is eliminated.
0.000
0.005
0.010
0.015
0.020
0.025
0.030
0 5 10 15 20 25
Time (hours)
Expa
nsio
n (%
)
1st-Reactive aggr. 80C2nd-Reactive aggr. 80C3rd-Reactive aggr. 80C
Figure 8-9. Repeatability of dilatometer test
2/2/04 AC 150/5380-8 Appendix 1
8-13
• The large chamber dimensions can accommodate all aggregate size ranges commonly
used in concrete.
• This method can measure the effectiveness of LiNO3 as a mitigating compound.
Although the ASTM C 1260 test method is used to test the effectiveness of LiNO3 in
reducing ASR expansion, the new rapid method can be used to predict the dosage of
LiNO3 required for a particular aggregate.
• Test results have not yet been calibrated against any other standard test method. This test
method should be capable of assessing the expansion of cement mortar. It may be useful
to correlate one of the existing accelerated test methods in practice and this new
dilatometer method.
Using the dilatometer to measure expansion of ASR gel represents an entirely new
approach to test ASR potential of aggregates in less than 30 hours. This method measures
expansion produced by the ASR gel, not the amount of soluble silica. It is possible to distinguish
between expansive gel-producing aggregate and soluble silica producing aggregate.
The effectiveness of LiNO3 as a mitigating agent of ASR was also evaluated by the
dilatometer method. The results indicate that the Dosage of LiNO3 can be predicted for a
particular aggregate. The new method provided test results very rapidly without sacrificing
reliability. Since the dilatometer method uses bulk aggregate samples, it eliminates the effect of
the specific surface area. Further studies are anticipated for comparing the dilatometer method
with other standard tests, and for determining the optimal dosage of LiNO3 required for a
particular aggregate.
AC 150/5380-8 2/2/04 Appendix 1
8-14
8.5 References
1. Helmuth, R., Stark, D. and Diamond, S., “Alkali-Silica reactivity in Concrete—An
Overview of Research, SHRP Report C/FR-92-000, Part II, 1992, pp.3-6.
2. Johansen, V.C., Klemm, W.A., and Taylor, P.C., “Why Chemistry Matters in Concrete,”
Concrete International. Vol.24, 2002, pp.84-89.
3. ASTM C 295, Guide for Petrographic Examination of Aggregates for Concrete, Annual
Book of ASTM Standards, American Society for Testing and Materials, Philadelphia,
1999, pp. 175-182
4. ASTM C 289, Standard Test Method for Potential Alkali-Silica Reactivity of Aggregates
(Chemical Method)1, Annual Book of ASTM Standards, American Society for Testing and
Materials, Philadelphia, 1999, pp. 156-162
5. ASTM C 441, Standard Test Method for Effectiveness of Mineral Admixture or Ground
Blast-Furnace Slag in Preventing Excessive Expansion of Concrete Due to the Alkali-Silica
Reaction1, Annual Book of ASTM Standards, American Society for Testing and Materials,
Philadelphia, 1999, pp. 225-227
6. ASTM C 1260, Standard Test Method for Potential Alkali Reactivity of Aggregates
(Mortar-Bar Method, D), Annual Book of ASTM Standards, American Society for Testing
and Materials, Philadelphia, 1999, pp. 646-649.
7. Stark D., “Eliminating or Minimizing Alkali-Silica Reactivity,” SHRP-C-343, Strategic
Highway Research Program, National Research Council. Washington, DC, 1993.
8. Stark, D.C., “Lithium Salt Admixture-An Alternative Method to Prevent Expansive Alkali-
Silica Reactivity,” PCA Research and Development Information, Skokie, 1992.
9. Stokes, D.B., “Use of Lithium to Combat Alkali Silica Reactivity,” Proceedings of the 10th
International Conference on Alkali-Aggregate Reaction in Concrete, Sydney, 1996, pp.862-
867.
10. Johnston, D.P., Surdahl, R., and Stokes, D.B., “A Case Study of A Lithium-Based
Treatment of an Alkali-Affected Pavement,” Proceedings of the 11th International
Conference on Alkali-Aggregate Reaction in Concrete, Quebec City, 2000, pp.1149-1158.
2/2/04 AC 150/5380-8 Appendix 1
8-15
11. Touma, W.E., Fowler, D.F., and Carrasquillo, R.L., “Alkali-Silica Reaction in Portland
Cement Concrete-Testing Methods and Mitigation Alternatives,” Research Report ICAR
301-1F, International Center for Aggregate Research, 2001.