Embed Size (px)
Citation preview
8/2/2019 Advisor Live NCCN July 15
http://slidepdf.com/reader/full/advisor-live-nccn-july-15 1/33
© 2009 National Comprehensive Cancer Network NCCN.org
& Medical Oncology“CANCER IS NOW ON THE TABLE”
Trish Goldsmith, Executive Vice President and Chief Operating Officer, NCCN
Jennifer Hinkel, MSc, Manager, Business Insights, NCCN
July 15, 2009
NCCN Oncology Trends Reports
Current Environment, Emerging
Trends, and Future Directions
Managed Care

8/2/2019 Advisor Live NCCN July 15
http://slidepdf.com/reader/full/advisor-live-nccn-july-15 2/33
© 2009 National Comprehensive Cancer Network NCCN.org
Learning ObjectivesAt the conclusion of this program, participants will be able
to:
• List reasons why medical oncology is a new priority for
managed care organizations
• Compare and contrast the historical methods for medical
oncology reimbursement with current directions and trends
• Describe four key strategies or tools employed by managed
care organizations to control utilization of cancer drugs and
biologics

8/2/2019 Advisor Live NCCN July 15
http://slidepdf.com/reader/full/advisor-live-nccn-july-15 3/33
© 2009 National Comprehensive Cancer Network NCCN.org
Learning Objectives (continued)• Identify examples of information sources and information
products used by managed care organizations to drive
coverage policy for drugs and biologics
• Define several emerging challenges to the status quo of
managed care in medical oncology and describe how these
might impact future coverage or reimbursement of cancerdrugs and biologics
• Identify specific examples of how three of the largest managed
care organizations in the U.S. are approaching medical
oncology

8/2/2019 Advisor Live NCCN July 15
http://slidepdf.com/reader/full/advisor-live-nccn-july-15 4/33
© 2009 National Comprehensive Cancer Network NCCN.org
NCCN Presenters
Trish Goldsmith, Executive Vice President and
Chief Operating Officer
National Comprehensive Cancer Network
Jennifer M. Hinkel, MSc, Manager, BusinessInsights
National Comprehensive Cancer Network
8/2/2019 Advisor Live NCCN July 15
http://slidepdf.com/reader/full/advisor-live-nccn-july-15 5/33
© 2009 National Comprehensive Cancer Network NCCN.org
Why is cancer “now on the table”?
• Population and demographic factors are leading to
higher consumption of oncology services andproducts
• Targeted biologic agents are changing how cancer is
treated and making cancer a chronic disease• Payors are seeing an increase in “million-dollar
cases,” even in high-incidence, “common” cancers
• Many of the proposed health care reforms may notapply well to oncology

8/2/2019 Advisor Live NCCN July 15
http://slidepdf.com/reader/full/advisor-live-nccn-july-15 6/33
© 2009 National Comprehensive Cancer Network NCCN.org
Reviewing Cancer Prevalence, Incidence,
and Cost of Treatment
• 1.437 million new cancer cases in 2008
• Estimated $89.0 billion in direct medical costs
in 2007, up from $70 billion in 2005 1,2
• Overall costs of cancer in 2007 areestimated to be $219.2 billion oncesecondary costs of morbidity and mortality
are included1. American Cancer Society. Cancer Facts and Figures 2008. Atlanta: American Cancer Society;
2008.
2. American Cancer Society. Costs of Cancer. Available at:
http://www.cancer.org/docroot/MIT/content MIT_3_2X_Costs_of_Cancer.asp. Accessed October
27, 2005.
8/2/2019 Advisor Live NCCN July 15
http://slidepdf.com/reader/full/advisor-live-nccn-july-15 7/33
© 2009 National Comprehensive Cancer Network NCCN.org
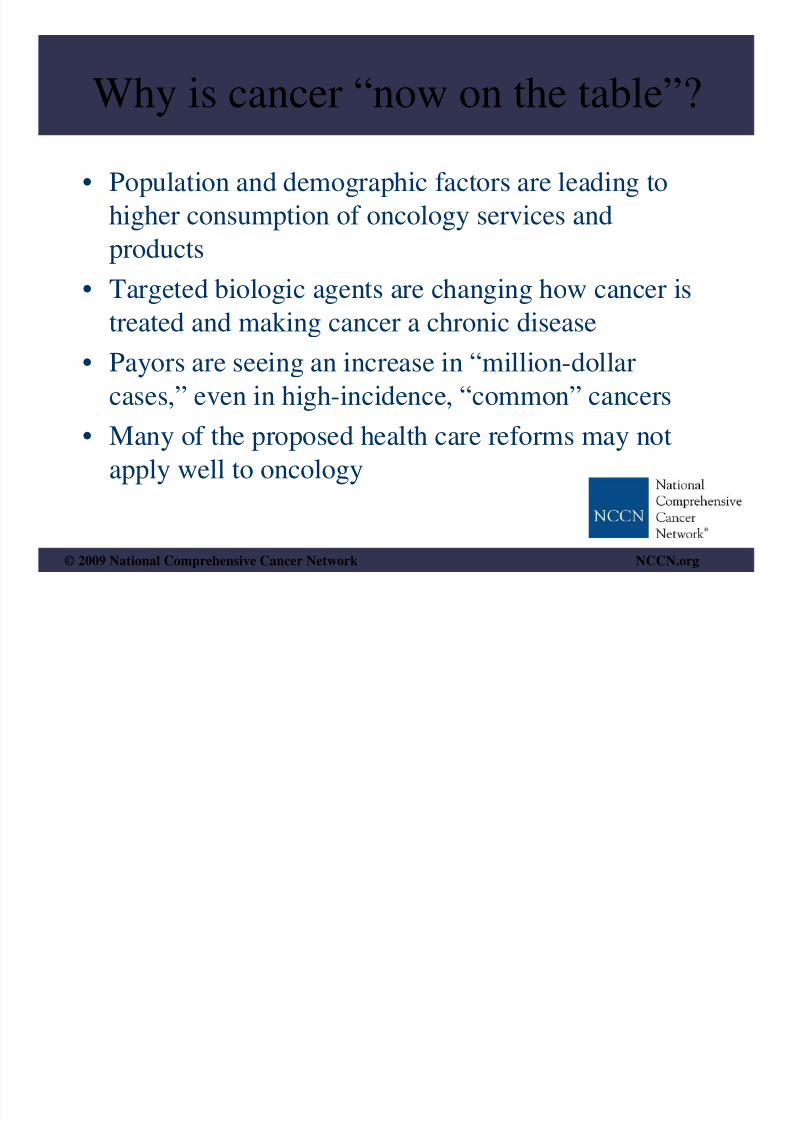
Initial Treatment Costs, 1991 and 2002
Breast Cancer Colorectal Cancer Lung Cancer
$ 1 6 , 7 7 5
$ 2
0 ,
9 6 4
$ 3 5 ,
7 8 9
$ 4 1 , 1
3 4
$ 3 2 ,
7 0 2
$ 3 9 ,
8 9
1
Graphic adapted from data in Warren JL, Yabroff KR, Meekins A, Topor M, Lamont EB, Brown ML. “Evaluation of trends in the cost of
initial cancer treatment.” J Natl Cancer Inst. 2008 Jun 18; 100(12):889-97. Epub 2008 Jun 10.
* increases adjusted for inflation
• From 1991 to 2002, the average Medicare payments for initial
treatment of the above three cancers rose by an average of 21%• Some estimate that oncology costs are now rising at a rate of
more than 20% per year
8/2/2019 Advisor Live NCCN July 15
http://slidepdf.com/reader/full/advisor-live-nccn-july-15 8/33
© 2009 National Comprehensive Cancer Network NCCN.org
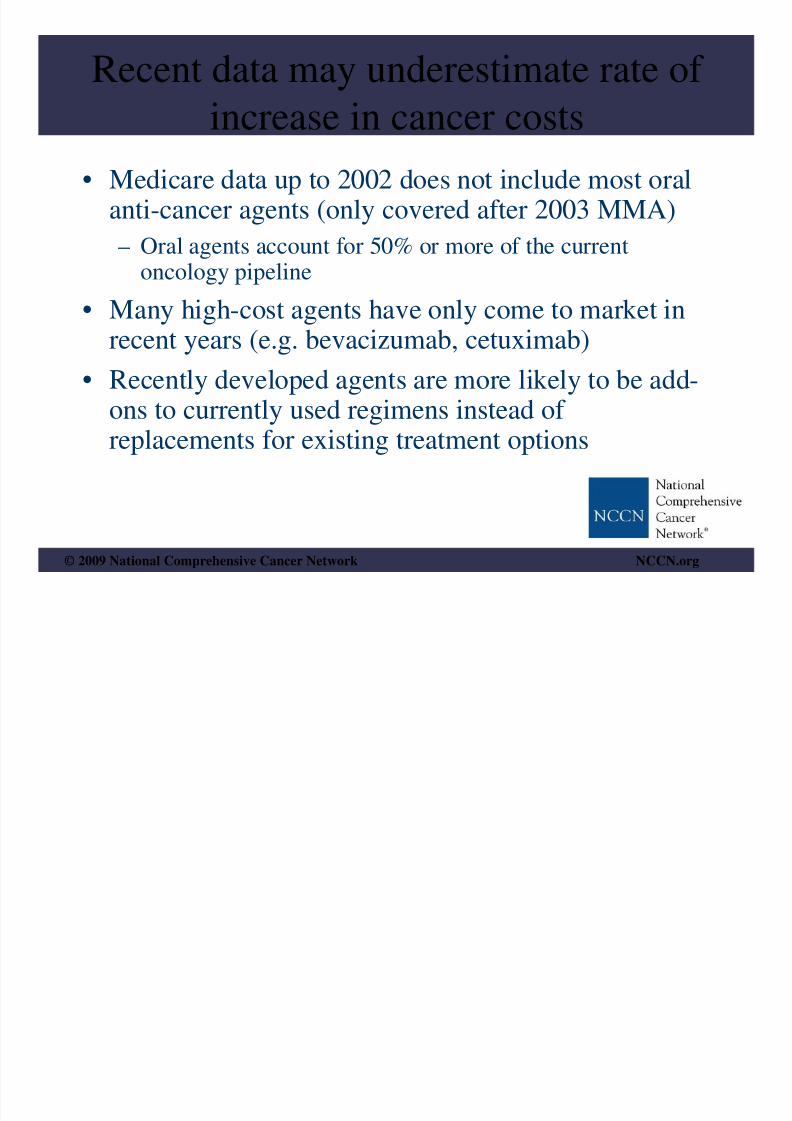
Recent data may underestimate rate of
increase in cancer costs
• Medicare data up to 2002 does not include most oral
anti-cancer agents (only covered after 2003 MMA)– Oral agents account for 50% or more of the current
oncology pipeline
• Many high-cost agents have only come to market inrecent years (e.g. bevacizumab, cetuximab)
• Recently developed agents are more likely to be add-ons to currently used regimens instead of replacements for existing treatment options
8/2/2019 Advisor Live NCCN July 15
http://slidepdf.com/reader/full/advisor-live-nccn-july-15 9/33
© 2009 National Comprehensive Cancer Network NCCN.org
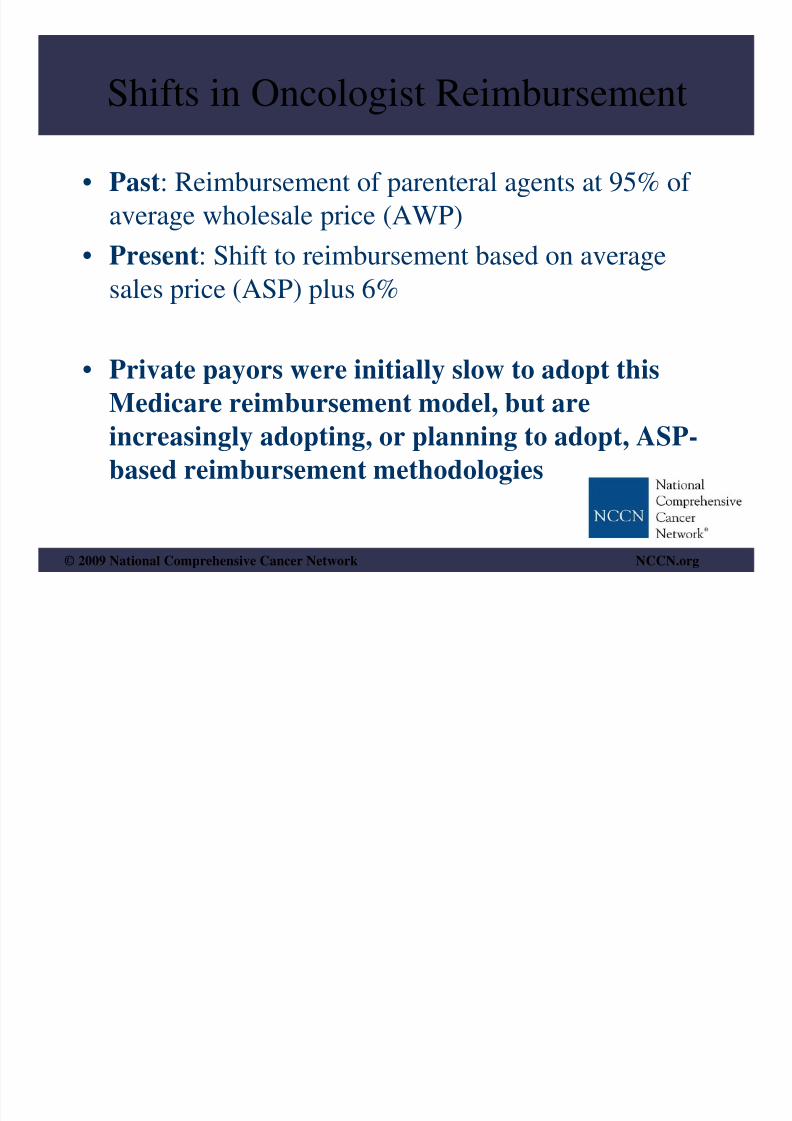
Shifts in Oncologist Reimbursement
• Past: Reimbursement of parenteral agents at 95% of
average wholesale price (AWP)• Present: Shift to reimbursement based on average
sales price (ASP) plus 6%
• Private payors were initially slow to adopt this
Medicare reimbursement model, but are
increasingly adopting, or planning to adopt, ASP-based reimbursement methodologies

8/2/2019 Advisor Live NCCN July 15
http://slidepdf.com/reader/full/advisor-live-nccn-july-15 10/33
© 2009 National Comprehensive Cancer Network NCCN.org
Why do payors see medical
oncology as a priority?
• Cost implications of novel agents
• Oncology-heavy pharmaceutical pipelines
• Shift towards oral delivery of agents
• Mandates to measure quality and performance• New reliance on information sources and
emphasis on evidence
8/2/2019 Advisor Live NCCN July 15
http://slidepdf.com/reader/full/advisor-live-nccn-july-15 11/33
© 2009 National Comprehensive Cancer Network NCCN.org
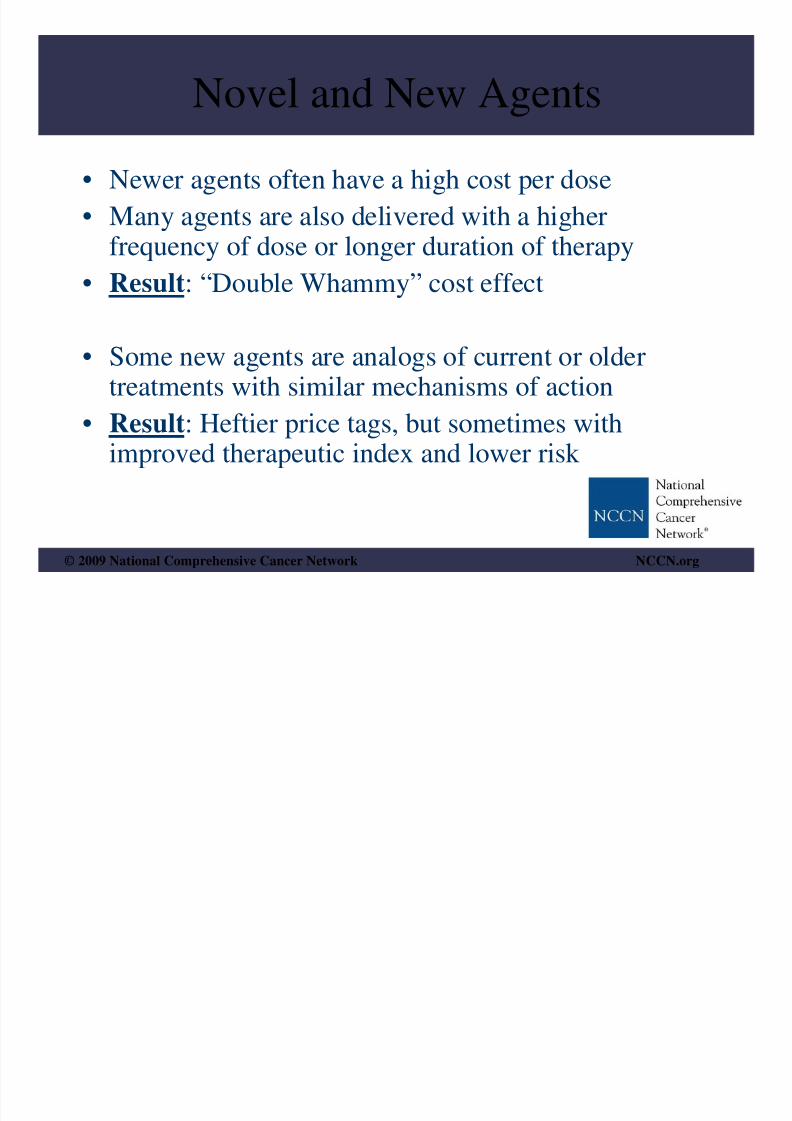
Novel and New Agents• Newer agents often have a high cost per dose
• Many agents are also delivered with a higherfrequency of dose or longer duration of therapy
• Result: “Double Whammy” cost effect
• Some new agents are analogs of current or oldertreatments with similar mechanisms of action
• Result: Heftier price tags, but sometimes withimproved therapeutic index and lower risk

8/2/2019 Advisor Live NCCN July 15
http://slidepdf.com/reader/full/advisor-live-nccn-july-15 12/33
© 2009 National Comprehensive Cancer Network NCCN.org
Oncology-heavy and Oral-heavy
Development Pipelines
• Companies looking specifically at potential for
biologic agents• Currently fewer than 10% of antineoplastics aredelivered orally, but 50% to 60% of oncologypipelines are oral formulations
• Result: Future agents likely to carry high prices, havereimbursement and distribution models specific tooral drugs, and have long time horizons beforeequivalents (“bio-similars”) are available on themarket

8/2/2019 Advisor Live NCCN July 15
http://slidepdf.com/reader/full/advisor-live-nccn-july-15 13/33
© 2009 National Comprehensive Cancer Network NCCN.org
Mandates for Quality Measurement• Managed care organizations are becoming
increasingly reliant on data to drive decision-making and policy-setting
• Payors do not currently collect data at the level
of specificity needed to assess quality of carein oncology
• Collaborations between payor organizations
and clinical / provider organizations areclosing this information gap

8/2/2019 Advisor Live NCCN July 15
http://slidepdf.com/reader/full/advisor-live-nccn-july-15 14/33
© 2009 National Comprehensive Cancer Network NCCN.org
Reliance on Information Sources• Much of drug and biologic use in oncology is
“off-label” (agents approved for one tumortype used for other tumor types based onavailable literature and evidence)
• Information sources such as drug compendianow allow managed care organizations toanalyze patterns of off-label use and identify
potentially inappropriate off-label prescribing
8/2/2019 Advisor Live NCCN July 15
http://slidepdf.com/reader/full/advisor-live-nccn-july-15 15/33
© 2009 National Comprehensive Cancer Network NCCN.org
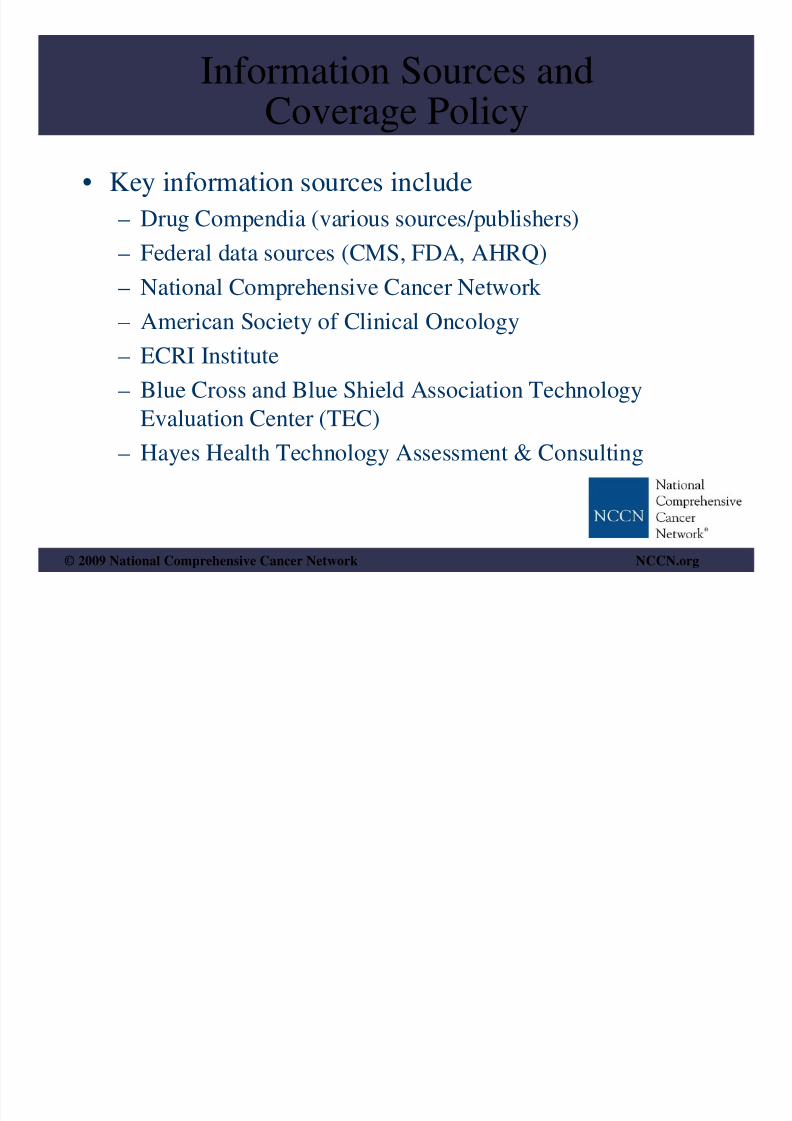
Information Sources and
Coverage Policy
• Key information sources include
– Drug Compendia (various sources/publishers)– Federal data sources (CMS, FDA, AHRQ)
– National Comprehensive Cancer Network
– American Society of Clinical Oncology– ECRI Institute
– Blue Cross and Blue Shield Association Technology
Evaluation Center (TEC)– Hayes Health Technology Assessment & Consulting
8/2/2019 Advisor Live NCCN July 15
http://slidepdf.com/reader/full/advisor-live-nccn-july-15 16/33
© 2009 National Comprehensive Cancer Network NCCN.org
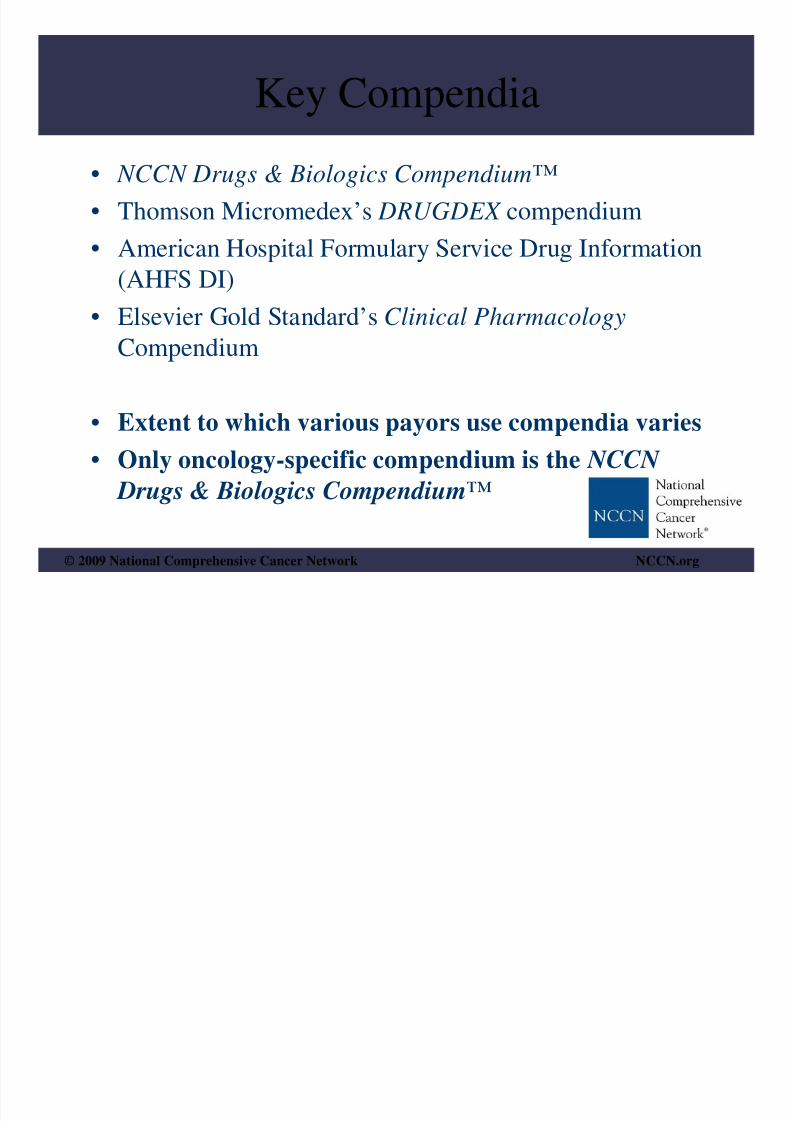
Key Compendia• NCCN Drugs & Biologics Compendium™
• Thomson Micromedex’s DRUGDEX compendium• American Hospital Formulary Service Drug Information
(AHFS DI)
• Elsevier Gold Standard’s Clinical PharmacologyCompendium
• Extent to which various payors use compendia varies• Only oncology-specific compendium is the NCCN
Drugs & Biologics Compendium™

8/2/2019 Advisor Live NCCN July 15
http://slidepdf.com/reader/full/advisor-live-nccn-july-15 17/33
© 2009 National Comprehensive Cancer Network NCCN.org
Coverage Models and Mechanisms• Precertification and Prior Authorization
– Used by more than 75% of private payors to curtailpotentially inappropriate use of drugs andbiologics
– Key targets are agents characterized both by highexpense and wide variation and use
– Supportive care (antiemetics, ESAs) often included
– Time consuming activity for provider and payor
8/2/2019 Advisor Live NCCN July 15
http://slidepdf.com/reader/full/advisor-live-nccn-july-15 18/33
© 2009 National Comprehensive Cancer Network NCCN.org
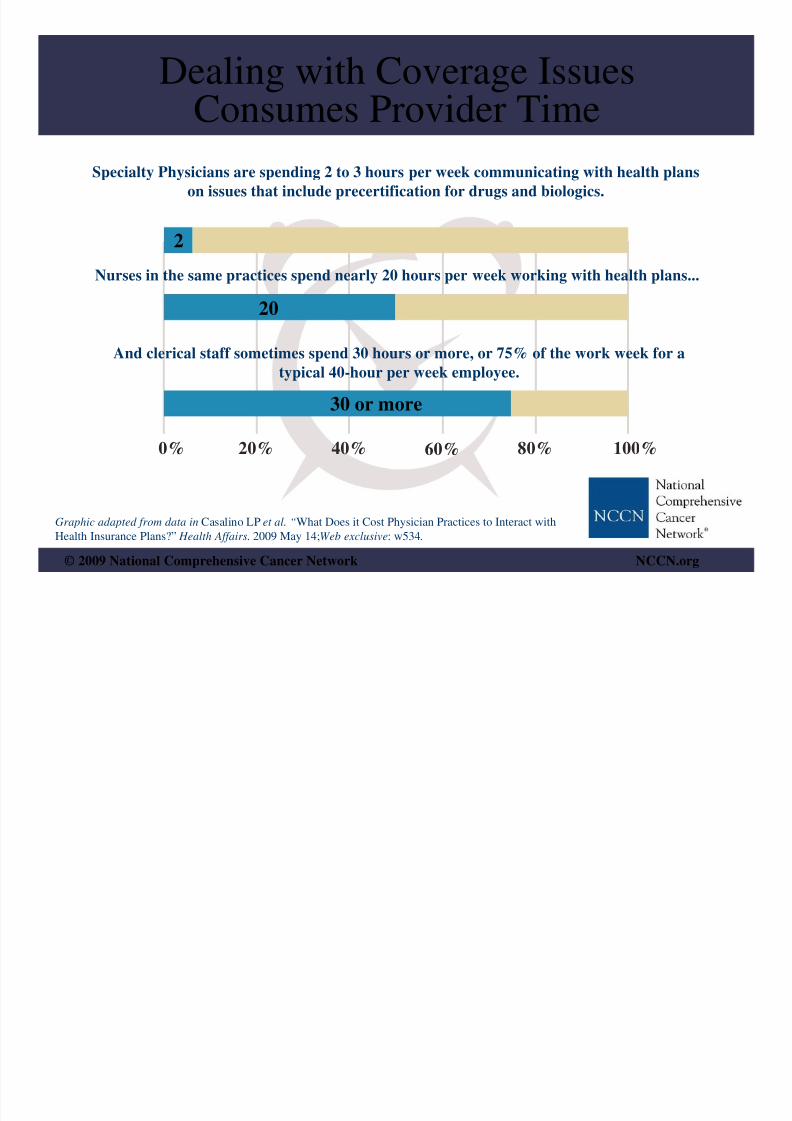
Dealing with Coverage Issues
Consumes Provider TimeSpecialty Physicians are spending 2 to 3 hours per week communicating with health plans
on issues that include precertification for drugs and biologics.
Nurses in the same practices spend nearly 20 hours per week working with health plans...
And clerical staff sometimes spend 30 hours or more, or 75% of the work week for a
typical 40-hour per week employee.
2
20
30 or more
0% 20% 40% 60% 80% 100%
Graphic adapted from data in Casalino LP et al. “What Does it Cost Physician Practices to Interact with
Health Insurance Plans?” Health Affairs. 2009 May 14;Web exclusive: w534.

8/2/2019 Advisor Live NCCN July 15
http://slidepdf.com/reader/full/advisor-live-nccn-july-15 19/33
© 2009 National Comprehensive Cancer Network NCCN.org
Coverage Models and Mechanisms• Payors are using formularies for supportive care, but
the model does not necessarily apply to antineoplasticagents– Lists of drugs restricting coverage or lists that “tier” agents
from the same class into categories, often on a cost basis
– Uniqueness and lack of interchangeability of anti-canceragents does not allow formulary use
– Antiemetic drugs lend themselves to formularymanagement
– Future shifts likely to be determined by clinicaldevelopments as more cancer drugs and biologics belong tosimilar classes (example: TKI inhibitors)
8/2/2019 Advisor Live NCCN July 15
http://slidepdf.com/reader/full/advisor-live-nccn-july-15 20/33
© 2009 National Comprehensive Cancer Network NCCN.org
Emerging Clinical Trends• Increasing availability of oral therapies for
cancer• “Targeted Therapies” that interfere with or
block specific molecular targets or pathways
• Increased understanding of biomarkers andhow they can assist decision-making
• “Personalized Medicine” andpharmacogenomics maximizing outcomes forthe individual

8/2/2019 Advisor Live NCCN July 15
http://slidepdf.com/reader/full/advisor-live-nccn-july-15 21/33
© 2009 National Comprehensive Cancer Network NCCN.org
Historical Perspective of Oral Agents
• Pre-1980: primarily cytotoxic therapies
– Cyclophosphamide, methotrexate, procarbazine,chlorambucil ( ~10 agents total)
• 1980s – 1990s: primarily hormonal therapies
– Estramustine, anastrozole, raloxifene ( ~ 12 agents total)• 2000s: primarily targeted therapies and
immunomodulators
– Dasatinib, everolimus, lenalidomide, lapatinib, sorafenib,vorinostat, erlotinib, sunitinib, nilotinib, imatinib,
thalidomide ( 15 or more agents)

8/2/2019 Advisor Live NCCN July 15
http://slidepdf.com/reader/full/advisor-live-nccn-july-15 22/33
© 2009 National Comprehensive Cancer Network NCCN.org
Implications of Oral Pipeline• Oral therapies are usually managed through a
pharmacy benefit rather than a medical benefit• Oral coverage governed by different
mechanisms than parenteral coverage
• Results in strange incentives that may
encourage providers to use parenteral therapies
even when they cost more

8/2/2019 Advisor Live NCCN July 15
http://slidepdf.com/reader/full/advisor-live-nccn-july-15 23/33
© 2009 National Comprehensive Cancer Network NCCN.org
Targeted Therapies• Targeted therapies block growth and division
of cancer cells• Targets could be specific proteins or enzymes,
growth factors, or processes needed by cancer
cells to divide, grow, or spread• Include TKIs, drugs inducing apoptosis,
monoclonal antibodies, angiogenesis
inhibitors, hormone receptor modulators, etc.

8/2/2019 Advisor Live NCCN July 15
http://slidepdf.com/reader/full/advisor-live-nccn-july-15 24/33
© 2009 National Comprehensive Cancer Network NCCN.org
Biomarkers• Specific variations in tumor genetics or
makeup• May have predictive value for prognosis or
response
• Identify sub-populations of patients that maybe more or less likely to benefit from a givenintervention
• Include hormone receptors, her-2-neu receptor,KRAS, PSA
8/2/2019 Advisor Live NCCN July 15
http://slidepdf.com/reader/full/advisor-live-nccn-july-15 25/33
© 2009 National Comprehensive Cancer Network NCCN.org
Challenges to the Status Quo
• Specialty Pharmacy distribution models
• Comparative Effectiveness as a
“buzzword”
• “Value-Based Insurance Design” (VBID)
• Negotiating for lower drug prices

8/2/2019 Advisor Live NCCN July 15
http://slidepdf.com/reader/full/advisor-live-nccn-july-15 26/33
© 2009 National Comprehensive Cancer Network NCCN.org
Specialty Pharmacy• Program used by pharmacy benefit management
(PBM) organizations to control distribution of drugs• May employ a closed method of distribution
• Potential to threaten revenue stream for oncology
pharmacies within hospitals• Unanswered questions regarding specialty pharmacy’sability to address safety and adherence challengeswith oral agents
8/2/2019 Advisor Live NCCN July 15
http://slidepdf.com/reader/full/advisor-live-nccn-july-15 27/33
© 2009 National Comprehensive Cancer Network NCCN.org
Comparative Effectiveness
• Sometimes mistakenly or deliberately
confused with “cost-effectiveness”
• Existing CE paradigms may not be
applicable to cancer treatment• Difficult lessons learned abroad (United
Kingdom’s NICE and kidney canceragents)
8/2/2019 Advisor Live NCCN July 15
http://slidepdf.com/reader/full/advisor-live-nccn-july-15 28/33
© 2009 National Comprehensive Cancer Network NCCN.org
Value Based Insurance Design
• Rooted in theory that some interventions
are more “valuable” than others
• Proponents espouse a benefit design that
incentivizes consumers to chooseinterventions with higher value
• Administratively complex to implement,especially in oncology

8/2/2019 Advisor Live NCCN July 15
http://slidepdf.com/reader/full/advisor-live-nccn-july-15 29/33
© 2009 National Comprehensive Cancer Network NCCN.org
Negotiating Drug Prices• Concept that CMS as a bulk purchaser could negotiate
directly with pharma/biotech for lower prices• Proponents cite international models (UK, Canada)
and Veteran’s Administration
• Even abroad, drug price negotiation is only onecomponent of price controls for pharmaceuticals
• CMS discussing “least costly alternative,” butauthority of CMS to pay in this manner remains in
question

8/2/2019 Advisor Live NCCN July 15
http://slidepdf.com/reader/full/advisor-live-nccn-july-15 30/33
© 2009 National Comprehensive Cancer Network NCCN.org
Cost Sharing in Oncology• Implications for clinical (and financial)
outcome• “Grade 4 Financial Toxicity”
• As outcome may hinge on adherence, high co-payments or out-of-pocket costs are a
disincentive to continue therapy
8/2/2019 Advisor Live NCCN July 15
http://slidepdf.com/reader/full/advisor-live-nccn-july-15 31/33
© 2009 National Comprehensive Cancer Network NCCN.org
Quality Evaluation of Cancer Care• MCOs have a growing interest in quality evaluation
• Often payors do not have enough specific data (tumorstage, patient status) to assess quality in cancer
• Payor/provider collaborations are emerging to help
measure delivered care against existingrecommendations, guidelines, and pathways
• Example: NCCN collaborating with Ingenix todevelop a quality tool for several high-incidence
malignancies
8/2/2019 Advisor Live NCCN July 15
http://slidepdf.com/reader/full/advisor-live-nccn-july-15 32/33
© 2009 National Comprehensive Cancer Network NCCN.org
Payor Perspectives• Lack of consensus over how precertification and prior
authorization should apply to cancer drugs/biologics andwhether “pay for performance” can be applied to oncology
• Most are using NCCN Drugs & Biologics Compendium™
• One payor identified a “trust gap” between patients and
payors• Reimbursement for infusion drugs is a target, but
approaches vary
• Payors are feeling the crunch of economic and system-wideissues, such as the rise in uninsured and COBRA patients

8/2/2019 Advisor Live NCCN July 15
http://slidepdf.com/reader/full/advisor-live-nccn-july-15 33/33
© 2009 National Comprehensive Cancer Network NCCN.org
& Medical Oncology
“CANCER IS NOW ON THE TABLE”
Trish Goldsmith, Executive Vice President and Chief Operating Officer, NCCNJennifer Hinkel, MSc, Manager, Business Insights, NCCN
July 15, 2009
NCCN Oncology Trends Reports
Current Environment, Emerging
Trends, and Future Directions
Managed Care