Embed Size (px)
Citation preview
THE GUIDE TO MULTI-ASSET STRATEGIES
Advisor Insights

THE GUIDE TO MULTI-ASSET STRATEGIES | 1
Current Market Environment
Challenges facing today’s investors
1 |
THE GUIDE TO MULTI-ASSET STRATEGIES | 2
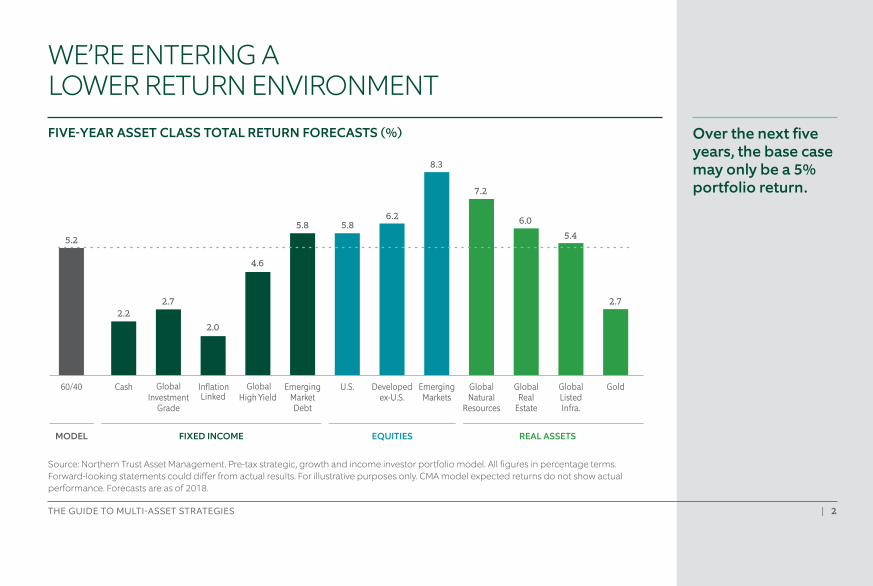
FIVE-YEAR ASSET CLASS TOTAL RETURN FORECASTS (%)
Source: Northern Trust Asset Management. Pre-tax strategic, growth and income investor portfolio model. All figures in percentage terms. Forward-looking statements could differ from actual results. For illustrative purposes only. CMA model expected returns do not show actual performance. Forecasts are as of 2018.
WE’RE ENTERING A LOWER RETURN ENVIRONMENT
GoldGlobalListedInfra.
GlobalReal
Estate
GlobalNatural
Resources
EmergingMarkets
Developedex-U.S.
U.S.EmergingMarketDebt
GlobalHigh Yield
InflationLinked
GlobalInvestment
Grade
Cash60/40
5.2
FIXED INCOME EQUITIES REAL ASSETS
2.22.0
4.6
5.8 5.86.2
8.3
7.2
6.0
5.4
2.7
MODEL
Over the next five years, the base case may only be a 5% portfolio return.
2.7
THE GUIDE TO MULTI-ASSET STRATEGIES | 3
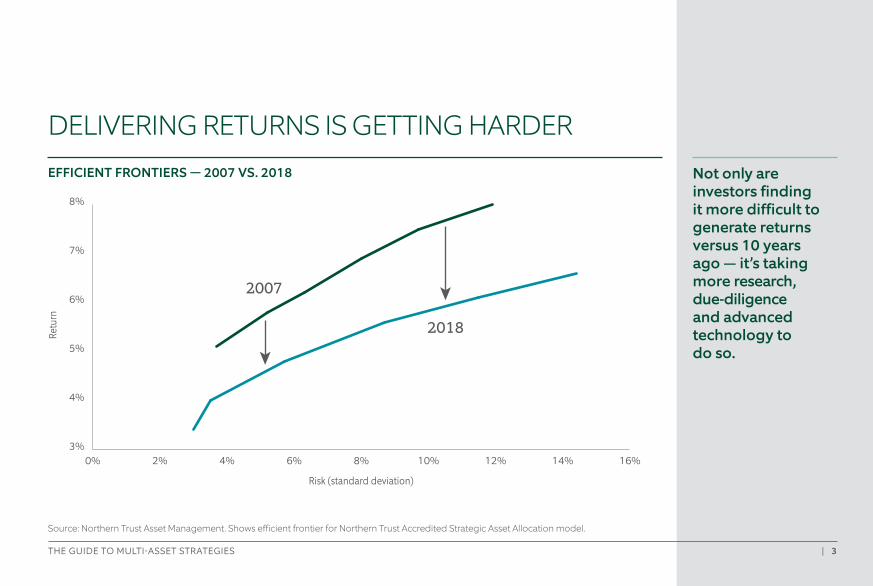
Not only are investors finding it more difficult to generate returns versus 10 years ago — it’s taking more research, due-diligence and advanced technology to do so.
Risk (standard deviation)
Retu
rn
0% 2% 4% 6% 8% 10% 12% 14% 16%3%
4%
5%
6%
7%
8%
2007
2018
EFFICIENT FRONTIERS — 2007 VS. 2018
DELIVERING RETURNS IS GETTING HARDER
Source: Northern Trust Asset Management. Shows efficient frontier for Northern Trust Accredited Strategic Asset Allocation model.
THE GUIDE TO MULTI-ASSET STRATEGIES | 4
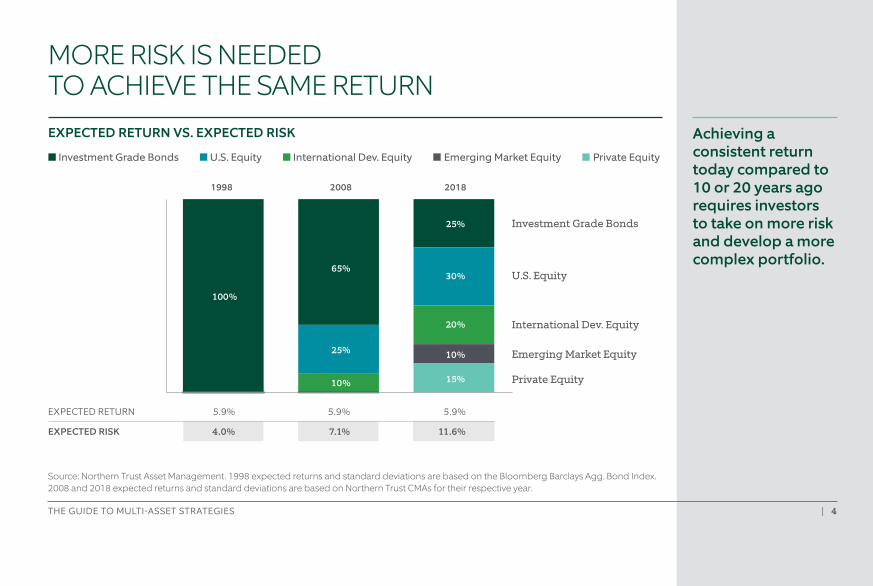
Source: Northern Trust Asset Management. 1998 expected returns and standard deviations are based on the Bloomberg Barclays Agg. Bond Index. 2008 and 2018 expected returns and standard deviations are based on Northern Trust CMAs for their respective year.
EXPECTED RETURN VS. EXPECTED RISK
■ Investment Grade Bonds ■ U.S. Equity ■ International Dev. Equity ■ Emerging Market Equity ■ Private Equity
MORE RISK IS NEEDED TO ACHIEVE THE SAME RETURN
Investment Grade Bonds
U.S. Equity
International Dev. Equity
Emerging Market Equity
Private Equity
100%
10%
25%
65%
10%
15%
20%
30%
25%
1998 2008 2018
EXPECTED RETURN 5.9% 5.9% 5.9%
EXPECTED RISK 4.0% 7.1% 11.6%
Achieving a consistent return today compared to 10 or 20 years ago requires investors to take on more risk and develop a more complex portfolio.
THE GUIDE TO MULTI-ASSET STRATEGIES | 5
The Role of Multi-Asset StrategiesA go-to solution in challenging markets
2 |
THE GUIDE TO MULTI-ASSET STRATEGIES | 6
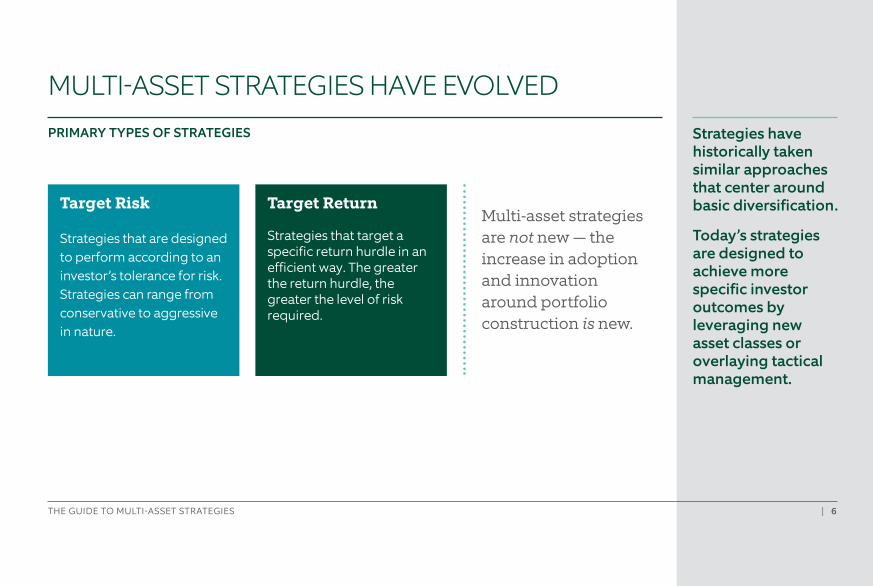
MULTI-ASSET STRATEGIES HAVE EVOLVED
Target Risk
Strategies that are designed to perform according to an investor’s tolerance for risk. Strategies can range from conservative to aggressive in nature.
Target Return
Strategies that target a specific return hurdle in an efficient way. The greater the return hurdle, the greater the level of risk required.
PRIMARY TYPES OF STRATEGIES
Multi-asset strategies are not new — the increase in adoption and innovation around portfolio construction is new.
Strategies have historically taken similar approaches that center around basic diversification.
Today’s strategies are designed to achieve more specific investor outcomes by leveraging new asset classes or overlaying tactical management.
THE GUIDE TO MULTI-ASSET STRATEGIES | 7
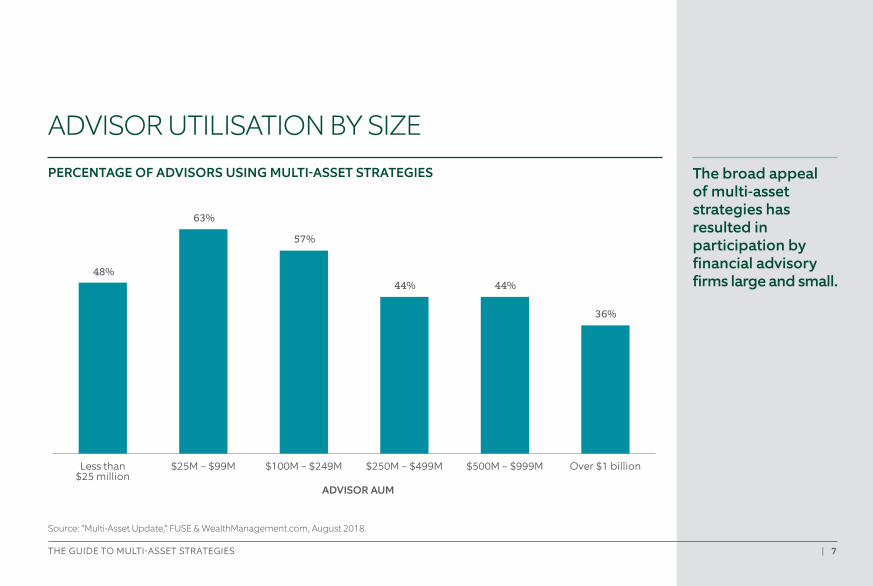
The broad appeal of multi-asset strategies has resulted in participation by financial advisory firms large and small.
ADVISOR UTILISATION BY SIZE
Over $1 billion$500M – $999M$250M – $499M$100M – $249M$25M – $99MLess than$25 million
ADVISOR AUM
48%
63%
57%
44% 44%
36%
Source: “Multi-Asset Update,” FUSE & WealthManagement.com, August 2018.
PERCENTAGE OF ADVISORS USING MULTI-ASSET STRATEGIES
THE GUIDE TO MULTI-ASSET STRATEGIES | 8
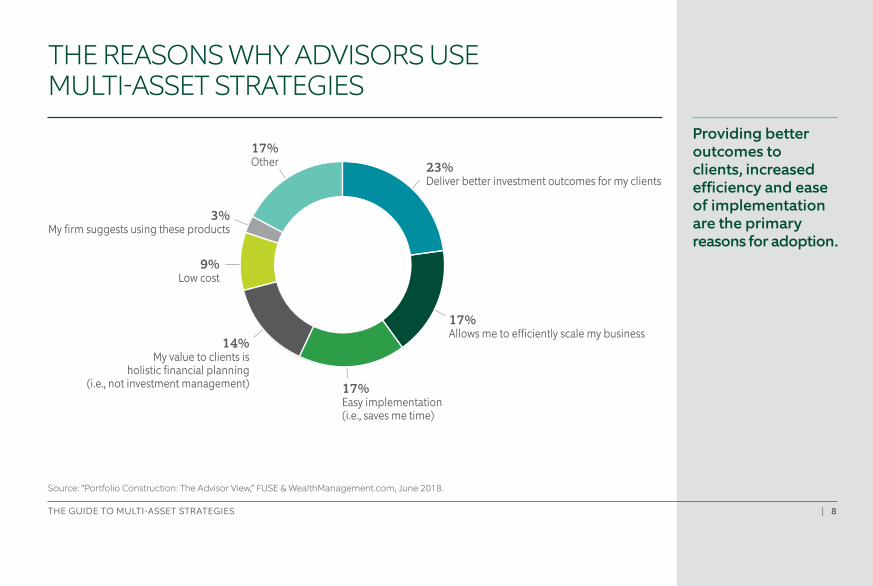
Providing better outcomes to clients, increased efficiency and ease of implementation are the primary reasons for adoption.
THE REASONS WHY ADVISORS USE MULTI-ASSET STRATEGIES
3%
14%My value to clients is
holistic financial planning(i.e., not investment management) 17%
Easy implementation (i.e., saves me time)
17%Allows me to e�ciently scale my business
23%Deliver better investment outcomes for my clients
9%Low cost
17%Other
3%My firm suggests using these products
Source: “Portfolio Construction: The Advisor View,” FUSE & WealthManagement.com, June 2018.
THE GUIDE TO MULTI-ASSET STRATEGIES | 9
3 |Deliver better investment outcomes
Streamline or scale your practice
Manage fees with greater efficiency
The Benefits
THE GUIDE TO MULTI-ASSET STRATEGIES | 10
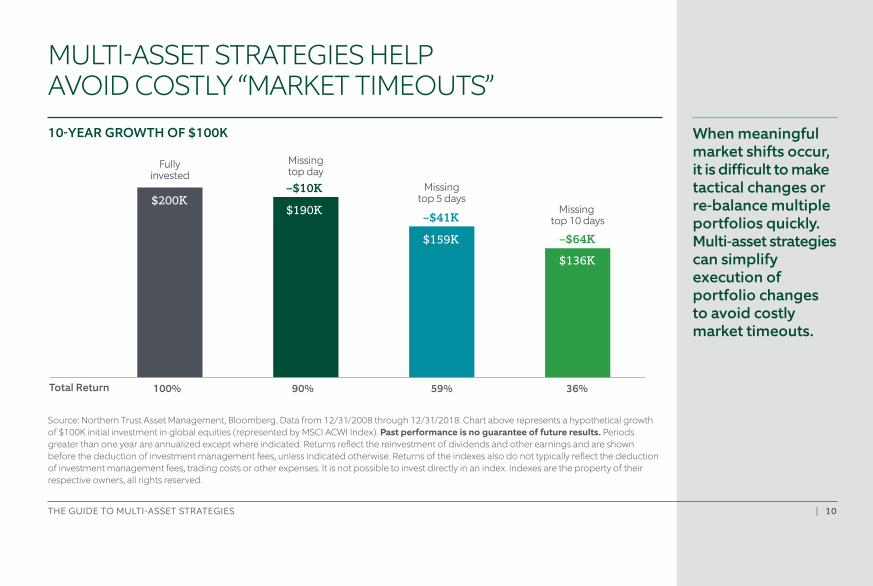
Source: Northern Trust Asset Management, Bloomberg. Data from 12/31/2008 through 12/31/2018. Chart above represents a hypothetical growth of $100K initial investment in global equities (represented by MSCI ACWI Index). Past performance is no guarantee of future results. Periods greater than one year are annualized except where indicated. Returns reflect the reinvestment of dividends and other earnings and are shown before the deduction of investment management fees, unless indicated otherwise. Returns of the indexes also do not typically reflect the deduction of investment management fees, trading costs or other expenses. It is not possible to invest directly in an index. Indexes are the property of their respective owners, all rights reserved.
When meaningful market shifts occur, it is difficult to make tactical changes or re-balance multiple portfolios quickly. Multi-asset strategies can simplify execution of portfolio changes to avoid costly market timeouts.
–$64K
–$10K
–$41KMissing
top 10 days
Missingtop 5 days
Missingtop day
Fullyinvested
$200K$190K
$159K
$136K
36%59%90%100%Total Return
10-YEAR GROWTH OF $100K
MULTI-ASSET STRATEGIES HELP AVOID COSTLY “MARKET TIMEOUTS”
THE GUIDE TO MULTI-ASSET STRATEGIES | 11
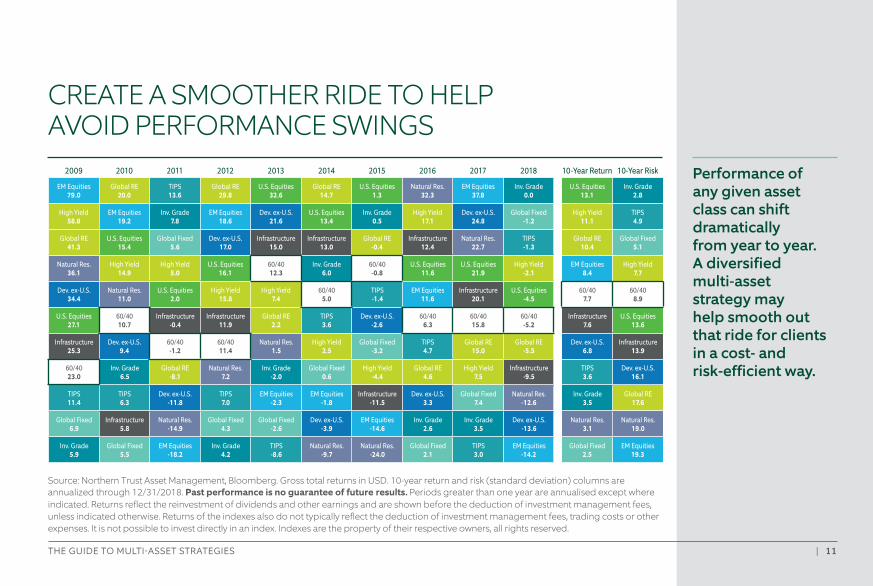
Source: Northern Trust Asset Management, Bloomberg. Gross total returns in USD. 10-year return and risk (standard deviation) columns are annualized through 12/31/2018. Past performance is no guarantee of future results. Periods greater than one year are annualised except where indicated. Returns reflect the reinvestment of dividends and other earnings and are shown before the deduction of investment management fees, unless indicated otherwise. Returns of the indexes also do not typically reflect the deduction of investment management fees, trading costs or other expenses. It is not possible to invest directly in an index. Indexes are the property of their respective owners, all rights reserved.
Performance of any given asset class can shift dramatically from year to year. A diversified multi-asset strategy may help smooth out that ride for clients in a cost- and risk-efficient way.
CREATE A SMOOTHER RIDE TO HELP AVOID PERFORMANCE SWINGS
2009 2010 2011 2012 2013 2014 2015 2016 2017 2018 10-Year Return 10-Year Risk
EM Equities79.0
Global RE 20.0
TIPS 13.6
Global RE 29.8
U.S. Equities 32.6
Global RE 14.7
U.S. Equities 1.3
Natural Res. 32.3
EM Equities 37.8
Inv. Grade 0.0
U.S. Equities 13.1
Inv. Grade 2.8
High Yield 58.8
EM Equities 19.2
Inv. Grade 7.8
EM Equities 18.6
Dev. ex-U.S. 21.6
U.S. Equities 13.4
Inv. Grade 0.5
High Yield 17.1
Dev. ex-U.S. 24.8
Global Fixed -1.2
High Yield 11.1
TIPS 4.9
Global RE 41.3
U.S. Equities 15.4
Global Fixed 5.6
Dev. ex-U.S. 17.0
Infrastructure 15.0
Infrastructure 13.0
Global RE -0.4
Infrastructure 12.4
Natural Res. 22.7
TIPS -1.3
Global RE 10.4
Global Fixed 5.1
Natural Res. 36.1
High Yield 14.9
High Yield 5.0
U.S. Equities 16.1
60/40 12.3
Inv. Grade 6.0
60/40 -0.8
U.S. Equities 11.6
U.S. Equities 21.9
High Yield -2.1
EM Equities 8.4
High Yield 7.7
Dev. ex-U.S. 34.4
Natural Res. 11.0
U.S. Equities 2.0
High Yield 15.8
High Yield 7.4
60/40 5.0
TIPS -1.4
EM Equities 11.6
Infrastructure 20.1
U.S. Equities -4.5
60/40 7.7
60/40 8.9
U.S. Equities 27.1
60/40 10.7
Infrastructure -0.4
Infrastructure 11.9
Global RE 2.2
TIPS 3.6
Dev. ex-U.S. -2.6
60/40 6.3
60/40 15.8
60/40 -5.2
Infrastructure 7.6
U.S. Equities 13.6
Infrastructure 25.3
Dev. ex-U.S. 9.4
60/40 -1.2
60/40 11.4
Natural Res. 1.5
High Yield 2.5
Global Fixed -3.2
TIPS 4.7
Global RE 15.0
Global RE -5.5
Dev. ex-U.S. 6.8
Infrastructure 13.9
60/40 23.0
Inv. Grade 6.5
Global RE -8.1
Natural Res. 7.2
Inv. Grade -2.0
Global Fixed 0.6
High Yield -4.4
Global RE 4.6
High Yield 7.5
Infrastructure -9.5
TIPS 3.6
Dev. ex-U.S. 16.1
TIPS 11.4
TIPS 6.3
Dev. ex-U.S. -11.8
TIPS 7.0
EM Equities -2.3
EM Equities -1.8
Infrastructure -11.5
Dev. ex-U.S. 3.3
Global Fixed 7.4
Natural Res. -12.6
Inv. Grade 3.5
Global RE 17.6
Global Fixed 6.9
Infrastructure 5.8
Natural Res. -14.9
Global Fixed 4.3
Global Fixed -2.6
Dev. ex-U.S. -3.9
EM Equities -14.6
Inv. Grade 2.6
Inv. Grade 3.5
Dev. ex-U.S. -13.6
Natural Res. 3.1
Natural Res. 19.0
Inv. Grade 5.9
Global Fixed 5.5
EM Equities -18.2
Inv. Grade 4.2
TIPS -8.6
Natural Res. -9.7
Natural Res. -24.0
Global Fixed 2.1
TIPS 3.0
EM Equities -14.2
Global Fixed 2.5
EM Equities 19.3
THE GUIDE TO MULTI-ASSET STRATEGIES | 12
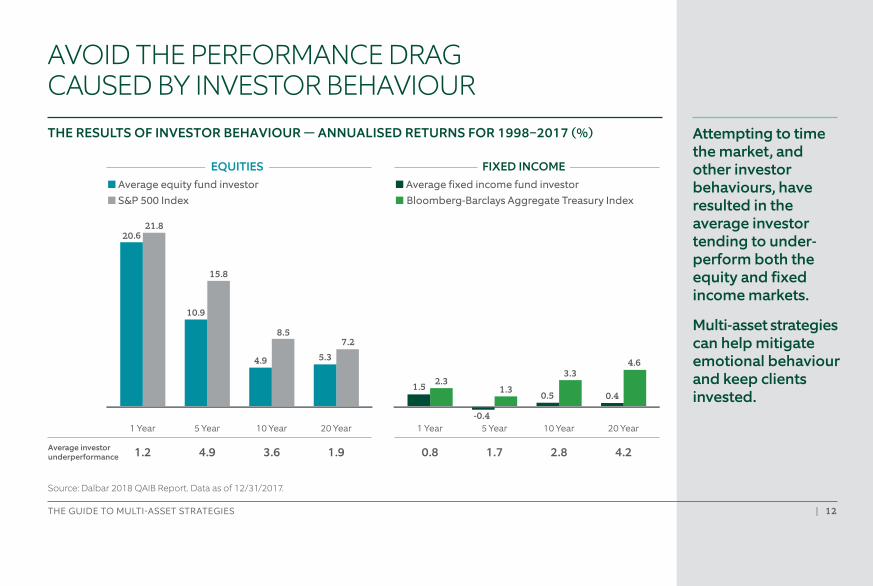
Source: Dalbar 2018 QAIB Report. Data as of 12/31/2017.
Attempting to time the market, and other investor behaviours, have resulted in the average investor tending to under- perform both the equity and fixed income markets.
Multi-asset strategies can help mitigate emotional behaviour and keep clients invested.
AVOID THE PERFORMANCE DRAG CAUSED BY INVESTOR BEHAVIOUR THE RESULTS OF INVESTOR BEHAVIOUR — ANNUALISED RETURNS FOR 1998–2017 (%)
20 Year10 Year5 Year1 Year20 Year10 Year5 Year1 Year
4.22.81.70.81.93.64.91.2Average investorunderperformance
5.3
10.9
15.8
20.621.8
7.2
4.9
8.5
0.4
-0.4
1.31.5 2.3
4.6
0.5
3.3
FIXED INCOMEEQUITIES■ Average equity fund investor■ S&P 500 Index
■ Average fixed income fund investor■ Bloomberg-Barclays Aggregate Treasury Index
THE GUIDE TO MULTI-ASSET STRATEGIES | 13
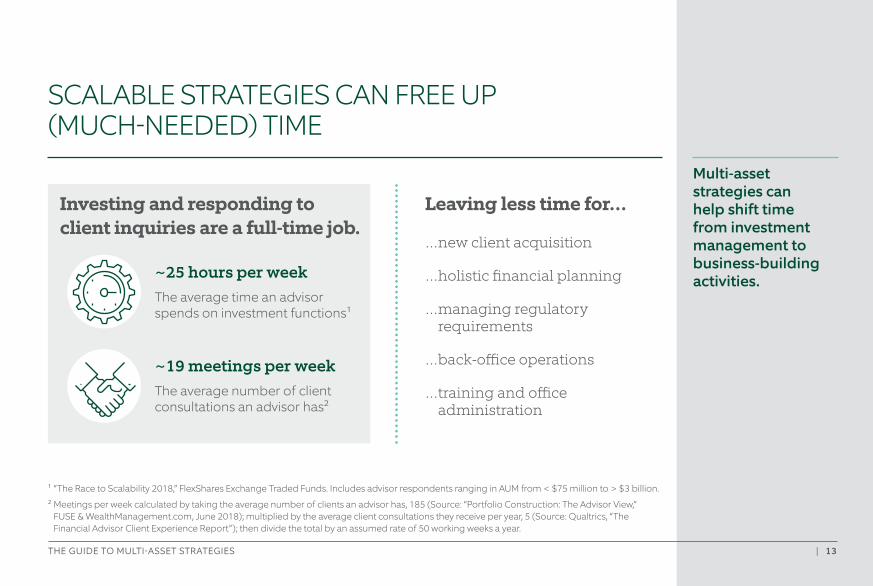
¹ “The Race to Scalability 2018,” FlexShares Exchange Traded Funds. Includes advisor respondents ranging in AUM from < $75 million to > $3 billion.
² Meetings per week calculated by taking the average number of clients an advisor has, 185 (Source: “Portfolio Construction: The Advisor View,” FUSE & WealthManagement.com, June 2018); multiplied by the average client consultations they receive per year, 5 (Source: Qualtrics, “The Financial Advisor Client Experience Report”); then divide the total by an assumed rate of 50 working weeks a year.
Multi-asset strategies can help shift time from investment management to business-building activities.
SCALABLE STRATEGIES CAN FREE UP (MUCH-NEEDED) TIME
Investing and responding to client inquiries are a full-time job.
Leaving less time for…
…new client acquisition
…holistic financial planning
… managing regulatory requirements
…back-office operations
… training and office administration
~25 hours per week The average time an advisor spends on investment functions¹
~19 meetings per week
The average number of client consultations an advisor has²
THE GUIDE TO MULTI-ASSET STRATEGIES | 14
New Business
Show Holistic Value
¹ “The Race to Scalability 2018,” FlexShares Exchange Traded Funds. Includes advisor respondents ranging in AUM from < $75 million to > $3 billion.
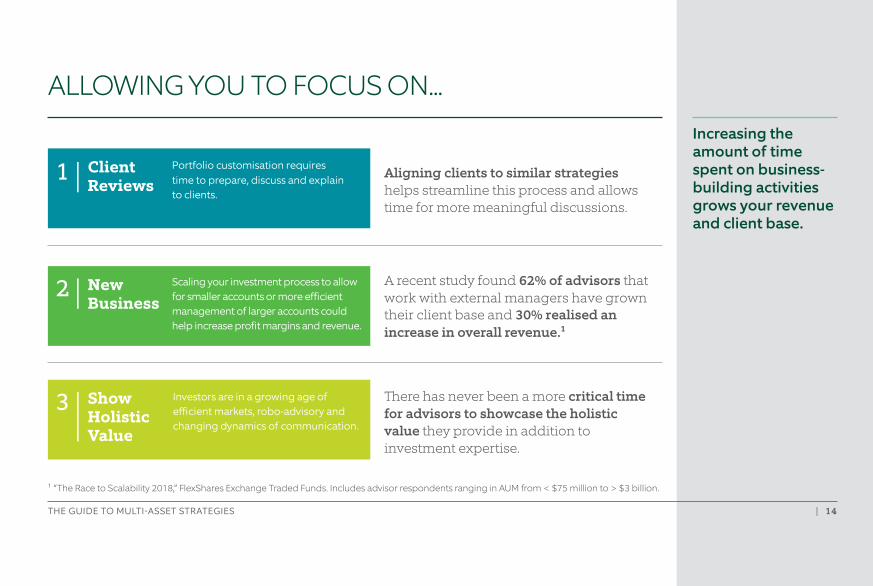
Increasing the amount of time spent on business- building activities grows your revenue and client base.
ALLOWING YOU TO FOCUS ON...
Client Reviews
Portfolio customisation requires time to prepare, discuss and explain to clients.
Aligning clients to similar strategies helps streamline this process and allows time for more meaningful discussions.
Scaling your investment process to allow for smaller accounts or more efficient management of larger accounts could help increase profit margins and revenue.
A recent study found 62% of advisors that work with external managers have grown their client base and 30% realised an increase in overall revenue.¹
Investors are in a growing age of efficient markets, robo-advisory and changing dynamics of communication.
There has never been a more critical time for advisors to showcase the holistic value they provide in addition to investment expertise.
1 |
2 |
3 |
THE GUIDE TO MULTI-ASSET STRATEGIES | 15
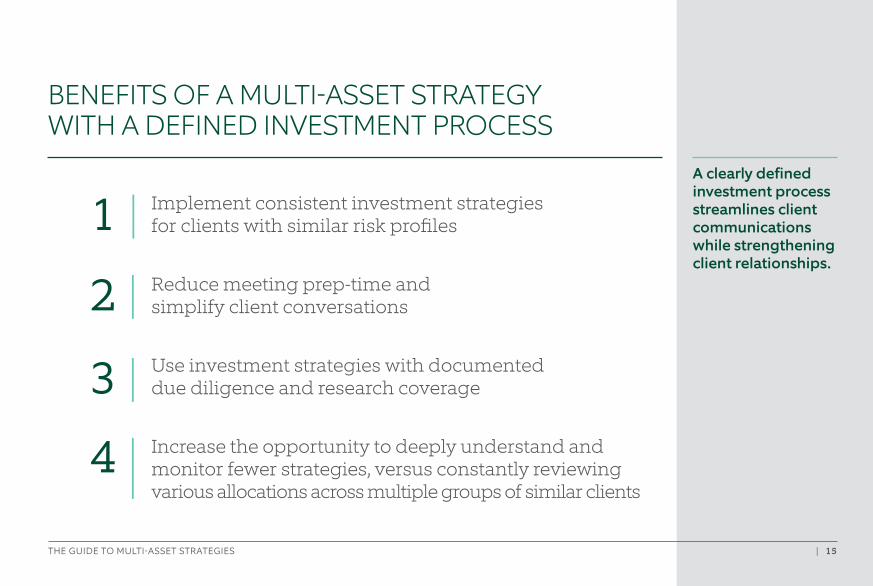
A clearly defined investment process streamlines client communications while strengthening client relationships.
BENEFITS OF A MULTI-ASSET STRATEGY WITH A DEFINED INVESTMENT PROCESS
Implement consistent investment strategies for clients with similar risk profiles
Reduce meeting prep-time and simplify client conversations
Use investment strategies with documented due diligence and research coverage
Increase the opportunity to deeply understand and monitor fewer strategies, versus constantly reviewing various allocations across multiple groups of similar clients
1 |
2 |
3 |
4 |
THE GUIDE TO MULTI-ASSET STRATEGIES | 16
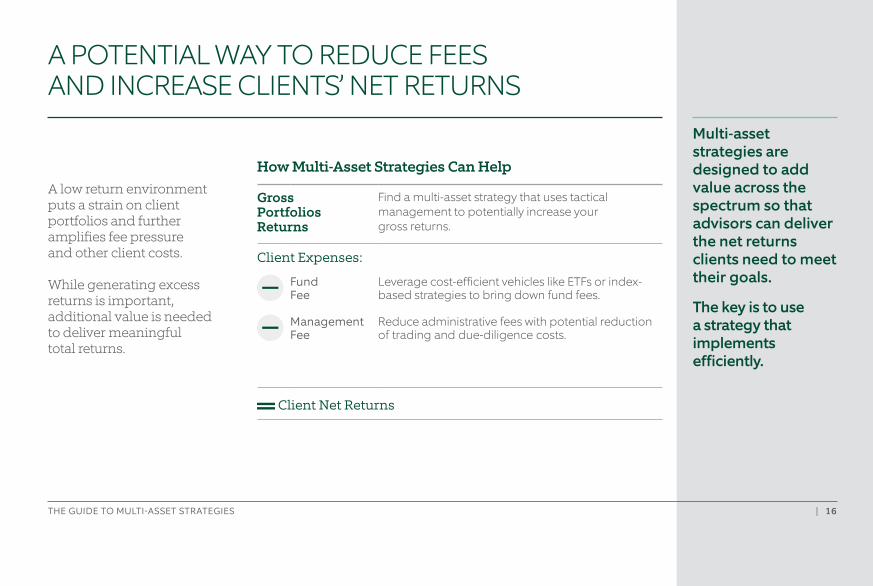
Gross Portfolios Returns
Find a multi-asset strategy that uses tactical management to potentially increase your gross returns.
Client Expenses:
Fund Fee
Management Fee
Leverage cost-efficient vehicles like ETFs or index- based strategies to bring down fund fees.
Reduce administrative fees with potential reduction of trading and due-diligence costs.
Client Net Returns
Multi-asset strategies are designed to add value across the spectrum so that advisors can deliver the net returns clients need to meet their goals.
The key is to use a strategy that implements efficiently.
A POTENTIAL WAY TO REDUCE FEES AND INCREASE CLIENTS’ NET RETURNS
A low return environment puts a strain on client portfolios and further amplifies fee pressure and other client costs.
While generating excess returns is important, additional value is needed to deliver meaningful total returns.
How Multi-Asset Strategies Can Help
THE GUIDE TO MULTI-ASSET STRATEGIES | 17
Multi-Asset Investing at Northern Trust Asset Management4 |40+ years of demonstrated experience and commitment
THE GUIDE TO MULTI-ASSET STRATEGIES | 18
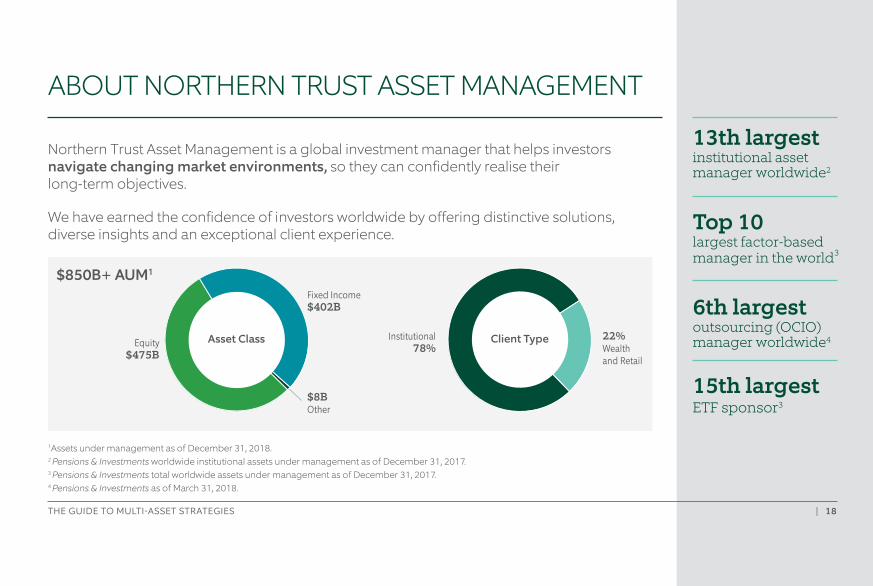
$850B+ AUM1
Northern Trust Asset Management is a global investment manager that helps investors navigate changing market environments, so they can confidently realise their long-term objectives.
We have earned the confidence of investors worldwide by offering distinctive solutions, diverse insights and an exceptional client experience.
ABOUT NORTHERN TRUST ASSET MANAGEMENT
6th largestoutsourcing (OCIO) manager worldwide4
15th largestETF sponsor3
13th largestinstitutional asset manager worldwide2
Top 10 largest factor-based manager in the world3
3%
22%Wealthand Retail
Institutional78%
Client Type
3%
$8BOther
Fixed Income$402B
Equity$475B
Asset Class
1Assets under management as of December 31, 2018. 2 Pensions & Investments worldwide institutional assets under management as of December 31, 2017.3 Pensions & Investments total worldwide assets under management as of December 31, 2017.4 Pensions & Investments as of March 31, 2018.
THE GUIDE TO MULTI-ASSET STRATEGIES | 19
We’ve honed our expertise over four decades as a discretionary asset
manager — entrusted by institutional investors for total portfolio design and construction.
This provides a distinctly informed perspective and advantage.
THE GUIDE TO MULTI-ASSET STRATEGIES | 20
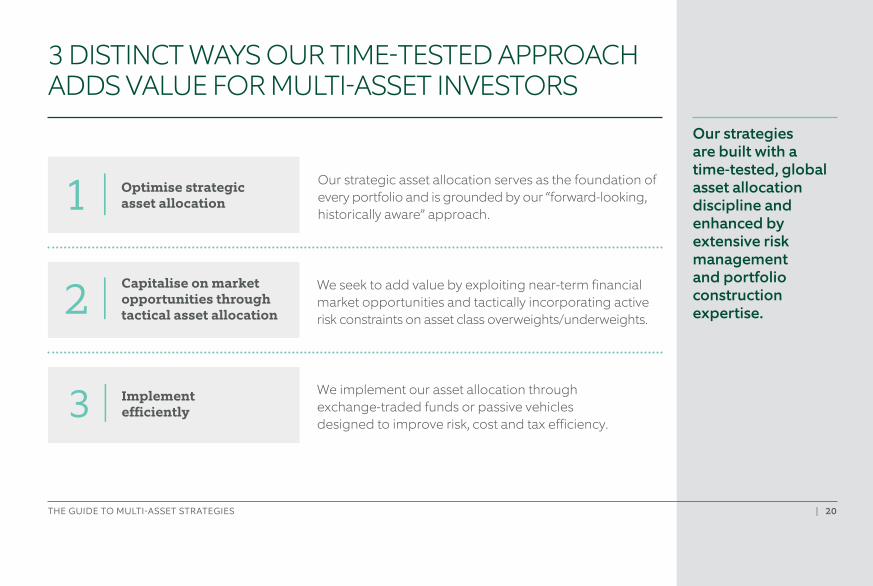
Our strategies are built with a time-tested, global asset allocation discipline and enhanced by extensive risk management and portfolio construction expertise.
3 DISTINCT WAYS OUR TIME-TESTED APPROACHADDS VALUE FOR MULTI-ASSET INVESTORS
Our strategic asset allocation serves as the foundation of every portfolio and is grounded by our “forward-looking, historically aware” approach.
Optimise strategic asset allocation1 |
We seek to add value by exploiting near-term financial market opportunities and tactically incorporating active risk constraints on asset class overweights/underweights.
Capitalise on market opportunities through tactical asset allocation2 |
We implement our asset allocation through exchange-traded funds or passive vehicles designed to improve risk, cost and tax efficiency.
Implement efficiently3 |
THE GUIDE TO MULTI-ASSET STRATEGIES | 21
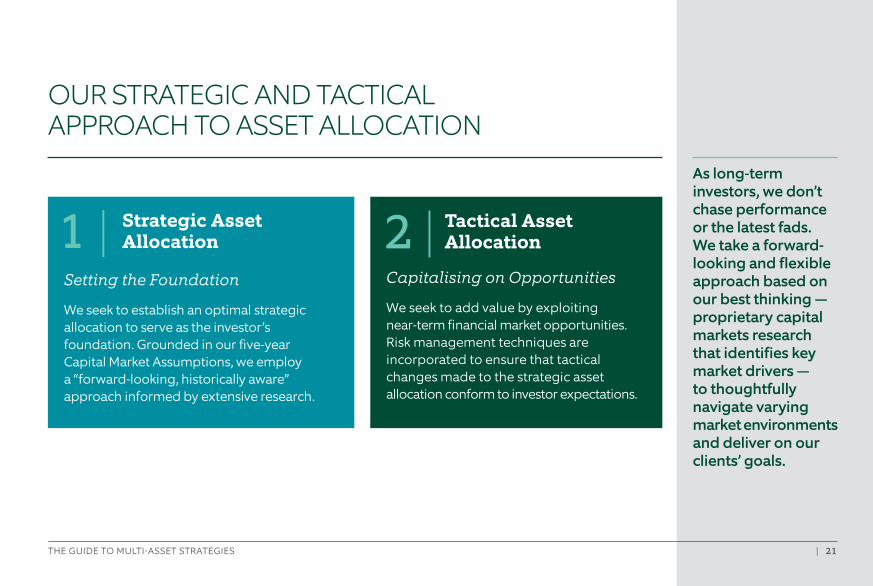
As long-term investors, we don’t chase performance or the latest fads. We take a forward-looking and flexible approach based on our best thinking — proprietary capital markets research that identifies key market drivers — to thoughtfully navigate varying market environments and deliver on our clients’ goals.
OUR STRATEGIC AND TACTICAL APPROACH TO ASSET ALLOCATION
2 | TAlloc
acticational Asset
Capitalising on Opportunities
We seek to add value by exploiting near-term financial market opportunities. Risk management techniques are incorporated to ensure that tactical changes made to the strategic asset allocation conform to investor expectations.
1 | Strategic AssetAllocation
Setting the Foundation
We seek to establish an optimal strategic allocation to serve as the investor’s foundation. Grounded in our five-year Capital Market Assumptions, we employ a “forward-looking, historically aware” approach informed by extensive research.
THE GUIDE TO MULTI-ASSET STRATEGIES | 22
For illustrative purposes only.
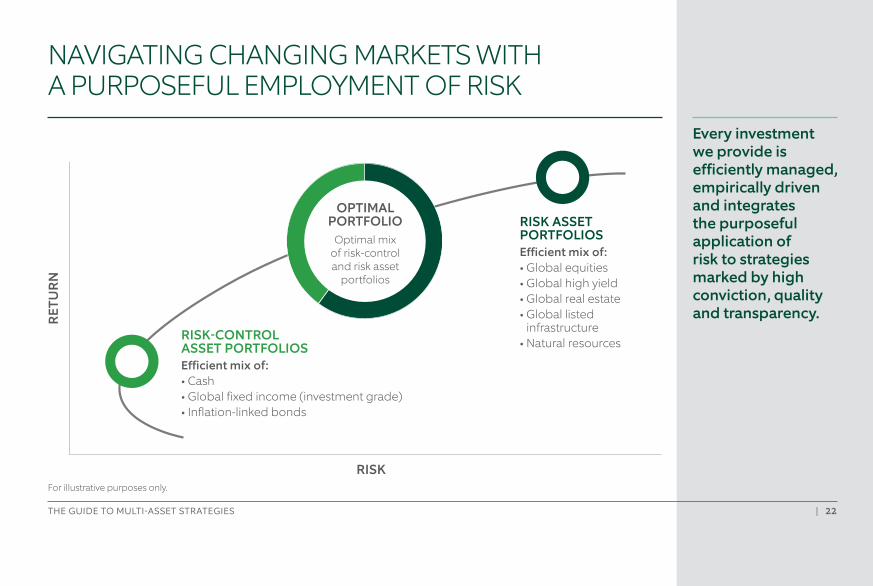
Every investment we provide is efficiently managed, empirically driven and integrates the purposeful application of risk to strategies marked by high conviction, quality and transparency.
NAVIGATING CHANGING MARKETS WITH A PURPOSEFUL EMPLOYMENT OF RISK
RISK
RET
UR
N
RISK-CONTROL ASSET PORTFOLIOSEfficient mix of: • Cash• Global fixed income (investment grade)• Inflation-linked bonds
RISK ASSET PORTFOLIOSEfficient mix of: • Global equities• Global high yield• Global real estate• Global listed
infrastructure• Natural resources
OPTIMAL PORTFOLIO
Optimal mix of risk-control and risk asset
portfolios
THE GUIDE TO MULTI-ASSET STRATEGIES | 23
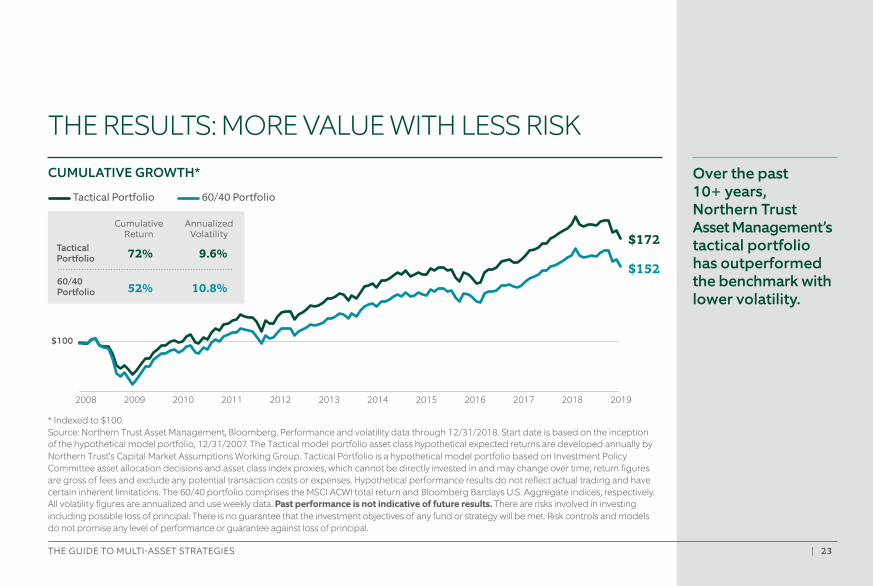
Over the past 10+ years, Northern Trust Asset Management’s tactical portfolio has outperformed the benchmark with lower volatility.
CUMULATIVE GROWTH*
Tactical Portfolio 60/40 Portfolio
THE RESULTS: MORE VALUE WITH LESS RISK
* Indexed to $100. Source: Northern Trust Asset Management, Bloomberg. Performance and volatility data through 12/31/2018. Start date is based on the inception of the hypothetical model portfolio, 12/31/2007. The Tactical model portfolio asset class hypothetical expected returns are developed annually by Northern Trust’s Capital Market Assumptions Working Group. Tactical Portfolio is a hypothetical model portfolio based on Investment Policy Committee asset allocation decisions and asset class index proxies, which cannot be directly invested in and may change over time; return figures are gross of fees and exclude any potential transaction costs or expenses. Hypothetical performance results do not reflect actual trading and have certain inherent limitations. The 60/40 portfolio comprises the MSCI ACWI total return and Bloomberg Barclays U.S. Aggregate indices, respectively. All volatility figures are annualized and use weekly data. Past performance is not indicative of future results. There are risks involved in investing including possible loss of principal. There is no guarantee that the investment objectives of any fund or strategy will be met. Risk controls and models do not promise any level of performance or guarantee against loss of principal.
2008 2009 2010 2011 2012 2013 2014 2015 2016 2017 2018 2019
$100
$172
$15272% 9.6%
52% 10.8%
Tactical Portfolio
Annualized Volatility
Cumulative Return
60/40 Portfolio
THE GUIDE TO MULTI-ASSET STRATEGIES | 24
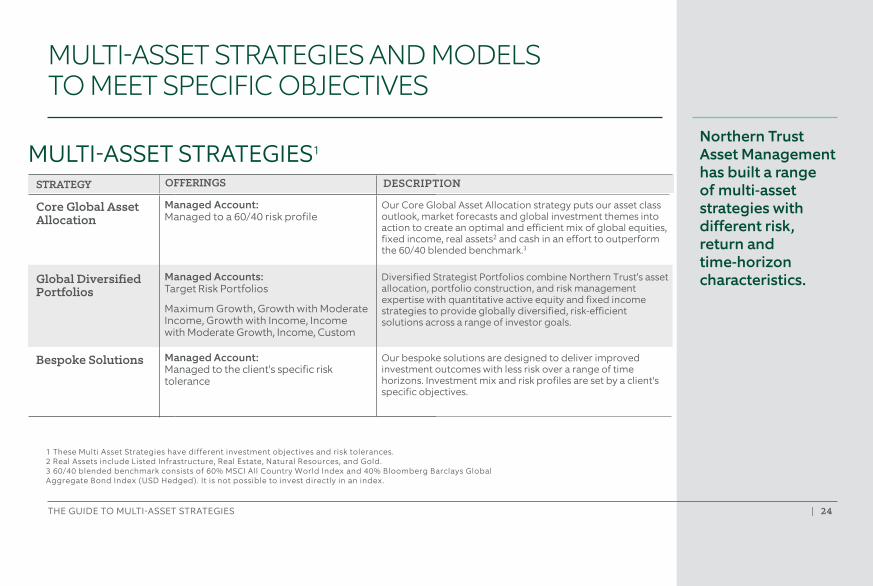
Northern Trust Asset Management has built a range of multi-asset strategies with different risk, return and time-horizon characteristics.
MULTI-ASSET STRATEGIES AND MODELS TO MEET SPECIFIC OBJECTIVES
MULTI-ASSET STRATEGIES1
STRATEGY OFFERINGS DESCRIPTION
Core Global Asset Allocation
Managed Account:Managed to a 60/40 risk profile
Our Core Global Asset Allocation strategy puts our asset class outlook, market forecasts and global investment themes into action to create an optimal and efficient mix of global equities, fixed income, real assets2 and cash in an effort to outperform the 60/40 blended benchmark.3
Global Diversified Portfolios
Managed Accounts: Target Risk Portfolios
Bespoke Solutions
Maximum Growth, Growth with Moderate Income, Growth with Income, Income with Moderate Growth, Income, Custom
Managed Account: Managed to the client's specific risk tolerance
Diversified Strategist Portfolios combine Northern Trust’s asset allocation, portfolio construction, and risk management expertise with quantitative active equity and fixed income strategies to provide globally diversified, risk-efficient solutions across a range of investor goals.
Our bespoke solutions are designed to deliver improved investment outcomes with less risk over a range of time horizons. Investment mix and risk profiles are set by a client's specific objectives.
1 These Multi Asset Strategies have different investment objectives and risk tolerances.2 Real Assets include Listed Infrastructure, Real Estate, Natural Resources, and Gold.3 60/40 blended benchmark consists of 60% MSCI All Country World Index and 40% Bloomberg Barclays Global Aggregate Bond Index (USD Hedged). It is not possible to invest directly in an index.
THE GUIDE TO MULTI-ASSET STRATEGIES | 25
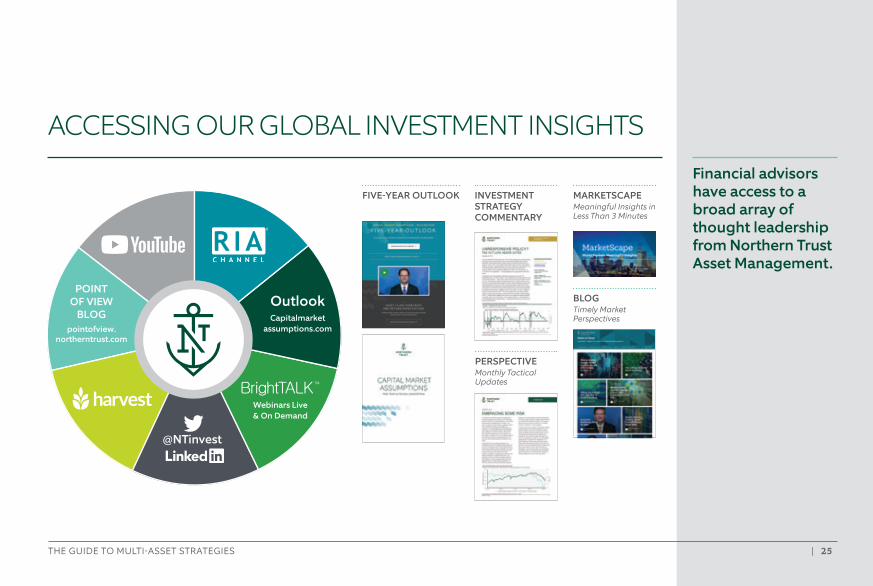
Financial advisors have access to a broad array of thought leadership from Northern Trust Asset Management.
ACCESSING OUR GLOBAL INVESTMENT INSIGHTS
FIVE-YEAR OUTLOOK INVESTMENT STRATEGY COMMENTARY
PERSPECTIVEMonthly Tactical Updates
MARKETSCAPEMeaningful Insights in Less Than 3 Minutes
BLOGTimely Market Perspectives
OutlookCapitalmarket
assumptions.compointofview.northerntrust.com
Webinars Live & On Demand
@NTinvest
POINTOF VIEW
BLOG

THE GUIDE TO MULTI-ASSET STRATEGIES | 26
INTENTIONALLY BLANK PAGE
THE GUIDE TO MULTI-ASSET STRATEGIES | 27
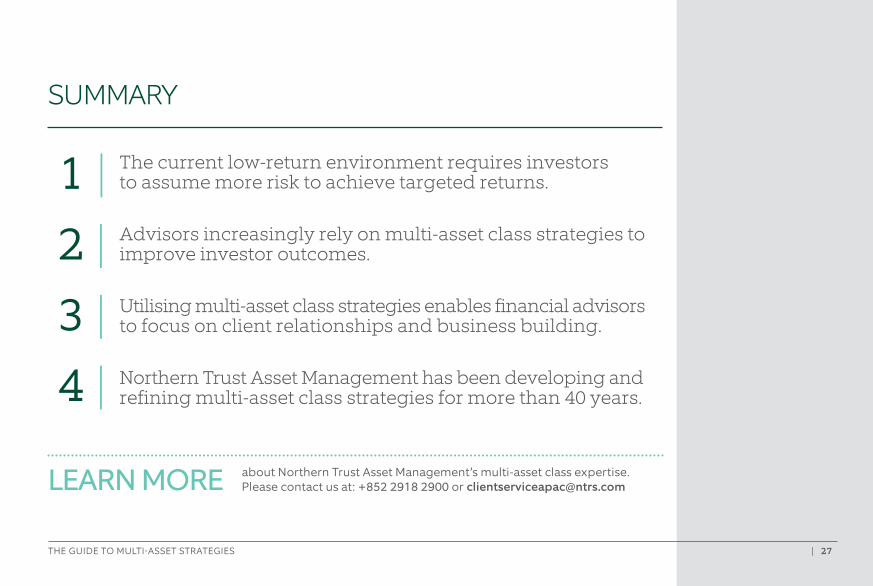
SUMMARY
LEARN MORE about Northern Trust Asset Management’s multi-asset class expertise.Please contact us at: +852 2918 2900 or [email protected]
The current low-return environment requires investors to assume more risk to achieve targeted returns.
Advisors increasingly rely on multi-asset class strategies to improve investor outcomes.
Utilising multi-asset class strategies enables financial advisors to focus on client relationships and business building.
Northern Trust Asset Management has been developing and refining multi-asset class strategies for more than 40 years.
1 |2 |3 |4 |
THE GUIDE TO MULTI-ASSET STRATEGIES | 28
IMPORTANT INFORMATION
© 2019 Northern Trust Corporation. Head Office: 50 South La Salle Street, Chicago, Illinois 60603 U.S.A.
The information contained herein is intended for use with current or prospective clients of Northern Trust Investments, Inc. The information is not intended for distribution or use by any person in any jurisdiction where such distribution would be contrary to local law or regulation. Northern Trust and its affiliates may have positions in and may effect transactions in the markets, contracts and related investments different than described in this information. This information is obtained from sources believed to be reliable, and its accuracy and completeness are not guaranteed. Information does not constitute a recommendation of any investment strategy, is not intended as investment advice and does not take into account all the circumstances of each investor. Opinions and forecasts discussed are those of the author, do not necessarily reflect the views of Northern Trust and are subject to change without notice.
This report is provided for informational purposes only and is not intended to be, and should not be construed as, an offer, solicitation or recommendation with respect to any transaction and should not be treated as legal advice, investment advice or tax advice. Recipients should not rely upon this information as a substitute for obtaining specific legal or tax advice from their own professional legal or tax advisors. References to specific securities and their issuers are for illustrative purposes only and are not intended and should not be interpreted as recommendations to purchase or sell such securities. Indices and trademarks are the property of their respective owners. Information is subject to change based on market or other conditions.
All securities investing and trading activities risk the loss of capital. Each portfolio is subject to substantial risks including market risks, strategy risks, adviser risk and risks with respect to its investment in other structures. There can be no assurance that any portfolio investment objectives will be achieved, or that any investment will achieve profits or avoid incurring substantial losses. No investment strategy or risk management technique can guarantee returns or eliminate risk in any market environment. Risk controls and models do not promise any level of performance or guarantee against loss of principal. Any discussion of risk management is intended to describe Northern Trust’s efforts to monitor and manage risk but does not imply low risk.
Past performance is no guarantee of future results. Performance returns and the principal value of an investment will fluctuate. Performance returns contained herein are subject to revision by Northern Trust. Comparative indices shown are provided as an indication of the performance of a particular segment of the capital markets and/or alternative strategies in general. Index performance returns do not reflect any management fees, transaction costs or expenses. It is not possible to invest directly in any index. Net performance returns are reduced by investment management fees and other expenses relating to the management of the account. Gross performance returns contained herein include reinvestment of dividends and other earnings, transaction costs, and all fees and expenses other than investment management fees, unless indicated otherwise. For additional information on fees, please refer to Part 2a of the Form ADV or consult a Northern Trust representative.
THE GUIDE TO MULTI-ASSET STRATEGIES | 29
IMPORTANT INFORMATIONcontinued
Forward-looking statements and assumptions are Northern Trust’s current estimates or expectations of future events or future results based upon proprietary research and should not be construed as an estimate or promise of results that a portfolio may achieve. Actual results could differ materially from the results indicated by this information.
Capital Market Assumption (CMA) model expected returns do not show actual performance. CMA model expected returns are based on IPC Forecasted Returns and reflect Northern Trust’s Investment Policy Committee’s (IPC) forward-looking annual capital market assumptions.
The Capital Market Assumptions Working Group (CMAWG), a subset of IPC members, publishes its assumptions as a white paper report. Forecasted returns are for average annual returns (geometric basis). Five-year forecasts are developed annually; most recent forecasts released [7/13/2018]. The model cannot account for the impact that economic, market, and other factors may have on the implementation and ongoing management of an actual investment strategy. Model outcomes do not reflect actual trading, liquidity constraints, fees, expenses, taxes and other factors that could impact the future returns. The model assumptions are passive only. References to expected returns are not promises or even estimates of actual returns an investor may achieve. The assumptions, views, techniques and estimates set out are provided for illustrative purposes only.
Forecasts of financial market trends that are based on current market conditions constitute CMAWG judgment and are subject to change without notice.
“Expected” or “alpha” return estimates are subject to uncertainty and error. The ability to achieve similar outcomes is subject to risk factors over which Northern Trust may have no or limited control.
If presented, hypothetical portfolio information provided does not represent results of an actual investment portfolio but reflects representative historical performance of the strategies, funds or accounts listed herein, which were selected with the benefit of hindsight. Hypothetical performance results do not reflect actual trading. No representation is being made that any portfolio will achieve a performance record similar to that shown. A hypothetical investment does not necessarily take into account the fees, risks, economic or market factors/conditions an investor might experience in actual trading. Hypothetical results may have under- or over-compensation for the impact, if any, of certain market factors such as lack of liquidity, economic or market factors/conditions. The investment returns of other clients may differ materially from the portfolio portrayed. There are numerous other factors related to the markets in general or to the implementation of any specific program that cannot be fully accounted for in the preparation of hypothetical performance results. The information is confidential and may not be duplicated in any form or disseminated without the prior consent of Northern Trust.
This report is provided for informational purposes only and is not intended to be, and should not be construed as, an offer, solicitation or recommendation with respect to any transaction and should not be treated as legal advice, investment advice, or tax advice.
THE GUIDE TO MULTI-ASSET STRATEGIES | 30
IMPORTANT INFORMATIONcontinued
Northern Trust Asset Management is composed of Northern Trust Investments, Inc. Northern Trust Global Investments Limited, Northern Trust Fund Managers (Ireland) Limited, Northern Trust Global Investments Japan, K.K., NT Global Advisors Inc., 50 South Capital Advisors, LLC and investment personnel of The Northern Trust Company of Hong Kong Limited and The Northern Trust Company.
The Northern Trust Company has a branch in China mainly regulated by the China Banking Regulatory Commission, People’s Bank of China and State Administration of Foreign Exchange.
The Northern Trust Company of Hong Kong Limited (CE no. ACO807) (TNTCHK) is incorporated in Hong Kong and is licensed by the Securities and Futures Commission (SFC) of Hong Kong to conduct Type 1 (dealing in securities), Type 2 (dealing in futures), Type 4 (advising on securities) and Type 9 (asset management) regulated activities pursuant to the Securities and Futures Ordnance (SFO) of Hong Kong. TNTCHK only deals with 'professional investors' (as defined by the SFO and its subsidiary legislation) and does not hold any client assets.
The Northern Trust Company has a Representative Office in Kuala Lumpur which is subject to regulation in Malaysia by Bank Negara Malaysia.The Northern Trust Company has a Singapore Branch, which is a foreign wholesale bank regulated by the Monetary Authority of Singapore.
The Northern Trust Company has a Representative Office in Seoul which is subject to regulation in South Korea by the Financial Services Commission of Korea.
Pursuant to Class Order/transitional relief granted by the Australian Securities and Investments Commission (ASIC), Northern Trust Global Investments Limited (“NTGIL”) is exempt from the requirement to hold an Australian Financial Services Licence (“AFSL”) under the Corporations Act. NTGIL is authorised and regulated by the FCA under UK laws, which differ from Australian laws. Similarly, The Northern Trust Company of Hong Kong Limited (“TNTCHK”) is exempt from the requirement to hold an AFSL under the Corporations Act. TNTCHK is authorized and regulated by the SFC under Hong Kong laws, which differ from Australian laws. For investors in Australia, this material is directed to and should only be accessed by wholesale and professional investors within the meaning of the Corporations Act 2001 (Cth) and is not intended for retail clients. For investors in New Zealand, this material is directed to and should only be accessed by registered financial service providers and is not intended for retail clients.
The Northern Trust Company ABN 62 126 279 918 holds AFSL No. 314970.
For more information, read our legal and regulatory information about individual market offices.
This material is directed to professional clients only and is not intended for retail clients. For Asia-Pacific markets, it is directed to expert, institutional, professional and wholesale clients or investors only and should not be relied upon by retail clients or investors.