Embed Size (px)
Citation preview
siemens-healthineers.com/epoc
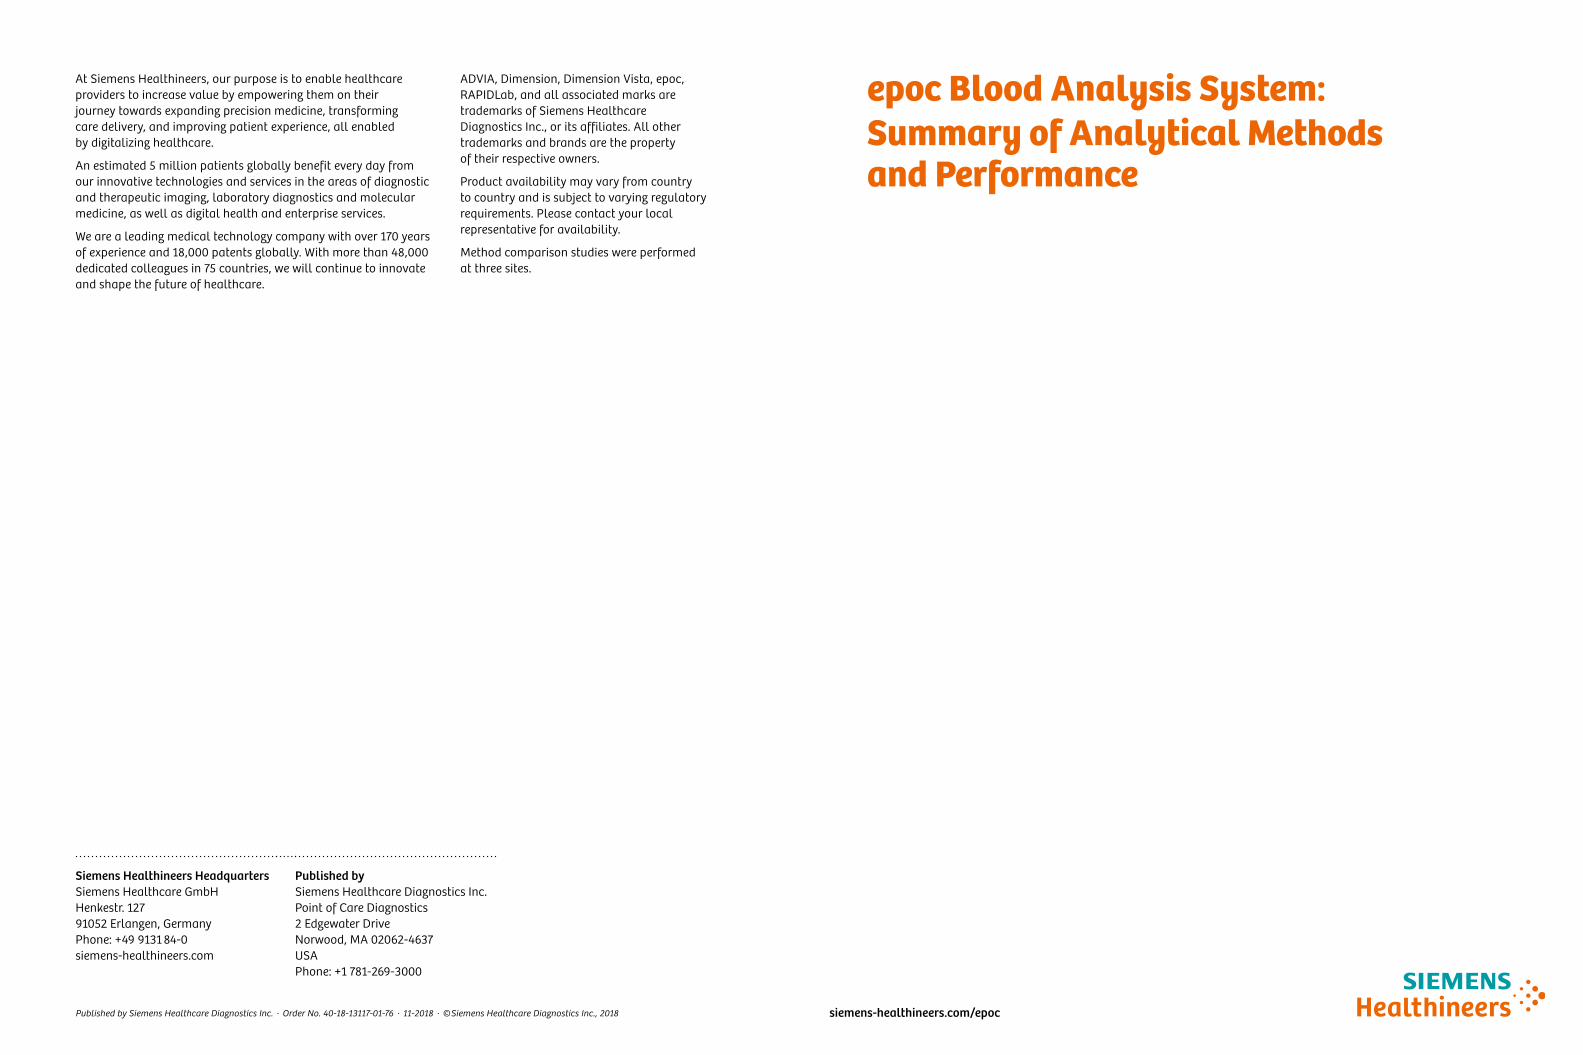
epoc Blood Analysis System:Summary of Analytical Methods and Performance
ADVIA, Dimension, Dimension Vista, epoc, RAPIDLab, and all associated marks are trademarks of Siemens Healthcare Diagnostics Inc., or its affiliates. All other trademarks and brands are the property of their respective owners.
Product availability may vary from country to country and is subject to varying regulatory requirements. Please contact your local representative for availability.
Method comparison studies were performed at three sites.
At Siemens Healthineers, our purpose is to enable healthcare providers to increase value by empowering them on their journey towards expanding precision medicine, transforming care delivery, and improving patient experience, all enabled by digitalizing healthcare.
An estimated 5 million patients globally benefit every day from our innovative technologies and services in the areas of diagnostic and therapeutic imaging, laboratory diagnostics and molecular medicine, as well as digital health and enterprise services.
We are a leading medical technology company with over 170 years of experience and 18,000 patents globally. With more than 48,000 dedicated colleagues in 75 countries, we will continue to innovate and shape the future of healthcare.
Published by Siemens Healthcare Diagnostics Inc. · Order No. 40-18-13117-01-76 · 11-2018 · © Siemens Healthcare Diagnostics Inc., 2018
Siemens Healthineers HeadquartersSiemens Healthcare GmbHHenkestr. 12791052 Erlangen, GermanyPhone: +49 9131 84-0siemens-healthineers.com
Published bySiemens Healthcare Diagnostics Inc.Point of Care Diagnostics 2 Edgewater Drive Norwood, MA 02062-4637 USA Phone: +1 781-269-3000
White Paper | epoc Blood Analysis System epoc Blood Analysis System | White Paper
2 3
epoc Blood Analysis System: Summary of Analytical Methods and Performance
Table of ContentsPerformance Data . . . . . . . . . . . . . . . . . . . . . . . . . . . . . . . . . . . . . . . . . . . . . . . . . . . . . . . . . . . . . . .4
Glossary. . . . . . . . . . . . . . . . . . . . . . . . . . . . . . . . . . . . . . . . . . . . . . . . . . . . . . . . . . . . . . . . . . . . . . . . . . . . . .4
Methodologies . . . . . . . . . . . . . . . . . . . . . . . . . . . . . . . . . . . . . . . . . . . . . . . . . . . . . . . . . . . . . . . . . . . .4
pH . . . . . . . . . . . . . . . . . . . . . . . . . . . . . . . . . . . . . . . . . . . . . . . . . . . . . . . . . . . . . . . . . . . . . . . . . . . . . . . . . . . . . .6
pCO2 . . . . . . . . . . . . . . . . . . . . . . . . . . . . . . . . . . . . . . . . . . . . . . . . . . . . . . . . . . . . . . . . . . . . . . . . . . . . . . . . . . .8
pO2 . . . . . . . . . . . . . . . . . . . . . . . . . . . . . . . . . . . . . . . . . . . . . . . . . . . . . . . . . . . . . . . . . . . . . . . . . . . . . . . . . . . 10
TCO2 . . . . . . . . . . . . . . . . . . . . . . . . . . . . . . . . . . . . . . . . . . . . . . . . . . . . . . . . . . . . . . . . . . . . . . . . . . . . . . . . . 12
Sodium . . . . . . . . . . . . . . . . . . . . . . . . . . . . . . . . . . . . . . . . . . . . . . . . . . . . . . . . . . . . . . . . . . . . . . . . . . . . . 14
Potassium . . . . . . . . . . . . . . . . . . . . . . . . . . . . . . . . . . . . . . . . . . . . . . . . . . . . . . . . . . . . . . . . . . . . . . . . . 16
Ionized Calcium . . . . . . . . . . . . . . . . . . . . . . . . . . . . . . . . . . . . . . . . . . . . . . . . . . . . . . . . . . . . . . . . . 18
Chloride . . . . . . . . . . . . . . . . . . . . . . . . . . . . . . . . . . . . . . . . . . . . . . . . . . . . . . . . . . . . . . . . . . . . . . . . . . . .20
Hematocrit. . . . . . . . . . . . . . . . . . . . . . . . . . . . . . . . . . . . . . . . . . . . . . . . . . . . . . . . . . . . . . . . . . . . . . . .22
Glucose . . . . . . . . . . . . . . . . . . . . . . . . . . . . . . . . . . . . . . . . . . . . . . . . . . . . . . . . . . . . . . . . . . . . . . . . . . . . . 24
Lactate . . . . . . . . . . . . . . . . . . . . . . . . . . . . . . . . . . . . . . . . . . . . . . . . . . . . . . . . . . . . . . . . . . . . . . . . . . . . .26
BUN . . . . . . . . . . . . . . . . . . . . . . . . . . . . . . . . . . . . . . . . . . . . . . . . . . . . . . . . . . . . . . . . . . . . . . . . . . . . . . . . . . 28
Creatinine . . . . . . . . . . . . . . . . . . . . . . . . . . . . . . . . . . . . . . . . . . . . . . . . . . . . . . . . . . . . . . . . . . . . . . . . .30
White Paper | epoc Blood Analysis System epoc Blood Analysis System | White Paper
4 5
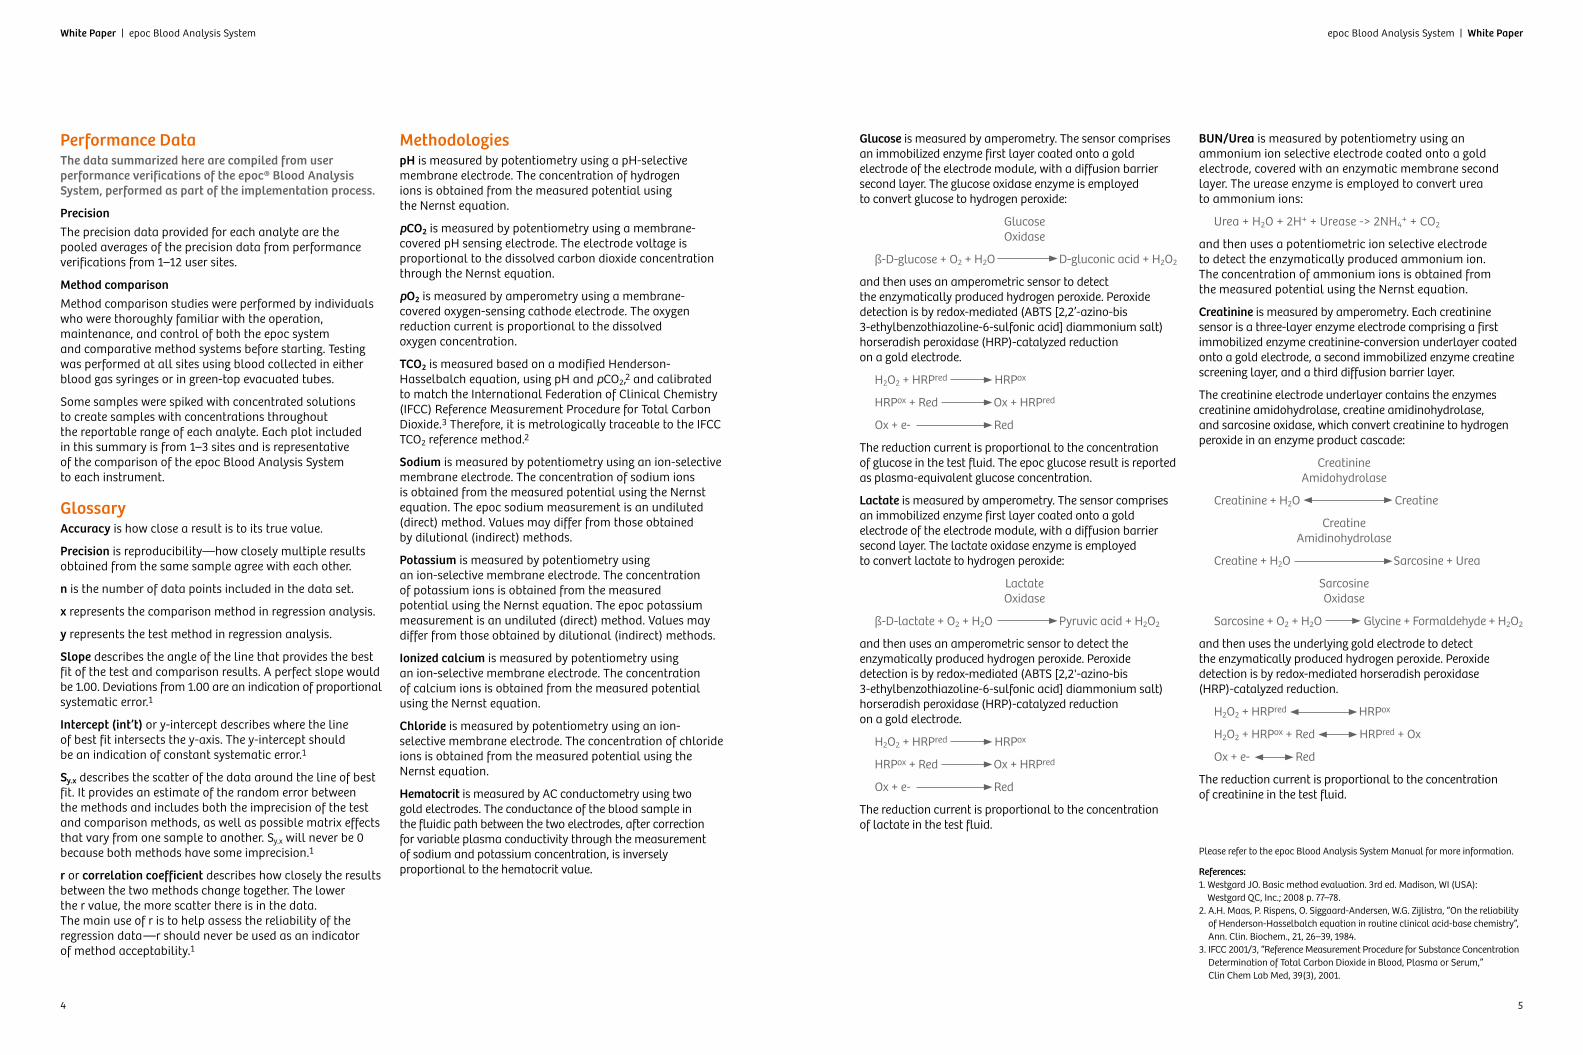
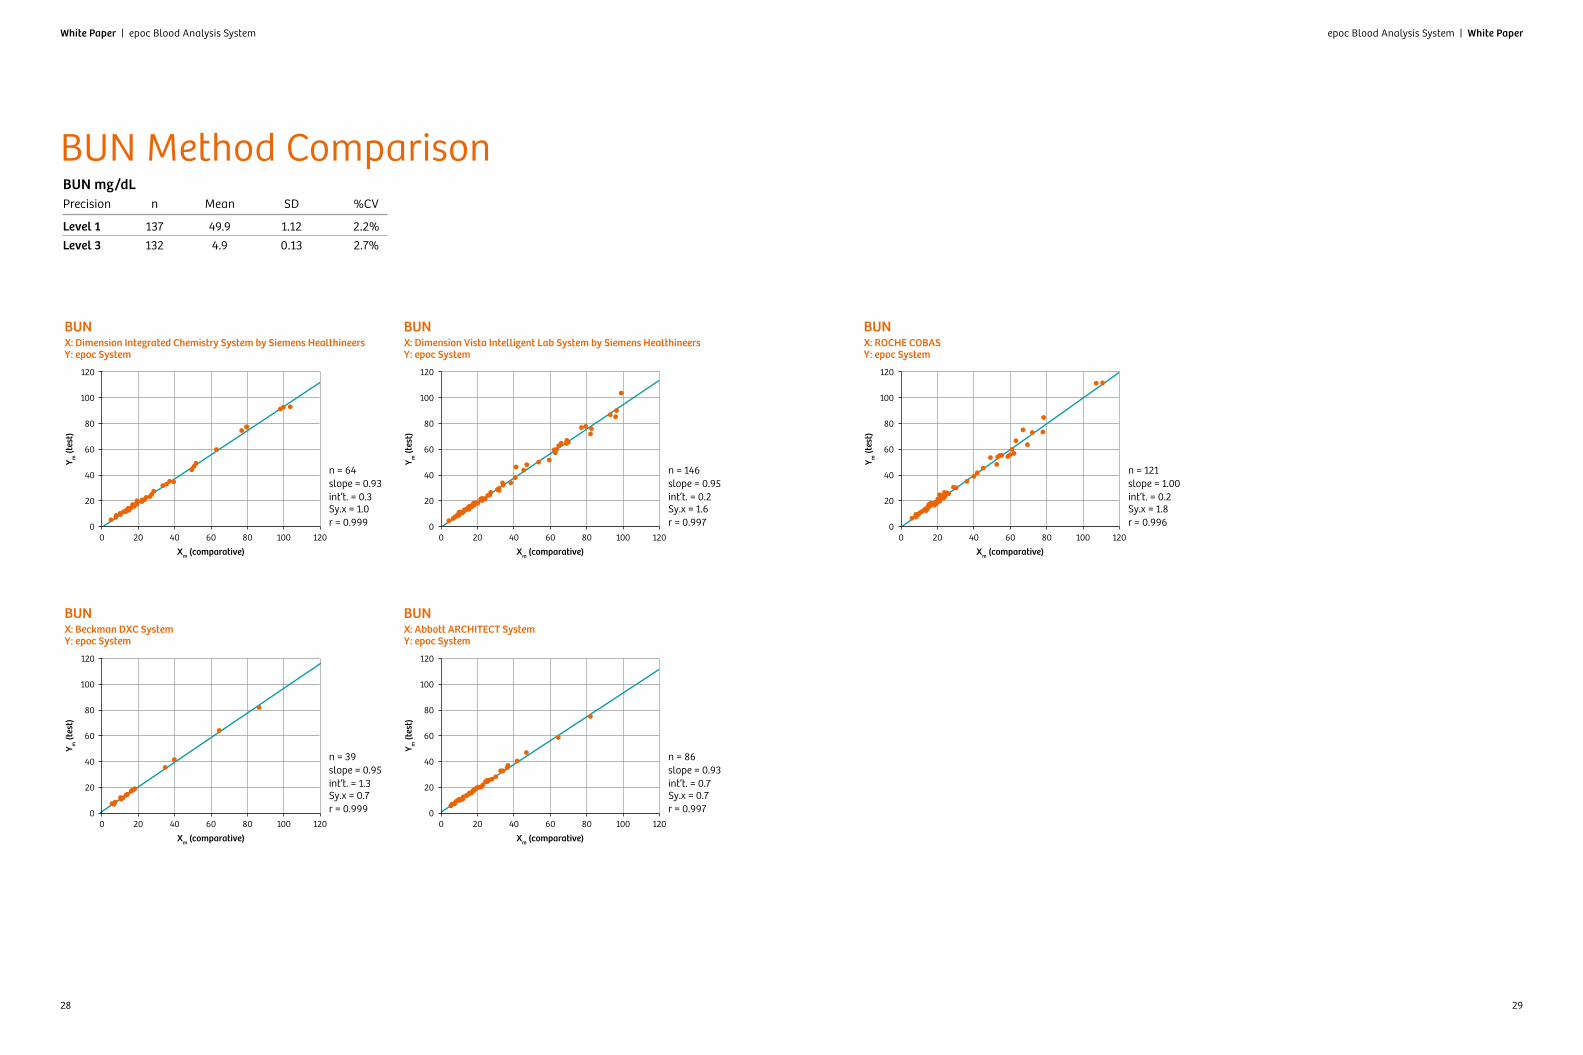
BUN/Urea is measured by potentiometry using an ammonium ion selective electrode coated onto a gold electrode, covered with an enzymatic membrane second layer. The urease enzyme is employed to convert urea to ammonium ions:
Urea + H2O + 2H+ + Urease -> 2NH4+ + CO2
and then uses a potentiometric ion selective electrode to detect the enzymatically produced ammonium ion. The concentration of ammonium ions is obtained from the measured potential using the Nernst equation.
Creatinine is measured by amperometry. Each creatinine sensor is a three-layer enzyme electrode comprising a first immobilized enzyme creatinine-conversion underlayer coated onto a gold electrode, a second immobilized enzyme creatine screening layer, and a third diffusion barrier layer.
The creatinine electrode underlayer contains the enzymes creatinine amidohydrolase, creatine amidinohydrolase, and sarcosine oxidase, which convert creatinine to hydrogen peroxide in an enzyme product cascade:
Creatinine Amidohydrolase
Creatinine + H2O Creatine
Creatine Amidinohydrolase
Creatine + H2O Sarcosine + Urea
Sarcosine Oxidase
Sarcosine + O2 + H2O Glycine + Formaldehyde + H2O2
and then uses the underlying gold electrode to detect the enzymatically produced hydrogen peroxide. Peroxide detection is by redox-mediated horseradish peroxidase (HRP)-catalyzed reduction.
H2O2 + HRPred HRPox
H2O2 + HRPox + Red HRPred + Ox
Ox + e- Red
The reduction current is proportional to the concentration of creatinine in the test fluid.
Performance DataThe data summarized here are compiled from user performance verifications of the epoc® Blood Analysis System, performed as part of the implementation process.
PrecisionThe precision data provided for each analyte are the pooled averages of the precision data from performance verifications from 1–12 user sites.
Method comparisonMethod comparison studies were performed by individuals who were thoroughly familiar with the operation, maintenance, and control of both the epoc system and comparative method systems before starting. Testing was performed at all sites using blood collected in either blood gas syringes or in green-top evacuated tubes.
Some samples were spiked with concentrated solutions to create samples with concentrations throughout the reportable range of each analyte. Each plot included in this summary is from 1–3 sites and is representative of the comparison of the epoc Blood Analysis System to each instrument.
GlossaryAccuracy is how close a result is to its true value.
Precision is reproducibility—how closely multiple results obtained from the same sample agree with each other.
n is the number of data points included in the data set.
x represents the comparison method in regression analysis.
y represents the test method in regression analysis.
Slope describes the angle of the line that provides the best fit of the test and comparison results. A perfect slope would be 1.00. Deviations from 1.00 are an indication of proportional systematic error.1
Intercept (int’t) or y-intercept describes where the line of best fit intersects the y-axis. The y-intercept should be an indication of constant systematic error.1
Sy.x describes the scatter of the data around the line of best fit. It provides an estimate of the random error between the methods and includes both the imprecision of the test and comparison methods, as well as possible matrix effects that vary from one sample to another. Sy.x will never be 0 because both methods have some imprecision.1
r or correlation coefficient describes how closely the results between the two methods change together. The lower the r value, the more scatter there is in the data. The main use of r is to help assess the reliability of the regression data—r should never be used as an indicator of method acceptability.1
MethodologiespH is measured by potentiometry using a pH-selective membrane electrode. The concentration of hydrogen ions is obtained from the measured potential using the Nernst equation.
pCO2 is measured by potentiometry using a membrane-covered pH sensing electrode. The electrode voltage is proportional to the dissolved carbon dioxide concentration through the Nernst equation.
pO2 is measured by amperometry using a membrane-covered oxygen-sensing cathode electrode. The oxygen reduction current is proportional to the dissolved oxygen concentration.
TCO2 is measured based on a modified Henderson-Hasselbalch equation, using pH and pCO2,2 and calibrated to match the International Federation of Clinical Chemistry (IFCC) Reference Measurement Procedure for Total Carbon Dioxide.3 Therefore, it is metrologically traceable to the IFCC TCO2 reference method.2
Sodium is measured by potentiometry using an ion-selective membrane electrode. The concentration of sodium ions is obtained from the measured potential using the Nernst equation. The epoc sodium measurement is an undiluted (direct) method. Values may differ from those obtained by dilutional (indirect) methods.
Potassium is measured by potentiometry using an ion-selective membrane electrode. The concentration of potassium ions is obtained from the measured potential using the Nernst equation. The epoc potassium measurement is an undiluted (direct) method. Values may differ from those obtained by dilutional (indirect) methods.
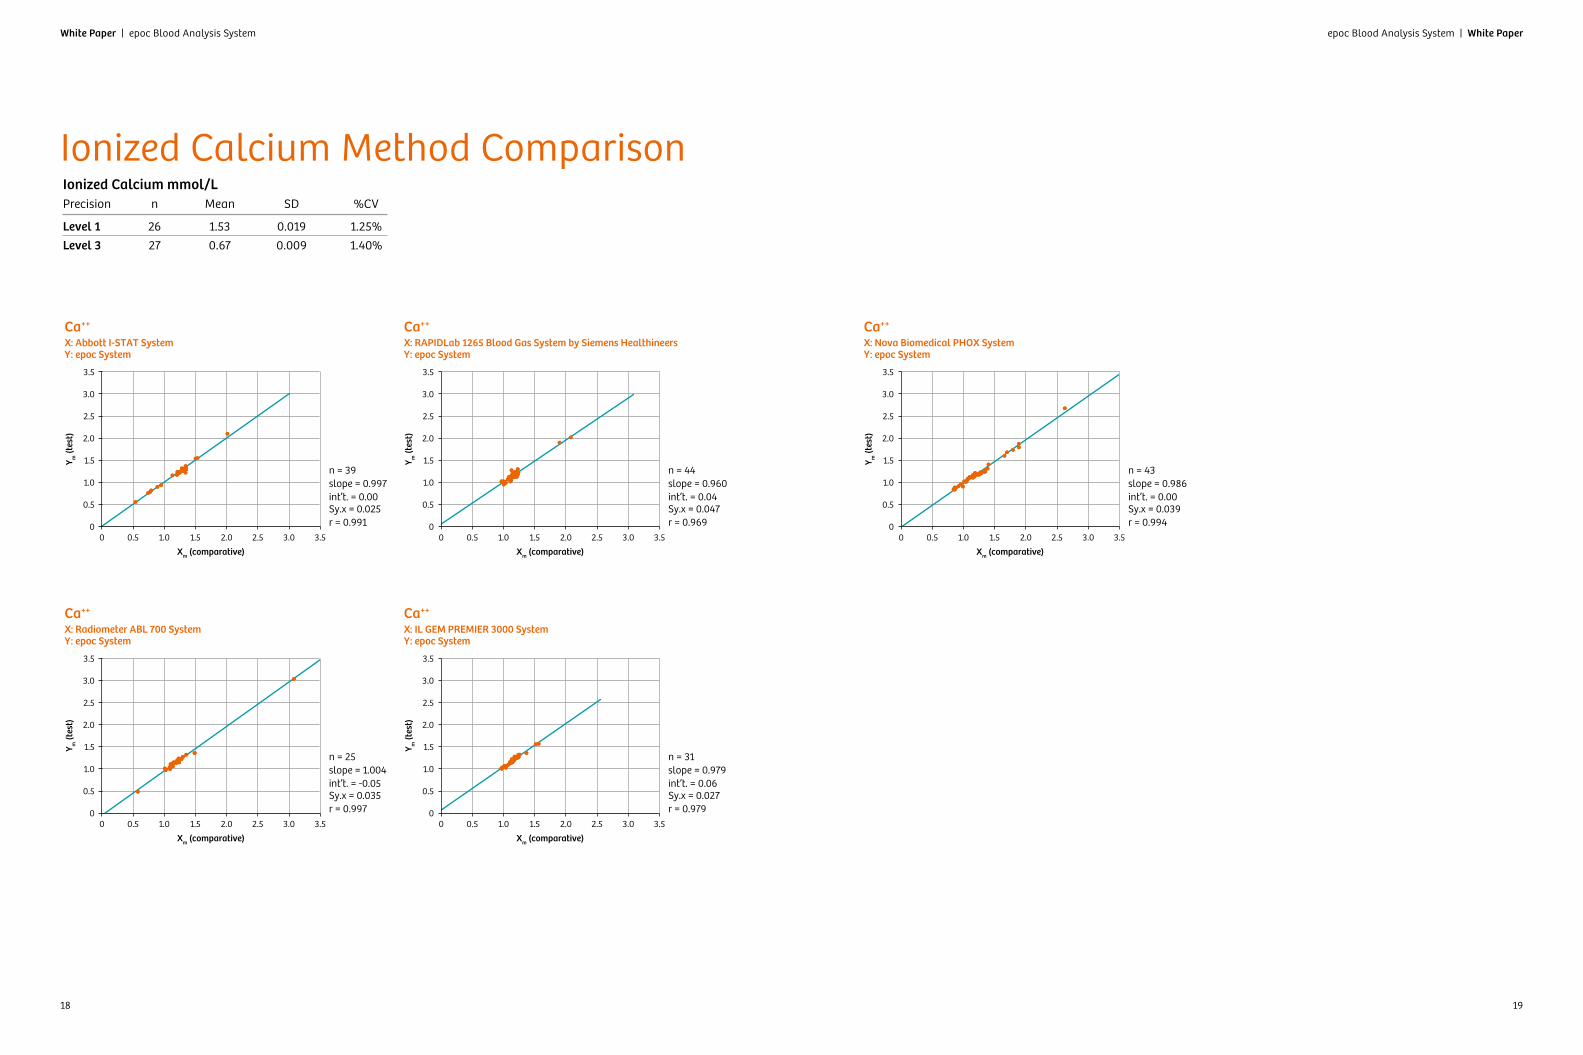
Ionized calcium is measured by potentiometry using an ion-selective membrane electrode. The concentration of calcium ions is obtained from the measured potential using the Nernst equation.
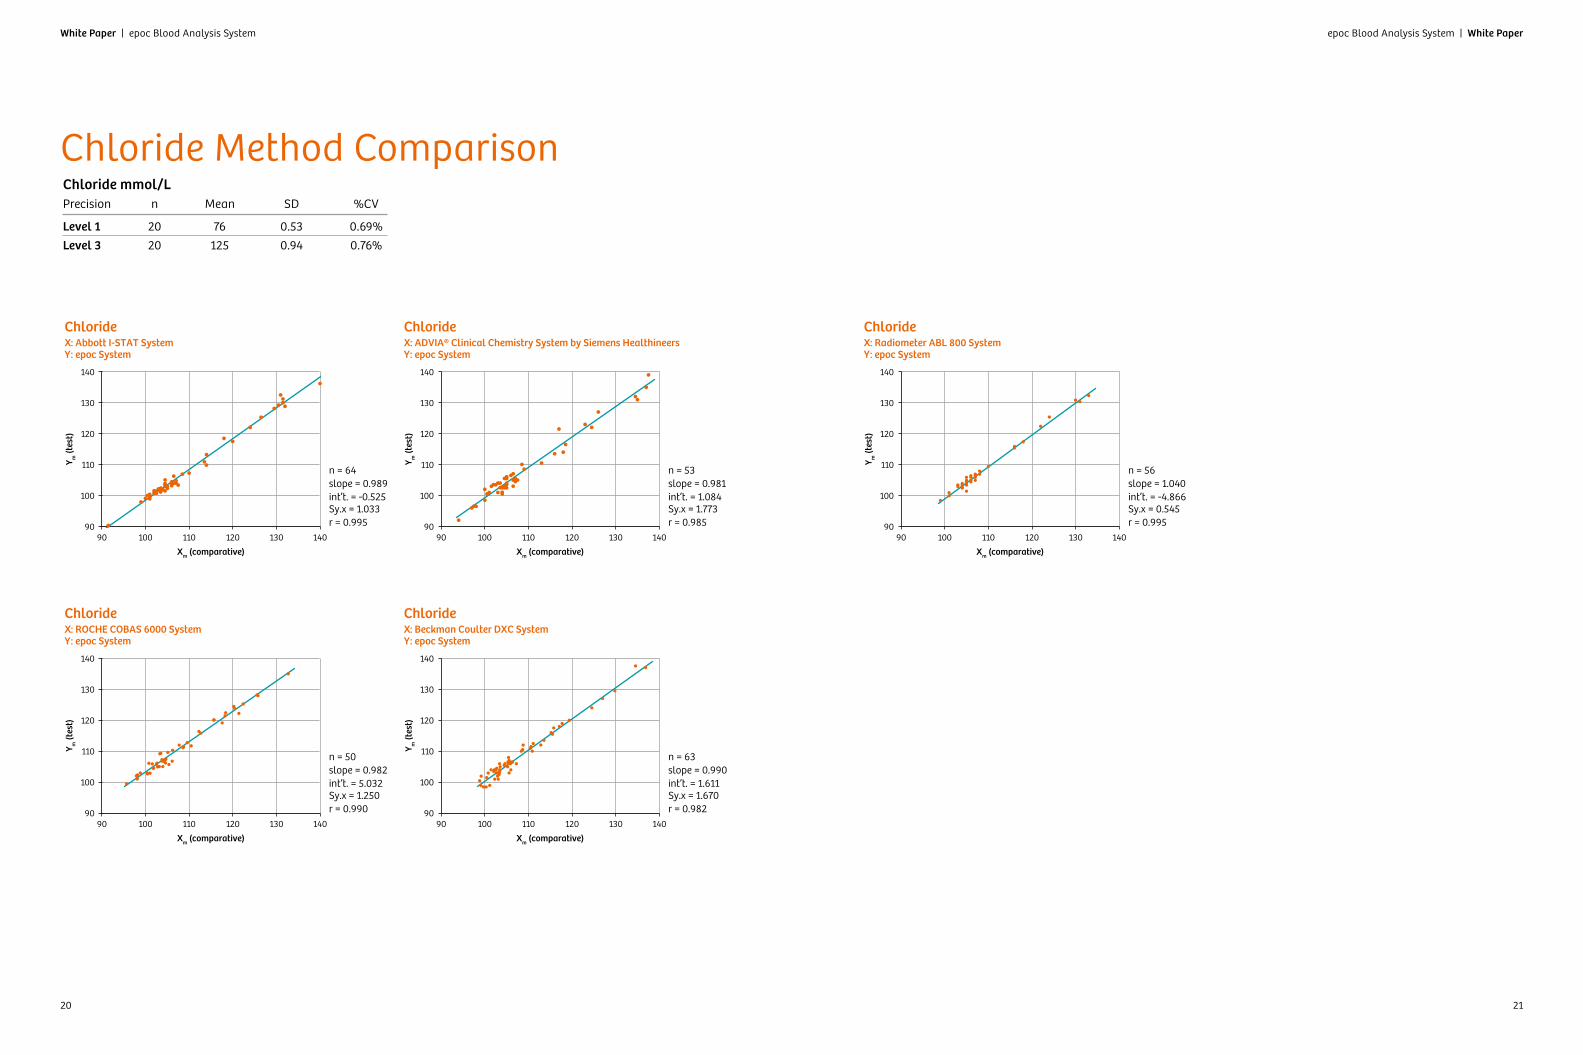
Chloride is measured by potentiometry using an ion-selective membrane electrode. The concentration of chloride ions is obtained from the measured potential using the Nernst equation.
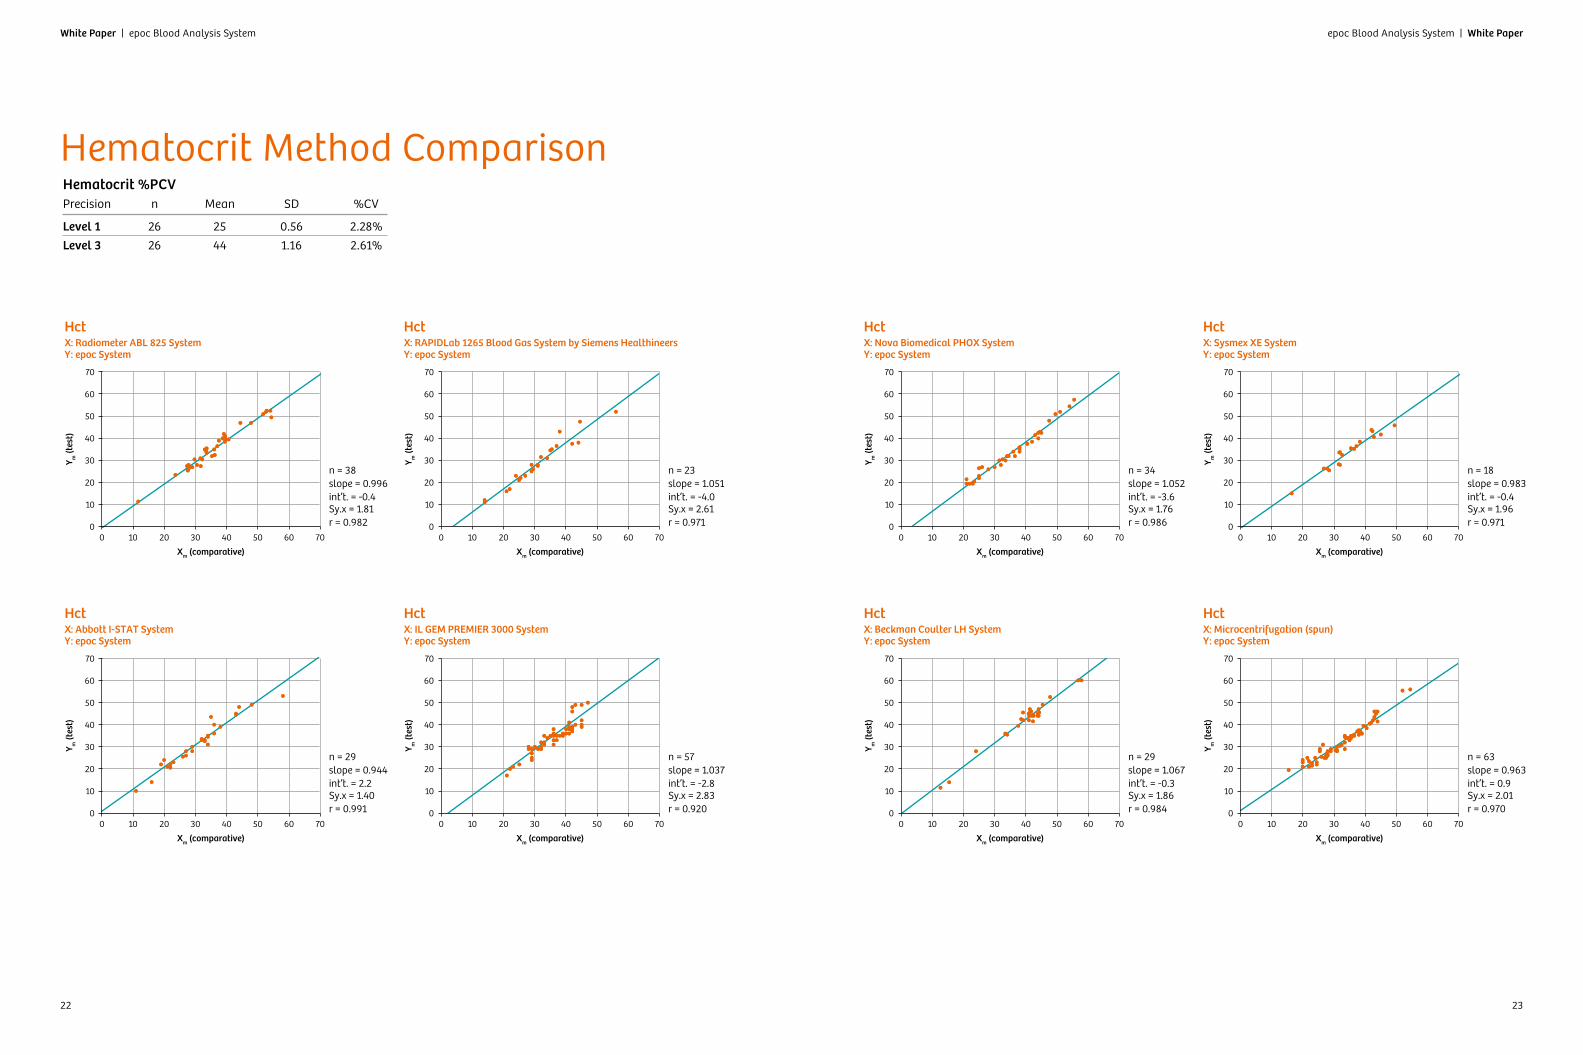
Hematocrit is measured by AC conductometry using two gold electrodes. The conductance of the blood sample in the fluidic path between the two electrodes, after correction for variable plasma conductivity through the measurement of sodium and potassium concentration, is inversely proportional to the hematocrit value.
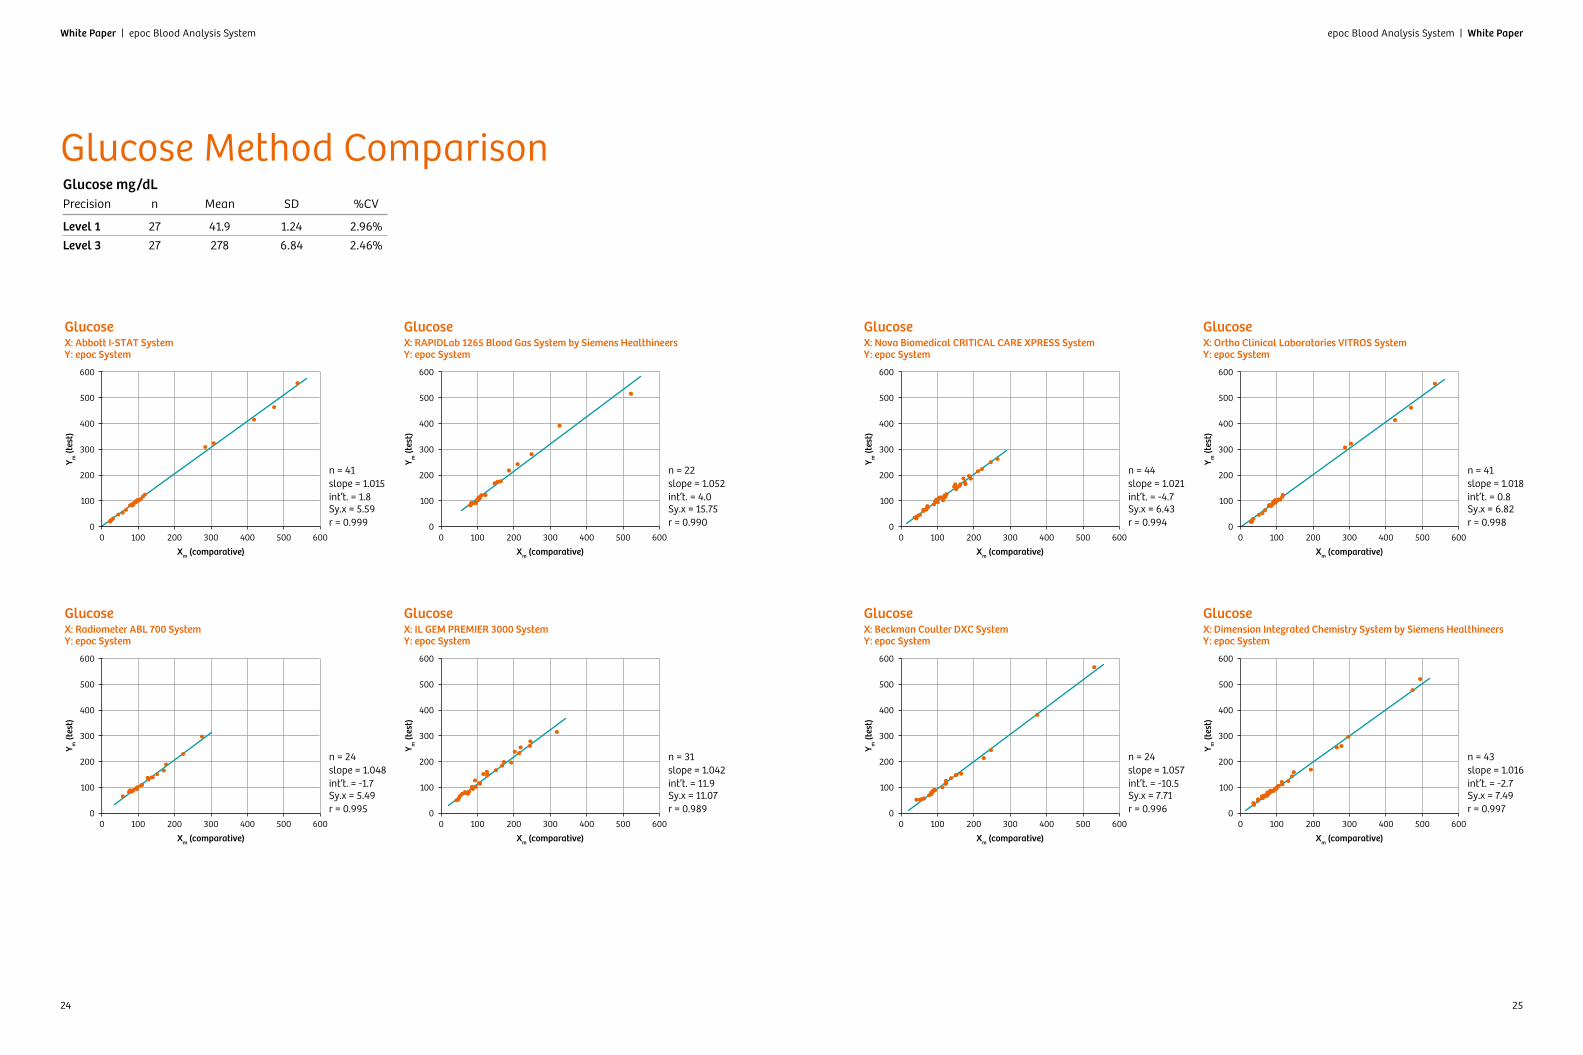
Glucose is measured by amperometry. The sensor comprises an immobilized enzyme first layer coated onto a gold electrode of the electrode module, with a diffusion barrier second layer. The glucose oxidase enzyme is employed to convert glucose to hydrogen peroxide:
Glucose Oxidase
ß-D-glucose + O2 + H2O D-gluconic acid + H2O2
and then uses an amperometric sensor to detect the enzymatically produced hydrogen peroxide. Peroxide detection is by redox-mediated (ABTS [2,2’-azino-bis 3-ethylbenzothiazoline-6-sulfonic acid] diammonium salt) horseradish peroxidase (HRP)-catalyzed reduction on a gold electrode.
H2O2 + HRPred HRPox
HRPox + Red Ox + HRPred
Ox + e- Red
The reduction current is proportional to the concentration of glucose in the test fluid. The epoc glucose result is reported as plasma-equivalent glucose concentration.
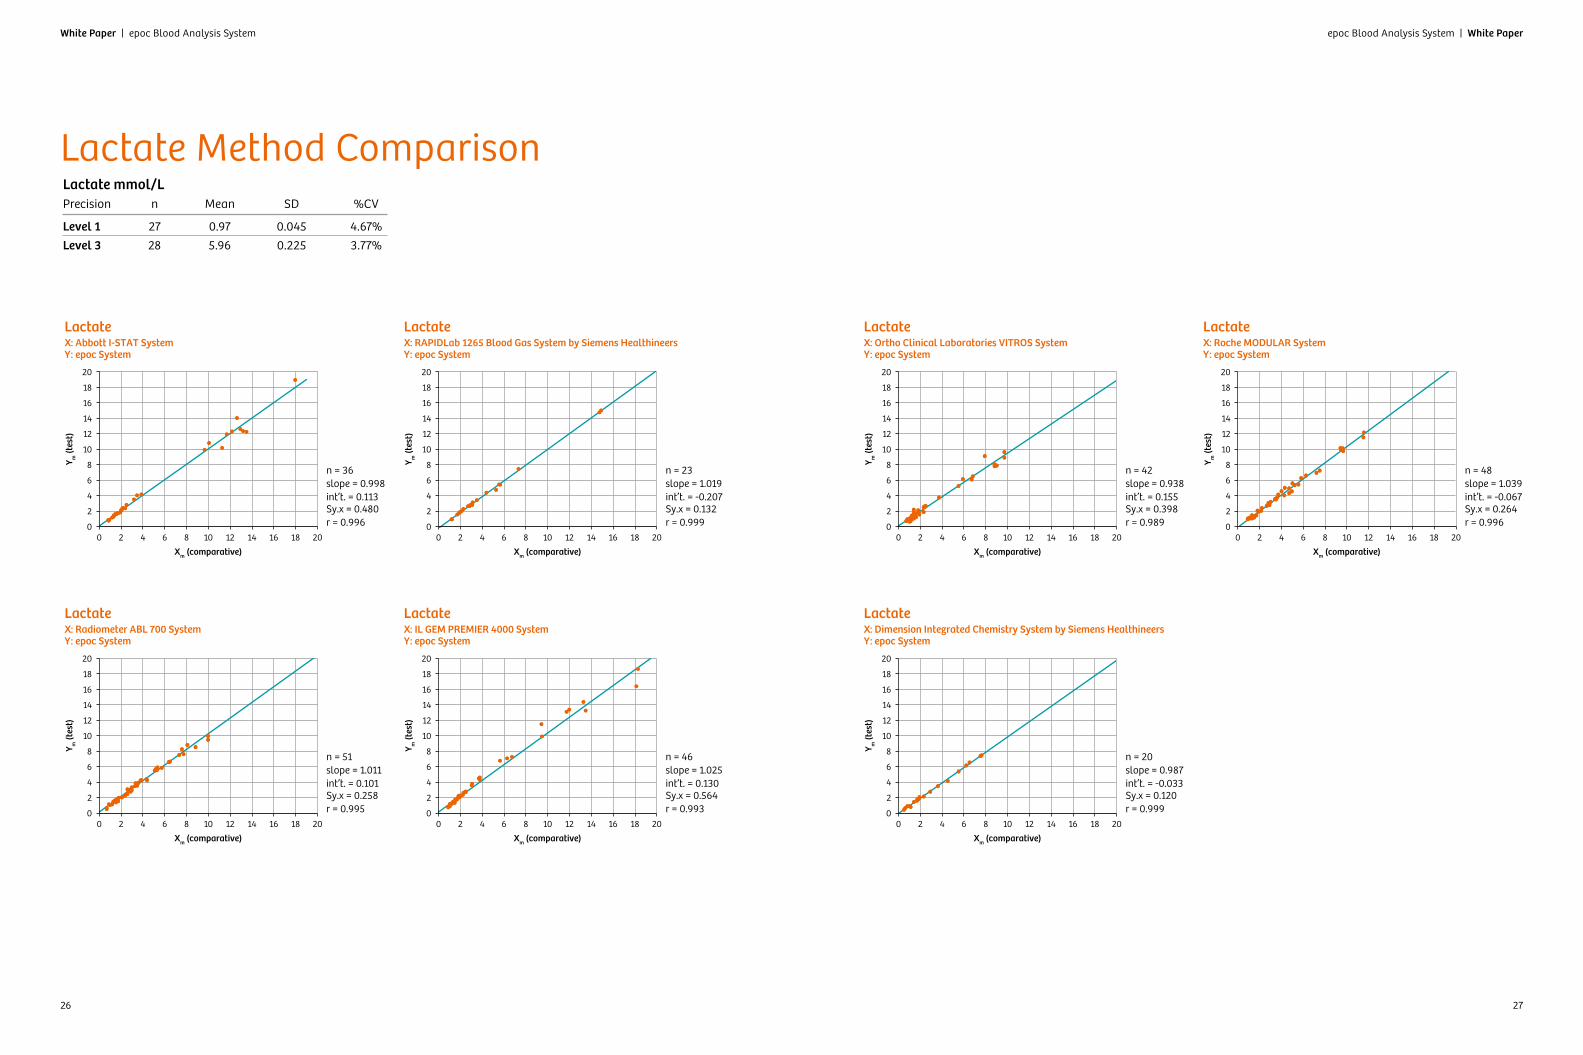
Lactate is measured by amperometry. The sensor comprises an immobilized enzyme first layer coated onto a gold electrode of the electrode module, with a diffusion barrier second layer. The lactate oxidase enzyme is employed to convert lactate to hydrogen peroxide:
Lactate Oxidase
ß-D-lactate + O2 + H2O Pyruvic acid + H2O2
and then uses an amperometric sensor to detect the enzymatically produced hydrogen peroxide. Peroxide detection is by redox-mediated (ABTS [2,2'-azino-bis 3-ethylbenzothiazoline-6-sulfonic acid] diammonium salt) horseradish peroxidase (HRP)-catalyzed reduction on a gold electrode.
H2O2 + HRPred HRPox
HRPox + Red Ox + HRPred
Ox + e- Red
The reduction current is proportional to the concentration of lactate in the test fluid.
Please refer to the epoc Blood Analysis System Manual for more information.
References:1. Westgard JO. Basic method evaluation. 3rd ed. Madison, WI (USA):
Westgard QC, Inc.; 2008 p. 77–78.2. A.H. Maas, P. Rispens, O. Siggaard-Andersen, W.G. Zijlistra, “On the reliability
of Henderson-Hasselbalch equation in routine clinical acid-base chemistry”, Ann. Clin. Biochem., 21, 26–39, 1984.
3. IFCC 2001/3, “Reference Measurement Procedure for Substance Concentration Determination of Total Carbon Dioxide in Blood, Plasma or Serum,” Clin Chem Lab Med, 39(3), 2001.
White Paper | epoc Blood Analysis System epoc Blood Analysis System | White Paper
6 7
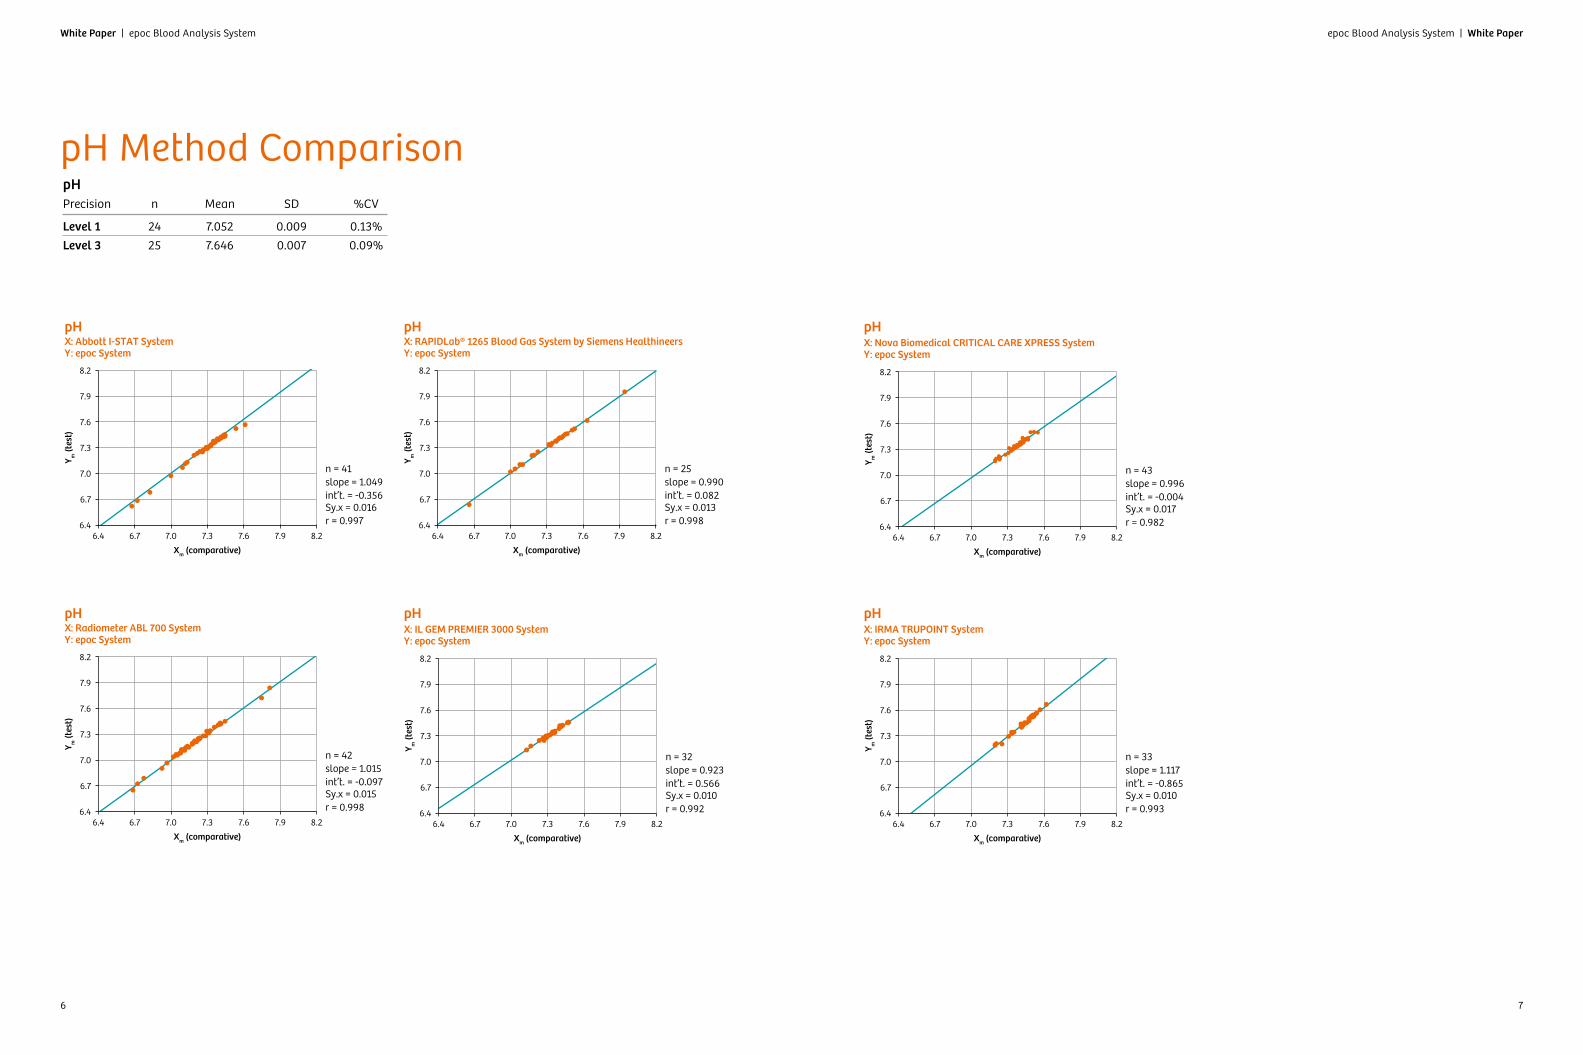
pH Method ComparisonpHPrecision n Mean SD %CV
Level 1 24 7.052 0.009 0.13%
Level 3 25 7.646 0.007 0.09%
r = 0.997
n = 41 slope = 1.049 int’t. = -0.356 Sy.x = 0.016
6.4
6.7
7.0
7.3
7.6
7.9
8.2
6.4 6.7 7.0 7.3 7.6 7.9 8.2
Y m (t
est)
Xm (comparative)
pH X: Abbott I-STAT SystemY: epoc System
r = 0.998
n = 42 slope = 1.015 int’t. = -0.097 Sy.x = 0.015
6.4
6.7
7.0
7.3
7.6
7.9
8.2
6.4 6.7 7.0 7.3 7.6 7.9 8.2
Y m (t
est)
Xm (comparative)
pH X: Radiometer ABL 700 SystemY: epoc System
r = 0.998
pH X: RAPIDLab® 1265 Blood Gas System by Siemens Healthineers Y: epoc System
n = 25 slope = 0.990 int’t. = 0.082 Sy.x = 0.013
6.4
6.7
7.0
7.3
7.6
7.9
8.2
6.4 6.7 7.0 7.3 7.6 7.9 8.2
Y m (t
est)
Xm (comparative)
r = 0.992
pH X: IL GEM PREMIER 3000 SystemY: epoc System
n = 32 slope = 0.923 int’t. = 0.566 Sy.x = 0.010
6.4
6.7
7.0
7.3
7.6
7.9
8.2
6.4 6.7 7.0 7.3 7.6 7.9 8.2
Y m (t
est)
Xm (comparative)
r = 0.982
pH X: Nova Biomedical CRITICAL CARE XPRESS SystemY: epoc System
n = 43 slope = 0.996 int’t. = -0.004 Sy.x = 0.017
6.4
6.7
7.0
7.3
7.6
7.9
8.2
6.4 6.7 7.0 7.3 7.6 7.9 8.2
Y m (t
est)
Xm (comparative)
r = 0.993
pH X: IRMA TRUPOINT SystemY: epoc System
n = 33 slope = 1.117 int’t. = -0.865 Sy.x = 0.010
6.4
6.7
7.0
7.3
7.6
7.9
8.2
6.4 6.7 7.0 7.3 7.6 7.9 8.2
Y m (t
est)
Xm (comparative)
White Paper | epoc Blood Analysis System epoc Blood Analysis System | White Paper
8 9
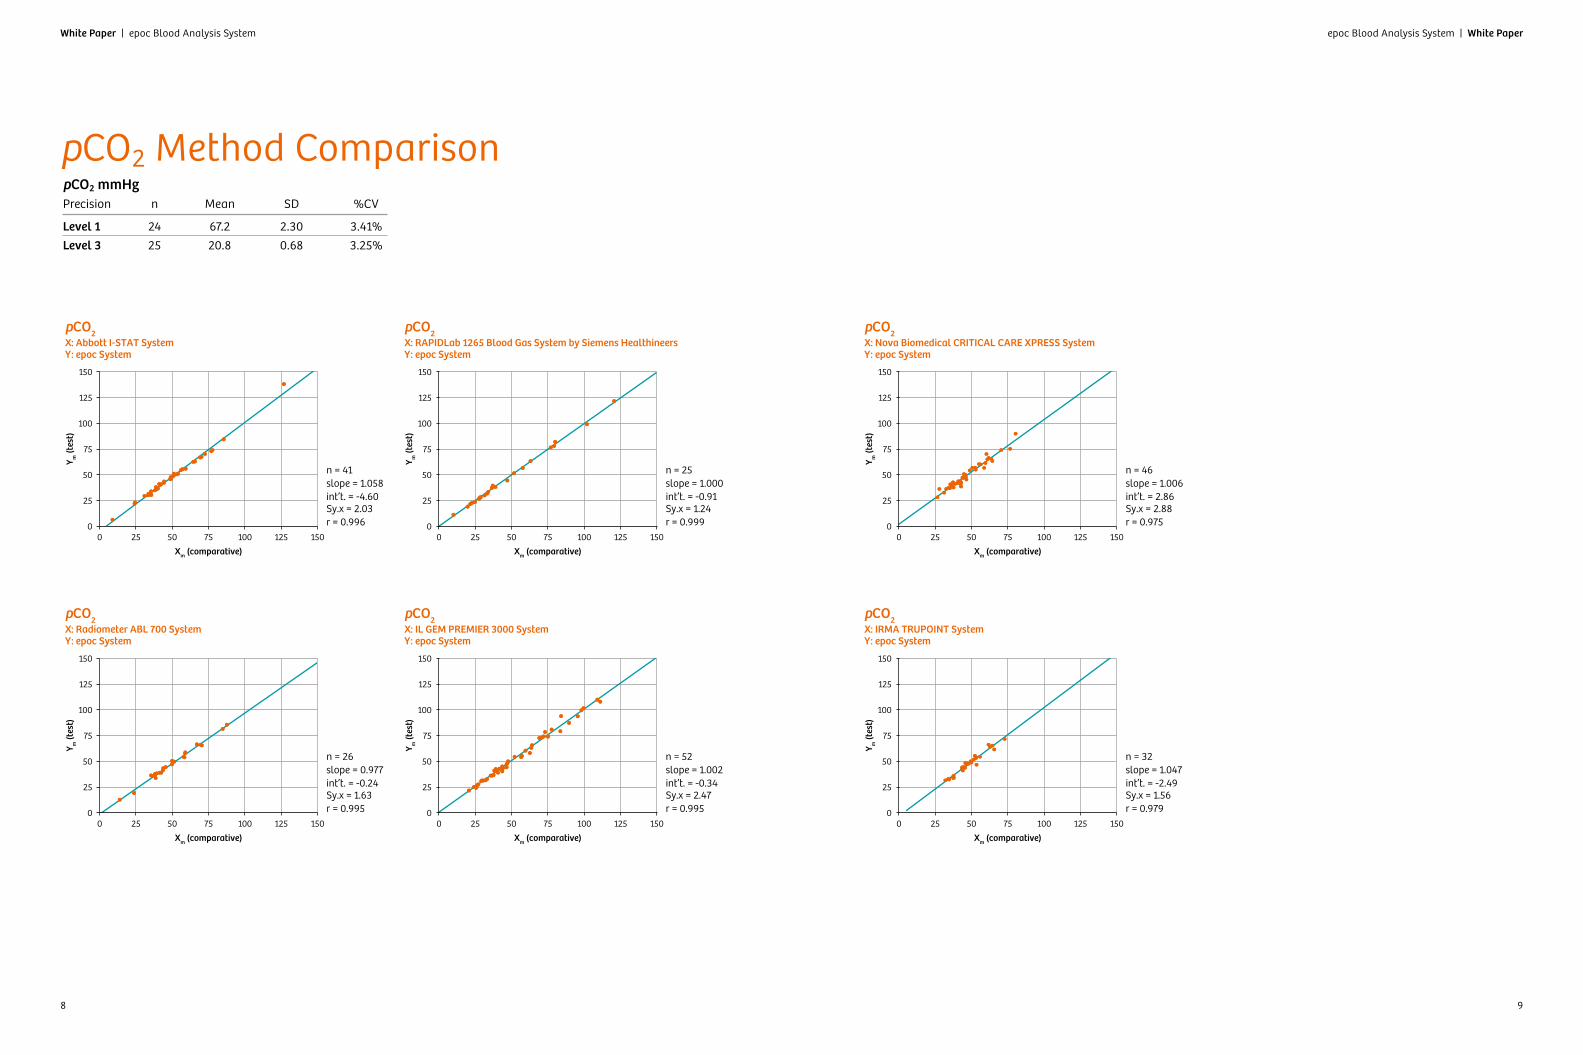
pCO2 Method ComparisonpCO2 mmHgPrecision n Mean SD %CV
Level 1 24 67.2 2.30 3.41%
Level 3 25 20.8 0.68 3.25%
r = 0.996
pCO2 X: Abbott I-STAT SystemY: epoc System
n = 41 slope = 1.058 int’t. = -4.60 Sy.x = 2.03
0
25
50
75
100
125
150
0 25 50 75 100 125 150
Y m (t
est)
Xm (comparative)
r = 0.999
pCO2 X: RAPIDLab 1265 Blood Gas System by Siemens HealthineersY: epoc System
n = 25 slope = 1.000 int’t. = -0.91 Sy.x = 1.24
0
25
50
75
100
125
150
0 25 50 75 100 125 150
Y m (t
est)
Xm (comparative)
r = 0.995
pCO2 X: IL GEM PREMIER 3000 SystemY: epoc System
n = 52 slope = 1.002 int’t. = -0.34 Sy.x = 2.47
0
25
50
75
100
125
150
0 25 50 75 100 125 150
Y m (t
est)
Xm (comparative)
r = 0.975
pCO2 X: Nova Biomedical CRITICAL CARE XPRESS SystemY: epoc System
n = 46 slope = 1.006 int’t. = 2.86 Sy.x = 2.88
0
25
50
75
100
125
150
0 25 50 75 100 125 150
Y m (t
est)
Xm (comparative)
r = 0.979
pCO2 X: IRMA TRUPOINT SystemY: epoc System
n = 32 slope = 1.047 int’t. = -2.49 Sy.x = 1.56
0
25
50
75
100
125
150
0 25 50 75 100 125 150
Y m (t
est)
Xm (comparative)
r = 0.995
pCO2 X: Radiometer ABL 700 SystemY: epoc System
n = 26 slope = 0.977 int’t. = -0.24 Sy.x = 1.63
0
25
50
75
100
125
150
0 25 50 75 100 125 150
Y m (t
est)
Xm (comparative)
White Paper | epoc Blood Analysis System epoc Blood Analysis System | White Paper
10 11
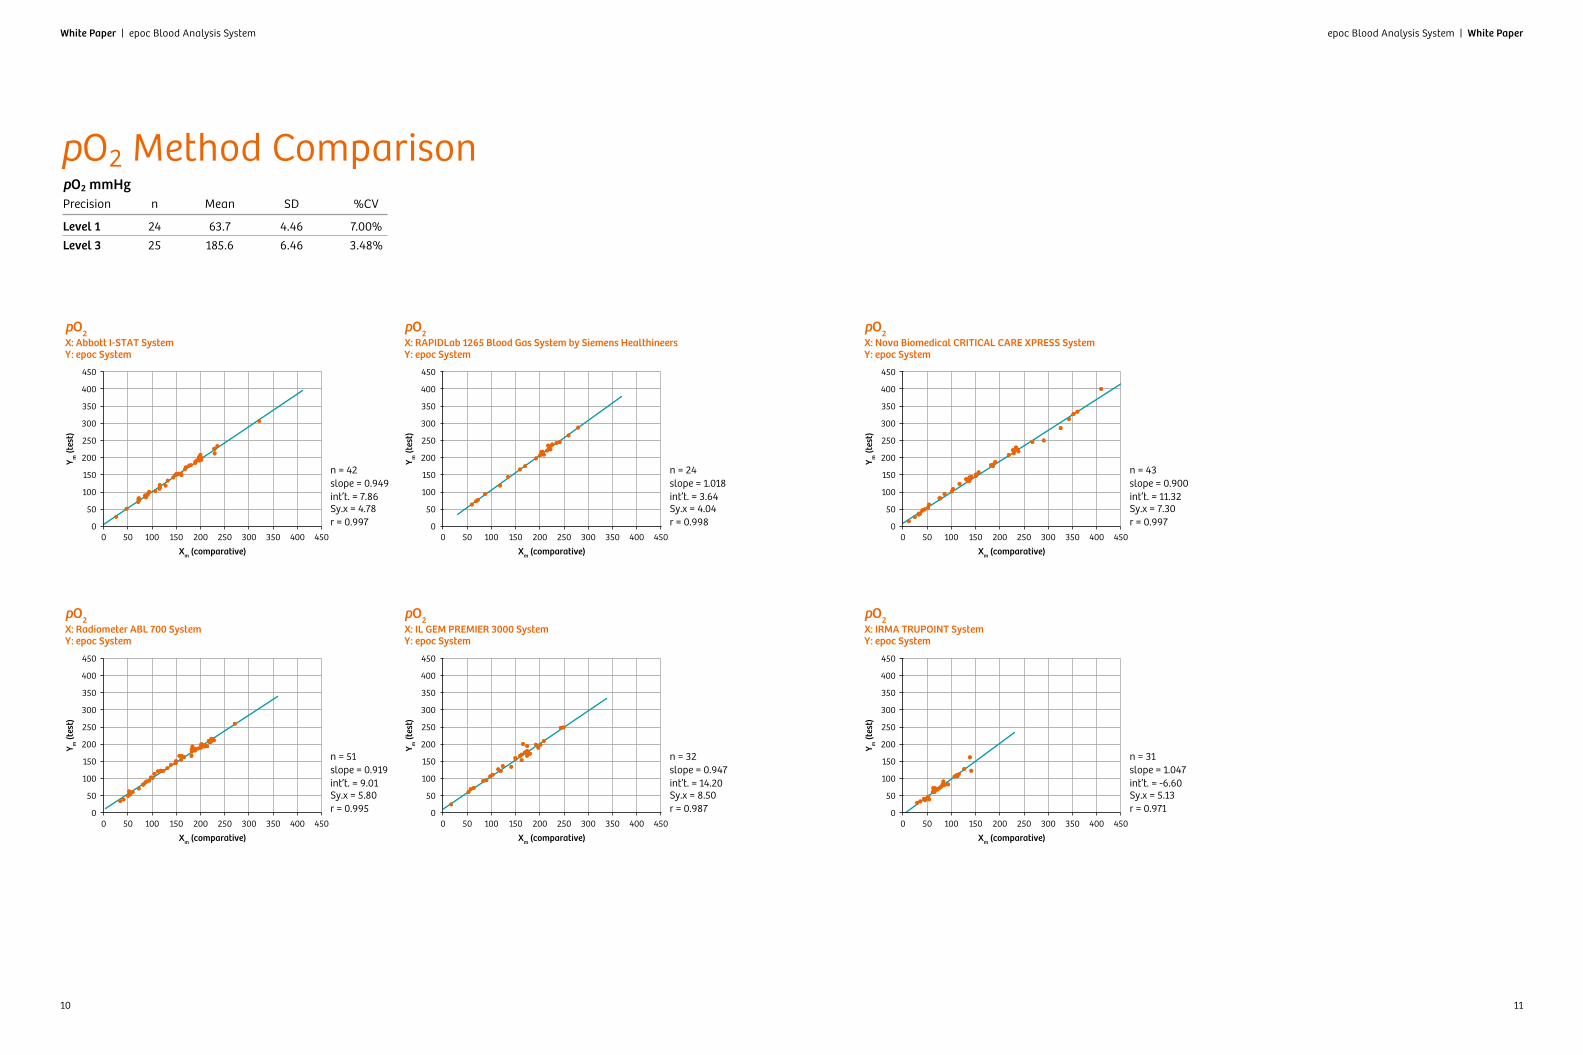
pO2 Method ComparisonpO2 mmHgPrecision n Mean SD %CV
Level 1 24 63.7 4.46 7.00%
Level 3 25 185.6 6.46 3.48%
r = 0.997
pO2 X: Abbott I-STAT SystemY: epoc System
n = 42 slope = 0.949 int’t. = 7.86 Sy.x = 4.78
0
50
150
100
250
200
350
300
400
450
0 100 150 20050 250 300 350 400 450
Y m (t
est)
Xm (comparative)
r = 0.995
pO2 X: Radiometer ABL 700 SystemY: epoc System
n = 51 slope = 0.919 int’t. = 9.01 Sy.x = 5.80
0
50
150
100
250
200
350
300
400
450
0 100 150 20050 250 300 350 400 450
Y m (t
est)
Xm (comparative)
r = 0.998
pO2 X: RAPIDLab 1265 Blood Gas System by Siemens HealthineersY: epoc System
n = 24 slope = 1.018 int’t. = 3.64 Sy.x = 4.04
0
50
150
100
250
200
350
300
400
450
0 100 150 20050 250 300 350 400 450
Y m (t
est)
Xm (comparative)
r = 0.987
pO2 X: IL GEM PREMIER 3000 SystemY: epoc System
n = 32 slope = 0.947 int’t. = 14.20 Sy.x = 8.50
0
50
150
100
250
200
350
300
400
450
0 100 150 20050 250 300 350 400 450
Y m (t
est)
Xm (comparative)
r = 0.997
pO2 X: Nova Biomedical CRITICAL CARE XPRESS SystemY: epoc System
n = 43 slope = 0.900 int’t. = 11.32 Sy.x = 7.30
0
50
150
100
250
200
350
300
400
450
0 100 150 20050 250 300 350 400 450
Y m (t
est)
Xm (comparative)
r = 0.971
pO2 X: IRMA TRUPOINT SystemY: epoc System
n = 31 slope = 1.047 int’t. = -6.60 Sy.x = 5.13
0
50
150
100
250
200
350
300
400
450
0 100 150 20050 250 300 350 400 450
Y m (t
est)
Xm (comparative)
White Paper | epoc Blood Analysis System epoc Blood Analysis System | White Paper
12 13
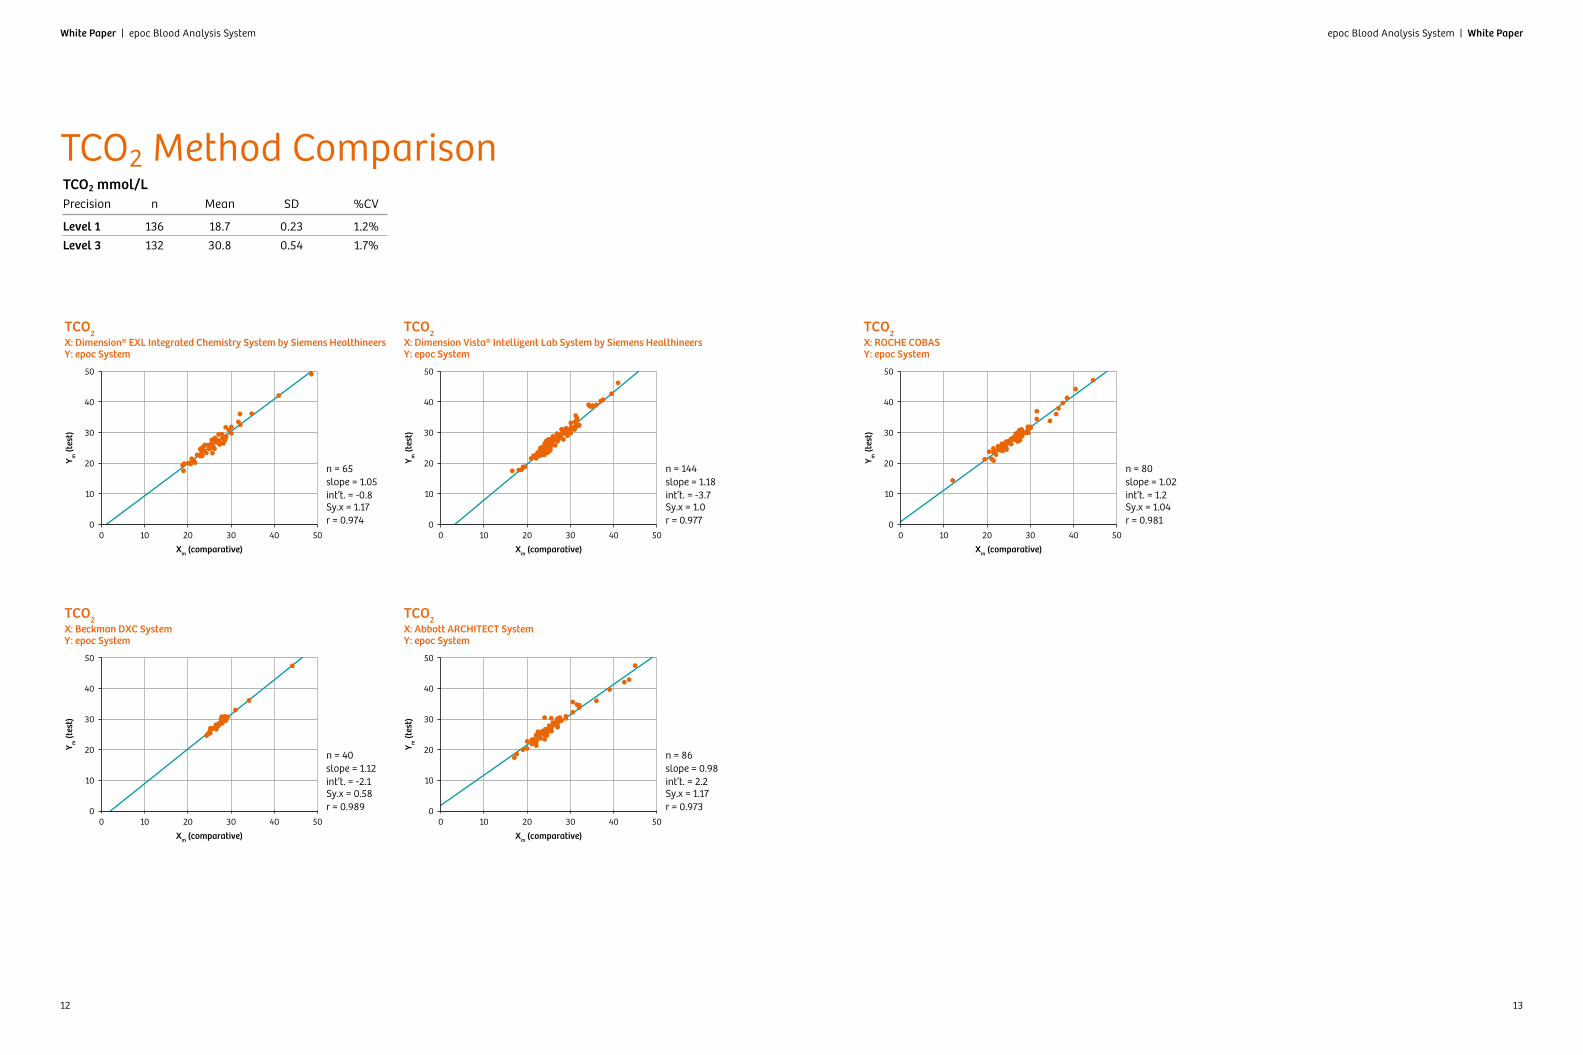
TCO2 Method ComparisonTCO2 mmol/LPrecision n Mean SD %CV
Level 1 136 18.7 0.23 1.2%
Level 3 132 30.8 0.54 1.7%
r = 0.974
TCO2 X: Dimension® EXL Integrated Chemistry System by Siemens HealthineersY: epoc System
n = 65 slope = 1.05 int’t. = -0.8 Sy.x = 1.17
0
10
20
30
40
50
0 10 20 30 40 50
Y m (t
est)
Xm (comparative)
r = 0.989
TCO2 X: Beckman DXC SystemY: epoc System
n = 40 slope = 1.12 int’t. = -2.1 Sy.x = 0.58
0
10
20
30
40
50
0 10 20 30 40 50
Y m (t
est)
Xm (comparative)
r = 0.977
TCO2 X: Dimension Vista® Intelligent Lab System by Siemens HealthineersY: epoc System
n = 144 slope = 1.18 int’t. = -3.7 Sy.x = 1.0
0
10
20
30
40
50
0 10 20 30 40 50
Y m (t
est)
Xm (comparative)
r = 0.973
TCO2 X: Abbott ARCHITECT SystemY: epoc System
n = 86 slope = 0.98 int’t. = 2.2 Sy.x = 1.17
0
10
20
30
40
50
0 10 20 30 40 50
Y m (t
est)
Xm (comparative)
r = 0.981
TCO2 X: ROCHE COBASY: epoc System
n = 80 slope = 1.02 int’t. = 1.2 Sy.x = 1.04
0
10
20
30
40
50
0 10 20 30 40 50
Y m (t
est)
Xm (comparative)
White Paper | epoc Blood Analysis System epoc Blood Analysis System | White Paper
14 15
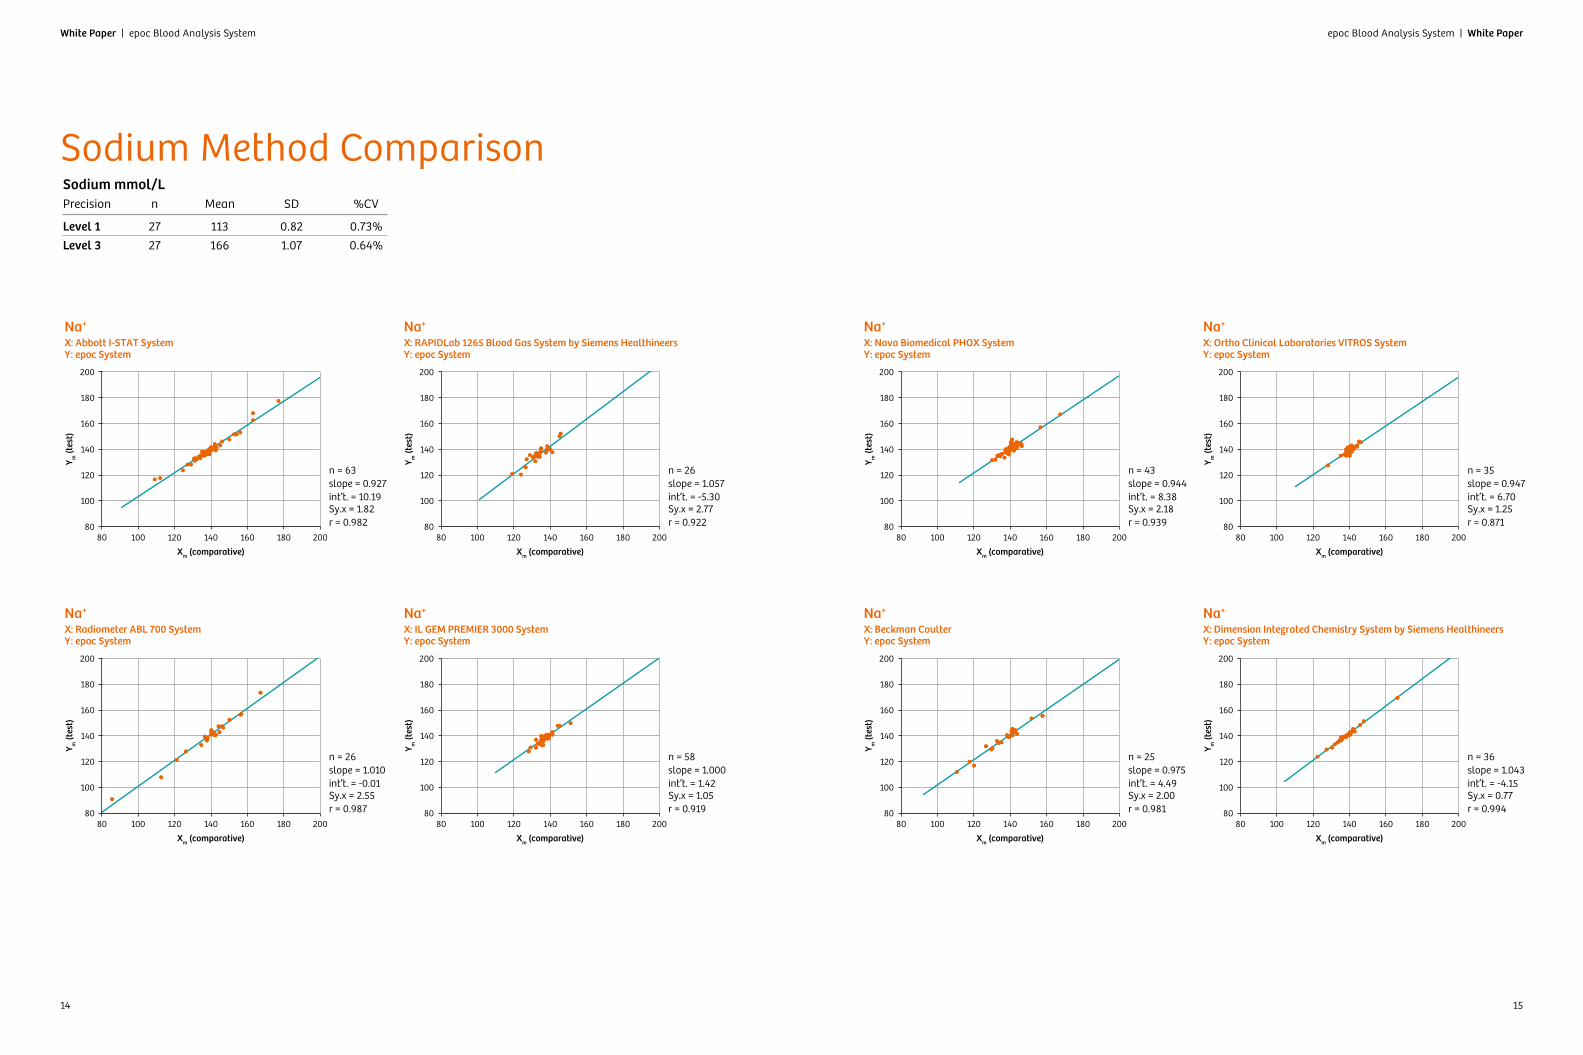
Sodium Method ComparisonSodium mmol/LPrecision n Mean SD %CV
Level 1 27 113 0.82 0.73%
Level 3 27 166 1.07 0.64%
r = 0.982
Na+ X: Abbott I-STAT SystemY: epoc System
n = 63 slope = 0.927 int’t. = 10.19 Sy.x = 1.82
80
100
120
140
160
180
200
80 100 120 140 160 180 200
Y m (t
est)
Xm (comparative)
r = 0.987
Na+ X: Radiometer ABL 700 SystemY: epoc System
n = 26 slope = 1.010 int’t. = -0.01 Sy.x = 2.55
80
100
120
140
160
180
200
80 100 120 140 160 180 200
Y m (t
est)
Xm (comparative)
r = 0.922
Na+ X: RAPIDLab 1265 Blood Gas System by Siemens HealthineersY: epoc System
n = 26 slope = 1.057 int’t. = -5.30 Sy.x = 2.77
80
100
120
140
160
180
200
80 100 120 140 160 180 200
Y m (t
est)
Xm (comparative)
r = 0.919
Na+ X: IL GEM PREMIER 3000 SystemY: epoc System
n = 58 slope = 1.000 int’t. = 1.42 Sy.x = 1.05
80
100
120
140
160
180
200
80 100 120 140 160 180 200
Y m (t
est)
Xm (comparative)
r = 0.939
Na+ X: Nova Biomedical PHOX SystemY: epoc System
n = 43 slope = 0.944 int’t. = 8.38 Sy.x = 2.18
80
100
120
140
160
180
200
80 100 120 140 160 180 200
Y m (t
est)
Xm (comparative)
r = 0.981
Na+ X: Beckman CoulterY: epoc System
n = 25 slope = 0.975 int’t. = 4.49 Sy.x = 2.00
80
100
120
140
160
180
200
80 100 120 140 160 180 200
Y m (t
est)
Xm (comparative)
r = 0.871
Na+ X: Ortho Clinical Laboratories VITROS SystemY: epoc System
n = 35 slope = 0.947 int’t. = 6.70 Sy.x = 1.25
80
100
120
140
160
180
200
80 100 120 140 160 180 200
Y m (t
est)
Xm (comparative)
r = 0.994
Na+ X: Dimension Integrated Chemistry System by Siemens HealthineersY: epoc System
n = 36 slope = 1.043 int’t. = -4.15 Sy.x = 0.77
80
100
120
140
160
180
200
80 100 120 140 160 180 200
Y m (t
est)
Xm (comparative)
White Paper | epoc Blood Analysis System epoc Blood Analysis System | White Paper
16 17
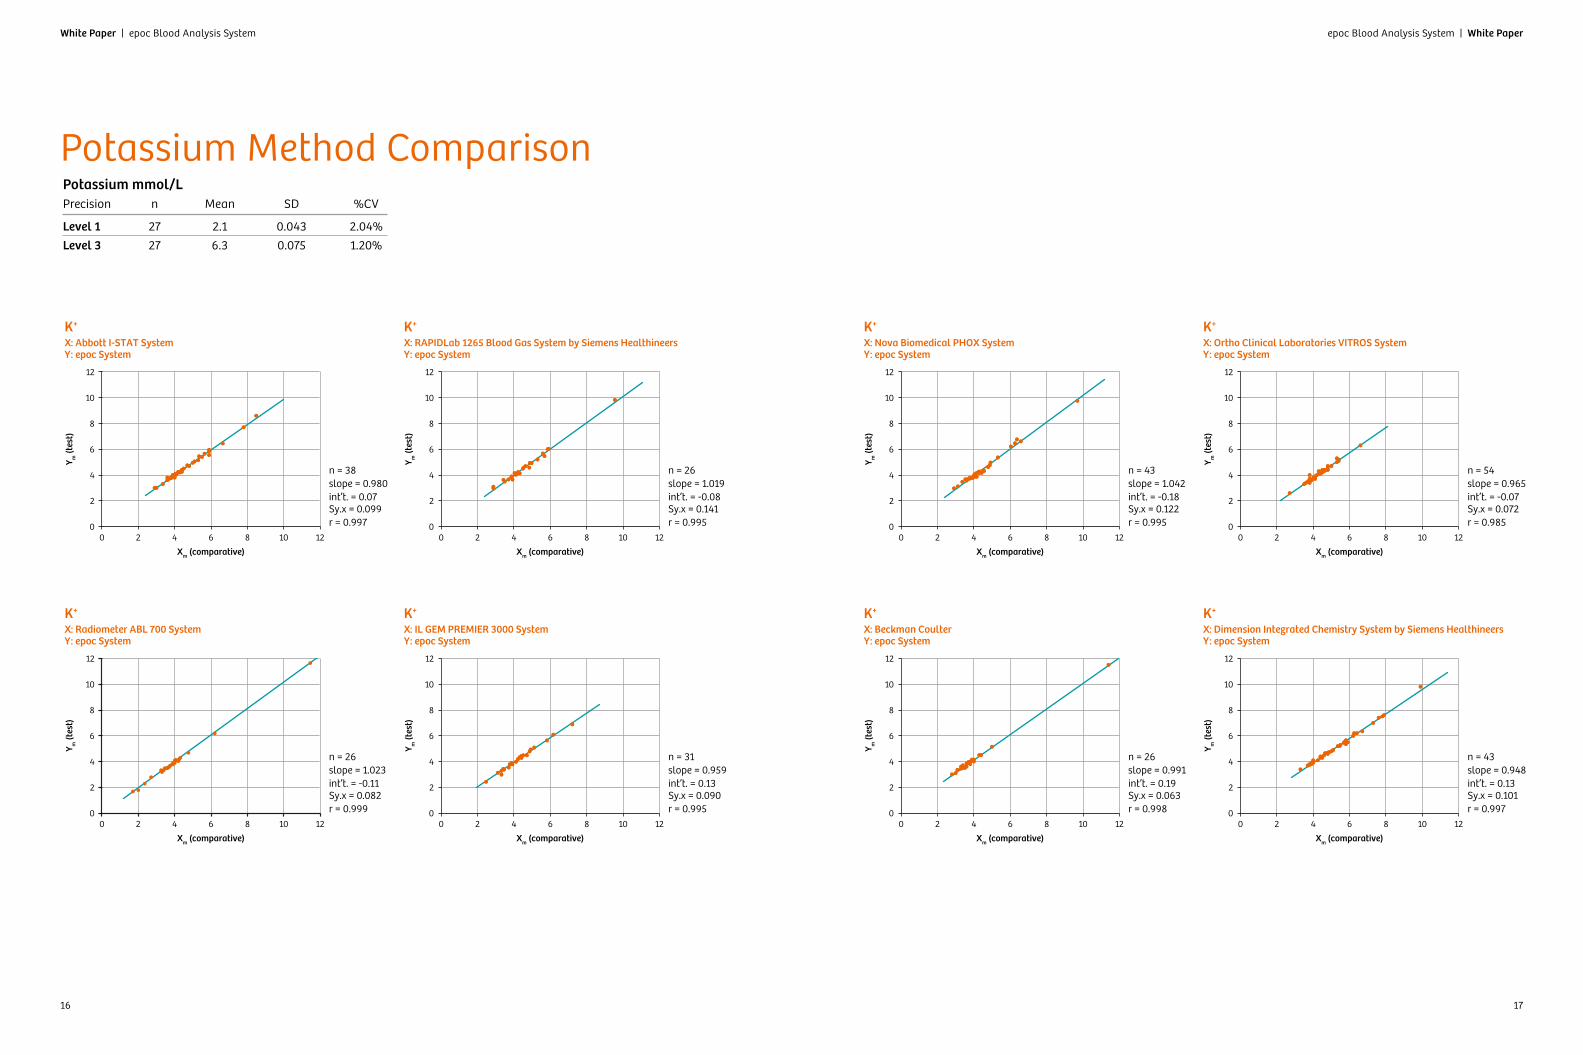
Potassium Method ComparisonPotassium mmol/LPrecision n Mean SD %CV
Level 1 27 2.1 0.043 2.04%
Level 3 27 6.3 0.075 1.20%
r = 0.997
K+ X: Abbott I-STAT SystemY: epoc System
n = 38 slope = 0.980 int’t. = 0.07 Sy.x = 0.099
0
2
4
6
8
10
12
0 2 4 6 8 10 12
Y m (t
est)
Xm (comparative)
r = 0.999
K+ X: Radiometer ABL 700 SystemY: epoc System
n = 26 slope = 1.023 int’t. = -0.11 Sy.x = 0.082
0
2
4
6
8
10
12
0 2 4 6 8 10 12
Y m (t
est)
Xm (comparative)
r = 0.995
K+ X: RAPIDLab 1265 Blood Gas System by Siemens HealthineersY: epoc System
n = 26 slope = 1.019 int’t. = -0.08 Sy.x = 0.141
0
2
4
6
8
10
12
0 2 4 6 8 10 12
Y m (t
est)
Xm (comparative)
r = 0.995
K+ X: IL GEM PREMIER 3000 SystemY: epoc System
n = 31 slope = 0.959 int’t. = 0.13 Sy.x = 0.090
0
2
4
6
8
10
12
0 2 4 6 8 10 12
Y m (t
est)
Xm (comparative)
r = 0.995
K+ X: Nova Biomedical PHOX SystemY: epoc System
n = 43 slope = 1.042 int’t. = -0.18 Sy.x = 0.122
0
2
4
6
8
10
12
0 2 4 6 8 10 12
Y m (t
est)
Xm (comparative)
r = 0.998
K+ X: Beckman CoulterY: epoc System
n = 26 slope = 0.991 int’t. = 0.19 Sy.x = 0.063
0
2
4
6
8
10
12
0 2 4 6 8 10 12
Y m (t
est)
Xm (comparative)
r = 0.985
K+ X: Ortho Clinical Laboratories VITROS SystemY: epoc System
n = 54 slope = 0.965 int’t. = -0.07 Sy.x = 0.072
0
2
4
6
8
10
12
0 2 4 6 8 10 12
Y m (t
est)
Xm (comparative)
r = 0.997
K+ X: Dimension Integrated Chemistry System by Siemens HealthineersY: epoc System
n = 43 slope = 0.948 int’t. = 0.13 Sy.x = 0.101
0
2
4
6
8
10
12
0 2 4 6 8 10 12
Y m (t
est)
Xm (comparative)
White Paper | epoc Blood Analysis System epoc Blood Analysis System | White Paper
18 19
Ionized Calcium Method ComparisonIonized Calcium mmol/LPrecision n Mean SD %CV
Level 1 26 1.53 0.019 1.25%
Level 3 27 0.67 0.009 1.40%
r = 0.991
Ca++ X: Abbott I-STAT SystemY: epoc System
n = 39 slope = 0.997 int’t. = 0.00 Sy.x = 0.025
0
0.5
1.0
1.5
2.0
3.0
2.5
3.5
0 0.5 1.0 1.5 2.0 2.5 3.0 3.5
Y m (t
est)
Xm (comparative)
r = 0.997
Ca++ X: Radiometer ABL 700 SystemY: epoc System
n = 25 slope = 1.004 int’t. = -0.05 Sy.x = 0.035
0
0.5
1.0
1.5
2.0
3.0
2.5
3.5
0 0.5 1.0 1.5 2.0 2.5 3.0 3.5
Y m (t
est)
Xm (comparative)
r = 0.969
Ca++ X: RAPIDLab 1265 Blood Gas System by Siemens Healthineers Y: epoc System
n = 44 slope = 0.960 int’t. = 0.04 Sy.x = 0.047
0
0.5
1.0
1.5
2.0
3.0
2.5
3.5
0 0.5 1.0 1.5 2.0 2.5 3.0 3.5
Y m (t
est)
Xm (comparative)
r = 0.979
Ca++ X: IL GEM PREMIER 3000 SystemY: epoc System
n = 31 slope = 0.979 int’t. = 0.06 Sy.x = 0.027
0
0.5
1.0
1.5
2.0
3.0
2.5
3.5
0 0.5 1.0 1.5 2.0 2.5 3.0 3.5
Y m (t
est)
Xm (comparative)
r = 0.994
Ca++ X: Nova Biomedical PHOX SystemY: epoc System
n = 43 slope = 0.986 int’t. = 0.00 Sy.x = 0.039
0
0.5
1.0
1.5
2.0
3.0
2.5
3.5
0 0.5 1.0 1.5 2.0 2.5 3.0 3.5
Y m (t
est)
Xm (comparative)
White Paper | epoc Blood Analysis System epoc Blood Analysis System | White Paper
20 21
Chloride Method ComparisonChloride mmol/LPrecision n Mean SD %CV
Level 1 20 76 0.53 0.69%
Level 3 20 125 0.94 0.76%
r = 0.995
Chloride X: Abbott I-STAT SystemY: epoc System
n = 64 slope = 0.989 int’t. = -0.525 Sy.x = 1.033
90
100
110
120
130
140
90 100 110 120 130 140
Y m (t
est)
Xm (comparative)
r = 0.990
Chloride X: ROCHE COBAS 6000 SystemY: epoc System
n = 50 slope = 0.982 int’t. = 5.032 Sy.x = 1.250
90
100
110
120
130
140
90 100 110 120 130 140
Y m (t
est)
Xm (comparative)
r = 0.985
Chloride X: ADVIA® Clinical Chemistry System by Siemens HealthineersY: epoc System
n = 53 slope = 0.981 int’t. = 1.084 Sy.x = 1.773
90
100
110
120
130
140
90 100 110 120 130 140
Y m (t
est)
Xm (comparative)
r = 0.982
Chloride X: Beckman Coulter DXC SystemY: epoc System
n = 63 slope = 0.990 int’t. = 1.611 Sy.x = 1.670
90
100
110
120
130
140
90 100 110 120 130 140
Y m (t
est)
Xm (comparative)
r = 0.995
Chloride X: Radiometer ABL 800 SystemY: epoc System
n = 56 slope = 1.040 int’t. = -4.866 Sy.x = 0.545
90
100
110
120
130
140
90 100 110 120 130 140
Y m (t
est)
Xm (comparative)
White Paper | epoc Blood Analysis System epoc Blood Analysis System | White Paper
22 23
Hematocrit Method ComparisonHematocrit %PCVPrecision n Mean SD %CV
Level 1 26 25 0.56 2.28%
Level 3 26 44 1.16 2.61%
r = 0.982
Hct X: Radiometer ABL 825 SystemY: epoc System
n = 38 slope = 0.996 int’t. = -0.4 Sy.x = 1.81
0
10
20
30
40
60
50
70
0 10 20 30 40 50 60 70
Y m (t
est)
Xm (comparative)
r = 0.991
Hct X: Abbott I-STAT SystemY: epoc System
n = 29 slope = 0.944 int’t. = 2.2 Sy.x = 1.40
0
10
20
30
40
60
50
70
0 10 20 30 40 50 60 70
Y m (t
est)
Xm (comparative)
r = 0.971
Hct X: RAPIDLab 1265 Blood Gas System by Siemens HealthineersY: epoc System
n = 23 slope = 1.051 int’t. = -4.0 Sy.x = 2.61
0
10
20
30
40
60
50
70
0 10 20 30 40 50 60 70
Y m (t
est)
Xm (comparative)
r = 0.920
Hct X: IL GEM PREMIER 3000 SystemY: epoc System
n = 57 slope = 1.037 int’t. = -2.8 Sy.x = 2.83
0
10
20
30
40
60
50
70
0 10 20 30 40 50 60 70
Y m (t
est)
Xm (comparative)
r = 0.986
Hct X: Nova Biomedical PHOX SystemY: epoc System
n = 34 slope = 1.052 int’t. = -3.6 Sy.x = 1.76
0
10
20
30
40
60
50
70
0 10 20 30 40 50 60 70
Y m (t
est)
Xm (comparative)
r = 0.984
Hct X: Beckman Coulter LH SystemY: epoc System
n = 29 slope = 1.067 int’t. = -0.3 Sy.x = 1.86
0
10
20
30
40
60
50
70
0 10 20 30 40 50 60 70
Y m (t
est)
Xm (comparative)
r = 0.971
Hct X: Sysmex XE SystemY: epoc System
n = 18 slope = 0.983 int’t. = -0.4 Sy.x = 1.96
0
10
20
30
40
60
50
70
0 10 20 30 40 50 60 70
Y m (t
est)
Xm (comparative)
r = 0.970
Hct X: Microcentrifugation (spun)Y: epoc System
n = 63 slope = 0.963 int’t. = 0.9 Sy.x = 2.01
0
10
20
30
40
60
50
70
0 10 20 30 40 50 60 70
Y m (t
est)
Xm (comparative)
White Paper | epoc Blood Analysis System epoc Blood Analysis System | White Paper
24 25
Glucose Method ComparisonGlucose mg/dLPrecision n Mean SD %CV
Level 1 27 41.9 1.24 2.96%
Level 3 27 278 6.84 2.46%
r = 0.999
Glucose X: Abbott I-STAT SystemY: epoc System
n = 41 slope = 1.015 int’t. = 1.8 Sy.x = 5.59
0
100
200
300
400
500
600
0 100 200 300 400 500 600
Y m (t
est)
Xm (comparative)
r = 0.995
Glucose X: Radiometer ABL 700 SystemY: epoc System
n = 24 slope = 1.048 int’t. = -1.7 Sy.x = 5.49
0
100
200
300
400
500
600
0 100 200 300 400 500 600
Y m (t
est)
Xm (comparative)
r = 0.990
Glucose X: RAPIDLab 1265 Blood Gas System by Siemens HealthineersY: epoc System
n = 22 slope = 1.052 int’t. = 4.0 Sy.x = 15.75
0
100
200
300
400
500
600
0 100 200 300 400 500 600
Y m (t
est)
Xm (comparative)
r = 0.989
Glucose X: IL GEM PREMIER 3000 SystemY: epoc System
n = 31 slope = 1.042 int’t. = 11.9 Sy.x = 11.07
0
100
200
300
400
500
600
0 100 200 300 400 500 600
Y m (t
est)
Xm (comparative)
r = 0.994
Glucose X: Nova Biomedical CRITICAL CARE XPRESS SystemY: epoc System
n = 44 slope = 1.021 int’t. = -4.7 Sy.x = 6.43
0
100
200
300
400
500
600
0 100 200 300 400 500 600
Y m (t
est)
Xm (comparative)
r = 0.996
Glucose X: Beckman Coulter DXC SystemY: epoc System
n = 24 slope = 1.057 int’t. = -10.5 Sy.x = 7.71
0
100
200
300
400
500
600
0 100 200 300 400 500 600
Y m (t
est)
Xm (comparative)
r = 0.998
Glucose X: Ortho Clinical Laboratories VITROS SystemY: epoc System
n = 41 slope = 1.018 int’t. = 0.8 Sy.x = 6.82
0
100
200
300
400
500
600
0 100 200 300 400 500 600
Y m (t
est)
Xm (comparative)
r = 0.997
Glucose X: Dimension Integrated Chemistry System by Siemens HealthineersY: epoc System
n = 43 slope = 1.016 int’t. = -2.7 Sy.x = 7.49
0
100
200
300
400
500
600
0 100 200 300 400 500 600
Y m (t
est)
Xm (comparative)
White Paper | epoc Blood Analysis System epoc Blood Analysis System | White Paper
26 27
Lactate Method ComparisonLactate mmol/LPrecision n Mean SD %CV
Level 1 27 0.97 0.045 4.67%
Level 3 28 5.96 0.225 3.77%
r = 0.996
Lactate X: Abbott I-STAT SystemY: epoc System
n = 36 slope = 0.998 int’t. = 0.113 Sy.x = 0.480
0
2
6
4
10
8
14
12
16
20
18
0 6 8 102 4 12 14 16 18 20
Y m (t
est)
Xm (comparative)
r = 0.995
Lactate X: Radiometer ABL 700 SystemY: epoc System
n = 51 slope = 1.011 int’t. = 0.101 Sy.x = 0.258
0
2
6
4
10
8
14
12
16
20
18
0 6 8 102 4 12 14 16 18 20
Y m (t
est)
Xm (comparative)
r = 0.999
Lactate X: RAPIDLab 1265 Blood Gas System by Siemens HealthineersY: epoc System
n = 23 slope = 1.019 int’t. = -0.207 Sy.x = 0.132
0
2
6
4
10
8
14
12
16
20
18
0 6 8 102 4 12 14 16 18 20
Y m (t
est)
Xm (comparative)
r = 0.993
Lactate X: IL GEM PREMIER 4000 SystemY: epoc System
n = 46 slope = 1.025 int’t. = 0.130 Sy.x = 0.564
0
2
6
4
10
8
14
12
16
20
18
0 6 8 102 4 12 14 16 18 20
Y m (t
est)
Xm (comparative)
r = 0.989
Lactate X: Ortho Clinical Laboratories VITROS SystemY: epoc System
n = 42 slope = 0.938 int’t. = 0.155 Sy.x = 0.398
0
2
6
4
10
8
14
12
16
20
18
0 6 8 102 4 12 14 16 18 20
Y m (t
est)
Xm (comparative)
r = 0.999
Lactate X: Dimension Integrated Chemistry System by Siemens HealthineersY: epoc System
n = 20 slope = 0.987 int’t. = -0.033 Sy.x = 0.120
0
2
6
4
10
8
14
12
16
20
18
0 6 8 102 4 12 14 16 18 20
Y m (t
est)
Xm (comparative)
r = 0.996
Lactate X: Roche MODULAR SystemY: epoc System
n = 48 slope = 1.039 int’t. = -0.067 Sy.x = 0.264
0
2
6
4
10
8
14
12
16
20
18
0 6 8 102 4 12 14 16 18 20
Y m (t
est)
Xm (comparative)
White Paper | epoc Blood Analysis System epoc Blood Analysis System | White Paper
28 29
BUN Method ComparisonBUN mg/dLPrecision n Mean SD %CV
Level 1 137 49.9 1.12 2.2%
Level 3 132 4.9 0.13 2.7%
r = 0.999
BUN X: Dimension Integrated Chemistry System by Siemens HealthineersY: epoc System
n = 64 slope = 0.93 int’t. = 0.3 Sy.x = 1.0
0
20
40
60
80
100
120
0 20 40 60 80 100 120
Y m (t
est)
Xm (comparative)
r = 0.999
BUN X: Beckman DXC SystemY: epoc System
n = 39 slope = 0.95 int’t. = 1.3 Sy.x = 0.7
0
20
40
60
80
100
120
0 20 40 60 80 100 120
Y m (t
est)
Xm (comparative)
r = 0.997
BUN X: Dimension Vista Intelligent Lab System by Siemens HealthineersY: epoc System
n = 146 slope = 0.95 int’t. = 0.2 Sy.x = 1.6
0
20
40
60
80
100
120
0 20 40 60 80 100 120
Y m (t
est)
Xm (comparative)
r = 0.997
BUN X: Abbott ARCHITECT SystemY: epoc System
n = 86 slope = 0.93 int’t. = 0.7 Sy.x = 0.7
0
20
40
60
80
100
120
0 20 40 60 80 100 120
Y m (t
est)
Xm (comparative)
r = 0.996
BUN X: ROCHE COBASY: epoc System
n = 121 slope = 1.00 int’t. = 0.2 Sy.x = 1.8
0
20
40
60
80
100
120
0 20 40 60 80 100 120
Y m (t
est)
Xm (comparative)
White Paper | epoc Blood Analysis System epoc Blood Analysis System | White Paper
30 31
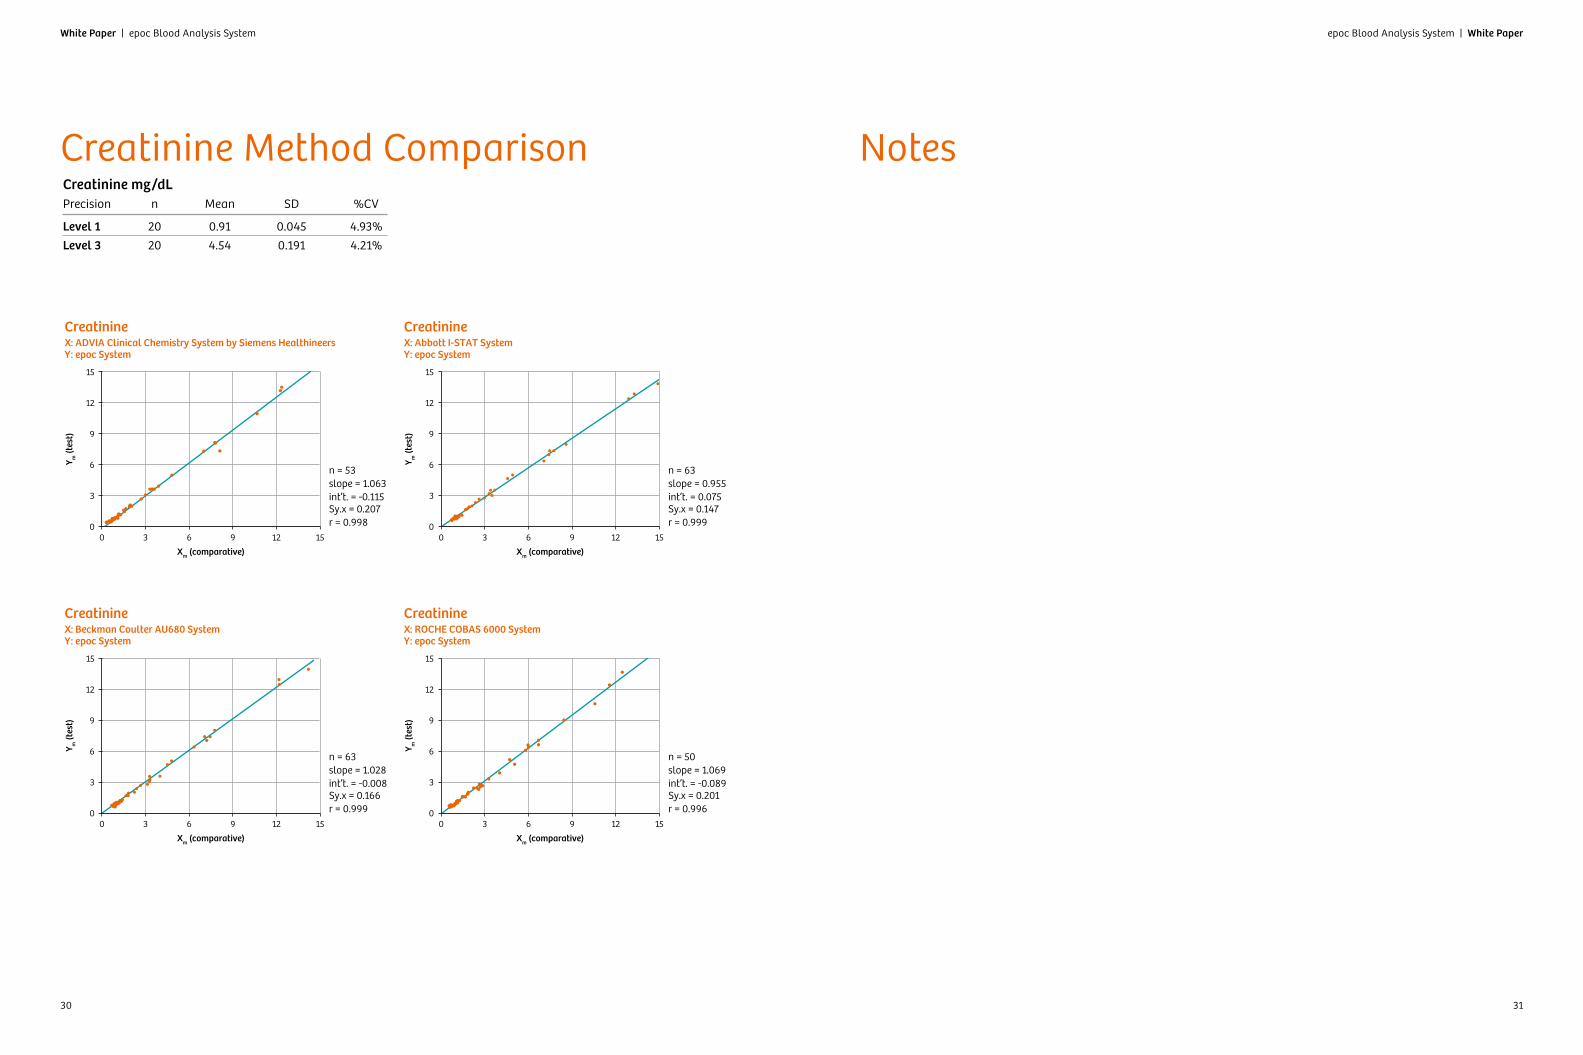
Creatinine Method Comparison NotesCreatinine mg/dLPrecision n Mean SD %CV
Level 1 20 0.91 0.045 4.93%
Level 3 20 4.54 0.191 4.21%
r = 0.998
Creatinine X: ADVIA Clinical Chemistry System by Siemens HealthineersY: epoc System
n = 53 slope = 1.063 int’t. = -0.115 Sy.x = 0.207
0
3
6
9
12
15
0 3 6 9 12 15
Y m (t
est)
Xm (comparative)
r = 0.999
Creatinine X: Beckman Coulter AU680 SystemY: epoc System
n = 63 slope = 1.028 int’t. = -0.008 Sy.x = 0.166
0
3
6
9
12
15
0 3 6 9 12 15
Y m (t
est)
Xm (comparative)
r = 0.999
Creatinine X: Abbott I-STAT SystemY: epoc System
n = 63 slope = 0.955 int’t. = 0.075 Sy.x = 0.147
0
3
6
9
12
15
0 3 6 9 12 15
Y m (t
est)
Xm (comparative)
r = 0.996
Creatinine X: ROCHE COBAS 6000 SystemY: epoc System
n = 50 slope = 1.069 int’t. = -0.089 Sy.x = 0.201
0
3
6
9
12
15
0 3 6 9 12 15
Y m (t
est)
Xm (comparative)