Embed Size (px)
DESCRIPTION
Joe Sirott PMEL/NOAA. Adventures in Web Services for Large Geophysical Datasets. Motivation. Zonal averages of precipitation trends From Zhang, et al Nature 448, 461-465(26 July 2007) . Seasonal zonal averages of Arctic temperature trends - PowerPoint PPT Presentation
Citation preview

11
Adventures in Web Services Adventures in Web Services for Large Geophysical for Large Geophysical
DatasetsDatasets
Joe SirottJoe Sirott
PMEL/NOAAPMEL/NOAA

22
MotivationMotivation
Zonal averages of precipitation trendsFrom Zhang, et al Nature 448, 461-465(26 July 2007)

33
Seasonal zonal averages of Arctic temperature trendsFrom Graversen, et al Nature 541, 53-56(3 Jan 2008)

44
Use caseUse case
Calculate zonally averaged seasonal Calculate zonally averaged seasonal temperature trends from 20temperature trends from 20thth century century climate experiment from four climate climate experiment from four climate models (NASA GISS, NCAR PCM and models (NASA GISS, NCAR PCM and CCSM, GFDL CM2.1, and Hadley CM3) in CCSM, GFDL CM2.1, and Hadley CM3) in CMIP3 archives from 30N to 90NCMIP3 archives from 30N to 90N
Total of 81 files in 36GBTotal of 81 files in 36GB
Time period of interest 1979-2000Time period of interest 1979-2000

55
Recipe is…Recipe is…
Regrid all model data to common gridRegrid all model data to common gridCalculate seasonal ensemble means for all Calculate seasonal ensemble means for all models for 30N-90N, 1979 - 2000models for 30N-90N, 1979 - 2000Calculate zonal means from seasonal Calculate zonal means from seasonal ensemble meansensemble meansCalculate seasonal trends from zonal meanCalculate seasonal trends from zonal meanPlot/download resultsPlot/download results

66
Traditional approachTraditional approach
Find datasets/variables of interestFind datasets/variables of interest
Download individual data files or subset Download individual data files or subset with OPeNDAPwith OPeNDAP
Analyze data locallyAnalyze data locally

77
Problems with traditional approachProblems with traditional approach
Awkward user interface(s)Awkward user interface(s)Obscure UI naming conventions makes it difficult Obscure UI naming conventions makes it difficult to find variables of interestto find variables of interest
Datasets often aren’t aggregatedDatasets often aren’t aggregated
Subsetting and/or aggregation services often fail Subsetting and/or aggregation services often fail with large datasets (e.g. out of memory errors)with large datasets (e.g. out of memory errors)
Requires download of 36GB of data (file Requires download of 36GB of data (file download) or ~2.5GB (OPeNDAP) for final download) or ~2.5GB (OPeNDAP) for final product ~5KB.product ~5KB.

More modern approachMore modern approach
Aggregated dataAggregated dataSpatial or temporal subsettingSpatial or temporal subsettingMeaningful variable and dataset namesMeaningful variable and dataset namesModern Web UIModern Web UI

Mandatory product plugMandatory product plug
1010
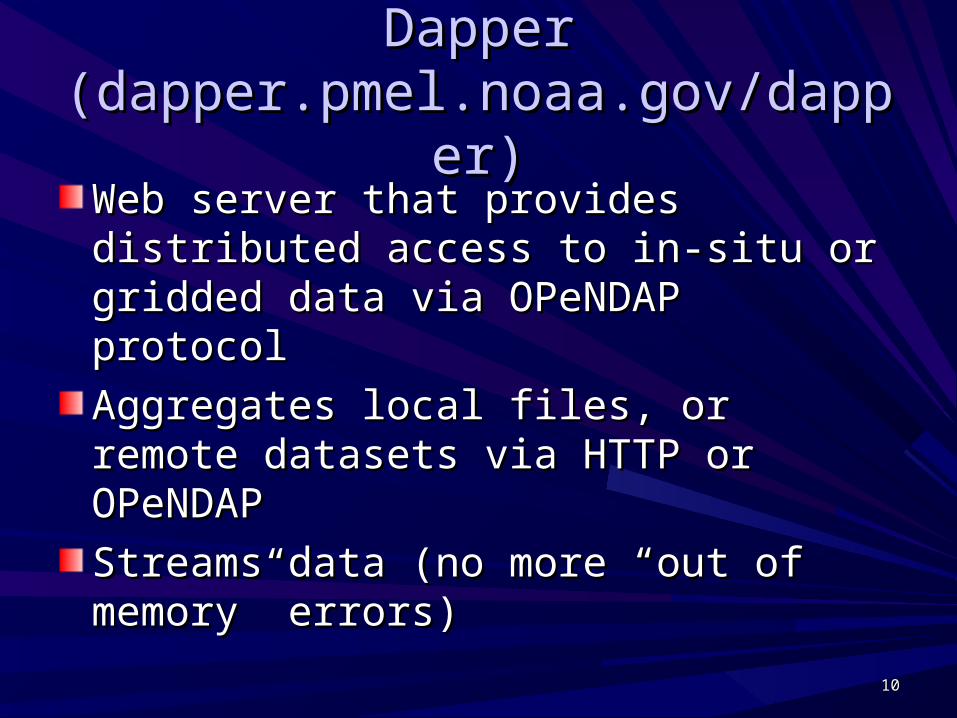
Dapper Dapper (dapper.pmel.noaa.gov/dapper)(dapper.pmel.noaa.gov/dapper)
Web server that provides distributed Web server that provides distributed access to in-situ or gridded data via access to in-situ or gridded data via OPeNDAP protocolOPeNDAP protocol
Aggregates local files, or remote datasets Aggregates local files, or remote datasets via HTTP or OPeNDAPvia HTTP or OPeNDAP
Streams data (no more “out of memory” Streams data (no more “out of memory” errors)errors)

1111
DChart (dapper.pmel.noaa.gov)DChart (dapper.pmel.noaa.gov)
Browser based tool for visualizing or Browser based tool for visualizing or downloading in-situ or gridded ocean or downloading in-situ or gridded ocean or atmospheric dataatmospheric data
Also aggregates dataAlso aggregates data
AJAX based user interfaceAJAX based user interface
Access to ~3.5 TB of gridded dataAccess to ~3.5 TB of gridded data
Configurable UIConfigurable UI

1212

What’s missing?What’s missing?
Still requires download of ~2.5GB for final Still requires download of ~2.5GB for final product ~5KBproduct ~5KB
Lots of clicking to download multiple Lots of clicking to download multiple datasetsdatasets
BIG problem for AR5 data needs (>1PB)BIG problem for AR5 data needs (>1PB)

Missing pieceMissing piece

Ideal analysis environment Ideal analysis environment (scientist perspective)(scientist perspective)
Highly interactive (i.e. command line)Highly interactive (i.e. command line)Scripting in familiar language of choice Scripting in familiar language of choice (bash, Python, Ruby, Matlab)(bash, Python, Ruby, Matlab)Access to multiple tools (Matlab, nco, cdo, Access to multiple tools (Matlab, nco, cdo, GrADS, Ferret, gdal, … )GrADS, Ferret, gdal, … )Access to custom home-grown toolsAccess to custom home-grown toolsStorage of intermediate products Storage of intermediate products (anomalies, statistics, etc.)(anomalies, statistics, etc.)

Limitations of Web servicesLimitations of Web services
Users locked-in to backend analysis Users locked-in to backend analysis softwaresoftwareDifficult to debugDifficult to debugSteep learning curveSteep learning curveHow to handle long lived operations?How to handle long lived operations?Security problemsSecurity problemsNo (or limited) scripting capabilitiesNo (or limited) scripting capabilitiesNot interactiveNot interactive

A cloud computing alternativeA cloud computing alternative
Upload data to cloudUpload data to cloudMove computation to dataMove computation to dataBoot VM preloaded with common analysis Boot VM preloaded with common analysis toolstoolsUsers can customize (and share) VM Users can customize (and share) VM images and dataimages and dataUsers have full ssh access to Xen VM(s) Users have full ssh access to Xen VM(s) running Linux with local access to data running Linux with local access to data stored in cloudstored in cloud
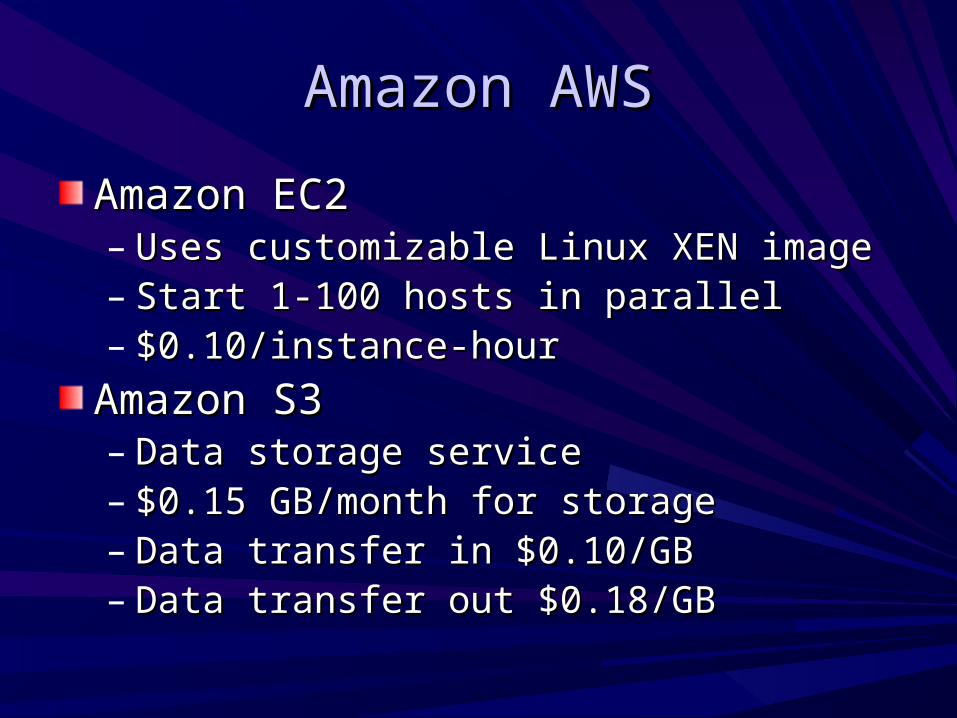
Amazon AWSAmazon AWS
Amazon EC2Amazon EC2– Uses customizable Linux XEN imageUses customizable Linux XEN image– Start 1-100 hosts in parallelStart 1-100 hosts in parallel– $0.10/instance-hour$0.10/instance-hour
Amazon S3Amazon S3– Data storage serviceData storage service– $0.15 GB/month for storage$0.15 GB/month for storage– Data transfer in $0.10/GBData transfer in $0.10/GB– Data transfer out $0.18/GBData transfer out $0.18/GB

Cloud analysis architectureCloud analysis architecture

Sample workflow (free version)Sample workflow (free version)
1.1. User authenticated via Web UIUser authenticated via Web UI2.2. EC2 instance booted with OPeNDAP EC2 instance booted with OPeNDAP
access to datasets (stored on S3 or EC2 access to datasets (stored on S3 or EC2 volumes)volumes)
3.3. User rpms installed (optional)User rpms installed (optional)4.4. ssh access to instance using ssh keypair ssh access to instance using ssh keypair
(generated when account issued)(generated when account issued)5.5. User analyzes, downloads, visualizes, ...User analyzes, downloads, visualizes, ...6.6. Instance restored to pool after user done Instance restored to pool after user done
(or after period of inactivity)(or after period of inactivity)

Analysis cloud advantagesAnalysis cloud advantages
ScalableScalableData lives in same network as softwareData lives in same network as softwareNo user software lock-inNo user software lock-inUsers can work in familiar environmentUsers can work in familiar environmentSecurity problems reducedSecurity problems reducedInteractiveInteractiveAccess to debugging toolsAccess to debugging tools
BUTBUT
Lots of details to work out!Lots of details to work out!

2222
Questions?Questions?

2323
More infoMore info
PMEL Dapper ServerPMEL Dapper Serverhttp://dapper.pmel.noaa.gov/dapperhttp://dapper.pmel.noaa.gov/dapper
PMEL DChartPMEL DCharthttp://dapper.pmel.noaa.gov/dcharthttp://dapper.pmel.noaa.gov/dchart
Downloads, propagandaDownloads, propagandahttp://http://www.epic.noaa.gov/epic/software/dapperwww.epic.noaa.gov/epic/software/dapper//http://http://www.epic.noaa.gov/epic/software/dchart/www.epic.noaa.gov/epic/software/dchart/
[email protected]@noaa.gov


![Visualization and Analysis of Multi-terabyte Geophysical Datasets …gerlebacher/vlab/ChinaViz... · 2006-08-30 · datasets, the fast and interactive 3D environment of Amira [] works](https://img.pdfslide.us/doc/110x75/5f139dc88594495abc07aed8/visualization-and-analysis-of-multi-terabyte-geophysical-datasets-gerlebachervlabchinaviz.jpg)