Embed Size (px)
Citation preview

Adventist Midwest Health2007 Community Benefit Report
2007 Annual Report2008 Community Benefit Plan

Table of Contents
Table of Contents
Introduction
Mission 4
Adventist Midwest Health Beginnings 5-7
Guiding Principles 8
Mission Matters 9
Community Benefit Report
Community Benefit: Definition 10
Community Needs Assessment: Resources 11
2007 Community Benefit Focus 12
Summary of Benefit Provided: 2004-present 13-14
Charity Care 15

Table of Contents
Language Assistance Services 16
Government Sponsored Indigent Health Care 17
Subsidized Health Care 18
Bad Debt 19
Donations 20
Volunteer Services 21
Education 22
Research 23
Other Community Benefit 24
Community Needs Assessment 25-73
Table of Contents

Adventist Midwest Health Mission
Extending the healing ministry of Christ.
“I came that they may have life, and have it abundantly.” John 10:10
Mission 4
David L. Crane
President/CEO
Adventist Midwest Health

Adventist Midwest Health Beginnings
Founders:
David and Mary Paulson
Life Boat Mission
Where David and Mary Paulson’s Chicago mission began.
(State Street in Chicago)
Hinsdale Sanitarium was founded in 1904 by Drs. David and Mary Paulson. Dr. David Paulson was born on October 27, 1868 on a farm near Raymond, Wisconsin. His family moved west when he was six, and he grew up on the Western Plains. Facing death at seventeen, he gave his life unreservedly to Christ. Later, Paulson attended Battle Creek College and Anne Arbor Medical College. He then gave his life in service to the downtrodden of Chicago. He trained medical missionaries, directed the Life Boat Mission on Chicago’s State Street, and founded the Rescue Home for Girls.
“It is our privilege to have the Spirit of God unfold to us simple, definite principles, which we may incorporate so thoroughly into our life’s experience, that, like a master key, they will serve to unlock our most troublesome perplexities.” Dr. David Paulson
Adventist Midwest Health Beginnings5

Adventist Midwest Health Beginnings
Panoramic view of Adventist Hinsdale Hospital (the old Hinsdale Sanitarium).
Imagine a 10-acre piece of property located on the edge of Hinsdale. The rolling hills have a brook running through them and are entirely wooded with fruit trees, berry bushes and shrubbery. This is the setting where the Hinsdale Sanitarium was built. C.B. Kimbell, a wealthy gentleman who lived in Hinsdale, offered to buy the land for Dr. David Paulson with the condition that Dr. Paulson repay him with 20 yearly installments without interest.
Dr. Paulson and his group started building with a good deal of enthusiasm in the fall of 1904. They broke ground and worked during the winter building Hinsdale Sanitarium with 17 bedrooms. The first patient came before the front steps were built, and within three weeks of dedication, every room was full. And this was the beginning of Adventist Midwest Health.
Adventist Midwest Health Beginnings6
View of Adventist Hinsdale Hospital Lobby (Circa 1920).
Adventist Midwest Health Beginnings
Not-for-profit health care organizations have a rich tradition of providing benefit to their communities. Adventist Midwest Health was established not because of economic opportunity, but because there was a need for health services in the community.
Adventist Midwest Health, as a not-for-profit health care organization, continues this rich tradition of providing benefit to the community, with the ultimate goal of improving community health and increasing access to care. As a not-for-profit organization, all of the net income (profit margin) generated by our hospitals is reinvested back into our programs and services. This benefits the patients and communities we serve instead of individual owners or shareholders.
Member hospitals of Adventist Midwest Health continue the Adventist tradition of meeting patients' emotional and spiritual needs in addition to their physical needs. This includes Adventist Hinsdale Hospital in Hinsdale, Adventist GlenOaks Hospital in Glendale Heights, Adventist Bolingbrook Hospital in Bolingbrook, Adventist La Grange Memorial Hospital in La Grange, and Chippewa Valley Hospital & Oakview Care Center in Durand, Wisconsin. Each partner with community organizations to provide health services, educational programs and support groups that promote better health.
“In times of sadness and joy, sickness and renewal, generations of mothers and fathers have turned to the strength and stability of Adventist Midwest Health.”
David L. Crane, President/CEO; Adventist Midwest Health
Adventist Midwest Health Beginnings
Adventist Hinsdale Hospital
Adventist La Grange Memorial
Hospital
Adventist GlenOaks Hospital
Adventist Bolingbrook
Hospital
Chippewa Valley Hospital
CEO Rick Mace
CEO Rick Wright
CEO Brinsley Lewis
CEO David L. Crane
CEO Doug Peterson
7

Guiding Principles
Christian MissionWe exist to serve the needs of our communities in harmony with Christ’s healing ministry and incorporate Christian values at every level of service.
Quality and Service ExcellenceWe strive to meet or exceed both the service standards of the health care industry and the expectations of the patients we serve and measure our success through continuous surveying of patient satisfaction.
CompassionWe are sensitive to the needs of the individuals and families we serve and meet their needs with kindness and empathy.
Focus on Community WellnessWe commit time, talent and financial support to educate our neighbors in the principles of illness prevention and healthful living.
High Ethical StandardsWe conduct our business with integrity, honesty and fairness. As responsible stewards, we use our financial resources wisely by choosing business practices which are cost-effective, productive and result in a fair return on investment.
Cultural DiversityWe value the diversity of our patients, employees, business colleagues and visitors and treat them with kindness and respect regardless of their background, race, religion or culture.
Adventist Midwest Health employees draw motivation and direction from six strongly held principles. These principles guide the manner in which we treat each other and those we serve:
Adventist Midwest Health Guiding Principles 8

For some people we are a place to be born; and for others, a place to die.
To some people we offer sanctuary, literally a place of refuge in the midst of a chaotic world, a sacred place to sit and pray, think and let go.
And some seek our folds for routine healthcare and preventive medicine to optimize a healthy lifestyle.
To other people we are a M.A.S.H. unit. They come here when their medical and emotional needs are so overwhelming that they have nowhere else to turn.
For some, we are a place of worship, with many opportunities for spiritual enrichment and musical praise to fill the soul.
For others, we are the lecture hall; a place to capture knowledge that has the capacity to change lives.
In smaller bites, in smaller groups, we are a grief counseling center, a locus of support for issues of health care ethics, a haven for life’s most difficult challenges, offering a community to promote knowledge and healing necessary to move forward with happy and productive living.
For some we are a research hub; confronting some of medical science’s toughest questions for the benefit of many.
For many we are a career center, a place to grow professionally and spiritually, crafting their skill sets to benefit others.
To some we are a “resource lifeboat,” offering financial assistance and donations of time or service at a moment’s notice.
And for many, we are community itself; providing an essential link to others through volunteering, social events, employment and community benefit activities.
“All that we do, all that we are, all the means we can employ, is for the single purpose of living our Mission.” Richard K. Reiner, Chairman of the Board; Adventist Midwest Health
Guiding Principles
Guiding Principles 9

Community Benefit
Community benefit is a planned, managed, organized, and measured approach to both evaluating and providing those services identified as high priority by members of the participating community. Community benefits meet one of the following three criteria:
•Generate a low or negative margin•Respond to needs of special populations (minorities, elderly, persons with disabilities, mentally ill, etc.)•Supply services or programs that would likely be discontinued if the decision were made on a purely financial basis
Community Benefit: Definition
“In times as difficult and demanding as these, securing the trust of the public in the nation’s hospitals is paramount. Even if a hospital’s connection to the community already is strong, it must be bolstered. It it’s weak, it must be strengthened. If it’s broken, it must be fixed.” John King and Emerson Moran.
Trust Counts Now
10

1. 2005-2010 We Plan; Suburban Cook County Assessment and Planning for Public Health Partners2. Adventist Midwest Health Strategic Planning Report (2006/07)3. America’s Health Rankings 2005 Edition. A Call to Action for People and Their Communities. United Health Foundation; Partnership for
Prevention; American Public Health Association.4. Anzalone-Liszt Research: Summary of MCHC Chicagoland Focus Groups. January 8, 2005.5. Camarota, Steven A. Immigrants at Mid-Decade: A Snapshot of America’s Foreign-Born Population in 2005. Center for Immigration Studies.6. Caring for the Future. A Plan for Meeting Metropolitan Chicago’s Growing Health Care Workforce Needs. Metropolitan Chicago Health Care
Council.7. DuPage County Health Department Illinois Project for the Local Assessment of Needs 2010; IPLAN 2010. March 3, 2005.8. Friedman, Emily. White Coats and Many Colors. Population Diversity and Its Implications for Health Care. American Hospital Association. 20059. Healthy People in Healthy Communities: A Community Planning Guide Using Health People 2010. Office of Disease Prevention and Health
Promotion; Department of Health and Human Services; February 2001.10. King, John and Moran, Emerson. Trust Counts Now: Hospitals and Their Communities. A Report to the American Hospital Association.11. Lewin Group. Trendwatch: Trends Affecting Hospitals and Health Systems. American Hospital Association, 2006.12. Real People, Real Stories: A detailed description of Illinois’ Uninsured. A Project of United Power for Action and Justice; Gilead Outreach and
Referral Center13. Strunk, Bradley, C.; Ginsburg, Paul B.; and Banker, Michelle I. Trends: The Effect of Population Aging on Future Hospital Demand. Health
Affairs Web Exclusive; 2006 Project Hope.14. Ten Essential Facts About Poverty in DuPage County (compiled by DuPage Federation on Human Services).15. Will County Health Department Community Health Needs Assessment and Plan.
Health is a state of complete physical, mental and social well-being and not merely the absence of disease or infirmity.
World Health Organization
Community Needs Assessment: Resources
Community Needs Assessment: Resources
*A comprehensive summary of the community needs assessment may be found on pages 25-78.
11

2007 Community Benefit Focus
2007 Adventist Midwest Health Community Benefit Focus
Areas of Prioritized Community Benefit Activities
1. Access to Care
2. Heart Disease
3. Cancer
4. Adolescent Health
5. Obesity
6. Diabetes
Adventist Midwest Health Community Benefit Focus: Analysis of community needs data has resulted in prioritization of the following primary areas of focus for 2007 AMH Community Benefit.
“Far and away the best prize that life offers is the chance to work hard at work worth doing.”Theodore Roosevelt
12

Community Benefit: Resources Provided
AMH Community Benefit Resources Provided
Benefit for the Poor and Underserved 2007 Value
Charity Care: Care for which the provider does not expect to receive payment from the patient or a third party. Does not include bad debt or the unreimbursed cost of Medicare, Medicaid and other federal, State or local indigent health care programs.
$9,620,562
$132,227
$49,638,965
$1,098,203
Language Assistance Services: Unreimbursed actual costs pertaining to language assistance services offset by any revenue received for these services (interpreters, translators, language line, salaries/benefits for program coordination)
Government-sponsored Indigent Health Care: Unreimbursed cost of Medicare, Medicaid and other federal, state, or local indigent health care programs, eligibility for which is based on financial need. Apply a total cost-to-charge ratio to obtain costs, unless the hospital has an alternative method for determining costs, then deduct any revenues.
Subsidized Health Services: Services for which the hospital, in response to community need, must subsidize from other revenue sources.
Bad Debt: The bad debt expense resulting from the extension of credit for services the hospital provided for which payment was expected but not received. $9,189,292
*Note: The Bad calculation reflects bad debt based on cost to provide service.
“As a mission-driven organization, we believe strength and growth have little virtue unless they work to benefit others.” John B. Rapp, D.Min., Vice President Ministries and Mission; Adventist
Midwest Health
13

Benefit for the Broader Community 2007 Value
Donations: Cash and in-kind donations such as the value of meeting space, equipment, and personnel to assist other community health care providers, social service agencies and organizations. $551,560
$316,901
$6,151,549
$486,754
$1,829,619
Total Benefit:$79,015,632
Volunteer Services: Voluntary activities provided by hospital employees and volunteers in connection with a hospital’s Community Benefits Program that take place as the result of a formal hospital initiative to organize or promote voluntary participation in the activity.
Education: Costs incurred for hospital-based educational programs such as medical residency and internships and nursing, radiology tech and physical therapy programs (reduced by direct medical education funding from third-party payer reimbursement, fees charged, etc.).
Research: Cost of research activities conducted primarily to advance medical or health care services (costs not covered by grant funding, etc.).
Other Community Benefit:
AMH Community Benefit Resources Provided
“With faith we can transform bleak and desolate valleys into sunlit paths of joy and bring new light into the dark caverns of pessimism.” Dr. Martin Luther King
Community Benefit: Resources Provided
14

Charity Care
Community Benefit: Resources Provided and Planned
We are dedicated to serving Our Patients, and Our Community.
Access to care and coverage for health care is a primary determinant of health care disparity in America.
(Goal) Provide free or discounted care to those who qualify.
(Objective) Implement use of Charity Care guidelines with 100% of those individuals who have identified need
Adventist Midwest Health has exceeded Illinois Hospital Association charity guidelines by providing 100% coverage for individuals who are at or below 200% of the federal poverty level, and providing additional coverage via a sliding scale discount for individuals who are between 200-400% of the federal poverty level.
Elements of a simplified charity care application process include: (1)Simplified the charity application; (2) Printed charity care application with English on one side and Spanish on the other; (3) Charity care application printed on back side of all patient bills; (4) Proof of income no longer needed to qualify for charity care if the patient’s debts to the hospital are under $20,000; (5)Verbal charity application may be taken for debts that are $20,000 or less; (6) Increased financial counselor role to allow personal visits to all inpatients for insurance, and collection, payment or charity care processes.
Monitoring and Auditing activities by Corporate Compliance assessed staff knowledge relative to Charity Care Policies and Practices as well as availability of signage to notify patients of financial assistance available (audit completed two times in 2007 with two planned in 2008). Formal education was provided to staff to promote optimal assistance to the patient population. Monitoring and Auditing will continue into 2007.
Charity Care (Community Need: Access to Care)
“Wherever Jesus traveled, He healed the sick, fed the hungry, and clothed the poor. He was moved with compassion, and in tending to physical needs He touched the mind and the spirit. By His
example, this is our work today.” Walter Wright D.D.; Chairman, Board of Directors; Adventist Health System
15

Language Assistance Services
Community Benefit: Resources Provided and Planned
Language and Culture significantly impact the health care experience. 2003 Census data for DuPage County reveals that the percentage of people that speak a language other English at home is at 20% (a 218% increase in the past fifteen years), with 10% of those individuals speaking English “less than very well”. Similarly, Western Cook and Will counties have a substantive increase in the percentage of individuals who do not proficiently speak English.
Adventist Midwest Health recognizes the importance of cultural awareness and sensitivity in the course of comprehensive health care. In 2005, leaders from our hospitals partnered with community law enforcement for cultural diversity education, with focus on awareness and strategies to promote health outcomes. Workforce diversity is celebrated, with a large percentage of the workforce coming from diverse cultural and religious backgrounds, and this is evident in the many cultural celebrations at the hospital campuses, as well as in successful community partnerships. Many Adventist Midwest Health employees are bilingual, and thirteen employees have become trained interpreters through two separate comprehensive educational programs. Cultural preferences and language needs are assessed and responded to for all patients admitted to the hospital.
(Goal) Assure equal access to service for individuals with limited English proficiency.
(Objectives) (1) Continued contractual relationships with interpreter service providers; (2) Implementation of automated voice menus in Spanish at all AMH Hospitals (implemented 09/05); (3) Participation on the DuPage Federation for Healthcare, with initiation of a written agreement and use of Federation resources; (4) Continued evaluation and translation of prioritized documents in Spanish; (5) Ongoing staff education; (6) Provision of interpreter training for AMH employees.
Monitoring and Auditing activities by Corporate Compliance assess language needs of the AMH patient population, utilization of services, staff knowledge relative to language assistance services as well as availability of signage to notify patients of language assistance available. An audit is completed annually. Formal education is provided to staff to promote optimal assistance to the patient population. Monitoring and Auditing will continue into 2008.
Language Assistance Services (Community Need: Access to Care)
“In a multicultural setting, treating all people alike means that we have to treat them differently.”Dr. Gottfried Oosterwal, Medical Anthropologist
16

Government-Sponsored Indigent Health Care
The Bottom Line is not the top priority. People are.
State and Federal reimbursement programs do not cover all service needs of individuals with limited resources. Medicare and Medicaid payment shortfalls for services needed by the community continue to grow. Our ability to absorb losses associated with payment shortfalls (exceeding $49 million in 2007 alone) allows needed services for our community to continue. This includes comprehensive emergency health, treatment of chronic health diseases, cancer prevention and treatment services, surgical interventions, and the list goes on.
(Goal) Provide care to patients with health needs in which government funding is not available.
(Objective) Assure assessment of community need is top priority when determining the impact of government shortfalls in payments on health care decisions.
Government-Sponsored Indigent Health Care (Community Need: Access to Care; Evaluation and Treatment of Heart Disease, Cancer, Obesity and Diabetes)
Community Benefit: Resources Provided and Planned
17
“Adventist Midwest Health is always seeking new ways to use its strength. This includes offering programs and services in which reimbursement does not cover the cost. Community need serves as a basis for program decisions. Continued growth allows Adventist Midwest Health to actively pursue our mission of service and compassion.” Janice Hagensicker, Senior Vice President/CFO; Adventist Midwest Health

Subsidized Health Services
(Goal) Provide services in response to community need, which must be subsidized from other revenue sources.
(Objectives) (1) Provide ongoing health screenings and health education classes as defined by community need; (2)Continue commitment to community health/education via KeepingYouWell; (3)Continue support of the Bone Lab, the Cochlear Implant Program, Cardiac Rehab Phase III; Conficare; Community Health Care Services; MD Clinic; and Center for Hearing Research.
Subsidized Health Services (Community Need: Access to Care; Adolescent Health; Evaluation and Treatment of Heart Disease, Cancer, Obesity and Diabetes)
“Well-honed skills and simple acts of kindness, performed on a grand scale, have an untold reach.”Thomas J. Williams Regional Vice President/CAO Adventist Midwest Health
The Adventist Faith fittingly promotes the physical and emotional benefits of healthy living. Hundreds of programs on prevention are offered across Adventist Midwest Health facilities….because we know that the most successful way to treat any disease is to avoid it altogether. 2007 programs included multiple activities and events related to heart disease, diabetes education, cancer screening, support groups for adolescents and adults, healthy eating, lectures to area schools, and family health and safety. Community health education is also provided via physician referral services (staffed by registered nurses) and educational publications sent to the community (KeepingYouWell), with focus on prevention. Many health care programs are provided at a loss in order to promote community wellness (e.g. Cardiac Rehab Phase III, Community Health Services, AHH Bone Lab, etc.).
Community Benefit: Resources Provided and Planned
18

Bad Debt
Bad DebtBad debt is uncollectible charges from those unwilling to pay for the services rendered (or unwilling to complete the steps necessary to demonstrate financial need), as opposed to those who are unable to pay. Hospital services differ from services of other industries. While many service providers outside of health care have the option of checking the customer’s credit rating or asking for payment in advance, this option is often not available for health care providers. The commitment is to health and wellness, often during times of a health crisis, and focus is not placed on collections.
The result is bad debt, or uncollectible costs of providing service (totaling over $9 million dollars in 2007).
Patients receiving care through Adventist Midwest Health have several options to alleviate financial pressures associated with health care bills. Prompt pay discounts are available to all patients, in addition to a self-pay discount of 30% for those individuals without health care coverage. Generous payment plans are available, and Charity Care is always an option for individuals to consider when confronted with financial challenges. These options are available to all who qualify.
However, for many the financial need for assistance is not pursued or present and options of prompt pay or self-pay discounts are not sought. Collection of these unpaid bills becomes an organizational challenge.
(Goal) Provide free or discounted care to those who qualify.
(Objective) Implement use of Charity Care guidelines with 100% of those individuals who have identified need; assure comprehensive notification to all patients of options for prompt-pay discount, self-pay discount and implementation of payment plans; work toward increased efficiency in charity care verification processes.
Community Benefit: Resources Provided and Planned
“It is misguided and even dangerous to assume that lack of health insurance harms only those who are uninsured. The rest of the community pays for uncompensated medical care either directly or indirectly,
and high rates of uninsurance can strain community health systems to the point that important services have to be cut or eliminated.” Arthur Kellermann, “A Shared Destiny: Community Effects of Uninsurance”
Institute of Medicine, 2005.
19

Donations
Donations (Community Need: Access to Care; Adolescent Health; Evaluation and Treatment of Heart Disease, Cancer, Obesity and Diabetes)
Extension of the healing mission into the communities we serve is core to who we are. Our facilities are home to a number of community groups that seek to recover from grief, navigate the uncertainty that comes with behavioral health disorders, or combat alcoholism, and eating disorders, as well as provision of medications and supplies to Ecuador. Over $551,000 in cash and in-kind donations was provided by Adventist Midwest Health in 2007.
(Goal) Provide cash and in-kind donations to assist other community healthcare providers, social service agencies and organizations.
(Objective) Continue to support Community Wellness Programs and other agencies that support community need via ongoing evaluation and continuation of donations. Develop alliances with new community groups with identified need to support AMH Community Benefit priorities.
“Every live man with a gift must divide it with others, or pay the penalty of having it shrink away and finally shrivel up altogether…It is what we give away that we really keep.” Dr. David
Paulson
Community Benefit: Resources Provided and Planned
20

Volunteer Services
Volunteer Services (Community Need: Community Connection; Socialization for community members; Forum, facility and operations to allow residents to give back to the Community)
Volunteer Service Programs enrich the culture and enhance the ability of Adventist Midwest Health entities to accomplish the mission of partnering with the community to promote whole-person care. Community members are integrated into the fabric of healthcare by providing many hours of service in clinical and non-clinical areas, alike. Volunteers come from a wide variety of backgrounds and are grateful for the opportunity to give back to the community and participate in a benevolent social network that might otherwise not be available to them. Over 95,000 volunteer hours are recorded for 2007 (the equivalent of 46 full-time employees). From the youngest volunteers to those volunteers that choose to give of themselves late in life, the benefits of these Community Ambassadors are immeasurable. Volunteerism takes many forms, from carrying out structured hospital tasks, to pet therapy, guided imagery, completing chores and errands for homebound patients, there are meaningful opportunities to serve in many capacities.
(Goal) Continue to provide resources and expertise necessary to promote a comprehensive volunteer program that benefits community members at each Adventist Midwest Health Hospital.
(Objective) Maintain or increase the number of volunteer hours supported from community members (approximately 125,000 hours for the Region).
“Do all the good you can, By all the means you can, In all the ways you can, In all the places you can, At all the times you can, To all the people you can, As long as ever you can.” John Wesley
Community Benefit: Resources Provided and Planned
21

Education
Education (Community Need: Address issue of Health Care workforce shortage , which jeopardizes fulfillment of future health care needs for aging Americans).
(Goal) Provide resources necessary to assure continuation of comprehensive, hospital-based educational programs.
(Objective) (1) Support 48 Residents in the AHH and ALMH Residency Programs in 2008; (2) Support student nurses via job shadowing and educational experiences (goal of 33,000 hours for the Region.
They are chosen as much as they choose, often realizing at an early age that they want to do something important with their lives. They dedicate hands and minds to developing skills, but the mission they know in their hearts.
“The knowledge that we have some one else to teach is a stimulant to our own gift, and furnishes us a constant incentive for treasuring up live facts and valuable items which we otherwise would give only a
passing notice and which would soon pass from our memory.” Dr. David Paulson
A growing shortage of skilled health care workers threatens the ability of hospitals and other health care providers to continueproviding health care services. Adventist Midwest Health promotes community need for skilled health care workers by providing a site for clinical training. This includes two Family Medicine Residency programs, supporting 48 Residents who, with faculty, provide a complete array of primary care services (health maintenance, preventive care, psychological care, urgent care, sports medicine, women’s health, newborn and pediatric care, obstetrical care, delivery, hospital care and geriatrics). There were 16 graduates from this program in 2007. The programs are providers for public aid members (45% of those served receive public aid), allowing access to a network of specialists to whom these patients may not otherwise have access.
Adventist Midwest Health also affiliates with multiple colleges/universities to provide clinical training in nursing, speech pathology, nutrition care, radiology and laboratory services to name a few. Over 33,000 hours of clinical training was provided throughout Adventist Midwest Health entities in 2007.
Community Benefit: Resources Provided and Planned
22

Research
Research (Community Need: Evidence-based treatment of chronic disease and cancer)
Adventist Midwest Health supports research in two important ways: through (1) the Research Review Board (RRB); and (2) the Cancer Program and Data Management.
Research Review BoardThe Research Review Board is comprised of Physicians, Clinicians, Pastoral Care Staff, Community Members, and other Administrative staff with the sole purpose of protecting the safety and welfare of human subjects in research. The federal government is very involved in the regulation of the research process in healthcare. In order for research to occur at any Adventist Midwest Health entity, a thorough review and approval process is required by a Research Review Board. Through the commitment and expertise of physicians, Adventist Midwest Health Staff, and community members, there are over 181 active research studies in progress today, with 56 new protocols in 2007.
Cancer Program and Data ManagementOur centers are two of among just 25 cancer programs in Illinois to be approved as Comprehensive Community Hospital Cancer Programs by the Commission on Cancer of the American College of Surgeons – the highest distinction given to a community hospital. Our team of data management experts work closely with physicians, administrators, researchers, and health care planners to provide support for cancer program development, ensure compliance of reporting standards and serve as valuable resource for cancer information with the ultimate goal of preventing and controlling cancer. The data management process allows us to provide completed information of care to use in quality management projects, benchmarking comparisons and monitoring of outcomes.
(Goal) Support research activities conducted primarily to advance medical or healthcare services through Research Review Board and Cancer Data Management functions.
(Objective) RRB and Cancer Data Management support of 181 active research studies, with a minimum of 50 new protocols in 2008.
Community Benefit: Resources Provided and Planned
23

Other Community Benefits
Other Community Benefits
(Goal) Ongoing evaluation of the Community Benefit Program for Adventist Midwest Health, with prioritization and provision of service based on identified need.
(Objective) Provide support for the following: (1) Public Aid Assistance; (2) Discharge medications to indigents; (3) Transportation services for individuals with identified needs; and (4) Pastoral care services to patients, family, staff and the broader community; (5) Participation in Cover the Uninsured; (6) Participate in 2008 medical mission trip to Pena Blanco, Honduras.
Community benefits come in many packages; Dedicated service, spiritual enrichment, educational forums, community emergency preparedness, newsletters, sponsorship of community events, cash, and research to name a few. There are a host of community benefits provided by Adventist Midwest Health that do not “tuck neatly” under other categories identified by the State of Illinois for reporting. For that, the category “other community benefits” is reserved. Adventist Midwest Health is committed to serving the public need, whether it is for assistance in connecting with a community resource (Public Aid enrollment services, Illinois efforts with “Cover the Uninsured”) or providing needed discharge medications and transportation home for patients lacking these resources, we stand ready to serve. Our faith-based operations provide opportunities for community members, patients and their friends and family to join forces and promote the best in healthy outcomes.
“…for I was hungry and you gave me food, I was thirsty and you gave me something to drink, I was a stranger and you welcomed me, I was naked and you gave me clothing, I was sick and you took care of me, I was in prison and you visited me.” Matthew 25:35-36
Community Benefit: Resources Provided and Planned
24

Community Needs AssessmentAdventist Midwest Health
25

Community Needs Assessment: Outcomes
2005-2010 We Plan: Suburban Cook County Assessment and Planning
Demographic and Economic Indicators : Changes since 1990
Census increase in SW district by 10.5% In SW district, 24.7% of students are low-income
Hispanic population has doubled Payer mix in SCC follows: 40.7% Medicare; 13.4% Medicaid; 42.4% Private Insurance; 3.5% Charity and Private Pay
Unemployment in SW residents has risen from approximately 4.7% to 5.8%.
In SW district, 13.6% of residents are uninsured;
In SW district, median household income dropped by .85% from 1989-1999 (adjusted for inflation)
Percent of population living in poverty has decreased (to 5.2%)
Asian population has doubled
White population has decreased by 13.5%
No significant change in ratio of males to females
Age in SW district increased by 3.6% (average age = 34.9 years)
2005-2010 We Plan; Suburban Cook County (SCC) Assessment and Planning for Public Health PartnersA systematic collection and analysis of data was competed by the local public health system as a basis for decision making and community strategic planning.
26

Health Trends Identified since 1994
Decrease in overall death rate (down by 1.9%). Leading Causes of Death: Heart Disease; Cancer and Stroke
Overall decrease in teen births
Low rate of vaccine-preventable diseases (diptheria, measles, mumps, rubella and whooping cough)
Incidence of TB has remained stable
Decrease in cases of West Nile Virus
Increase in chlamydia and gonorrhea (up 200% and 73% respectively)
Increase in hospitalization due to diabetes (up 16.2%)
Increase in hospitalization due to psychoses (up 13.9%)
Decrease in deaths due to homicides (down 8%)
Decrease in deaths due to infant mortality (down 9.9%)
Decrease in deaths due to cirrhosis (down 33.9%)
Decrease in deaths due to HIV/AIDS (down 44.2%)
Decrease in deaths due to cancer (down by .3%)
Decrease in deaths due to firearm mortality (down by 4.3%)
Decrease in deaths due to heart disease (down 4.9%)
Decrease in deaths due to cerebrovascular disease (down 6.1%)
2005-2010 We Plan: Suburban Cook County Assessment and Planning
Community Needs Assessment: Outcomes
27

Community Needs Assessment: Outcomes
Providers and Residents Identified Major Health Problems facing Community
Depression: Believed by residents and providers to be a serious problem in the community. Hospital admission for mental health treatment has increased.
Alcohol/Drug Use: Crime and violence were identified as factors that reduced the health quality of the community, with alcohol and drug abuse as the most important safety issues.
Diabetes: 5.6% of the adult population in SCC have diabetes.
Obesity: Risk factor for a number of diseases and can be a major contributor to both adverse physical and mental health. Estimated prevalence of obesity was 19.4% in 2002.
Smoking: Leading cause of preventable chronic disease mortality. Causes more than 1,200 annual deaths in Cook County. 19.5% of population are current smokers.
Lack of Exercise: Only 2 of 5 residents meet criteria for physical activity. 20% are considered inactive.
Lack of Nutritional Foods
STDs/HIV/AIDS: HIV Incidence rates were higher for both Hispanics and blacks as compared to whites. HIV related mortality decreased by nearly half between 1995 and 2002. Chlamydia and gonorrhea rates have both significantly increased since 1995.
2005-2010 We Plan: Suburban Cook County Assessment and Planning 28

Community and Provider:Forces of Change Assessment
Description
Disparate Economic and Social Conditions
Inadequate public transportation; Unemployment and underemployment; Lack of business development; sense of general apathy
Housing Disparities Lack of affordable housing; increase in homelessness; lead poisoning in older homes
Safety Issues Lack of gun control; lack of police presence; schools built close to factories; drug dealing; poor municipal maintenance
Inconsistent Citizen Participation Public unaware of available services; apathy; disengagement from government; elderly becoming invisible population; parents working late hours
Aging Population Inadequate supply of affordable senior housing; LTC needs
Changing Demographics in the Community
Language barriers to services; segregation, racism and police discrimination; increase in multicultural backgrounds; growing number of elderly
Access to Health Care Inadequate resources to provide primary and mental health services; cultural/linguistic barriers; widening gap between private and public insurance; high cost of health care; loss of doctors due to high cost of malpractice; higher utilization of hospital ERs; changes in acceptance for insurance plans by providers
Health Care Funding Prioritizes Medical Care Services over Primary Prevention Efforts
Lack of prevention programming; unequal community access to risk reduction
Need for More Public Health System Partnerships
Duplication of services due to competition for resources; ineffective regular communication with system partners
2005-2010 We Plan: Suburban Cook County Assessment and Planning
Community Needs Assessment: Outcomes
29

Community Needs Assessment: Outcomes
Three Priority Health Indicators Identified by Cook County Health Dept.
Cook County Health Department Plan
Chronic Disease: More SCC residents living with the burden of chronic disease (heart disease, asthma, diabetes, cancer, depression and oral health disease). Type 2 diabetes due to obesity has additionally significantly impaired public health.
Prevent and reduce the onset of type 2 diabetes in SCC, so that the prevalence rate is reduced by 15% (baseline = 5.6%).Prevent and reduce obesity so that no more than 17% of adults are determined to be obese (baseline = 19.4%). Intervention Strategies: Improve physical activity levels for all ages to meet CDC recommendations of 30 minutes of moderate physical activity 5 days/week. Expand access to public facilities and programs that enhance opportunities for physical activities. Enlist community participation.
Access to Health Care: Access to healthcare is a critical determinant in staying healthy. SCC residents responded that they experienced difficulties accessing health care services due to (1) rising cost of services and medications; (2) lack of private insurance; (3) incomplete insurance coverage; (4) long wait times; (5) inadequate capacity of providers; and (6) language barriers
Reduce the proportion of people in SCC without a primary care provider by 5%. Reduce preventable primary care visits to hospital emergency rooms by 5%.Intervention Strategies: Increase recruitment of bilingual staff. Develop usable
communication format of available community resources (directory). Increase opportunities for health providers to improve cultural competencies. Expand outreach and resident awareness of SCC health resources
Prevent and reduce homicides in 15-24 year olds by 20% in SCC.Intervention Strategies: Expand Safe Havens in neighborhoods to provide for positive after-school activities for children. Parent education. Increase opportunities for culturally competent and accessible parent education. Increase a sense of community through environmental and policy recommendations
Violence: Violent acts in the community threaten the quality of life as well as the mental well being of many people in SCC. Violence, crime and abuse are the primary indicators.
2005-2010 We Plan: Suburban Cook County Assessment and Planning 30

Community Needs Assessment: Outcomes
Illinois Project for Local Assessment of Needs 2010: DuPage County Community Health Plan (2005)
Illinois Plan for Local Assessment of needs (IPLAN)A community health planning process for identifying priority health issues, and for mobilizing community coalitions and partnerships to address these issues.
Rank order of Strategic Health Issues
1. Address obesity and overweight among county residents
2. Develop capacity to meet the mental health needs of county residents
3. Assure access to essential health services for low-income uninsured county residents
4. Develop capacity to meet the substance abuse needs of county residents
5. Address family violence among county residents
6. Decrease tobacco use among county residents
7. Decrease health disparities among racial and ethnic minorities in DuPage County
8. Decrease the incidence and impact of asthma among county residents
9. Address the growing health needs of frail low-income county seniors
10.Appropriately respond to the threat of terrorism in DuPage County
31

Community Needs Assessment: Outcomes
Obesity and Overweight: Second leading cause of premature death in the US. Increases risk for heart disease, high blood pressure, diabetes, arthritis-related disabilities and some cancers. Priority is “How can the health problems of overweight and obese individuals be prevented and treated in DuPage County?”. Risk factors include improper nutrition and physical inactivity. Outcome objective: by 12/31/10, increase the proportion of DuPage County residents who are at a healthy weight to 60 percent.
Mental Health: Depression and anxiety disorders affect a large number of DuPage County residents, both adults and children. 118,913 DuPage County adults were affected by mental illness in 2000. Priority is defined as the following: “How can DuPage County develop the capacity to meet the mental health needs of county residents?”. Risk factors include insufficient screening; insufficient treatment services; low community awareness; and stigmatization. Outcome objective: by 12/31/10, increase the proportion of DuPage County adults and children with mental health problems who receive treatment to 30 percent.
Access to Essential Health Services: Having access to quality health services may be the single most important determinant of health status. According to DuPage County residents, health care access is one of the most important factors for creating a healthy community. Use of clinical preventive services, such as early prenatal care, can serve as indicators of access to quality health care services. Priority is defined as the following: “How can DuPage County assure access to essential health services for low-income, uninsured county residents?”. In 2000, 5.3% of the adult population and 3.7% of the child population in DuPage County had no health insurance. Additionally, 12.3% of the adult population had no usual source of health care. Risk factors include: lack of health insurance; poverty; unemployment; minority race or ethnicity; employed in service and trade industries; employed in firms with fewer than 100 employees; generosity/inclusiveness of public insurance programs; overall HMO penetration; Medicaid managed care penetration; communities underserved by primary care physicians. Outcome objective: by 12/31/10, DuPage County will have the capacity to provide access to essential health services outside of the current mainstream health system to 30,000 low-income residents in DuPage County.
DuPage County Health Department Top Three Priorities: Rationale and Objectives
Illinois Project for Local Assessment of Needs 2010: DuPage County Community Health Plan (2005) 32
Community Needs Assessment: Outcomes
Will County Health Department Community Health Needs Assessment and Plan
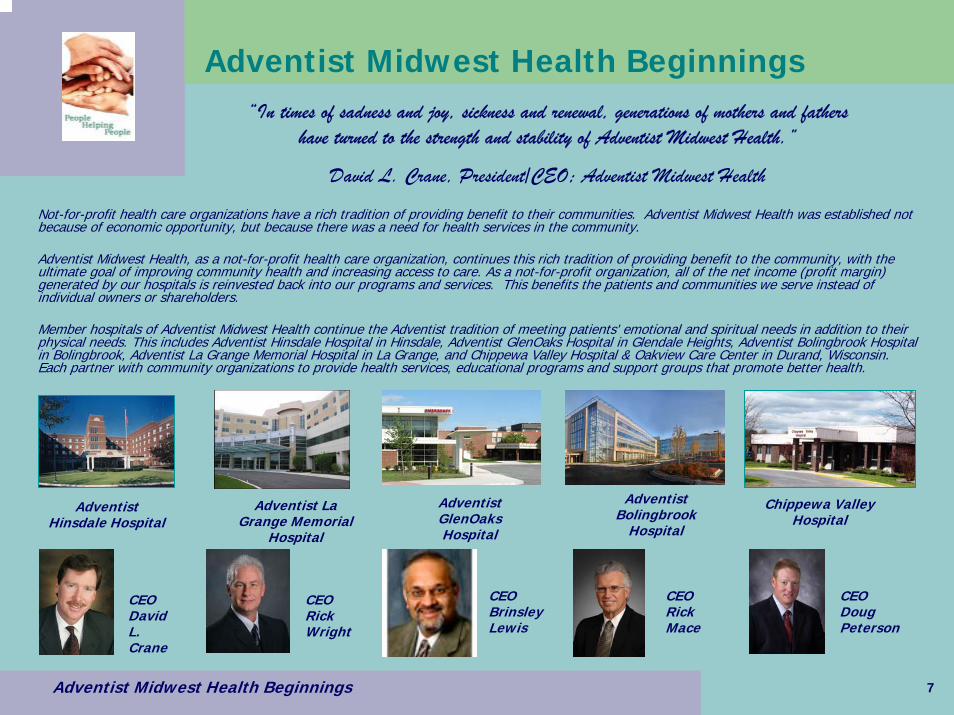
Will County Health Department Community Health Needs Assessment and PlanGoal of health planning is to improve the overall health of the community by improving health status and through systems, change the way in which health care is provided.
Demographic and Socioeconomic Characteristics
Race/Ethnicity: (1997 Census estimate) 80% white non-Hispanic; 12% Black; 7% Hispanic; 2% Asian/Pacific Islander. Majority of Hispanics are of Mexican ancestry. Many undocumented Hispanics in Will County.
Social: Social commitments in Will County are reflected in 306 human services agencies, 88 licensed childcare centers, 7 adult care centers, 20 nursing/extended care homes, 279 churches, one synagogue and an array of social and civic organizations.
Age: Median age is 31.1 (younger than the state (32.8) and nation (32.9).
Behavioral: According to the Behavioral Risk Factor Survey in 1997, the percentages for obesity (22.7%); sedentary lifestyle (22.6%) and smoking (24.3%) are all lower than the IL rates.
Income and Poverty: Median income is $52,278. Estimate for people of all ages in poverty is 6% for Will County and 11.3% for Illinois.
Leading Cause of Death (rank order): Heart disease; Malignant Neoplasms; Cerebrovascular Disease; COPD; Unintentional Injuries; Pneumonia/Influenza; Diabetes; Cirrhosis; Suicide; andHomicide.
Marriage/Divorce: 55% divorce rate is higher than the state (42.3) and nation (49.7).
Education: Proportion of residents aged 25 and older not completing high school (19.7%) was lower than the state (23.9%) and nation (24.8%).
Maternal Child Health: Birth rate of 15.6 per 1,000 population (higher than the state (15.2) and nation (14.6). Teen births (8.6%) are lower than the state (12.5%) and nation (12.8%). Infant mortality rate in 1997 was 7.5 per 1000 live births, lower than the state rate of 8.2, but higher than the nation (7.1).
33
Community Needs Assessment: Outcomes
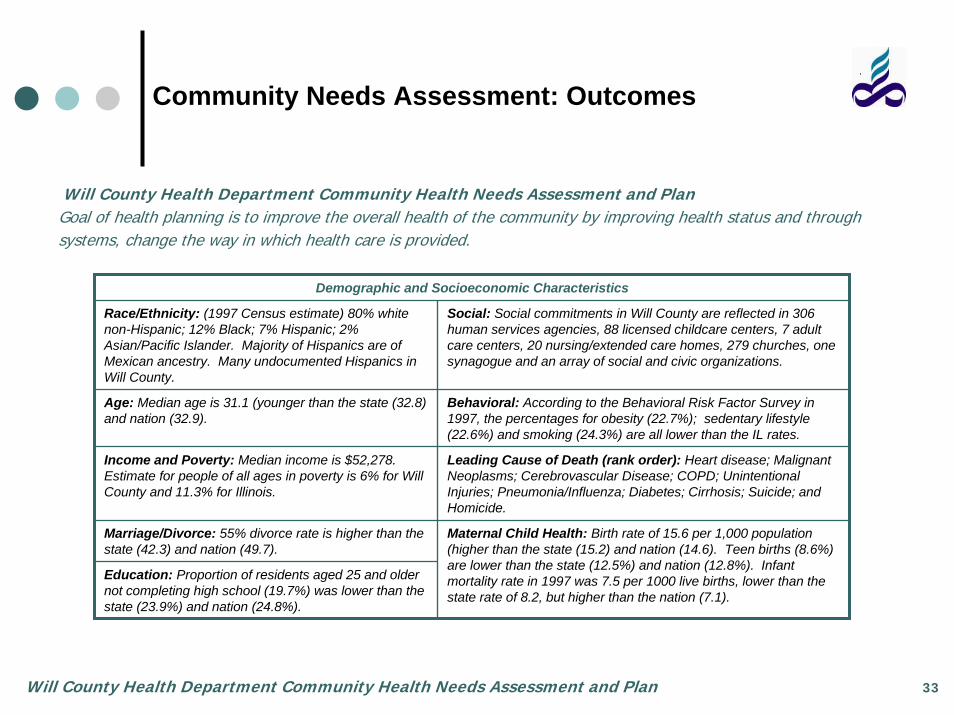
Will County Health Department Community Health Needs Assessment and Plan
Health Care Priorities Will County Initiatives
Adolescent Health Issues related to teenage pregnancy, sexually transmitted diseases, and substance abuse. Consequences of teenage pregnancy include reduced educational attainment; unemployment and increased risk of welfare dependence. 25% of all new cases of STDs occur in teens. The risk for heart disease, stroke, hypertension, unintentional injuries, crime, cirrhosis, HIV, and hepatitis B and C increases when substance abuse is present.
Objectives: Reduce teen births by 10%; Reduce chlamydia and gonorrhea to no more than 274 cases/year. Increase percentage of youth that remain alcohol free (30%) and drug free (70%).Strategies: Implementation of youth tobacco prevention programs and campaigns. Speakers Bureau to provide speakers to the schools and community groups to address adolescent health topics. Implementation of a teen advisory council.
Heart Disease and related risk factors. Ranked as the #1 cause of death in Will county. There are seven (7) primary risk factors associated with heart disease: smoking; obesity; hypertension; diabetes; stress; high cholesterol and sedentary lifestyle.
Objectives: Reduce coronary heart disease deaths to 125/100,000 people.Strategies: Educational and Community-Based Programs targeting those at most risk for heart disease and promoting healthy behaviors (includes church-based education; screenings; health fairs).
Violence including issues related to domestic/family violence and street/community violence. The underlying risk factors for violence are poverty, substance abuse, child abuse and lack of education.
Objectives: Reduce incidents of domestic/family violence by 10% throughout Will County; Reduce incidents of street and community violence by 10%.Strategies: Develop and expand existing programs to reduce domestic violence including hospital assessments and screening, school programs, domestic violence team presentations, etc. Distribute information of prevention and resources for services to 25% of population.
Access to Primary and Preventive Care: Lack of medical coverage and lack of medical providers for Medicaid clients weremajor issues of concern. Residents identified the following barriers: refusal of Medicaid; distance and access to transportation; inability to pay; language; consumer attitudes of acute vs. preventive care.
Strategies: Access to Care committee was formed to identify priorities, overcome barriers to access and to propose solutions; KidCare outreach efforts; tax counseling for low-income families.
34

Community Needs Assessment: Outcomes
Ten Essential Facts about Poverty in DuPage County
The number of low income residents in DuPage County is steadily increasing: 14% of the DuPage County residents are at or below 200% of the Federal Poverty Level. This represents a 38% increase since 2000.
In Illinois, poverty is moving to the suburbs. In Suburban Cook County, the poverty population has increased 44% since the 1990 census. In DuPage County, the poverty population has increased 138% since the 1990 census.
DuPage County is becoming increasingly diverse. There is a 96% increase in African Americans, a 122% increase in the Asian population, and a 184% increase in the Hispanic or Latino population since the 1990 census.
Nearly all of the population growth in DuPage County is among the immigrant, low income and minority populations.
Unemployment in DuPage County, though low by national standards,remains at a relatively high level compared to historical trends. In Cook County, the current unemployment rate is 6.6%. In DuPage County, the current unemployment rate is 4.9%.
DuPage County is the only metropolitan Chicago county where median income is declining. In DuPage County, there has been a .56% average decrease in median income. In Cook County, there has been a 4.36% average increase in median income since 2000.
Use of Food Stamps, Medicaid and Kid Care is growing. There has been a 43% increase in households receiving food stamps, and a 48% increase in households receiving Medicaid.
The number of people with limited English proficiency is significantly increasing. The number of people speaking English “less than very well”has increased 168% since 1990.
The number of households paying more than 30% of their income for rent has increased to 3.6% since the 2000 census (a 51% increase).
Homelessness is a serious problem in DuPage. Significant percentages of the Homeless are working. There has been a 115% increase in the number of persons receiving homeless prevention services since 2001.
The above ten essential facts were compiled by the DuPage Federation on Human Services based on Census population estimates for 2004.
Ten Essential Facts about Poverty in DuPage County
35

Community Needs Assessment: Outcomes
Effect of Population Aging on Future Hospital Demand
Effect of Population Aging on Future Hospital Demand by Bradley C. Trunk, Paul B. Ginsburg, and Michelle I. Banker
A simulation of future spending finds that aging will not be the strongest influence on inpatient hospital use.
Data Analysis: Study predicts how shifts in the age distribution of the U.S. population, reflecting both the aging of the baby-boom generation and increased longevity, will affect demand for hospital inpatient services during the next ten years (seeking to isolate the effect of population aging).
Study Findings: Despite popular thought on the topic, the age distribution of the population shifts very slowly from one year to the next (between 2005 and 2015, the average age of people in the US will increase from 36.5 to 37.9). This slow growth limits the magnitude of the impact on utilization overall.
However, there are some diseases which are more impacted by aging than others (diseases of the circulatory and respiratory systems will drive utilization substantively more than other diseases).
Advancing technology was found to impact utilization of inpatient hospital services more than aging.
Implications: Focus on disease prevention and early detection of diseases of the circulatory and respiratory system for the elderly.
36

Community Needs Assessment: Outcomes
America’s Health Rankings (2005 Edition) A Call to Action for People and Their CommunitiesFunded by the United Health Foundation in partnership with the American Public Health Association and the Partnership for Prevention. Based on data from the US Departments of Health and Human Services, Commerce, Education, and Labor, the National Safety Council and the National Association of State Budget Officers. Represents a 16-year perspective on health, tracking improvements in overall health over time.
Purpose: To stimulate public conversation concerning health in our states, as well as provide information to facilitate citizen participation
Premise: In addition to the contribution of our individual genetic predispositions to disease, health is the result of the following three factors:
1. Personal Behaviors: Everyday decisions individuals make that affect personal health. Includes habits and practices developed as individuals and families that have an effect on personal health and utilization of health resources.
2. Community Environment: Daily conditions in which people live their lives have a great effect on achieving optimal individual health.
3. Health Policies: Indicative of the availability of resources and the extent of reach of public health programs into the general population.
4. Clinical Care: All treatments received through health care providers (not addressed further in this report)
5. Outcomes: Provides a basis of community resource need centered on issues of personal behaviors, community environment and health policy.
America’s Health Rankings (2005 Edition) A Call to Action for People and Their Communities 37

Community Needs Assessment: Outcomes
America’s Health Rankings (2005 Edition) A Call to Action for People and Their Communities
Measure Changes from 1990 to 2005
Success: Motor Vehicle Deaths 40% decrease in the rate of MVA deaths from 2.5 to 1.5 deaths per 100,000,000 miles driven
Success: Infectious Disease 40% decrease in the incidence of infectious disease from 40.7 to to 24.6 cases per 100,000 population
Success: Infant Mortality 34% decrease in the infant mortality rate from 10.2 to 6.7 deaths per 1,000 live births
Success: Prevalence of Smoking 30% decline in the prevalence of smoking from 29.5 to 20.8% of the population
Success: Violent Crime 24% decline in the violent crime rate from 609 to 466 offenses per 100,000 population
Success: Cardiovascular Deaths 18% decline in the rate of cardiovascular deaths from 406.3 to 332.9 deaths per 100,000 population
Success: Limited Activity Days 52% decline in the number of limited activity days per month from 4.4 to 2.1 days in the previous 30 days.
Challenge: Prevalence of Obesity 99% increase in the prevalence of obesity from 11.6 to 23.1% of the population.
Challenge: Lack of Health Insurance 17% increase in the percentage of uninsured population from 13.4% to 15.7%. An additional trend noted from 2004-05 is the percent of children in poverty (17.8% of kids under age 18).
Challenge: High School Graduation 6% decrease in the HS graduation rate from 72.9 to 68.3 percent of incoming ninth graders who graduate within four years
38

Illinois ranks 28th out of 50 overall as the healthiest state. This compares with a ranking of 29 in 2004 and 29 in 1990.
Community Needs Assessment: Outcomes
America’s Health Rankings (2005 Edition) A Call to Action for People and Their Communities
Component Measure Illinois 2005 Rank/(Outcome)
Illinois 2004 Rank/(Outcome)
Illinois 1990 Rank/(Outcome)
Prevalence of Smoking 32 (22%) 32 (24%) 19 (29%)
Motor Vehicle Deaths; per 100,000,000 miles driven 16 (1.3) 17 (1.4) 26 (2.4)
Prevalence of Obesity 23 (23%) 27 (23%) 17 (11%)
High School Graduation 25 (72%) 25 (72%) 21 (78%)
Violent Crime; per 100,000 population 40 (543) 43 (621) 47 (795)
Lack of Health Insurance 21 (14%) 28 (14%) 18 (10%)
Infectious Disease; per 100,000 population 32 (22) 32 (22) 19 (28)
Children in Poverty; percent under age 18 30 (18%) 31 (17%) 34 (22%)
Occupational Fatalities; per 100,000 workers 9 (4) 9 (4) 15 (*8.3)
Per Capita Public Health Spending;$ per person 12 ($190) 11 ($201) no data
Immunization Coverage; children 19-35 months 18 (83%) 13 (83%) no data
Adequacy of Prenatal Care 22 (77%) 24 (76) no data
Limited Activity Days; # of days in previous 30 days 9 (1.8) 14 (1.9) 18 (*3.6)
Cardiovascular Deaths; per 100,000 population 31 (334.5) 31 (343.4) 41 (430.3)
Cancer Deaths; per 100,000 population 38 (212.8) 39 (213.7) 35 (206.8)
Total Mortality; per 100,000 population 30 (869.8) 31 (875.9) 31 (901.7)
Infant Mortality; per 100,000 live births 31 (7.2) 31 (7.4) 46 (11.9)
Premature Death; per 100,000 population 24 (7,573) 27 (7,585) 31 (8,791)
Health Outcomes
Health Policies
Community Environment
Personal Behaviors
39

Community Needs Assessment: Outcomes
America’s Health Rankings (2005 Edition) A Call to Action for People and Their Communities
American Academy of Family Physicians Personal Behaviors that can Improve Health
•Avoid any form of tobacco
•Eat a health diet
•Exercise regularly
•Drink alcohol in moderation, if at all
•Avoid use of illegal drugs
•Practice safe sex
•Use seat belts (and car seats for children) when riding in a car or truck
•Avoid sunbathing and tanning booths
•Keep immunizations up-to-date
•See a doctor regularly for preventive care
40

Community Needs Assessment: Outcomes
America’s Health Rankings (2005 Edition) A Call to Action for People and Their Communities
Recommendations for Community Action: M-A-P-I-T
MOBILIZE individuals and organizations, which care about the health of your community, into coalition
ASSESS the areas of greatest need in your community, as well as the resources and other strengths that can be tapped into to address these areas
PLAN your approach: Start with a vision of where you want to be as a community, then add strategies and action steps to achieve vision
IMPLEMENT your plan using concrete action steps that can be monitored and will make a difference
TRACK your progress over time
41

Community Needs Assessment: Outcomes
Trends Affecting Hospitals and Health Systems (2007)
TRENDWATCH: Trends Affecting Hospitals and Health Systems: American Hospital Association and the Lewin GroupCompilation of health care statistics that provide a basis for planning and addressing provision of service and community need. Designed to provide research and analysis of important and emerging trends in the hospital and health care field. Trends important when considering community benefit are below.
Report Summary
The Lewen Group and the American Hospital Association combine forces to provide trended data relative to trends in the overall health care market; organizational trends; trends in hospital financing; and workforce.
This data assists health care organizations in analyzing resource trends to optimally achieve the organizational Mission of caring for the community.
42

Community Needs Assessment: Outcomes
Trends Affecting Hospitals and Health Systems (2007)
1. Trends in Overall Health Care MarketConsumer Out-of-Pocket Payments for National Health Expenditures: Since 1990, consumer payment has increased from just under $140 billion to over $220 billion.
Percent Uninsured: Has risen steadily since 2000 (just under 16% nationally)
Medicare and Medicaid enrollees: Has increased steadily since 1990 to 41.4 million (Medicare) and 57.3 million (Medicaid).
2. Organizational Trends: Number of Community Hospitals: Decreased over past 25 years by approximately from 5,830 to 4,919 nationally.
3. Utilization and VolumeHospital Emergency Department Visits/1,000 Persons: Steady increase since 1991 (approximately 350/1,000 to 380/1,000 persons).
Percent of Hospitals Reporting Emergency Department Capacity: 48% of hospitals report having EDs that are at capacity (23%) orover capacity (25%),
4. Trends in Hospital FinancingPercentage of Hospitals with Negative Total Margins: Averages between 25-30% over past five years.
Hospital Payment Shortfall Relative to Costs Medicare, Medicaid and Other Government: Has transitioned from just under positive $5 billion in 1997 to approximately negative $23 billion in 2004, with Medicare shortfalls predominating.
5. WorkforceTotal Number of Active Physicians per 1,000 Persons (1980-2003): Has increased from 1.9 to 2.7.
Number of RN FTEs per Adjusted Admission (1987-2004): Has decreased from .020 per adjusted admission to .018. Nurses have increased as the percentage of total hospital employees in the past five years.
43
Community Needs Assessment: Outcomes
Healthy People in Healthy Communities: A Community Planning Guide Using Healthy People 2010
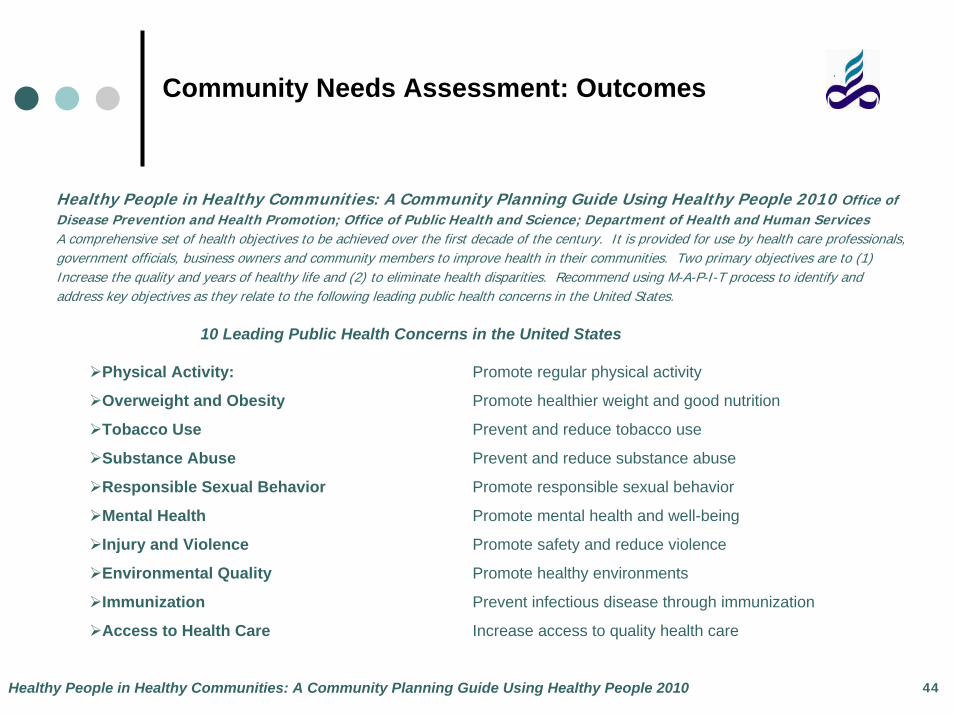
Healthy People in Healthy Communities: A Community Planning Guide Using Healthy People 2010 Office of Disease Prevention and Health Promotion; Office of Public Health and Science; Department of Health and Human ServicesA comprehensive set of health objectives to be achieved over the first decade of the century. It is provided for use by health care professionals, government officials, business owners and community members to improve health in their communities. Two primary objectives are to (1) Increase the quality and years of healthy life and (2) to eliminate health disparities. Recommend using M-A-P-I-T process to identify and address key objectives as they relate to the following leading public health concerns in the United States.
10 Leading Public Health Concerns in the United States
Physical Activity: Promote regular physical activity
Overweight and Obesity Promote healthier weight and good nutrition
Tobacco Use Prevent and reduce tobacco use
Substance Abuse Prevent and reduce substance abuse
Responsible Sexual Behavior Promote responsible sexual behavior
Mental Health Promote mental health and well-being
Injury and Violence Promote safety and reduce violence
Environmental Quality Promote healthy environments
Immunization Prevent infectious disease through immunization
Access to Health Care Increase access to quality health care
44

“In times as difficult and demanding as these, securing the trust of the public in the nation’s hospitals is paramount. Even if a hospital’s connection to the community already is strong, it must be bolstered. It
it’s weak, it must be strengthened. If it’s broken, it must be fixed.” Trust Counts Now
Community Needs Assessment: Outcomes
Trust Counts Now: hospitals and Their Communities
Trust Counts Now: Hospitals and Their Communities A Report to the American Hospital Association by John G. King and Emerson Moran There is a disconnect between what hospitals believe are the issues and what patients experience in the hospital. 28% fewer feel our health care system is meeting their needs than five years ago (McInturff, May 2004); 60% do not completely trust hospitals to do the right thing for patients (Harris, January 2004); 55% fear they will be harmed during a hospital stay (Health Pulse, May 2003). Seven Hospital models for building community trust are provided.
10 Characteristics Model Hospitals Share to Build Public Confidence in Mission and Dedication to Patients and the Community
1. Tradition of Energetic, visionary and innovative leadership
2. Relate own well-being to the health of the community
3. Stay true to their core values while changing and improving
4. Place patients and principle first
5. Good at their business – but business isn’t all they do
6. See beyond limited role as providers of acute care
7. Collaborate with others to solve basic community problems
8. Dedicate fiscal and human resources to improving the community’s quality of life
9. Communicate with the community – and listen to the community
10. Respected locally and nationally
45

Community Needs Assessment: Outcomes
Immigrants at Mid-Decade: A Snapshot of America’s Foreign-Born Population in 2005
Immigrants at Mid-Decade: A Snapshot of America’s Foreign-Born Population in 2005 by Steven A. Camarota
of the Center for Immigration Studies. An analysis of Census Bureau data shows that the nation’s foreign-born population (legal and illegal) reached a new record of more than 35 million in March of 2005. 2000-2005 represents the highest five-year period of immigration in American history.
Study Findings
1. Nearly half of post-2000 immigrant arrivals (3.7 million) are estimated to be illegal aliens
2. Immigrants account for 12.1 percent of the total population (the highest percentage in eight decades)
3. Of adult immigrants, 31 percent have not completed high school (3.5 times the rate for natives)
4. The proportion of immigrant-headed households using at least one major welfare program is 29 percent compared to 18 percent for native households.
5. The poverty rate for immigrants and their U.S.-born children is 28.4%, 57% higher than for natives and their children.
6. One-third of immigrants lack health insurance (2.5 times the rate of natives).
*Low educational attainment of many immigrants and resulting low wages are the primary reasons so many live in poverty, use welfare programs, or lack health insurance, not their legal status
or an unwillingness to work.
46

“….it is now widely realized that our supposedly once-homogenous population has blossomed into a coat of many colors, faiths, cultures, languages – and expectations.” Emily Friedman
Community Needs Assessment: Outcomes
White Coats and Many Colors: Population Diversity and its Implications for Health Care
White Coats and Many Colors: Population Diversity and its Implications for Health Care by Emily Friedman;
Independent Health Policy and Ethics Analyst; an Issue Briefing Prepared for the American Hospital Association When populations change, some areas of society are affected more quickly than others. However, the impact is realized immediately in both health care and education. A summary of America’s immigrant population is provided along with the implications these findings have on community need and health care delivery.
Study Findings
1. Today, one in four Americans is a member of a racial or ethnic minority group (projected to one in two Americans by 2070).
2. In 2003, Latinos became the largest minority group in the US, passing African-Americans and numbering nearly 40 million.
3. The second largest urban Mexican-American population is in Chicago.
4. Determinants of disparity include (1) genetic factors; (2) concomitant disease; (3) financial status; (4) access to care and coverage.
5. In many communities, members of minority groups are in greater need of preventive services.
6. In the future, the population over 65 will be far more diverse and the majority of them will be women (70% of those over 85 will be women).
7. Lack of public funding for health care for immigrants is a serious problem for many providers.
47
Community Needs Assessment: Outcomes
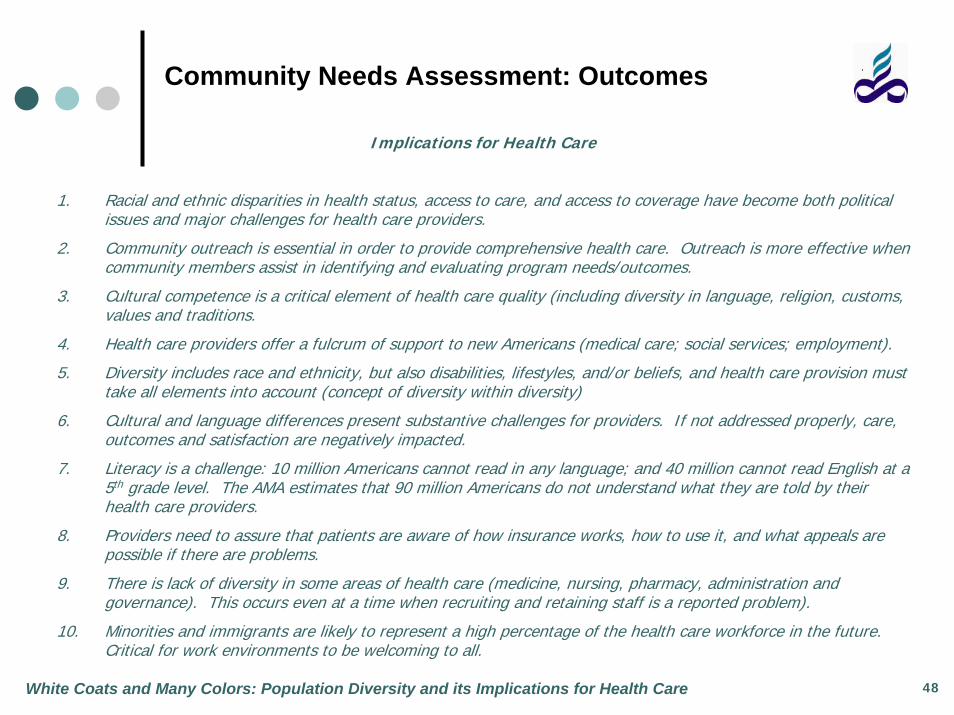
Implications for Health Care
1. Racial and ethnic disparities in health status, access to care, and access to coverage have become both political issues and major challenges for health care providers.
2. Community outreach is essential in order to provide comprehensive health care. Outreach is more effective when community members assist in identifying and evaluating program needs/outcomes.
3. Cultural competence is a critical element of health care quality (including diversity in language, religion, customs, values and traditions.
4. Health care providers offer a fulcrum of support to new Americans (medical care; social services; employment).
5. Diversity includes race and ethnicity, but also disabilities, lifestyles, and/or beliefs, and health care provision must take all elements into account (concept of diversity within diversity)
6. Cultural and language differences present substantive challenges for providers. If not addressed properly, care, outcomes and satisfaction are negatively impacted.
7. Literacy is a challenge: 10 million Americans cannot read in any language; and 40 million cannot read English at a 5th grade level. The AMA estimates that 90 million Americans do not understand what they are told by their health care providers.
8. Providers need to assure that patients are aware of how insurance works, how to use it, and what appeals are possible if there are problems.
9. There is lack of diversity in some areas of health care (medicine, nursing, pharmacy, administration and governance). This occurs even at a time when recruiting and retaining staff is a reported problem).
10. Minorities and immigrants are likely to represent a high percentage of the health care workforce in the future. Critical for work environments to be welcoming to all.
White Coats and Many Colors: Population Diversity and its Implications for Health Care 48

Community Needs Assessment: Outcomes
Real People; Real Stories. A Detailed Description of Illinois/ Uninsured
1. Illinois Insurance Status (ages 0-64): 74.2% Private; 10% Public; 15.8% uninsured.
2. Illinois Insurance Status (ages 0-18): 71% Private; 16.9% Public; 12% uninsured.
3. Illinois Uninsured by Race and Ethnicity: White, Non-Hispanic (11.4%); African-American (23.7%); Hispanic (28.9%); Other (15.1%).
4. Chicago Metro Insurance Status (ages 0-64): 82.3% Private; 4.5% Public; 13.2% Uninsured.
5. Chicago Insurance Status (ages 0-18): 84.6% Private; 6.2% Public; 9.2% Uninsured.
6. Chicago Metro Uninsured by Age: 0-18 9.2%; 19-29 25.6%; 30-49 12.2%; 50-64 10.1%.
Real People; Real Stories. A Detailed Description of Illinois’ Uninsured. A project of United Power for Action and Justice; Gilead Outreach and Referral Center (March 2006).
“It is misguided and even dangerous to assume that lack of health insurance harms only those who are uninsured. The rest of the community pays for uncompensated medical care either directly or indirectly, and high rates of uninsurance can strain community health systems to the point that important services have to be
cut or elminated.” Arthur Kellermann, “A Shared Destiny: Community Effects of Uninsurance”Institute of Medicine, 2005.
49

Community Needs Assessment: Outcomes
White Coats and Many Colors: Population Diversity and its Implications for Health Care
1. Increase by 50% the number of nurses and health professionals trained by 2010 statewide, with a total investment of between $40-50 million (additional 2,000 additional professionals trained per year in the eight-county metropolitan).
2. Increase recruitment and support for health professions candidates (increase awareness of health services careers; expand health careers education programs for grade- and high-school students, provide career counseling for current health care workers, additional scholarship funds, etc.).
3. Reduce regulatory barriers to expanding the health workforce (streamline and standardize training and credentialing requirements for licensing nursing and others trained outside of the U.S., revise regulations governing allied health professions faculty to allow case-by-case review of credentials of personnel with relevant advanced health degrees who may not meet strict faculty guidelines).
4. Continue improving working conditions to reduce turnover and increase job satisfaction (provide and support career paths, promote a culture of respect, reduce unnecessary paperwork, etc.).
Caring for the Future: A Plan for Meeting Metropolitan Chicago’s Growing Health Care Workforce Needs. Metropolitan Chicago Healthcare Council. The health consequences of allowing workforce shortages to develop are severe. A growing body of literature demonstrates that shortages of skilled health care workers lead to increased medical errors and poorer patient outcomes. Addressing the shortage requires a mojor and coordinated effort among health care providers, the education community, and government and business leaders.
“By 2020, Illinois will face a shortage of 21,000 registered nurses, about 19% of the projected demand. Two-thirds of these vacancies will be in the Chicago area.” Caring for the Future; Metropolitan Chicago
Healthcare Council
50

Community Needs Assessment: Outcomes
Anzalone Liszt Research: Chicagoland Healthcare 2005
Opportunities for Hospitals
• 40% of respondents believe that for-profit hospitals have a mission to provide care for the uninsured and poor and just 69% believe non-profit hospitals have a mission to provide care for the uninsured and poor.
• 52% believe hospitals should provide more charity care.
• 55% believe hospitals are more concerned with bottom line than quality care.
• 33% believe the biggest problem for hospitals in the cost of treating the uninsured. 52% believe hospitals should be doing more in this area.
• 39% believe nurses and support staff care for more patients than is safe.
• 18% of respondents did not know if the hospital they use most is for-profit or not-for-profit.
• 25% believe that State and federal government give hospitals fair payment
• 24% the greatest concern with going to the hospital to be waiting too long for treatment.
• 35% are very concern about errors or medical mistakes when they or a family member are admitted to the hospital.
• 41% are very concerned about losing their health insurance.
• 53% do not believe hospitals are ready to handle a crisis like bird flu or bioterrorism.
Anzalone-Liszt Research: Chicagoland Healthcare 2005 Results of research conducted based on interviews with six focus groups including a variety of Chicagoland health consumers is provided. The interviews were conducted around five elements of access to care. Results indicate that residents have soft perceptions of hospitals’ missions. Results afford hospitals an opportunity to understand and respond to community need for access, quality, timeliness of service, etc.
51

Community Needs Assessment: Outcomes
2008 Adventist Midwest Health Planning Report: Adventist Hinsdale Hospital
Primary Service Area
52

Community Needs Assessment: Outcomes
2008 Adventist Midwest Health Planning Report: Adventist Hinsdale Hospital
Demographic: Age
53
Age 2000 2007 200907-09
Change07-09
% Change
07-09Avg. Annual % Change
0-64 38,278 39,516 39,651 135 0.3% 0.2%65+ 33,141 32,960 33,781 821 2.5% 1.2%
Total 71,419 72,476 73,431 955 1.3% 0.7%
Age 2000 2007 200907-09
Change07-09
% Change
07-09Avg. Annual % Change
0-64 4,561 4,723 4,673 -50 -1.0% -0.5%65+ 779 674 692 18 2.7% 1.4%
Total 5,340 5,397 5,366 -31 -0.6% -0.3%
Age 2000 2007 200907-09
Change07-09
% Change
07-09Avg. Annual % Change
0-64 174 218 225 7 3.2% 1.6%65+ 918 528 538 10 1.8% 0.9%
Total 1,092 746 763 17 2.2% 1.1%
Rehab
Medical/Surgical
Psychiatry
Source: 2000 and 2007 is actual data from IHA COMPdata. 2009 is a projection based on data from Solucient

Community Needs Assessment: Outcomes
2008 Adventist Midwest Health Planning Report: Adventist Hinsdale Hospital
CardiologyAHH-Overall volume decline of 152 admissions-Largest increase in DRG 518 (+21)-Largest decline in DRG 143 (-38)Market-Overall volume decline of 602 admissions-Largest increase in DRG 555 (+95)-Largest decline in DRG 143 (-292)Open HeartAHH-Overall volume decline of 28 admissions-Largest increase in DRG 106 (+1)-Largest decline in DRG 547 (-9)Market-Overall volume decline of 79 admissions-Largest increase in DRG 108 (+5)-Largest decline in DRG 104 (-37)General SurgeryAHH-Overall volume decline of 46 admissions-Largest increase in DRG 569 (+29)-Largest decline in DRG 148 (-57)Market-Overall volume increase of 163 admissions-Largest increase in DRG 569 (+284)-Largest decline in DRG 148 (-494)
54
2006-2007 Admissions
Hematology/OncologyAHH-Overall volume decline of 65 admissions-Largest increase in DRG 574 (+13)-Largest decline in DRG 410 (-24)Market-Overall volume decline of 31 admissions-Largest increase in DRG 574 (+210)-Largest decline in DRG 398 (-133)NeurologyAHH-Overall volume decline of 100 admissions-Largest increase in DRG 564 (+12)-Largest decline in DRG 14 (-37)Market-Overall volume decline of 61 admissions-Largest increase in DRG 562 (+194)-Largest decline in DRG 24 (-283)NeurosurgeryAHH-Overall volume increase of 4 admissions-Largest increase in DRG 1 (+8)-Largest decline in DRG 532 (-5)Market-Overall volume increase of 14 admissions-Largest increase in DRG 1 (+37)-Largest decline in DRG 8 (-14)

Community Needs Assessment: Outcomes
2008 Adventist Midwest Health Planning Report: Adventist Hinsdale Hospital
Demographic: Age
POPULATIONOverall Population by Age Group
Source: Solucient, Market Planner Plus
55
Service Area Age Groups 2007 2012 % Growth00-17 174,494 167,659 -3.90%18-44 241,727 227,956 -5.70%45-64 200,823 209,683 4.40%65+ 101,922 111,157 9.10%
Total Primary and Secondary
POPULATION- AHH Primary and Secondary Service Area

Community Needs Assessment: Outcomes
2008 Adventist Midwest Health Planning Report: Adventist Hinsdale Hospital 56
Adventist Hinsdale Hospital Primary and Secondary Service Area
Demographics: Population by Race/Ethnicity
Race/Ethnicity 2007 Population 2012 Population % of Total
ASIAN NON-HISPANIC 44,315 50,844 7.10%
BLACK NON-HISPANIC 26,794 31,258 4.36%
HISPANIC 83,410 99,427 13.88%
MULTIRACIAL NON-HISPANIC 10,187 11,907 1.66%
NATIVE AMERICAN NON-HISPANIC 657 684 0.10%
OTHER NON-HISPANIC 551 535 0.07%
PACIFIC ISLANDR NON-HISPANIC 136 145 0.02%
WHITE NON-HISPANIC 552,916 521,655 72.81%
Total 718,966 716,455

Community Needs Assessment: Outcomes
2008 Adventist Midwest Health Planning Report: Adventist Bolingbrook Hospital
Primary Service Area
57

Community Needs Assessment: Outcomes
2008 Adventist Midwest Health Planning Report: Adventist Bolingbrook Hospital 58
Adventist Bolingbrook Hospital Primary and Secondary Service Area
Demographics: Population by Race/Ethnicity
Race/Ethnicity 2007 Population 2012 Population % of Total
ASIAN NON-HISPANIC 32,376 46,256 8.62%
BLACK NON-HISPANIC 38,028 46,635 8.69%
HISPANIC 57,242 88,638 16.52%
MULTIRACIAL NON-HISPANIC 7,904 11,189 2.08%
NATIVE AMERICAN NON-HISPANIC 663 850 0.16%
OTHER NON-HISPANIC 513 561 0.10%
PACIFIC ISLANDR NON-HISPANIC 148 202 0.04%
WHITE NON-HISPANIC 327,792 342,317 63.79%
Total 464,666 536,648

Community Needs Assessment: Outcomes
2008 Adventist Midwest Health Planning Report: Adventist La Grange Memorial Hospital
Primary Service Area
59

Community Needs Assessment: Outcomes
2008 Adventist Midwest Health Planning Report: Adventist La Grange Memorial Hospital
Demographic: Age
60
Age 2000 2007 200907-09
Change07-09
% Change
07-09Avg. Annual % Change
0-64 26,464 29,490 29,490 0 0.0% 0.0%65+ 23,743 24,859 25,210 351 1.4% 0.7%
Total 50,207 54,349 54,699 350 0.6% 0.3%
Age 2000 2007 200907-09
Change07-09
% Change
07-09Avg. Annual % Change
0-64 3,247 3,262 3,222 -40 -1.2% -0.6%65+ 555 441 449 8 1.7% 0.9%
Total 3,802 3,703 3,671 -32 -0.9% -0.4%
Age 2000 2007 200907-09
Change07-09
% Change
07-09Avg. Annual % Change
0-64 161 187 192 5 2.5% 1.2%65+ 850 524 528 4 0.8% 0.4%
Total 1,011 711 720 9 1.3% 0.6%
Rehab
Medical/Surgical
Psychiatry
Source: 2000 and 2007 is actual data from IHA COMPdata. 2009 is a projection based on data from Solucient

Community Needs Assessment: Outcomes
2008 Adventist Midwest Health Planning Report: Adventist La Grange Memorial Hospital
CardiologyALMH-Overall volume decline of 98 admissions-Largest increase in DRG 556 (+21)-Largest decline in DRG 558 (-47)Market-Overall volume decline of 448 admissions-Largest increase in DRG 556 (+61)-Largest decline in DRG 143 (-200)Open HeartALMH-Overall volume decline of 2 admissions-Largest increase in DRG 550 (+6)-Largest decline in DRG 547 (-6)Market-Overall volume decline of 54 admissions-Largest increase in DRG 550 (+7)-Largest decline in DRG 104 (-25)
61
2006-2007 Admissions

Community Needs Assessment: Outcomes
2008 Adventist Midwest Health Planning Report: Adventist La Grange Memorial Hospital
POPULATIONOverall Population by Age Groups
Source: Solucient, Market Planner Plus
62
Service Area Age Groups 2007 2012 % Growth00-17 113,782 110,423 -3.00%18-44 152,689 143,354 -6.10%45-64 128,354 131,526 2.50%65+ 69,647 73,595 5.70%
POPULATION- ALMH Primary and Secondary Service Area
Total Primary and Secondary

Community Needs Assessment: Outcomes
2008 Adventist Midwest Health Planning Report: Adventist La Grange Memorial Hospital 63
Race/Ethnicity 2007 Population 2012 Population % of Total
ASIAN NON-HISPANIC 23,648 26,436 5.76%
BLACK NON-HISPANIC 22,761 25,049 5.46%
HISPANIC 71,731 84,490 18.41%
MULTIRACIAL NON-HISPANIC 7,468 8,265 1.80%
NATIVE AMERICAN NON-HISPANIC 457 483 0.11%
OTHER NON-HISPANIC 451 447 0.10%
PACIFIC ISLANDR NON-HISPANIC 85 99 0.02%
WHITE NON-HISPANIC 337,871 313,629 68.34%
Total 464,472 458,898
Adventist La Grange Memorial Hospital Primary and Secondary Service Area
Demographics: Population by Race/Ethnicity

Community Needs Assessment: Outcomes
2008 Adventist Midwest Health Planning Report: Adventist GlenOaks Hospital
Primary Service Area
64

Community Needs Assessment: Outcomes
2008 Adventist Midwest Health Planning Report: Adventist GlenOaks Hospital
Demographic: Age
65
Age 2000 2007 200907-09
Change07-09
% Change
07-09Avg. Annual % Change
0-64 21,844 25,669 25,810 141 0.6% 0.3%65+ 12,163 14,517 15,416 899 6.2% 3.1%
Total 34,007 40,186 41,226 1,040 2.6% 1.3%
Age 2000 2007 200907-09
Change07-09
% Change
07-09Avg. Annual % Change
0-64 2,208 2,984 2,972 -12 -0.4% -0.2%65+ 304 296 316 20 6.7% 3.4%
Total 2,512 3,280 3,288 8 0.3% 0.1%
Age 2000 2007 200907-09
Change07-09
% Change
07-09Avg. Annual % Change
0-64 82 136 142 6 4.5% 2.3%65+ 177 163 173 10 6.0% 3.0%
Total 259 299 315 16 5.3% 2.7%
Medical/Surgical
Psychiatry
Rehab
Source: 2000 and 2007 is actual data from IHA COMPdata. 2009 is a projection based on data from Solucient

Community Needs Assessment: Outcomes
2008 Adventist Midwest Health Planning Report: Adventist GlenOaks Hospital
CardiologyAGH-Overall volume increase of 40 admissions-Largest increase in DRG 125 (+20)-Largest decline in DRG 143 (-26)Market-Overall volume decline of 403 admissions-Largest increase in DRG 127 (+57)-Largest decline in DRG 143 (-223)Psychiatry/Substance AbuseAGH-Overall volume decline of 30 admissions-Largest increase in DRG 430 (+8)-Largest decline in DRG 521 (-18)Market-Overall volume increase of 176 admissions -Largest increase in DRG 430 (+114)-Largest decline in DRG 429 (-32)
66
2006-2007 Admissions

Community Needs Assessment: Outcomes
2008 Adventist Midwest Health Planning Report: Adventist GlenOaks Hospital
PopulationOverall Population by Age Groups
Source: Solucient, Market Planner Plus
67
Service Area Age Groups 2007 2012 % Growth00-17 106,886 101,951 -4.60%18-44 158,596 148,699 -6.20%45-64 108,956 116,984 7.40%65+ 41,853 49,228 17.60%
POPULATION- AGH Primary and Secondary Service Area
Total Primary and Secondary

Community Needs Assessment: Outcomes
2008 Adventist Midwest Health Planning Report: Adventist GlenOaks Hospital 68
Race/Ethnicity 2007 Population 2012 Population % of Total
ASIAN NON-HISPANIC 39,911 45,854 11.00%
BLACK NON-HISPANIC 16,389 19,515 4.68%
HISPANIC 75,670 90,741 21.77%
MULTIRACIAL NON-HISPANIC 6,870 8,201 1.97%
NATIVE AMERICAN NON-HISPANIC 487 486 0.12%
OTHER NON-HISPANIC 381 366 0.09%
PACIFIC ISLANDR NON-HISPANIC 84 77 0.02%
WHITE NON-HISPANIC 276,499 251,622 60.36%
Total 416,291 416,862
Adventist GlenOaks Hospital Primary and Secondary Service Area
Demographics: Population by Race/Ethnicity

Community Needs Assessment: Outcomes
2008 Adventist Midwest Health Planning Report: Adventist GlenOaks Hospital
Population by Zip Code
69
Zip City Service Area 2007 2012
07-12Numeric Growth
07-12% Growth
60185 WEST CHICAGO Primary 36,961 38,917 1,956 5.30%60101 ADDISON Primary 38,782 39,246 464 1.20%60139 GLENDALE HEIGHTS Primary 32,661 32,886 225 0.70%60108 BLOOMINGDALE Primary 22,387 22,555 168 0.80%60188 CAROL STREAM Primary 42,432 42,085 -347 -0.80%
173,223 175,689 2,466 1.42%60181 VILLA PARK Secondary 29,757 29,847 90 0.30%60172 ROSELLE Secondary 24,990 24,850 -140 -0.60%60137 GLEN ELLYN Secondary 38,010 37,625 -385 -1.00%60148 LOMBARD Secondary 50,856 50,427 -429 -0.80%60133 HANOVER PARK Secondary 37,579 37,115 -464 -1.20%60187 WHEATON Secondary 61,876 61,309 -567 -0.90%
243,068 241,173 -1,895 -0.78%416,291 416,862 571 0.14%Total Service Area
Source: Solucient, Market Planner Plus Sorted by: 07-12 % Growth
Primary Total
Secondary Total

Community Needs Assessment: Outcomes
2008 Adventist Midwest Health Planning Report
Health Care Trends
Demand for services continues to rise, while revenue growth stalls: Aging population continues to drive demand, however growth will be sustainable only if several insurance-related factors are realized.
The Uninsured, the Underinsured and Unpredictable Assistance Programs: Number of uninsured Americans has reached 45 million, and millions more are underinsured, thus increasing the percentage of self-pay patients. With the federal deficit continuing to widen and many state budgets still not balanced, Medicare and Medicaid likely will have to reduce or eliminate benefits.
Impact of Consumerism on Healthcare: Mercer’s National Survey of Employer-Sponsored Health Plans of 2004 found that the average total cost of health benefits rose 7.5% in 2004. Employers will have an increasing need to modify the plans and shift more of the decision-making and cost burden to the employees.
Limited Availability of Professionals: Severe workforce shortages continue to exert hardships for hospitals and other healthcare providers. The government estimates that if no actions are taken, the shortfall of registered nurses will climb above 800,000 by 2020. To address the shortage of physicians, providers have intensified recruitment efforts and expanded employment options. The lack of specialty physicians, in particular, has created loss of certain services in communities across the nation.
70

Community Needs Assessment: Outcomes
2008 Adventist Midwest Health Planning Report
Opportunities based in Community Need
Adventist Hinsdale Hospital
Promote breadth of services, with focus on those services that are difficult to find (neuro services, oncology and cardiology). Enhance hospital/physician incentive alignment through PHO
Expand physician base to west and south-west communities
Improve Employee Gallup Survey Scores
Adventist La Grange Memorial Hospital
Continue cardiology outreach through Goodman consulting business planning
Expand geriatric programs, with focus on aging population
Improve Employee Gallup Survey Scores
Adventist GlenOaks Hospital
Develop interventional cardiology program
Recruit new primary care and OB physicians
Improve PHO contracting for behavioral health physicians
71