Embed Size (px)
Citation preview
Advancing Vulnerable Children and Families in New Mexico: A Collabora;ve Strategy to Improve Benefit Access and Integrated Services
Prepared by Joohee Rand, Consultant for a Joint Project of
New Mexico Associa;on of Grantmakers (NMAG) and The Center for Philanthropic Partnerships (CPP)
2011 March
A Working Document for Data-‐Driven, Cross-‐Sector Discussion
March 2011 CPP-‐NMAG Joint Project / Advancing Vulnerable Children and Families in New Mexico 2
ACKNOWLEDGEMENT This report was prepared by Joohee Rand, consultant, for a joint project by the Center for Philanthropic Partnerships (www.cppnm.org) and the New Mexico Association of Grantmakers (www.nmag.org). The project was funded with generous support from the W.K. Kellogg Foundation and The Annie E. Casey Foundation.
A special thanks goes to the following for sharing their valuable perspectives and knowledge and for providing feedback in preparing this report: Robin Brule, CPP; Ron White, NMAG; Patricia Anders and Sireesha Manne, NM Center on Law and Poverty; Marisol Atkins and Karen Ziegler, CYFD; Eric Griego, Nick Estes, Christine Hollis, and Myra Segal, NM Voices for Children; Ruth Hoffman, Lutheran Advocacy Ministry-NM; Leora Jerger, My Community NM; Nancy Johnson, Albuquerque Community Foundation; Norty Kalishman, McCune Charitable Foundation; John Martinez and Jerry Otero, HELP-New Mexico; Frank Mirabal, Contigo Research, Policy & Strategy; Jenny Parks, New Mexico Community Foundation; Nancy Pope and Sarah Newman, New Mexico Collaboration to End Hunger; Ona Porter, Prosperity Works; Dolores E. Roybal, Con Alma Health Foundation; Chris Sturgis, MetisNet; and Robert Otto Valdez, RWJF Center for Health Policy.
The analyses and recommendations in this report were prepared using mostly publicly available data and reports, with input from a small group of experts and leaders. The recommended collaborative strategy and initiatives in this report suggest a potential path for further deliberation by the broader cross-sector leadership and community, rather than a prescriptive solution. Please direct any questions or feedback regarding the report to Joohee Rand, consultant, at [email protected].
March 2011 CPP-‐NMAG Joint Project / Advancing Vulnerable Children and Families in New Mexico 3
TABLE OF CONTENTS
Introduction and Executive Summary
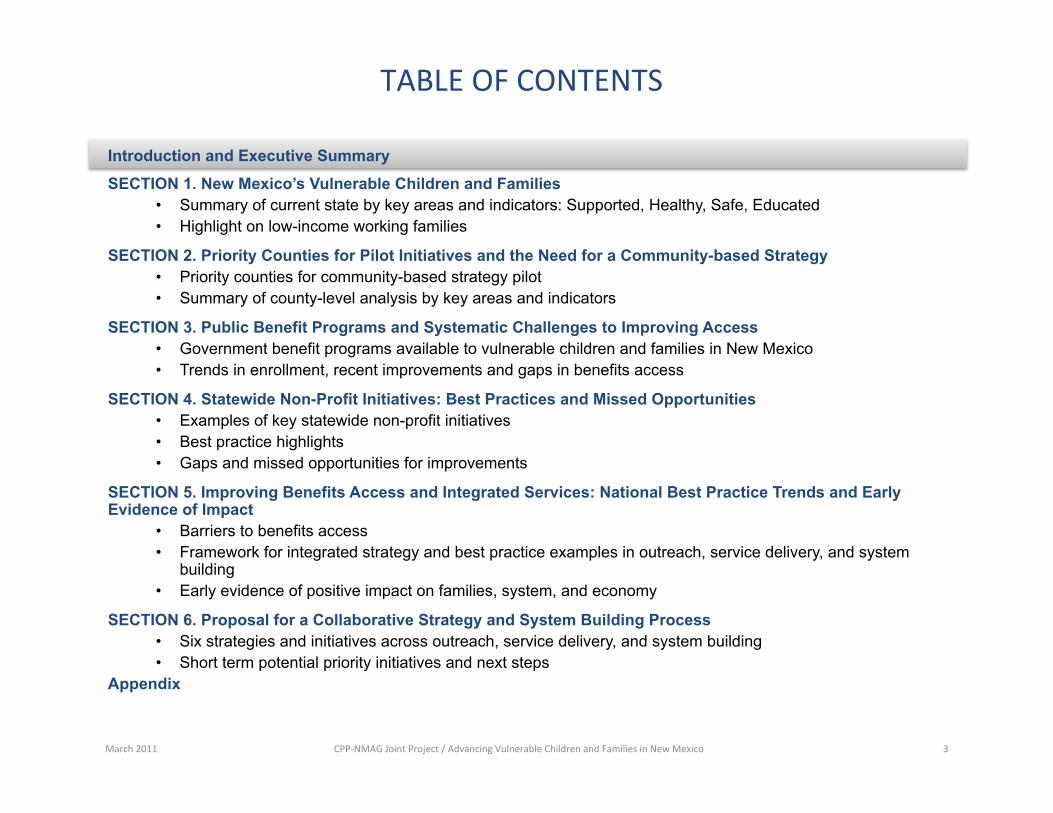
SECTION 1. New Mexico’s Vulnerable Children and Families • Summary of current state by key areas and indicators: Supported, Healthy, Safe, Educated • Highlight on low-income working families
SECTION 2. Priority Counties for Pilot Initiatives and the Need for a Community-based Strategy • Priority counties for community-based strategy pilot • Summary of county-level analysis by key areas and indicators
SECTION 3. Public Benefit Programs and Systematic Challenges to Improving Access • Government benefit programs available to vulnerable children and families in New Mexico • Trends in enrollment, recent improvements and gaps in benefits access
SECTION 4. Statewide Non-Profit Initiatives: Best Practices and Missed Opportunities • Examples of key statewide non-profit initiatives • Best practice highlights • Gaps and missed opportunities for improvements
SECTION 5. Improving Benefits Access and Integrated Services: National Best Practice Trends and Early Evidence of Impact
• Barriers to benefits access • Framework for integrated strategy and best practice examples in outreach, service delivery, and system
building • Early evidence of positive impact on families, system, and economy
SECTION 6. Proposal for a Collaborative Strategy and System Building Process • Six strategies and initiatives across outreach, service delivery, and system building • Short term potential priority initiatives and next steps
Appendix
March 2011 CPP-‐NMAG Joint Project / Advancing Vulnerable Children and Families in New Mexico 4
Introduc;on
New Mexico’s vulnerable families face high rates of poverty, poor educational outcomes, and in some cases isolation in rural communities. Add the often-ignored cultural diversity of a “majority-minority” state, and the challenge is complex and formidable. But recent examples of promising emerging solutions and partnership initiatives in New Mexico and nationally suggest a possible direction for a positive system-wide change. This paper proposes a potential collaborative strategy for the state’s philanthropic, non-profit and government leaders and communities to address New Mexico’s issues of poverty and family economic insecurity. By taking a holistic approach to the needs of families, collaborating across state and national lines, and creating channels for system-wide coordination, we can move crisis-stricken families toward long term self sustenance. Access to public benefits and supports for basic needs such as food, housing and health care need to be coordinated and connected to opportunities for advancement such as education, job training, careers (beyond minimum wage jobs), financial skills and asset building. While strong programs and improvements in all of these areas are needed, without a system-wide coordination of such efforts to address holistic needs of the families and help advance them in the long term, the impacts of individual programs are likely to be limited or short-lived with higher overall cost to the communities and the state economy. The strategies recommended in this report are aimed at bringing about that system-wide coordination of programs with a continuum of support and opportunities to achieve collective impact toward families’ long-term advancement. It is not meant to be a prescriptive plan, but instead a data-driven guide for further deliberation. It calls on philanthropic, non-profit and government leaders to come together, set aside their individual agendas, and strategize on how to collectively improve their efforts to achieve the common goal: helping New Mexico’s vulnerable families advance.
March 2011 CPP-‐NMAG Joint Project / Advancing Vulnerable Children and Families in New Mexico 5
Execu;ve Summary (1/9)
THE PROBLEM New Mexico continues to lag behind the nation in economic security and wellbeing of its children and families. A wide range of public benefit programs exists in New Mexico to assist its vulnerable families including Supplemental Nutrition Assistance Program (SNAP), Medicaid, Children’s Health Insurance Program (CHIP), Temporary Assistance for Needy Families (TANF) and Child Care Assistance. There have also been significant non-profit and public-private partnership efforts – both statewide and in various communities – to improve the situation for certain population or issue areas such as youth, early childhood, hunger, and health care. However, many families still struggle to access the benefits and support programs they need, and when they do find them, they discover it difficult to move beyond crisis management to long-term self-sufficiency and wellbeing. There is a mismatch between the complex needs of families that require an integrated, continuum of support services across benefits and programs and the current disconnected service delivery system of these benefits and programs. On the one hand, public benefit programs often fail to support needy families who are eligible due to various barriers in access including inadequate outreach with little coordination across multiple programs, complex application and recertification procedures, limited agency capacity, technology issues, and budget shortages. On the other hand, many non-profit programs focus on their own issue areas with limited capacity and fail to address the holistic needs of the families and help them obtain continuous support needed for advancement beyond a single programmatic area. Promising programs often do not receive the attention and funding they need for rapid replication, and potentially synergistic programs fail to work together because they are not linked to each other or do not have the capacity to coordinate. This fragmented support system is reinforced by equally fragmented funding streams – both in government and philanthropic sectors – and the lack of a system to drive coordinated strategy and execution across programs, issue areas, and sectors.
Chart Reference
March 2011 CPP-‐NMAG Joint Project / Advancing Vulnerable Children and Families in New Mexico 6
Execu;ve Summary (2/9)
New Mexico’s Vulnerable Children and Families New Mexico consistently ranks as one of the poorest performing states according to KIDS COUNT, in its nationally recognized annual profile of child wellbeing produced by the Annie E. Casey Foundation. This report provides a comprehensive view of key indicators that measure the ability for children to grow up supported, healthy, safe and educated. According to the latest indicators, 17% of New Mexico’s population and 1 in 4 children live in poverty; 30% of children live in families where no parent has full-time, year-round employment; 40% of the low income population and 1 in 4 low income children do not have health insurance; 1 in 10 high school students have attempted suicide; 3 to 4 out of 10 high school students do not graduate; and 16% of adults do not have basic prose literacy. What is even more concerning is that New Mexico seems to provide the worst conditions in the country for working families to advance economically. 40% of working families in New Mexico are low-income (50th in rank!) while 37% of jobs are in occupations that pay below poverty (49th in rank), and 48% of parents in low-income working families have no health insurance (47th in rank). 35% of those in low-income working families have no high school degree or GED and 56% no postsecondary experience, limiting their chances of advancing economically with better paying jobs in the future. Priority Counties for Pilot Initiatives and the Need for a Community-based Strategy This report has selected five potential priority counties – Bernalillo, Dona Ana, McKinley, Lea and Mora – for targeted studies to analyze the current situation and potential short-term pilot initiatives. Collectively, the five counties represent a significant share of the vulnerable population in New Mexico including over 50% of population and children in poverty, low-income, uninsured populations and public benefit (SNAP, Medicaid) recipients. They also represent a diverse mix of urban and rural county types, geographic regions of the state as well as demographic characteristics including Hispanic, Native American, and Immigrant communities. More importantly, each county showcases a unique set of issues affecting vulnerable children and families. Tailored solutions developed for and piloted in these priority counties could provide effective tools and lessons for broader statewide strategy replication in other communities. The 33 counties in New Mexico have varying economic, social and demographic characteristics. Detailed analysis of county-level data shows that problems facing the communities are multi-faceted and complex with many communities facing critical conditions across multiple issue areas (economic support, health, safety, and education). Strategies to improve conditions for the vulnerable population should be tailored to fit the unique local characteristics, assets, and challenges of the community. For example, strategies that work for highly populated Dona Ana County in the Southwest with majority urban, Hispanic population are likely to be quite different from strategies for McKinley County in the Northwest with over 70% Native American population or those of Mora, a small, scarcely populated rural community in the Northeast.
Chart Reference
1.1 – 1.3
1.4
2.1
2.2 - 2.5
2.6
March 2011 CPP-‐NMAG Joint Project / Advancing Vulnerable Children and Families in New Mexico 7
Execu;ve Summary (3/9)
Significant Holes in Public Benefit Programs and Systematic Challenges to Improving Access While New Mexico has made several steps to improve access to benefit programs for families in recent years, there are still significant holes in the safety net. In addition, federal dollars are lost and economic impact opportunity is forfeited because many families do not participate in the benefits for which they are eligible. A number of researchers suggest that entitlement programs with high federal funding contribution, such as SNAP and Medicaid, can be significant sources of economic stimuli for New Mexico. For example, while exact numbers are not available, rough analysis based on available data from various sources suggests that increasing statewide SNAP participation from the current estimate of 68% (as of June 2009) to 80% could bring approximately $50~80M in federal dollars into New Mexico and $90~150M in economic activity. According to an analysis by New Mexico Voices for Children, each $1 in state spending for Medicaid will generate $2.3 in federal funding and $0.9 in additional economic activities in FY2012 even with the reduced federal funding contribution rate of 70%. Once health care reform takes effect in 2014 with expanded coverage and federal funding contribution, New Mexico could benefit from over $4.5B in federal dollars between 2014-2019 and at least $988M in annual federal Medicaid spending, according to a recent Medicaid Coalition’s report for New Mexico’s Healthcare Reform Working Group presented by the New Mexico Center on Law and Poverty. In addition, $1.65B in new economic activity and more than 20,000 new jobs will be created after 2019, the report said. Unfortunately, the recent state budget shortfall has placed significant added strain on families’ access to benefits they desperately need in the harsh economic environment. For example, the state government recently reduced income eligibility for Child Care Assistance from 200% to 100% of the Federal Poverty Level (affecting 7,000 low income families), cut TANF cash assistance by 13-25%, froze new enrollment of State Coverage Insurance, and decreased SNAP State Supplement for the Elderly and Disabled among other measures for cost containment. Moreover, New Mexico faces several other systemic challenges to improving access to benefits for families including the state’s 22 plus-year-old income support eligibility system slowing implementation of the new combined online application processing for multiple programs (so called Yes-NM project), staff shortages and overwhelming caseloads as well as other policy and procedural issues that are reinforcing inefficiencies in the system and preventing more families from participating in benefit programs.
Chart Reference
3.1 – 3.7
3.8 – 3.9
3.10
3.11
March 2011 CPP-‐NMAG Joint Project / Advancing Vulnerable Children and Families in New Mexico 8
Execu;ve Summary (4/9)
Missed Opportunities With Statewide Non-Profit Initiatives Operating In “Silos” Several statewide non-profit and public-private partnership initiatives exist that advocate and address the needs of vulnerable children and families in New Mexico. Some focus on specific issue areas such as hunger (e.g., NM Collaboration to End Hunger), economic security (e.g., Assets Consortium by Prosperity Works), health care (e.g., School Based Health Clinic), behavioral health (e.g., Behavioral Health Collaborative), or workforce training (e.g., NM Workforce Connection). Others specialize by function (e.g., advocacy and outreach for NM Center on Law and Poverty and New Mexico Voices for Children) or provide more integrated services for a narrow target population (e.g., Early Childhood Action Network, Community Action Agencies, Center for Working Families). Strong partnerships and innovative strategies have made some of these initiatives successful in targeted issue areas. For example, the NM Collaboration to End Hunger has improved food security through broad collaboration of cross-sector partners, and the Center for Working Families has improved economic and educational outcomes for low-income, community college students through innovative bundled services. These successful programs should be reviewed and their lessons shared broadly as best practices for further replication and expansion. However, there are still missed opportunities and there is significant room for improvement. Improvements could include better coordination and fewer duplicated efforts across initiatives, and sufficient investment in adult education and job training programs, which are required for the long-term advancement of families. Limited awareness of other initiatives and projects, lack of data, and limited funder collaboration, with a preference for an independent program-driven funding approach, reinforce “silo” effects. IMPROVING BENEFIT ACCESS AND INTEGRATED SERVICES: NATIONAL BEST PRACTICE TRENDS AND EARLY EVIDENCE OF IMPACT Best practice programs combine improved outreach, enhancement in benefits delivery systems, and integrated services to move families toward independence and overall wellbeing beyond immediate crisis intervention. Nationally, there have been increasing efforts by state and local governments, funders and nonprofit organizations to improve access to benefits and provide comprehensive, integrated services to support vulnerable (particularly low-income) families. This trend is driven by an increasing recognition that 1) there are several systematic barriers preventing families from accessing available public benefits and that 2) addressing the complex needs of families and truly advancing them will require coordination of outreach and service delivery across programs. Integrated programs must connect families to a long term, broad continuum of supports and opportunities to move them toward self-sufficiency.
Chart Reference
4.1 – 4.3
4.4 - 4.6
4.7
5.1 – 5.6
March 2011 CPP-‐NMAG Joint Project / Advancing Vulnerable Children and Families in New Mexico 9
Execu;ve Summary (5/9)
Such efforts are made possible by bringing together non-profit, community, and educational organizations, government agencies, and businesses in partnership to effectively address the holistic needs of families. Many programs utilize online systems for combined applications of multiple benefit programs and provide hands-on assistance to applicants to maximize benefit access. Effective partnerships also enable expanded outreach to families where they are and allow bundling of multiple services to better meet the needs of the families and provide further opportunities for advancement beyond what individual programs can provide alone. Many state governments have also led the charge with innovative strategies in outreach and efforts to streamline and enhance benefit policies and procedures. They include:
• A consolidated information source of the state’s support resources across departments with all-in-one handbooks, call centers, and websites. Some include direct links to referral services, application assistance and online benefit application tools (e.g, Pennsylvania, Arizona, Minnesota);
• Expanded benefit access points through community partnerships, including out-stationed eligibility workers at community-based organizations or CBOs, workforce development training programs, and faith-based organizations (e.g., Ohio Benefit Bank);
• “No wrong door” approach in benefit access through cross department coordination, policy alignment, and technology enhancement (e.g., Louisiana);
• Aligned and simplified benefit policies and processes including eligibility requirements, application and recertification processes.
Early evidence from such efforts shows positive impact in both short-term results and long-term outcomes for families as well as local economies. Studies suggest that families with access to multiple benefits and programs are less likely to return to the welfare system, have more stable lives for their children with improved schooling and behavioral outcomes, and are more likely to achieve major positive economic outcomes such as earning post-secondary degrees and staying at jobs. Many states investing in benefit systems and processes have been able to save administrative costs and significantly increase families’ benefits participation. As mentioned earlier, increased benefit participation may also provide significant economic stimuli for the state, especially at a time of economic downturn, through injection of federal funding and the multiplier impact of increased economic activities.
Chart Reference
5.1 – 5.6
5.7 – 5.8
5.9
March 2011 CPP-‐NMAG Joint Project / Advancing Vulnerable Children and Families in New Mexico 10
Execu;ve Summary (6/9)
PROPOSAL FOR A COLLABORATIVE STRATEGY AND SYSTEM-BUILDING PROCESS The crisis facing vulnerable children and families in New Mexico is too extensive and multi-faceted for any one initiative, organization, foundation, or government entity to address alone or for all of them to solve by operating in disconnected silos. What New Mexico needs is a coordinated strategy that efficiently and effectively connects families to not just individual programs but a continuum of benefits, services and opportunities that advance them from public assistance and crisis management to independence and well-being. Improvements are needed in all three areas –- outreach, service delivery, and system-building -- to ensure broad and long-term impact. The six strategies outlined below are provided as a guide to engaging non-profit organizations, government agencies, policymakers, and funders in collective efforts across outreach, service delivery, and system-building to improve benefit access and create a continuum of integrated services for families. Overall Strategic Objective: To advance New Mexico’s vulnerable children and families from crisis to economic security through improved benefit access and a continuum of integrated support services. Effective, Coordinated OUTREACH v STRATEGY 1 – FAMILIES:
Enhance and connect outreach across programs and benefits. Outreach efforts need to be expanded and coordinated across programs to meet families where they are so that families can learn about and access multiple programs easily from initial point of contact. Potential solutions for short-term improvements include common outreach materials, cross training of staff across programs and increased front-line hands-on support to families in testing eligibility and applying for benefit programs. Existing programs with broad partnership reach to families (e.g., Collaboration to End Hunger, Assets Consortium, School-based Health Clinics, WIC clinics) and available federal funding streams for outreach can be leveraged in implementing the strategy.
Chart Reference
6.1 – 6.2
6.3
March 2011 CPP-‐NMAG Joint Project / Advancing Vulnerable Children and Families in New Mexico 11
Execu;ve Summary (7/9)
Efficiency, Capacity Building, and Integration in SERVICE DELIVERY v STRATEGY 2 – GOVERNMENT AGENCIES:
Increase efficiency and capacity for benefit administration in government agencies. Inefficiencies and limited capacity in government agencies, exacerbated by vacancies and outdated IT infrastructure, continue to pose a barrier to improving benefit access. As mentioned earlier in STRATEGY 1, community partnerships and federal funding streams can be leveraged to expand front-line staff capacity for benefit outreach and administration. Also, it is absolutely critical to ensure timely and effective full implementation of the new online combined benefit screening and application system (or Yes-NM project including planned replacement of the Integrated Service Delivery System or ISD2, the state’s 22 plus-year-old income support eligibility system) by January 2014. Meanwhile, non-profit organizations and funders should work with state agencies to explore other short term IT system improvement options to enable a simplified, online application process prior to 2014.
v STRATEGY 3 – NON-PROFIT ORGANIZATIONS:
Enable family’s easy access to a continuum of services through integrated, collaborative service delivery. One way to achieve integrated service delivery is by replicating and scaling existing bundled service programs with proven outcomes in the state such as the Center for Working Families and Elev8. Programs can be launched at new sites or added to other existing programs serving the target population for increased impact. At the same time, broader coordination will be needed to achieve “no wrong door” and “warm hand-off of referrals” practices in the short term, and eventually develop wide, formal collaborative structure and processes that link together continuum of services across programs and issue areas in the long term. This will require investment in increased capacity within non-profit organizations so that they can allocate resources to collaborative efforts beyond executing their own programs. Many also point out that adult education and job training components in both public benefit and non-profit programs are particularly underprovided and need strengthening to ensure opportunities for advancement at the right end of the continuum. Effective partnerships with higher educational institutions and businesses will be needed to achieve meaningful progress in these areas.
Chart Reference
6.4
6.5
March 2011 CPP-‐NMAG Joint Project / Advancing Vulnerable Children and Families in New Mexico 12
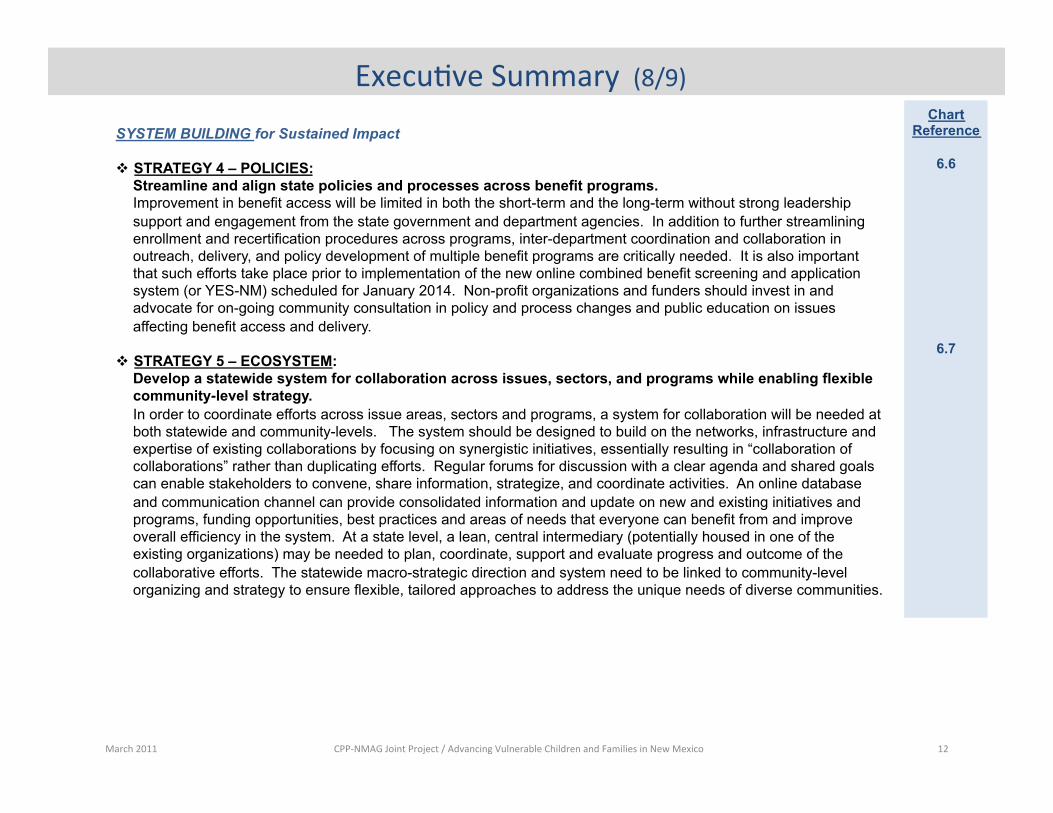
Execu;ve Summary (8/9) SYSTEM BUILDING for Sustained Impact v STRATEGY 4 – POLICIES:
Streamline and align state policies and processes across benefit programs. Improvement in benefit access will be limited in both the short-term and the long-term without strong leadership support and engagement from the state government and department agencies. In addition to further streamlining enrollment and recertification procedures across programs, inter-department coordination and collaboration in outreach, delivery, and policy development of multiple benefit programs are critically needed. It is also important that such efforts take place prior to implementation of the new online combined benefit screening and application system (or YES-NM) scheduled for January 2014. Non-profit organizations and funders should invest in and advocate for on-going community consultation in policy and process changes and public education on issues affecting benefit access and delivery.
v STRATEGY 5 – ECOSYSTEM:
Develop a statewide system for collaboration across issues, sectors, and programs while enabling flexible community-level strategy. In order to coordinate efforts across issue areas, sectors and programs, a system for collaboration will be needed at both statewide and community-levels. The system should be designed to build on the networks, infrastructure and expertise of existing collaborations by focusing on synergistic initiatives, essentially resulting in “collaboration of collaborations” rather than duplicating efforts. Regular forums for discussion with a clear agenda and shared goals can enable stakeholders to convene, share information, strategize, and coordinate activities. An online database and communication channel can provide consolidated information and update on new and existing initiatives and programs, funding opportunities, best practices and areas of needs that everyone can benefit from and improve overall efficiency in the system. At a state level, a lean, central intermediary (potentially housed in one of the existing organizations) may be needed to plan, coordinate, support and evaluate progress and outcome of the collaborative efforts. The statewide macro-strategic direction and system need to be linked to community-level organizing and strategy to ensure flexible, tailored approaches to address the unique needs of diverse communities.
Chart Reference
6.6
6.7
March 2011 CPP-‐NMAG Joint Project / Advancing Vulnerable Children and Families in New Mexico 13
Execu;ve Summary (9/9)
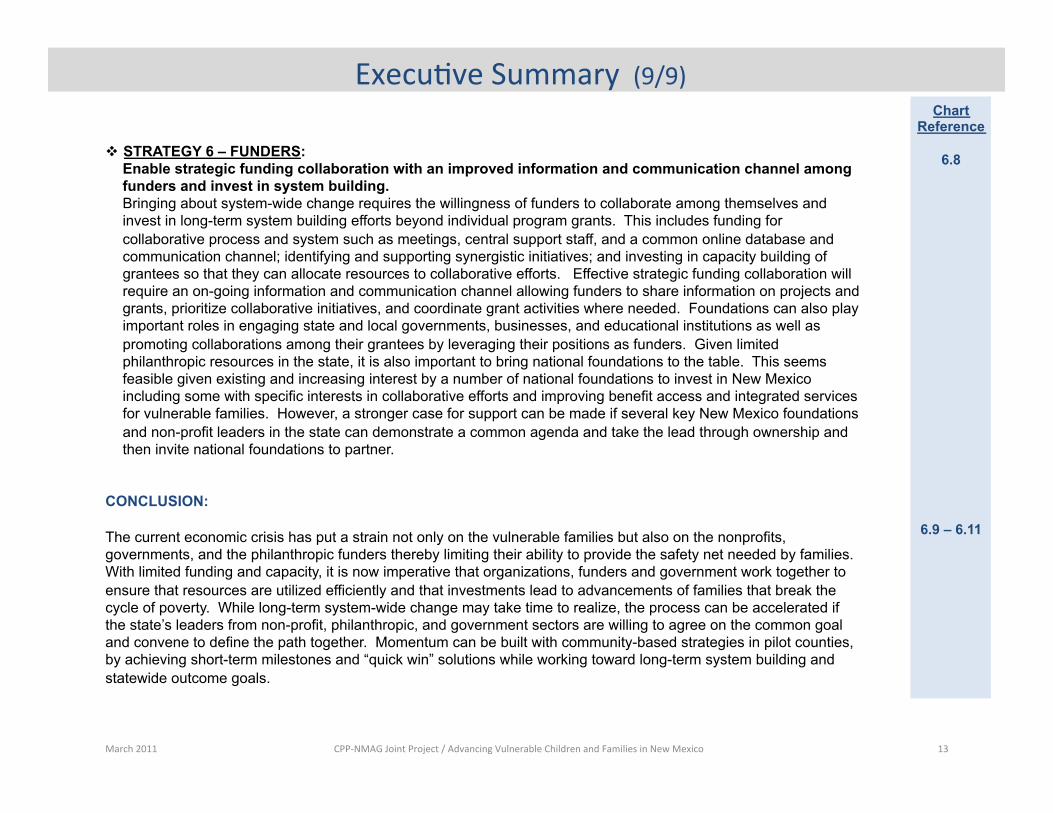
v STRATEGY 6 – FUNDERS: Enable strategic funding collaboration with an improved information and communication channel among funders and invest in system building. Bringing about system-wide change requires the willingness of funders to collaborate among themselves and invest in long-term system building efforts beyond individual program grants. This includes funding for collaborative process and system such as meetings, central support staff, and a common online database and communication channel; identifying and supporting synergistic initiatives; and investing in capacity building of grantees so that they can allocate resources to collaborative efforts. Effective strategic funding collaboration will require an on-going information and communication channel allowing funders to share information on projects and grants, prioritize collaborative initiatives, and coordinate grant activities where needed. Foundations can also play important roles in engaging state and local governments, businesses, and educational institutions as well as promoting collaborations among their grantees by leveraging their positions as funders. Given limited philanthropic resources in the state, it is also important to bring national foundations to the table. This seems feasible given existing and increasing interest by a number of national foundations to invest in New Mexico including some with specific interests in collaborative efforts and improving benefit access and integrated services for vulnerable families. However, a stronger case for support can be made if several key New Mexico foundations and non-profit leaders in the state can demonstrate a common agenda and take the lead through ownership and then invite national foundations to partner.
CONCLUSION: The current economic crisis has put a strain not only on the vulnerable families but also on the nonprofits, governments, and the philanthropic funders thereby limiting their ability to provide the safety net needed by families. With limited funding and capacity, it is now imperative that organizations, funders and government work together to ensure that resources are utilized efficiently and that investments lead to advancements of families that break the cycle of poverty. While long-term system-wide change may take time to realize, the process can be accelerated if the state’s leaders from non-profit, philanthropic, and government sectors are willing to agree on the common goal and convene to define the path together. Momentum can be built with community-based strategies in pilot counties, by achieving short-term milestones and “quick win” solutions while working toward long-term system building and statewide outcome goals.
Chart Reference
6.8
6.9 – 6.11
March 2011 CPP-‐NMAG Joint Project / Advancing Vulnerable Children and Families in New Mexico 14
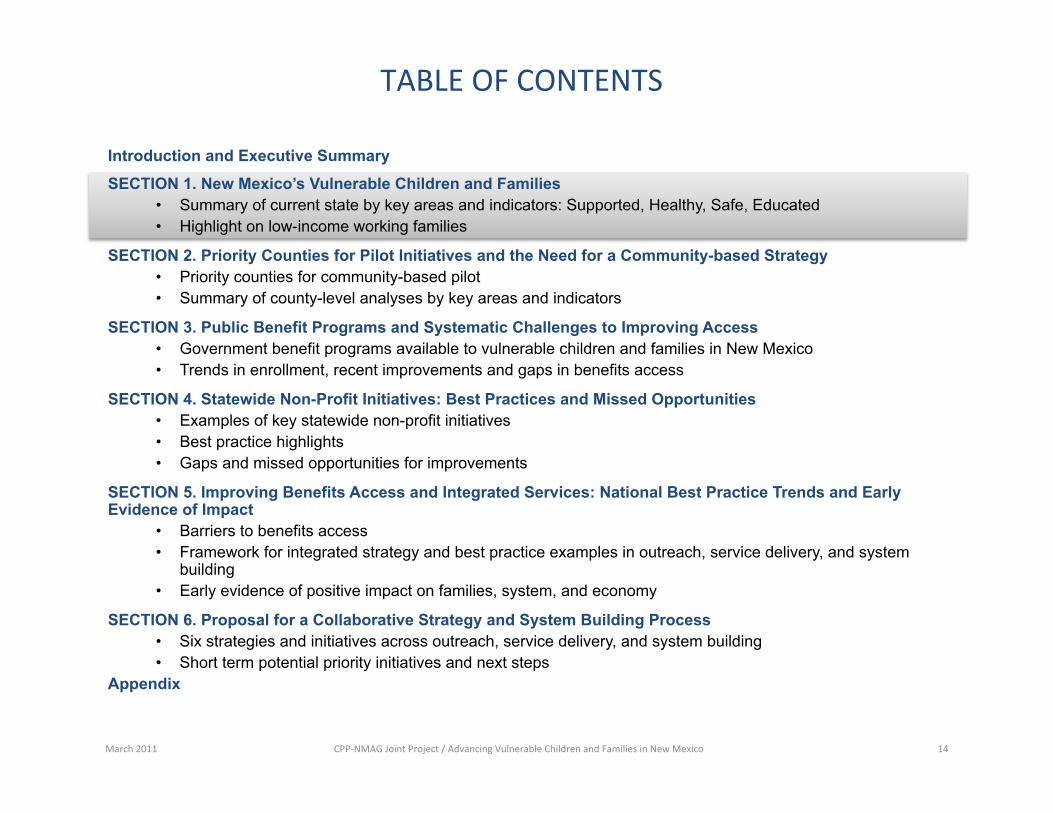
TABLE OF CONTENTS
Introduction and Executive Summary
SECTION 1. New Mexico’s Vulnerable Children and Families • Summary of current state by key areas and indicators: Supported, Healthy, Safe, Educated • Highlight on low-income working families
SECTION 2. Priority Counties for Pilot Initiatives and the Need for a Community-based Strategy • Priority counties for community-based pilot • Summary of county-level analyses by key areas and indicators
SECTION 3. Public Benefit Programs and Systematic Challenges to Improving Access • Government benefit programs available to vulnerable children and families in New Mexico • Trends in enrollment, recent improvements and gaps in benefits access
SECTION 4. Statewide Non-Profit Initiatives: Best Practices and Missed Opportunities • Examples of key statewide non-profit initiatives • Best practice highlights • Gaps and missed opportunities for improvements
SECTION 5. Improving Benefits Access and Integrated Services: National Best Practice Trends and Early Evidence of Impact
• Barriers to benefits access • Framework for integrated strategy and best practice examples in outreach, service delivery, and system
building • Early evidence of positive impact on families, system, and economy
SECTION 6. Proposal for a Collaborative Strategy and System Building Process • Six strategies and initiatives across outreach, service delivery, and system building • Short term potential priority initiatives and next steps
Appendix
15
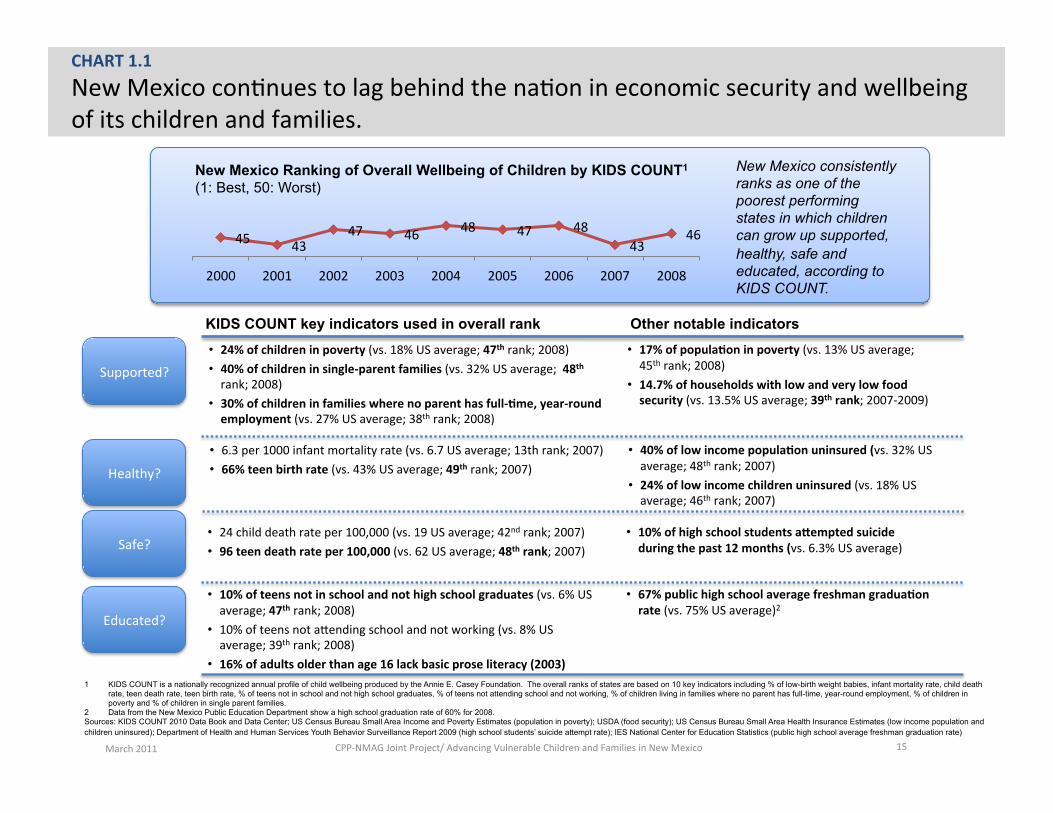
CHART 1.1 New Mexico con;nues to lag behind the na;on in economic security and wellbeing of its children and families.
45 43 47 46 48 47 48
43 46
2000 2001 2002 2003 2004 2005 2006 2007 2008
New Mexico Ranking of Overall Wellbeing of Children by KIDS COUNT1 (1: Best, 50: Worst)
Supported? • 24% of children in poverty (vs. 18% US average; 47th rank; 2008) • 40% of children in single-‐parent families (vs. 32% US average; 48th rank; 2008)
• 30% of children in families where no parent has full-‐Fme, year-‐round employment (vs. 27% US average; 38th rank; 2008)
KIDS COUNT key indicators used in overall rank Other notable indicators
Healthy?
Safe?
Educated?
New Mexico consistently ranks as one of the poorest performing states in which children can grow up supported, healthy, safe and educated, according to KIDS COUNT.
1 KIDS COUNT is a nationally recognized annual profile of child wellbeing produced by the Annie E. Casey Foundation. The overall ranks of states are based on 10 key indicators including % of low-birth weight babies, infant mortality rate, child death rate, teen death rate, teen birth rate, % of teens not in school and not high school graduates, % of teens not attending school and not working, % of children living in families where no parent has full-time, year-round employment, % of children in poverty and % of children in single parent families.
2 Data from the New Mexico Public Education Department show a high school graduation rate of 60% for 2008. Sources: KIDS COUNT 2010 Data Book and Data Center; US Census Bureau Small Area Income and Poverty Estimates (population in poverty); USDA (food security); US Census Bureau Small Area Health Insurance Estimates (low income population and children uninsured); Department of Health and Human Services Youth Behavior Surveillance Report 2009 (high school students’ suicide attempt rate); IES National Center for Education Statistics (public high school average freshman graduation rate)
• 6.3 per 1000 infant mortality rate (vs. 6.7 US average; 13th rank; 2007) • 66% teen birth rate (vs. 43% US average; 49th rank; 2007)
• 24 child death rate per 100,000 (vs. 19 US average; 42nd rank; 2007) • 96 teen death rate per 100,000 (vs. 62 US average; 48th rank; 2007)
• 10% of teens not in school and not high school graduates (vs. 6% US average; 47th rank; 2008)
• 10% of teens not acending school and not working (vs. 8% US average; 39th rank; 2008)
• 16% of adults older than age 16 lack basic prose literacy (2003)
• 17% of populaFon in poverty (vs. 13% US average; 45th rank; 2008)
• 14.7% of households with low and very low food security (vs. 13.5% US average; 39th rank; 2007-‐2009)
• 40% of low income populaFon uninsured (vs. 32% US average; 48th rank; 2007)
• 24% of low income children uninsured (vs. 18% US average; 46th rank; 2007)
• 10% of high school students aNempted suicide during the past 12 months (vs. 6.3% US average)
• 67% public high school average freshman graduaFon rate (vs. 75% US average)2
March 2011 CPP-‐NMAG Joint Project/ Advancing Vulnerable Children and Families in New Mexico
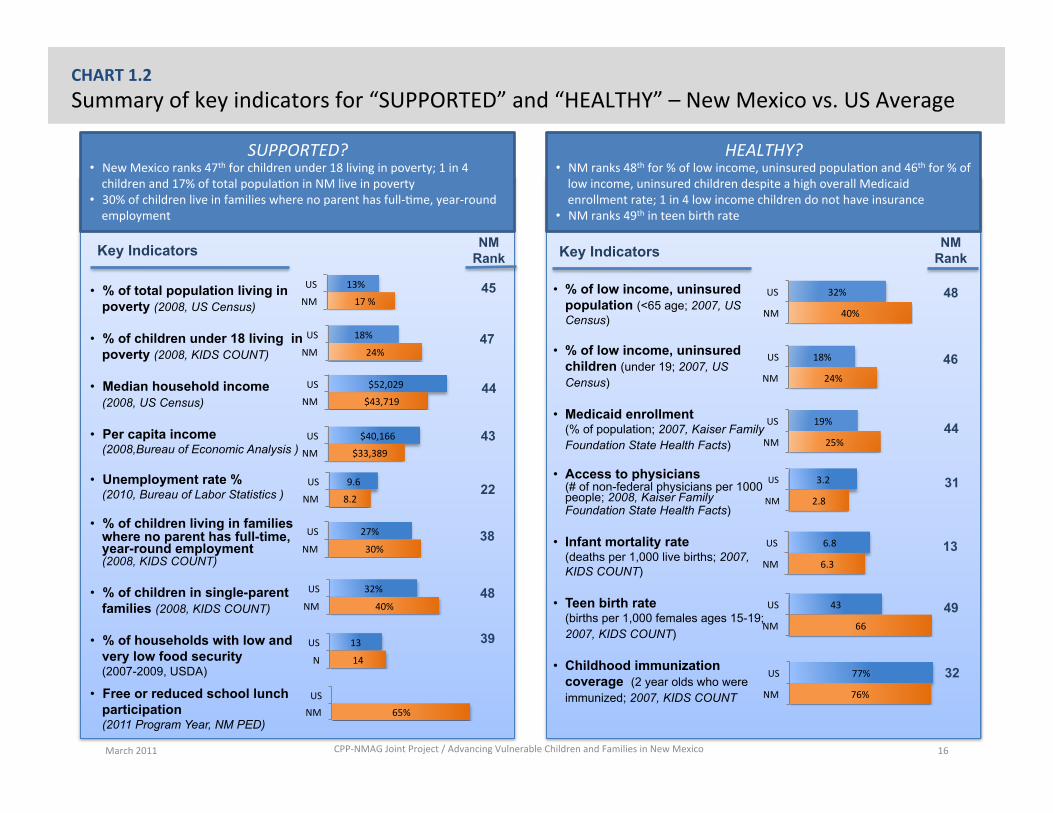
HEALTHY? • NM ranks 48th for % of low income, uninsured popula;on and 46th for % of low income, uninsured children despite a high overall Medicaid enrollment rate; 1 in 4 low income children do not have insurance
• NM ranks 49th in teen birth rate
March 2011 16
24%
18%
NM
US
• % of low income, uninsured population (<65 age; 2007, US Census)
• % of low income, uninsured children (under 19; 2007, US Census)
• Medicaid enrollment (% of population; 2007, Kaiser Family Foundation State Health Facts)
• Access to physicians (# of non-federal physicians per 1000 people; 2008, Kaiser Family Foundation State Health Facts)
• Infant mortality rate (deaths per 1,000 live births; 2007, KIDS COUNT)
• Teen birth rate (births per 1,000 females ages 15-19; 2007, KIDS COUNT)
• Childhood immunization coverage (2 year olds who were immunized; 2007, KIDS COUNT
Key Indicators NM Rank
46
25%
19%
NM
US 44
2.8
3.2
NM
US 31
6.3
6.8
NM
US 13
66
43
NM
US 49
76%
77%
NM
US 32
40%
32%
NM
US 48
SUPPORTED? • New Mexico ranks 47th for children under 18 living in poverty; 1 in 4 children and 17% of total popula;on in NM live in poverty
• 30% of children live in families where no parent has full-‐;me, year-‐round employment
17 %
13%
NM
US • % of total population living in poverty (2008, US Census)
• % of children under 18 living in poverty (2008, KIDS COUNT)
• Median household income (2008, US Census)
• Per capita income (2008,Bureau of Economic Analysis )
• Unemployment rate % (2010, Bureau of Labor Statistics )
• % of children living in families where no parent has full-time, year-round employment (2008, KIDS COUNT)
• % of children in single-parent families (2008, KIDS COUNT)
• % of households with low and very low food security (2007-2009, USDA)
• Free or reduced school lunch participation (2011 Program Year, NM PED)
Key Indicators NM Rank
45
24%
18%
NM
US 47
$43,719
$52,029
NM
US 44
$33,389
$40,166
NM
US 43
30%
27%
NM
US
40%
32%
NM
US
8.2
9.6
NM
US
38
48
14
13
N
US 39
22
CHART 1.2 Summary of key indicators for “SUPPORTED” and “HEALTHY” – New Mexico vs. US Average
65% NM US
CPP-‐NMAG Joint Project / Advancing Vulnerable Children and Families in New Mexico
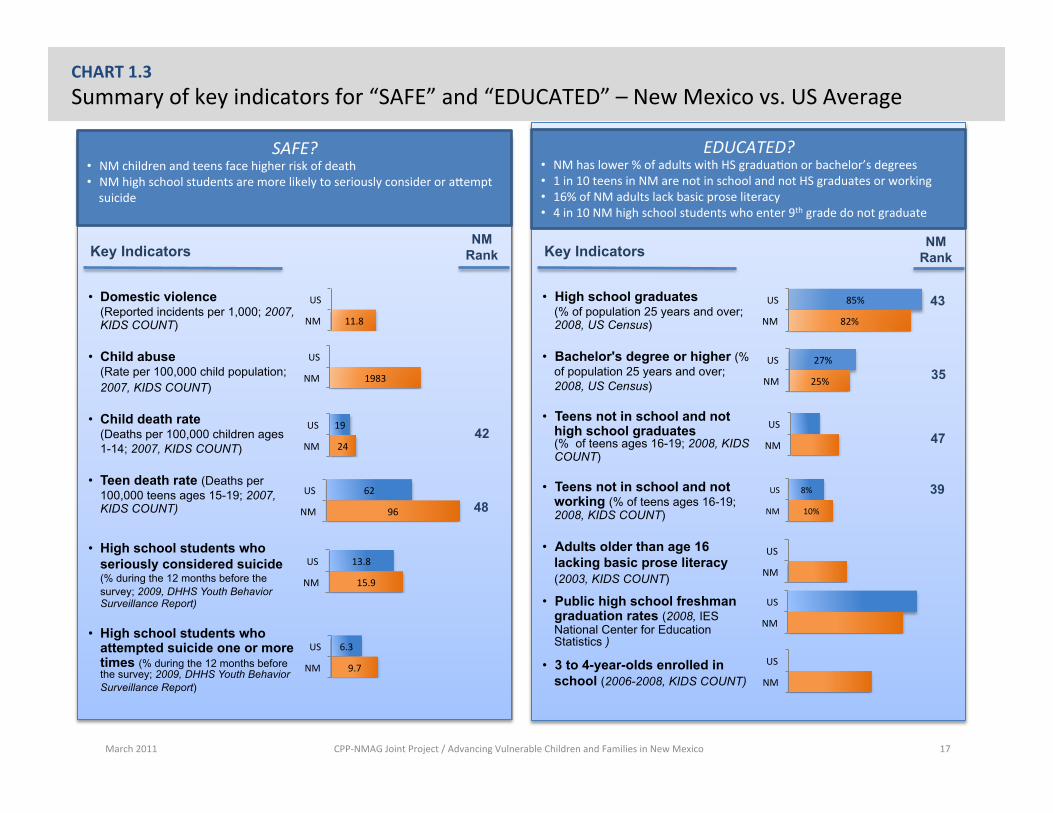
SAFE? • NM children and teens face higher risk of death • NM high school students are more likely to seriously consider or acempt suicide
March 2011 CPP-‐NMAG Joint Project / Advancing Vulnerable Children and Families in New Mexico 17
11.8 NM
US • Domestic violence (Reported incidents per 1,000; 2007, KIDS COUNT)
• Child abuse (Rate per 100,000 child population; 2007, KIDS COUNT)
• Child death rate (Deaths per 100,000 children ages 1-14; 2007, KIDS COUNT)
• Teen death rate (Deaths per 100,000 teens ages 15-19; 2007, KIDS COUNT)
• High school students who seriously considered suicide (% during the 12 months before the survey; 2009, DHHS Youth Behavior Surveillance Report)
• High school students who attempted suicide one or more times (% during the 12 months before the survey; 2009, DHHS Youth Behavior Surveillance Report)
Key Indicators NM
Rank
24
19
NM
US 42
96
62
NM
US
48
15.9
13.8
NM
US
9.7
6.3
NM
US
1983 NM
US
EDUCATED? • NM has lower % of adults with HS gradua;on or bachelor’s degrees • 1 in 10 teens in NM are not in school and not HS graduates or working • 16% of NM adults lack basic prose literacy • 4 in 10 NM high school students who enter 9th grade do not graduate
82%
85%
NM
US • High school graduates (% of population 25 years and over; 2008, US Census)
• Bachelor's degree or higher (% of population 25 years and over; 2008, US Census)
• Teens not in school and not high school graduates (% of teens ages 16-19; 2008, KIDS COUNT)
• Teens not in school and not working (% of teens ages 16-19; 2008, KIDS COUNT)
• Adults older than age 16 lacking basic prose literacy (2003, KIDS COUNT)
• Public high school freshman graduation rates (2008, IES National Center for Education Statistics )
• 3 to 4-year-olds enrolled in school (2006-2008, KIDS COUNT)
Key Indicators NM Rank
43
25%
27%
NM
US 35
NM
US 47
10%
8%
NM
US 39
NM
US
NM
US
NM
US
CHART 1.3 Summary of key indicators for “SAFE” and “EDUCATED” – New Mexico vs. US Average
18
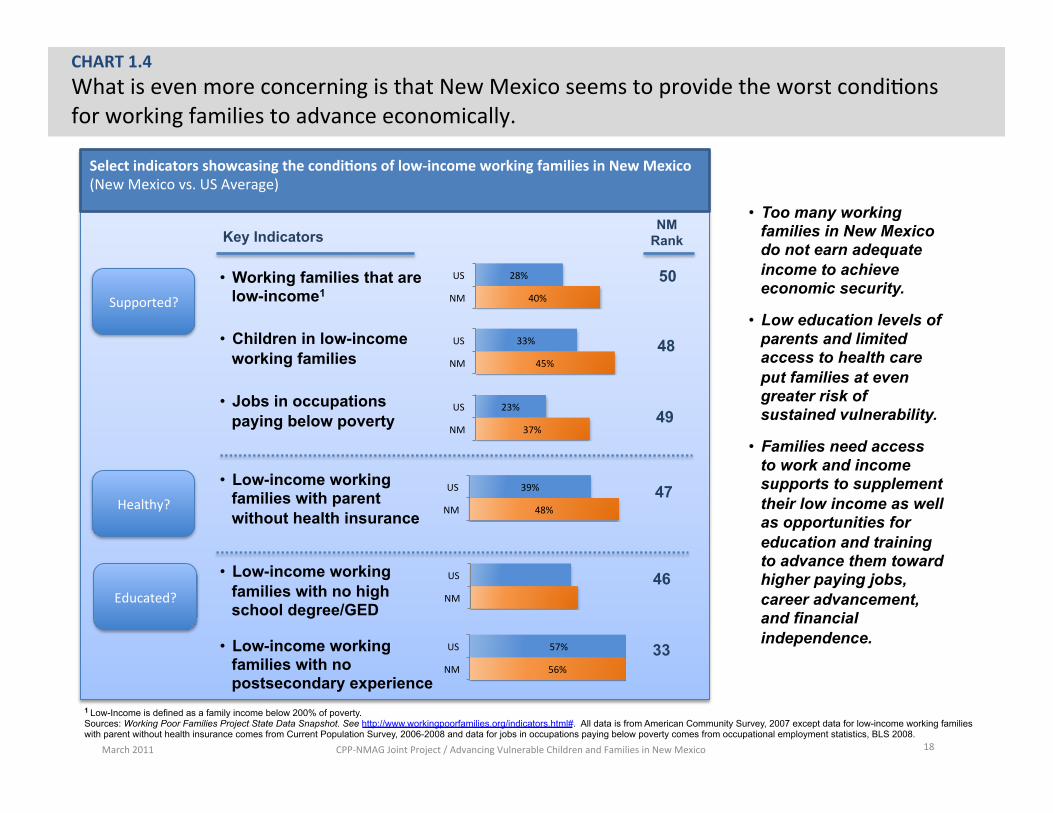
CHART 1.4 What is even more concerning is that New Mexico seems to provide the worst condi;ons for working families to advance economically.
1 Low-Income is defined as a family income below 200% of poverty. Sources: Working Poor Families Project State Data Snapshot. See http://www.workingpoorfamilies.org/indicators.html#. All data is from American Community Survey, 2007 except data for low-income working families with parent without health insurance comes from Current Population Survey, 2006-2008 and data for jobs in occupations paying below poverty comes from occupational employment statistics, BLS 2008.
40%
28%
NM
US • Working families that are low-income1
• Children in low-income working families
• Jobs in occupations paying below poverty
• Low-income working families with parent without health insurance
• Low-income working families with no high school degree/GED
• Low-income working families with no postsecondary experience
Key Indicators NM
Rank
50
48
49
47
46
45%
33%
NM
US
37%
23%
NM
US
48%
39%
NM
US
NM
US
Supported?
Healthy?
Educated?
Select indicators showcasing the condiFons of low-‐income working families in New Mexico (New Mexico vs. US Average)
• Too many working families in New Mexico do not earn adequate income to achieve economic security.
• Low education levels of parents and limited access to health care put families at even greater risk of sustained vulnerability.
• Families need access to work and income supports to supplement their low income as well as opportunities for education and training to advance them toward higher paying jobs, career advancement, and financial independence.
March 2011 CPP-‐NMAG Joint Project / Advancing Vulnerable Children and Families in New Mexico
33 56%
57%
NM
US
March 2011 CPP-‐NMAG Joint Project / Advancing Vulnerable Children and Families in New Mexico 19
TABLE OF CONTENTS
Introduction and Executive Summary
SECTION 1. New Mexico’s Vulnerable Children and Families • Summary of current state by key areas and indicators: Supported, Healthy, Safe, Educated • Highlight on low-income working families
SECTION 2. Priority Counties for Pilot Initiatives and the Need for a Community-based Strategy • Priority counties for community-based strategy pilot • Summary of county-level analysis by key areas and indicators
SECTION 3. Public Benefit Programs and Systematic Challenges to Improving Access • Government benefit programs available to vulnerable children and families in New Mexico • Trends in enrollment, recent improvements and gap in benefits access
SECTION 4. Statewide Non-Profit Initiatives: Best Practices and Missed Opportunities • Examples of key statewide non-profit initiatives • Best practice highlights • Gaps and missed opportunities for improvements
SECTION 5. Improving Benefits Access and Integrated Services: National Best Practice Trends and Early Evidence of Impact
• Barriers to benefits access • Framework for integrated strategy and best practice examples in outreach, service delivery, and system • Early evidence of positive impact on families, system, and economy
SECTION 6. Proposal for a Collaborative Strategy and System Building Process • Six strategies and example initiatives across outreach, service delivery, and system building • Short term potential priority initiatives and next steps
Appendix
20
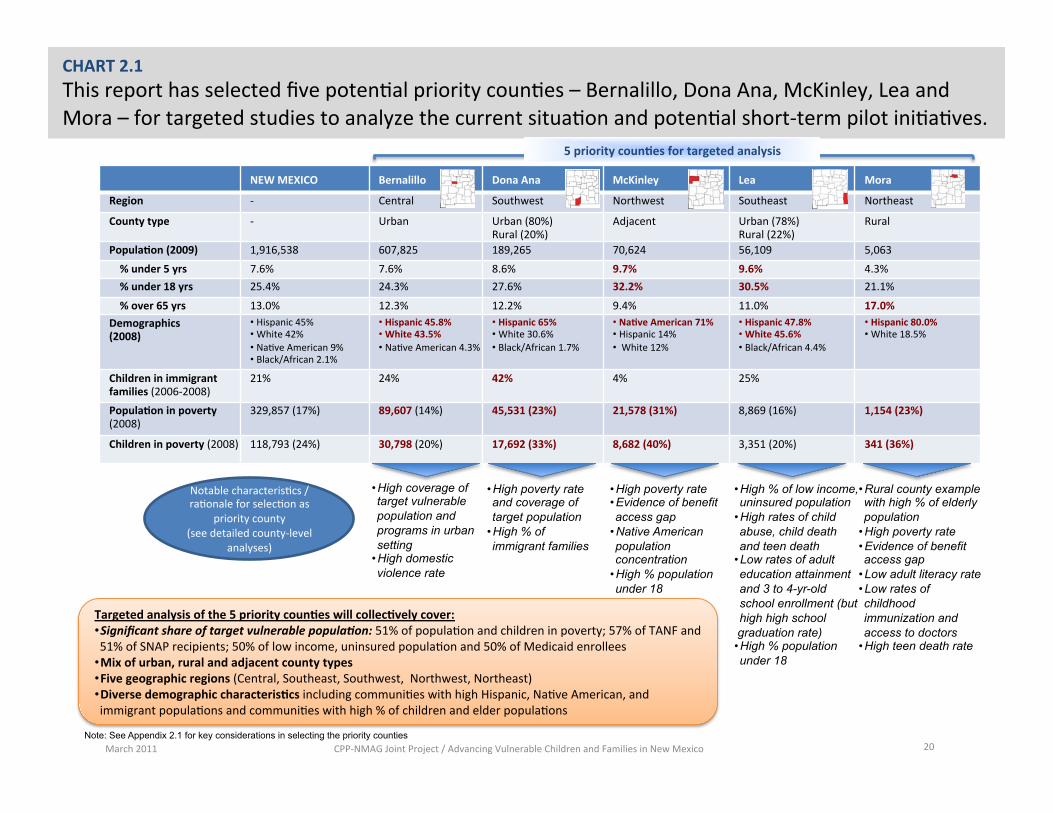
CHART 2.1 This report has selected five poten;al priority coun;es – Bernalillo, Dona Ana, McKinley, Lea and Mora – for targeted studies to analyze the current situa;on and poten;al short-‐term pilot ini;a;ves.
NEW MEXICO Bernalillo Dona Ana McKinley Lea Mora
Region -‐ Central Southwest Northwest Southeast Northeast
County type -‐ Urban Urban (80%) Rural (20%)
Adjacent Urban (78%) Rural (22%)
Rural
PopulaFon (2009) 1,916,538 607,825 189,265 70,624 56,109 5,063 % under 5 yrs 7.6% 7.6% 8.6% 9.7% 9.6% 4.3% % under 18 yrs 25.4% 24.3% 27.6% 32.2% 30.5% 21.1%
% over 65 yrs 13.0% 12.3% 12.2% 9.4% 11.0% 17.0% Demographics (2008)
• Hispanic 45% • White 42% • Na;ve American 9% • Black/African 2.1%
• Hispanic 45.8% • White 43.5% • Na;ve American 4.3%
• Hispanic 65% • White 30.6% • Black/African 1.7%
• NaFve American 71% • Hispanic 14% • White 12%
• Hispanic 47.8% • White 45.6% • Black/African 4.4%
• Hispanic 80.0% • White 18.5%
Children in immigrant families (2006-‐2008)
21% 24% 42% 4% 25%
PopulaFon in poverty (2008)
329,857 (17%) 89,607 (14%) 45,531 (23%) 21,578 (31%) 8,869 (16%) 1,154 (23%)
Children in poverty (2008) 118,793 (24%) 30,798 (20%) 17,692 (33%) 8,682 (40%) 3,351 (20%) 341 (36%)
Notable characteris;cs / ra;onale for selec;on as
priority county (see detailed county-‐level
analyses)
• High coverage of target vulnerable population and programs in urban setting
• High domestic violence rate
• High poverty rate and coverage of target population
• High % of immigrant families
• High poverty rate • Evidence of benefit access gap
• Native American population concentration
• High % population under 18
• High % of low income, uninsured population
• High rates of child abuse, child death and teen death
• Low rates of adult education attainment and 3 to 4-yr-old school enrollment (but high high school
graduation rate) • High % population under 18
• Rural county example with high % of elderly population
• High poverty rate • Evidence of benefit access gap
• Low adult literacy rate • Low rates of childhood immunization and access to doctors
• High teen death rate
Targeted analysis of the 5 priority counFes will collecFvely cover: • Significant share of target vulnerable popula5on: 51% of popula;on and children in poverty; 57% of TANF and 51% of SNAP recipients; 50% of low income, uninsured popula;on and 50% of Medicaid enrollees
• Mix of urban, rural and adjacent county types • Five geographic regions (Central, Southeast, Southwest, Northwest, Northeast) • Diverse demographic characterisFcs including communi;es with high Hispanic, Na;ve American, and immigrant popula;ons and communi;es with high % of children and elder popula;ons
5 priority counFes for targeted analysis
March 2011 CPP-‐NMAG Joint Project / Advancing Vulnerable Children and Families in New Mexico Note: See Appendix 2.1 for key considerations in selecting the priority counties
March 2011 CPP-‐NMAG Joint Project / Advancing Vulnerable Children and Families in New Mexico 21
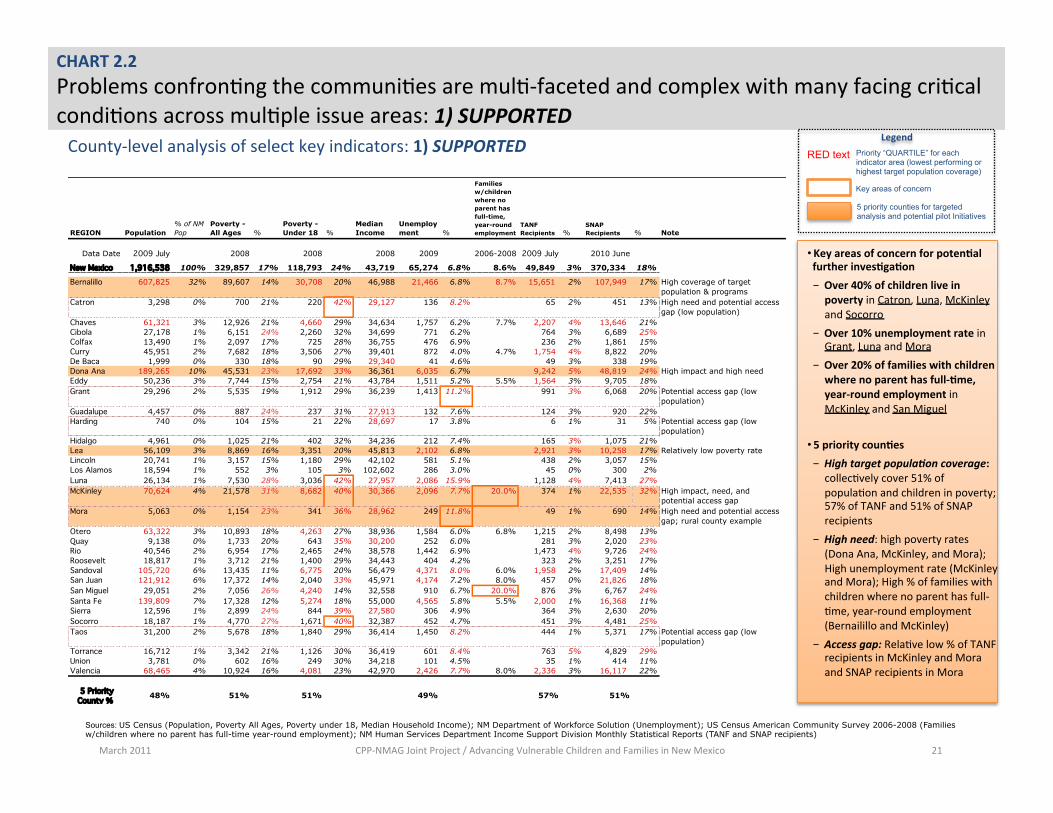
CHART 2.2 Problems confron;ng the communi;es are mul;-‐faceted and complex with many facing cri;cal condi;ons across mul;ple issue areas: 1) SUPPORTED
• Key areas of concern for potenFal further invesFgaFon - Over 40% of children live in poverty in Catron, Luna, McKinley and Socorro
- Over 10% unemployment rate in Grant, Luna and Mora
- Over 20% of families with children where no parent has full-‐Fme, year-‐round employment in McKinley and San Miguel
• 5 priority counFes - High target popula5on coverage: collec;vely cover 51% of popula;on and children in poverty; 57% of TANF and 51% of SNAP recipients
- High need: high poverty rates (Dona Ana, McKinley, and Mora); High unemployment rate (McKinley and Mora); High % of families with children where no parent has full-‐;me, year-‐round employment (Bernailillo and McKinley)
- Access gap: Rela;ve low % of TANF recipients in McKinley and Mora and SNAP recipients in Mora
Key areas of concern
Priority “QUARTILE” for each indicator area (lowest performing or highest target population coverage)
RED text Legend County-‐level analysis of select key indicators: 1) SUPPORTED
5 priority counties for targeted analysis and potential pilot Initiatives
Sources: US Census (Population, Poverty All Ages, Poverty under 18, Median Household Income); NM Department of Workforce Solution (Unemployment); US Census American Community Survey 2006-2008 (Families w/children where no parent has full-time year-round employment); NM Human Services Department Income Support Division Monthly Statistical Reports (TANF and SNAP recipients)
REGION Population% of NM Pop
Poverty - All Ages %
Poverty - Under 18 %
Median Income
Unemployment %
Families w/children where no parent has full-time, year-round employment
TANF Recipients %
SNAP Recipients % Note
Data Date 2009 July 2008 2008 2008 2009 2006-2008 2009 July 2010 June
New Mexico 1,916,538 100% 329,857 17% 118,793 24% 43,719 65,274 6.8% 8.6% 49,849 3% 370,334 18%
Bernalillo 607,825 32% 89,607 14% 30,708 20% 46,988 21,466 6.8% 8.7% 15,651 2% 107,949 17% High coverage of target population & programs
Catron 3,298 0% 700 21% 220 42% 29,127 136 8.2% 65 2% 451 13% High need and potential access gap (low population)
Chaves 61,321 3% 12,926 21% 4,660 29% 34,634 1,757 6.2% 7.7% 2,207 4% 13,646 21%Cibola 27,178 1% 6,151 24% 2,260 32% 34,699 771 6.2% 764 3% 6,689 25%Colfax 13,490 1% 2,097 17% 725 28% 36,755 476 6.9% 236 2% 1,861 15%Curry 45,951 2% 7,682 18% 3,506 27% 39,401 872 4.0% 4.7% 1,754 4% 8,822 20%De Baca 1,999 0% 330 18% 90 29% 29,340 41 4.6% 49 3% 338 19%Dona Ana 189,265 10% 45,531 23% 17,692 33% 36,361 6,035 6.7% 9,242 5% 48,819 24% High impact and high needEddy 50,236 3% 7,744 15% 2,754 21% 43,784 1,511 5.2% 5.5% 1,564 3% 9,705 18%Grant 29,296 2% 5,535 19% 1,912 29% 36,239 1,413 11.2% 991 3% 6,068 20% Potential access gap (low
population)Guadalupe 4,457 0% 887 24% 237 31% 27,913 132 7.6% 124 3% 920 22%Harding 740 0% 104 15% 21 22% 28,697 17 3.8% 6 1% 31 5% Potential access gap (low
population)Hidalgo 4,961 0% 1,025 21% 402 32% 34,236 212 7.4% 165 3% 1,075 21%Lea 56,109 3% 8,869 16% 3,351 20% 45,813 2,102 6.8% 2,921 3% 10,258 17% Relatively low poverty rateLincoln 20,741 1% 3,157 15% 1,180 29% 42,102 581 5.1% 438 2% 3,057 15%Los Alamos 18,594 1% 552 3% 105 3% 102,602 286 3.0% 45 0% 300 2%Luna 26,134 1% 7,530 28% 3,036 42% 27,957 2,086 15.9% 1,128 4% 7,413 27%McKinley 70,624 4% 21,578 31% 8,682 40% 30,366 2,096 7.7% 20.0% 374 1% 22,535 32% High impact, need, and
potential access gapMora 5,063 0% 1,154 23% 341 36% 28,962 249 11.8% 49 1% 690 14% High need and potential access
gap; rural county exampleOtero 63,322 3% 10,893 18% 4,263 27% 38,936 1,584 6.0% 6.8% 1,215 2% 8,498 13%Quay 9,138 0% 1,733 20% 643 35% 30,200 252 6.0% 281 3% 2,020 23%Rio 40,546 2% 6,954 17% 2,465 24% 38,578 1,442 6.9% 1,473 4% 9,726 24%Roosevelt 18,817 1% 3,712 21% 1,400 29% 34,443 404 4.2% 323 2% 3,251 17%Sandoval 105,720 6% 13,435 11% 6,775 20% 56,479 4,371 8.0% 6.0% 1,958 2% 17,409 14%San Juan 121,912 6% 17,372 14% 2,040 33% 45,971 4,174 7.2% 8.0% 457 0% 21,826 18%San Miguel 29,051 2% 7,056 26% 4,240 14% 32,558 910 6.7% 20.0% 876 3% 6,767 24%Santa Fe 139,809 7% 17,328 12% 5,274 18% 55,000 4,565 5.8% 5.5% 2,000 1% 16,368 11%Sierra 12,596 1% 2,899 24% 844 39% 27,580 306 4.9% 364 3% 2,630 20%Socorro 18,187 1% 4,770 27% 1,671 40% 32,387 452 4.7% 451 3% 4,481 25%Taos 31,200 2% 5,678 18% 1,840 29% 36,414 1,450 8.2% 444 1% 5,371 17% Potential access gap (low
population)Torrance 16,712 1% 3,342 21% 1,126 30% 36,419 601 8.4% 763 5% 4,829 29%Union 3,781 0% 602 16% 249 30% 34,218 101 4.5% 35 1% 414 11%Valencia 68,465 4% 10,924 16% 4,081 23% 42,970 2,426 7.7% 8.0% 2,336 3% 16,117 22%
5 Priority County % 48% 51% 51% 49% 57% 51%
March 2011 CPP-‐NMAG Joint Project / Advancing Vulnerable Children and Families in New Mexico 22
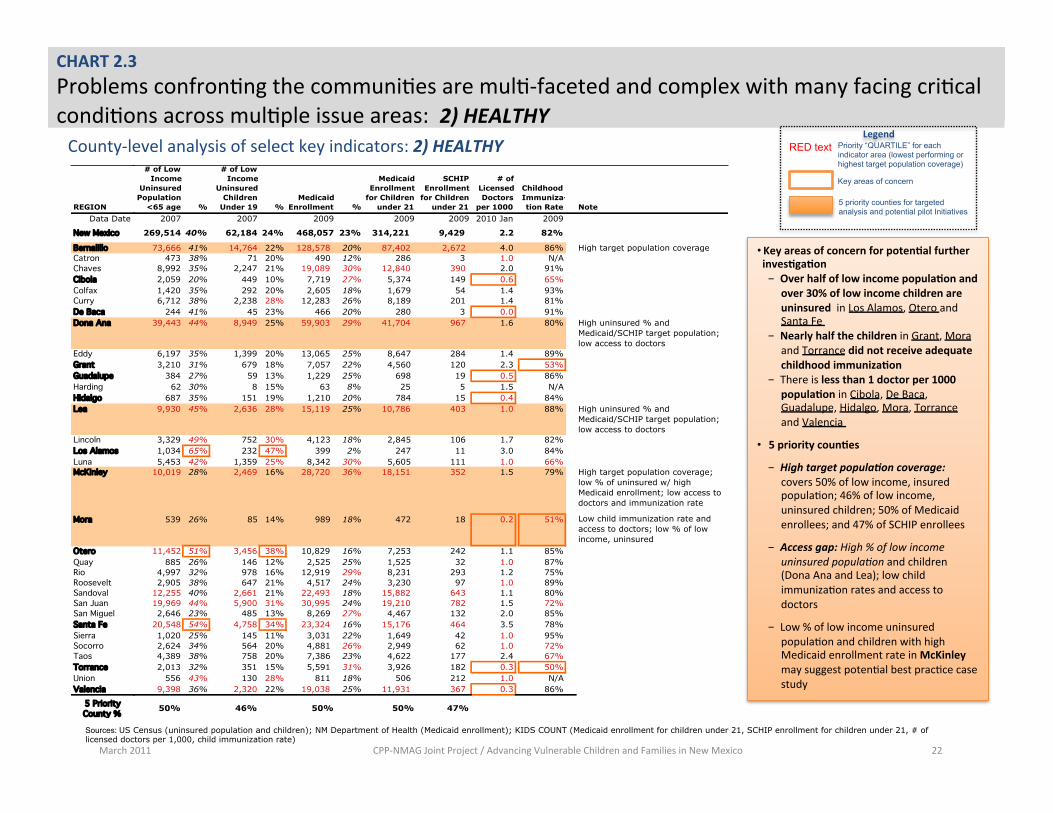
• Key areas of concern for potenFal further invesFgaFon - Over half of low income populaFon and
over 30% of low income children are uninsured in Los Alamos, Otero and Santa Fe
- Nearly half the children in Grant, Mora and Torrance did not receive adequate childhood immunizaFon
- There is less than 1 doctor per 1000 populaFon in Cibola, De Baca, Guadalupe, Hidalgo, Mora, Torrance and Valencia
• 5 priority counFes
- High target popula5on coverage: covers 50% of low income, insured popula;on; 46% of low income, uninsured children; 50% of Medicaid enrollees; and 47% of SCHIP enrollees
- Access gap: High % of low income uninsured populaIon and children (Dona Ana and Lea); low child immuniza;on rates and access to doctors
- Low % of low income uninsured popula;on and children with high Medicaid enrollment rate in McKinley may suggest poten;al best prac;ce case study
CHART 2.3 Problems confron;ng the communi;es are mul;-‐faceted and complex with many facing cri;cal condi;ons across mul;ple issue areas: 2) HEALTHY County-‐level analysis of select key indicators: 2) HEALTHY
Key areas of concern
Priority “QUARTILE” for each indicator area (lowest performing or highest target population coverage)
RED text Legend
5 priority counties for targeted analysis and potential pilot Initiatives
Sources: US Census (uninsured population and children); NM Department of Health (Medicaid enrollment); KIDS COUNT (Medicaid enrollment for children under 21, SCHIP enrollment for children under 21, # of licensed doctors per 1,000, child immunization rate)
REGIONData Date
New MexicoBernalilloCatronChavesCibolaColfaxCurryDe BacaDona Ana
EddyGrantGuadalupeHardingHidalgoLea
LincolnLos AlamosLunaMcKinley
Mora
OteroQuayRioRooseveltSandovalSan JuanSan MiguelSanta FeSierraSocorroTaosTorranceUnionValencia
5 Priority County %
# of Low Income
Uninsured Population
<65 age %
# of Low Income
Uninsured Children
Under 19 %Medicaid
Enrollment %
Medicaid Enrollment
for Children under 21
SCHIP Enrollment
for Children under 21
# of Licensed Doctors
per 1000
Childhood Immuniza-tion Rate Note
2007 2007 2009 2009 2009 2010 Jan 2009
269,514 40% 62,184 24% 468,057 23% 314,221 9,429 2.2 82%
73,666 41% 14,764 22% 128,578 20% 87,402 2,672 4.0 86% High target population coverage473 38% 71 20% 490 12% 286 3 1.0 N/A
8,992 35% 2,247 21% 19,089 30% 12,840 390 2.0 91%2,059 20% 449 10% 7,719 27% 5,374 149 0.6 65%1,420 35% 292 20% 2,605 18% 1,679 54 1.4 93%6,712 38% 2,238 28% 12,283 26% 8,189 201 1.4 81%
244 41% 45 23% 466 20% 280 3 0.0 91%39,443 44% 8,949 25% 59,903 29% 41,704 967 1.6 80% High uninsured % and
Medicaid/SCHIP target population; low access to doctors
6,197 35% 1,399 20% 13,065 25% 8,647 284 1.4 89%3,210 31% 679 18% 7,057 22% 4,560 120 2.3 53%
384 27% 59 13% 1,229 25% 698 19 0.5 86%62 30% 8 15% 63 8% 25 5 1.5 N/A
687 35% 151 19% 1,210 20% 784 15 0.4 84%9,930 45% 2,636 28% 15,119 25% 10,786 403 1.0 88% High uninsured % and
Medicaid/SCHIP target population; low access to doctors
3,329 49% 752 30% 4,123 18% 2,845 106 1.7 82%1,034 65% 232 47% 399 2% 247 11 3.0 84%5,453 42% 1,359 25% 8,342 30% 5,605 111 1.0 66%
10,019 28% 2,469 16% 28,720 36% 18,151 352 1.5 79% High target population coverage; low % of uninsured w/ high Medicaid enrollment; low access to doctors and immunization rate
539 26% 85 14% 989 18% 472 18 0.2 51% Low child immunization rate and access to doctors; low % of low income, uninsured
11,452 51% 3,456 38% 10,829 16% 7,253 242 1.1 85%885 26% 146 12% 2,525 25% 1,525 32 1.0 87%
4,997 32% 978 16% 12,919 29% 8,231 293 1.2 75%2,905 38% 647 21% 4,517 24% 3,230 97 1.0 89%
12,255 40% 2,661 21% 22,493 18% 15,882 643 1.1 80%19,969 44% 5,900 31% 30,995 24% 19,210 782 1.5 72%2,646 23% 485 13% 8,269 27% 4,467 132 2.0 85%
20,548 54% 4,758 34% 23,324 16% 15,176 464 3.5 78%1,020 25% 145 11% 3,031 22% 1,649 42 1.0 95%2,624 34% 564 20% 4,881 26% 2,949 62 1.0 72%4,389 38% 758 20% 7,386 23% 4,622 177 2.4 67%2,013 32% 351 15% 5,591 31% 3,926 182 0.3 50%
556 43% 130 28% 811 18% 506 212 1.0 N/A9,398 36% 2,320 22% 19,038 25% 11,931 367 0.3 86%
50% 46% 50% 50% 47%
March 2011 CPP-‐NMAG Joint Project / Advancing Vulnerable Children and Families in New Mexico 23
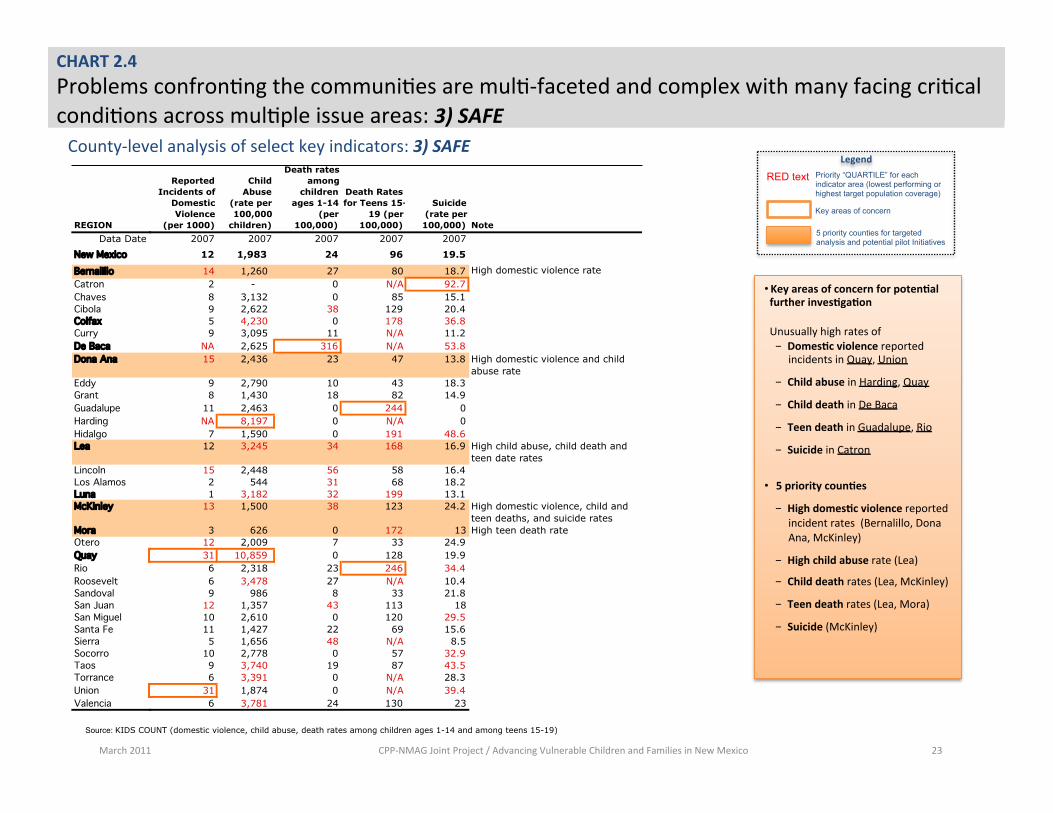
• Key areas of concern for potenFal further invesFgaFon Unusually high rates of - DomesFc violence reported
incidents in Quay, Union
- Child abuse in Harding, Quay
- Child death in De Baca
- Teen death in Guadalupe, Rio
- Suicide in Catron
• 5 priority counFes
- High domesFc violence reported incident rates (Bernalillo, Dona Ana, McKinley)
- High child abuse rate (Lea) - Child death rates (Lea, McKinley)
- Teen death rates (Lea, Mora)
- Suicide (McKinley)
CHART 2.4 Problems confron;ng the communi;es are mul;-‐faceted and complex with many facing cri;cal condi;ons across mul;ple issue areas: 3) SAFE County-‐level analysis of select key indicators: 3) SAFE
Key areas of concern
Priority “QUARTILE” for each indicator area (lowest performing or highest target population coverage)
RED text Legend
5 priority counties for targeted analysis and potential pilot Initiatives
Source: KIDS COUNT (domestic violence, child abuse, death rates among children ages 1-14 and among teens 15-19)
REGIONData Date
New MexicoBernalilloCatronChavesCibolaColfaxCurryDe BacaDona Ana
EddyGrantGuadalupeHardingHidalgoLea
LincolnLos AlamosLunaMcKinley
MoraOteroQuayRioRooseveltSandovalSan JuanSan MiguelSanta FeSierraSocorroTaosTorranceUnionValencia
Reported Incidents of
Domestic Violence
(per 1000)
Child Abuse
(rate per 100,000
children)
Death rates among
children ages 1-14
(per 100,000)
Death Rates for Teens 15-
19 (per 100,000)
Suicide (rate per 100,000) Note
2007 2007 2007 2007 200712 1,983 24 96 19.5
14 1,260 27 80 18.7 High domestic violence rate2 - 0 N/A 92.78 3,132 0 85 15.19 2,622 38 129 20.45 4,230 0 178 36.89 3,095 11 N/A 11.2
NA 2,625 316 N/A 53.815 2,436 23 47 13.8 High domestic violence and child
abuse rate9 2,790 10 43 18.38 1,430 18 82 14.9
11 2,463 0 244 0NA 8,197 0 N/A 0
7 1,590 0 191 48.612 3,245 34 168 16.9 High child abuse, child death and
teen date rates15 2,448 56 58 16.42 544 31 68 18.21 3,182 32 199 13.1
13 1,500 38 123 24.2 High domestic violence, child and teen deaths, and suicide rates
3 626 0 172 13 High teen death rate12 2,009 7 33 24.931 10,859 0 128 19.96 2,318 23 246 34.46 3,478 27 N/A 10.49 986 8 33 21.8
12 1,357 43 113 1810 2,610 0 120 29.511 1,427 22 69 15.65 1,656 48 N/A 8.5
10 2,778 0 57 32.99 3,740 19 87 43.56 3,391 0 N/A 28.3
31 1,874 0 N/A 39.46 3,781 24 130 23
March 2011 CPP-‐NMAG Joint Project / Advancing Vulnerable Children and Families in New Mexico 24
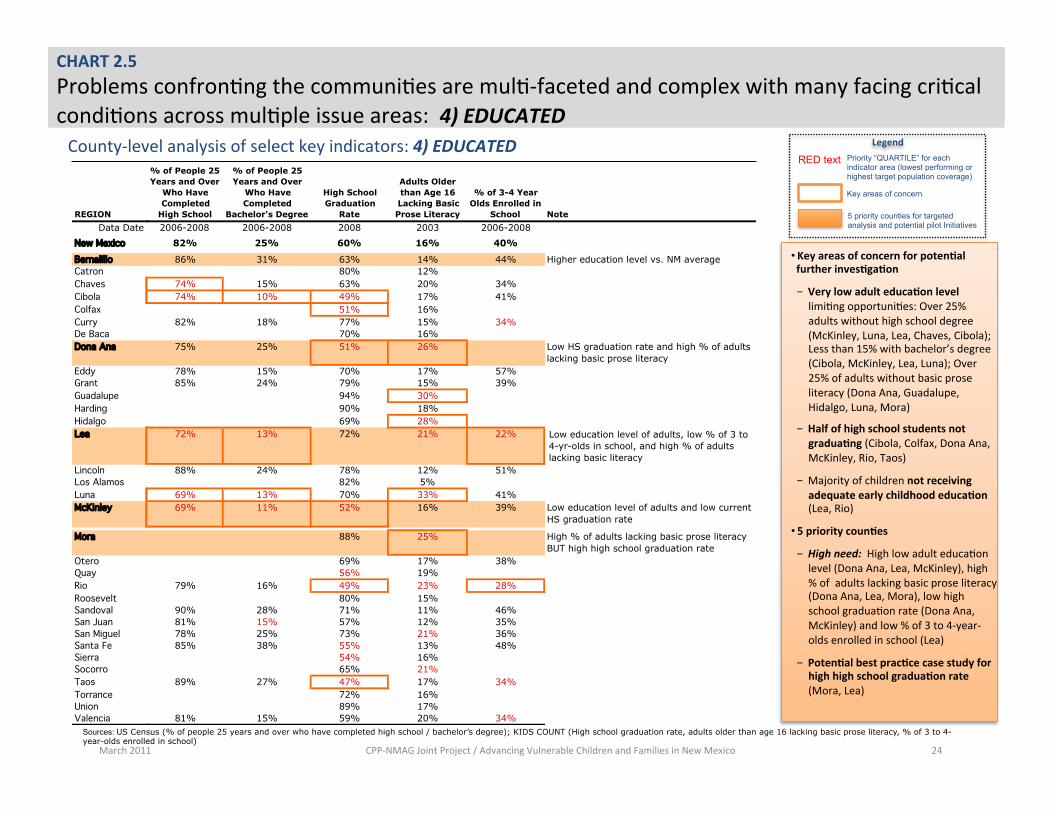
• Key areas of concern for potenFal further invesFgaFon
- Very low adult educaFon level limi;ng opportuni;es: Over 25% adults without high school degree (McKinley, Luna, Lea, Chaves, Cibola); Less than 15% with bachelor’s degree (Cibola, McKinley, Lea, Luna); Over 25% of adults without basic prose literacy (Dona Ana, Guadalupe, Hidalgo, Luna, Mora)
- Half of high school students not graduaFng (Cibola, Colfax, Dona Ana, McKinley, Rio, Taos)
- Majority of children not receiving adequate early childhood educaFon (Lea, Rio)
• 5 priority counFes
- High need: High low adult educa;on level (Dona Ana, Lea, McKinley), high % of adults lacking basic prose literacy (Dona Ana, Lea, Mora), low high school gradua;on rate (Dona Ana, McKinley) and low % of 3 to 4-‐year-‐ olds enrolled in school (Lea)
- PotenFal best pracFce case study for high high school graduaFon rate (Mora, Lea)
CHART 2.5 Problems confron;ng the communi;es are mul;-‐faceted and complex with many facing cri;cal condi;ons across mul;ple issue areas: 4) EDUCATED County-‐level analysis of select key indicators: 4) EDUCATED
Key areas of concern
Priority “QUARTILE” for each indicator area (lowest performing or highest target population coverage)
RED text Legend
5 priority counties for targeted analysis and potential pilot Initiatives
Sources: US Census (% of people 25 years and over who have completed high school / bachelor’s degree); KIDS COUNT (High school graduation rate, adults older than age 16 lacking basic prose literacy, % of 3 to 4- year-olds enrolled in school)
REGIONData Date
New MexicoBernalilloCatronChavesCibolaColfaxCurryDe BacaDona Ana
EddyGrantGuadalupeHardingHidalgoLea
LincolnLos AlamosLunaMcKinley
Mora
OteroQuayRioRooseveltSandovalSan JuanSan MiguelSanta FeSierraSocorroTaosTorranceUnionValencia
% of People 25 Years and Over
Who Have Completed
High School
% of People 25 Years and Over
Who Have Completed
Bachelor's Degree
High School Graduation
Rate
Adults Older than Age 16 Lacking Basic Prose Literacy
% of 3-4 Year Olds Enrolled in
School Note2006-2008 2006-2008 2008 2003 2006-2008
82% 25% 60% 16% 40%
86% 31% 63% 14% 44% Higher education level vs. NM average80% 12%
74% 15% 63% 20% 34%74% 10% 49% 17% 41%
51% 16%82% 18% 77% 15% 34%
70% 16%75% 25% 51% 26% Low HS graduation rate and high % of adults
lacking basic prose literacy78% 15% 70% 17% 57%85% 24% 79% 15% 39%
94% 30%90% 18%69% 28%
72% 13% 72% 21% 22% Low education level of adults, low % of 3-4 yr olds in school, and high % of adults lacking basic literacy
88% 24% 78% 12% 51%82% 5%
69% 13% 70% 33% 41%69% 11% 52% 16% 39% Low education level of adults and low current
HS graduation rate
88% 25% High % of adults lacking basic prose literacy BUT high high school graduation rate
69% 17% 38%56% 19%
79% 16% 49% 23% 28%80% 15%
90% 28% 71% 11% 46%81% 15% 57% 12% 35%78% 25% 73% 21% 36%85% 38% 55% 13% 48%
54% 16%65% 21%
89% 27% 47% 17% 34%72% 16%89% 17%
81% 15% 59% 20% 34%
Low education level of adults, low % of 3 to 4-yr-olds in school, and high % of adults lacking basic literacy
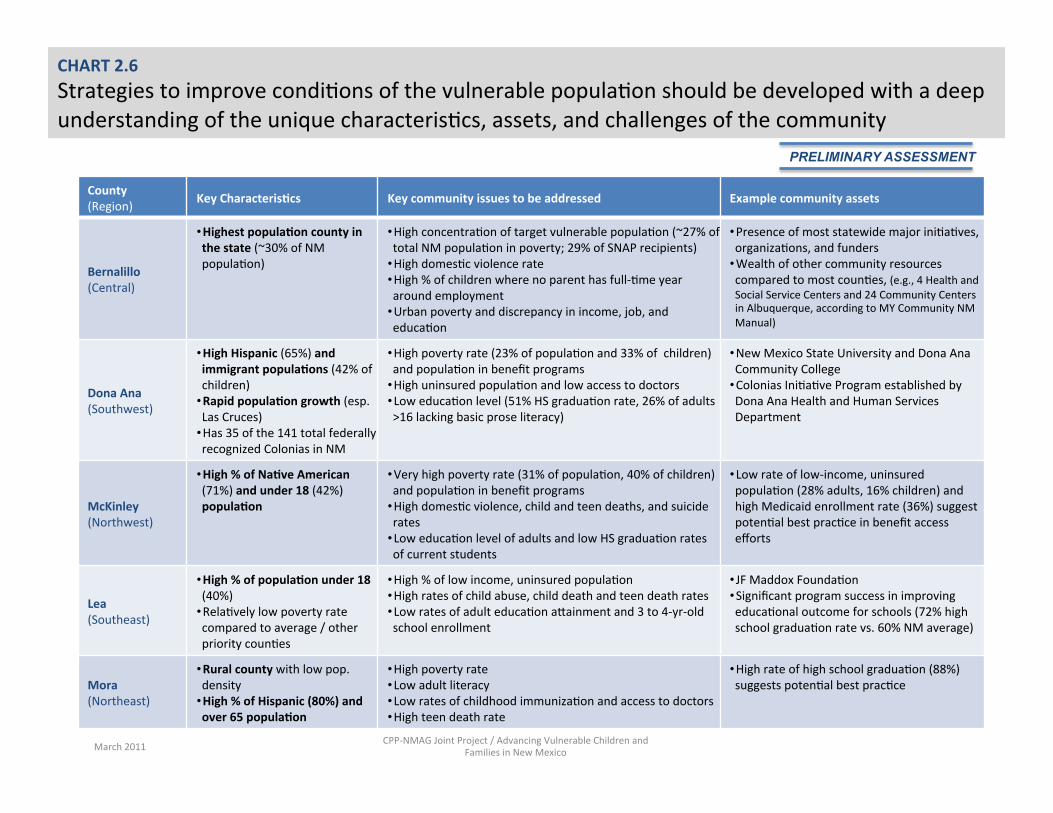
CHART 2.6 Strategies to improve condi;ons of the vulnerable popula;on should be developed with a deep understanding of the unique characteris;cs, assets, and challenges of the community
March 2011 CPP-‐NMAG Joint Project / Advancing Vulnerable Children and Families in New Mexico
County (Region) Key CharacterisFcs Key community issues to be addressed Example community assets
Bernalillo (Central)
• Highest populaFon county in the state (~30% of NM popula;on)
• High concentra;on of target vulnerable popula;on (~27% of total NM popula;on in poverty; 29% of SNAP recipients)
• High domes;c violence rate • High % of children where no parent has full-‐;me year around employment
• Urban poverty and discrepancy in income, job, and educa;on
• Presence of most statewide major ini;a;ves, organiza;ons, and funders
• Wealth of other community resources compared to most coun;es, (e.g., 4 Health and Social Service Centers and 24 Community Centers in Albuquerque, according to MY Community NM Manual)
Dona Ana (Southwest)
• High Hispanic (65%) and immigrant populaFons (42% of children)
• Rapid populaFon growth (esp. Las Cruces)
• Has 35 of the 141 total federally recognized Colonias in NM
• High poverty rate (23% of popula;on and 33% of children) and popula;on in benefit programs
• High uninsured popula;on and low access to doctors • Low educa;on level (51% HS gradua;on rate, 26% of adults >16 lacking basic prose literacy)
• New Mexico State University and Dona Ana Community College
• Colonias Ini;a;ve Program established by Dona Ana Health and Human Services Department
McKinley (Northwest)
• High % of NaFve American (71%) and under 18 (42%) populaFon
• Very high poverty rate (31% of popula;on, 40% of children) and popula;on in benefit programs
• High domes;c violence, child and teen deaths, and suicide rates
• Low educa;on level of adults and low HS gradua;on rates of current students
• Low rate of low-‐income, uninsured popula;on (28% adults, 16% children) and high Medicaid enrollment rate (36%) suggest poten;al best prac;ce in benefit access efforts
Lea (Southeast)
• High % of populaFon under 18 (40%)
• Rela;vely low poverty rate compared to average / other priority coun;es
• High % of low income, uninsured popula;on • High rates of child abuse, child death and teen death rates • Low rates of adult educa;on acainment and 3 to 4-‐yr-‐old school enrollment
• JF Maddox Founda;on • Significant program success in improving educa;onal outcome for schools (72% high school gradua;on rate vs. 60% NM average)
Mora (Northeast)
• Rural county with low pop. density
• High % of Hispanic (80%) and over 65 populaFon
• High poverty rate • Low adult literacy • Low rates of childhood immuniza;on and access to doctors • High teen death rate
• High rate of high school gradua;on (88%) suggests poten;al best prac;ce
PRELIMINARY ASSESSMENT
March 2011 CPP-‐NMAG Joint Project / Advancing Vulnerable Children and Families in New Mexico 26
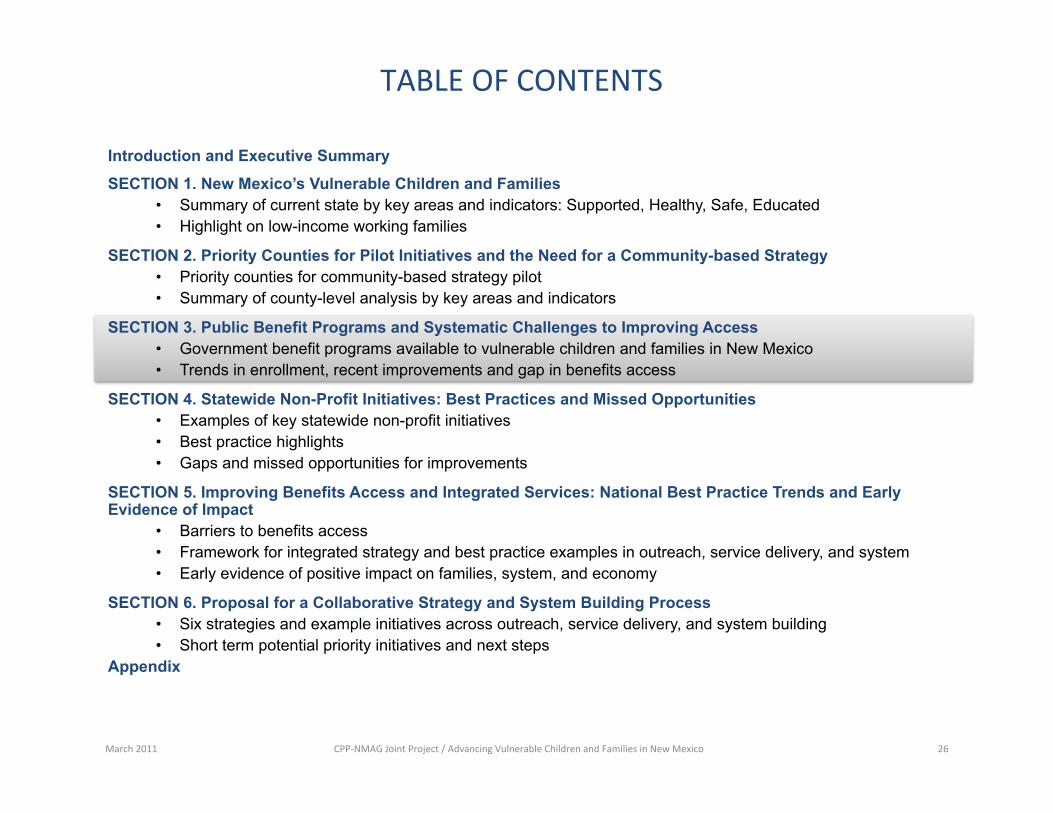
TABLE OF CONTENTS
Introduction and Executive Summary
SECTION 1. New Mexico’s Vulnerable Children and Families • Summary of current state by key areas and indicators: Supported, Healthy, Safe, Educated • Highlight on low-income working families
SECTION 2. Priority Counties for Pilot Initiatives and the Need for a Community-based Strategy • Priority counties for community-based strategy pilot • Summary of county-level analysis by key areas and indicators
SECTION 3. Public Benefit Programs and Systematic Challenges to Improving Access • Government benefit programs available to vulnerable children and families in New Mexico • Trends in enrollment, recent improvements and gap in benefits access
SECTION 4. Statewide Non-Profit Initiatives: Best Practices and Missed Opportunities • Examples of key statewide non-profit initiatives • Best practice highlights • Gaps and missed opportunities for improvements
SECTION 5. Improving Benefits Access and Integrated Services: National Best Practice Trends and Early Evidence of Impact
• Barriers to benefits access • Framework for integrated strategy and best practice examples in outreach, service delivery, and system • Early evidence of positive impact on families, system, and economy
SECTION 6. Proposal for a Collaborative Strategy and System Building Process • Six strategies and example initiatives across outreach, service delivery, and system building • Short term potential priority initiatives and next steps
Appendix
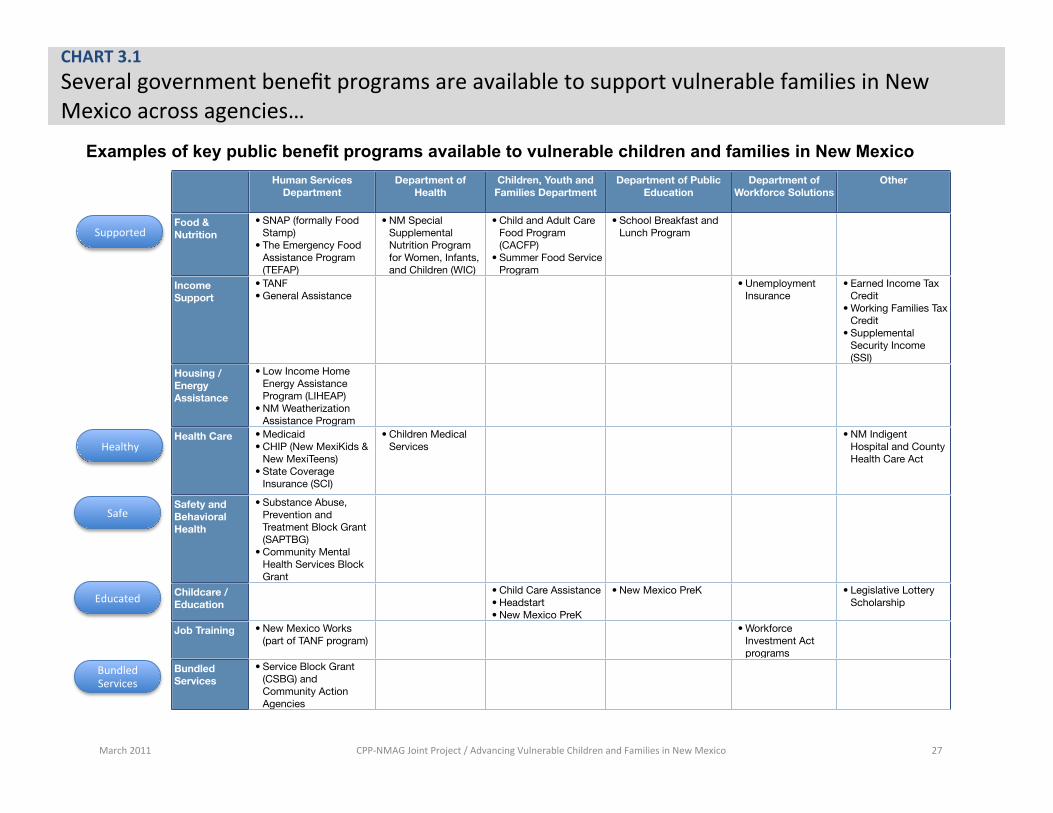
CHART 3.1 Several government benefit programs are available to support vulnerable families in New Mexico across agencies…
March 2011 CPP-‐NMAG Joint Project / Advancing Vulnerable Children and Families in New Mexico 27
Supported
Healthy
Safe
Educated
Bundled Services
Examples of key public benefit programs available to vulnerable children and families in New Mexico Human Services
DepartmentDepartment of
HealthChildren, Youth and
Families DepartmentDepartment of Public
EducationDepartment of
Workforce SolutionsOther
Food & Nutrition
Income Support
Housing / Energy Assistance
Health Care
Safety and Behavioral Health
Childcare / Education
Job Training
Bundled Services
• SNAP (formally Food Stamp)
• The Emergency Food Assistance Program (TEFAP)
• NM Special Supplemental Nutrition Program for Women, Infants, and Children (WIC)
• Child and Adult Care Food Program (CACFP)
• Summer Food Service Program
• School Breakfast and Lunch Program
• TANF • General Assistance
• Unemployment Insurance
• Earned Income Tax Credit
• Working Families Tax Credit
• Supplemental Security Income (SSI)
• Low Income Home Energy Assistance Program (LIHEAP)
• NM Weatherization Assistance Program
• Medicaid• CHIP (New MexiKids &
New MexiTeens)• State Coverage
Insurance (SCI)
• Children Medical Services
• NM Indigent Hospital and County Health Care Act
• Substance Abuse, Prevention and Treatment Block Grant (SAPTBG)
• Community Mental Health Services Block Grant
• Child Care Assistance• Headstart • New Mexico PreK
• New Mexico PreK • Legislative Lottery Scholarship
• New Mexico Works (part of TANF program)
• Workforce Investment Act programs
• Service Block Grant (CSBG) and Community Action Agencies
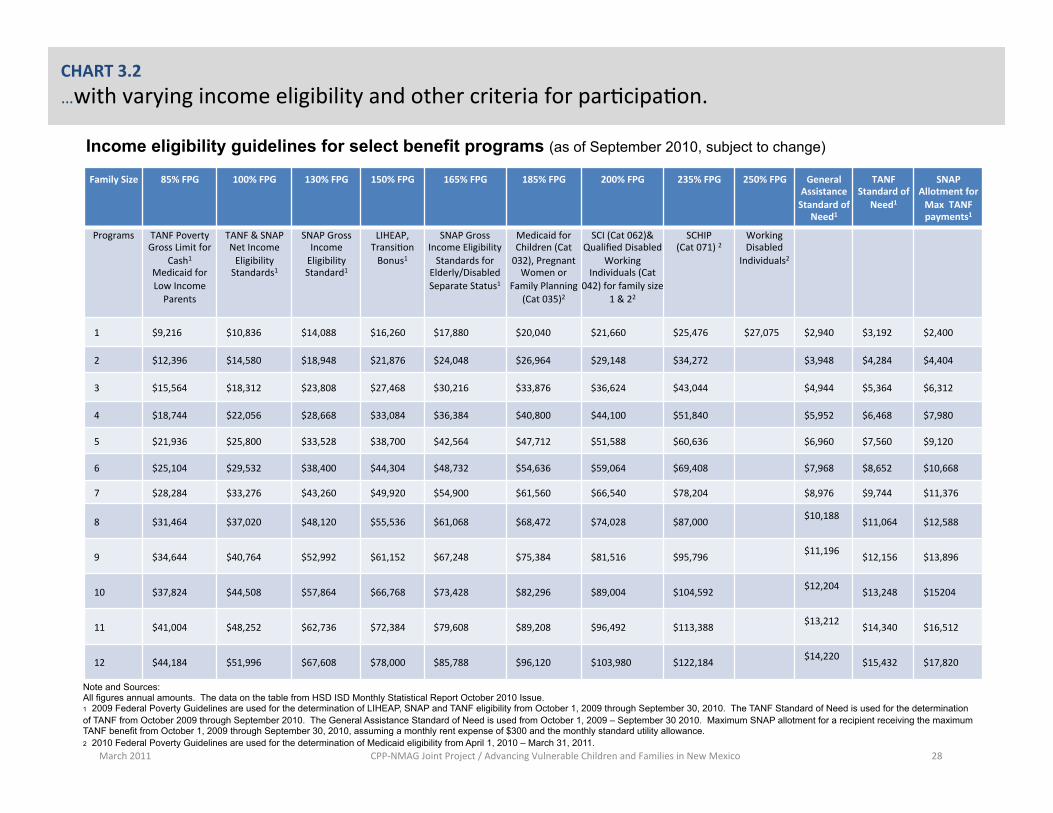
CHART 3.2 …with varying income eligibility and other criteria for par;cipa;on.
March 2011 CPP-‐NMAG Joint Project / Advancing Vulnerable Children and Families in New Mexico 28
Note and Sources: All figures annual amounts. The data on the table from HSD ISD Monthly Statistical Report October 2010 Issue. 1 2009 Federal Poverty Guidelines are used for the determination of LIHEAP, SNAP and TANF eligibility from October 1, 2009 through September 30, 2010. The TANF Standard of Need is used for the determination of TANF from October 2009 through September 2010. The General Assistance Standard of Need is used from October 1, 2009 – September 30 2010. Maximum SNAP allotment for a recipient receiving the maximum TANF benefit from October 1, 2009 through September 30, 2010, assuming a monthly rent expense of $300 and the monthly standard utility allowance. 2 2010 Federal Poverty Guidelines are used for the determination of Medicaid eligibility from April 1, 2010 – March 31, 2011.
Family Size
85% FPG 100% FPG 130% FPG 150% FPG 165% FPG 185% FPG 200% FPG 235% FPG 250% FPG General Assistance Standard of
Need1
TANF Standard of
Need1
SNAP Allotment for Max TANF payments1
Programs TANF Poverty Gross Limit for
Cash1 Medicaid for Low Income Parents
TANF & SNAP Net Income Eligibility Standards1
SNAP Gross Income Eligibility Standard1
LIHEAP, Transi;on Bonus1
SNAP Gross Income Eligibility Standards for
Elderly/Disabled Separate Status1
Medicaid for Children (Cat 032), Pregnant Women or
Family Planning (Cat 035)2
SCI (Cat 062)& Qualified Disabled
Working Individuals (Cat
042) for family size 1 & 22
SCHIP (Cat 071) 2
Working Disabled
Individuals2
1 $9,216 $10,836 $14,088 $16,260 $17,880 $20,040 $21,660 $25,476 $27,075 $2,940 $3,192 $2,400
2 $12,396 $14,580 $18,948 $21,876 $24,048 $26,964 $29,148 $34,272 $3,948 $4,284 $4,404
3 $15,564 $18,312 $23,808 $27,468 $30,216 $33,876 $36,624 $43,044 $4,944 $5,364 $6,312
4 $18,744 $22,056 $28,668 $33,084 $36,384 $40,800 $44,100 $51,840 $5,952 $6,468 $7,980
5 $21,936 $25,800 $33,528 $38,700 $42,564 $47,712 $51,588 $60,636 $6,960 $7,560 $9,120
6 $25,104 $29,532 $38,400 $44,304 $48,732 $54,636 $59,064 $69,408 $7,968 $8,652 $10,668
7 $28,284 $33,276 $43,260 $49,920 $54,900 $61,560 $66,540 $78,204 $8,976 $9,744 $11,376
8 $31,464 $37,020 $48,120 $55,536 $61,068 $68,472 $74,028 $87,000 $10,188 $11,064 $12,588
9 $34,644 $40,764 $52,992 $61,152 $67,248 $75,384 $81,516 $95,796 $11,196 $12,156 $13,896
10 $37,824 $44,508 $57,864 $66,768 $73,428 $82,296 $89,004 $104,592 $12,204 $13,248 $15204
11 $41,004 $48,252 $62,736 $72,384 $79,608 $89,208 $96,492 $113,388 $13,212 $14,340 $16,512
12 $44,184 $51,996 $67,608 $78,000 $85,788 $96,120 $103,980 $122,184 $14,220 $15,432 $17,820
Income eligibility guidelines for select benefit programs (as of September 2010, subject to change)
29
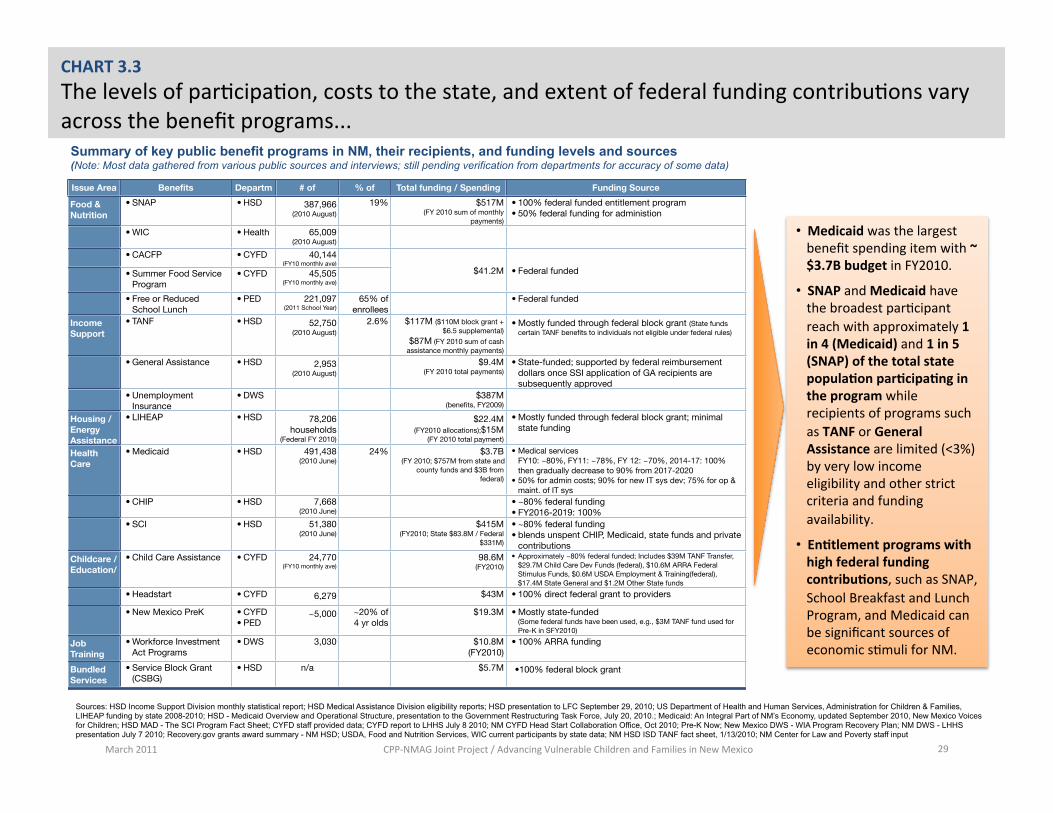
CHART 3.3 The levels of par;cipa;on, costs to the state, and extent of federal funding contribu;ons vary across the benefit programs...
• Medicaid was the largest benefit spending item with ~$3.7B budget in FY2010.
• SNAP and Medicaid have the broadest par;cipant reach with approximately 1 in 4 (Medicaid) and 1 in 5 (SNAP) of the total state populaFon parFcipaFng in the program while recipients of programs such as TANF or General Assistance are limited (<3%) by very low income eligibility and other strict criteria and funding availability.
• EnFtlement programs with high federal funding contribuFons, such as SNAP, School Breakfast and Lunch Program, and Medicaid can be significant sources of economic s;muli for NM.
March 2011 CPP-‐NMAG Joint Project / Advancing Vulnerable Children and Families in New Mexico
Sources: HSD Income Support Division monthly statistical report; HSD Medical Assistance Division eligibility reports; HSD presentation to LFC September 29, 2010; US Department of Health and Human Services, Administration for Children & Families, LIHEAP funding by state 2008-2010; HSD - Medicaid Overview and Operational Structure, presentation to the Government Restructuring Task Force, July 20, 2010.; Medicaid: An Integral Part of NM’s Economy, updated September 2010, New Mexico Voices for Children; HSD MAD - The SCI Program Fact Sheet; CYFD staff provided data; CYFD report to LHHS July 8 2010; NM CYFD Head Start Collaboration Office, Oct 2010; Pre-K Now; New Mexico DWS - WIA Program Recovery Plan; NM DWS - LHHS presentation July 7 2010; Recovery.gov grants award summary - NM HSD; USDA, Food and Nutrition Services, WIC current participants by state data; NM HSD ISD TANF fact sheet, 1/13/2010; NM Center for Law and Poverty staff input
Summary of key public benefit programs in NM, their recipients, and funding levels and sources (Note: Most data gathered from various public sources and interviews; still pending verification from departments for accuracy of some data)
Issue Area Benefits Department
# of Recipients
% of population
Total funding / Spending Funding Source (% of federal funding)
Food & Nutrition
Income Support
Housing / Energy AssistanceHealth Care
Childcare / Education/
Job Training
Bundled Services
• SNAP • HSD 387,966(2010 August)
19% $517M(FY 2010 sum of monthly
payments)
• 100% federal funded entitlement program• 50% federal funding for administion
• WIC • Health 65,009(2010 August)
• CACFP • CYFD 40,144(FY10 monthly ave)
$41.2M • Federal funded• Summer Food Service Program
• CYFD 45,505(FY10 monthly ave)
$41.2M • Federal funded
• Free or Reduced School Lunch
• PED 221,097(2011 School Year)
65% of enrollees
• Federal funded
• TANF • HSD 52,750(2010 August)
2.6% $117M ($110M block grant +$6.5 supplemental)
$87M (FY 2010 sum of cash assistance monthly payments)
• Mostly funded through federal block grant (State funds certain TANF benefits to individuals not eligible under federal rules)
• General Assistance • HSD 2,953(2010 August)
$9.4M(FY 2010 total payments)
• State-funded; supported by federal reimbursement dollars once SSI application of GA recipients are subsequently approved
• Unemployment Insurance
• DWS $387M(benefits, FY2009)
• LIHEAP • HSD 78,206 households
(Federal FY 2010)
$22.4M (FY2010 allocations);$15M
(FY 2010 total payment)
• Mostly funded through federal block grant; minimal state funding
• Medicaid • HSD 491,438(2010 June)
24% $3.7B (FY 2010; $757M from state and
county funds and $3B from federal)
• Medical services FY10: ~80%, FY11: ~78%, FY 12: ~70%, 2014-17: 100% then gradually decrease to 90% from 2017-2020
• 50% for admin costs; 90% for new IT sys dev; 75% for op & maint. of IT sys
• CHIP • HSD 7,668(2010 June)
• ~80% federal funding • FY2016-2019: 100%
• SCI • HSD 51,380(2010 June)
$415M (FY2010; State $83.8M / Federal
$331M)
• ~80% federal funding • blends unspent CHIP, Medicaid, state funds and private
contributions• Child Care Assistance • CYFD 24,770
(FY10 monthly ave)98.6M
(FY2010)
• Approximately ~80% federal funded; Includes $39M TANF Transfer, $29.7M Child Care Dev Funds (federal), $10.6M ARRA Federal Stimulus Funds, $0.6M USDA Employment & Training(federal), $17.4M State General and $1.2M Other State funds
• Headstart • CYFD 6,279 $43M • 100% direct federal grant to providers
• New Mexico PreK • CYFD• PED
~5,000 ~20% of 4 yr olds
$19.3M • Mostly state-funded(Some federal funds have been used, e.g., $3M TANF fund used for Pre-K in SFY2010)
• Workforce Investment Act Programs
• DWS 3,030 $10.8M(FY2010)
• 100% ARRA funding
• Service Block Grant (CSBG)
• HSD n/a $5.7M •100% federal block grant
!"
#!!$!!!"
%!!$!!!"
&!!$!!!"
'!!$!!!"
(!!$!!!"
)!!$!!!"
%!!*"+,
-"%!!*".,/"
%!!*"01
2"%!!*"345"
%!!*"678"
%!!*"914"
%!!:"+;
<"%!!:"=1
>"%!!:"?
;@"
%!!:".2@"
%!!:"?
;A"
%!!:"+,
<"%!!:"+,
-"%!!:".,/"
%!!:"01
2"%!!:"345"
%!!:"678"
%!!:"914"
%!#!"+;
<"%!#!"=1
>"%!#!"?
;@"
%!#!".2@"
%!#!"?
;A"
%!#!"+,
<"
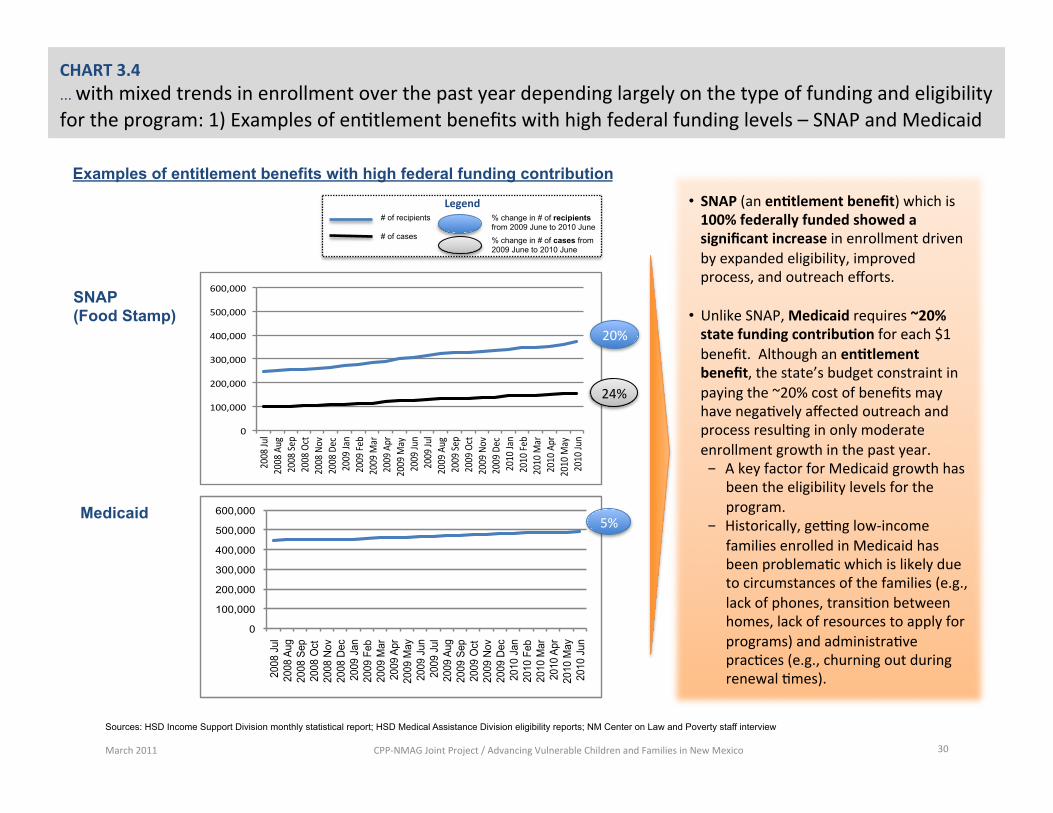
CHART 3.4 ... with mixed trends in enrollment over the past year depending largely on the type of funding and eligibility for the program: 1) Examples of en;tlement benefits with high federal funding levels – SNAP and Medicaid
Legend
30 March 2011 CPP-‐NMAG Joint Project / Advancing Vulnerable Children and Families in New Mexico
SNAP (Food Stamp)
# of recipients
# of cases
0
100,000
200,000
300,000
400,000
500,000
600,000
2008
Jul
20
08 A
ug
2008
Sep
20
08 O
ct
2008
Nov
20
08 D
ec
2009
Jan
20
09 F
eb
2009
Mar
20
09 A
pr
2009
May
20
09 J
un
2009
Jul
20
09 A
ug
2009
Sep
20
09 O
ct
2009
Nov
20
09 D
ec
2010
Jan
20
10 F
eb
2010
Mar
20
10 A
pr
2010
May
20
10 J
un
Medicaid
% change in # of recipients from 2009 June to 2010 June
% change in # of cases from 2009 June to 2010 June
5%
• SNAP (an enFtlement benefit) which is 100% federally funded showed a significant increase in enrollment driven by expanded eligibility, improved process, and outreach efforts.
• Unlike SNAP, Medicaid requires ~20% state funding contribuFon for each $1 benefit. Although an enFtlement benefit, the state’s budget constraint in paying the ~20% cost of benefits may have nega;vely affected outreach and process resul;ng in only moderate enrollment growth in the past year. - A key factor for Medicaid growth has
been the eligibility levels for the program.
- Historically, gevng low-‐income families enrolled in Medicaid has been problema;c which is likely due to circumstances of the families (e.g., lack of phones, transi;on between homes, lack of resources to apply for programs) and administra;ve prac;ces (e.g., churning out during renewal ;mes).
Examples of entitlement benefits with high federal funding contribution
Sources: HSD Income Support Division monthly statistical report; HSD Medical Assistance Division eligibility reports; NM Center on Law and Poverty staff interview
20%
24%
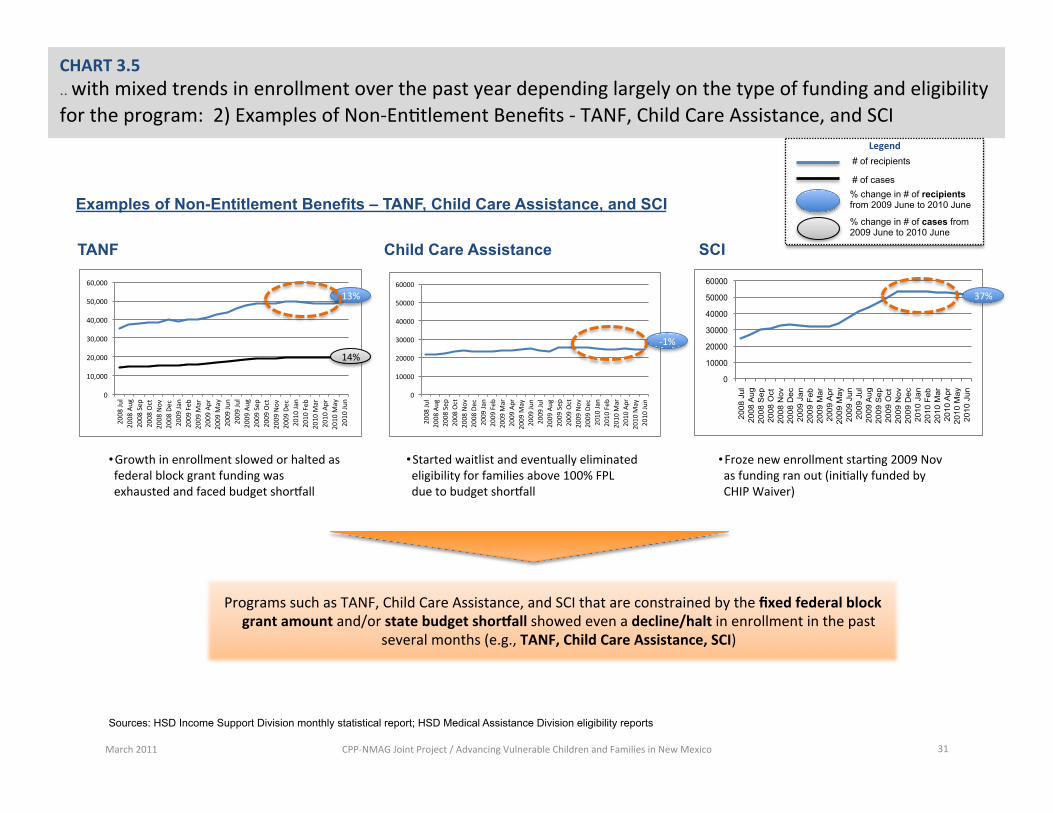
!"
#!!!!"
$!!!!"
%!!!!"
&!!!!"
'!!!!"
(!!!!"
$!!)"*+
,"$!!)"-+."
$!!)"/01
"$!!)"234"
$!!)"567"
$!!)"803"
$!!9"*:
;"$!!9"<0=
"$!!9">
:?"
$!!9"-1?"
$!!9">
:@"
$!!9"*+
;"$!!9"*+
,"$!!9"-+."
$!!9"/01
"$!!9"234"
$!!9"567"
$!!9"803"
$!#!"*:
;"$!#!"<0=
"$!#!">
:?"
$!#!"-1?"
$!#!">
:@"
$!#!"*+
;"
!"
#!$!!!"
%!$!!!"
&!$!!!"
'!$!!!"
(!$!!!"
)!$!!!"
%!!*"+,
-"%!!*".,/"
%!!*"012
"%!!*"345"
%!!*"678"
%!!*"914"
%!!:"+;
<"%!!:"=1>
"%!!:"?
;@"
%!!:".2@"
%!!:"?
;A"
%!!:"+,
<"%!!:"+,
-"%!!:".,/"
%!!:"012
"%!!:"345"
%!!:"678"
%!!:"914"
%!#!"+;
<"%!#!"=1>
"%!#!"?
;@"
%!#!".2@"
%!#!"?
;A"
%!#!"+,
<"
CHART 3.5 .. with mixed trends in enrollment over the past year depending largely on the type of funding and eligibility for the program: 2) Examples of Non-‐En;tlement Benefits -‐ TANF, Child Care Assistance, and SCI
Legend
31 March 2011 CPP-‐NMAG Joint Project / Advancing Vulnerable Children and Families in New Mexico
TANF
# of recipients
# of cases
0
10000
20000
30000
40000
50000
60000
2008
Jul
20
08 A
ug
2008
Sep
20
08 O
ct
2008
Nov
20
08 D
ec
2009
Jan
20
09 F
eb
2009
Mar
20
09 A
pr
2009
May
20
09 J
un
2009
Jul
20
09 A
ug
2009
Sep
20
09 O
ct
2009
Nov
20
09 D
ec
2010
Jan
20
10 F
eb
2010
Mar
20
10 A
pr
2010
May
20
10 J
un
Child Care Assistance SCI
% change in # of recipients from 2009 June to 2010 June
% change in # of cases from 2009 June to 2010 June
13%
-‐1%
37%
14%
• Growth in enrollment slowed or halted as federal block grant funding was exhausted and faced budget shorwall
• Started waitlist and eventually eliminated eligibility for families above 100% FPL due to budget shorwall
• Froze new enrollment star;ng 2009 Nov as funding ran out (ini;ally funded by CHIP Waiver)
Programs such as TANF, Child Care Assistance, and SCI that are constrained by the fixed federal block grant amount and/or state budget shorgall showed even a decline/halt in enrollment in the past
several months (e.g., TANF, Child Care Assistance, SCI)
Examples of Non-Entitlement Benefits – TANF, Child Care Assistance, and SCI
Sources: HSD Income Support Division monthly statistical report; HSD Medical Assistance Division eligibility reports
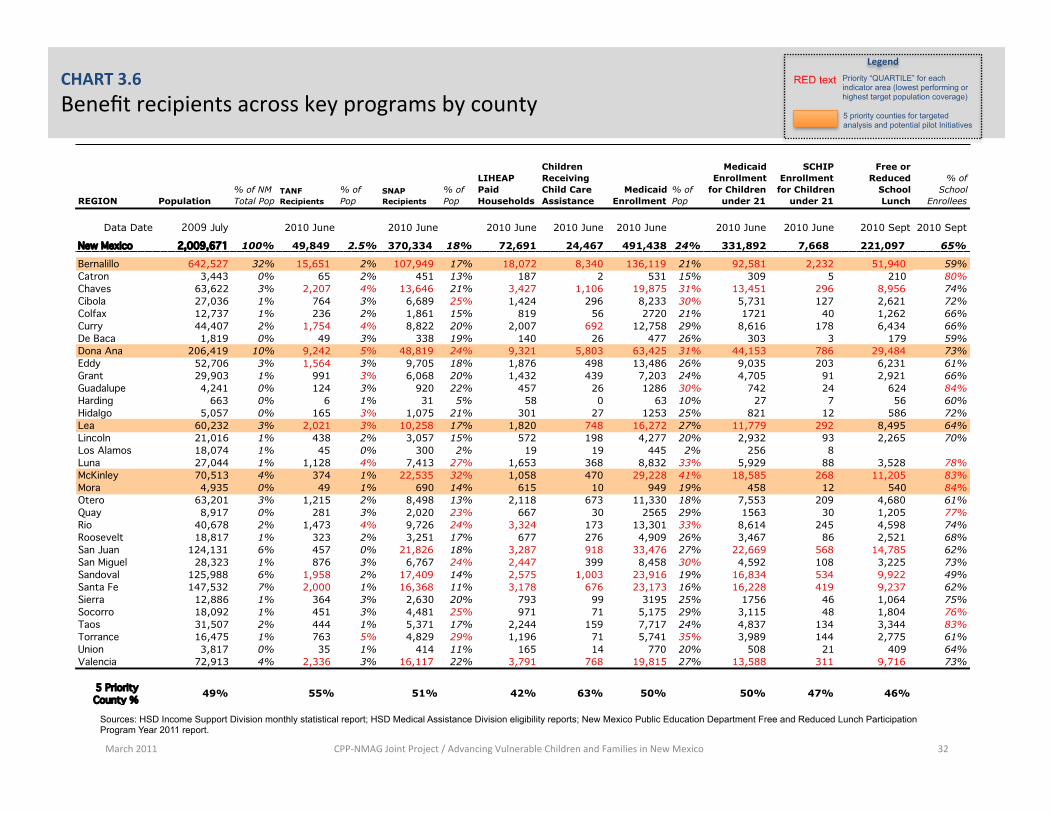
March 2011 CPP-‐NMAG Joint Project / Advancing Vulnerable Children and Families in New Mexico 32
CHART 3.6 Benefit recipients across key programs by county
Sources: HSD Income Support Division monthly statistical report; HSD Medical Assistance Division eligibility reports; New Mexico Public Education Department Free and Reduced Lunch Participation Program Year 2011 report.
Priority “QUARTILE” for each indicator area (lowest performing or highest target population coverage)
RED text
Legend
5 priority counties for targeted analysis and potential pilot Initiatives
REGION Population% of NM Total Pop
TANF Recipients
% of Pop
SNAP Recipients
% of Pop
LIHEAP Paid Households
Children Receiving Child Care Assistance
Medicaid Enrollment
% of Pop
Medicaid Enrollment
for Children under 21
SCHIP Enrollment for Children
under 21
Free or Reduced
School Lunch
% of School
Enrollees
Data Date 2009 July 2010 June 2010 June 2010 June 2010 June 2010 June 2010 June 2010 June 2010 Sept 2010 Sept
New Mexico 2,009,671 100% 49,849 2.5% 370,334 18% 72,691 24,467 491,438 24% 331,892 7,668 221,097 65%
Bernalillo 642,527 32% 15,651 2% 107,949 17% 18,072 8,340 136,119 21% 92,581 2,232 51,940 59%Catron 3,443 0% 65 2% 451 13% 187 2 531 15% 309 5 210 80%Chaves 63,622 3% 2,207 4% 13,646 21% 3,427 1,106 19,875 31% 13,451 296 8,956 74%Cibola 27,036 1% 764 3% 6,689 25% 1,424 296 8,233 30% 5,731 127 2,621 72%Colfax 12,737 1% 236 2% 1,861 15% 819 56 2720 21% 1721 40 1,262 66%Curry 44,407 2% 1,754 4% 8,822 20% 2,007 692 12,758 29% 8,616 178 6,434 66%De Baca 1,819 0% 49 3% 338 19% 140 26 477 26% 303 3 179 59%Dona Ana 206,419 10% 9,242 5% 48,819 24% 9,321 5,803 63,425 31% 44,153 786 29,484 73%Eddy 52,706 3% 1,564 3% 9,705 18% 1,876 498 13,486 26% 9,035 203 6,231 61%Grant 29,903 1% 991 3% 6,068 20% 1,432 439 7,203 24% 4,705 91 2,921 66%Guadalupe 4,241 0% 124 3% 920 22% 457 26 1286 30% 742 24 624 84%Harding 663 0% 6 1% 31 5% 58 0 63 10% 27 7 56 60%Hidalgo 5,057 0% 165 3% 1,075 21% 301 27 1253 25% 821 12 586 72%Lea 60,232 3% 2,021 3% 10,258 17% 1,820 748 16,272 27% 11,779 292 8,495 64%Lincoln 21,016 1% 438 2% 3,057 15% 572 198 4,277 20% 2,932 93 2,265 70%Los Alamos 18,074 1% 45 0% 300 2% 19 19 445 2% 256 8Luna 27,044 1% 1,128 4% 7,413 27% 1,653 368 8,832 33% 5,929 88 3,528 78%McKinley 70,513 4% 374 1% 22,535 32% 1,058 470 29,228 41% 18,585 268 11,205 83%Mora 4,935 0% 49 1% 690 14% 615 10 949 19% 458 12 540 84%Otero 63,201 3% 1,215 2% 8,498 13% 2,118 673 11,330 18% 7,553 209 4,680 61%Quay 8,917 0% 281 3% 2,020 23% 667 30 2565 29% 1563 30 1,205 77%Rio 40,678 2% 1,473 4% 9,726 24% 3,324 173 13,301 33% 8,614 245 4,598 74%Roosevelt 18,817 1% 323 2% 3,251 17% 677 276 4,909 26% 3,467 86 2,521 68%San Juan 124,131 6% 457 0% 21,826 18% 3,287 918 33,476 27% 22,669 568 14,785 62%San Miguel 28,323 1% 876 3% 6,767 24% 2,447 399 8,458 30% 4,592 108 3,225 73%Sandoval 125,988 6% 1,958 2% 17,409 14% 2,575 1,003 23,916 19% 16,834 534 9,922 49%Santa Fe 147,532 7% 2,000 1% 16,368 11% 3,178 676 23,173 16% 16,228 419 9,237 62%Sierra 12,886 1% 364 3% 2,630 20% 793 99 3195 25% 1756 46 1,064 75%Socorro 18,092 1% 451 3% 4,481 25% 971 71 5,175 29% 3,115 48 1,804 76%Taos 31,507 2% 444 1% 5,371 17% 2,244 159 7,717 24% 4,837 134 3,344 83%Torrance 16,475 1% 763 5% 4,829 29% 1,196 71 5,741 35% 3,989 144 2,775 61%Union 3,817 0% 35 1% 414 11% 165 14 770 20% 508 21 409 64%Valencia 72,913 4% 2,336 3% 16,117 22% 3,791 768 19,815 27% 13,588 311 9,716 73%
5 Priority County % 49% 55% 51% 42% 63% 50% 50% 47% 46%
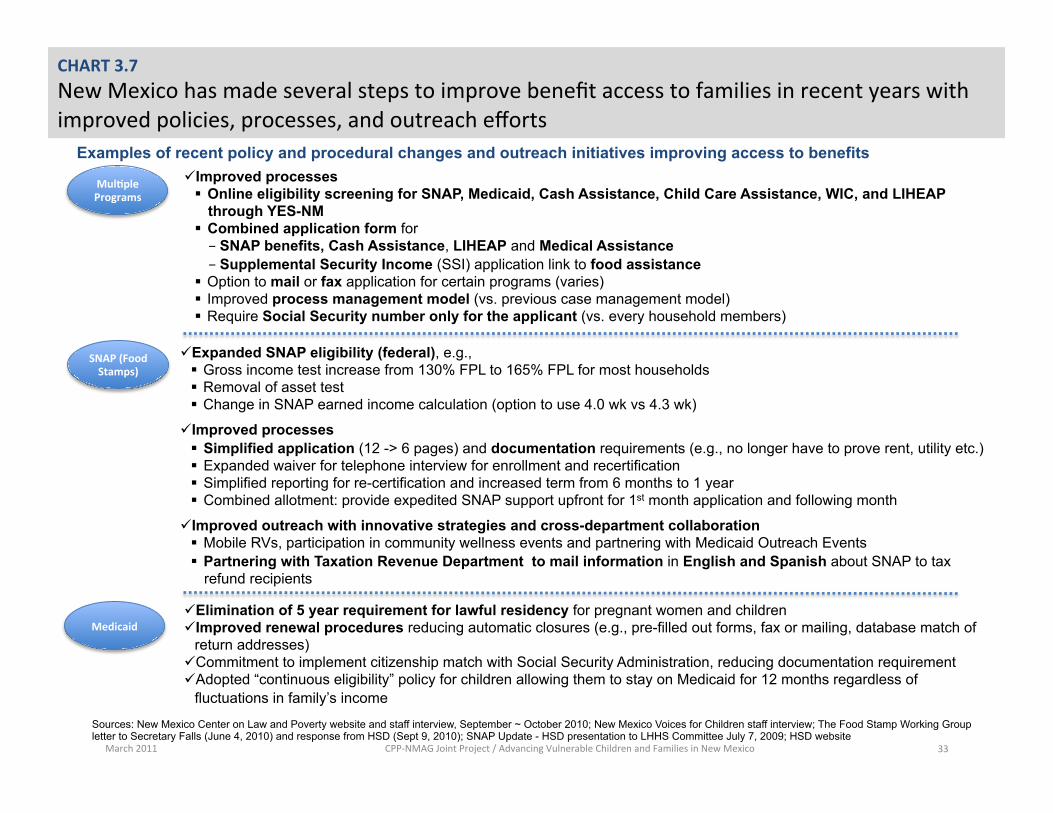
CHART 3.7 New Mexico has made several steps to improve benefit access to families in recent years with improved policies, processes, and outreach efforts
March 2011 CPP-‐NMAG Joint Project / Advancing Vulnerable Children and Families in New Mexico
SNAP (Food Stamps)
Medicaid
ü Expanded SNAP eligibility (federal), e.g., § Gross income test increase from 130% FPL to 165% FPL for most households § Removal of asset test § Change in SNAP earned income calculation (option to use 4.0 wk vs 4.3 wk)
ü Improved processes § Simplified application (12 -> 6 pages) and documentation requirements (e.g., no longer have to prove rent, utility etc.) § Expanded waiver for telephone interview for enrollment and recertification § Simplified reporting for re-certification and increased term from 6 months to 1 year § Combined allotment: provide expedited SNAP support upfront for 1st month application and following month
ü Improved outreach with innovative strategies and cross-department collaboration § Mobile RVs, participation in community wellness events and partnering with Medicaid Outreach Events § Partnering with Taxation Revenue Department to mail information in English and Spanish about SNAP to tax
refund recipients
MulFple Programs
ü Improved processes § Online eligibility screening for SNAP, Medicaid, Cash Assistance, Child Care Assistance, WIC, and LIHEAP
through YES-NM § Combined application form for - SNAP benefits, Cash Assistance, LIHEAP and Medical Assistance - Supplemental Security Income (SSI) application link to food assistance
§ Option to mail or fax application for certain programs (varies) § Improved process management model (vs. previous case management model) § Require Social Security number only for the applicant (vs. every household members)
ü Elimination of 5 year requirement for lawful residency for pregnant women and children ü Improved renewal procedures reducing automatic closures (e.g., pre-filled out forms, fax or mailing, database match of
return addresses) ü Commitment to implement citizenship match with Social Security Administration, reducing documentation requirement ü Adopted “continuous eligibility” policy for children allowing them to stay on Medicaid for 12 months regardless of
fluctuations in family’s income
Examples of recent policy and procedural changes and outreach initiatives improving access to benefits
Sources: New Mexico Center on Law and Poverty website and staff interview, September ~ October 2010; New Mexico Voices for Children staff interview; The Food Stamp Working Group letter to Secretary Falls (June 4, 2010) and response from HSD (Sept 9, 2010); SNAP Update - HSD presentation to LHHS Committee July 7, 2009; HSD website
33
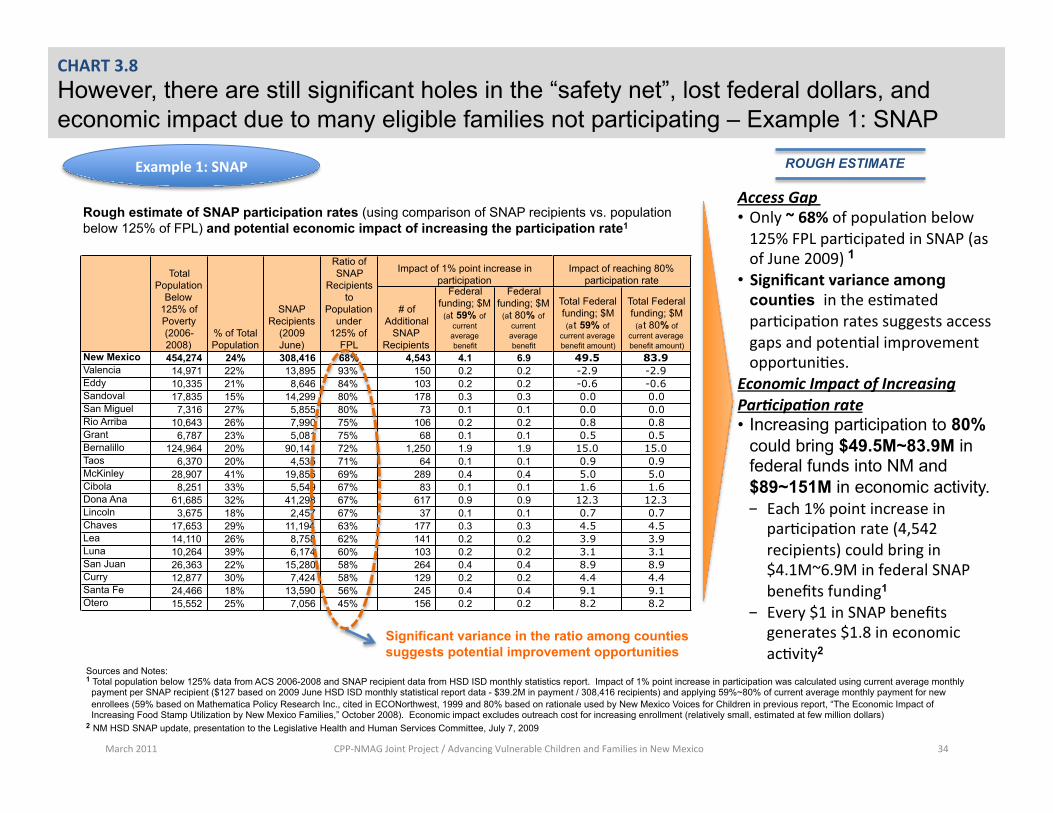
# of Additional
SNAP Recipients
Federal funding; $M
(at 59% of current average benefit
Federal funding; $M
(at 80% of current average benefit
Total Federal funding; $M (at 59% of
current average benefit amount)
Total Federal funding; $M
(at 80% of current average benefit amount)
New Mexico 454,274 24% 308,416 68% 4,543 4.1 6.9 49.5 83.9Valencia 14,971 22% 13,895 93% 150 0.2 0.2 -2.9 -2.9Eddy 10,335 21% 8,646 84% 103 0.2 0.2 -0.6 -0.6Sandoval 17,835 15% 14,299 80% 178 0.3 0.3 0.0 0.0San Miguel 7,316 27% 5,855 80% 73 0.1 0.1 0.0 0.0Rio Arriba 10,643 26% 7,990 75% 106 0.2 0.2 0.8 0.8Grant 6,787 23% 5,081 75% 68 0.1 0.1 0.5 0.5Bernalillo 124,964 20% 90,141 72% 1,250 1.9 1.9 15.0 15.0Taos 6,370 20% 4,535 71% 64 0.1 0.1 0.9 0.9McKinley 28,907 41% 19,855 69% 289 0.4 0.4 5.0 5.0Cibola 8,251 33% 5,549 67% 83 0.1 0.1 1.6 1.6Dona Ana 61,685 32% 41,298 67% 617 0.9 0.9 12.3 12.3Lincoln 3,675 18% 2,457 67% 37 0.1 0.1 0.7 0.7Chaves 17,653 29% 11,194 63% 177 0.3 0.3 4.5 4.5Lea 14,110 26% 8,758 62% 141 0.2 0.2 3.9 3.9Luna 10,264 39% 6,174 60% 103 0.2 0.2 3.1 3.1San Juan 26,363 22% 15,280 58% 264 0.4 0.4 8.9 8.9Curry 12,877 30% 7,424 58% 129 0.2 0.2 4.4 4.4Santa Fe 24,466 18% 13,590 56% 245 0.4 0.4 9.1 9.1Otero 15,552 25% 7,056 45% 156 0.2 0.2 8.2 8.2
Impact of 1% point increase in participation
Impact of reaching 80% participation rate
Ratio of SNAP
Recipients to
Population under
125% of FPL
SNAP Recipients
(2009 June)
% of Total Population
Total Population
Below 125% of Poverty (2006-2008)
CHART 3.8 However, there are still significant holes in the “safety net”, lost federal dollars, and economic impact due to many eligible families not participating – Example 1: SNAP
March 2011 CPP-‐NMAG Joint Project / Advancing Vulnerable Children and Families in New Mexico 34
Access Gap • Only ~ 68% of popula;on below 125% FPL par;cipated in SNAP (as of June 2009) 1
• Significant variance among counties in the es;mated par;cipa;on rates suggests access gaps and poten;al improvement opportuni;es.
Economic Impact of Increasing Par5cipa5on rate • Increasing participation to 80%
could bring $49.5M~83.9M in federal funds into NM and $89~151M in economic activity. - Each 1% point increase in
par;cipa;on rate (4,542 recipients) could bring in $4.1M~6.9M in federal SNAP benefits funding1
- Every $1 in SNAP benefits generates $1.8 in economic ac;vity2
Rough estimate of SNAP participation rates (using comparison of SNAP recipients vs. population below 125% of FPL) and potential economic impact of increasing the participation rate1
Significant variance in the ratio among counties suggests potential improvement opportunities
Sources and Notes: 1 Total population below 125% data from ACS 2006-2008 and SNAP recipient data from HSD ISD monthly statistics report. Impact of 1% point increase in participation was calculated using current average monthly
payment per SNAP recipient ($127 based on 2009 June HSD ISD monthly statistical report data - $39.2M in payment / 308,416 recipients) and applying 59%~80% of current average monthly payment for new enrollees (59% based on Mathematica Policy Research Inc., cited in ECONorthwest, 1999 and 80% based on rationale used by New Mexico Voices for Children in previous report, “The Economic Impact of Increasing Food Stamp Utilization by New Mexico Families,” October 2008). Economic impact excludes outreach cost for increasing enrollment (relatively small, estimated at few million dollars)
2 NM HSD SNAP update, presentation to the Legislative Health and Human Services Committee, July 7, 2009
Example 1: SNAP ROUGH ESTIMATE
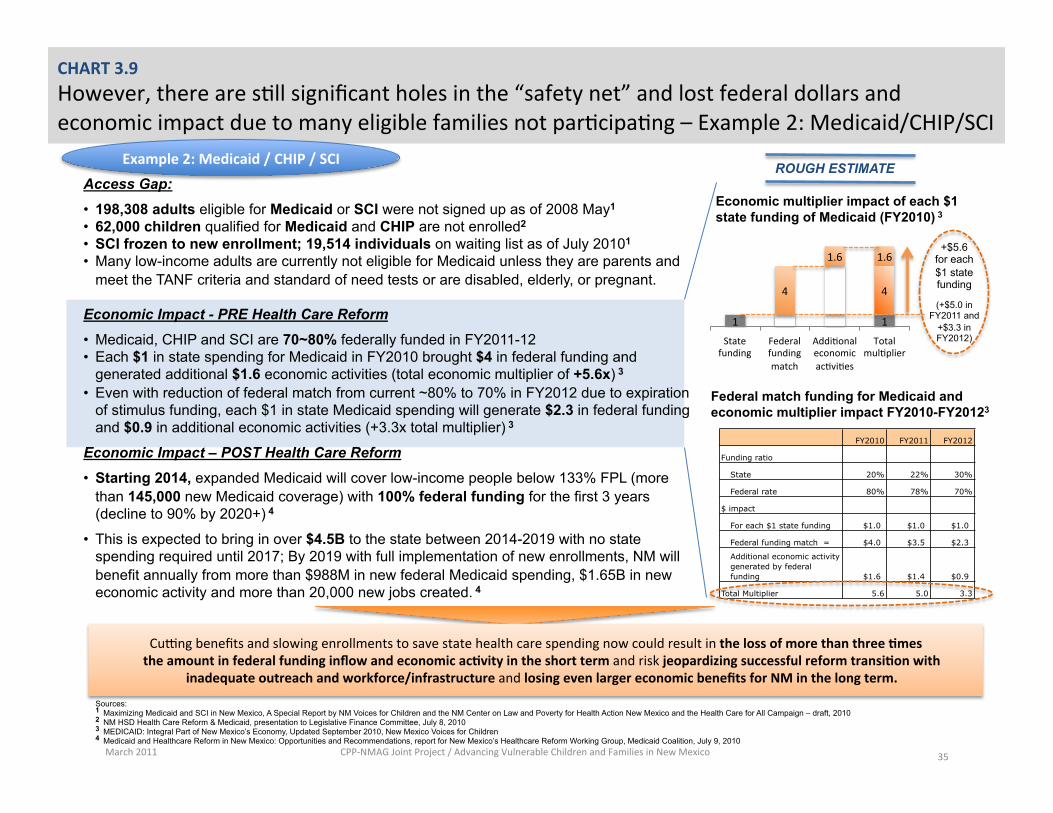
FY2010 FY2011 FY2012
Funding ratio
State 20% 22% 30%
Federal rate 80% 78% 70%
$ impact
For each $1 state funding $1.0 $1.0 $1.0
Federal funding match = $4.0 $3.5 $2.3
Additional economic activity generated by federal funding $1.6 $1.4 $0.9
Total Multiplier 5.6 5.0 3.3
CHART 3.9 However, there are s;ll significant holes in the “safety net” and lost federal dollars and economic impact due to many eligible families not par;cipa;ng – Example 2: Medicaid/CHIP/SCI
March 2011 CPP-‐NMAG Joint Project / Advancing Vulnerable Children and Families in New Mexico 35
Example 2: Medicaid / CHIP / SCI Access Gap: • 198,308 adults eligible for Medicaid or SCI were not signed up as of 2008 May1
• 62,000 children qualified for Medicaid and CHIP are not enrolled2
• SCI frozen to new enrollment; 19,514 individuals on waiting list as of July 20101
• Many low-income adults are currently not eligible for Medicaid unless they are parents and meet the TANF criteria and standard of need tests or are disabled, elderly, or pregnant.
Economic Impact - PRE Health Care Reform • Medicaid, CHIP and SCI are 70~80% federally funded in FY2011-12 • Each $1 in state spending for Medicaid in FY2010 brought $4 in federal funding and
generated additional $1.6 economic activities (total economic multiplier of +5.6x) 3 • Even with reduction of federal match from current ~80% to 70% in FY2012 due to expiration
of stimulus funding, each $1 in state Medicaid spending will generate $2.3 in federal funding and $0.9 in additional economic activities (+3.3x total multiplier) 3
Economic Impact – POST Health Care Reform • Starting 2014, expanded Medicaid will cover low-income people below 133% FPL (more
than 145,000 new Medicaid coverage) with 100% federal funding for the first 3 years (decline to 90% by 2020+) 4
• This is expected to bring in over $4.5B to the state between 2014-2019 with no state spending required until 2017; By 2019 with full implementation of new enrollments, NM will benefit annually from more than $988M in new federal Medicaid spending, $1.65B in new economic activity and more than 20,000 new jobs created. 4
Sources: 1 Maximizing Medicaid and SCI in New Mexico, A Special Report by NM Voices for Children and the NM Center on Law and Poverty for Health Action New Mexico and the Health Care for All Campaign – draft, 2010 2 NM HSD Health Care Reform & Medicaid, presentation to Legislative Finance Committee, July 8, 2010 3 MEDICAID: Integral Part of New Mexico’s Economy, Updated September 2010, New Mexico Voices for Children 4 Medicaid and Healthcare Reform in New Mexico: Opportunities and Recommendations, report for New Mexico’s Healthcare Reform Working Group, Medicaid Coalition, July 9, 2010
Federal match funding for Medicaid and economic multiplier impact FY2010-FY20123
1 1
4 4
1.6 1.6
State funding
Federal funding match
Addi;onal economic ac;vi;es
Total mul;plier
+$5.6 for each $1 state funding
(+$5.0 in FY2011 and
+$3.3 in FY2012)
Economic multiplier impact of each $1 state funding of Medicaid (FY2010) 3
Cuvng benefits and slowing enrollments to save state health care spending now could result in the loss of more than three Fmes the amount in federal funding inflow and economic acFvity in the short term and risk jeopardizing successful reform transiFon with
inadequate outreach and workforce/infrastructure and losing even larger economic benefits for NM in the long term.
ROUGH ESTIMATE
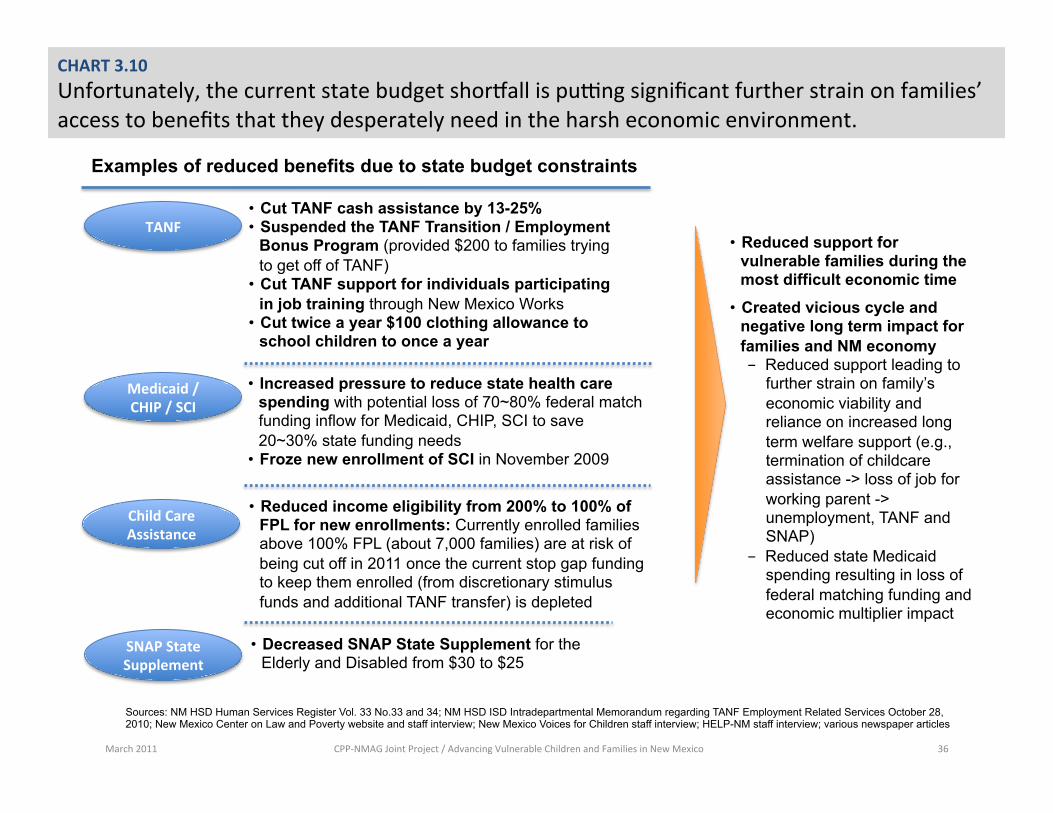
CHART 3.10 Unfortunately, the current state budget shorwall is puvng significant further strain on families’ access to benefits that they desperately need in the harsh economic environment.
March 2011 CPP-‐NMAG Joint Project / Advancing Vulnerable Children and Families in New Mexico 36
Child Care Assistance
Medicaid / CHIP / SCI
• Reduced income eligibility from 200% to 100% of FPL for new enrollments: Currently enrolled families above 100% FPL (about 7,000 families) are at risk of being cut off in 2011 once the current stop gap funding to keep them enrolled (from discretionary stimulus funds and additional TANF transfer) is depleted
• Increased pressure to reduce state health care spending with potential loss of 70~80% federal match funding inflow for Medicaid, CHIP, SCI to save 20~30% state funding needs
• Froze new enrollment of SCI in November 2009
• Decreased SNAP State Supplement for the Elderly and Disabled from $30 to $25
SNAP State Supplement
TANF • Cut TANF cash assistance by 13-25% • Suspended the TANF Transition / Employment
Bonus Program (provided $200 to families trying to get off of TANF)
• Cut TANF support for individuals participating in job training through New Mexico Works
• Cut twice a year $100 clothing allowance to school children to once a year
• Reduced support for vulnerable families during the most difficult economic time
• Created vicious cycle and negative long term impact for families and NM economy - Reduced support leading to
further strain on family’s economic viability and reliance on increased long term welfare support (e.g., termination of childcare assistance -> loss of job for working parent -> unemployment, TANF and SNAP)
- Reduced state Medicaid spending resulting in loss of federal matching funding and economic multiplier impact
Examples of reduced benefits due to state budget constraints
Sources: NM HSD Human Services Register Vol. 33 No.33 and 34; NM HSD ISD Intradepartmental Memorandum regarding TANF Employment Related Services October 28, 2010; New Mexico Center on Law and Poverty website and staff interview; New Mexico Voices for Children staff interview; HELP-NM staff interview; various newspaper articles
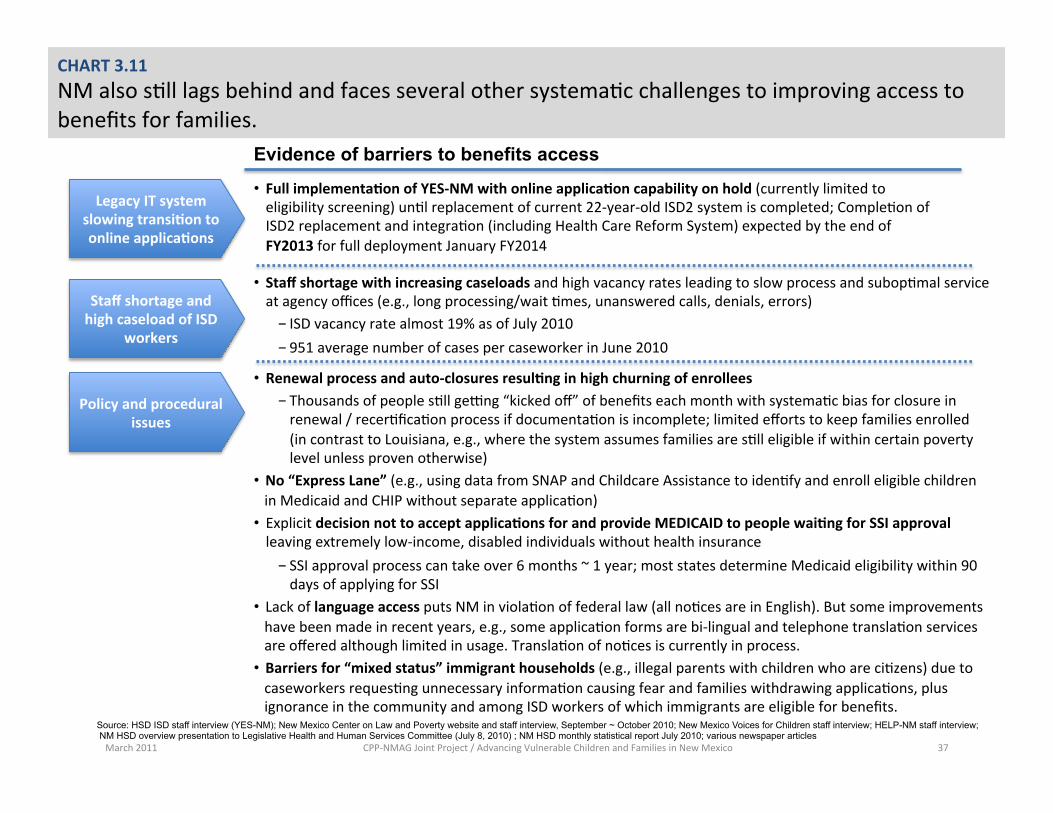
CHART 3.11 NM also s;ll lags behind and faces several other systema;c challenges to improving access to benefits for families.
March 2011 CPP-‐NMAG Joint Project / Advancing Vulnerable Children and Families in New Mexico 37
• Full implementaFon of YES-‐NM with online applicaFon capability on hold (currently limited to eligibility screening) un;l replacement of current 22-‐year-‐old ISD2 system is completed; Comple;on of ISD2 replacement and integra;on (including Health Care Reform System) expected by the end of FY2013 for full deployment January FY2014
Legacy IT system slowing transiFon to online applicaFons
Staff shortage and high caseload of ISD
workers
• Staff shortage with increasing caseloads and high vacancy rates leading to slow process and subop;mal service at agency offices (e.g., long processing/wait ;mes, unanswered calls, denials, errors) - ISD vacancy rate almost 19% as of July 2010 - 951 average number of cases per caseworker in June 2010
Policy and procedural issues
• Renewal process and auto-‐closures resulFng in high churning of enrollees - Thousands of people s;ll gevng “kicked off” of benefits each month with systema;c bias for closure in renewal / recer;fica;on process if documenta;on is incomplete; limited efforts to keep families enrolled (in contrast to Louisiana, e.g., where the system assumes families are s;ll eligible if within certain poverty level unless proven otherwise)
• No “Express Lane” (e.g., using data from SNAP and Childcare Assistance to iden;fy and enroll eligible children in Medicaid and CHIP without separate applica;on)
• Explicit decision not to accept applicaFons for and provide MEDICAID to people waiFng for SSI approval leaving extremely low-‐income, disabled individuals without health insurance - SSI approval process can take over 6 months ~ 1 year; most states determine Medicaid eligibility within 90 days of applying for SSI
• Lack of language access puts NM in viola;on of federal law (all no;ces are in English). But some improvements have been made in recent years, e.g., some applica;on forms are bi-‐lingual and telephone transla;on services are offered although limited in usage. Transla;on of no;ces is currently in process.
• Barriers for “mixed status” immigrant households (e.g., illegal parents with children who are ci;zens) due to caseworkers reques;ng unnecessary informa;on causing fear and families withdrawing applica;ons, plus ignorance in the community and among ISD workers of which immigrants are eligible for benefits.
Source: HSD ISD staff interview (YES-NM); New Mexico Center on Law and Poverty website and staff interview, September ~ October 2010; New Mexico Voices for Children staff interview; HELP-NM staff interview; NM HSD overview presentation to Legislative Health and Human Services Committee (July 8, 2010) ; NM HSD monthly statistical report July 2010; various newspaper articles
Evidence of barriers to benefits access
March 2011 CPP-‐NMAG Joint Project / Advancing Vulnerable Children and Families in New Mexico 38
TABLE OF CONTENTS
Introduction and Executive Summary
SECTION 1. New Mexico’s Vulnerable Children and Families • Summary of current state by key areas and indicators: Supported, Healthy, Safe, Educated • Highlight on low-income working families
SECTION 2. Priority Counties for Pilot Initiatives and the Need for a Community-based Strategy • Priority counties for community-based strategy pilot • Summary of county-level analysis by key areas and indicators
SECTION 3. Public Benefit Programs and Systematic Challenges to Improving Access • Government benefit programs available to vulnerable children and families in New Mexico • Trends in enrollment, recent improvements and gap in benefits access
SECTION 4. Statewide Non-Profit Initiatives: Best Practices and Missed Opportunities • Examples of key statewide non-profit initiatives • Best practice highlights • Gaps and missed opportunities for improvements
SECTION 5. Improving Benefits Access and Integrated Services: National Best Practice Trends and Early Evidence of Impact
• Barriers to benefits access • Framework for integrated strategy and best practice examples in outreach, service delivery, and system • Early evidence of positive impact on families, system, and economy
SECTION 6. Proposal for a Collaborative Strategy and System Building Process • Six strategies and example initiatives across outreach, service delivery, and system building • Short term potential priority initiatives and next steps
Appendix
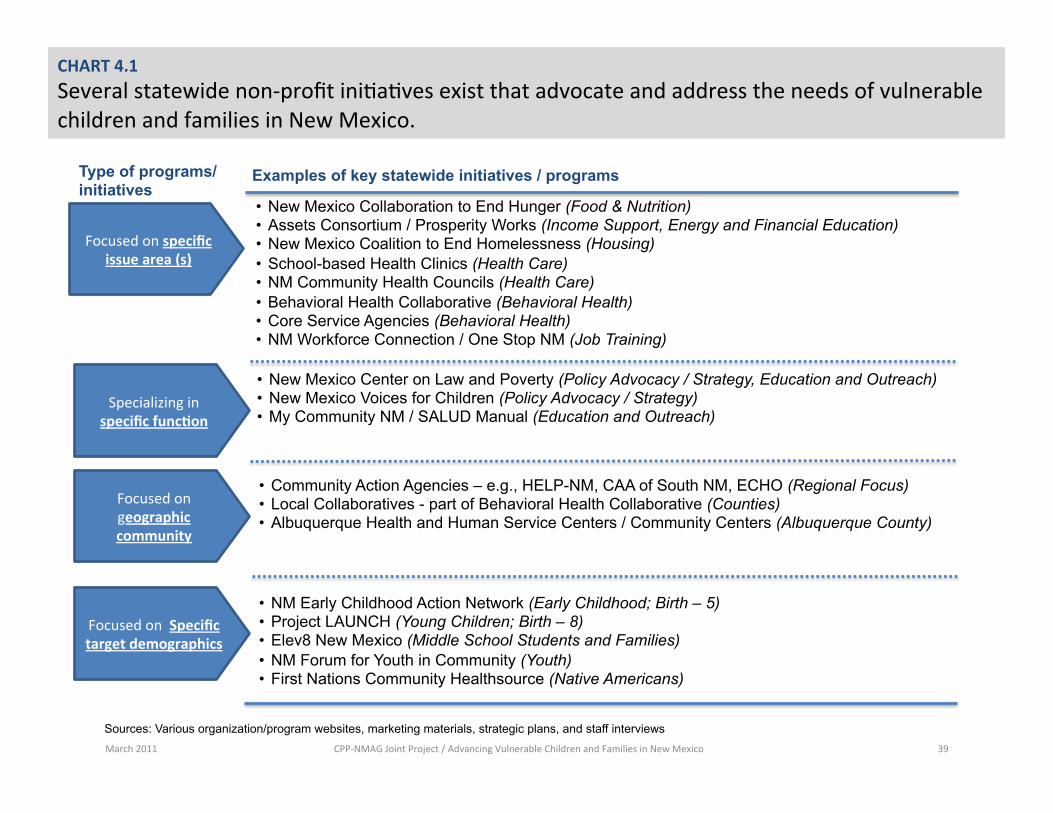
March 2011 CPP-‐NMAG Joint Project / Advancing Vulnerable Children and Families in New Mexico 39
CHART 4.1 Several statewide non-‐profit ini;a;ves exist that advocate and address the needs of vulnerable children and families in New Mexico.
Examples of key statewide initiatives / programs
Sources: Various organization/program websites, marketing materials, strategic plans, and staff interviews
Focused on specific issue area (s)
Type of programs/initiatives
• New Mexico Collaboration to End Hunger (Food & Nutrition) • Assets Consortium / Prosperity Works (Income Support, Energy and Financial Education) • New Mexico Coalition to End Homelessness (Housing) • School-based Health Clinics (Health Care) • NM Community Health Councils (Health Care) • Behavioral Health Collaborative (Behavioral Health) • Core Service Agencies (Behavioral Health) • NM Workforce Connection / One Stop NM (Job Training)
Specializing in specific funcFon
Focused on geographic community
Focused on Specific target demographics
• New Mexico Center on Law and Poverty (Policy Advocacy / Strategy, Education and Outreach) • New Mexico Voices for Children (Policy Advocacy / Strategy) • My Community NM / SALUD Manual (Education and Outreach)
• Community Action Agencies – e.g., HELP-NM, CAA of South NM, ECHO (Regional Focus) • Local Collaboratives - part of Behavioral Health Collaborative (Counties) • Albuquerque Health and Human Service Centers / Community Centers (Albuquerque County)
• NM Early Childhood Action Network (Early Childhood; Birth – 5) • Project LAUNCH (Young Children; Birth – 8) • Elev8 New Mexico (Middle School Students and Families) • NM Forum for Youth in Community (Youth) • First Nations Community Healthsource (Native Americans)
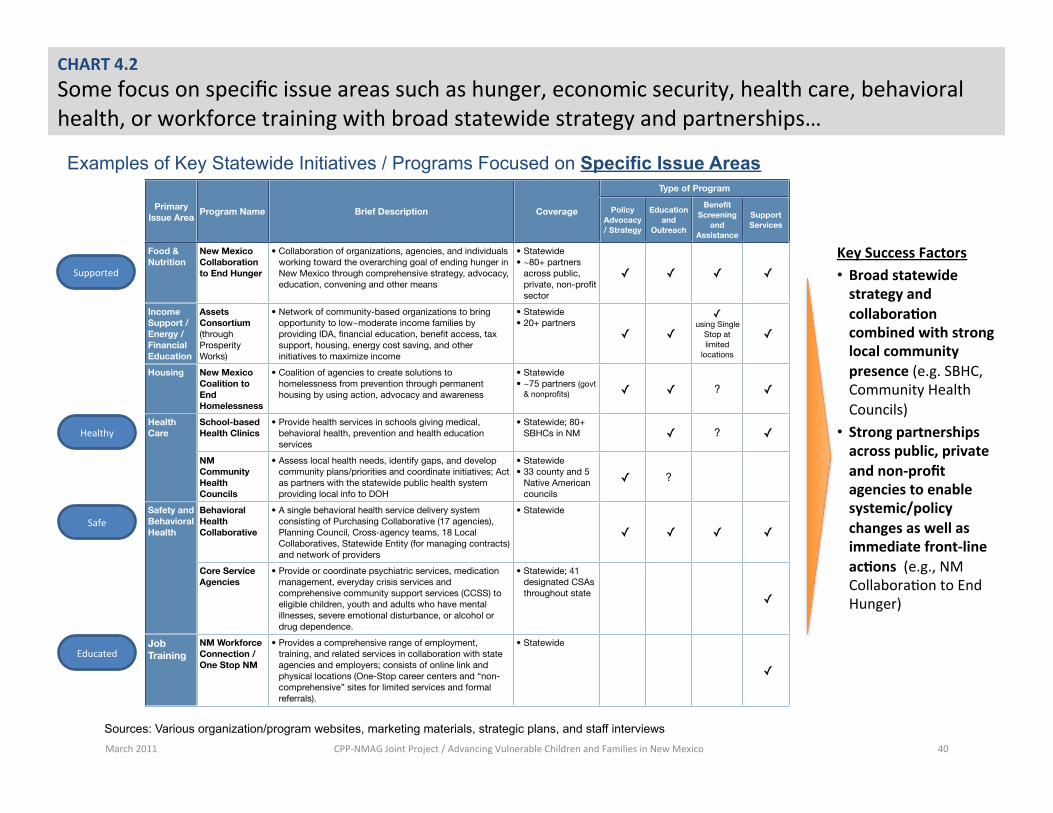
March 2011 CPP-‐NMAG Joint Project / Advancing Vulnerable Children and Families in New Mexico 40
CHART 4.2 Some focus on specific issue areas such as hunger, economic security, health care, behavioral health, or workforce training with broad statewide strategy and partnerships…
Examples of Key Statewide Initiatives / Programs Focused on Specific Issue Areas
Supported
Healthy
Safe
Educated
Key Success Factors • Broad statewide strategy and collaboraFon combined with strong local community presence (e.g. SBHC, Community Health Councils)
• Strong partnerships across public, private and non-‐profit agencies to enable systemic/policy changes as well as immediate front-‐line acFons (e.g., NM Collabora;on to End Hunger)
Sources: Various organization/program websites, marketing materials, strategic plans, and staff interviews
Primary Issue Area
Program Name Brief Description Coverage
Type of ProgramType of ProgramType of ProgramType of Program
Primary Issue Area
Program Name Brief Description Coverage Policy Advocacy / Strategy
Education and
Outreach
Benefit Screening
and Assistance
Support Services
Food & Nutrition
New Mexico Collaboration to End Hunger
• Collaboration of organizations, agencies, and individuals working toward the overarching goal of ending hunger in New Mexico through comprehensive strategy, advocacy, education, convening and other means
• Statewide• ~80+ partners
across public, private, non-profit sector
✓ ✓ ✓ ✓
Income Support / Energy / Financial Education
Assets Consortium (through Prosperity Works)
• Network of community-based organizations to bring opportunity to low~moderate income families by providing IDA, financial education, benefit access, tax support, housing, energy cost saving, and other initiatives to maximize income
• Statewide• 20+ partners
✓ ✓
✓using Single
Stop at limited
locations
✓
Housing New Mexico Coalition to End Homelessness
• Coalition of agencies to create solutions to homelessness from prevention through permanent housing by using action, advocacy and awareness
• Statewide• ~75 partners (govt
& nonprofits) ✓ ✓ ? ✓
Health Care
School-based Health Clinics
• Provide health services in schools giving medical, behavioral health, prevention and health education services
• Statewide; 80+ SBHCs in NM ✓ ? ✓
Health Care
NM Community Health Councils
• Assess local health needs, identify gaps, and develop community plans/priorities and coordinate initiatives; Act as partners with the statewide public health system providing local info to DOH
• Statewide• 33 county and 5
Native American councils
✓ ?
Safety and Behavioral Health
Behavioral Health Collaborative
• A single behavioral health service delivery system consisting of Purchasing Collaborative (17 agencies), Planning Council, Cross-agency teams, 18 Local Collaboratives, Statewide Entity (for managing contracts) and network of providers
• Statewide
✓ ✓ ✓ ✓
Safety and Behavioral Health
Core Service Agencies
• Provide or coordinate psychiatric services, medication management, everyday crisis services and comprehensive community support services (CCSS) to eligible children, youth and adults who have mental illnesses, severe emotional disturbance, or alcohol or drug dependence.
• Statewide; 41 designated CSAs throughout state ✓
Job Training
NM Workforce Connection / One Stop NM
• Provides a comprehensive range of employment, training, and related services in collaboration with state agencies and employers; consists of online link and physical locations (One-Stop career centers and “non-comprehensive” sites for limited services and formal referrals).
• Statewide
✓
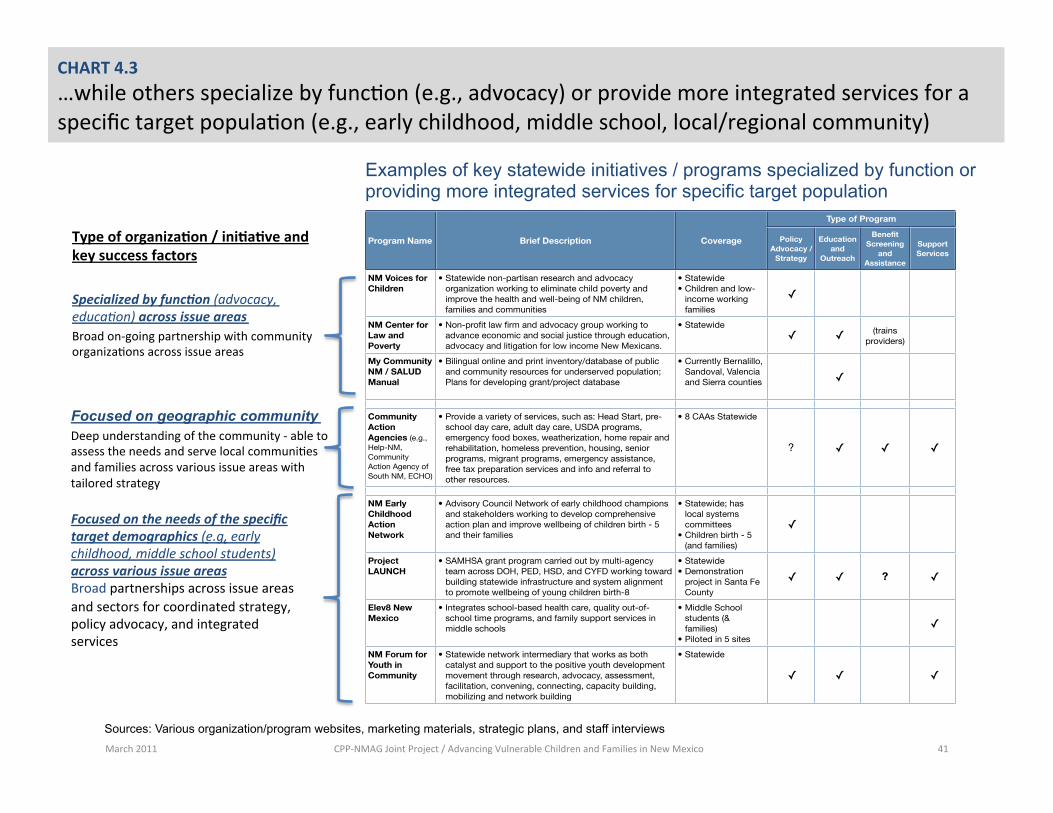
March 2011 CPP-‐NMAG Joint Project / Advancing Vulnerable Children and Families in New Mexico 41
CHART 4.3 …while others specialize by func;on (e.g., advocacy) or provide more integrated services for a specific target popula;on (e.g., early childhood, middle school, local/regional community)
Examples of key statewide initiatives / programs specialized by function or providing more integrated services for specific target population
Specialized by func5on (advocacy, educaIon) across issue areas Broad on-‐going partnership with community organiza;ons across issue areas
Focused on geographic community Deep understanding of the community -‐ able to assess the needs and serve local communi;es and families across various issue areas with tailored strategy
Focused on the needs of the specific target demographics (e.g, early childhood, middle school students) across various issue areas Broad partnerships across issue areas and sectors for coordinated strategy, policy advocacy, and integrated services
Type of organizaFon / iniFaFve and key success factors
Sources: Various organization/program websites, marketing materials, strategic plans, and staff interviews
Program Name Brief Description Coverage
Type of ProgramType of ProgramType of ProgramType of Program
Program Name Brief Description Coverage Policy Advocacy /
Strategy
Education and
Outreach
Benefit Screening
and Assistance
Support Services
NM Voices for Children
• Statewide non-partisan research and advocacy organization working to eliminate child poverty and improve the health and well-being of NM children, families and communities
• Statewide• Children and low-
income working families
✓
NM Center for Law and Poverty
• Non-profit law firm and advocacy group working to advance economic and social justice through education, advocacy and litigation for low income New Mexicans.
• Statewide ✓ ✓ (trains
providers)
My Community NM / SALUD Manual
• Bilingual online and print inventory/database of public and community resources for underserved population; Plans for developing grant/project database
• Currently Bernalillo, Sandoval, Valencia and Sierra counties ✓
Community Action Agencies (e.g., Help-NM, Community Action Agency of South NM, ECHO)
• Provide a variety of services, such as: Head Start, pre-school day care, adult day care, USDA programs, emergency food boxes, weatherization, home repair and rehabilitation, homeless prevention, housing, senior programs, migrant programs, emergency assistance, free tax preparation services and info and referral to other resources.
• 8 CAAs Statewide
? ✓ ✓ ✓
NM Early Childhood Action Network
• Advisory Council Network of early childhood champions and stakeholders working to develop comprehensive action plan and improve wellbeing of children birth - 5 and their families
• Statewide; has local systems committees
• Children birth - 5 (and families)
✓
Project LAUNCH
• SAMHSA grant program carried out by multi-agency team across DOH, PED, HSD, and CYFD working toward building statewide infrastructure and system alignment to promote wellbeing of young children birth-8
• Statewide• Demonstration
project in Santa Fe County
✓ ✓ ? ✓
Elev8 New Mexico
• Integrates school-based health care, quality out-of-school time programs, and family support services in middle schools
• Middle School students (& families)
• Piloted in 5 sites
✓
NM Forum for Youth in Community
• Statewide network intermediary that works as both catalyst and support to the positive youth development movement through research, advocacy, assessment, facilitation, convening, connecting, capacity building, mobilizing and network building
• Statewide
✓ ✓ ✓
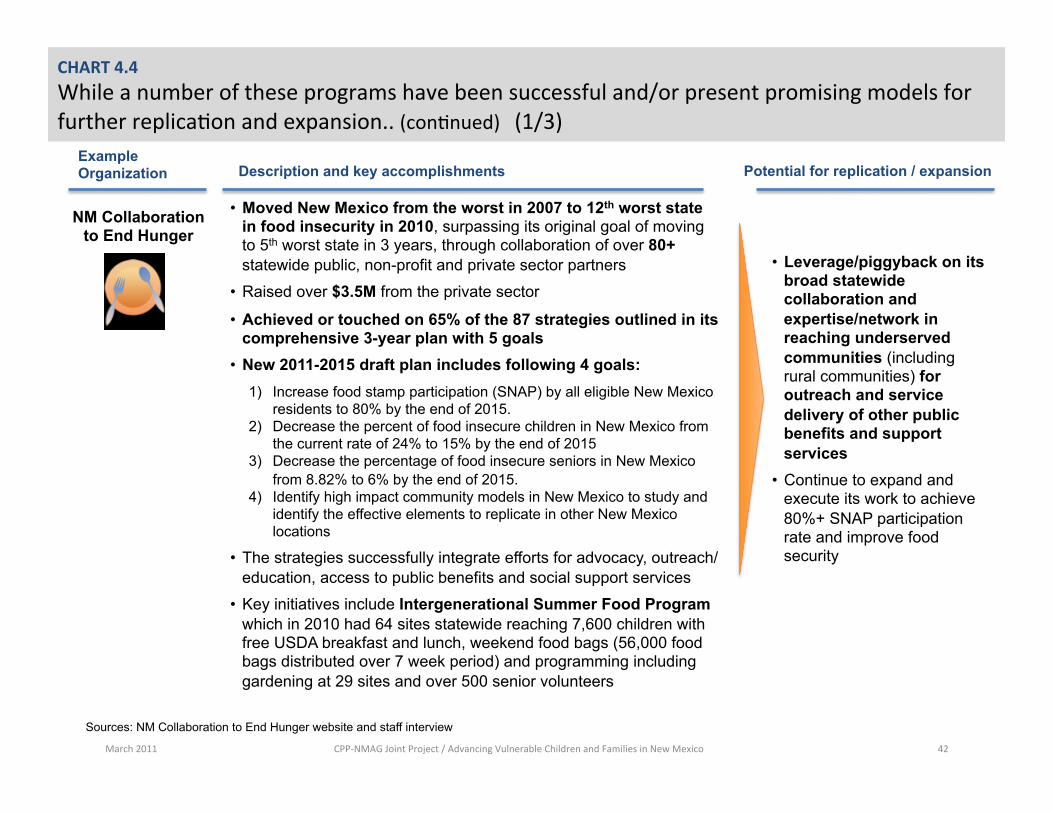
March 2011 CPP-‐NMAG Joint Project / Advancing Vulnerable Children and Families in New Mexico 42
CHART 4.4 While a number of these programs have been successful and/or present promising models for further replica;on and expansion.. (con;nued) (1/3)
NM Collaboration to End Hunger
Description and key accomplishments Potential for replication / expansion
• Leverage/piggyback on its broad statewide collaboration and expertise/network in reaching underserved communities (including rural communities) for outreach and service delivery of other public benefits and support services
• Continue to expand and execute its work to achieve 80%+ SNAP participation rate and improve food security
Example Organization
Sources: NM Collaboration to End Hunger website and staff interview
• Moved New Mexico from the worst in 2007 to 12th worst state in food insecurity in 2010, surpassing its original goal of moving to 5th worst state in 3 years, through collaboration of over 80+ statewide public, non-profit and private sector partners
• Raised over $3.5M from the private sector
• Achieved or touched on 65% of the 87 strategies outlined in its comprehensive 3-year plan with 5 goals
• New 2011-2015 draft plan includes following 4 goals: 1) Increase food stamp participation (SNAP) by all eligible New Mexico
residents to 80% by the end of 2015. 2) Decrease the percent of food insecure children in New Mexico from
the current rate of 24% to 15% by the end of 2015 3) Decrease the percentage of food insecure seniors in New Mexico
from 8.82% to 6% by the end of 2015. 4) Identify high impact community models in New Mexico to study and
identify the effective elements to replicate in other New Mexico locations
• The strategies successfully integrate efforts for advocacy, outreach/education, access to public benefits and social support services
• Key initiatives include Intergenerational Summer Food Program which in 2010 had 64 sites statewide reaching 7,600 children with free USDA breakfast and lunch, weekend food bags (56,000 food bags distributed over 7 week period) and programming including gardening at 29 sites and over 500 senior volunteers
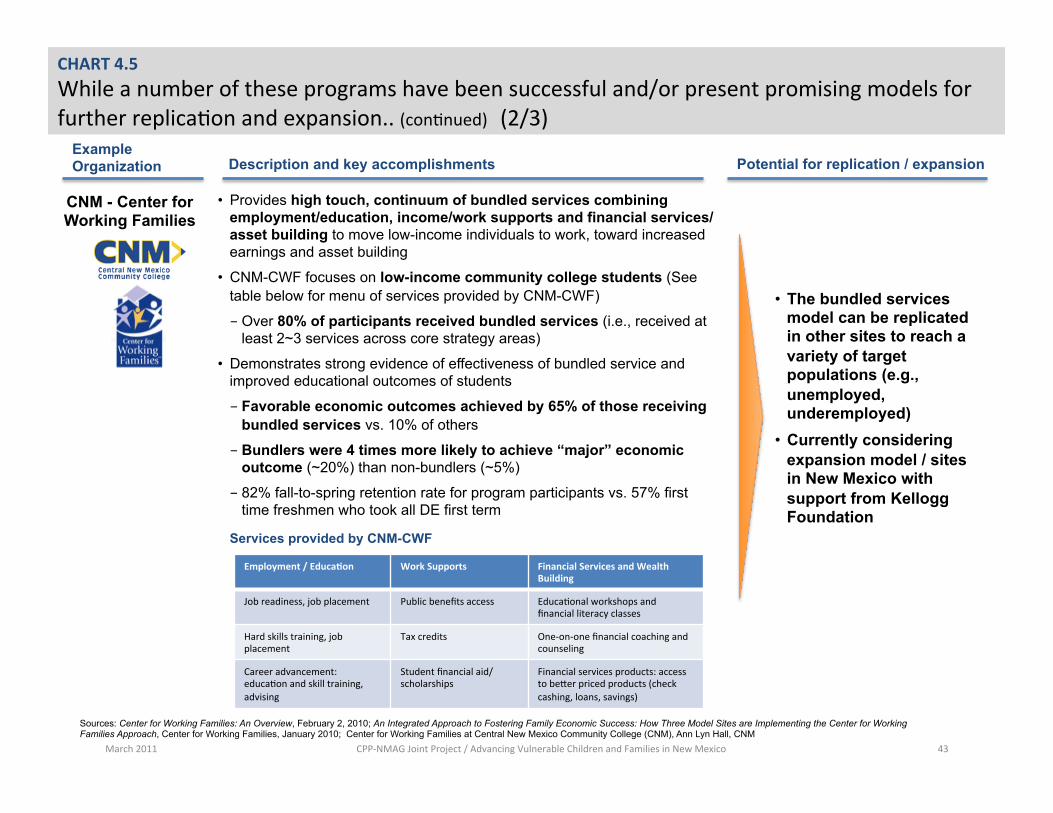
March 2011 CPP-‐NMAG Joint Project / Advancing Vulnerable Children and Families in New Mexico 43
CHART 4.5 While a number of these programs have been successful and/or present promising models for further replica;on and expansion.. (con;nued) (2/3)
Description and key accomplishments Potential for replication / expansion
CNM - Center for Working Families
Example Organization
Sources: Center for Working Families: An Overview, February 2, 2010; An Integrated Approach to Fostering Family Economic Success: How Three Model Sites are Implementing the Center for Working Families Approach, Center for Working Families, January 2010; Center for Working Families at Central New Mexico Community College (CNM), Ann Lyn Hall, CNM
• Provides high touch, continuum of bundled services combining employment/education, income/work supports and financial services/asset building to move low-income individuals to work, toward increased earnings and asset building
• CNM-CWF focuses on low-income community college students (See table below for menu of services provided by CNM-CWF)
- Over 80% of participants received bundled services (i.e., received at least 2~3 services across core strategy areas)
• Demonstrates strong evidence of effectiveness of bundled service and improved educational outcomes of students
- Favorable economic outcomes achieved by 65% of those receiving bundled services vs. 10% of others
- Bundlers were 4 times more likely to achieve “major” economic outcome (~20%) than non-bundlers (~5%)
- 82% fall-to-spring retention rate for program participants vs. 57% first time freshmen who took all DE first term
Employment / EducaFon Work Supports Financial Services and Wealth Building
Job readiness, job placement Public benefits access Educa;onal workshops and financial literacy classes
Hard skills training, job placement
Tax credits One-‐on-‐one financial coaching and counseling
Career advancement: educa;on and skill training, advising
Student financial aid/ scholarships
Financial services products: access to becer priced products (check cashing, loans, savings)
• The bundled services model can be replicated in other sites to reach a variety of target populations (e.g., unemployed, underemployed)
• Currently considering expansion model / sites in New Mexico with support from Kellogg Foundation
Services provided by CNM-CWF
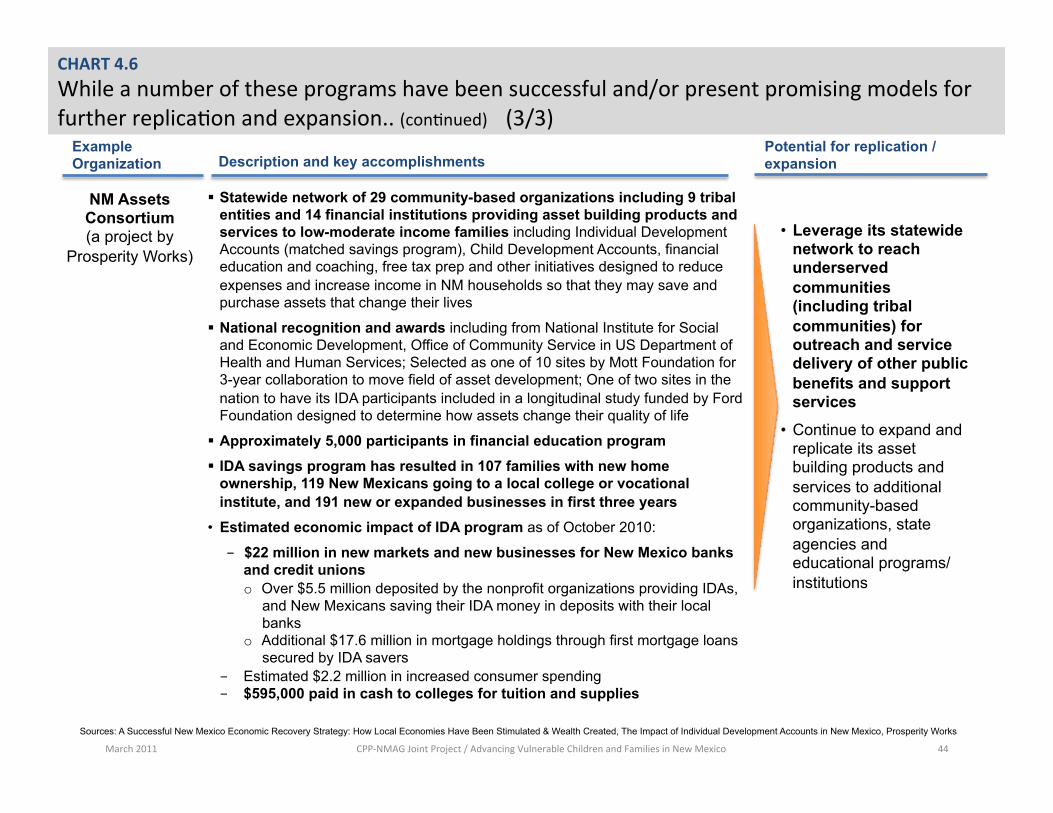
March 2011 CPP-‐NMAG Joint Project / Advancing Vulnerable Children and Families in New Mexico 44
CHART 4.6 While a number of these programs have been successful and/or present promising models for further replica;on and expansion.. (con;nued) (3/3)
Description and key accomplishments Potential for replication / expansion
NM Assets Consortium (a project by
Prosperity Works)
Example Organization
Sources: A Successful New Mexico Economic Recovery Strategy: How Local Economies Have Been Stimulated & Wealth Created, The Impact of Individual Development Accounts in New Mexico, Prosperity Works
§ Statewide network of 29 community-based organizations including 9 tribal entities and 14 financial institutions providing asset building products and services to low-moderate income families including Individual Development Accounts (matched savings program), Child Development Accounts, financial education and coaching, free tax prep and other initiatives designed to reduce expenses and increase income in NM households so that they may save and purchase assets that change their lives
§ National recognition and awards including from National Institute for Social and Economic Development, Office of Community Service in US Department of Health and Human Services; Selected as one of 10 sites by Mott Foundation for 3-year collaboration to move field of asset development; One of two sites in the nation to have its IDA participants included in a longitudinal study funded by Ford Foundation designed to determine how assets change their quality of life
§ Approximately 5,000 participants in financial education program § IDA savings program has resulted in 107 families with new home
ownership, 119 New Mexicans going to a local college or vocational institute, and 191 new or expanded businesses in first three years
• Estimated economic impact of IDA program as of October 2010:
- $22 million in new markets and new businesses for New Mexico banks and credit unions o Over $5.5 million deposited by the nonprofit organizations providing IDAs,
and New Mexicans saving their IDA money in deposits with their local banks
o Additional $17.6 million in mortgage holdings through first mortgage loans secured by IDA savers
- Estimated $2.2 million in increased consumer spending - $595,000 paid in cash to colleges for tuition and supplies
• Leverage its statewide network to reach underserved communities (including tribal communities) for outreach and service delivery of other public benefits and support services
• Continue to expand and replicate its asset building products and services to additional community-based organizations, state agencies and educational programs/institutions
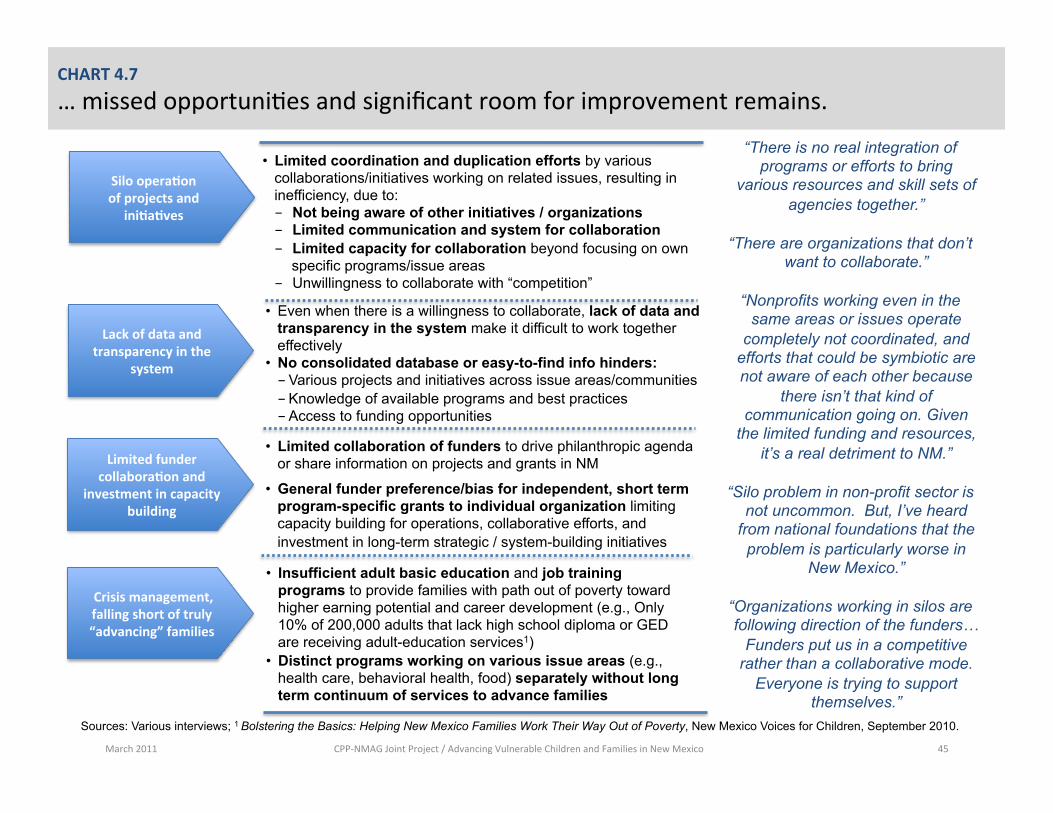
March 2011 CPP-‐NMAG Joint Project / Advancing Vulnerable Children and Families in New Mexico 45
CHART 4.7 … missed opportuni;es and significant room for improvement remains.
• Limited coordination and duplication efforts by various collaborations/initiatives working on related issues, resulting in inefficiency, due to: - Not being aware of other initiatives / organizations - Limited communication and system for collaboration - Limited capacity for collaboration beyond focusing on own
specific programs/issue areas - Unwillingness to collaborate with “competition”
Silo operaFon of projects and
iniFaFves
Limited funder collaboraFon and
investment in capacity building
Crisis management, falling short of truly “advancing” families
“There is no real integration of programs or efforts to bring
various resources and skill sets of agencies together.”
“There are organizations that don’t
want to collaborate.”
“Nonprofits working even in the same areas or issues operate
completely not coordinated, and efforts that could be symbiotic are not aware of each other because
there isn’t that kind of communication going on. Given
the limited funding and resources, it’s a real detriment to NM.”
“Silo problem in non-profit sector is
not uncommon. But, I’ve heard from national foundations that the
problem is particularly worse in New Mexico.”
“Organizations working in silos are following direction of the funders…
Funders put us in a competitive rather than a collaborative mode.
Everyone is trying to support themselves.”
• Insufficient adult basic education and job training programs to provide families with path out of poverty toward higher earning potential and career development (e.g., Only 10% of 200,000 adults that lack high school diploma or GED are receiving adult-education services1)
• Distinct programs working on various issue areas (e.g., health care, behavioral health, food) separately without long term continuum of services to advance families
• Limited collaboration of funders to drive philanthropic agenda or share information on projects and grants in NM
• General funder preference/bias for independent, short term program-specific grants to individual organization limiting capacity building for operations, collaborative efforts, and investment in long-term strategic / system-building initiatives
Lack of data and transparency in the
system
• Even when there is a willingness to collaborate, lack of data and transparency in the system make it difficult to work together effectively
• No consolidated database or easy-to-find info hinders: - Various projects and initiatives across issue areas/communities - Knowledge of available programs and best practices - Access to funding opportunities
Sources: Various interviews; 1 Bolstering the Basics: Helping New Mexico Families Work Their Way Out of Poverty, New Mexico Voices for Children, September 2010.
March 2011 CPP-‐NMAG Joint Project / Advancing Vulnerable Children and Families in New Mexico 46
TABLE OF CONTENTS
Introduction and Executive Summary
SECTION 1. New Mexico’s Vulnerable Children and Families • Summary of current state by key areas and indicators: Supported, Healthy, Safe, Educated • Highlight on low-income working families
SECTION 2. Priority Counties for Pilot Initiatives and the Need for a Community-based Strategy • Priority counties for community-based strategy pilot • Summary of county-level analysis by key areas and indicators
SECTION 3. Public Benefit Programs and Systematic Challenges to Improving Access • Government benefit programs available to vulnerable children and families in New Mexico • Trends in enrollment, recent improvements and gap in benefits access
SECTION 4. Statewide Non-Profit Initiatives: Best Practices and Missed Opportunities • Examples of key statewide non-profit initiatives • Best practice highlights • Gaps and missed opportunities for improvements
SECTION 5. Improving Benefits Access and Integrated Services: National Best Practice Trends and Early Evidence of Impact
• Barriers to benefits access • Framework for integrated strategy and best practice examples in outreach, service delivery, and system • Early evidence of positive impact on families, system, and economy
SECTION 6. Proposal for a Collaborative Strategy and System Building Process • Six strategies and example initiatives across outreach, service delivery, and system building • Short term potential priority initiatives and next steps
Appendix
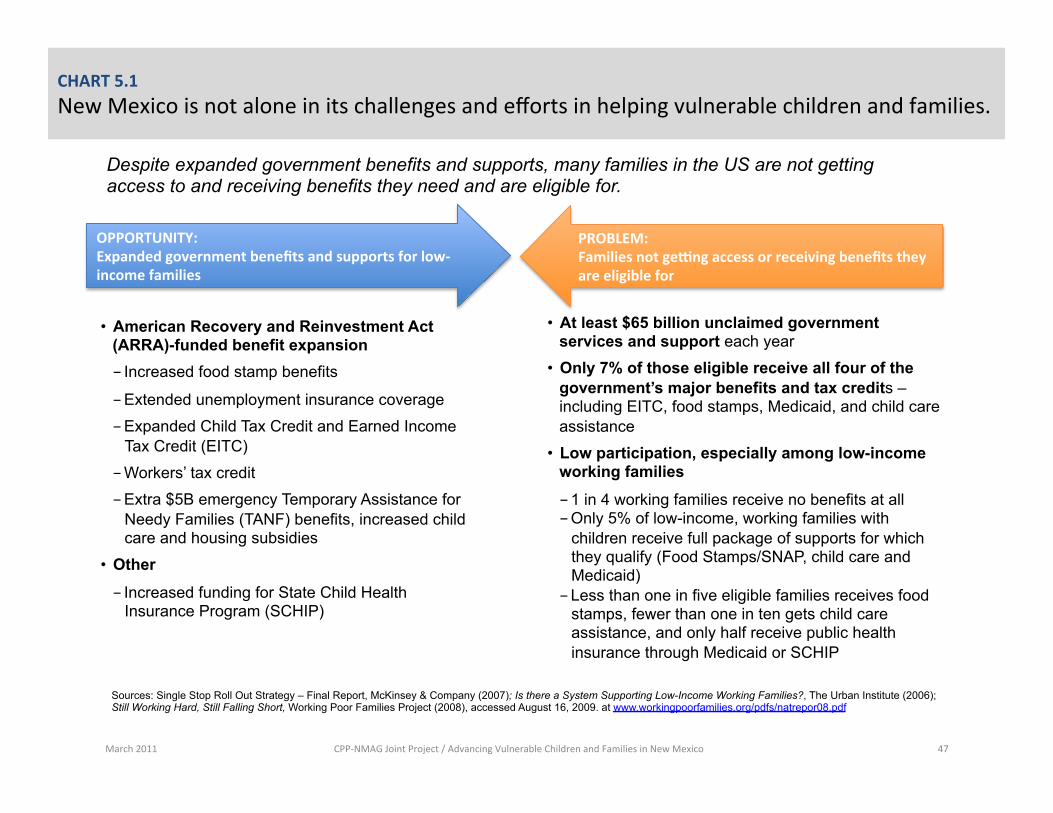
March 2011 CPP-‐NMAG Joint Project / Advancing Vulnerable Children and Families in New Mexico 47
OPPORTUNITY: Expanded government benefits and supports for low-‐income families
PROBLEM: Families not geong access or receiving benefits they are eligible for
• American Recovery and Reinvestment Act (ARRA)-funded benefit expansion - Increased food stamp benefits
- Extended unemployment insurance coverage
- Expanded Child Tax Credit and Earned Income Tax Credit (EITC)
- Workers’ tax credit
- Extra $5B emergency Temporary Assistance for Needy Families (TANF) benefits, increased child care and housing subsidies
• Other
- Increased funding for State Child Health Insurance Program (SCHIP)
• At least $65 billion unclaimed government services and support each year
• Only 7% of those eligible receive all four of the government’s major benefits and tax credits – including EITC, food stamps, Medicaid, and child care assistance
• Low participation, especially among low-income working families
- 1 in 4 working families receive no benefits at all - Only 5% of low-income, working families with
children receive full package of supports for which they qualify (Food Stamps/SNAP, child care and Medicaid) - Less than one in five eligible families receives food
stamps, fewer than one in ten gets child care assistance, and only half receive public health insurance through Medicaid or SCHIP
Sources: Single Stop Roll Out Strategy – Final Report, McKinsey & Company (2007); Is there a System Supporting Low-Income Working Families?, The Urban Institute (2006); Still Working Hard, Still Falling Short, Working Poor Families Project (2008), accessed August 16, 2009. at www.workingpoorfamilies.org/pdfs/natrepor08.pdf
CHART 5.1 New Mexico is not alone in its challenges and efforts in helping vulnerable children and families.
Despite expanded government benefits and supports, many families in the US are not getting access to and receiving benefits they need and are eligible for.
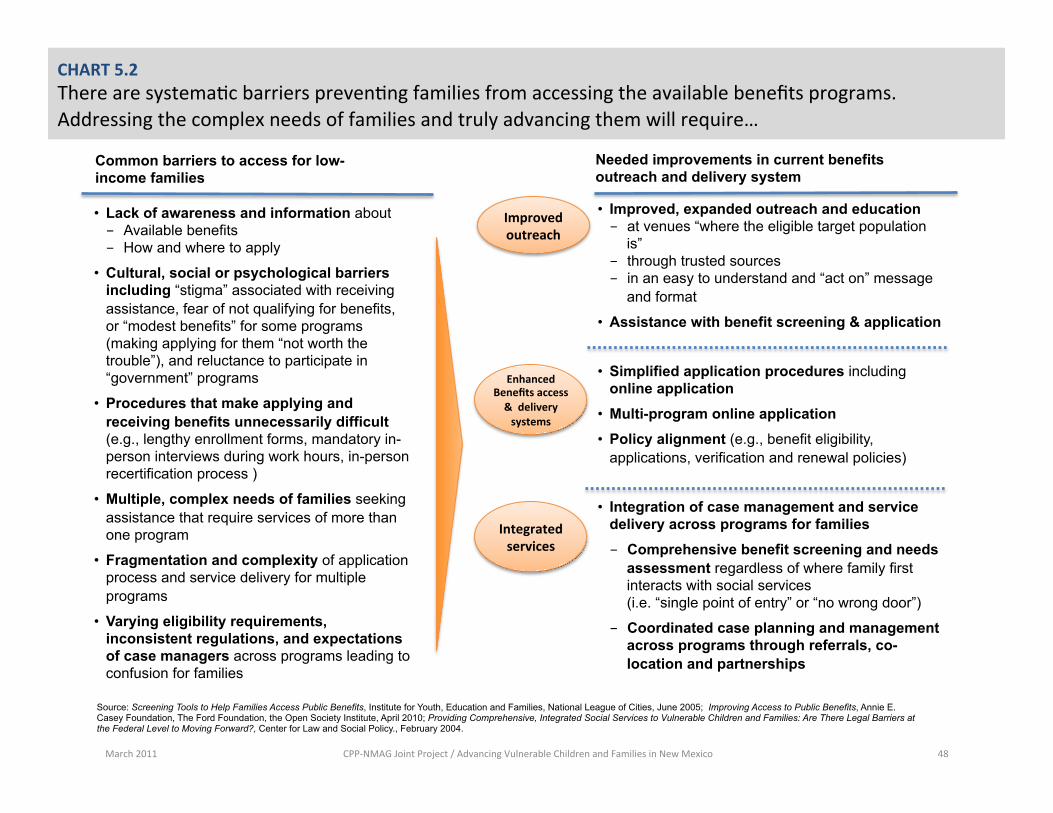
March 2011 CPP-‐NMAG Joint Project / Advancing Vulnerable Children and Families in New Mexico 48
• Lack of awareness and information about - Available benefits - How and where to apply
• Cultural, social or psychological barriers including “stigma” associated with receiving assistance, fear of not qualifying for benefits, or “modest benefits” for some programs (making applying for them “not worth the trouble”), and reluctance to participate in “government” programs
• Procedures that make applying and receiving benefits unnecessarily difficult (e.g., lengthy enrollment forms, mandatory in-person interviews during work hours, in-person recertification process )
• Multiple, complex needs of families seeking assistance that require services of more than one program
• Fragmentation and complexity of application process and service delivery for multiple programs
• Varying eligibility requirements, inconsistent regulations, and expectations of case managers across programs leading to confusion for families
Common barriers to access for low-income families
Source: Screening Tools to Help Families Access Public Benefits, Institute for Youth, Education and Families, National League of Cities, June 2005; Improving Access to Public Benefits, Annie E. Casey Foundation, The Ford Foundation, the Open Society Institute, April 2010; Providing Comprehensive, Integrated Social Services to Vulnerable Children and Families: Are There Legal Barriers at the Federal Level to Moving Forward?, Center for Law and Social Policy., February 2004.
• Improved, expanded outreach and education - at venues “where the eligible target population
is” - through trusted sources - in an easy to understand and “act on” message
and format
• Assistance with benefit screening & application
• Simplified application procedures including online application
• Multi-program online application • Policy alignment (e.g., benefit eligibility,
applications, verification and renewal policies)
• Integration of case management and service delivery across programs for families - Comprehensive benefit screening and needs
assessment regardless of where family first interacts with social services (i.e. “single point of entry” or “no wrong door”)
- Coordinated case planning and management across programs through referrals, co-location and partnerships
Needed improvements in current benefits outreach and delivery system
Improved outreach
Enhanced Benefits access & delivery systems
Integrated services
CHART 5.2 There are systema;c barriers preven;ng families from accessing the available benefits programs. Addressing the complex needs of families and truly advancing them will require…
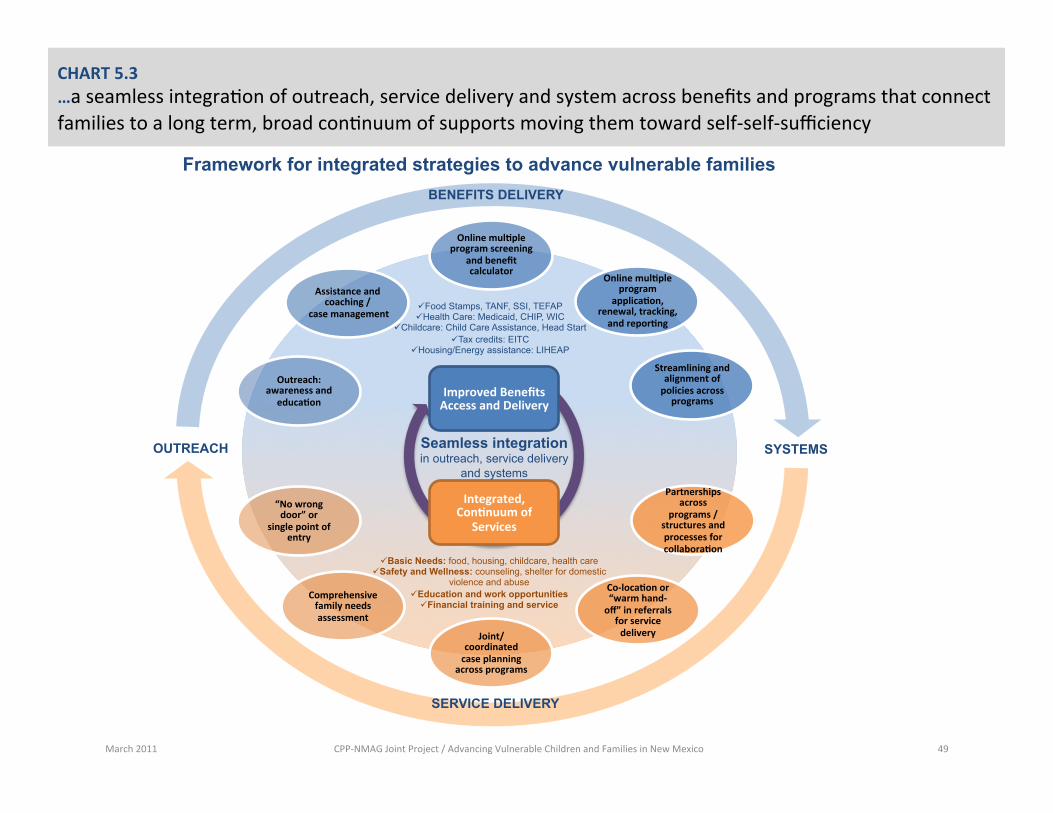
“No wrong door” or
single point of entry
Comprehensive family needs assessment
Joint/coordinated case planning
across programs
Co-‐locaFon or “warm hand-‐off” in referrals for service delivery
Partnerships across
programs / structures and processes for collaboraFon
Improved Benefits Access and Delivery
Integrated, ConFnuum of
Services
Seamless integration in outreach, service delivery
and systems
ü Basic Needs: food, housing, childcare, health care ü Safety and Wellness: counseling, shelter for domestic
violence and abuse ü Education and work opportunities
ü Financial training and service
ü Food Stamps, TANF, SSI, TEFAP ü Health Care: Medicaid, CHIP, WIC
ü Childcare: Child Care Assistance, Head Start ü Tax credits: EITC
ü Housing/Energy assistance: LIHEAP
OUTREACH SYSTEMS
SERVICE DELIVERY
Outreach: awareness and
educaFon
Assistance and coaching /
case management
Online mulFple program screening
and benefit calculator
Online mulFple program
applicaFon, renewal, tracking, and reporFng
Streamlining and alignment of policies across programs
March 2011 CPP-‐NMAG Joint Project / Advancing Vulnerable Children and Families in New Mexico 49
Framework for integrated strategies to advance vulnerable families BENEFITS DELIVERY
CHART 5.3 …a seamless integra;on of outreach, service delivery and system across benefits and programs that connect families to a long term, broad con;nuum of supports moving them toward self-‐self-‐sufficiency
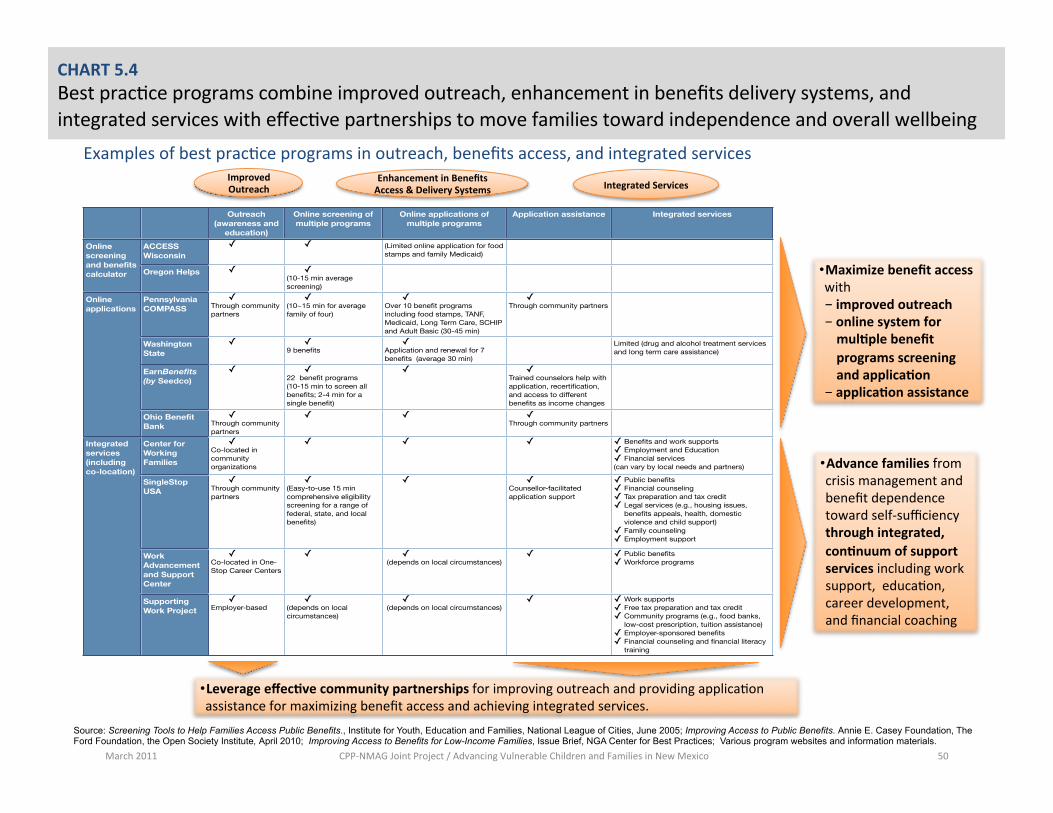
March 2011 CPP-‐NMAG Joint Project / Advancing Vulnerable Children and Families in New Mexico 50
CHART 5.4 Best prac;ce programs combine improved outreach, enhancement in benefits delivery systems, and integrated services with effec;ve partnerships to move families toward independence and overall wellbeing
Examples of best prac;ce programs in outreach, benefits access, and integrated services
• Advance families from crisis management and benefit dependence toward self-‐sufficiency through integrated, conFnuum of support services including work support, educa;on, career development, and financial coaching
• Maximize benefit access with - improved outreach - online system for mulFple benefit programs screening and applicaFon
- applicaFon assistance
• Leverage effecFve community partnerships for improving outreach and providing applica;on assistance for maximizing benefit access and achieving integrated services.
Source: Screening Tools to Help Families Access Public Benefits., Institute for Youth, Education and Families, National League of Cities, June 2005; Improving Access to Public Benefits. Annie E. Casey Foundation, The Ford Foundation, the Open Society Institute, April 2010; Improving Access to Benefits for Low-Income Families, Issue Brief, NGA Center for Best Practices; Various program websites and information materials.
Improved Outreach
Enhancement in Benefits Access & Delivery Systems Integrated Services
Outreach (awareness and
education)
Online screening of multiple programs
Online applications of multiple programs
Application assistance Integrated services
Online screening and benefits calculator
ACCESS Wisconsin
Online screening and benefits calculator Oregon Helps
Online applications
Pennsylvania COMPASS
Online applications
Washington State
Online applications
EarnBenefits (by Seedco)
Online applications
Ohio Benefit Bank
Integrated services (including co-location)
Center for Working Families
Integrated services (including co-location)
SingleStop USA
Integrated services (including co-location)
Work Advancement and Support Center
Integrated services (including co-location)
Supporting Work Project
✓ ✓ (Limited online application for food stamps and family Medicaid)
✓ ✓ (10-15 min average screening)
✓Through community partners
✓ (10~15 min for average family of four)
✓ Over 10 benefit programs including food stamps, TANF, Medicaid, Long Term Care, SCHIP and Adult Basic (30-45 min)
✓Through community partners
✓ ✓ 9 benefits
✓ Application and renewal for 7 benefits (average 30 min)
Limited (drug and alcohol treatment services and long term care assistance)
✓ ✓ 22 benefit programs(10-15 min to screen all benefits; 2-4 min for a single benefit)
✓ ✓Trained counselors help with application, recertification, and access to different benefits as income changes
✓Through community partners
✓ ✓ ✓Through community partners
✓Co-located in community organizations
✓ ✓ ✓ ✓ Benefits and work supports ✓ Employment and Education ✓ Financial services(can vary by local needs and partners)
✓Through community partners
✓ (Easy-to-use 15 min comprehensive eligibility screening for a range of federal, state, and local benefits)
✓ ✓Counsellor-facilitated application support
✓ Public benefits✓ Financial counseling✓ Tax preparation and tax credit✓ Legal services (e.g., housing issues,
benefits appeals, health, domestic violence and child support)
✓ Family counseling✓ Employment support
✓Co-located in One-Stop Career Centers
✓ ✓(depends on local circumstances)
✓ ✓ Public benefits✓ Workforce programs
✓Employer-based
✓(depends on local circumstances)
✓(depends on local circumstances)
✓ ✓ Work supports✓ Free tax preparation and tax credit✓ Community programs (e.g., food banks,
low-cost prescription, tuition assistance)✓ Employer-sponsored benefits✓ Financial counseling and financial literacy
training
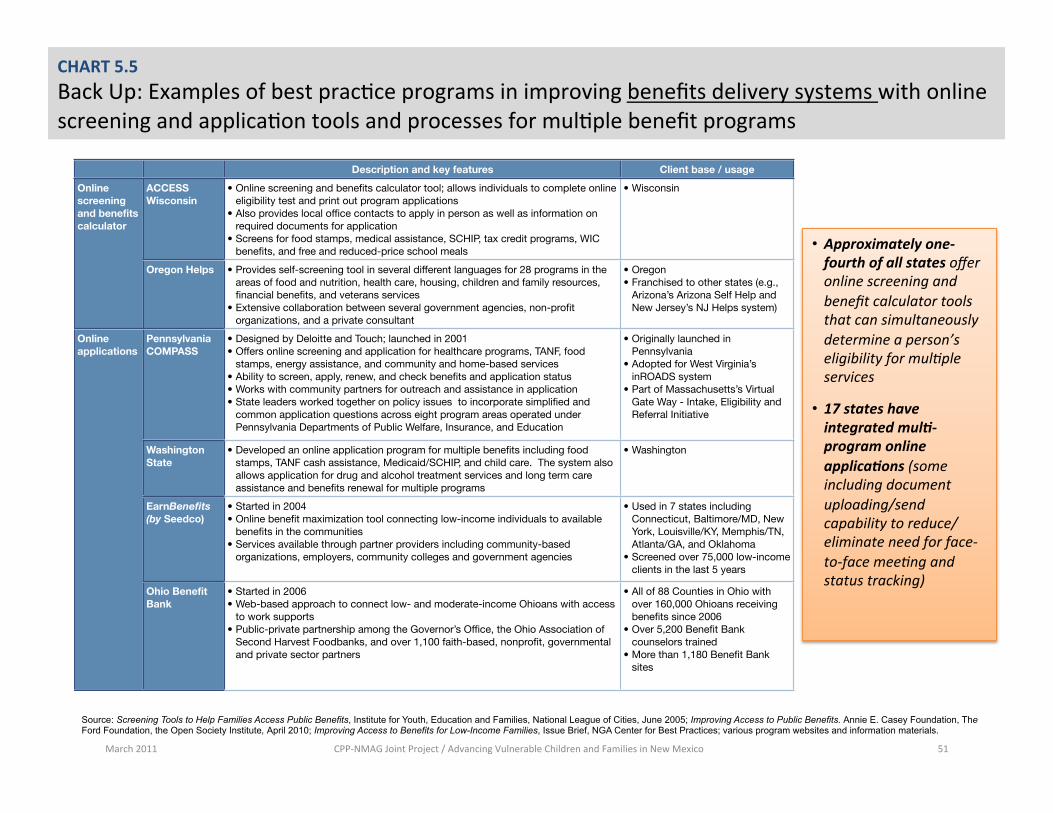
March 2011 CPP-‐NMAG Joint Project / Advancing Vulnerable Children and Families in New Mexico 51
CHART 5.5 Back Up: Examples of best prac;ce programs in improving benefits delivery systems with online screening and applica;on tools and processes for mul;ple benefit programs
• Approximately one-‐fourth of all states offer online screening and benefit calculator tools that can simultaneously determine a person’s eligibility for mulIple services
• 17 states have integrated mul5-‐program online applica5ons (some including document uploading/send capability to reduce/eliminate need for face-‐to-‐face meeIng and status tracking)
Source: Screening Tools to Help Families Access Public Benefits, Institute for Youth, Education and Families, National League of Cities, June 2005; Improving Access to Public Benefits. Annie E. Casey Foundation, The Ford Foundation, the Open Society Institute, April 2010; Improving Access to Benefits for Low-Income Families, Issue Brief, NGA Center for Best Practices; various program websites and information materials.
Description and key features Client base / usage
Online screening and benefits calculator
ACCESS Wisconsin
Online screening and benefits calculator
Oregon Helps
Online applications
Pennsylvania COMPASS
Online applications
Washington State
Online applications
EarnBenefits (by Seedco)
Online applications
Ohio Benefit Bank
• Online screening and benefits calculator tool; allows individuals to complete online eligibility test and print out program applications
• Also provides local office contacts to apply in person as well as information on required documents for application
• Screens for food stamps, medical assistance, SCHIP, tax credit programs, WIC benefits, and free and reduced-price school meals
• Wisconsin
• Provides self-screening tool in several different languages for 28 programs in the areas of food and nutrition, health care, housing, children and family resources, financial benefits, and veterans services
• Extensive collaboration between several government agencies, non-profit organizations, and a private consultant
• Oregon• Franchised to other states (e.g.,
Arizona’s Arizona Self Help and New Jersey’s NJ Helps system)
• Designed by Deloitte and Touch; launched in 2001• Offers online screening and application for healthcare programs, TANF, food
stamps, energy assistance, and community and home-based services• Ability to screen, apply, renew, and check benefits and application status • Works with community partners for outreach and assistance in application• State leaders worked together on policy issues to incorporate simplified and
common application questions across eight program areas operated under Pennsylvania Departments of Public Welfare, Insurance, and Education
• Originally launched in Pennsylvania
• Adopted for West Virginia’s inROADS system
• Part of Massachusetts’s Virtual Gate Way - Intake, Eligibility and Referral Initiative
• Developed an online application program for multiple benefits including food stamps, TANF cash assistance, Medicaid/SCHIP, and child care. The system also allows application for drug and alcohol treatment services and long term care assistance and benefits renewal for multiple programs
• Washington
• Started in 2004• Online benefit maximization tool connecting low-income individuals to available
benefits in the communities• Services available through partner providers including community-based
organizations, employers, community colleges and government agencies
• Used in 7 states including Connecticut, Baltimore/MD, New York, Louisville/KY, Memphis/TN, Atlanta/GA, and Oklahoma
• Screened over 75,000 low-income clients in the last 5 years
• Started in 2006• Web-based approach to connect low- and moderate-income Ohioans with access
to work supports• Public-private partnership among the Governor’s Office, the Ohio Association of
Second Harvest Foodbanks, and over 1,100 faith-based, nonprofit, governmental and private sector partners
• All of 88 Counties in Ohio with over 160,000 Ohioans receiving benefits since 2006
• Over 5,200 Benefit Bank counselors trained
• More than 1,180 Benefit Bank sites
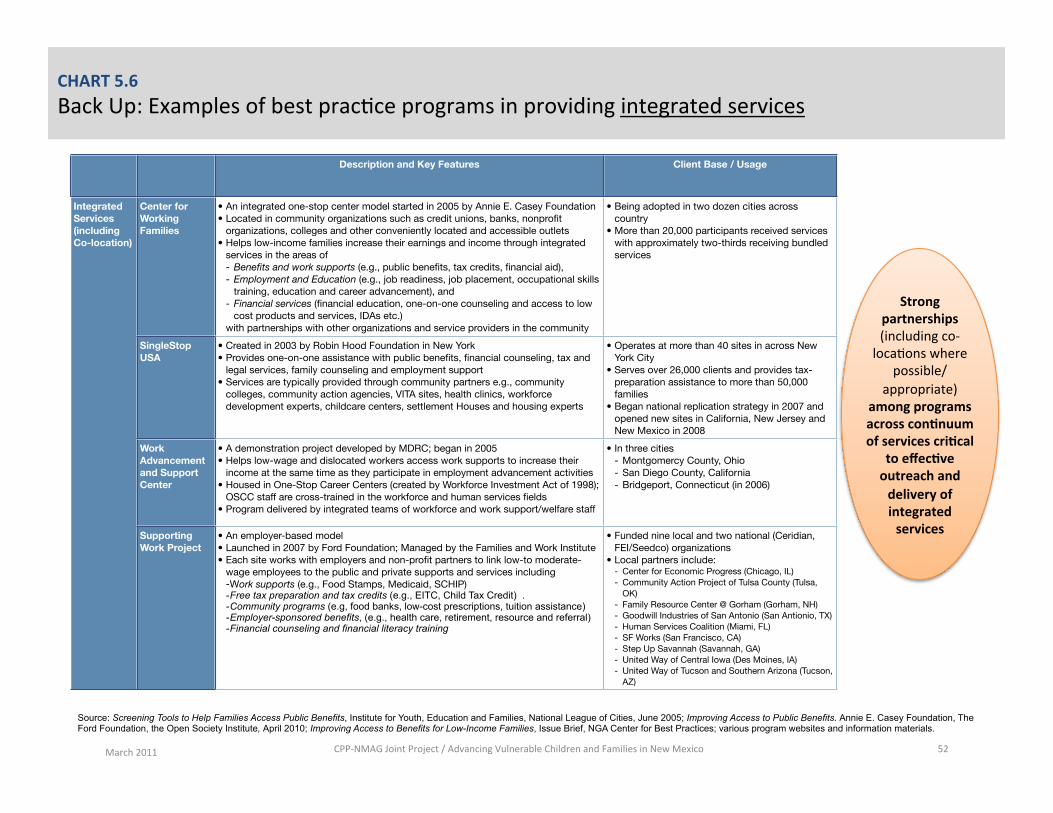
March 2011 CPP-‐NMAG Joint Project / Advancing Vulnerable Children and Families in New Mexico 52
CHART 5.6 Back Up: Examples of best prac;ce programs in providing integrated services
Description and Key Features Client Base / Usage
Integrated Services (including Co-location)
Center for Working Families
Integrated Services (including Co-location)
SingleStop USA
Integrated Services (including Co-location)
Work Advancement and Support Center
Integrated Services (including Co-location)
Supporting Work Project
• An integrated one-stop center model started in 2005 by Annie E. Casey Foundation • Located in community organizations such as credit unions, banks, nonprofit
organizations, colleges and other conveniently located and accessible outlets• Helps low-income families increase their earnings and income through integrated
services in the areas of- Benefits and work supports (e.g., public benefits, tax credits, financial aid),- Employment and Education (e.g., job readiness, job placement, occupational skills
training, education and career advancement), and - Financial services (financial education, one-on-one counseling and access to low
cost products and services, IDAs etc.)with partnerships with other organizations and service providers in the community
• Being adopted in two dozen cities across country
• More than 20,000 participants received services with approximately two-thirds receiving bundled services
• Created in 2003 by Robin Hood Foundation in New York• Provides one-on-one assistance with public benefits, financial counseling, tax and
legal services, family counseling and employment support• Services are typically provided through community partners e.g., community
colleges, community action agencies, VITA sites, health clinics, workforce development experts, childcare centers, settlement Houses and housing experts
• Operates at more than 40 sites in across New York City
• Serves over 26,000 clients and provides tax-preparation assistance to more than 50,000 families
• Began national replication strategy in 2007 and opened new sites in California, New Jersey and New Mexico in 2008
• A demonstration project developed by MDRC; began in 2005• Helps low-wage and dislocated workers access work supports to increase their
income at the same time as they participate in employment advancement activities • Housed in One-Stop Career Centers (created by Workforce Investment Act of 1998);
OSCC staff are cross-trained in the workforce and human services fields • Program delivered by integrated teams of workforce and work support/welfare staff
• In three cities- Montgomercy County, Ohio- San Diego County, California- Bridgeport, Connecticut (in 2006)
• An employer-based model • Launched in 2007 by Ford Foundation; Managed by the Families and Work Institute• Each site works with employers and non-profit partners to link low-to moderate-
wage employees to the public and private supports and services including -Work supports (e.g., Food Stamps, Medicaid, SCHIP)-Free tax preparation and tax credits (e.g., EITC, Child Tax Credit) .-Community programs (e.g, food banks, low-cost prescriptions, tuition assistance) -Employer-sponsored benefits, (e.g., health care, retirement, resource and referral)-Financial counseling and financial literacy training
• Funded nine local and two national (Ceridian, FEI/Seedco) organizations
• Local partners include:- Center for Economic Progress (Chicago, IL)- Community Action Project of Tulsa County (Tulsa,
OK)- Family Resource Center @ Gorham (Gorham, NH)- Goodwill Industries of San Antonio (San Antionio, TX)- Human Services Coalition (Miami, FL)- SF Works (San Francisco, CA)- Step Up Savannah (Savannah, GA)- United Way of Central Iowa (Des Moines, IA)- United Way of Tucson and Southern Arizona (Tucson,
AZ)
Strong partnerships (including co-‐loca;ons where
possible/ appropriate)
among programs across conFnuum of services criFcal
to effecFve outreach and delivery of integrated services
Source: Screening Tools to Help Families Access Public Benefits, Institute for Youth, Education and Families, National League of Cities, June 2005; Improving Access to Public Benefits. Annie E. Casey Foundation, The Ford Foundation, the Open Society Institute, April 2010; Improving Access to Benefits for Low-Income Families, Issue Brief, NGA Center for Best Practices; various program websites and information materials.
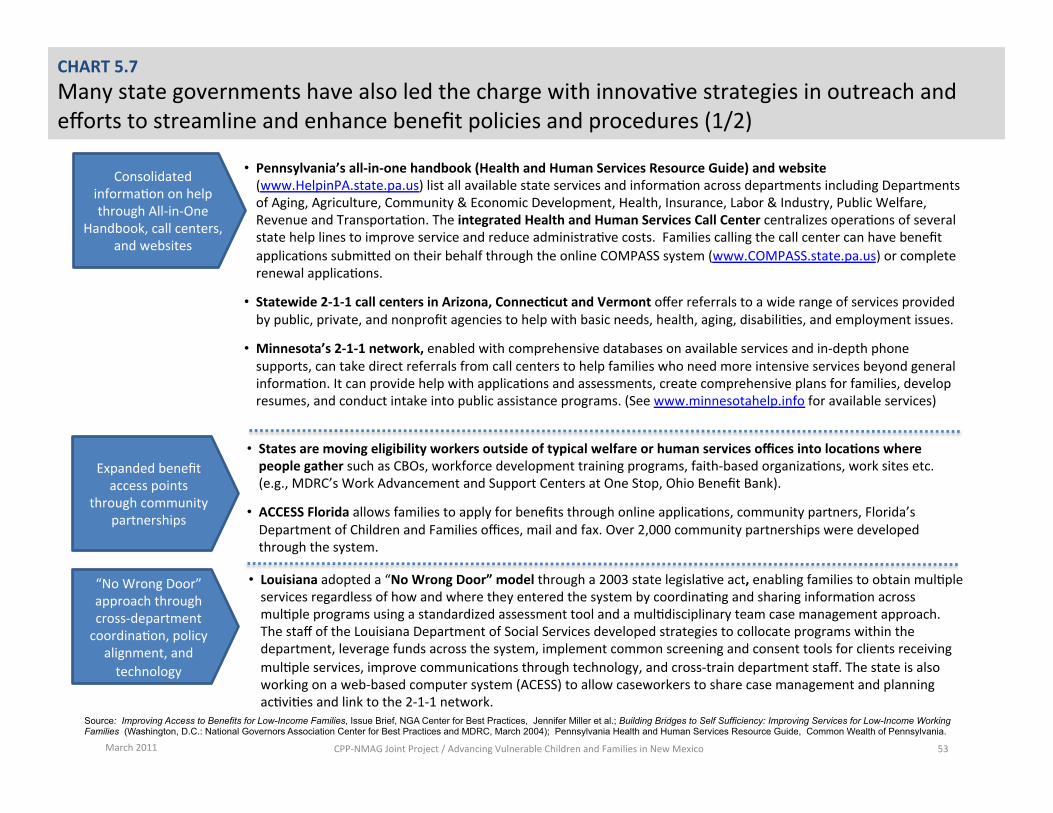
2010 November CPP-‐NMAG Joint Project / Advancing Vulnerable Children and Families in New Mexico 53
CHART 5.7 Many state governments have also led the charge with innova;ve strategies in outreach and efforts to streamline and enhance benefit policies and procedures (1/2)
• States are moving eligibility workers outside of typical welfare or human services offices into locaFons where people gather such as CBOs, workforce development training programs, faith-‐based organiza;ons, work sites etc. (e.g., MDRC’s Work Advancement and Support Centers at One Stop, Ohio Benefit Bank).
• ACCESS Florida allows families to apply for benefits through online applica;ons, community partners, Florida’s Department of Children and Families offices, mail and fax. Over 2,000 community partnerships were developed through the system.
Consolidated informa;on on help through All-‐in-‐One
Handbook, call centers, and websites
• Pennsylvania’s all-‐in-‐one handbook (Health and Human Services Resource Guide) and website (www.HelpinPA.state.pa.us) list all available state services and informa;on across departments including Departments of Aging, Agriculture, Community & Economic Development, Health, Insurance, Labor & Industry, Public Welfare, Revenue and Transporta;on. The integrated Health and Human Services Call Center centralizes opera;ons of several state help lines to improve service and reduce administra;ve costs. Families calling the call center can have benefit applica;ons submiced on their behalf through the online COMPASS system (www.COMPASS.state.pa.us) or complete renewal applica;ons.
• Statewide 2-‐1-‐1 call centers in Arizona, ConnecFcut and Vermont offer referrals to a wide range of services provided by public, private, and nonprofit agencies to help with basic needs, health, aging, disabili;es, and employment issues.
• Minnesota’s 2-‐1-‐1 network, enabled with comprehensive databases on available services and in-‐depth phone supports, can take direct referrals from call centers to help families who need more intensive services beyond general informa;on. It can provide help with applica;ons and assessments, create comprehensive plans for families, develop resumes, and conduct intake into public assistance programs. (See www.minnesotahelp.info for available services)
Expanded benefit access points
through community partnerships
Source: Improving Access to Benefits for Low-Income Families, Issue Brief, NGA Center for Best Practices, Jennifer Miller et al.; Building Bridges to Self Sufficiency: Improving Services for Low-Income Working Families (Washington, D.C.: National Governors Association Center for Best Practices and MDRC, March 2004); Pennsylvania Health and Human Services Resource Guide, Common Wealth of Pennsylvania.
“No Wrong Door” approach through cross-‐department coordina;on, policy alignment, and technology
• Louisiana adopted a “No Wrong Door” model through a 2003 state legisla;ve act, enabling families to obtain mul;ple services regardless of how and where they entered the system by coordina;ng and sharing informa;on across mul;ple programs using a standardized assessment tool and a mul;disciplinary team case management approach. The staff of the Louisiana Department of Social Services developed strategies to collocate programs within the department, leverage funds across the system, implement common screening and consent tools for clients receiving mul;ple services, improve communica;ons through technology, and cross-‐train department staff. The state is also working on a web-‐based computer system (ACESS) to allow caseworkers to share case management and planning ac;vi;es and link to the 2-‐1-‐1 network.
March 2011 CPP-‐NMAG Joint Project / Advancing Vulnerable Children and Families in New Mexico 53
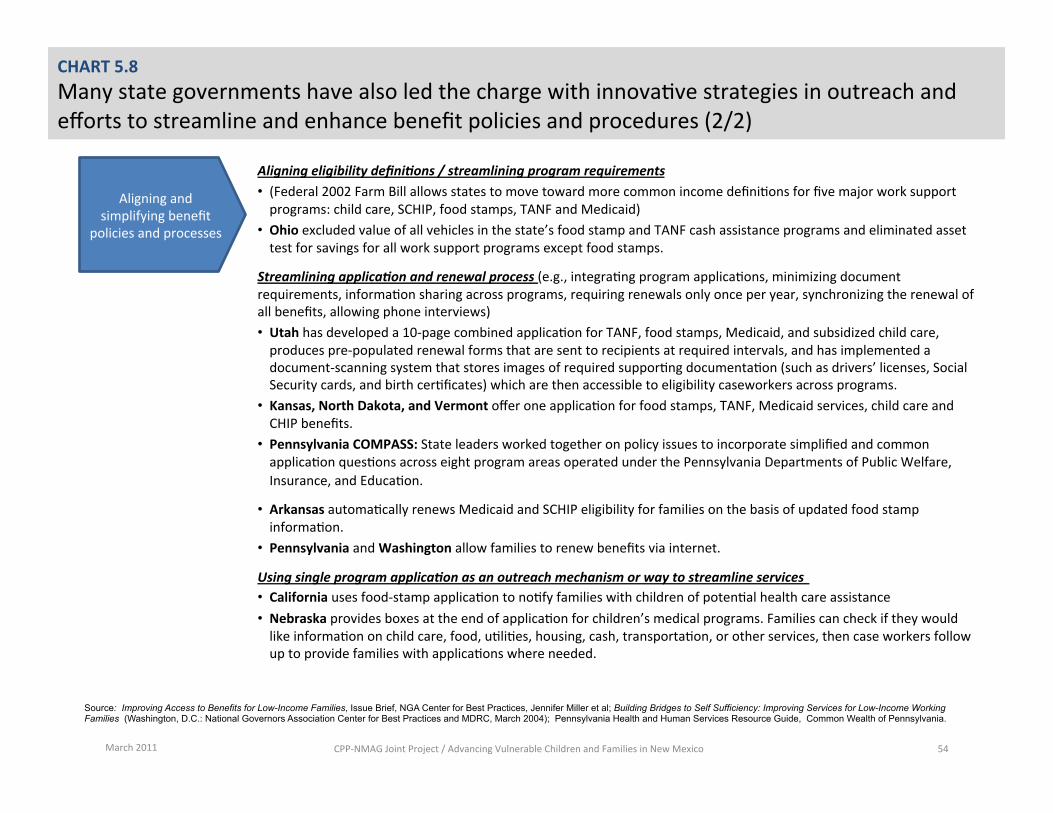
2010 November CPP-‐NMAG Joint Project / Advancing Vulnerable Children and Families in New Mexico 54
CHART 5.8 Many state governments have also led the charge with innova;ve strategies in outreach and efforts to streamline and enhance benefit policies and procedures (2/2)
Aligning eligibility defini5ons / streamlining program requirements • (Federal 2002 Farm Bill allows states to move toward more common income defini;ons for five major work support programs: child care, SCHIP, food stamps, TANF and Medicaid)
• Ohio excluded value of all vehicles in the state’s food stamp and TANF cash assistance programs and eliminated asset test for savings for all work support programs except food stamps.
Streamlining applica5on and renewal process (e.g., integra;ng program applica;ons, minimizing document requirements, informa;on sharing across programs, requiring renewals only once per year, synchronizing the renewal of all benefits, allowing phone interviews) • Utah has developed a 10-‐page combined applica;on for TANF, food stamps, Medicaid, and subsidized child care, produces pre-‐populated renewal forms that are sent to recipients at required intervals, and has implemented a document-‐scanning system that stores images of required suppor;ng documenta;on (such as drivers’ licenses, Social Security cards, and birth cer;ficates) which are then accessible to eligibility caseworkers across programs.
• Kansas, North Dakota, and Vermont offer one applica;on for food stamps, TANF, Medicaid services, child care and CHIP benefits.
• Pennsylvania COMPASS: State leaders worked together on policy issues to incorporate simplified and common applica;on ques;ons across eight program areas operated under the Pennsylvania Departments of Public Welfare, Insurance, and Educa;on.
• Arkansas automa;cally renews Medicaid and SCHIP eligibility for families on the basis of updated food stamp informa;on.
• Pennsylvania and Washington allow families to renew benefits via internet.
Using single program applica5on as an outreach mechanism or way to streamline services • California uses food-‐stamp applica;on to no;fy families with children of poten;al health care assistance • Nebraska provides boxes at the end of applica;on for children’s medical programs. Families can check if they would like informa;on on child care, food, u;li;es, housing, cash, transporta;on, or other services, then case workers follow up to provide families with applica;ons where needed.
Aligning and simplifying benefit
policies and processes
Source: Improving Access to Benefits for Low-Income Families, Issue Brief, NGA Center for Best Practices, Jennifer Miller et al; Building Bridges to Self Sufficiency: Improving Services for Low-Income Working Families (Washington, D.C.: National Governors Association Center for Best Practices and MDRC, March 2004); Pennsylvania Health and Human Services Resource Guide, Common Wealth of Pennsylvania.
March 2011 CPP-‐NMAG Joint Project / Advancing Vulnerable Children and Families in New Mexico 54
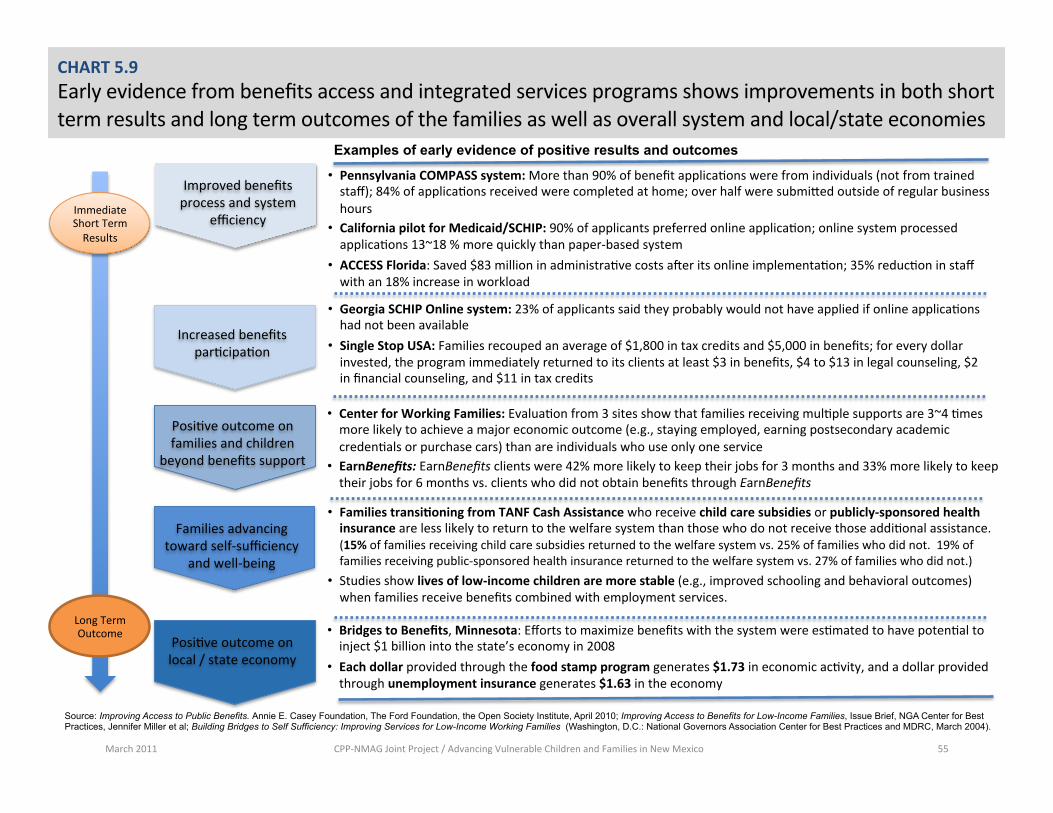
March 2011 CPP-‐NMAG Joint Project / Advancing Vulnerable Children and Families in New Mexico 55
Immediate Short Term Results
Long Term Outcome
• Pennsylvania COMPASS system: More than 90% of benefit applica;ons were from individuals (not from trained staff); 84% of applica;ons received were completed at home; over half were submiced outside of regular business hours
• California pilot for Medicaid/SCHIP: 90% of applicants preferred online applica;on; online system processed applica;ons 13~18 % more quickly than paper-‐based system
• ACCESS Florida: Saved $83 million in administra;ve costs ayer its online implementa;on; 35% reduc;on in staff with an 18% increase in workload
Examples of early evidence of positive results and outcomes
• Bridges to Benefits, Minnesota: Efforts to maximize benefits with the system were es;mated to have poten;al to inject $1 billion into the state’s economy in 2008
• Each dollar provided through the food stamp program generates $1.73 in economic ac;vity, and a dollar provided through unemployment insurance generates $1.63 in the economy
Source: Improving Access to Public Benefits. Annie E. Casey Foundation, The Ford Foundation, the Open Society Institute, April 2010; Improving Access to Benefits for Low-Income Families, Issue Brief, NGA Center for Best Practices, Jennifer Miller et al; Building Bridges to Self Sufficiency: Improving Services for Low-Income Working Families (Washington, D.C.: National Governors Association Center for Best Practices and MDRC, March 2004).
• Georgia SCHIP Online system: 23% of applicants said they probably would not have applied if online applica;ons had not been available
• Single Stop USA: Families recouped an average of $1,800 in tax credits and $5,000 in benefits; for every dollar invested, the program immediately returned to its clients at least $3 in benefits, $4 to $13 in legal counseling, $2 in financial counseling, and $11 in tax credits
• Center for Working Families: Evalua;on from 3 sites show that families receiving mul;ple supports are 3~4 ;mes more likely to achieve a major economic outcome (e.g., staying employed, earning postsecondary academic creden;als or purchase cars) than are individuals who use only one service
• EarnBenefits: EarnBenefits clients were 42% more likely to keep their jobs for 3 months and 33% more likely to keep their jobs for 6 months vs. clients who did not obtain benefits through EarnBenefits
CHART 5.9 Early evidence from benefits access and integrated services programs shows improvements in both short term results and long term outcomes of the families as well as overall system and local/state economies
Improved benefits process and system
efficiency
Increased benefits par;cipa;on
Posi;ve outcome on families and children
beyond benefits support
Families advancing toward self-‐sufficiency
and well-‐being
Posi;ve outcome on local / state economy
• Families transiFoning from TANF Cash Assistance who receive child care subsidies or publicly-‐sponsored health insurance are less likely to return to the welfare system than those who do not receive those addi;onal assistance. (15% of families receiving child care subsidies returned to the welfare system vs. 25% of families who did not. 19% of families receiving public-‐sponsored health insurance returned to the welfare system vs. 27% of families who did not.)
• Studies show lives of low-‐income children are more stable (e.g., improved schooling and behavioral outcomes) when families receive benefits combined with employment services.
March 2011 CPP-‐NMAG Joint Project / Advancing Vulnerable Children and Families in New Mexico 56
TABLE OF CONTENTS
Introduction and Executive Summary
SECTION 1. New Mexico’s Vulnerable Children and Families • Summary of current state by key areas and indicators: Supported, Healthy, Safe, Educated • Highlight on low-income working families
SECTION 2. Priority Counties for Pilot Initiatives and the Need for a Community-based Strategy • Priority counties for community-based strategy pilot • Summary of county-level analysis by key areas and indicators
SECTION 3. Public Benefit Programs and Systematic Challenges to Improving Access • Government benefit programs available to vulnerable children and families in New Mexico • Trends in enrollment, recent improvements and gap in benefits access
SECTION 4. Statewide Non-Profit Initiatives: Best Practices and Missed Opportunities • Examples of key statewide non-profit initiatives • Best practice highlights • Gaps and missed opportunities for improvements
SECTION 5. Improving Benefits Access and Integrated Services: National Best Practice Trends and Early Evidence of Impact
• Barriers to benefits access • Framework for integrated strategy and best practice examples in outreach, service delivery, and system • Early evidence of positive impact on families, system, and economy
SECTION 6. Proposal for a Collaborative Strategy and System Building Process • Six strategies and example initiatives across outreach, service delivery, and system building • Short term potential priority initiatives and next steps
Appendix
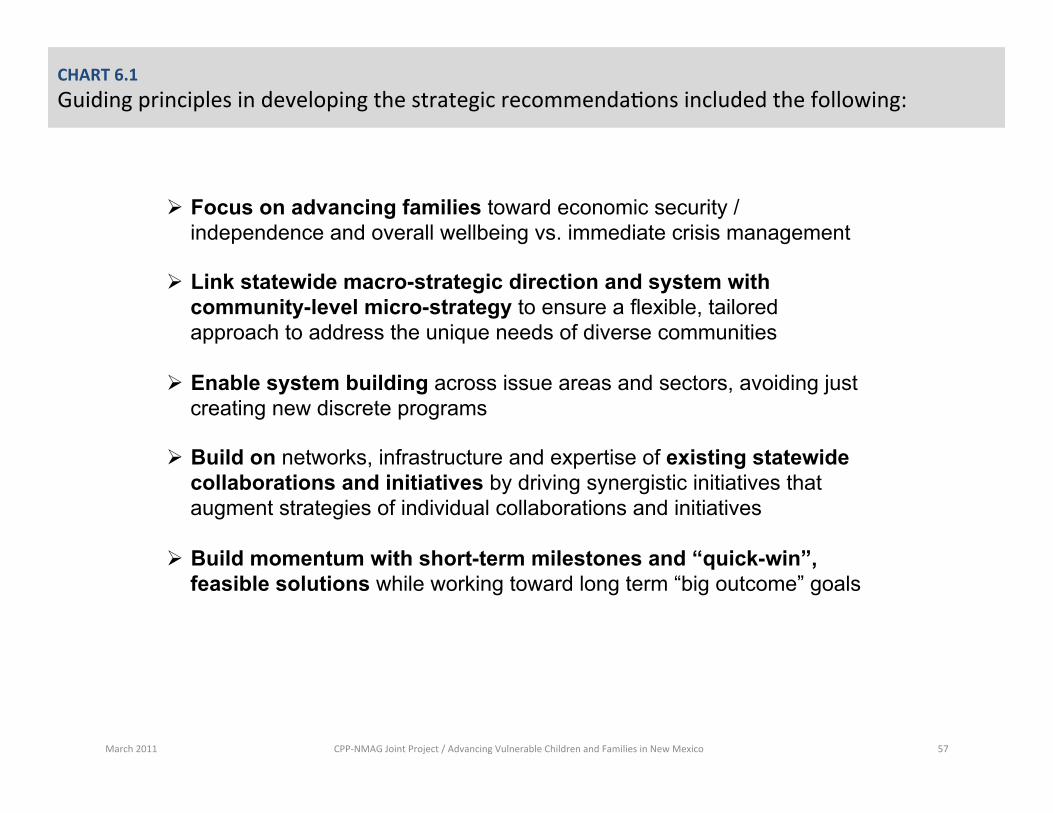
March 2011 CPP-‐NMAG Joint Project / Advancing Vulnerable Children and Families in New Mexico 57
CHART 6.1 Guiding principles in developing the strategic recommenda;ons included the following:
Ø Focus on advancing families toward economic security / independence and overall wellbeing vs. immediate crisis management
Ø Link statewide macro-strategic direction and system with community-level micro-strategy to ensure a flexible, tailored approach to address the unique needs of diverse communities
Ø Enable system building across issue areas and sectors, avoiding just creating new discrete programs
Ø Build on networks, infrastructure and expertise of existing statewide collaborations and initiatives by driving synergistic initiatives that augment strategies of individual collaborations and initiatives
Ø Build momentum with short-term milestones and “quick-win”, feasible solutions while working toward long term “big outcome” goals
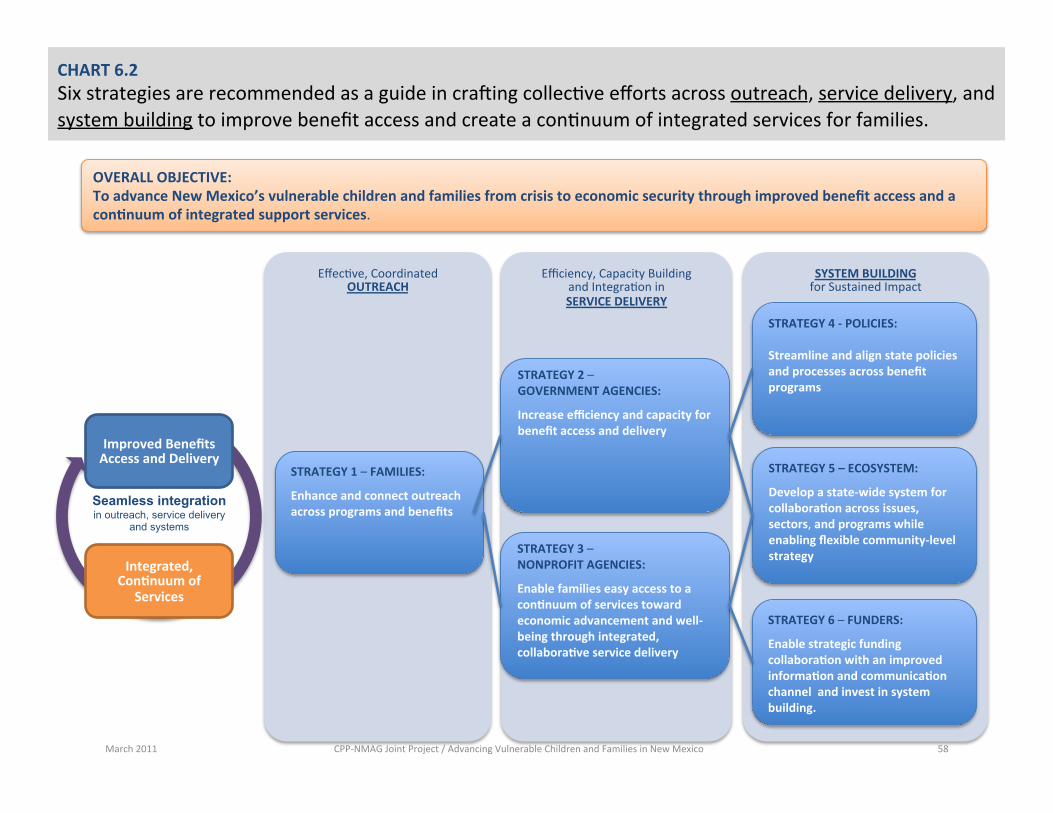
CHART 6.2 Six strategies are recommended as a guide in craying collec;ve efforts across outreach, service delivery, and system building to improve benefit access and create a con;nuum of integrated services for families.
Efficiency, Capacity Building and Integra;on in SERVICE DELIVERY
Effec;ve, Coordinated OUTREACH
SYSTEM BUILDING for Sustained Impact
STRATEGY 1 – FAMILIES:
Enhance and connect outreach across programs and benefits
STRATEGY 6 – FUNDERS:
Enable strategic funding collaboraFon with an improved informaFon and communicaFon channel and invest in system building.
STRATEGY 2 – GOVERNMENT AGENCIES:
Increase efficiency and capacity for benefit access and delivery
STRATEGY 3 – NONPROFIT AGENCIES:
Enable families easy access to a conFnuum of services toward economic advancement and well-‐being through integrated, collaboraFve service delivery
STRATEGY 5 – ECOSYSTEM:
Develop a state-‐wide system for collaboraFon across issues, sectors, and programs while enabling flexible community-‐level strategy
STRATEGY 4 -‐ POLICIES:
Streamline and align state policies and processes across benefit programs
Improved Benefits Access and Delivery
Integrated, ConFnuum of
Services
Seamless integration in outreach, service delivery
and systems
OVERALL OBJECTIVE: To advance New Mexico’s vulnerable children and families from crisis to economic security through improved benefit access and a conFnuum of integrated support services.
March 2011 CPP-‐NMAG Joint Project / Advancing Vulnerable Children and Families in New Mexico 58
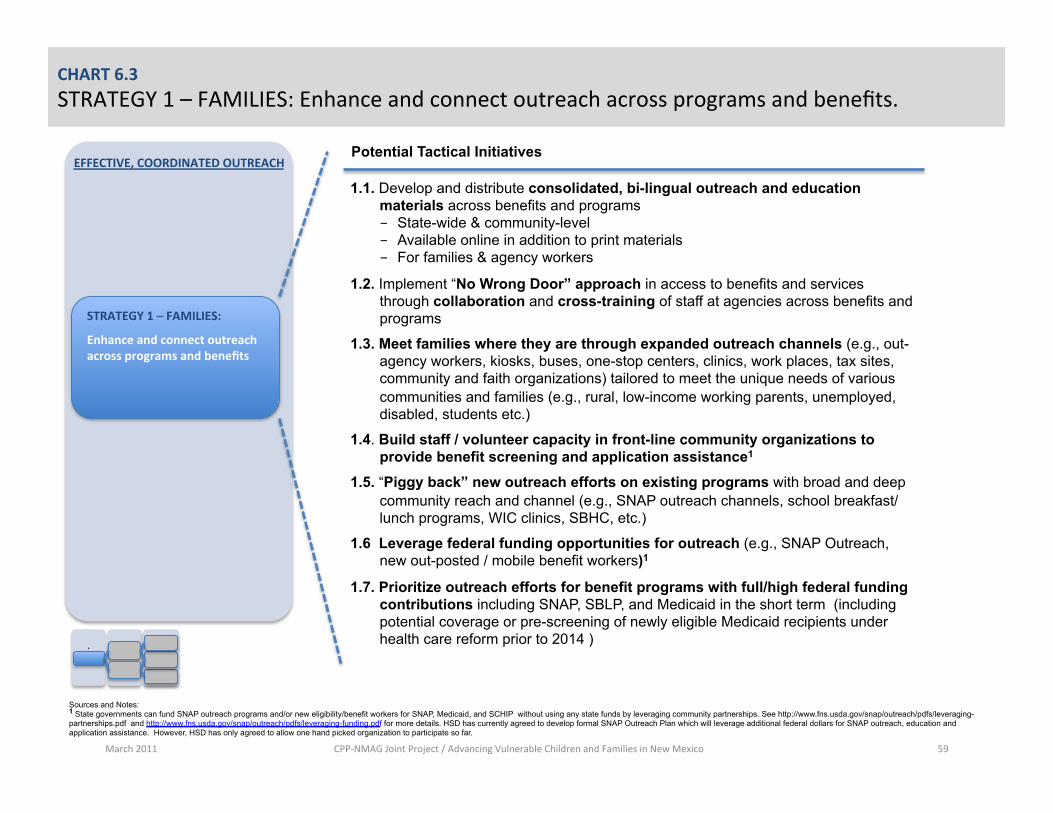
CHART 6.3 STRATEGY 1 – FAMILIES: Enhance and connect outreach across programs and benefits.
EFFECTIVE, COORDINATED OUTREACH
STRATEGY 1 – FAMILIES:
Enhance and connect outreach across programs and benefits
Potential Tactical Initiatives
1.1. Develop and distribute consolidated, bi-lingual outreach and education materials across benefits and programs - State-wide & community-level - Available online in addition to print materials - For families & agency workers
1.2. Implement “No Wrong Door” approach in access to benefits and services through collaboration and cross-training of staff at agencies across benefits and programs
1.3. Meet families where they are through expanded outreach channels (e.g., out-agency workers, kiosks, buses, one-stop centers, clinics, work places, tax sites, community and faith organizations) tailored to meet the unique needs of various communities and families (e.g., rural, low-income working parents, unemployed, disabled, students etc.)
1.4. Build staff / volunteer capacity in front-line community organizations to provide benefit screening and application assistance1
1.5. “Piggy back” new outreach efforts on existing programs with broad and deep community reach and channel (e.g., SNAP outreach channels, school breakfast/lunch programs, WIC clinics, SBHC, etc.)
1.6 Leverage federal funding opportunities for outreach (e.g., SNAP Outreach, new out-posted / mobile benefit workers)1
1.7. Prioritize outreach efforts for benefit programs with full/high federal funding contributions including SNAP, SBLP, and Medicaid in the short term (including potential coverage or pre-screening of newly eligible Medicaid recipients under health care reform prior to 2014 )
Sources and Notes: 1 State governments can fund SNAP outreach programs and/or new eligibility/benefit workers for SNAP, Medicaid, and SCHIP without using any state funds by leveraging community partnerships. See http://www.fns.usda.gov/snap/outreach/pdfs/leveraging-partnerships.pdf and http://www.fns.usda.gov/snap/outreach/pdfs/leveraging-funding.pdf for more details. HSD has currently agreed to develop formal SNAP Outreach Plan which will leverage additional federal dollars for SNAP outreach, education and application assistance. However, HSD has only agreed to allow one hand picked organization to participate so far.
March 2011 CPP-‐NMAG Joint Project / Advancing Vulnerable Children and Families in New Mexico 59
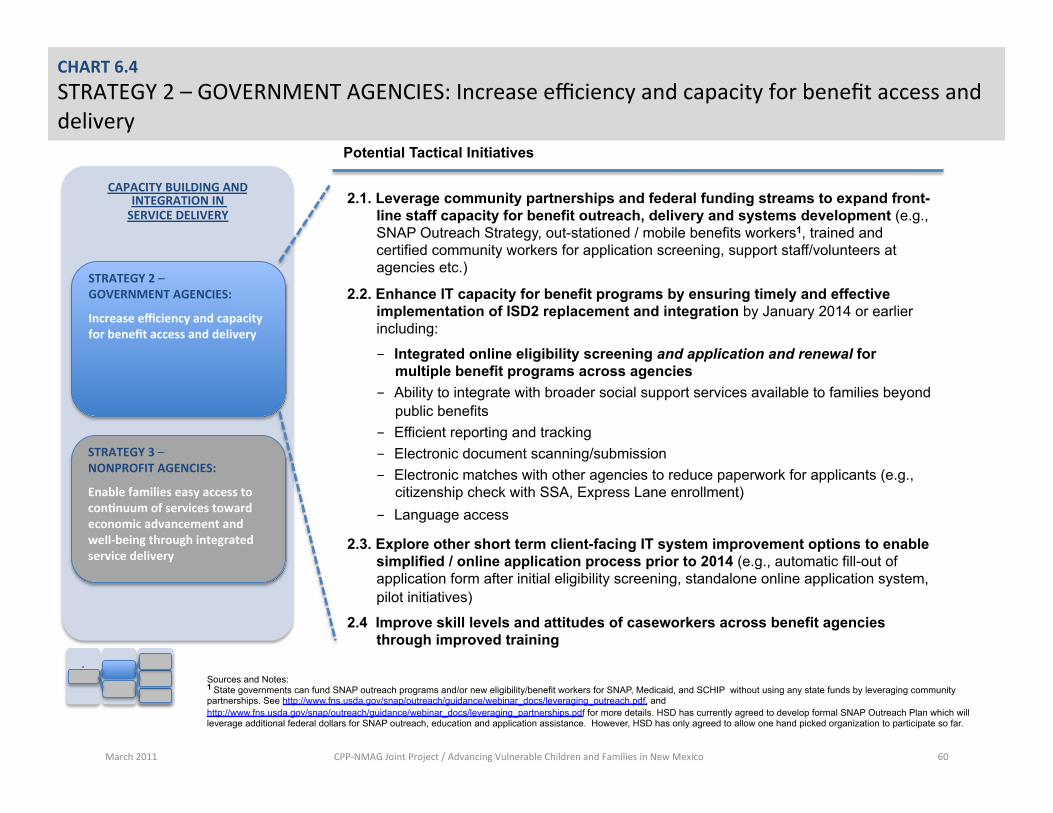
CHART 6.4 STRATEGY 2 – GOVERNMENT AGENCIES: Increase efficiency and capacity for benefit access and delivery
Potential Tactical Initiatives
2.1. Leverage community partnerships and federal funding streams to expand front-line staff capacity for benefit outreach, delivery and systems development (e.g., SNAP Outreach Strategy, out-stationed / mobile benefits workers1, trained and certified community workers for application screening, support staff/volunteers at agencies etc.)
2.2. Enhance IT capacity for benefit programs by ensuring timely and effective implementation of ISD2 replacement and integration by January 2014 or earlier including:
- Integrated online eligibility screening and application and renewal for multiple benefit programs across agencies
- Ability to integrate with broader social support services available to families beyond public benefits
- Efficient reporting and tracking - Electronic document scanning/submission - Electronic matches with other agencies to reduce paperwork for applicants (e.g.,
citizenship check with SSA, Express Lane enrollment) - Language access
2.3. Explore other short term client-facing IT system improvement options to enable simplified / online application process prior to 2014 (e.g., automatic fill-out of application form after initial eligibility screening, standalone online application system, pilot initiatives)
2.4 Improve skill levels and attitudes of caseworkers across benefit agencies through improved training
CAPACITY BUILDING AND INTEGRATION IN SERVICE DELIVERY
STRATEGY 2 – GOVERNMENT AGENCIES:
Increase efficiency and capacity for benefit access and delivery
STRATEGY 3 – NONPROFIT AGENCIES:
Enable families easy access to conFnuum of services toward economic advancement and well-‐being through integrated service delivery
March 2011 CPP-‐NMAG Joint Project / Advancing Vulnerable Children and Families in New Mexico 60
Sources and Notes: 1 State governments can fund SNAP outreach programs and/or new eligibility/benefit workers for SNAP, Medicaid, and SCHIP without using any state funds by leveraging community partnerships. See http://www.fns.usda.gov/snap/outreach/guidance/webinar_docs/leveraging_outreach.pdf. and http://www.fns.usda.gov/snap/outreach/guidance/webinar_docs/leveraging_partnerships.pdf for more details. HSD has currently agreed to develop formal SNAP Outreach Plan which will leverage additional federal dollars for SNAP outreach, education and application assistance. However, HSD has only agreed to allow one hand picked organization to participate so far.
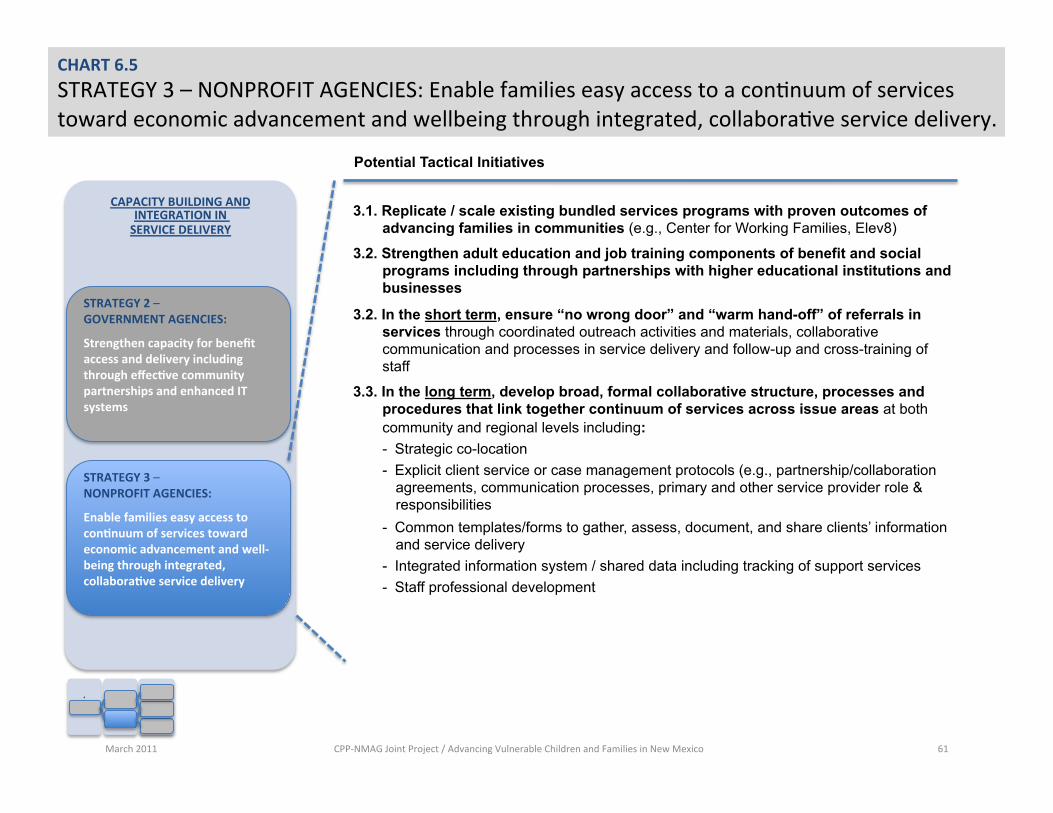
CHART 6.5 STRATEGY 3 – NONPROFIT AGENCIES: Enable families easy access to a con;nuum of services toward economic advancement and wellbeing through integrated, collabora;ve service delivery.
Potential Tactical Initiatives
CAPACITY BUILDING AND INTEGRATION IN SERVICE DELIVERY
STRATEGY 2 – GOVERNMENT AGENCIES:
Strengthen capacity for benefit access and delivery including through effecFve community partnerships and enhanced IT systems
STRATEGY 3 – NONPROFIT AGENCIES:
Enable families easy access to conFnuum of services toward economic advancement and well-‐being through integrated, collaboraFve service delivery
3.1. Replicate / scale existing bundled services programs with proven outcomes of advancing families in communities (e.g., Center for Working Families, Elev8)
3.2. Strengthen adult education and job training components of benefit and social programs including through partnerships with higher educational institutions and businesses
3.2. In the short term, ensure “no wrong door” and “warm hand-off” of referrals in services through coordinated outreach activities and materials, collaborative communication and processes in service delivery and follow-up and cross-training of staff
3.3. In the long term, develop broad, formal collaborative structure, processes and procedures that link together continuum of services across issue areas at both community and regional levels including: - Strategic co-location - Explicit client service or case management protocols (e.g., partnership/collaboration
agreements, communication processes, primary and other service provider role & responsibilities
- Common templates/forms to gather, assess, document, and share clients’ information and service delivery
- Integrated information system / shared data including tracking of support services - Staff professional development
March 2011 CPP-‐NMAG Joint Project / Advancing Vulnerable Children and Families in New Mexico 61
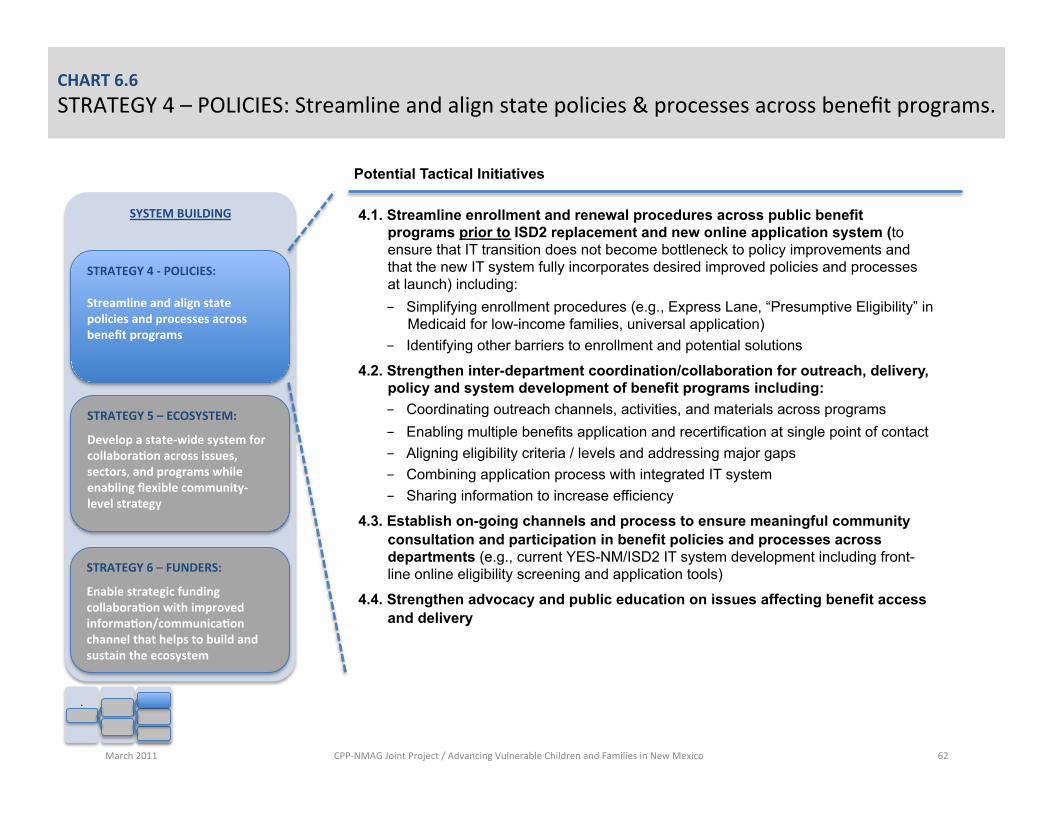
CHART 6.6 STRATEGY 4 – POLICIES: Streamline and align state policies & processes across benefit programs.
Potential Tactical Initiatives
SYSTEM BUILDING
STRATEGY 6 – FUNDERS:
Enable strategic funding collaboraFon with improved informaFon/communicaFon channel that helps to build and sustain the ecosystem
STRATEGY 5 – ECOSYSTEM:
Develop a state-‐wide system for collaboraFon across issues, sectors, and programs while enabling flexible community-‐level strategy
STRATEGY 4 -‐ POLICIES:
Streamline and align state policies and processes across benefit programs
4.1. Streamline enrollment and renewal procedures across public benefit programs prior to ISD2 replacement and new online application system (to ensure that IT transition does not become bottleneck to policy improvements and that the new IT system fully incorporates desired improved policies and processes at launch) including: - Simplifying enrollment procedures (e.g., Express Lane, “Presumptive Eligibility” in
Medicaid for low-income families, universal application) - Identifying other barriers to enrollment and potential solutions
4.2. Strengthen inter-department coordination/collaboration for outreach, delivery, policy and system development of benefit programs including: - Coordinating outreach channels, activities, and materials across programs - Enabling multiple benefits application and recertification at single point of contact - Aligning eligibility criteria / levels and addressing major gaps - Combining application process with integrated IT system - Sharing information to increase efficiency
4.3. Establish on-going channels and process to ensure meaningful community consultation and participation in benefit policies and processes across departments (e.g., current YES-NM/ISD2 IT system development including front-line online eligibility screening and application tools)
4.4. Strengthen advocacy and public education on issues affecting benefit access and delivery
March 2011 CPP-‐NMAG Joint Project / Advancing Vulnerable Children and Families in New Mexico 62
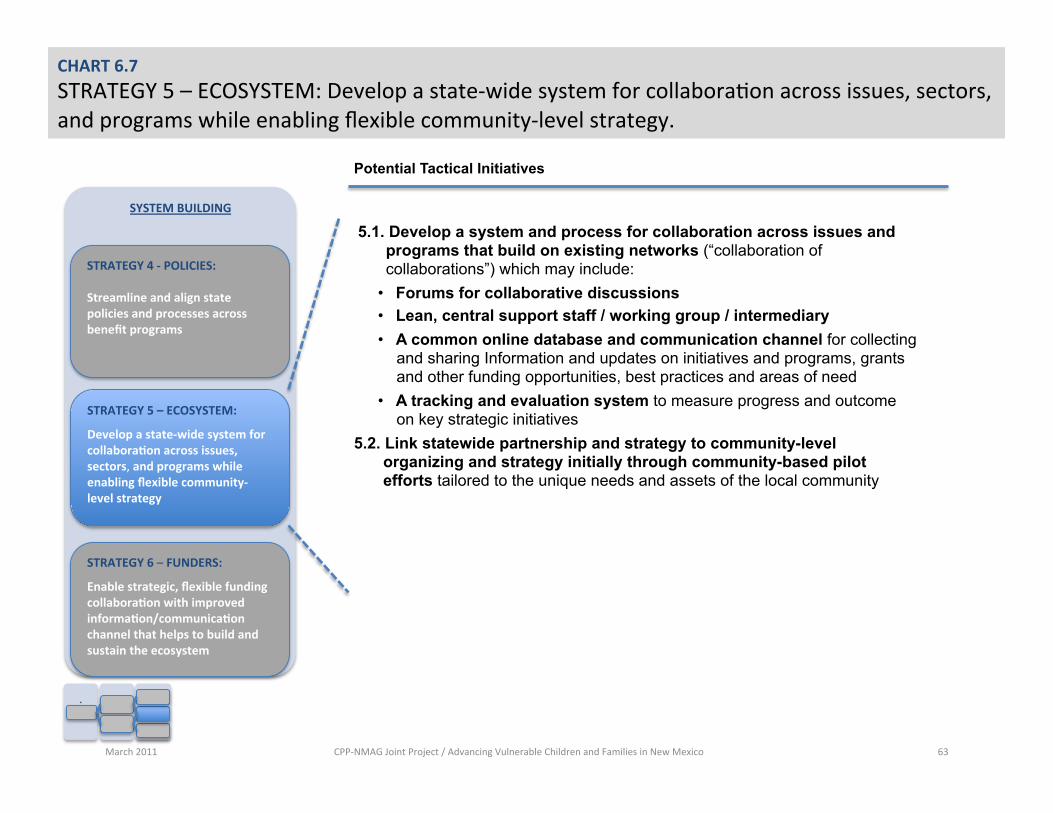
CHART 6.7 STRATEGY 5 – ECOSYSTEM: Develop a state-‐wide system for collabora;on across issues, sectors, and programs while enabling flexible community-‐level strategy.
Potential Tactical Initiatives
SYSTEM BUILDING
STRATEGY 6 – FUNDERS:
Enable strategic, flexible funding collaboraFon with improved informaFon/communicaFon channel that helps to build and sustain the ecosystem
STRATEGY 5 – ECOSYSTEM:
Develop a state-‐wide system for collaboraFon across issues, sectors, and programs while enabling flexible community-‐level strategy
STRATEGY 4 -‐ POLICIES:
Streamline and align state policies and processes across benefit programs
5.1. Develop a system and process for collaboration across issues and programs that build on existing networks (“collaboration of collaborations”) which may include:
• Forums for collaborative discussions • Lean, central support staff / working group / intermediary • A common online database and communication channel for collecting
and sharing Information and updates on initiatives and programs, grants and other funding opportunities, best practices and areas of need
• A tracking and evaluation system to measure progress and outcome on key strategic initiatives
5.2. Link statewide partnership and strategy to community-level organizing and strategy initially through community-based pilot efforts tailored to the unique needs and assets of the local community
March 2011 CPP-‐NMAG Joint Project / Advancing Vulnerable Children and Families in New Mexico 63
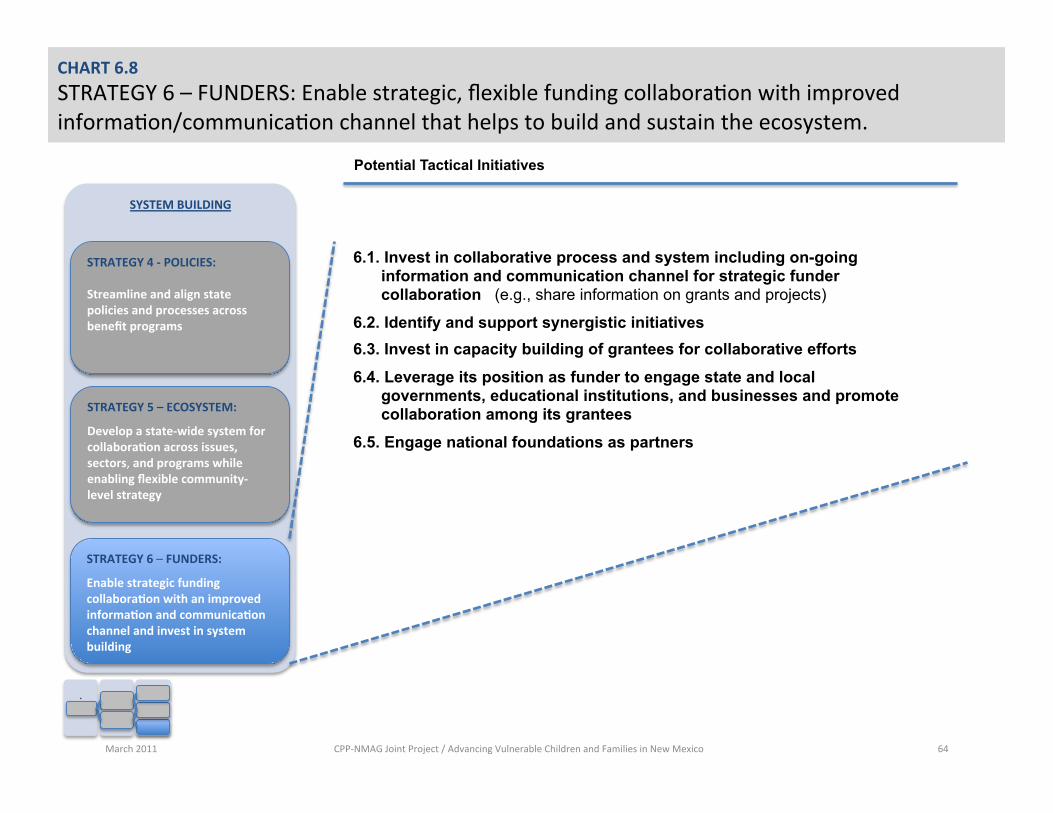
CHART 6.8 STRATEGY 6 – FUNDERS: Enable strategic, flexible funding collabora;on with improved informa;on/communica;on channel that helps to build and sustain the ecosystem.
Potential Tactical Initiatives
SYSTEM BUILDING
STRATEGY 6 – FUNDERS:
Enable strategic funding collaboraFon with an improved informaFon and communicaFon channel and invest in system building
STRATEGY 5 – ECOSYSTEM:
Develop a state-‐wide system for collaboraFon across issues, sectors, and programs while enabling flexible community-‐level strategy
STRATEGY 4 -‐ POLICIES:
Streamline and align state policies and processes across benefit programs
March 2011 CPP-‐NMAG Joint Project / Advancing Vulnerable Children and Families in New Mexico 64
6.1. Invest in collaborative process and system including on-going information and communication channel for strategic funder collaboration (e.g., share information on grants and projects)
6.2. Identify and support synergistic initiatives 6.3. Invest in capacity building of grantees for collaborative efforts
6.4. Leverage its position as funder to engage state and local governments, educational institutions, and businesses and promote collaboration among its grantees
6.5. Engage national foundations as partners
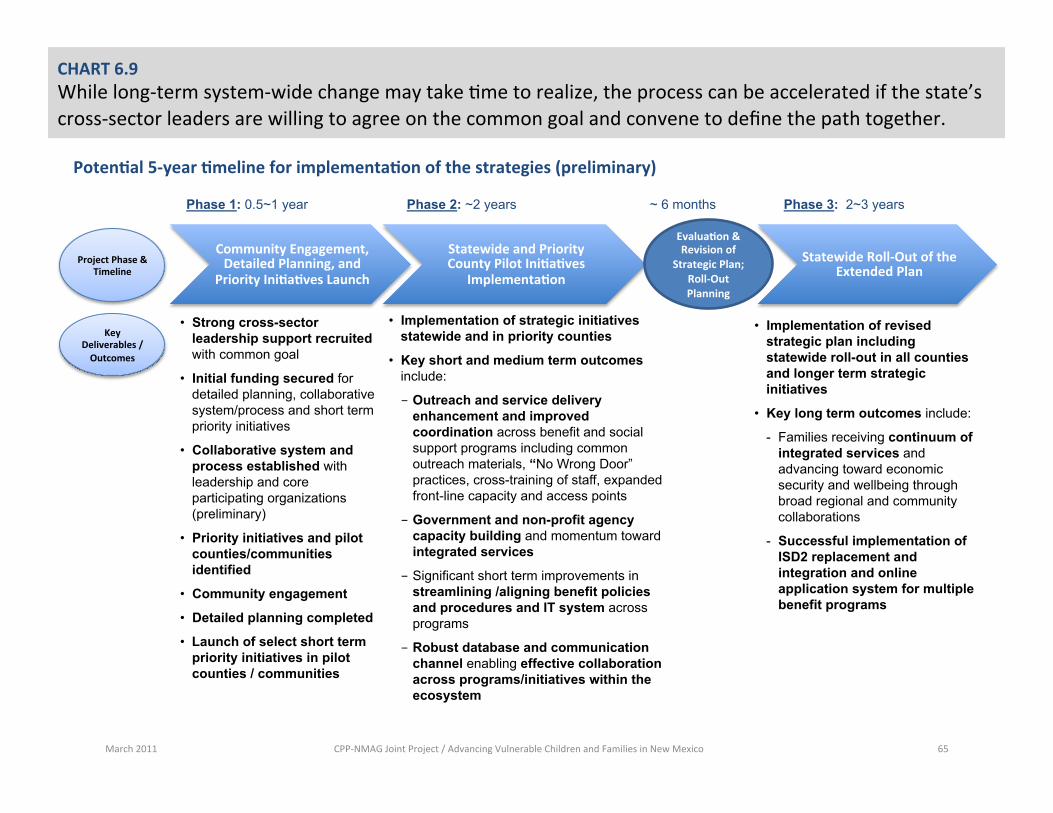
CHART 6.9 While long-‐term system-‐wide change may take ;me to realize, the process can be accelerated if the state’s cross-‐sector leaders are willing to agree on the common goal and convene to define the path together.
March 2011 CPP-‐NMAG Joint Project / Advancing Vulnerable Children and Families in New Mexico 65
Community Engagement, Detailed Planning, and
Priority IniFaFves Launch
Statewide and Priority County Pilot IniFaFves
ImplementaFon Statewide Roll-‐Out of the
Extended Plan
EvaluaFon & Revision of
Strategic Plan; Roll-‐Out Planning
Phase 1: 0.5~1 year Phase 2: ~2 years Phase 3: 2~3 years ~ 6 months
• Strong cross-sector leadership support recruited with common goal
• Initial funding secured for detailed planning, collaborative system/process and short term priority initiatives
• Collaborative system and process established with leadership and core participating organizations (preliminary)
• Priority initiatives and pilot counties/communities identified
• Community engagement
• Detailed planning completed
• Launch of select short term priority initiatives in pilot counties / communities
• Implementation of strategic initiatives statewide and in priority counties
• Key short and medium term outcomes include:
- Outreach and service delivery enhancement and improved coordination across benefit and social support programs including common outreach materials, “No Wrong Door” practices, cross-training of staff, expanded front-line capacity and access points
- Government and non-profit agency capacity building and momentum toward integrated services
- Significant short term improvements in streamlining /aligning benefit policies and procedures and IT system across programs
- Robust database and communication channel enabling effective collaboration across programs/initiatives within the ecosystem
Project Phase & Timeline
Key Deliverables / Outcomes
• Implementation of revised strategic plan including statewide roll-out in all counties and longer term strategic initiatives
• Key long term outcomes include:
- Families receiving continuum of integrated services and advancing toward economic security and wellbeing through broad regional and community collaborations
- Successful implementation of ISD2 replacement and integration and online application system for multiple benefit programs
PotenFal 5-‐year Fmeline for implementaFon of the strategies (preliminary)
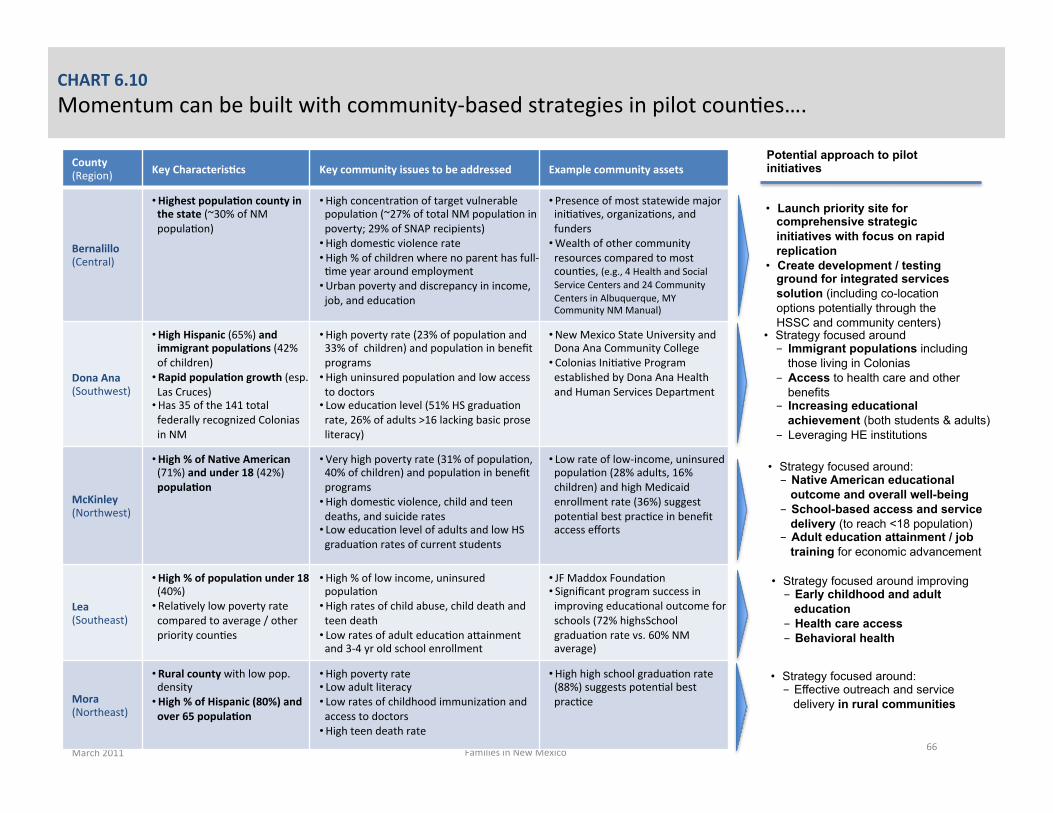
CHART 6.10 Momentum can be built with community-‐based strategies in pilot coun;es….
March 2011 CPP-‐NMAG Joint Project / Advancing Vulnerable Children and
Families in New Mexico 66
County (Region) Key CharacterisFcs Key community issues to be addressed Example community assets
Bernalillo (Central)
• Highest populaFon county in the state (~30% of NM popula;on)
• High concentra;on of target vulnerable popula;on (~27% of total NM popula;on in poverty; 29% of SNAP recipients)
• High domes;c violence rate • High % of children where no parent has full-‐;me year around employment
• Urban poverty and discrepancy in income, job, and educa;on
• Presence of most statewide major ini;a;ves, organiza;ons, and funders
• Wealth of other community resources compared to most coun;es, (e.g., 4 Health and Social Service Centers and 24 Community Centers in Albuquerque, MY Community NM Manual)
Dona Ana (Southwest)
• High Hispanic (65%) and immigrant populaFons (42% of children)
• Rapid populaFon growth (esp. Las Cruces)
• Has 35 of the 141 total federally recognized Colonias in NM
• High poverty rate (23% of popula;on and 33% of children) and popula;on in benefit programs
• High uninsured popula;on and low access to doctors
• Low educa;on level (51% HS gradua;on rate, 26% of adults >16 lacking basic prose literacy)
• New Mexico State University and Dona Ana Community College
• Colonias Ini;a;ve Program established by Dona Ana Health and Human Services Department
McKinley (Northwest)
• High % of NaFve American (71%) and under 18 (42%) populaFon
• Very high poverty rate (31% of popula;on, 40% of children) and popula;on in benefit programs
• High domes;c violence, child and teen deaths, and suicide rates
• Low educa;on level of adults and low HS gradua;on rates of current students
• Low rate of low-‐income, uninsured popula;on (28% adults, 16% children) and high Medicaid enrollment rate (36%) suggest poten;al best prac;ce in benefit access efforts
Lea (Southeast)
• High % of populaFon under 18 (40%)
• Rela;vely low poverty rate compared to average / other priority coun;es
• High % of low income, uninsured popula;on
• High rates of child abuse, child death and teen death
• Low rates of adult educa;on acainment and 3-‐4 yr old school enrollment
• JF Maddox Founda;on • Significant program success in improving educa;onal outcome for schools (72% highsSchool gradua;on rate vs. 60% NM average)
Mora (Northeast)
• Rural county with low pop. density
• High % of Hispanic (80%) and over 65 populaFon
• High poverty rate • Low adult literacy • Low rates of childhood immuniza;on and access to doctors
• High teen death rate
• High high school gradua;on rate (88%) suggests poten;al best prac;ce
Potential approach to pilot initiatives
• Launch priority site for comprehensive strategic initiatives with focus on rapid replication
• Create development / testing ground for integrated services solution (including co-location options potentially through the HSSC and community centers)
• Strategy focused around - Immigrant populations including
those living in Colonias - Access to health care and other
benefits - Increasing educational
achievement (both students & adults) - Leveraging HE institutions
• Strategy focused around: - Native American educational
outcome and overall well-being - School-based access and service
delivery (to reach <18 population) - Adult education attainment / job
training for economic advancement
• Strategy focused around improving - Early childhood and adult
education - Health care access - Behavioral health
• Strategy focused around: - Effective outreach and service
delivery in rural communities
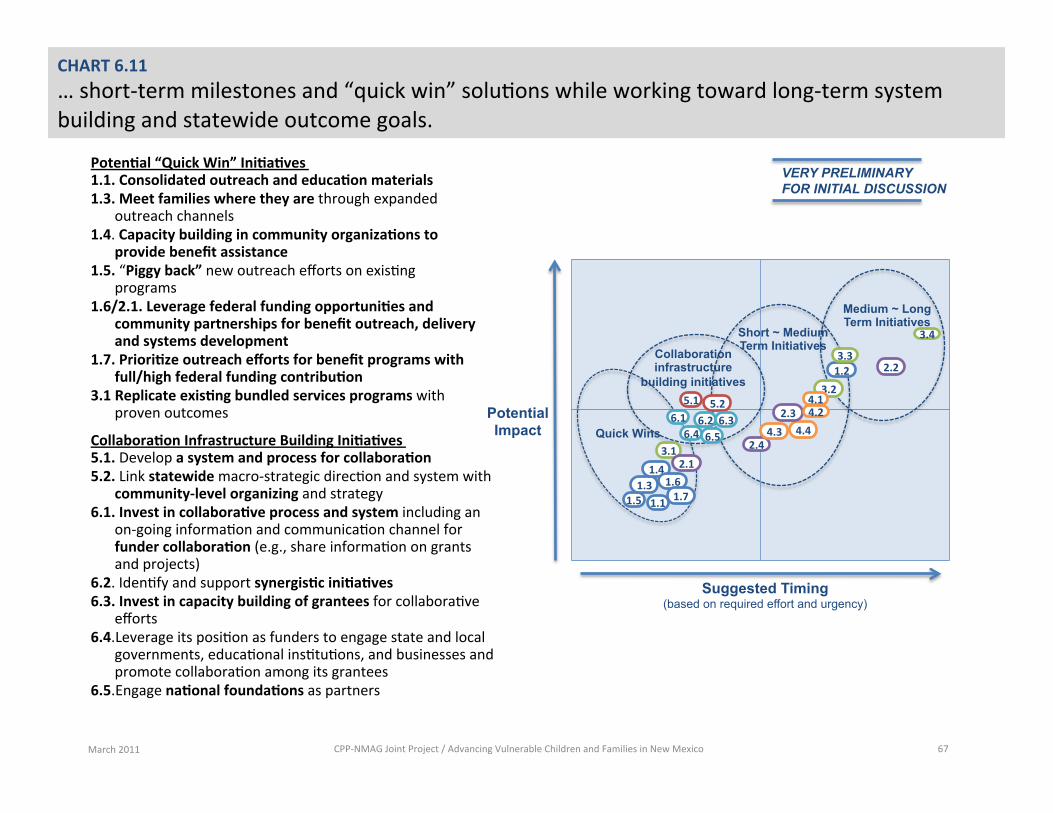
CHART 6.11 … short-‐term milestones and “quick win” solu;ons while working toward long-‐term system building and statewide outcome goals.
March 2011 CPP-‐NMAG Joint Project / Advancing Vulnerable Children and Families in New Mexico 67
Potential Impact
Suggested Timing (based on required effort and urgency)
Quick Wins
Collaboration infrastructure
building initiatives
Short ~ Medium Term Initiatives
Medium ~ Long Term Initiatives
PotenFal “Quick Win” IniFaFves 1.1. Consolidated outreach and educaFon materials 1.3. Meet families where they are through expanded
outreach channels 1.4. Capacity building in community organizaFons to
provide benefit assistance 1.5. “Piggy back” new outreach efforts on exis;ng
programs 1.6/2.1. Leverage federal funding opportuniFes and
community partnerships for benefit outreach, delivery and systems development
1.7. PrioriFze outreach efforts for benefit programs with full/high federal funding contribuFon
3.1 Replicate exisFng bundled services programs with proven outcomes
CollaboraFon Infrastructure Building IniFaFves 5.1. Develop a system and process for collaboraFon 5.2. Link statewide macro-‐strategic direc;on and system with
community-‐level organizing and strategy 6.1. Invest in collaboraFve process and system including an
on-‐going informa;on and communica;on channel for funder collaboraFon (e.g., share informa;on on grants and projects)
6.2. Iden;fy and support synergisFc iniFaFves 6.3. Invest in capacity building of grantees for collabora;ve
efforts 6.4.Leverage its posi;on as funders to engage state and local
governments, educa;onal ins;tu;ons, and businesses and promote collabora;on among its grantees
6.5.Engage naFonal foundaFons as partners
1.1 1.5
3.1
5.1 6.1 6.2
1.3 1.4
1.6 2.1
2.2
2.4
3.2
4.3 4.4
5.2
1.2
2.3
3.3
3.4
4.1 4.2
6.3 6.4 6.5
VERY PRELIMINARY FOR INITIAL DISCUSSION
1.7
March 2011 CPP-‐NMAG Joint Project / Advancing Vulnerable Children and Families in New Mexico 68
TABLE OF CONTENTS
Introduction and Executive Summary
SECTION 1. New Mexico’s Vulnerable Children and Families • Summary of current state by key areas and indicators: Supported, Healthy, Safe, Educated • Highlight on low-income working families
SECTION 2. Priority Counties for Pilot Initiatives and the Need for a Community-based Strategy • Priority counties for community-based strategy pilot • Summary of county-level analysis by key areas and indicators
SECTION 3. Public Benefit Programs and Systematic Challenges to Improving Access • Government benefit programs available to vulnerable children and families in New Mexico • Trends in enrollment, recent improvements and gap in benefits access
SECTION 4. Statewide Non-Profit Initiatives: Best Practices and Missed Opportunities • Examples of key statewide non-profit initiatives • Best practice highlights • Gaps and missed opportunities for improvements
SECTION 5. Improving Benefits Access and Integrated Services: National Best Practice Trends and Early Evidence of Impact
• Barriers to benefits access • Framework for integrated strategy and best practice examples in outreach, service delivery, and system • Early evidence of positive impact on families, system, and economy
SECTION 6. Proposal for a Collaborative Strategy and System Building Process • Six strategies and example initiatives across outreach, service delivery, and system building • Short term potential priority initiatives and next steps
Appendix
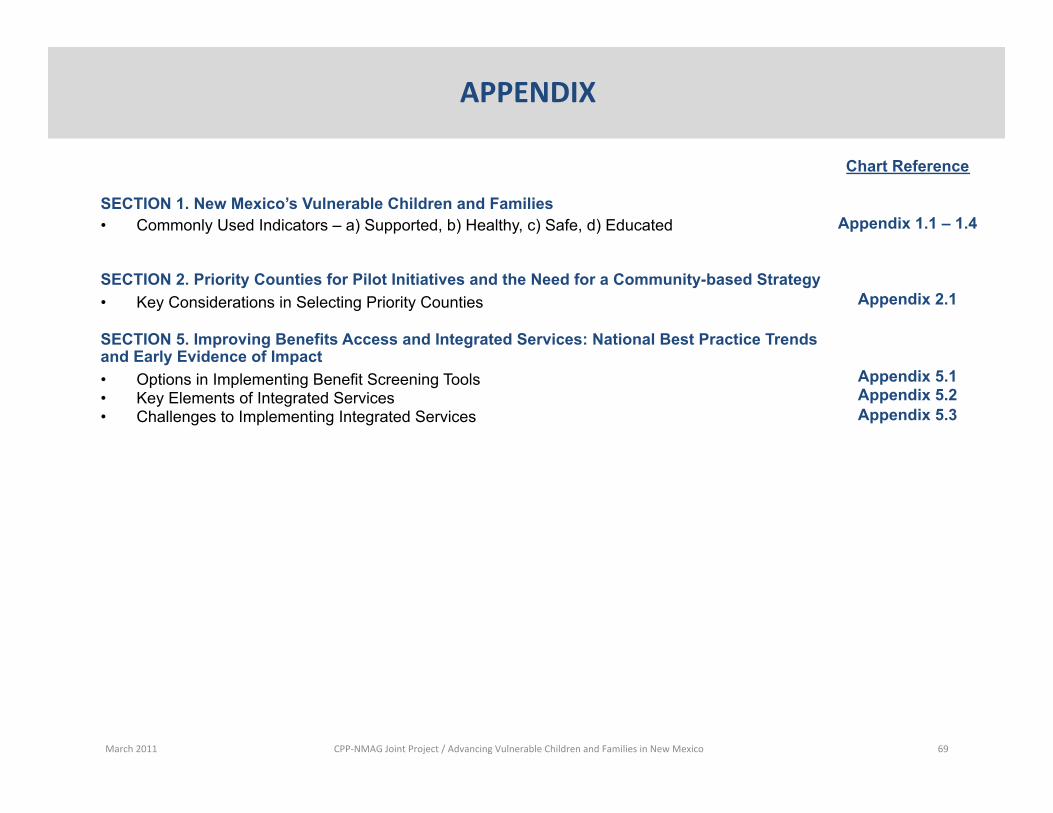
SECTION 1. New Mexico’s Vulnerable Children and Families • Commonly Used Indicators – a) Supported, b) Healthy, c) Safe, d) Educated
SECTION 2. Priority Counties for Pilot Initiatives and the Need for a Community-based Strategy • Key Considerations in Selecting Priority Counties SECTION 5. Improving Benefits Access and Integrated Services: National Best Practice Trends and Early Evidence of Impact • Options in Implementing Benefit Screening Tools • Key Elements of Integrated Services • Challenges to Implementing Integrated Services
APPENDIX
March 2011 CPP-‐NMAG Joint Project / Advancing Vulnerable Children and Families in New Mexico 69
Chart Reference
Appendix 1.1 – 1.4
Appendix 2.1
Appendix 5.1 Appendix 5.2 Appendix 5.3
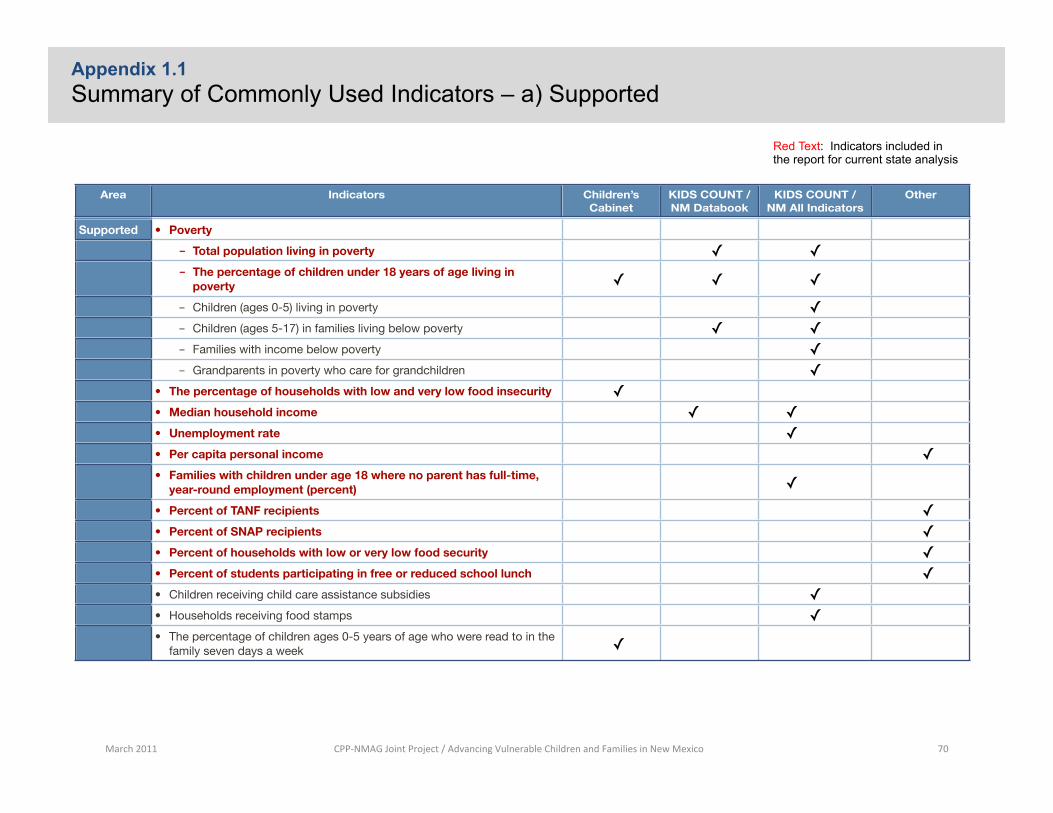
Area Indicators Children’s Cabinet
KIDS COUNT /NM Databook
KIDS COUNT / NM All Indicators
Other
Healthy • Infant Mortality ✓ ✓
• Births & Prenatal Care
- The percentage of new mothers who had all the characteristics of a healthy birth index ✓
- Teen Birth Rate
Ages 10-14 ✓ ✓
Ages 15-17 ✓ ✓ ✓
Ages 15-19 ✓ ✓
- Birth to single mothers ✓ ✓
- Low weight births ✓ ✓
- Prenatal care began (First - third or unknown trimester) ✓ ✓
- No prenatal care ✓ ✓
- Late or no prenatal care (per 100) ✓
• Uninsured
- Low income ✓
- Low income, under 18 years of age ✓
- Low income, under 19 years of age ✓ ✓
- Under 19 years of age ✓ ✓
- Ages 18-64 ✓
• Medicaid Enrollment (under 21 years old) ✓ ✓
• SCHIP Enrollment (under 21 years old) ✓ ✓
• Number of licensed medical doctors per 1000 people ✓
• The percentage of public high school youth who were overweight or obese ✓
• Childhood immunization coverage ✓
• Adults with Diabetes Not Receiving all Recommended Diabetes Preventive Services ✓
• Diabetes Deaths (per 100,000) ✓
• Diabetes Prevalence Among Adults ✓
• Youth (<15 years) Asthma Hospitalization Rates (per 10,000)
March 2011 CPP-‐NMAG Joint Project / Advancing Vulnerable Children and Families in New Mexico 70
Appendix 1.1 Summary of Commonly Used Indicators – a) Supported
Red Text: Indicators included in the report for current state analysis
Supported • Poverty
- Total population living in poverty ✓ ✓
- The percentage of children under 18 years of age living in poverty ✓ ✓ ✓
- Children (ages 0-5) living in poverty ✓
- Children (ages 5-17) in families living below poverty ✓ ✓
- Families with income below poverty ✓
- Grandparents in poverty who care for grandchildren ✓
• The percentage of households with low and very low food insecurity ✓
• Median household income ✓ ✓
• Unemployment rate ✓
• Per capita personal income ✓
• Families with children under age 18 where no parent has full-time, year-round employment (percent) ✓
• Percent of TANF recipients ✓
• Percent of SNAP recipients ✓
• Percent of households with low or very low food security ✓
• Percent of students participating in free or reduced school lunch ✓
• Children receiving child care assistance subsidies ✓
• Households receiving food stamps ✓
• The percentage of children ages 0-5 years of age who were read to in the family seven days a week ✓
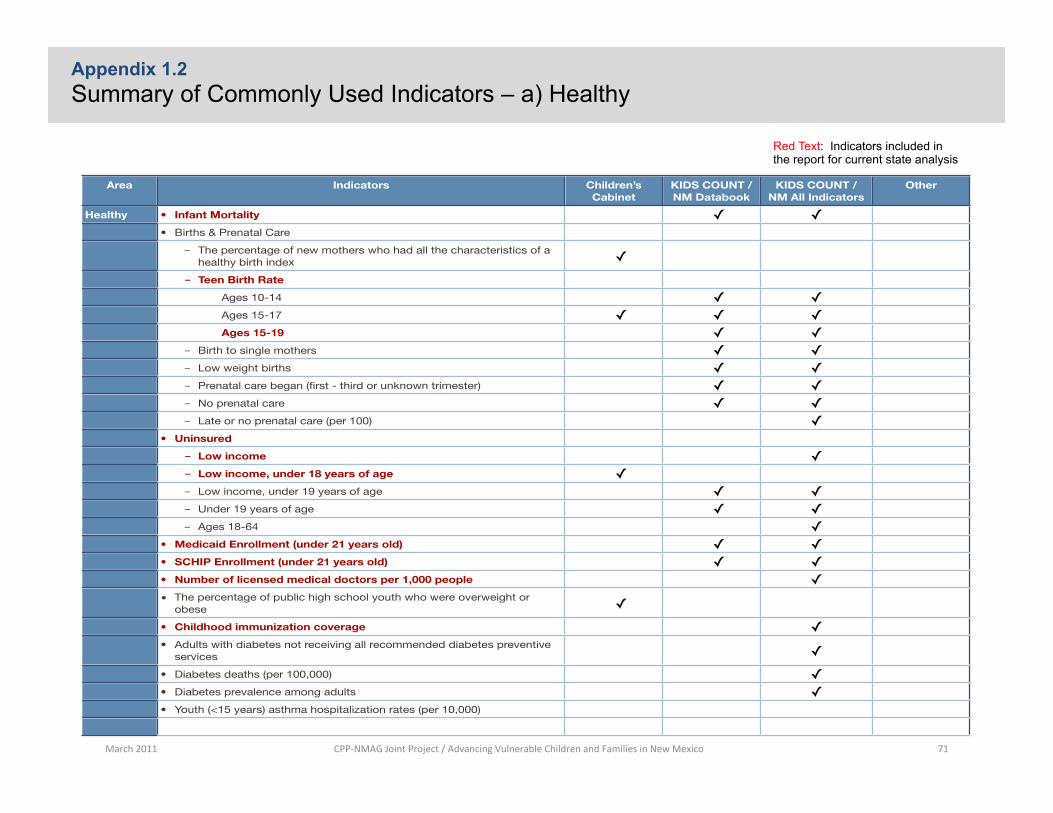
March 2011 CPP-‐NMAG Joint Project / Advancing Vulnerable Children and Families in New Mexico 71
Red Text: Indicators included in the report for current state analysis
Appendix 1.2 Summary of Commonly Used Indicators – a) Healthy
Area Indicators Children’s Cabinet
KIDS COUNT /NM Databook
KIDS COUNT / NM All Indicators
Other
Healthy • Infant Mortality ✓ ✓
• Births & Prenatal Care
- The percentage of new mothers who had all the characteristics of a healthy birth index ✓
- Teen Birth Rate
Ages 10-14 ✓ ✓
Ages 15-17 ✓ ✓ ✓
Ages 15-19 ✓ ✓
- Birth to single mothers ✓ ✓
- Low weight births ✓ ✓
- Prenatal care began (first - third or unknown trimester) ✓ ✓
- No prenatal care ✓ ✓
- Late or no prenatal care (per 100) ✓
• Uninsured
- Low income ✓
- Low income, under 18 years of age ✓
- Low income, under 19 years of age ✓ ✓
- Under 19 years of age ✓ ✓
- Ages 18-64 ✓
• Medicaid Enrollment (under 21 years old) ✓ ✓
• SCHIP Enrollment (under 21 years old) ✓ ✓
• Number of licensed medical doctors per 1,000 people ✓
• The percentage of public high school youth who were overweight or obese ✓
• Childhood immunization coverage ✓
• Adults with diabetes not receiving all recommended diabetes preventive services ✓
• Diabetes deaths (per 100,000) ✓
• Diabetes prevalence among adults ✓
• Youth (<15 years) asthma hospitalization rates (per 10,000)
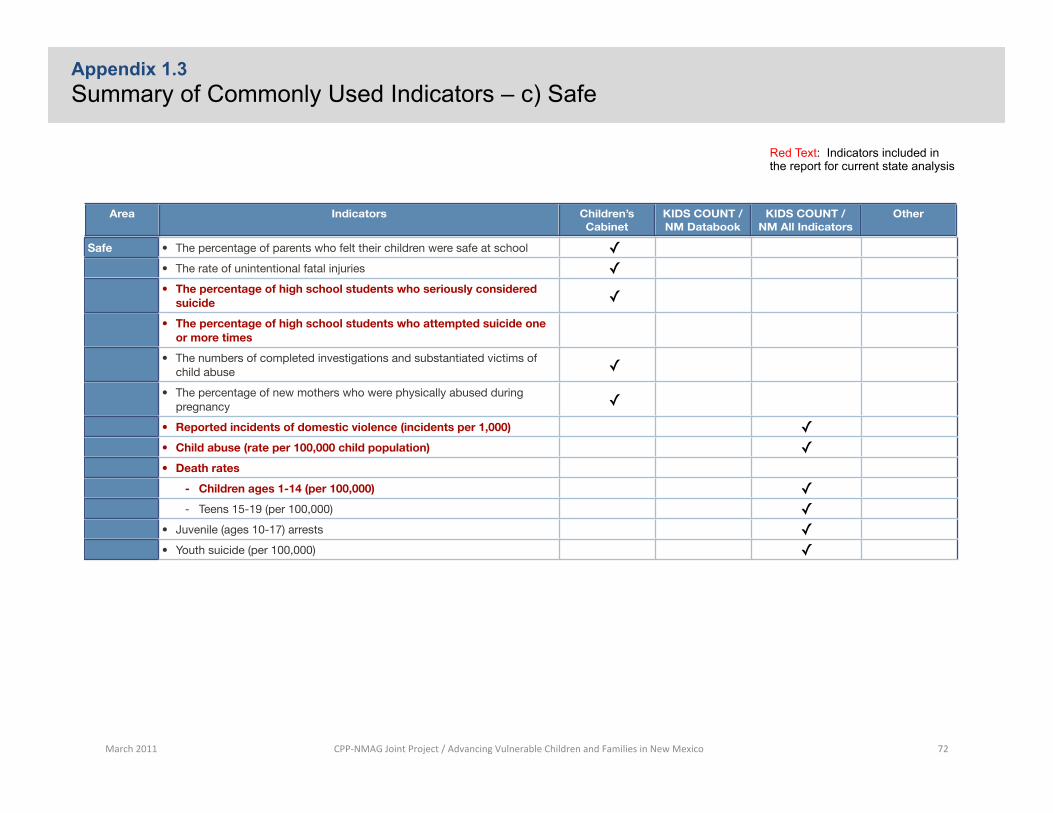
March 2011 CPP-‐NMAG Joint Project / Advancing Vulnerable Children and Families in New Mexico 72
Area Indicators Children’s Cabinet
KIDS COUNT /NM Databook
KIDS COUNT / NM All Indicators
Other
Healthy • Infant Mortality ✓ ✓
• Births & Prenatal Care
- The percentage of new mothers who had all the characteristics of a healthy birth index ✓
- Teen Birth Rate
Ages 10-14 ✓ ✓
Ages 15-17 ✓ ✓ ✓
Ages 15-19 ✓ ✓
- Birth to single mothers ✓ ✓
- Low weight births ✓ ✓
- Prenatal care began (First - third or unknown trimester) ✓ ✓
- No prenatal care ✓ ✓
- Late or no prenatal care (per 100) ✓
• Uninsured
- Low income ✓
- Low income, under 18 years of age ✓
- Low income, under 19 years of age ✓ ✓
- Under 19 years of age ✓ ✓
- Ages 18-64 ✓
• Medicaid Enrollment (under 21 years old) ✓ ✓
• SCHIP Enrollment (under 21 years old) ✓ ✓
• Number of licensed medical doctors per 1000 people ✓
• The percentage of public high school youth who were overweight or obese ✓
• Childhood immunization coverage ✓
• Adults with Diabetes Not Receiving all Recommended Diabetes Preventive Services ✓
• Diabetes Deaths (per 100,000) ✓
• Diabetes Prevalence Among Adults ✓
• Youth (<15 years) Asthma Hospitalization Rates (per 10,000)
Red Text: Indicators included in the report for current state analysis
Appendix 1.3 Summary of Commonly Used Indicators – c) Safe
Safe • The percentage of parents who felt their children were safe at school ✓
• The rate of unintentional fatal injuries ✓
• The percentage of high school students who seriously considered suicide ✓
• The percentage of high school students who attempted suicide one or more times
• The numbers of completed investigations and substantiated victims of child abuse ✓
• The percentage of new mothers who were physically abused during pregnancy ✓
• Reported incidents of domestic violence (incidents per 1,000) ✓
• Child abuse (rate per 100,000 child population) ✓
• Death rates
- Children ages 1-14 (per 100,000) ✓
- Teens 15-19 (per 100,000) ✓
• Juvenile (ages 10-17) arrests ✓
• Youth suicide (per 100,000) ✓
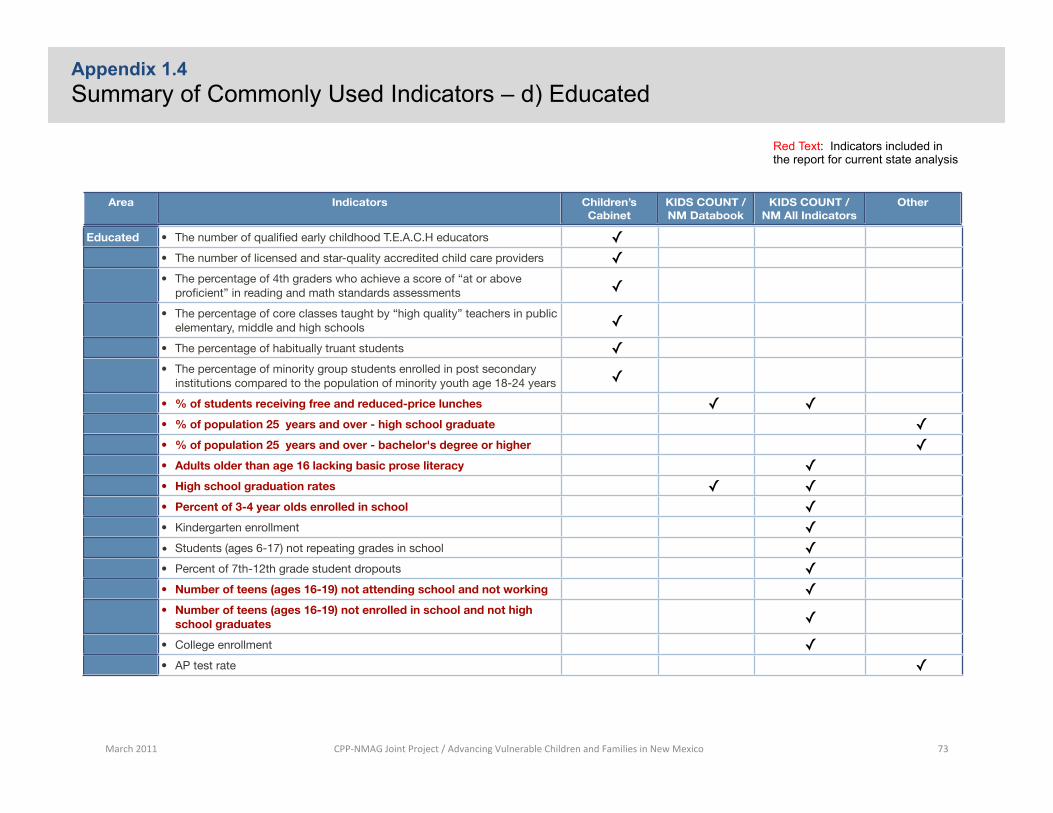
March 2011 CPP-‐NMAG Joint Project / Advancing Vulnerable Children and Families in New Mexico 73
Area Indicators Children’s Cabinet
KIDS COUNT /NM Databook
KIDS COUNT / NM All Indicators
Other
Healthy • Infant Mortality ✓ ✓
• Births & Prenatal Care
- The percentage of new mothers who had all the characteristics of a healthy birth index ✓
- Teen Birth Rate
Ages 10-14 ✓ ✓
Ages 15-17 ✓ ✓ ✓
Ages 15-19 ✓ ✓
- Birth to single mothers ✓ ✓
- Low weight births ✓ ✓
- Prenatal care began (First - third or unknown trimester) ✓ ✓
- No prenatal care ✓ ✓
- Late or no prenatal care (per 100) ✓
• Uninsured
- Low income ✓
- Low income, under 18 years of age ✓
- Low income, under 19 years of age ✓ ✓
- Under 19 years of age ✓ ✓
- Ages 18-64 ✓
• Medicaid Enrollment (under 21 years old) ✓ ✓
• SCHIP Enrollment (under 21 years old) ✓ ✓
• Number of licensed medical doctors per 1000 people ✓
• The percentage of public high school youth who were overweight or obese ✓
• Childhood immunization coverage ✓
• Adults with Diabetes Not Receiving all Recommended Diabetes Preventive Services ✓
• Diabetes Deaths (per 100,000) ✓
• Diabetes Prevalence Among Adults ✓
• Youth (<15 years) Asthma Hospitalization Rates (per 10,000)
Red Text: Indicators included in the report for current state analysis
Appendix 1.4 Summary of Commonly Used Indicators – d) Educated
Educated • The number of qualified early childhood T.E.A.C.H educators ✓
• The number of licensed and star-quality accredited child care providers ✓
• The percentage of 4th graders who achieve a score of “at or above proficient” in reading and math standards assessments ✓
• The percentage of core classes taught by “high quality” teachers in public elementary, middle and high schools ✓
• The percentage of habitually truant students ✓
• The percentage of minority group students enrolled in post secondary institutions compared to the population of minority youth age 18-24 years ✓
• % of students receiving free and reduced-price lunches ✓ ✓
• % of population 25 years and over - high school graduate ✓
• % of population 25 years and over - bachelor's degree or higher ✓
• Adults older than age 16 lacking basic prose literacy ✓
• High school graduation rates ✓ ✓
• Percent of 3-4 year olds enrolled in school ✓
• Kindergarten enrollment ✓
• Students (ages 6-17) not repeating grades in school ✓
• Percent of 7th-12th grade student dropouts ✓
• Number of teens (ages 16-19) not attending school and not working ✓
• Number of teens (ages 16-19) not enrolled in school and not high school graduates ✓
• College enrollment ✓
• AP test rate ✓
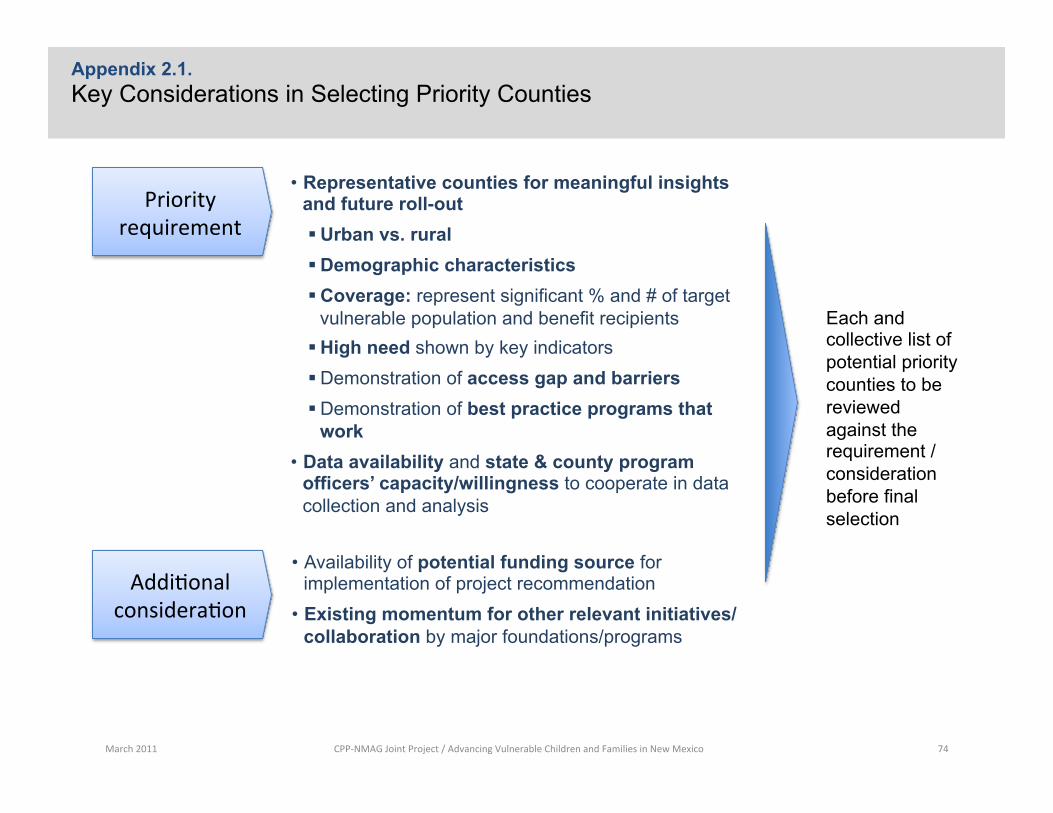
Priority requirement
• Representative counties for meaningful insights and future roll-out § Urban vs. rural § Demographic characteristics § Coverage: represent significant % and # of target
vulnerable population and benefit recipients § High need shown by key indicators § Demonstration of access gap and barriers § Demonstration of best practice programs that
work • Data availability and state & county program
officers’ capacity/willingness to cooperate in data collection and analysis
Addi;onal considera;on
• Availability of potential funding source for implementation of project recommendation
• Existing momentum for other relevant initiatives/collaboration by major foundations/programs
Each and collective list of potential priority counties to be reviewed against the requirement / consideration before final selection
March 2011 CPP-‐NMAG Joint Project / Advancing Vulnerable Children and Families in New Mexico 74
Appendix 2.1. Key Considerations in Selecting Priority Counties
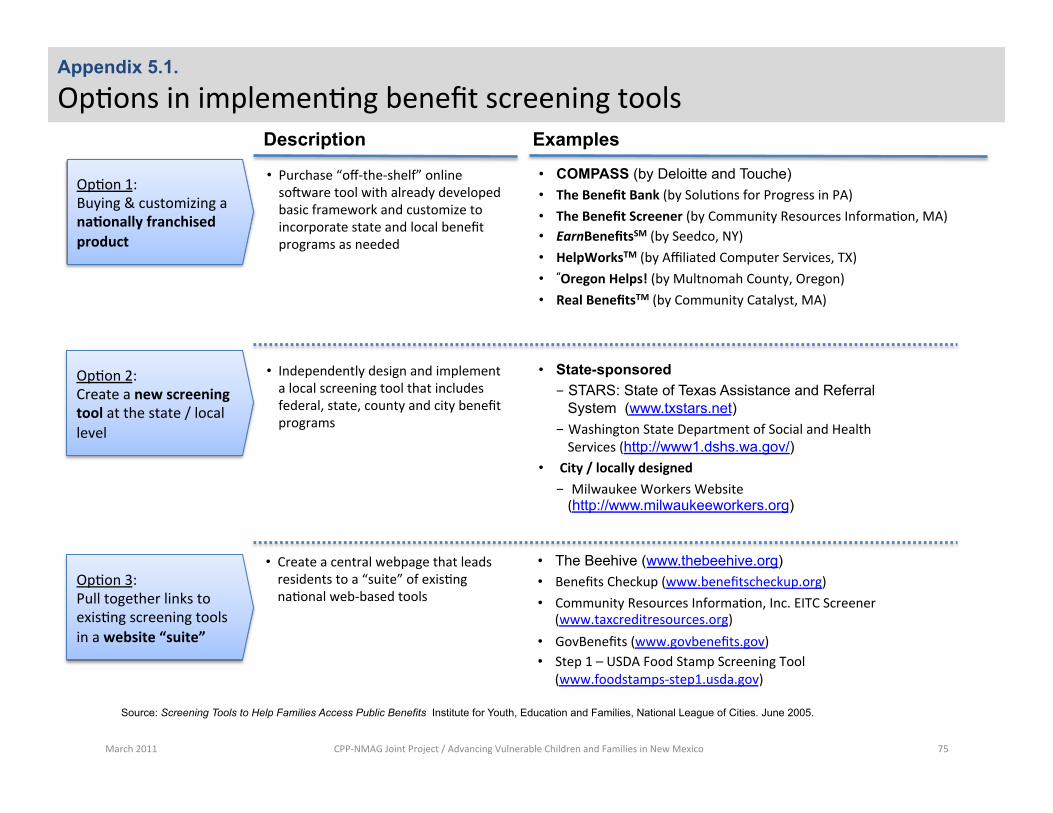
• Purchase “off-‐the-‐shelf” online soyware tool with already developed basic framework and customize to incorporate state and local benefit programs as needed
• COMPASS (by Deloitte and Touche) • The Benefit Bank (by Solu;ons for Progress in PA) • The Benefit Screener (by Community Resources Informa;on, MA) • EarnBenefitsSM (by Seedco, NY) • HelpWorksTM (by Affiliated Computer Services, TX) • “Oregon Helps! (by Multnomah County, Oregon) • Real BenefitsTM (by Community Catalyst, MA)
Description Examples
Op;on 1: Buying & customizing a naFonally franchised product
• Independently design and implement a local screening tool that includes federal, state, county and city benefit programs
• State-sponsored - STARS: State of Texas Assistance and Referral
System (www.txstars.net) - Washington State Department of Social and Health Services (http://www1.dshs.wa.gov/)
• City / locally designed - Milwaukee Workers Website (http://www.milwaukeeworkers.org)
Op;on 2: Create a new screening tool at the state / local level
Op;on 3: Pull together links to exis;ng screening tools in a website “suite”
• Create a central webpage that leads residents to a “suite” of exis;ng na;onal web-‐based tools
• The Beehive (www.thebeehive.org) • Benefits Checkup (www.benefitscheckup.org) • Community Resources Informa;on, Inc. EITC Screener
(www.taxcreditresources.org) • GovBenefits (www.govbenefits.gov) • Step 1 – USDA Food Stamp Screening Tool
(www.foodstamps-‐step1.usda.gov)
Source: Screening Tools to Help Families Access Public Benefits Institute for Youth, Education and Families, National League of Cities. June 2005.
Appendix 5.1.
Op;ons in implemen;ng benefit screening tools
March 2011 CPP-‐NMAG Joint Project / Advancing Vulnerable Children and Families in New Mexico 75
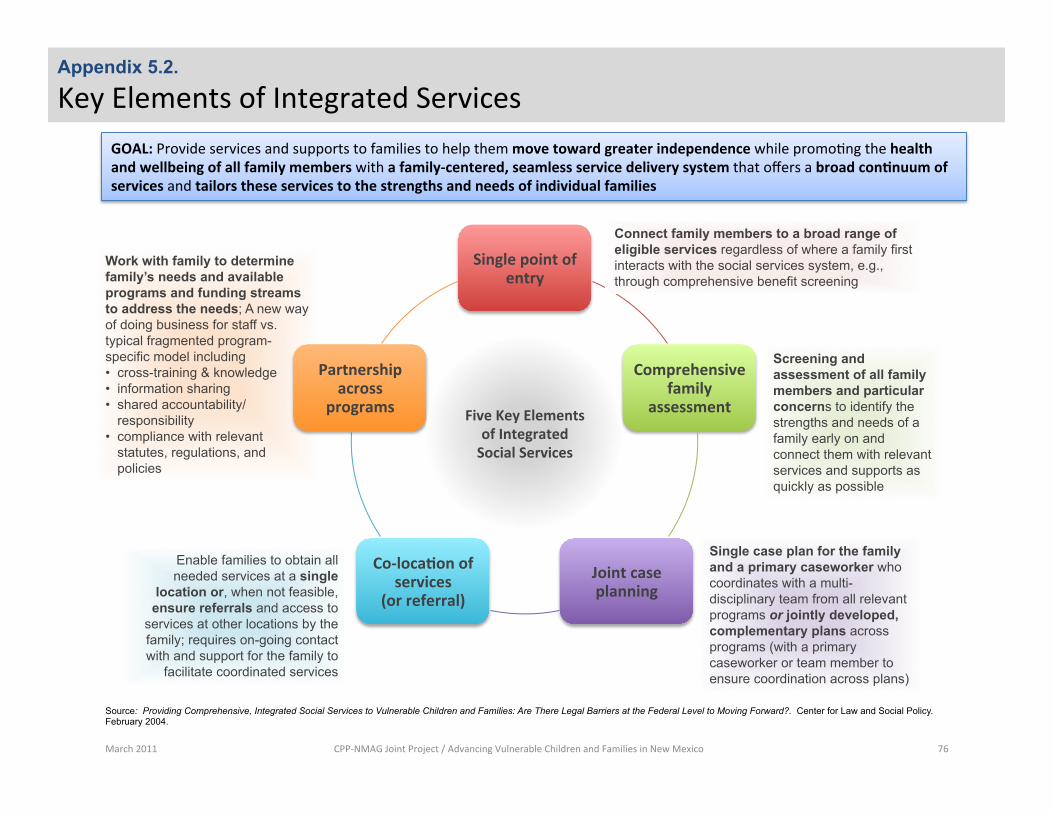
Work with family to determine family’s needs and available programs and funding streams to address the needs; A new way of doing business for staff vs. typical fragmented program-specific model including • cross-training & knowledge • information sharing • shared accountability/
responsibility • compliance with relevant
statutes, regulations, and policies
Single point of entry
Comprehensive family
assessment
Joint case planning
Co-‐locaFon of services
(or referral)
Partnership across
programs Five Key Elements of Integrated Social Services
Connect family members to a broad range of eligible services regardless of where a family first interacts with the social services system, e.g., through comprehensive benefit screening
Screening and assessment of all family members and particular concerns to identify the strengths and needs of a family early on and connect them with relevant services and supports as quickly as possible
Single case plan for the family and a primary caseworker who coordinates with a multi-disciplinary team from all relevant programs or jointly developed, complementary plans across programs (with a primary caseworker or team member to ensure coordination across plans)
Enable families to obtain all needed services at a single
location or, when not feasible, ensure referrals and access to
services at other locations by the family; requires on-going contact with and support for the family to
facilitate coordinated services
Source: Providing Comprehensive, Integrated Social Services to Vulnerable Children and Families: Are There Legal Barriers at the Federal Level to Moving Forward?. Center for Law and Social Policy. February 2004.
GOAL: Provide services and supports to families to help them move toward greater independence while promo;ng the health and wellbeing of all family members with a family-‐centered, seamless service delivery system that offers a broad conFnuum of services and tailors these services to the strengths and needs of individual families
March 2011 CPP-‐NMAG Joint Project / Advancing Vulnerable Children and Families in New Mexico 76
Appendix 5.2.
Key Elements of Integrated Services
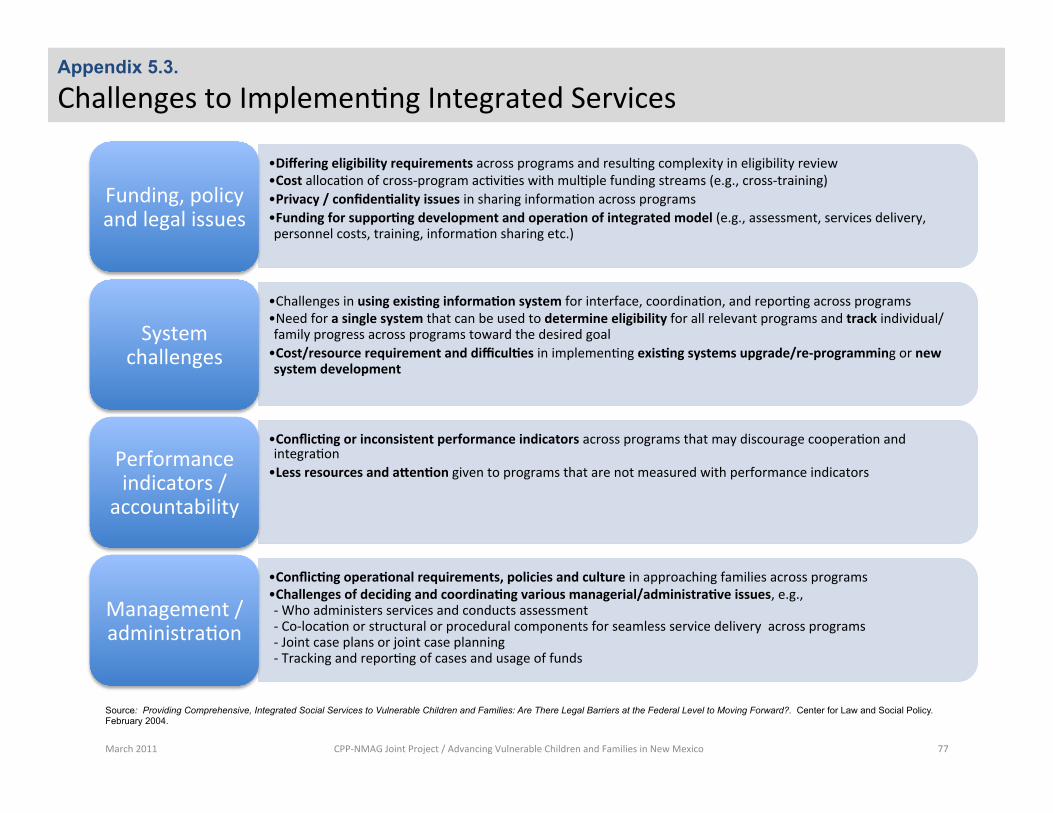
Source: Providing Comprehensive, Integrated Social Services to Vulnerable Children and Families: Are There Legal Barriers at the Federal Level to Moving Forward?. Center for Law and Social Policy. February 2004.
• Differing eligibility requirements across programs and resul;ng complexity in eligibility review • Cost alloca;on of cross-‐program ac;vi;es with mul;ple funding streams (e.g., cross-‐training) • Privacy / confidenFality issues in sharing informa;on across programs • Funding for supporFng development and operaFon of integrated model (e.g., assessment, services delivery, personnel costs, training, informa;on sharing etc.)
Funding, policy and legal issues
• Challenges in using exisFng informaFon system for interface, coordina;on, and repor;ng across programs • Need for a single system that can be used to determine eligibility for all relevant programs and track individual/family progress across programs toward the desired goal • Cost/resource requirement and difficulFes in implemen;ng exisFng systems upgrade/re-‐programming or new system development
System challenges
• ConflicFng or inconsistent performance indicators across programs that may discourage coopera;on and integra;on • Less resources and aNenFon given to programs that are not measured with performance indicators
Performance indicators /
accountability
• ConflicFng operaFonal requirements, policies and culture in approaching families across programs • Challenges of deciding and coordinaFng various managerial/administraFve issues, e.g., -‐ Who administers services and conducts assessment -‐ Co-‐loca;on or structural or procedural components for seamless service delivery across programs -‐ Joint case plans or joint case planning -‐ Tracking and repor;ng of cases and usage of funds
Management / administra;on
March 2011 CPP-‐NMAG Joint Project / Advancing Vulnerable Children and Families in New Mexico 77
Appendix 5.3.
Challenges to Implemen;ng Integrated Services
March 2011 CPP-‐NMAG Joint Project / Advancing Vulnerable Children and Families in New Mexico 78
End of Document