Embed Size (px)
Citation preview

Disclaimer: Attention of readers is drawn to important disclaimers printed at the end of this document
Redx Pharma
Advancing to clinic, increasing value
Although Redx has only been in operation since late-2010, it has already created several valuable drug candidates that are about to begin clinical development. Progress into the clinic will enhance significantly the value of these drug candidates as well as providing further technical validation of the company’s approach. Redx plans to partner these programmes with big pharma for late-stage development and commercialisation. Industry precedent indicates that deal values for clinical stage assets are much higher than for pre-clinical programmes and consequently these assets have the potential to secure superior returns for shareholders.
► Strategy: To discover ‘best-in-class’ drugs in therapeutic areas of significant commercial interest and, on a selective basis, to take those assets through early clinical development. Redx is focused on licensing out assets to drug major(s) for late-stage development and commercialisation to secure optimal returns.
► Delivery: Redx is a robust company that has performed strongly in terms of executing its strategy of delivering new drug candidates. It has managed this process faster and cheaper than industry norms – emphasising the strength in its core research and discovery capabilities. As a result, it now has multiple valuable drug candidate stage programmes as well as several attractive research programmes.
► Valuation: Redx has established itself as a well-run company, building a broad portfolio of pre-clinical assets. Out-licensing at the pre-clinical stage generates on average $17-20m in up-front payments and milestones. Taking some of these assets into early clinical development moves the asset up the value chain significantly, where up-front payments of $40-50m are common, accompanied by better milestones and higher long-term royalty streams.
► Opportunity: Redx is well managed and has strengthened both its management team and Board in keeping with its rapid progress. Redx has identified important areas upon which to focus its R&D efforts and built a valuable IP estate to support its programmes. Continuous management of the portfolio, to focus resources on the highest value programmes and eliminate others, has kept R&D efforts focused, as well as ensuring that cash is carefully invested.
► Risks: Clearly not without financial risk, however, Redx’s strategy and breadth of portfolio reduces the binary risk seen with single product companies. Also, timing of licensing deals is difficult to predict, but management has established already a track record of securing deals (including AstraZeneca, NHS, Horizon, Pierre Fabre). There is clear precedent that pharma/biotech is willing to pay high prices for assets, reflecting the level of de-risking undertaken by the developer.
► Investment summary: Redx offers investors access to a successful discovery and development pipeline. Redx plans to commence clinical work in early-2017 which will enhance significantly the value of the company. Additional capital will be required to support this important advance in the company’s strategy. The company will also continue to strengthen its Board and management team to ensure that it continues to build on its existing capabilities.
8th August 2016
Pharmaceuticals & Biotech
Source: Eikon Thomson Reuters
Market data
EPIC/TKR REDX Price (p) 26.5 12m High (p) 113.8 12m Low (p) 24.0 Shares (m) 93.6 Mkt Cap (£m) 24.6 EV (£m) 20.4 Free Float* 56% Market AIM
*As defined by AIM Rule 26
Description
Redx Pharma was formed in 2010 as a drug discovery company focused on creating ‘best-in-class’ drugs in the areas of cancer, infection, and inflammatory disease. With a broad portfolio, Redx is transitioning some of these assets into the clinic. The company's work has been endorsed by partnerships with global pharma companies and the NHS
Company information
CEO Neil Murray CFO Philip Tottey Chairman Frank Armstrong
0151 706 4747 www.redxpharma.com
Key shareholders
Directors 11.7% Seneca Partners 11.4% Jon Moulton 10.7% Aviva 10.0% AXA Framlington 9.8% Alderley Park Holdings 4.7%
Next event
Oct-16 Trading update Jan-17 Finals Feb-17 AGM Date Event
Analysts
Martin Hall 020 7148 1433 [email protected]
Gregoire Pave 020 7148 1434 [email protected]

Redx Pharma
8th August 2016 2
Research & Development
► R&D costs are running at around £12.8m in FY16, fully costed, a combination of direct costs and staff costs
► R&D costs are forecast to rise each year through 2018 given that some assets will be taken into clinical development
► Regional Growth Fund grant awards of £5.9m in 2012, £4.7m in 2013 and £4.2m in 2015 have helped fund, in part, research & development
Net cash
► Cash position at 30th April was £12.1m bolstered by Placing proceeds of £10.0m gross (£9.3m net) during April
► Excludes any potential up-front cash or milestones from potential commercial partners
► £2.0m convertible loan with Liverpool City Council due to be repaid March 2017 or converts into shares subject to agreement of both parties
Capital increases
► Funded privately up to March 2015; IPO proceeds of £15m gross (£13.4m net) in March 2015 and a further Placing of £10.0m gross in April 2016
► Future capital increases will be used to progress its pre-clinical assets through clinical development, moving them up the value chain
► No assumption of further capital increases although we forecast a cash requirement in the order of £12m p.a.
Cashflow
► The cash outflow is a direct consequence of moving its assets further up the value chain
► Reflects cash invested into R&D to support the carefully selected clinical development programmes
► Cash from R&D tax credits expected to be c.£1.0m in FY16, and rising in future years along with growth in R&D
► Management keeps tight control of cash and invests it wisely to improve the value of its assets
Source: Company data; Hardman & Co Life Sciences Research
0.0
5.0
10.0
15.0
20.0
2012 2013 2014 2015 2016E 2017E 2018E
R&
D s
pen
d (
£m
)
-40.0
-30.0
-20.0
-10.0
0.0
10.0
2012 2013 2014 2015 2016E 2017E 2018E
Net
cas
h (
£m
)
0.0
2.0
4.0
6.0
8.0
10.0
12.0
14.0
16.0
2012 2013 2014 2015 2016E 2017E
Cap
ital
incr
ease
s (£
m)
-20
-15
-10
-5
0
-20.0
-15.0
-10.0
-5.0
0.0
FCF/
shar
e (p
)
Free
cas
hfl
ow
(£
m)

Redx Pharma
8th August 2016 3
Strategy update
Redx Pharma is transitioning from discovery to clinical development of small molecule therapeutics that target well characterised and validated targets in the fields of oncology, anti-infectives and immunology. The goal is to improve the characteristics of existing drug classes to create highly differentiated ‘best-in-class’ drugs that are scientifically and commercially relevant to both big pharma and biotech, which are looking increasingly to build and diversify their product pipelines.
Although Redx was only incorporated in 2010, it has already created several valuable drug candidates that are about to commence clinical development. Progress into the clinic will significantly enhance the value of these putative drugs as well as providing technical validation of the company’s approach. Redx plans to partner these programmes with major pharmaceutical or biotech players, who will complete the clinical development programme and commercialise the products. This is moving Redx up the value chain. Out-licensing at the pre-clinical stage generates on average $17-20m in up-front payments and milestones. However, with early clinical data, the asset moves up the value chain significantly, where up-front payments of $40-50m are common, accompanied by better milestones and higher royalty streams.
Over the first half of fiscal 2016, Redx has made substantial strategic progress:
► Made considerable progress in all three target therapeutic areas – oncology, anti-infectives, immunology
► Expanded the number of drug development candidates in the pipeline to four
► Completed two more proof-of-concept studies bringing the total to seven
► Cash burn was £5.0m – net cash at period end £2.4m; increased cash held, as at the end of April, to £12.1m following a £10m gross fundraise
► Strengthened Board with the appointment of two industry-experienced NEDs
Oncology The highlight during the first half of fiscal 2016 was the identification of a novel patented lead development candidate to treat hard-to-treat cancers such as pancreatic, triple negative breast (unresponsive to oestrogen, progesterone or HER2 therapies) and head and neck cancers. The candidate compound RXC004 inhibits the porcupine enzyme that is a key target in the Wnt biological signalling pathway. The Wnt pathway is known to be dysregulated in a number of human cancers and is implicated in the maintenance of cancer stem cells (CSCs). CSCs are resistant to current cancer treatments and are thought to be responsible for the recurrence of tumours after successful initial treatment. Interest in this target was enhanced when Novartis initiated Phase I/II clinical trials with WNT974. Recent emerging evidence links elevated Wnt signalling with resistance to checkpoint inhibitors and points to a potential role for RXC004 in immuno-oncology.
In addition, on the day of the results, Redx announced that it had reached pre-clinical proof-of-concept with its reversible Bruton’s Tyrosine Kinase (BTK). The launch of Imbruvica (ibrutinib (Abbvie)), has already pointed to the potential market in blood cancers for this drug, however, treatment resistance against Imbruvica’s irreversible mode of action has already started to emerge. Redx’s approach is to develop a best-in-class reversible BTK inhibitor which is both active in patients that are untreated or have acquired resistance to ibrutinib and furthermore offers a reduced side-effect profile compared to ibrutinib.

Redx Pharma
8th August 2016 4
Anti-infectives In the anti-infectives programme, Redx announced during 1H’16 its second proof-of-concept. It has developed drug candidates that treat drug-resistant gonorrhoea, which is considered by the Centre for Disease Control1 to be one of the top three urgent threats. The company also has a broader Gram –ve programme, slightly further back in development, which is focused on treating a broad spectrum of resistant bacteria, in particular pseudomonas, klebsiella, enterobacteriaceae, and Acinetobacter (ESKAPE pathogens that cause significant morbidity and mortality).
Management believes that the primary differential feature of Redx’s novel compounds compared to fluoroquinolone is that they bind in a different way – to two enzymes at the same time – thereby improving the efficacy whilst at the same time reducing the risk of developing resistance.
Immunology The immunology division is still relatively new, having been established in May 2015. The focus is on the potential of its irreversible BTK inhibitor in autoimmune diseases.
Updated pipeline
The following chart provides a complete update to the company’s pipeline.
Redx Pharma’s discovery and development pipeline
Source: Redx Pharma
1 Antibiotic Resistance Threats, 2013. US Centre for Disease Control

Redx Pharma
8th August 2016 5
Building value
The business model of Redx is to commercialise its pharmaceutical assets via out-licensing, strategic alliances and co-developments either at the pre-clinical stage or, on a case by case basis, in Phase I/Phase IIa clinical development where Redx can obtain relatively quick human data at minimal incremental cost. This strategy is moving its assets significantly up the long-term value chain.
Given the productivity of the drug discovery programmes, one of Redx’s recently appointed NEDs has undertaken a review of the company’s pipeline, in order to make sure that an appropriate level of capital is allocated to projects to maximise returns for shareholders. As a consequence, management has indicated that, over the next 1-2 years, there will be a change in emphasis away from discovery and towards early-stage clinical development.
Redx plans to commence clinical work in early-2017 which will significantly enhance the value of the company. Additional capital will be required to support this important advance in the company’s strategy. The company will also continue to strengthen its Board and management team to ensure that it builds on its existing capabilities. We expect that management will continue to carefully focus its resources as well as executing on its business development and partnering activity.
Investment summary
Redx is a robust company that has performed strongly in terms of executing its core business of delivering new drug candidates. It has managed this process faster and cheaper than industry norms – emphasising the strength in its core research and discovery capabilities. As a result, it now has four valuable drug candidate stage programmes as well as several attractive research programmes.
The company is well managed and has strengthened both its management team and Board in keeping with the rapid progress that it has made to date. Although executing on licensing deals is time consuming and difficult to predict, management has an established track record of securing deals (including AstraZeneca, NHS, Horizon, Pierre Fabre). The company has a goal to secure a further licensing deal in this financial year.
Redx has identified important areas upon which to focus its R&D efforts and has built a valuable IP estate to support its programmes. Continuous management of the portfolio to focus resources on the highest value programmes and eliminate others, has kept R&D efforts focused as well as ensuring that cash is invested carefully. The company also has a strong track record of fund-raising both in the private sector prior to IPO, and latterly in the public markets. This has resulted in an expanding shareholder base including several institutions.
Building value
Source: Redx Pharma
Redx Pharma
8th August 2016 6
Highlighting pipeline potential
Pre-clinical stage discovery and development pharmaceutical companies are particularly difficult to value. There are two principal reasons for this:
1. Given the early stage of the business the probability of a putative drug reaching the market is extremely low, which dramatically affects the net present value derived from DCF modelling
2. Prices paid by big pharma to obtain early stage assets are extremely variable and difficult to predict. There is no magic formula that can be applied. Prices paid for assets that are considered to be ‘hot’ can be quite considerable and often way beyond market predictions
Consequently, we have undertaken an assessment of the sales potential of the leading assets within Redx Pharma’s current broad pipeline of assets, on which it would receive long-term royalties. On the basis that the drug is efficacious and eventually approved, we have asked the question: What is the 5-year sales potential of these key assets in the hands of an experienced commercial partner? A low outcome and a best case scenario have been considered and the key drivers pushing sales either towards the lower end of the spectrum or towards the upper end, with an important factor being the sales derived by appropriate comparator drugs when they were first launched on the global market.
It is important to stress that no account has been taken of the probability of each drug reaching the market or the timing of any launches, nor are these figures being used in any forecasts for the group as these assets will be out-licensed. Longer-term, once the asset has been out-licensed, these figures could be used to calculate a potential royalty stream for the company.
The following table highlights the leading assets of the group:
Summary of Redx Pharma leads Therapy Target Product I° indication
Oncology Smoothened (SMO) inhibitor RXC001 Basal cell carcinoma Oncology Porcupine (PORC) inhibitor RXC004 Pancreatic cancer Oncology Reversible BTK inhibitor - Leukemia/blood cancers Oncology IDO inhibitor - Skin/lung cancer Anti-infective Gram +ve bacteria RXC003 MRSA Anti-infective Gram –ve bacteria - Gonorrhoea
Source: Redx Pharma; Hardman & Co Life Sciences Research
RXC001 – Smoothened inhibitor Smoothened (SMO) is a protein within the Hedgehog signalling pathway implicated in the genesis of several types of cancer. Initially, the target for Redx is a topical treatment for basal cell carcinoma (BCC), a form of skin cancer that is the most prevalent cancer with almost 3 million cases each year in the US. This field was led by Aldara/Zyclara (3M), which is now generic and has been superseded by Erivedge (Roche), which is approved for the treatment of advanced and metastatic BCC. However, the differentiating feature for the Redx asset is that it will be used to treat BCC directly via topical administration, at an earlier stage.

Redx Pharma
8th August 2016 7
Smoothened inhibitor ($m) Comparator sales data – Erivedge (Roche) Year 5 Redx drug
Year 1 Year 2 Year 3 Year 4 Year 5 Low High
31 81 140 174 250est $150m $1,000m Source: Hardman & Co Life Sciences Research
► Indication – Targeting early stage BCC directly, as opposed to metastatic BCC, would have a major impact on sales potential
► Precedent – Aldara was launched in 1997 and has now gone generic. Erivedge has been on the market for over four years and is yet to break $200m sales per annum
► Formulation – A topical formulation applied directly to the affected tissue and with an improved safety profile would open the product up to much greater use
RXC004 – Porcupine inhibitor The difficulty in deriving a potential sales forecast for RXC004 is that there are no available comparators commercially available. This field is being led by Novartis with WNT974, which is in Phase I/II clinical trials. Given that RXC004 is expected to have efficacy in a genetically pre-defined population within cancers with a high unmet need (eg pancreatic), and to provide readers with a guide to the opportunity, Xalkori (Pfizer) has been selected as a comparator since it uses a similar strategy in lung cancer.
Porcupine inhibitor ($m) Comparator sales data – Xalkori (Pfizer) Year 5 Redx drug
Year 1 Year 2 Year 3 Year 4 Year 5 Low High
123 283 438 488 520est $500m $4,800m Source: Hardman & Co Life Sciences Research
► Indications – Although the Wnt signalling pathway is implicated in a broad number of cancers, it is likely that RXC004 would be indicated initially in pancreatic, gastric and biliary cancers, which potentially limits the sales potential
► Toxicity – Redx has a big advantage following Novartis as it can observe any issues facing WNT974, notably the narrow therapeutic window, and endeavour to overcome them
► Price – An efficacious drug in pancreatic cancer would command a significant price premium
Reversible BTK inhibitor The focus of Redx’s reversible BTK inhibitor is chronic lymphocytic leukemia (CLL) and other blood cancers. The precedent for this opportunity is Imbruvica (Abbvie), which has been on the market for two years, recording sales of $200m and $689m respectively. However, there is some early evidence that patients become resistant to this drug which may limit its longer-term sales potential. Given that Imbruvica has only been on the market a short time and sales data is not available, coupled with a comparable approach of Redx to target emerging resistance to a marketed agent in blood cancer with a next generation drug, Sprycel (kinase inhibitor) has been selected as the comparator.

Redx Pharma
8th August 2016 8
Reversible BTK inhibitor ($m) Comparator sales data – Sprycel (Bristol-Myers Squibb) Year 5 Redx drug
Year 1 Year 2 Year 3 Year 4 Year 5 Low High
158 310 421 576 803 $800m $2,900m Source: Hardman & Co Life Sciences Research
► Indication – The initial target will be CLL and other rare blood cancers (Waldenstrom’s macroglobulinaemia and Mantle cell lymphoma) only; extending the use to other cancer types will increase the sales potential
► Resistance – Are the early issues over resistance to Imbruvica founded and linked only to the irreversible action of the drug?
► Price – If Redx overcomes the issues facing the gold standard Imbruvica, its commercial partner would be able to charge a significant price premium
IDO inhibitor Indoleamine 2,3-dioxygenase (IDO) is one of several immune checkpoints involved in tumour immune escape and is considered to be a particular ‘hot’ field, with Bristol-Myers Squibb paying handsomely for Flexus Biosciences in February 2015 in order to gain access to its lead pre-clinical small molecule, an IDO-1 inhibitor. The potential indications for these products are solid tumours, particularly skin and lung cancer. While the most suitable comparators are probably Opdivo (Bristol-Myers Squibb) and Keytruda (Merck & Co), only two years’ sales data is available, both of which have similar trajectories to Yervoy.
IDO inhibitor ($m) Comparator sales data – Yervoy (Bristol-Myers Squibb) Year 5 Redx drug
Year 1 Year 2 Year 3 Year 4 Year 5 Low High
360 706 960 1,308 1,126 $1,000m $3,000m Source: Hardman & Co Life Sciences Research
► Indication – Yervoy is indicated primarily for advanced melanoma, which could be an initial target for Redx; although it is a very competitive space requiring large and long trials
► Molecule – Yervoy is an antibody (large molecule) versus Redx’s small molecule approach
► Competition – How does Redx molecule compare with Flexus’ more advanced inhibitor?
► Combination – The real opportunity is to combine with other immune modulators and checkpoint inhibitors (and PD1 and anti-PDL-1 antibodies) to improve their clinical response rates, this would have a consequential effect on the commercial prospects
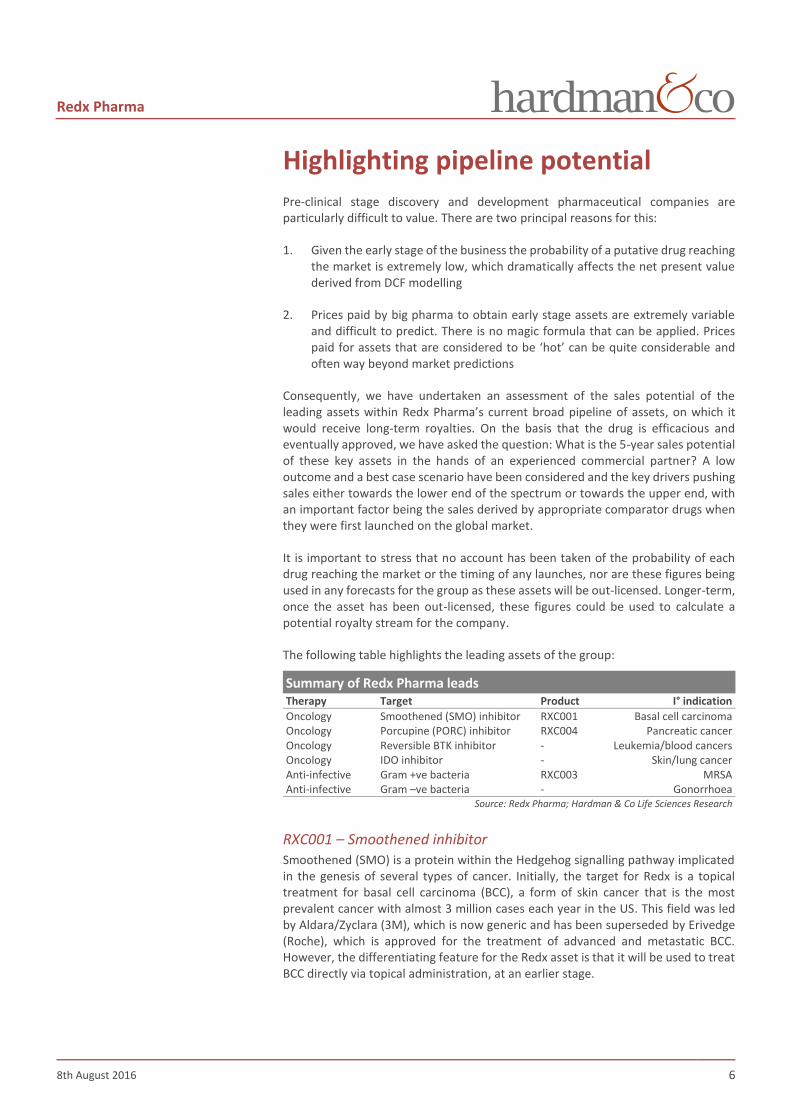
RXC003 – Gram +ve infections Resistance to antibiotics is a major public health issue worldwide, highlighted in the UK recently following publication of a report: “Tackling Drug-resistant infections globally: Review on anti-microbial resistance” by Jim O’Neill. Over the last 35 years, development of antibiotics has not been a focus for major drug companies. Although there have been several billion dollar antibiotics, it is important to note that the record for annual sales achieved still lies with Augmentin (GlaxoSmithKline) at $2.1bn in 2005, and cumulative sales since launch of $33.4bn.
Redx Pharma
8th August 2016 9
For the Gram +ve comparator, we have used Zyvox, although sales data for this drug is relatively old, having been launched in 2002. More recently introduced antibiotics such as Cubicin (Merck & Co) could have been used. However, after a very slow start following launch in 2003, this drug has reached annual sales of around $1.15m p.a., but has then failed to grow significantly further from this milestone. Also, it is available only as an intra-venous injection. The best case scenario for the Redx drug would be multiple formulations allowing widespread prescribing, at a premium price, to reflecting the lack of resistance initially to a new drug.
RXC003 – Gram +ve antibiotic ($m) Comparator sales data – Zyvox (Pfizer) Year 5 Redx drug
Year 1 Year 2 Year 3 Year 4 Year 5 Low High
199 181 463 618 782 $1,250m $3,500m Source: Hardman & Co Life Sciences Research
Several factors that would impact the sales of antibiotics need to be considered when trying to ascertain the likely sales opportunity of a successful Redx antibiotic:
► Formulation – Intra-venous administration will be restricted to hospital-use only; intra-muscular and, more importantly, oral administration would open the drug up to the general practitioner market
► Course of treatment – By their very nature, antibiotics work over a very short (acute) course of treatment, usually 5-7 days, which severely limits the sales potential compared to drugs targeting chronic diseases
► Licensee/Partner – It is unclear if the limited resources of Cubist Inc resulted in only low sales of Cubicin in the early years following launch
► Positioning/price – Given that any new antibiotic would represent a major breakthrough, there is a possibility that the drug would be reserved for only the most difficult cases and limit its sales potential; on the other hand, such a product would command a significant price premium. The balance between positioning and price would have a big impact on the sales potential
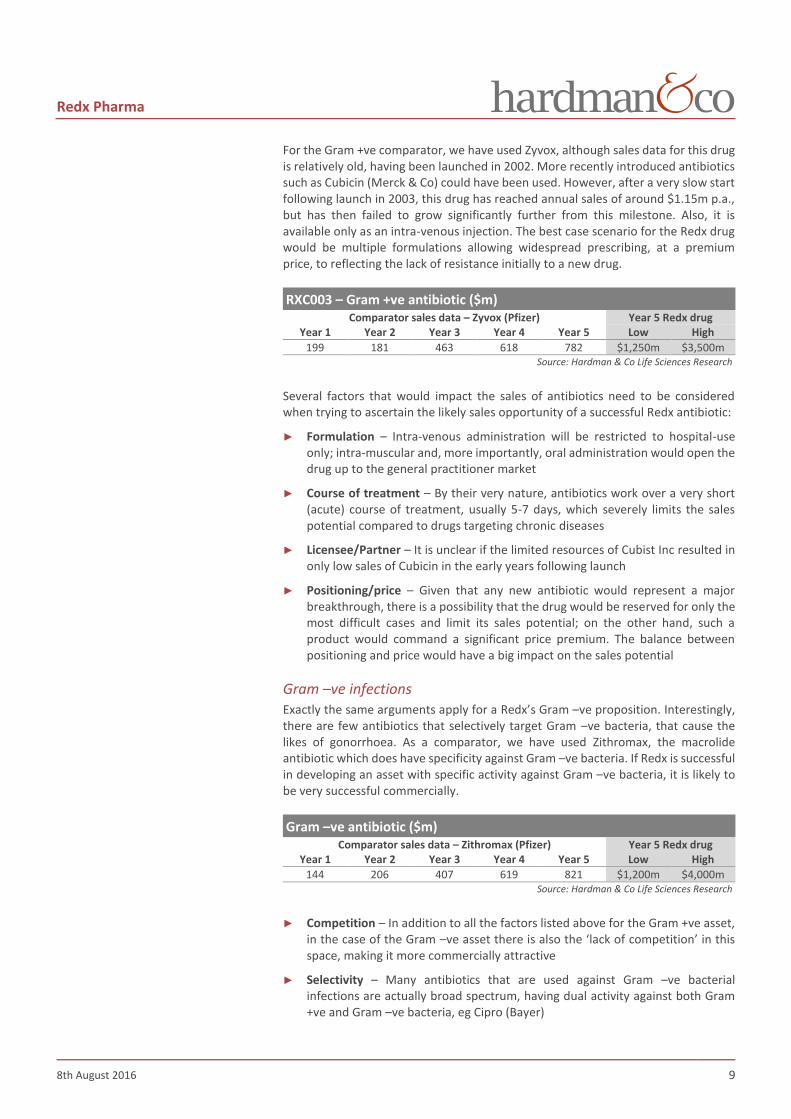
Gram –ve infections Exactly the same arguments apply for a Redx’s Gram –ve proposition. Interestingly, there are few antibiotics that selectively target Gram –ve bacteria, that cause the likes of gonorrhoea. As a comparator, we have used Zithromax, the macrolide antibiotic which does have specificity against Gram –ve bacteria. If Redx is successful in developing an asset with specific activity against Gram –ve bacteria, it is likely to be very successful commercially.
Gram –ve antibiotic ($m) Comparator sales data – Zithromax (Pfizer) Year 5 Redx drug
Year 1 Year 2 Year 3 Year 4 Year 5 Low High
144 206 407 619 821 $1,200m $4,000m Source: Hardman & Co Life Sciences Research
► Competition – In addition to all the factors listed above for the Gram +ve asset, in the case of the Gram –ve asset there is also the ‘lack of competition’ in this space, making it more commercially attractive
► Selectivity – Many antibiotics that are used against Gram –ve bacterial infections are actually broad spectrum, having dual activity against both Gram +ve and Gram –ve bacteria, eg Cipro (Bayer)
Redx Pharma
8th August 2016 10
Summary As outlined, Redx has a valuable pipeline of key therapeutic targets. Consideration should be given to the various caveats previously highlighted and it is important to stress that these figures are not our sales forecasts for the company but they are typical of figures that could be expected five years after launch by a large and experienced commercial partner.
From this analysis it is clear that Redx can secure significant returns from royalty income associated with the successful progression even from only one or two of its programmes, any one of which could exceed substantially the current market capitalisation of the company. In addition, the company has the potential to secure upfront and milestone payment income from the licensing of its assets.

Redx Pharma
8th August 2016 11
Financial summary
In order to continue to progress its drug pipeline, our estimate is that Redx will need to secure funding – either from income or capital – of £30m between now and the end of the 2018 financial year. This will enable the company to continue to develop its pipeline, progressing at least one programme into clinic and so increasing the value of the assets. This will position Redx to secure the most valuable deals from prospective partners.
It should be stressed that our forecasts do not include potential income from such licensing deals until they have been formally announced, as the timing of them is extremely difficult to predict. Therefore, there is considerable scope for upward revision to forecasts when such deals are announced.
Financial summary Year end Sept (£m) 2013 2014 2015 2016E 2017E 2018E
SG&A -1.34 -1.81 -1.63 -3.00 -3.18 -3.28
R&D -8.25 -8.34 -9.84 -13.80 -15.46 -16.38
Licensing/Royalties 0.00 0.00 0.00 0.00 0.00 0.00
Underlying EBIT -3.19 -4.00 -8.82 -14.30 -18.04 -19.66
Share based costs -0.14 -0.01 -0.61 -0.30 -0.32 -0.34
Statutory Operating profit -3.33 -4.01 -8.54 -14.60 -18.36 -20.00
Net financial income -0.25 -0.25 -0.29 -0.19 -0.18 0.00
Pre-tax profit -3.44 -4.25 -9.11 -14.49 -18.22 -19.66
Reported taxation 0.39 0.91 0.65 0.98 1.38 1.55
Underlying net income -3.05 -3.34 -8.46 -13.51 -16.84 -18.11
Underlying Basic EPS (p) n/a -7.55 -14.58 -17.04 -18.00 -19.36
Statutory Basic EPS (p) n/a -7.58 -14.09 -17.42 -18.34 -19.72 Balance sheet
Share capital 0.01 0.01 0.65 0.94 0.94 0.94
Reserves 0.77 1.81 7.05 2.33 -14.83 -33.28
Capitalised R&D 9.49 15.38 21.54 29.93 38.05 45.04
Loans 2.00 2.00 2.00 2.00 0.00 0.00
less: Cash & securities 1.03 2.89 9.44 6.11 -13.12 -30.18
Invested capital 10.85 15.36 21.06 28.30 36.45 42.01 Cashflow
Trading profit -3.19 -4.00 -8.82 -14.30 -18.04 -19.66
Depreciation 0.24 0.25 0.14 0.30 0.50 0.50
Working Capital -0.94 1.20 2.01 1.35 1.39 1.44
Other 0.01 -0.02 0.02 0.00 0.00 0.00
Company op cashflow -3.88 -2.57 -6.65 -12.65 -16.14 -17.72
Capital expenditure -0.28 -0.05 -0.36 -0.50 -0.63 -0.72
Share issues 4.89 4.38 13.45 9.37 0.00 0.00
Change in net debt 0.97 1.86 6.54 -3.32 -19.24 -17.06
Period end net cash -0.97 0.89 7.44 4.11 -13.12 -30.18
Source: Hardman & Co Life Sciences Research

Redx Pharma
8th August 2016 12
Changes to forecasts ► R&D – First-half R&D, at an estimated -£6.5m was higher than expected and has
a knock-on effect on to the full year and beyond. FY’16 R&D is now expected to be about –£3.0m higher at around –£13.8m
► Corporate costs – General corporate costs, governance – in part due via a strengthened Board – finance and IT have increased more than expected and we are now forecasting –£3.0m for the full year, compared to –£2.5m previously
► Share based costs – Excluded from underlying numbers, but now expected to be around –£0.3m compared to –£0.7m previously
► EPS – After the Placing in April, there is little change in underlying EPS forecasts (-17.0p vs to –17.2p previously) due to the increased number of shares in issue
► Net cash – At 30th Sept 2016, net cash is forecast to be £4.1m, ca.£1.0m lower than previous expectations, after allowing for the Placing, which echoes the changes made to the P&L account mentioned above

Redx Pharma
8th August 2016 13
Notes

Redx Pharma
8th August 2016 14
Notes

Redx Pharma
8th August 2016 15
Disclaimer Hardman & Co provides professional independent research services. Whilst every reasonable effort has been made to ensure that the information in the research is correct, this cannot be guaranteed.
The research reflects the objective views of the analysts named on the front page. However, the companies or funds covered in this research may pay us a fee, commission or other remuneration in order for this research to be made available. A full list of companies or funds that have paid us for coverage within the past 12 months can be viewed at http://www.hardmanandco.com/
Hardman & Co has a personal dealing policy which debars staff and consultants from dealing in shares, bonds or other related instruments of companies which pay Hardman for any services, including research. They may be allowed to hold such securities if they were owned prior to joining Hardman or if they were held before the company appointed Hardman. In such cases sales will only be allowed in limited circumstances, generally in the two weeks following publication of figures.
Hardman & Co does not buy or sell shares, either for its own account or for other parties and neither does it undertake investment business. We may provide investment banking services to corporate clients.
Hardman & Co does not make recommendations. Accordingly, we do not publish records of our past recommendations. Where a Fair Value price is given in a research note this is the theoretical result of a study of a range of possible outcomes, and not a forecast of a likely share price. Hardman & Co may publish further notes on these securities/companies but has no scheduled commitment and may cease to follow these securities/companies without notice.
Nothing in this report should be construed as an offer, or the solicitation of an offer, to buy or sell securities by us.
This information is not tailored to your individual situation and the investment(s) covered may not be suitable for you. You should not make any investment decision without consulting a fully qualified financial adviser.
This report may not be reproduced in whole or in part without prior permission from Hardman &Co.
Hardman Research Ltd, trading as Hardman & Co, is an appointed representative of Capital Markets Strategy Ltd and is authorised and regulated by the Financial Conduct Authority (FCA) under registration number 600843. Hardman Research Ltd is registered at Companies House with number 8256259. However, the information in this research report is not FCA regulated because it does not constitute investment advice (as defined in the Financial Services and Markets Act 2000) and is provided for general information only.
Hardman & Co Research Limited (trading as Hardman & Co) 11/12 Tokenhouse Yard London EC2R 7AS T +44 (0) 207 929 3399 Follow us on Twitter @HardmanandCo (Disclaimer Version 2 – Effective from August 2015)

Redx Pharma
8th August 2016 16
Hardman Team
Management Team +44 (0)20 7929 3399
John Holmes [email protected] +44 (0)207 148 0543 Chairman Keith Hiscock [email protected] +44 (0)207 148 0544 CEO
Marketing / Investor Engagement +44 (0)20 7929 3399
Richard Angus [email protected] +44 (0)207 148 0548 Max Davey [email protected] +44 (0)207 148 0540 Antony Gifford [email protected] +44 (0)7539 947 917 Vilma Pabilionyte [email protected] +44 (0)207 148 0546 Neil Pigeon [email protected] +44 (0)207 148 0546
Analysts +44 (0)20 7929 3399 Agriculture Bonds
Doug Hawkins [email protected] Brian Moretta [email protected] Yingheng Chen [email protected] Meghan Sapp [email protected] Building & Construction Consumer & Leisure
Tony Williams [email protected] Mike Foster [email protected] Mike Foster [email protected] Steve Clapham [email protected] Financials Life Sciences
Brian Moretta [email protected] Martin Hall [email protected] Mark Thomas [email protected] Dorothea Hill [email protected] Gregoire Pave [email protected] Media Mining
Derek Terrington [email protected] Ian Falconer [email protected] Oil & Gas Property
Stephen Thomas [email protected] Mike Foster [email protected] Mark Parfitt [email protected] Services Special Situations
Mike Foster [email protected] Steve Clapham [email protected] Paul Singer [email protected] Technology Utilities
Mike Foster [email protected] Nigel Hawkins [email protected]
Hardman & Co
11/12 Tokenhouse Yard London EC2R 7AS United Kingdom Tel: +44(0)20 7929 3399 Fax: +44(0)20 7929 3377 www.hardmanandco.com