Embed Size (px)
Citation preview
CRITICAL DIAGNOSTICS 3030 Bunker Hill St. Suite 117A
San Diego, CA 92109
Presage® ST2 Assay
EIA Test Kit
REF# BC-1065E
Advancing Medicine, Saving Lives®
CRITICAL DIAGNOSTICS Presage® ST2 Assay
Page 2 of 18
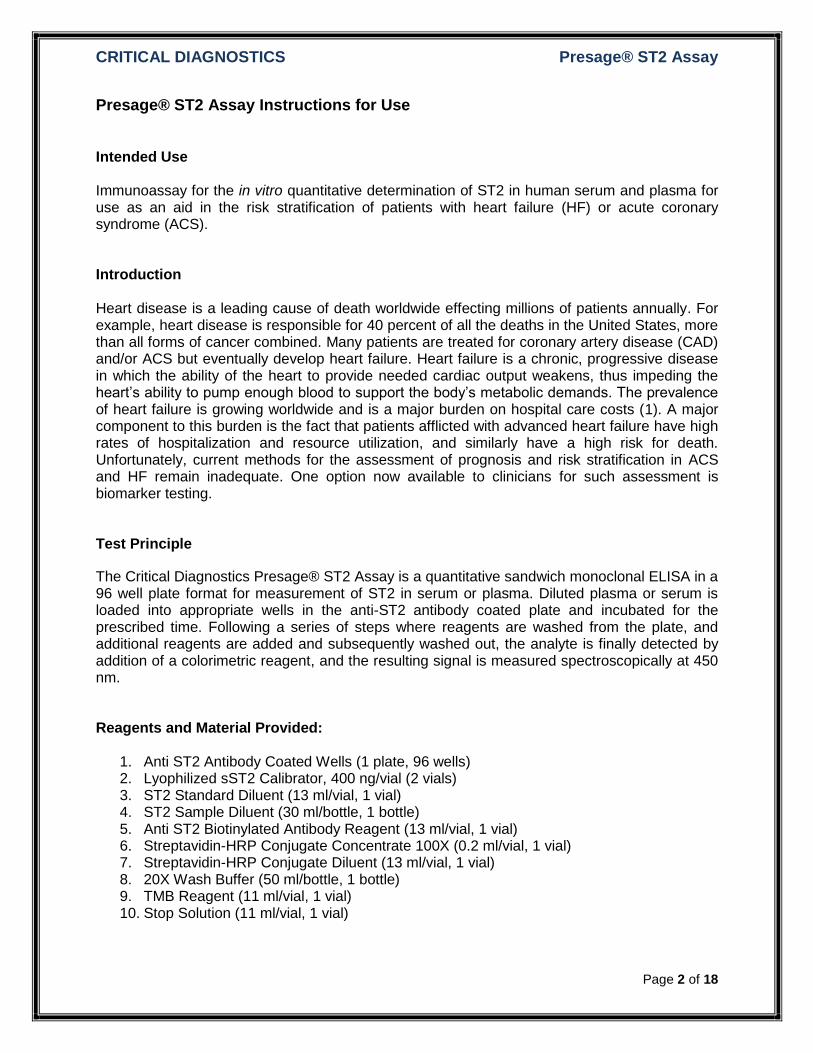
Presage® ST2 Assay Instructions for Use
Intended Use Immunoassay for the in vitro quantitative determination of ST2 in human serum and plasma for use as an aid in the risk stratification of patients with heart failure (HF) or acute coronary syndrome (ACS). Introduction Heart disease is a leading cause of death worldwide effecting millions of patients annually. For example, heart disease is responsible for 40 percent of all the deaths in the United States, more than all forms of cancer combined. Many patients are treated for coronary artery disease (CAD) and/or ACS but eventually develop heart failure. Heart failure is a chronic, progressive disease in which the ability of the heart to provide needed cardiac output weakens, thus impeding the heart’s ability to pump enough blood to support the body’s metabolic demands. The prevalence of heart failure is growing worldwide and is a major burden on hospital care costs (1). A major component to this burden is the fact that patients afflicted with advanced heart failure have high rates of hospitalization and resource utilization, and similarly have a high risk for death. Unfortunately, current methods for the assessment of prognosis and risk stratification in ACS and HF remain inadequate. One option now available to clinicians for such assessment is biomarker testing. Test Principle
The Critical Diagnostics Presage® ST2 Assay is a quantitative sandwich monoclonal ELISA in a 96 well plate format for measurement of ST2 in serum or plasma. Diluted plasma or serum is loaded into appropriate wells in the anti-ST2 antibody coated plate and incubated for the prescribed time. Following a series of steps where reagents are washed from the plate, and additional reagents are added and subsequently washed out, the analyte is finally detected by addition of a colorimetric reagent, and the resulting signal is measured spectroscopically at 450 nm. Reagents and Material Provided:
1. Anti ST2 Antibody Coated Wells (1 plate, 96 wells) 2. Lyophilized sST2 Calibrator, 400 ng/vial (2 vials) 3. ST2 Standard Diluent (13 ml/vial, 1 vial) 4. ST2 Sample Diluent (30 ml/bottle, 1 bottle) 5. Anti ST2 Biotinylated Antibody Reagent (13 ml/vial, 1 vial) 6. Streptavidin-HRP Conjugate Concentrate 100X (0.2 ml/vial, 1 vial) 7. Streptavidin-HRP Conjugate Diluent (13 ml/vial, 1 vial) 8. 20X Wash Buffer (50 ml/bottle, 1 bottle) 9. TMB Reagent (11 ml/vial, 1 vial) 10. Stop Solution (11 ml/vial, 1 vial)

CRITICAL DIAGNOSTICS Presage® ST2 Assay
Page 3 of 18
Materials Required But Not Provided:
1. Precision Pipettes: 100 l, and 1.0 ml single channel pipettes, and 300l multichannel pipette
2. Disposable pipette tips 3. Microtiter well shaker capable of shaking at 750 rpm. 4. Microtiter well reader capable of reading absorbance at 450 nm. 5. Non-binding 96 well U-Bottom microtiter plate for use as a transfer plate 6. Control Kit (lyophilized recombinant human ST2)- packaged separately and is available
from Critical Diagnostics (Part Number BC-1066E).
Storage Conditions:
1. Store the unopened kit refrigerated (2-8°C) upon receipt and when it is not in use, until the expiration shown on the kit label. Refer to the package label for the expiration date.
2. Keep microtiter plate in a sealed bag with desiccant to minimize exposure to damp air. 3. The microtiter plate is composed of twelve (12) strips of eight (8) wells. Only remove
from refrigerated storage the number of strips necessary to measure the desired number of samples.
4. Sufficient quantity of the various bottled reagents should be removed for performance of a specific assay. The remainder should be returned to refrigerated storage.
5. Solubilized calibrator may be stored for a maximum of seven (7) days if stored refrigerated between uses.
Specimen Collection and Storage The Presage® ST2 Assay is validated for use with human serum, EDTA-plasma, and heparin plasma only. The Presage® ST2 Assay is not validated with citrated plasma. Blood should be collected using standard collection techniques. Centrifugation and separation of the serum or plasma from the cellular components should occur as soon as possible following collection. The recommended specimen volume for the Presage® ST2 Assay is 20 µl which is sufficient volume for duplicate measurements following recommended sample dilution. If necessary, serum or plasma may be stored for future analysis. Endogenous human ST2 has been tested and shown to be stable under the following conditions: Specimen Storage and Stability
Storage Condition (temperature)
Specimen Stability
20˚C 48 hours
4˚C 7 days
-20˚C and -80˚C 18 months
CRITICAL DIAGNOSTICS Presage® ST2 Assay
Page 4 of 18
ST2 in EDTA-plasma is not significantly affected by sample freeze/thaw cycles and has been shown to be stable for 15 freeze-thaw cycles. Warnings and Precautions
Components of this assay kit that come in direct contact with human plasma or serum
specimens should be handled as biohazardous waste and disposed of according to local
regulations.
Reagent Preparation:
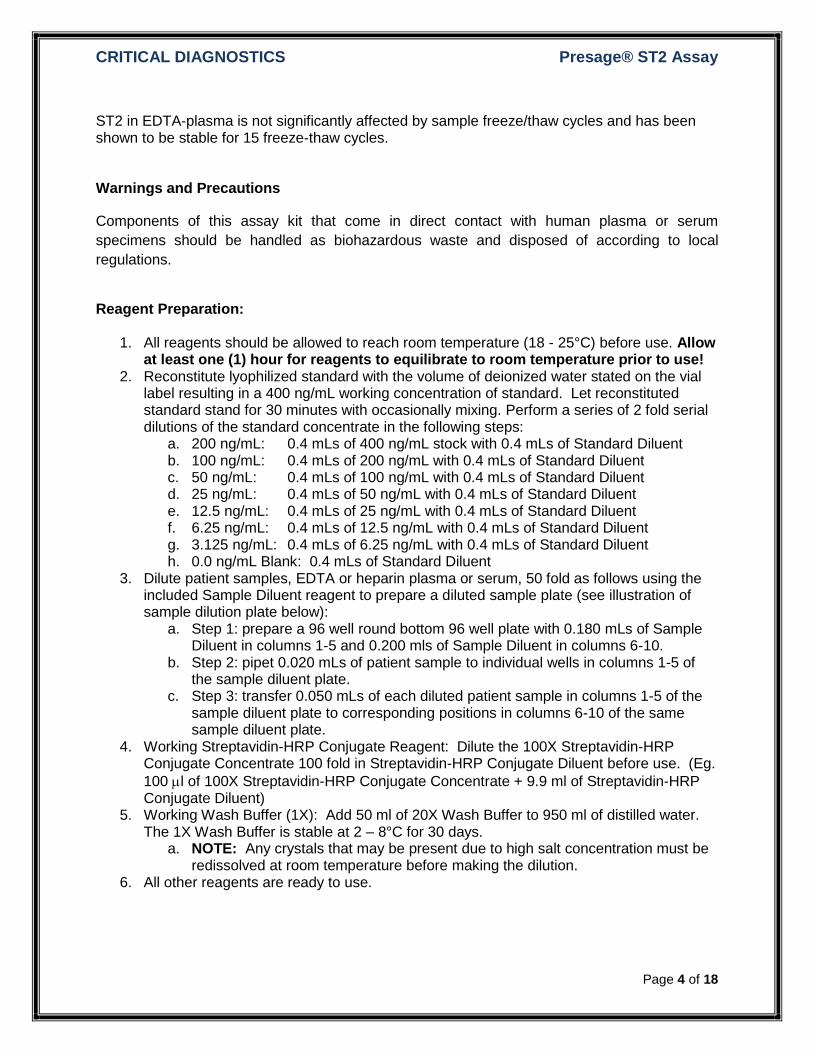
1. All reagents should be allowed to reach room temperature (18 - 25°C) before use. Allow at least one (1) hour for reagents to equilibrate to room temperature prior to use!
2. Reconstitute lyophilized standard with the volume of deionized water stated on the vial label resulting in a 400 ng/mL working concentration of standard. Let reconstituted standard stand for 30 minutes with occasionally mixing. Perform a series of 2 fold serial dilutions of the standard concentrate in the following steps:
a. 200 ng/mL: 0.4 mLs of 400 ng/mL stock with 0.4 mLs of Standard Diluent b. 100 ng/mL: 0.4 mLs of 200 ng/mL with 0.4 mLs of Standard Diluent c. 50 ng/mL: 0.4 mLs of 100 ng/mL with 0.4 mLs of Standard Diluent d. 25 ng/mL: 0.4 mLs of 50 ng/mL with 0.4 mLs of Standard Diluent e. 12.5 ng/mL: 0.4 mLs of 25 ng/mL with 0.4 mLs of Standard Diluent f. 6.25 ng/mL: 0.4 mLs of 12.5 ng/mL with 0.4 mLs of Standard Diluent g. 3.125 ng/mL: 0.4 mLs of 6.25 ng/mL with 0.4 mLs of Standard Diluent h. 0.0 ng/mL Blank: 0.4 mLs of Standard Diluent
3. Dilute patient samples, EDTA or heparin plasma or serum, 50 fold as follows using the included Sample Diluent reagent to prepare a diluted sample plate (see illustration of sample dilution plate below):
a. Step 1: prepare a 96 well round bottom 96 well plate with 0.180 mLs of Sample Diluent in columns 1-5 and 0.200 mls of Sample Diluent in columns 6-10.
b. Step 2: pipet 0.020 mLs of patient sample to individual wells in columns 1-5 of the sample diluent plate.
c. Step 3: transfer 0.050 mLs of each diluted patient sample in columns 1-5 of the sample diluent plate to corresponding positions in columns 6-10 of the same sample diluent plate.
4. Working Streptavidin-HRP Conjugate Reagent: Dilute the 100X Streptavidin-HRP Conjugate Concentrate 100 fold in Streptavidin-HRP Conjugate Diluent before use. (Eg.
100 l of 100X Streptavidin-HRP Conjugate Concentrate + 9.9 ml of Streptavidin-HRP Conjugate Diluent)
5. Working Wash Buffer (1X): Add 50 ml of 20X Wash Buffer to 950 ml of distilled water. The 1X Wash Buffer is stable at 2 – 8°C for 30 days.
a. NOTE: Any crystals that may be present due to high salt concentration must be redissolved at room temperature before making the dilution.
6. All other reagents are ready to use.
CRITICAL DIAGNOSTICS Presage® ST2 Assay
Page 5 of 18
CRITICAL DIAGNOSTICS Presage® ST2 Assay
Page 6 of 18
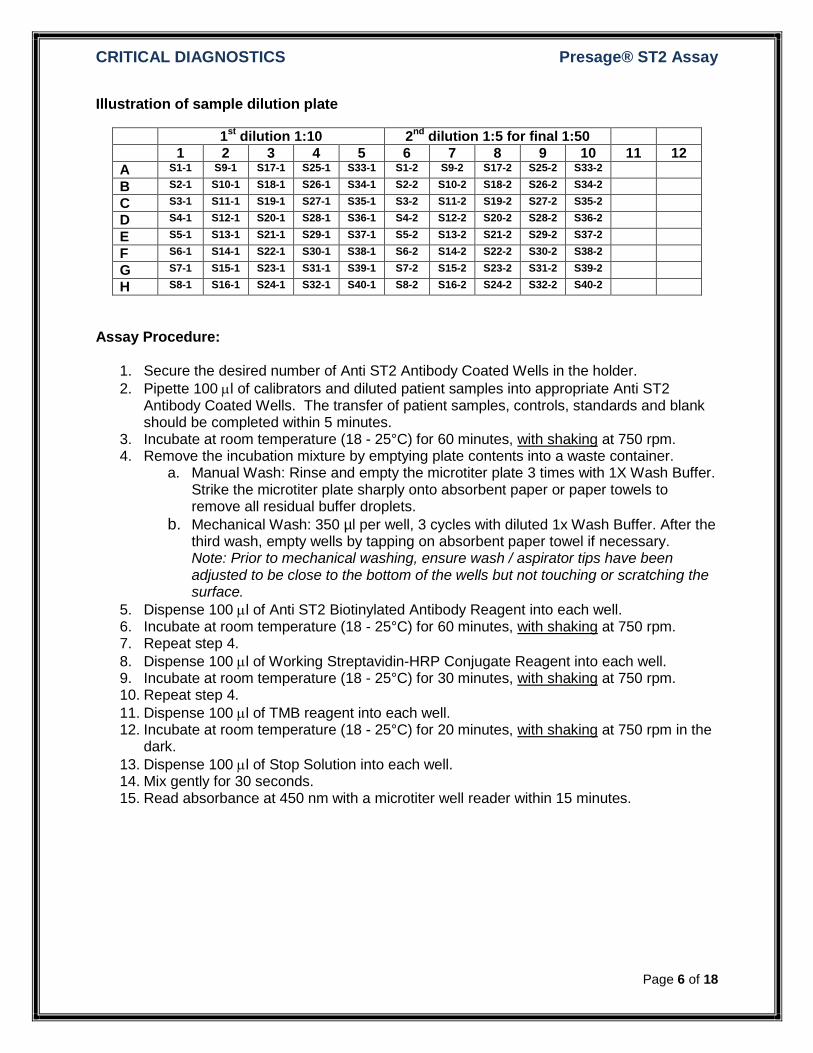
Illustration of sample dilution plate
1st
dilution 1:10 2nd
dilution 1:5 for final 1:50
1 2 3 4 5 6 7 8 9 10 11 12
A S1-1 S9-1 S17-1 S25-1 S33-1 S1-2 S9-2 S17-2 S25-2 S33-2
B S2-1 S10-1 S18-1 S26-1 S34-1 S2-2 S10-2 S18-2 S26-2 S34-2
C S3-1 S11-1 S19-1 S27-1 S35-1 S3-2 S11-2 S19-2 S27-2 S35-2
D S4-1 S12-1 S20-1 S28-1 S36-1 S4-2 S12-2 S20-2 S28-2 S36-2
E S5-1 S13-1 S21-1 S29-1 S37-1 S5-2 S13-2 S21-2 S29-2 S37-2
F S6-1 S14-1 S22-1 S30-1 S38-1 S6-2 S14-2 S22-2 S30-2 S38-2
G S7-1 S15-1 S23-1 S31-1 S39-1 S7-2 S15-2 S23-2 S31-2 S39-2
H S8-1 S16-1 S24-1 S32-1 S40-1 S8-2 S16-2 S24-2 S32-2 S40-2
Assay Procedure:
1. Secure the desired number of Anti ST2 Antibody Coated Wells in the holder.
2. Pipette 100 l of calibrators and diluted patient samples into appropriate Anti ST2 Antibody Coated Wells. The transfer of patient samples, controls, standards and blank should be completed within 5 minutes.
3. Incubate at room temperature (18 - 25°C) for 60 minutes, with shaking at 750 rpm. 4. Remove the incubation mixture by emptying plate contents into a waste container.
a. Manual Wash: Rinse and empty the microtiter plate 3 times with 1X Wash Buffer. Strike the microtiter plate sharply onto absorbent paper or paper towels to remove all residual buffer droplets.
b. Mechanical Wash: 350 µl per well, 3 cycles with diluted 1x Wash Buffer. After the third wash, empty wells by tapping on absorbent paper towel if necessary. Note: Prior to mechanical washing, ensure wash / aspirator tips have been adjusted to be close to the bottom of the wells but not touching or scratching the surface.
5. Dispense 100 l of Anti ST2 Biotinylated Antibody Reagent into each well. 6. Incubate at room temperature (18 - 25°C) for 60 minutes, with shaking at 750 rpm. 7. Repeat step 4.
8. Dispense 100 l of Working Streptavidin-HRP Conjugate Reagent into each well. 9. Incubate at room temperature (18 - 25°C) for 30 minutes, with shaking at 750 rpm. 10. Repeat step 4.
11. Dispense 100 l of TMB reagent into each well. 12. Incubate at room temperature (18 - 25°C) for 20 minutes, with shaking at 750 rpm in the
dark.
13. Dispense 100 l of Stop Solution into each well. 14. Mix gently for 30 seconds. 15. Read absorbance at 450 nm with a microtiter well reader within 15 minutes.
CRITICAL DIAGNOSTICS Presage® ST2 Assay
Page 7 of 18
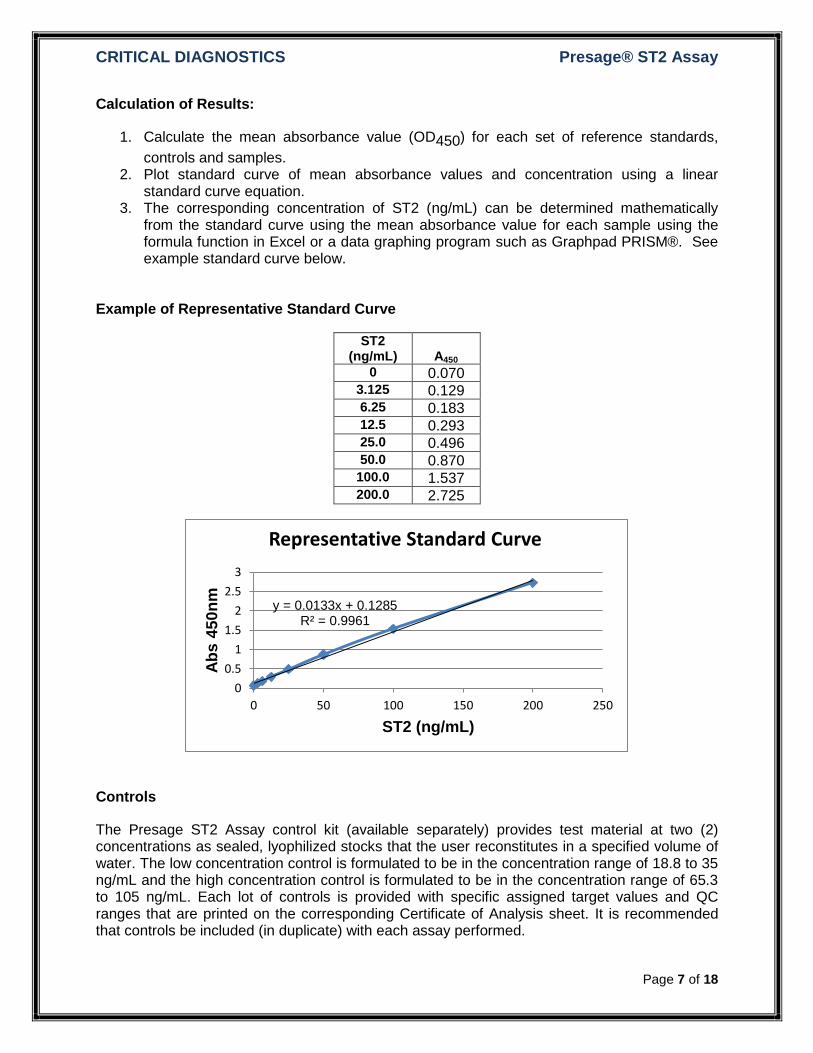
Calculation of Results:
1. Calculate the mean absorbance value (OD450) for each set of reference standards,
controls and samples. 2. Plot standard curve of mean absorbance values and concentration using a linear
standard curve equation. 3. The corresponding concentration of ST2 (ng/mL) can be determined mathematically
from the standard curve using the mean absorbance value for each sample using the formula function in Excel or a data graphing program such as Graphpad PRISM®. See example standard curve below.
Example of Representative Standard Curve
ST2 (ng/mL)
A450
0 0.070 3.125 0.129 6.25 0.183 12.5 0.293 25.0 0.496 50.0 0.870
100.0 1.537 200.0 2.725
Controls
The Presage ST2 Assay control kit (available separately) provides test material at two (2) concentrations as sealed, lyophilized stocks that the user reconstitutes in a specified volume of water. The low concentration control is formulated to be in the concentration range of 18.8 to 35 ng/mL and the high concentration control is formulated to be in the concentration range of 65.3 to 105 ng/mL. Each lot of controls is provided with specific assigned target values and QC ranges that are printed on the corresponding Certificate of Analysis sheet. It is recommended that controls be included (in duplicate) with each assay performed.
y = 0.0133x + 0.1285 R² = 0.9961
0
0.5
1
1.5
2
2.5
3
0 50 100 150 200 250
Ab
s 4
50
nm
ST2 (ng/mL)
Representative Standard Curve
CRITICAL DIAGNOSTICS Presage® ST2 Assay
Page 8 of 18
Interpretation of Results
Analytical Interpretation
When evaluating an individual assay the standard curve should be similar to the example above and results from both controls should be within the assigned QC ranges. If the either of these conditions is not satisfied the user should consider repeating the assay and evaluating potential reasons for unexpected performance.
Clinical Interpretation
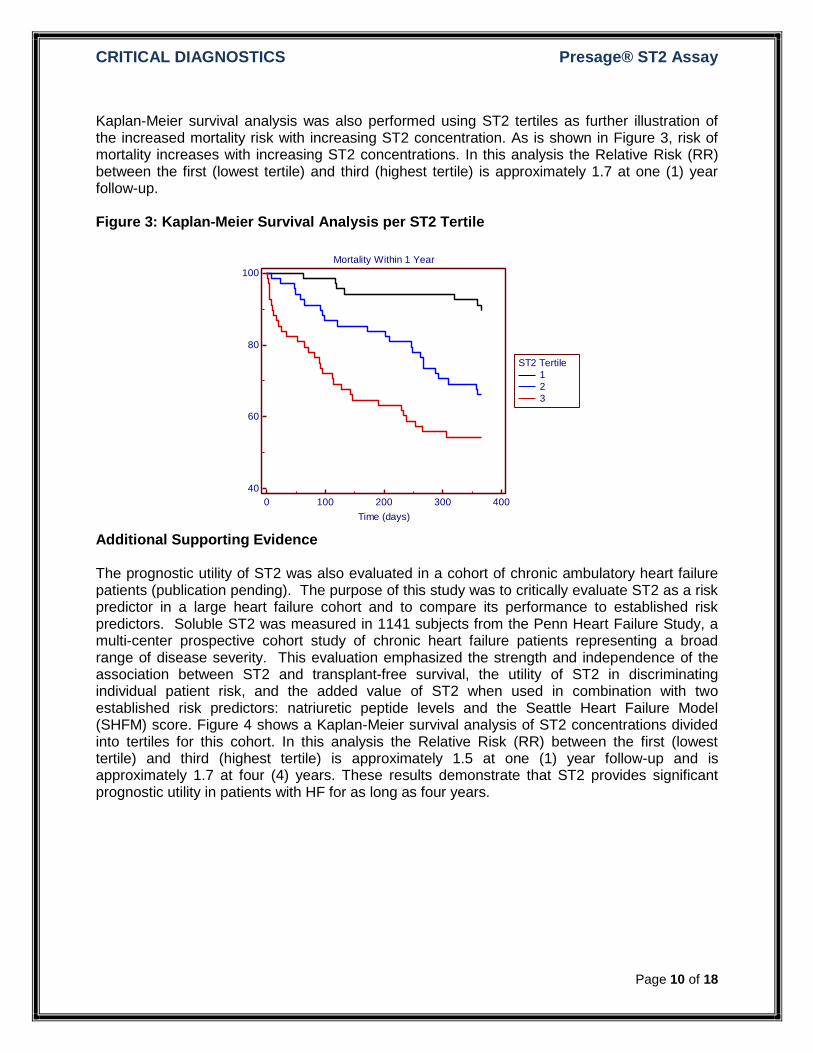
Assessment of risk of mortality or morbidity of patients with serious and life threatening diseases, such as ACS or HF, is not typically a binary phenomenon. Age for instance is a powerful predictor of mortality where risk increases with advancing age. Similarly, a patient’s risk of mortality and morbidity increases with increasing concentrations of ST2. In patients diagnosed with ACS or HF and who have ST2 concentrations >30 ng/mL (approximately the 85th percentile of normal) risk of mortality within one (1) year is greater than for patients with ST2 concentrations below this level. Further, risk of mortality increases with increasing concentrations of ST2, as illustrated in Figure 3 below, where the relative risk (RR) of mortality within 1 year is 1.7 between the 1st and 3rd tertiles. Concentrations of ST2 described in this document should only be used for reference. Specific concentrations and clinical decisions based on such concentrations must be ascertained by the institution and in the context of the patients and disease being evaluated.
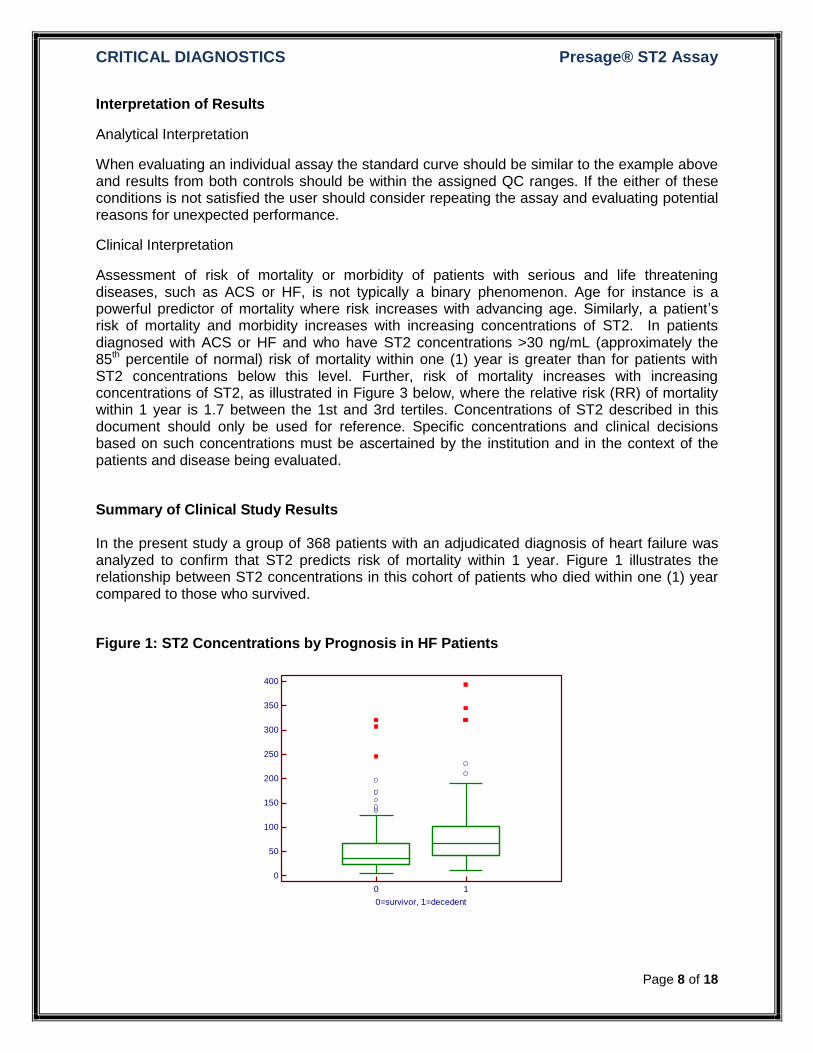
Summary of Clinical Study Results In the present study a group of 368 patients with an adjudicated diagnosis of heart failure was analyzed to confirm that ST2 predicts risk of mortality within 1 year. Figure 1 illustrates the relationship between ST2 concentrations in this cohort of patients who died within one (1) year compared to those who survived.
Figure 1: ST2 Concentrations by Prognosis in HF Patients
0
50
100
150
200
250
300
350
400
0=survivor, 1=decedent
ST
2 (
ng
/mL
)
0 1
CRITICAL DIAGNOSTICS Presage® ST2 Assay
Page 9 of 18
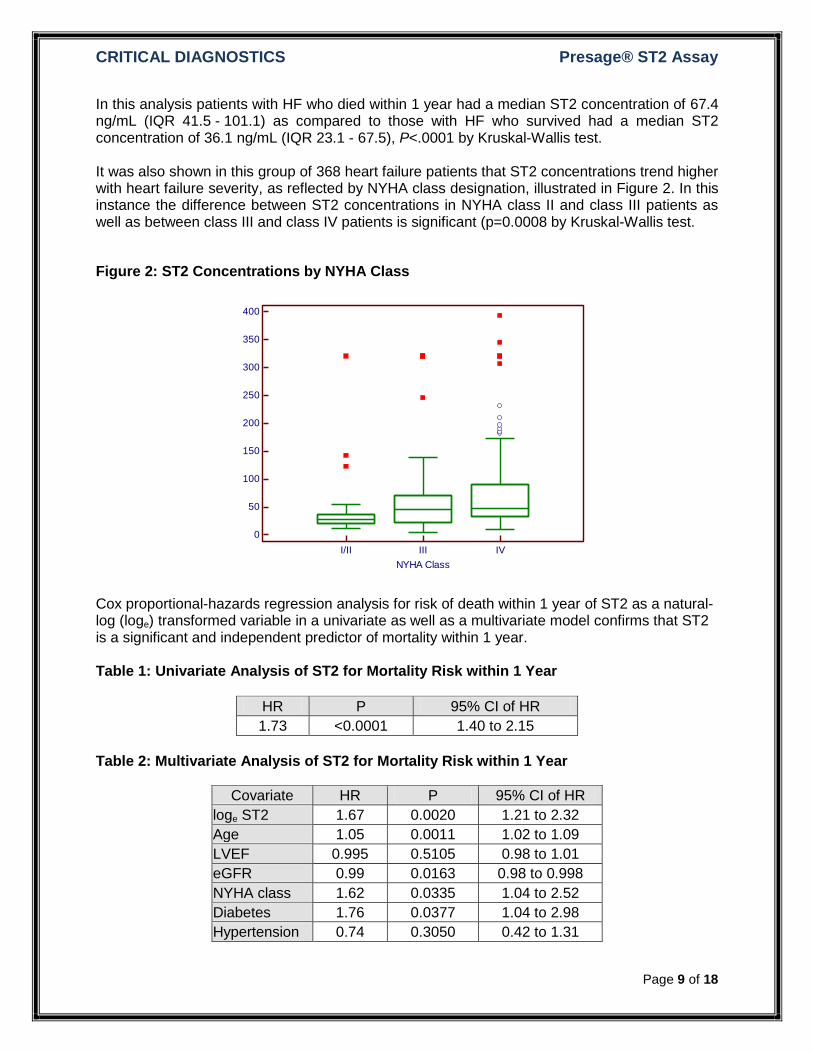
In this analysis patients with HF who died within 1 year had a median ST2 concentration of 67.4 ng/mL (IQR 41.5 - 101.1) as compared to those with HF who survived had a median ST2 concentration of 36.1 ng/mL (IQR 23.1 - 67.5), P<.0001 by Kruskal-Wallis test. It was also shown in this group of 368 heart failure patients that ST2 concentrations trend higher with heart failure severity, as reflected by NYHA class designation, illustrated in Figure 2. In this instance the difference between ST2 concentrations in NYHA class II and class III patients as well as between class III and class IV patients is significant (p=0.0008 by Kruskal-Wallis test.
Figure 2: ST2 Concentrations by NYHA Class
Cox proportional-hazards regression analysis for risk of death within 1 year of ST2 as a natural-log (loge) transformed variable in a univariate as well as a multivariate model confirms that ST2 is a significant and independent predictor of mortality within 1 year. Table 1: Univariate Analysis of ST2 for Mortality Risk within 1 Year
HR P 95% CI of HR
1.73 <0.0001 1.40 to 2.15 Table 2: Multivariate Analysis of ST2 for Mortality Risk within 1 Year
Covariate HR P 95% CI of HR
loge ST2 1.67 0.0020 1.21 to 2.32
Age 1.05 0.0011 1.02 to 1.09
LVEF 0.995 0.5105 0.98 to 1.01
eGFR 0.99 0.0163 0.98 to 0.998
NYHA class 1.62 0.0335 1.04 to 2.52
Diabetes 1.76 0.0377 1.04 to 2.98
Hypertension 0.74 0.3050 0.42 to 1.31
0
50
100
150
200
250
300
350
400
NYHA Class
ST
2 (
ng
/mL
)
I/II III IV
CRITICAL DIAGNOSTICS Presage® ST2 Assay
Page 10 of 18
Kaplan-Meier survival analysis was also performed using ST2 tertiles as further illustration of the increased mortality risk with increasing ST2 concentration. As is shown in Figure 3, risk of mortality increases with increasing ST2 concentrations. In this analysis the Relative Risk (RR) between the first (lowest tertile) and third (highest tertile) is approximately 1.7 at one (1) year follow-up. Figure 3: Kaplan-Meier Survival Analysis per ST2 Tertile
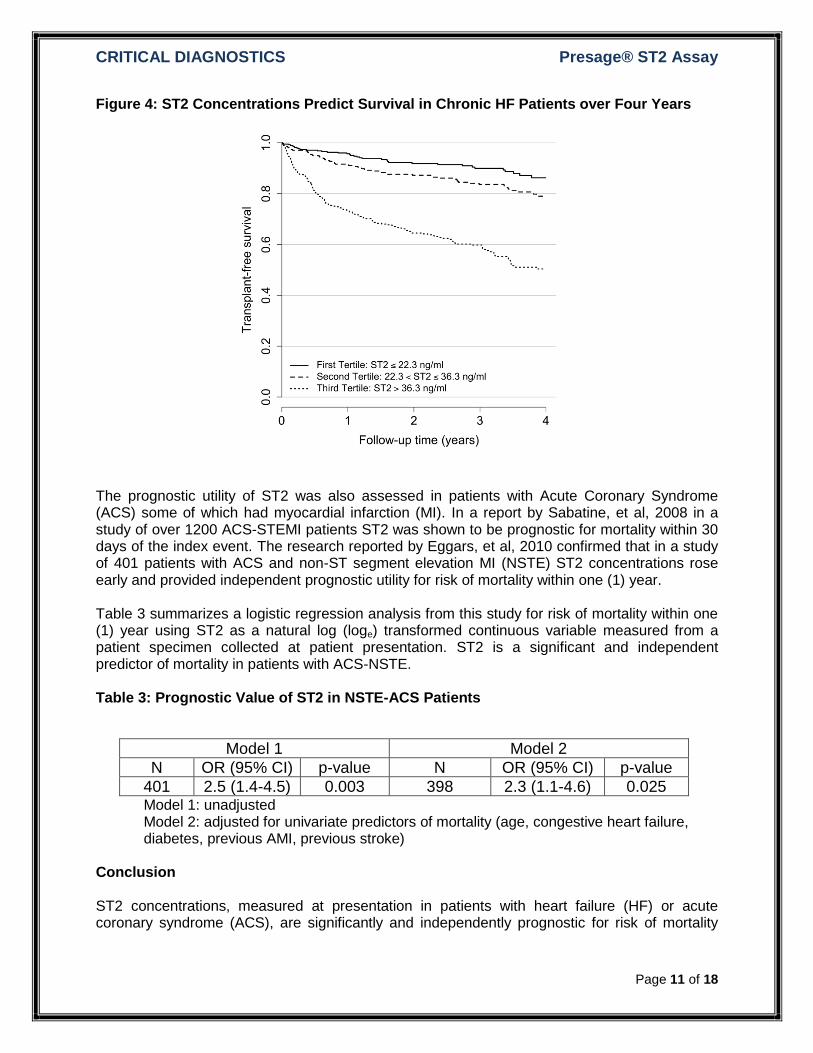
Additional Supporting Evidence The prognostic utility of ST2 was also evaluated in a cohort of chronic ambulatory heart failure patients (publication pending). The purpose of this study was to critically evaluate ST2 as a risk predictor in a large heart failure cohort and to compare its performance to established risk predictors. Soluble ST2 was measured in 1141 subjects from the Penn Heart Failure Study, a multi-center prospective cohort study of chronic heart failure patients representing a broad range of disease severity. This evaluation emphasized the strength and independence of the association between ST2 and transplant-free survival, the utility of ST2 in discriminating individual patient risk, and the added value of ST2 when used in combination with two established risk predictors: natriuretic peptide levels and the Seattle Heart Failure Model (SHFM) score. Figure 4 shows a Kaplan-Meier survival analysis of ST2 concentrations divided into tertiles for this cohort. In this analysis the Relative Risk (RR) between the first (lowest tertile) and third (highest tertile) is approximately 1.5 at one (1) year follow-up and is approximately 1.7 at four (4) years. These results demonstrate that ST2 provides significant prognostic utility in patients with HF for as long as four years.
Mortality Within 1 Year
0 100 200 300 400
40
60
80
100
Time (days)
Su
rviv
al p
rob
ab
ility (
%)
ST2 Tertile
1
2
3
CRITICAL DIAGNOSTICS Presage® ST2 Assay
Page 11 of 18
Figure 4: ST2 Concentrations Predict Survival in Chronic HF Patients over Four Years
The prognostic utility of ST2 was also assessed in patients with Acute Coronary Syndrome (ACS) some of which had myocardial infarction (MI). In a report by Sabatine, et al, 2008 in a study of over 1200 ACS-STEMI patients ST2 was shown to be prognostic for mortality within 30 days of the index event. The research reported by Eggars, et al, 2010 confirmed that in a study of 401 patients with ACS and non-ST segment elevation MI (NSTE) ST2 concentrations rose early and provided independent prognostic utility for risk of mortality within one (1) year. Table 3 summarizes a logistic regression analysis from this study for risk of mortality within one (1) year using ST2 as a natural log (loge) transformed continuous variable measured from a patient specimen collected at patient presentation. ST2 is a significant and independent predictor of mortality in patients with ACS-NSTE. Table 3: Prognostic Value of ST2 in NSTE-ACS Patients
Model 1 Model 2
N OR (95% CI) p-value N OR (95% CI) p-value
401 2.5 (1.4-4.5) 0.003 398 2.3 (1.1-4.6) 0.025 Model 1: unadjusted Model 2: adjusted for univariate predictors of mortality (age, congestive heart failure, diabetes, previous AMI, previous stroke)
Conclusion ST2 concentrations, measured at presentation in patients with heart failure (HF) or acute coronary syndrome (ACS), are significantly and independently prognostic for risk of mortality
CRITICAL DIAGNOSTICS Presage® ST2 Assay
Page 12 of 18
within one (1) year. Thus ST2 can be used as an aid in determining risk of mortality in such patients. Normal Range Reference Interval
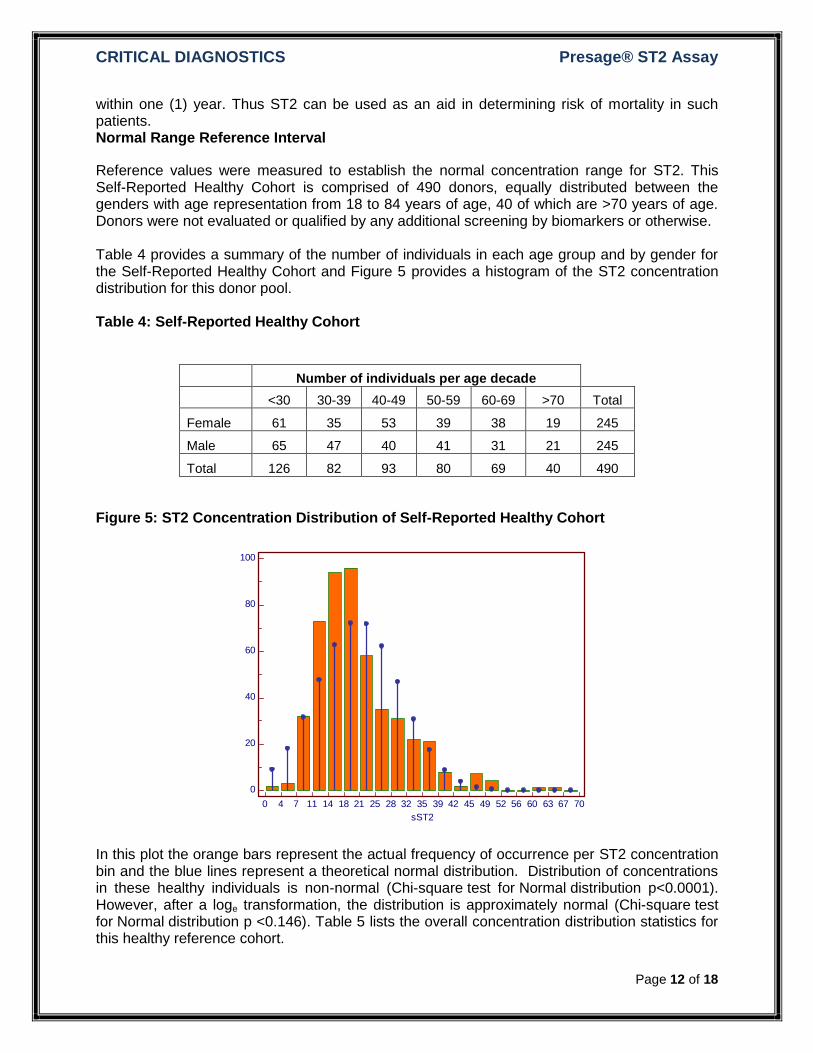
Reference values were measured to establish the normal concentration range for ST2. This Self-Reported Healthy Cohort is comprised of 490 donors, equally distributed between the genders with age representation from 18 to 84 years of age, 40 of which are >70 years of age. Donors were not evaluated or qualified by any additional screening by biomarkers or otherwise. Table 4 provides a summary of the number of individuals in each age group and by gender for the Self-Reported Healthy Cohort and Figure 5 provides a histogram of the ST2 concentration distribution for this donor pool. Table 4: Self-Reported Healthy Cohort
Number of individuals per age decade
<30 30-39 40-49 50-59 60-69 >70 Total
Female 61 35 53 39 38 19 245
Male 65 47 40 41 31 21 245
Total 126 82 93 80 69 40 490
Figure 5: ST2 Concentration Distribution of Self-Reported Healthy Cohort
In this plot the orange bars represent the actual frequency of occurrence per ST2 concentration bin and the blue lines represent a theoretical normal distribution. Distribution of concentrations in these healthy individuals is non-normal (Chi-square test for Normal distribution p<0.0001). However, after a loge transformation, the distribution is approximately normal (Chi-square test for Normal distribution p <0.146). Table 5 lists the overall concentration distribution statistics for this healthy reference cohort.
0 4 7 11 14 18 21 25 28 32 35 39 42 45 49 52 56 60 63 67 70
100
80
60
40
20
0
sST2
Fre
quency
CRITICAL DIAGNOSTICS Presage® ST2 Assay
Page 13 of 18
Table 5: ST2 Concentrations at Specific Thresholds Healthy Reference Cohort
Parameter ST2 (ng/mL) 95% CI
median 18.8 18.1 to 19.9
25th percentile 14.5 13.7 to 15.3
75th percentile 25.3 23.8 to 27.0
80th percentile 27.8 25.5 to 29.5
90th percentile 34.3 32.2 to 35.7
95th percentile 37.9 35.6 to 41.6
97.5th percentile 45.6 39.5 to 48.8
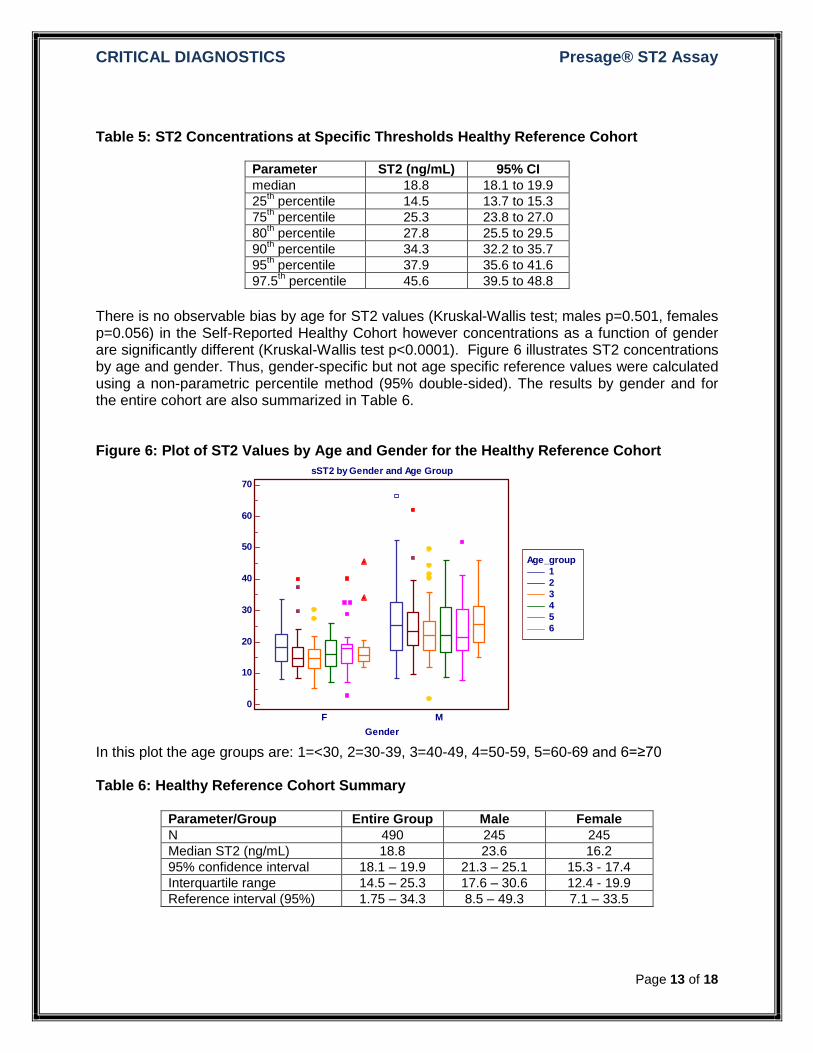
There is no observable bias by age for ST2 values (Kruskal-Wallis test; males p=0.501, females p=0.056) in the Self-Reported Healthy Cohort however concentrations as a function of gender are significantly different (Kruskal-Wallis test p<0.0001). Figure 6 illustrates ST2 concentrations by age and gender. Thus, gender-specific but not age specific reference values were calculated using a non-parametric percentile method (95% double-sided). The results by gender and for the entire cohort are also summarized in Table 6. Figure 6: Plot of ST2 Values by Age and Gender for the Healthy Reference Cohort
In this plot the age groups are: 1=<30, 2=30-39, 3=40-49, 4=50-59, 5=60-69 and 6=≥70 Table 6: Healthy Reference Cohort Summary
Parameter/Group Entire Group Male Female
N 490 245 245
Median ST2 (ng/mL) 18.8 23.6 16.2
95% confidence interval 18.1 – 19.9 21.3 – 25.1 15.3 - 17.4
Interquartile range 14.5 – 25.3 17.6 – 30.6 12.4 - 19.9
Reference interval (95%) 1.75 – 34.3 8.5 – 49.3 7.1 – 33.5
Age_group
1
2
3
4
5
6
sST2 by Gender and Age Group
70
60
50
40
30
20
10
0
Gender
sS
T2 (
ng
/mL
)
F M
CRITICAL DIAGNOSTICS Presage® ST2 Assay
Page 14 of 18
Based on this analysis the 95th percentile reference interval in normal, healthy males is 8.5-49.3 ng/mL (median 23.6 ng/mL), in females is 7.1-33.5 ng/mL (median 16.2 ng/mL) and in the entire group is 1.75-34.3 (median 18.8 ng/mL). Precision
Precision evaluation of the assay was performed according to the Clinical and Laboratory Standards Institute (CLSI) guideline EP5-A. Four (4) pooled patient plasma samples were aliquoted into twenty 1.5 mL plastic tubes for each concentration level and frozen at -80°C. These samples were analyzed in duplicate in one run per day for 20 days. Within-run and total analytical imprecision (CVA) was calculated with the CLSI single-run precision evaluation test. The assay had a within-run CVA of 6.5% and a total CVA of 9.1% at a mean concentration of 16.9 ng/mL (low), a within-run CVA of 3.4% and a total CVA of 5.5% at a mean concentration of 33.1 ng/mL (medium-1), a within-run CVA of 3.8% and a total CVA of 6.3% at a mean concentration of 68.7ng/mL (medium-2) and ), a within-run CVA of 2.4% and a total CVA of 4.8% at a mean concentration of 159.1 ng/mL (high). Table 7: Precision Analysis Summary
Within Run Total
Sample Mean ST2 (ng/mL)
SD CV SD CV
1 16.9 1.09 6.5% 1.54 9.1%
2 33.1 1.12 3.4% 1.83 5.5%
3 68.7 2.64 3.8% 4.32 6.3%
4 159.1 3.77 2.4% 7.68 4.8%
The assay does not exhibit any precision bias through the expected clinically significant concentration range. Sensitivity Sensitivity limits were determined per CLSI EP17-A. To determine the limit of blank (LoB) a minimum of 60 replicates of the calibrator diluent was analyzed over 4 days, with at least 15 replicates per day. To determine the limit of detection (LoD) four (4) unique plasma samples previously determined to have low sST2 concentrations were selected. Each was measured over four (4) consecutive days with 15 replicate measurements per day. To determine the LoQ the samples from the LoD analysis were used to estimate bias and imprecision. The equation used to calculate LoQ is:
LoQ = bias + 2*SDs
Four (4) additional samples in the same low concentration range were used to calculate the LoQ. Table 8 summarizes the values for LoB, LoD and LoQ. Table 8: Summary of Analytical Determinations
Parameter Value
Limit of Blank (LoB) 0.00 ng/mL
CRITICAL DIAGNOSTICS Presage® ST2 Assay
Page 15 of 18
Limit of Detection (LoD) 1.31
Limit of Quantitation (LoQ) 2.35
The LoQ value is slight greater than the 5th percentile of the normal reference concentration, 1.71 ng/mL, and is slightly lower than the lowest concentration calibrator recommended for the standard curve, 3.125 ng/mL.
Linearity
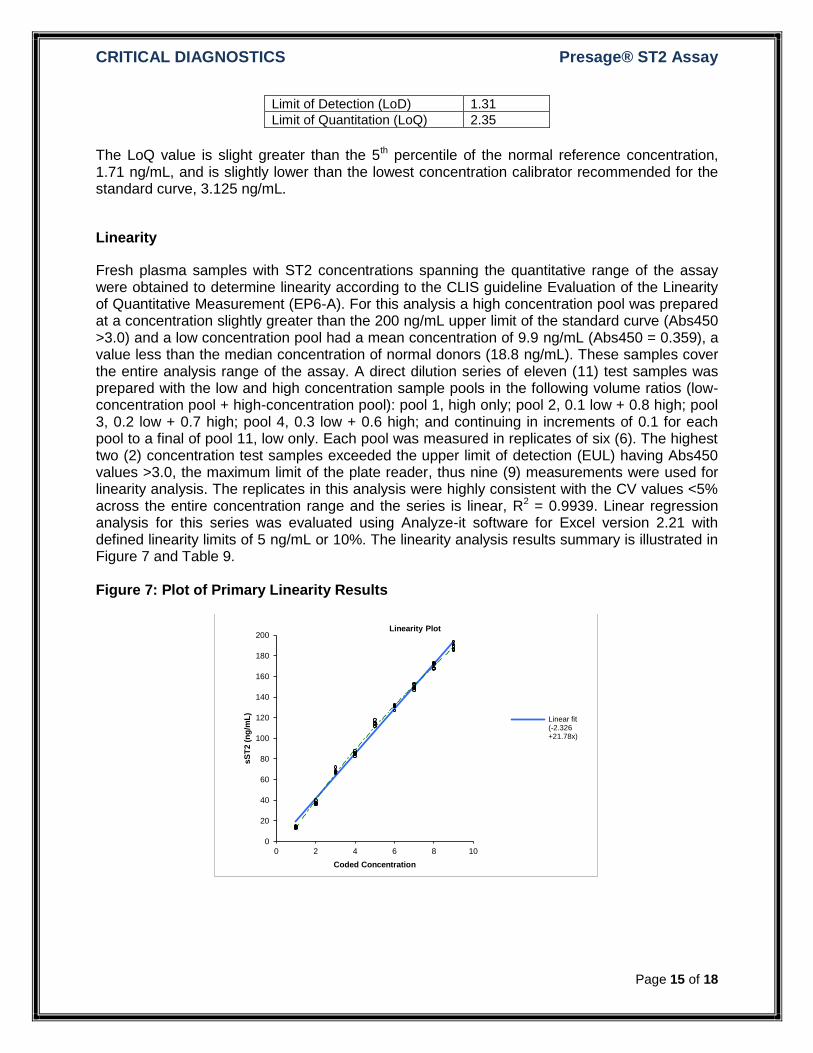
Fresh plasma samples with ST2 concentrations spanning the quantitative range of the assay were obtained to determine linearity according to the CLIS guideline Evaluation of the Linearity of Quantitative Measurement (EP6-A). For this analysis a high concentration pool was prepared at a concentration slightly greater than the 200 ng/mL upper limit of the standard curve (Abs450 >3.0) and a low concentration pool had a mean concentration of 9.9 ng/mL (Abs450 = 0.359), a value less than the median concentration of normal donors (18.8 ng/mL). These samples cover the entire analysis range of the assay. A direct dilution series of eleven (11) test samples was prepared with the low and high concentration sample pools in the following volume ratios (low-concentration pool + high-concentration pool): pool 1, high only; pool 2, 0.1 low + 0.8 high; pool 3, 0.2 low + 0.7 high; pool 4, 0.3 low + 0.6 high; and continuing in increments of 0.1 for each pool to a final of pool 11, low only. Each pool was measured in replicates of six (6). The highest two (2) concentration test samples exceeded the upper limit of detection (EUL) having Abs450 values >3.0, the maximum limit of the plate reader, thus nine (9) measurements were used for linearity analysis. The replicates in this analysis were highly consistent with the CV values <5% across the entire concentration range and the series is linear, R2 = 0.9939. Linear regression analysis for this series was evaluated using Analyze-it software for Excel version 2.21 with defined linearity limits of 5 ng/mL or 10%. The linearity analysis results summary is illustrated in Figure 7 and Table 9. Figure 7: Plot of Primary Linearity Results
0
20
40
60
80
100
120
140
160
180
200
0 2 4 6 8 10
sS
T2 (
ng
/mL
)
Coded Concentration
Linearity Plot
Linear fit(-2.326+21.78x)
CRITICAL DIAGNOSTICS Presage® ST2 Assay
Page 16 of 18
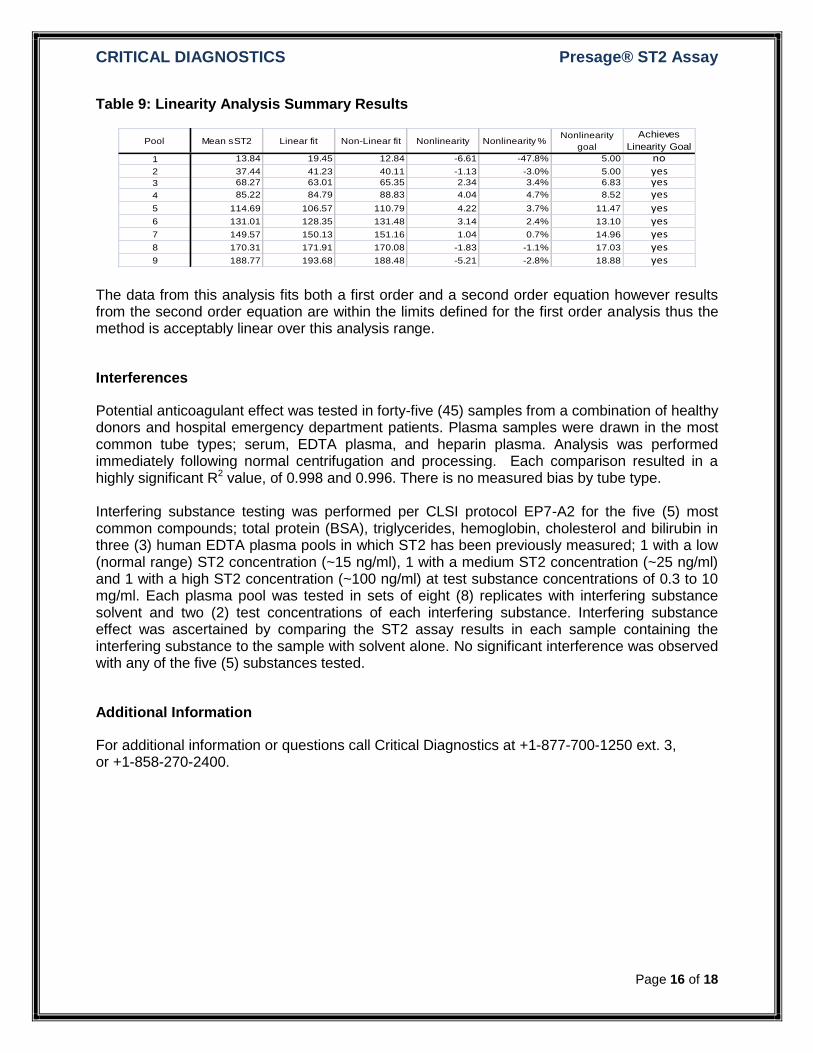
Table 9: Linearity Analysis Summary Results
The data from this analysis fits both a first order and a second order equation however results from the second order equation are within the limits defined for the first order analysis thus the method is acceptably linear over this analysis range.
Interferences
Potential anticoagulant effect was tested in forty-five (45) samples from a combination of healthy donors and hospital emergency department patients. Plasma samples were drawn in the most common tube types; serum, EDTA plasma, and heparin plasma. Analysis was performed immediately following normal centrifugation and processing. Each comparison resulted in a highly significant R2 value, of 0.998 and 0.996. There is no measured bias by tube type. Interfering substance testing was performed per CLSI protocol EP7-A2 for the five (5) most common compounds; total protein (BSA), triglycerides, hemoglobin, cholesterol and bilirubin in three (3) human EDTA plasma pools in which ST2 has been previously measured; 1 with a low (normal range) ST2 concentration (~15 ng/ml), 1 with a medium ST2 concentration (~25 ng/ml) and 1 with a high ST2 concentration (~100 ng/ml) at test substance concentrations of 0.3 to 10 mg/ml. Each plasma pool was tested in sets of eight (8) replicates with interfering substance solvent and two (2) test concentrations of each interfering substance. Interfering substance effect was ascertained by comparing the ST2 assay results in each sample containing the interfering substance to the sample with solvent alone. No significant interference was observed with any of the five (5) substances tested.
Additional Information
For additional information or questions call Critical Diagnostics at +1-877-700-1250 ext. 3, or +1-858-270-2400.
Pool Mean sST2 Linear fit Non-Linear fit Nonlinearity Nonlinearity %Nonlinearity
goal
Achieves
Linearity Goal
1 13.84 19.45 12.84 -6.61 -47.8% 5.00 no2 37.44 41.23 40.11 -1.13 -3.0% 5.00 yes3 68.27 63.01 65.35 2.34 3.4% 6.83 yes4 85.22 84.79 88.83 4.04 4.7% 8.52 yes
5 114.69 106.57 110.79 4.22 3.7% 11.47 yes6 131.01 128.35 131.48 3.14 2.4% 13.10 yes7 149.57 150.13 151.16 1.04 0.7% 14.96 yes8 170.31 171.91 170.08 -1.83 -1.1% 17.03 yes9 188.77 193.68 188.48 -5.21 -2.8% 18.88 yes
CRITICAL DIAGNOSTICS Presage® ST2 Assay
Page 17 of 18
References
1. Rosamond W, Flegal K, Furie K, Go A, Greenlund K, Haase N, Hailpern S, H M, Howard V, Kissela B, Kittner S, Lloyd-Jones D, McDermott M, Meigs J, Moy C, Nichol G, O’Donnell C, Roger V, Sorlie P, Steinberger J, Thom T, Wilson M, Hong Y. Heart Disease and Stroke Statistics – 2008 Update. Circulation 2008;117:e25-e146.
2. Januzzi JL Jr, Peacock WF, Maisel AS, Chae CU, Jesse RL, Baggish AL, O'Donoghue M, Sakhuja R, Chen AA, van Kimmenade RR, Lewandrowski KB, Lloyd-Jones DM, Wu AH. Measurement of the interleukin family member ST2 in patients with acute dyspnea: results from the PRIDE (Pro-Brain Natriuretic Peptide Investigation of Dyspnea in the Emergency Department) study. J Am Coll Cardiol. 2007 Aug 14;50(7):607-13
3. Mueller T, Dieplinger B, Gegenhuber A, Poelz W, Pacher R, Haltmayer M. Increased plasma concentrations of soluble ST2 are predictive for one-year mortality in patients with acute destabilized heart failure. Clin Chem 2008;54:752-6.
4. Rehman, S, Mueller T, Januzzi JL Jr. Characteristics of the Novel Interleukin Family Biomarker ST2 in Patients with Acute Heart Failure. JACC 2008;52(18):1458-1465.
5. Dieplinger B, Januzzi J, Steinmair M, Gabriel C, Poelz W, Haltmayer M, Mueller T. Analytical and Clinical Evaluation of a Novel High-Sensitivity Assay for Measurement of Soluble ST2 in Human Plasma – The Presage™ ST2 Assay. Clinica Chemica Acta. 2009;409:33-40.
6. Ky B, French B, McCloskey K, Rame JE, McIntosh E, Shahi P, Dries D, Tang W, Wu A, Fang J, Boxer R, Sweitzer N, Levy W, Goldberg L, Jessup M Cappola T. High-Sensitivity ST2 for Prediction of Adverse Outcomes in Chronic Heart Failure. CircHF. 2010 (publication pending)
7. Sabatine MS, Morrow DA, Higgins LJ, MacGillivray C, Guo W, Bode C, Rifai N, Cannon CP, Gerszten RE, Lee RT. Complementary Roles for Biomarkers of Biomechanical Strain ST2 and N-terminal Prohormone B-type Natriuretic Peptide in Patients with ST-elevation Myocardial Infarction. Circulation. 2008;117(15):1936-44.
8. Eggers KM, Armstrong PW, Califf RM, Simoons ML, Venge P, Wallentin L, James SK. ST2 and mortality in non-ST-segment elevation acute coronary syndrome. Am Heart J. 2010 May;159(5):788-94.
CRITICAL DIAGNOSTICS Presage® ST2 Assay
Page 18 of 18