Embed Size (px)
Citation preview
Advancing Equity-Minded Student Success through an Institutional Strategy to Utilize Existing Student Data
Dr. Lucas Schalewski, Director, Assessment & Research
Dr. Kendra Thompson-Dyck, Sr. Research Analyst, Assessment and Research
Office of the Provost, University of Arizona
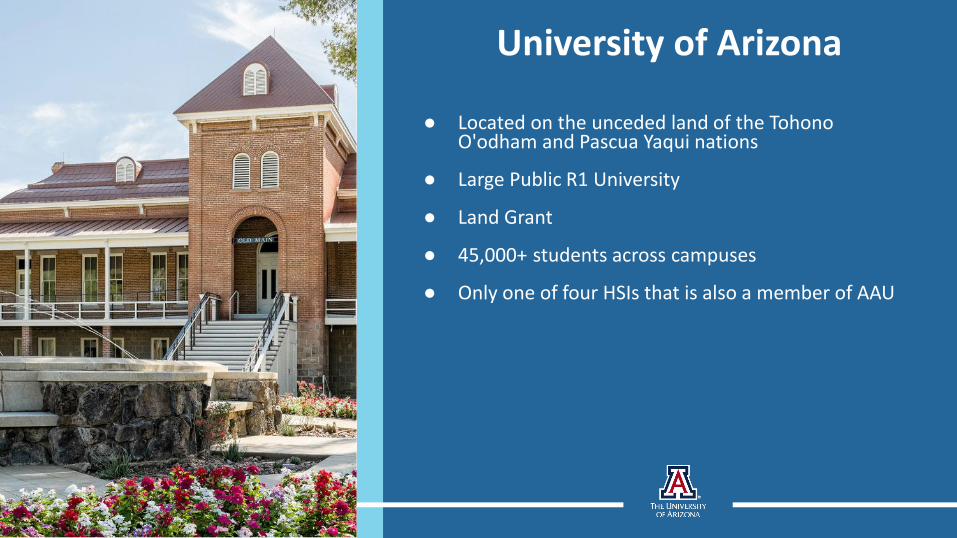
University of Arizona
● Located on the unceded land of the Tohono O'odham and Pascua Yaqui nations
● Large Public R1 University
● Land Grant
● 45,000+ students across campuses
● Only one of four HSIs that is also a member of AAU
The Student Data Insights Strategy Team hosts equity-minded discussions
with University of Arizona student leaders, faculty, staff, and administration
centered on data to better understand and support the student journey.
Data-informed insights are presented with recommendations to inform the
development of policy, practices, and services that enhance the student
experience and their success.
Student Data Insights Strategy Team
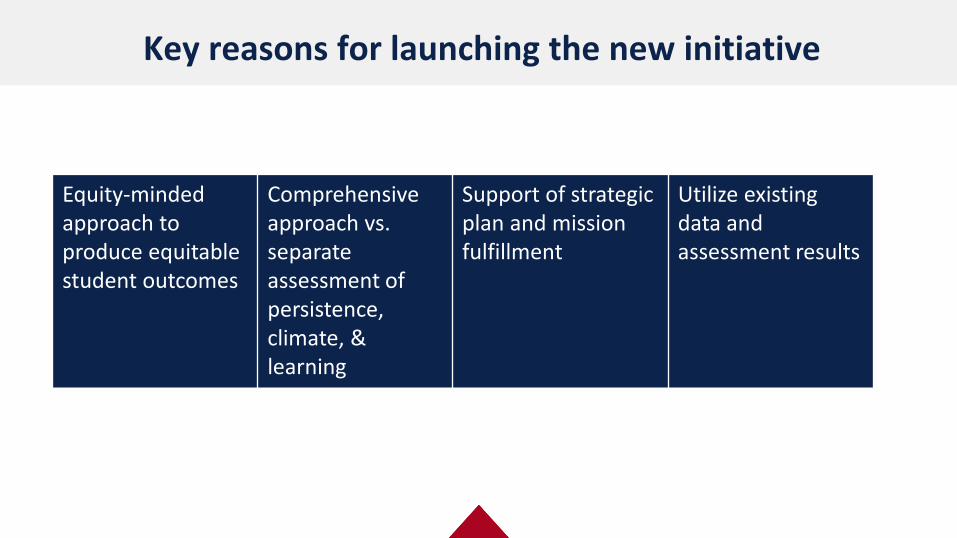
Equity-minded approach to produce equitable student outcomes
Comprehensive approach vs. separate assessment of persistence, climate, & learning
Support of strategic plan and mission fulfillment
Utilize existing data and assessment results
Key reasons for launching the new initiative
• Identify a student issue, experience, or population each year informed by relevancy, timeliness of data, and aligned to strategic plan and values
• Team members are identified based on topic being examined
• Intentionally involve students (and faculty in second year)
• Year-long methodological process to triangulate insights, contextualize findings, and share and act on results
Student Data Insights Strategy Team Key Components
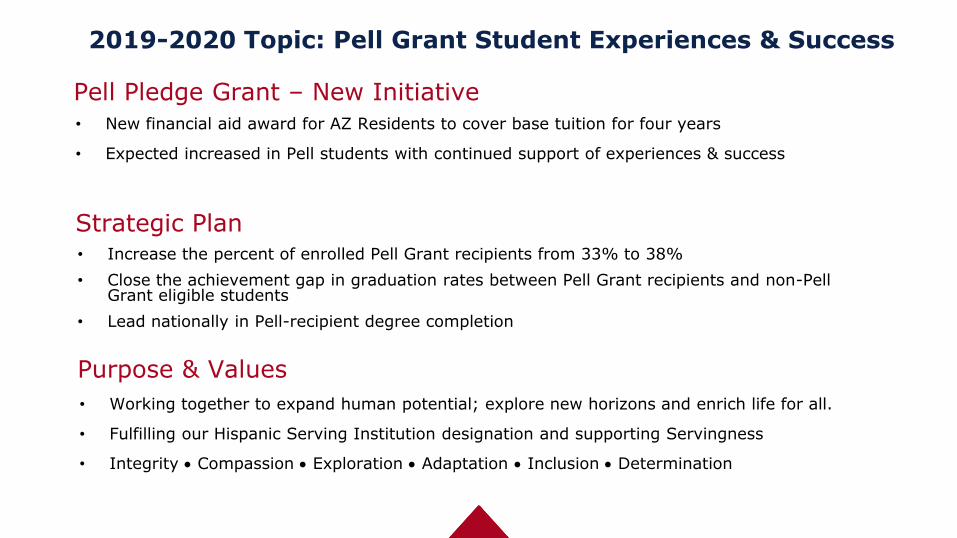
2019-2020 Topic: Pell Grant Student Experiences & Success
6
• New financial aid award for AZ Residents to cover base tuition for four years
• Expected increased in Pell students with continued support of experiences & success
Pell Pledge Grant – New Initiative
• Increase the percent of enrolled Pell Grant recipients from 33% to 38%
• Close the achievement gap in graduation rates between Pell Grant recipients and non-Pell Grant eligible students
• Lead nationally in Pell-recipient degree completion
Strategic Plan
• Working together to expand human potential; explore new horizons and enrich life for all.
• Fulfilling our Hispanic Serving Institution designation and supporting Servingness
• Integrity • Compassion • Exploration • Adaptation • Inclusion • Determination
Purpose & Values
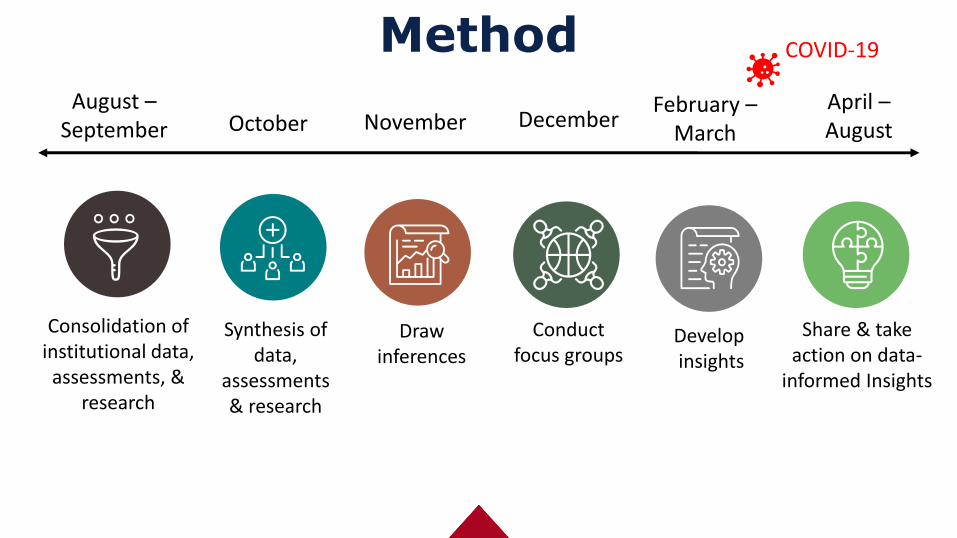
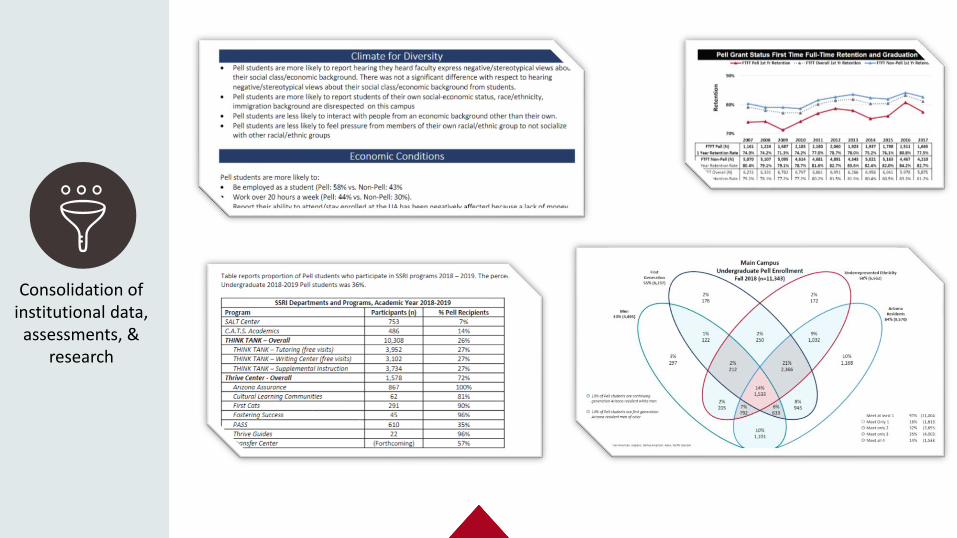
Consolidation of institutional data,
assessments, & research
Synthesis of data,
assessments & research
Draw inferences
Share & take action on data-
informed Insights
Developinsights
Method
Conduct focus groups
August –September
April –AugustOctober November December
February –March
COVID-19
8
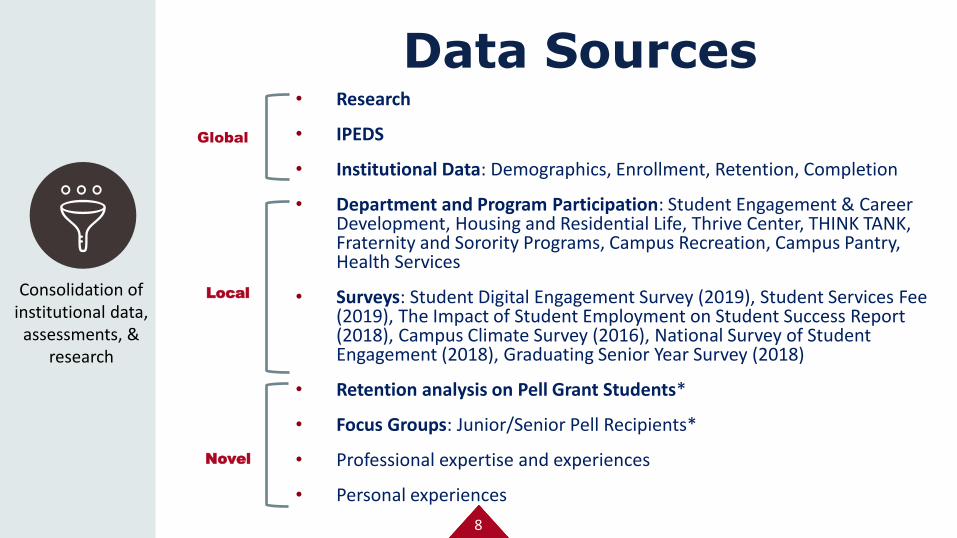
Data Sources • Research
• IPEDS
• Institutional Data: Demographics, Enrollment, Retention, Completion
• Department and Program Participation: Student Engagement & Career Development, Housing and Residential Life, Thrive Center, THINK TANK, Fraternity and Sorority Programs, Campus Recreation, Campus Pantry, Health Services
• Surveys: Student Digital Engagement Survey (2019), Student Services Fee (2019), The Impact of Student Employment on Student Success Report (2018), Campus Climate Survey (2016), National Survey of Student Engagement (2018), Graduating Senior Year Survey (2018)
• Retention analysis on Pell Grant Students*
• Focus Groups: Junior/Senior Pell Recipients*
• Professional expertise and experiences
• Personal experiences
Consolidation of institutional data,
assessments, & research
Global
Local
Novel
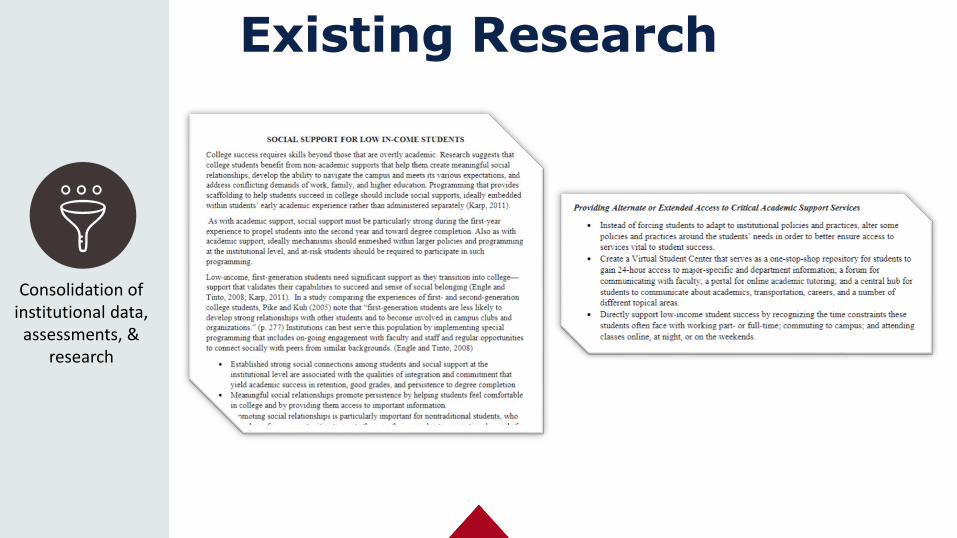
Existing Research
Consolidation of institutional data,
assessments, & research
Consolidation of institutional data,
assessments, & research
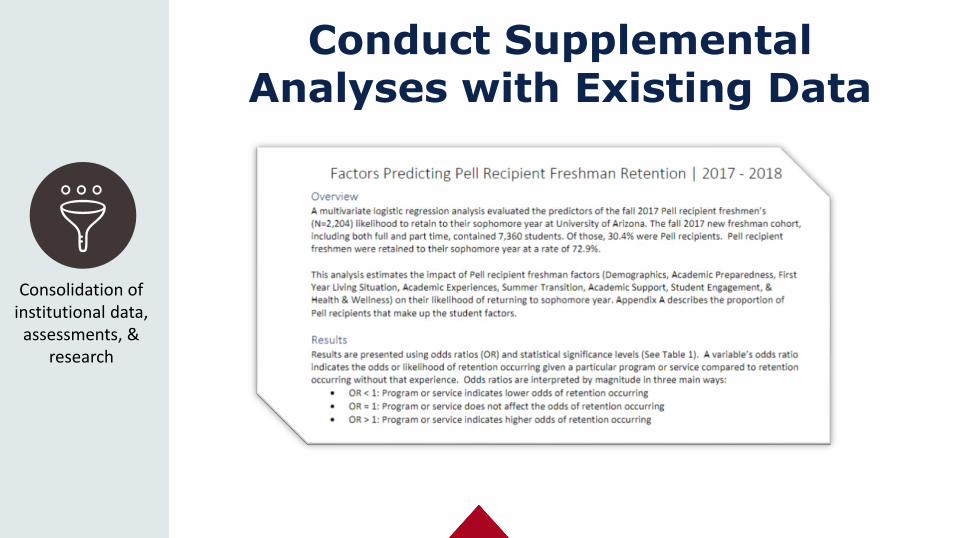
Conduct Supplemental Analyses with Existing Data
Consolidation of institutional data,
assessments, & research
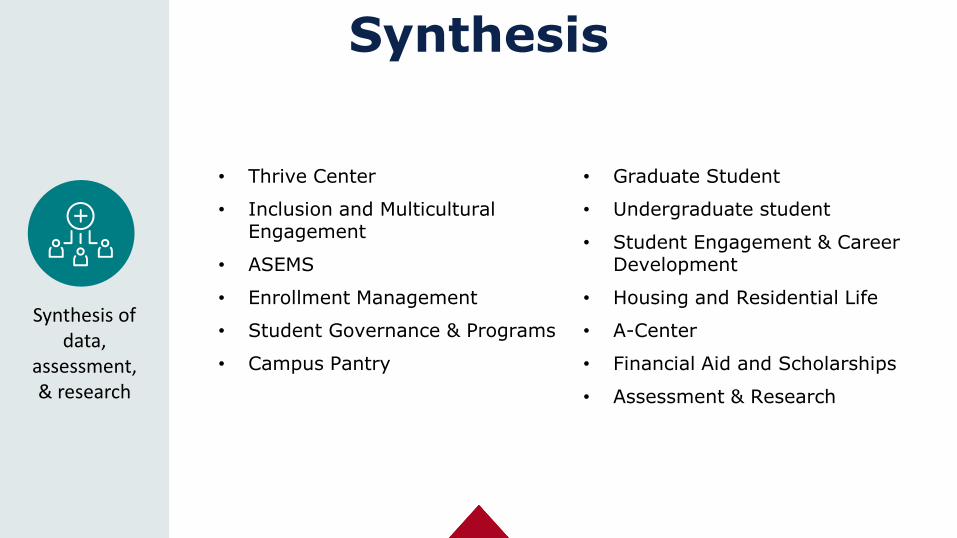
Synthesis
• Thrive Center
• Inclusion and Multicultural Engagement
• ASEMS
• Enrollment Management
• Student Governance & Programs
• Campus Pantry
• Graduate Student
• Undergraduate student
• Student Engagement & Career Development
• Housing and Residential Life
• A-Center
• Financial Aid and Scholarships
• Assessment & Research
Synthesis of data,
assessment, & research
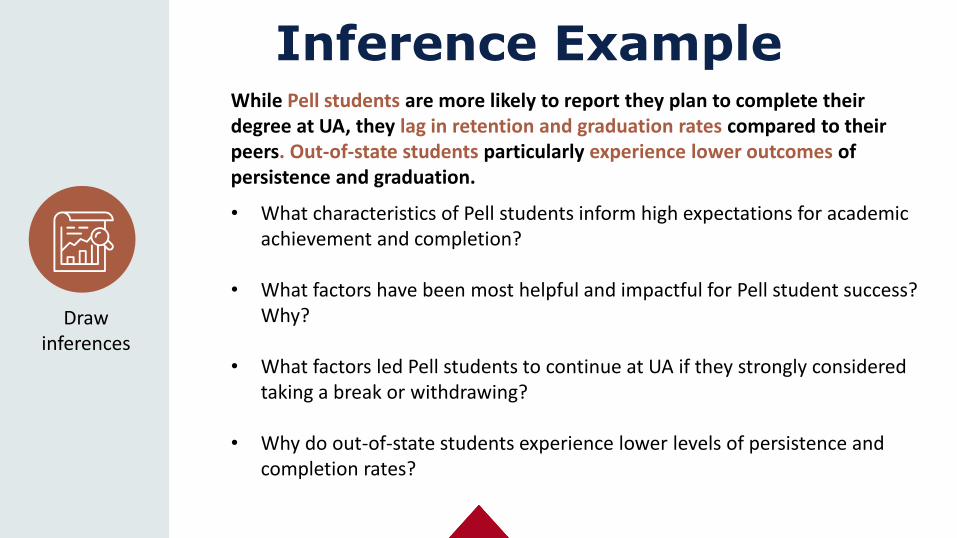
Inference ExampleWhile Pell students are more likely to report they plan to complete their degree at UA, they lag in retention and graduation rates compared to their peers. Out-of-state students particularly experience lower outcomes of persistence and graduation.
• What characteristics of Pell students inform high expectations for academic achievement and completion?
• What factors have been most helpful and impactful for Pell student success? Why?
• What factors led Pell students to continue at UA if they strongly considered taking a break or withdrawing?
• Why do out-of-state students experience lower levels of persistence and completion rates?
Draw inferences
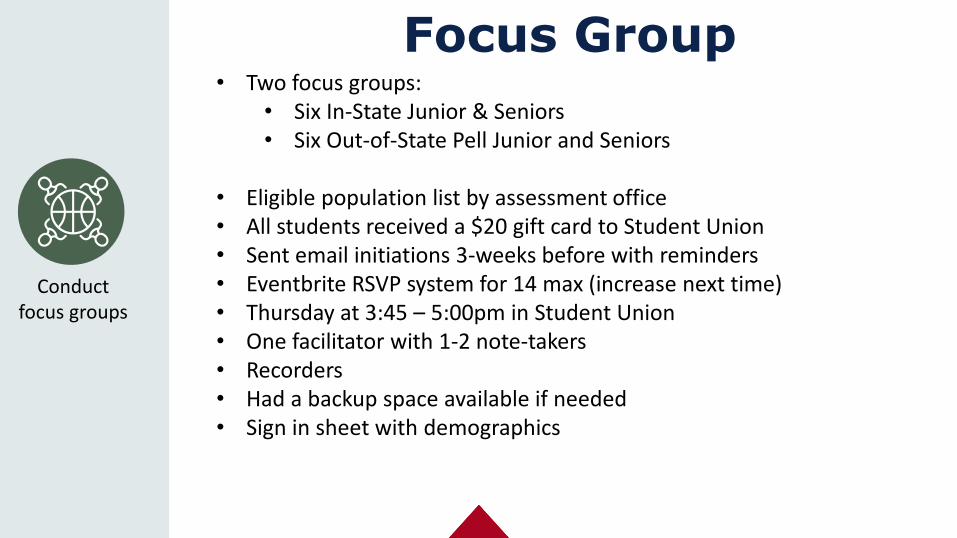
Focus Group • Two focus groups:
• Six In-State Junior & Seniors• Six Out-of-State Pell Junior and Seniors
• Eligible population list by assessment office• All students received a $20 gift card to Student Union• Sent email initiations 3-weeks before with reminders• Eventbrite RSVP system for 14 max (increase next time)• Thursday at 3:45 – 5:00pm in Student Union• One facilitator with 1-2 note-takers• Recorders• Had a backup space available if needed • Sign in sheet with demographics
Conduct focus groups
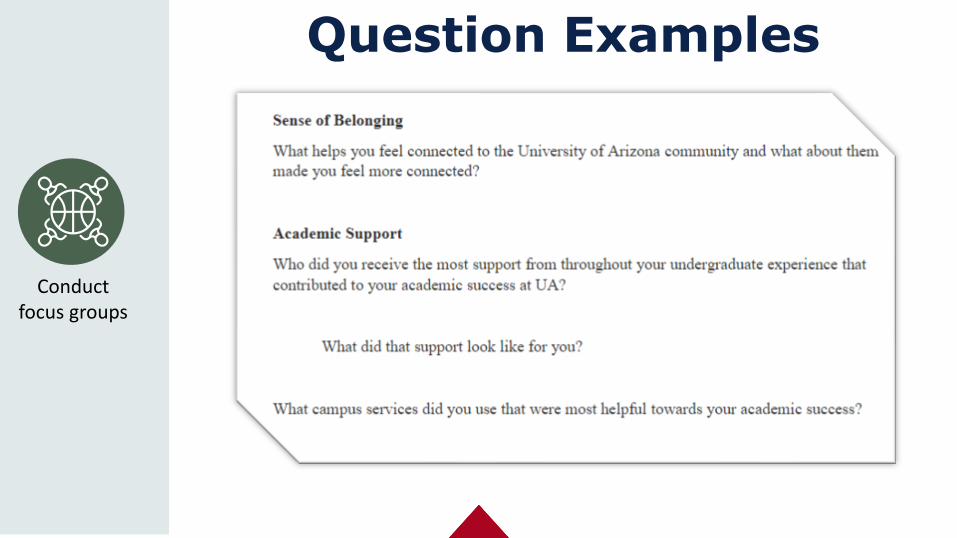
Question Examples
Conduct focus groups
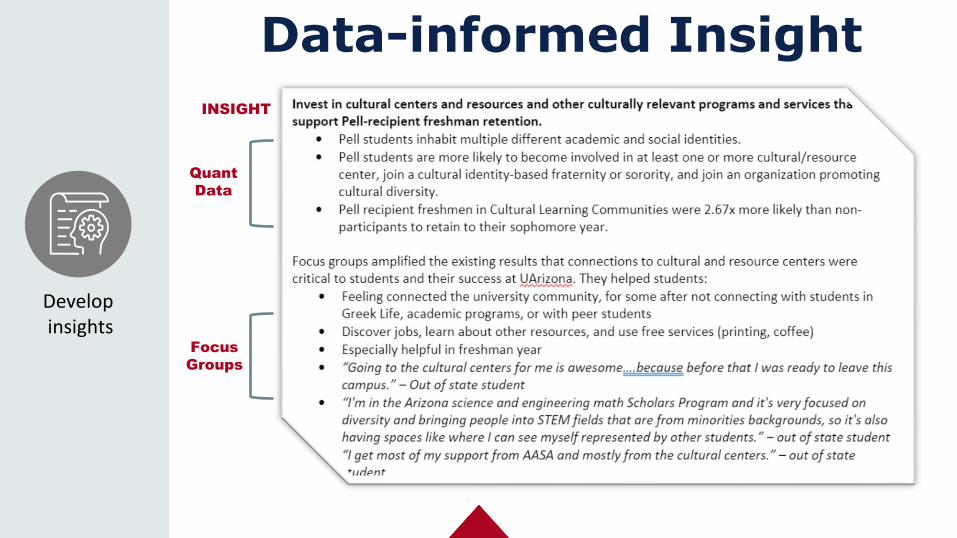
Data-informed Insight
Developinsights
Quant
Data
Focus
Groups
INSIGHT
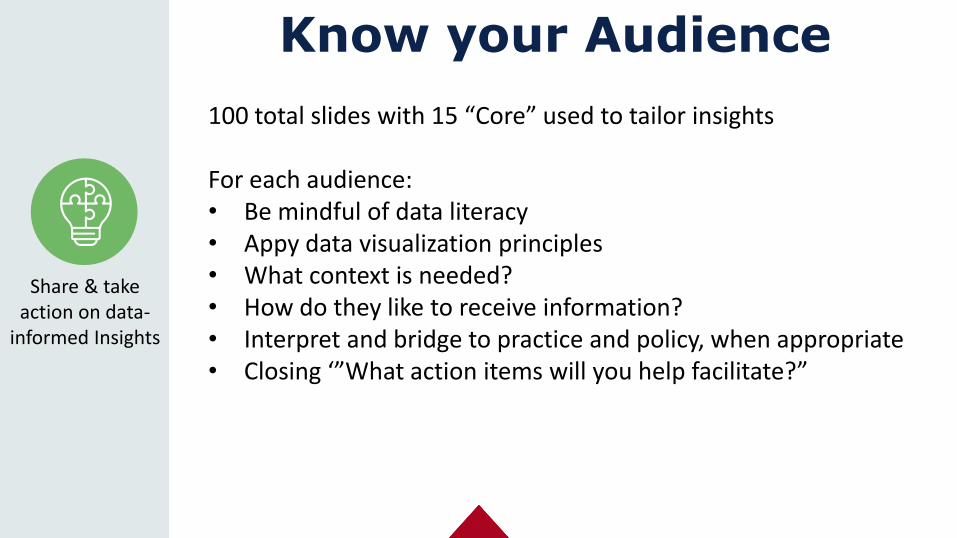
Know your Audience
100 total slides with 15 “Core” used to tailor insights
For each audience:• Be mindful of data literacy• Appy data visualization principles• What context is needed?• How do they like to receive information?• Interpret and bridge to practice and policy, when appropriate• Closing ‘”What action items will you help facilitate?”
Share & take action on data-
informed Insights
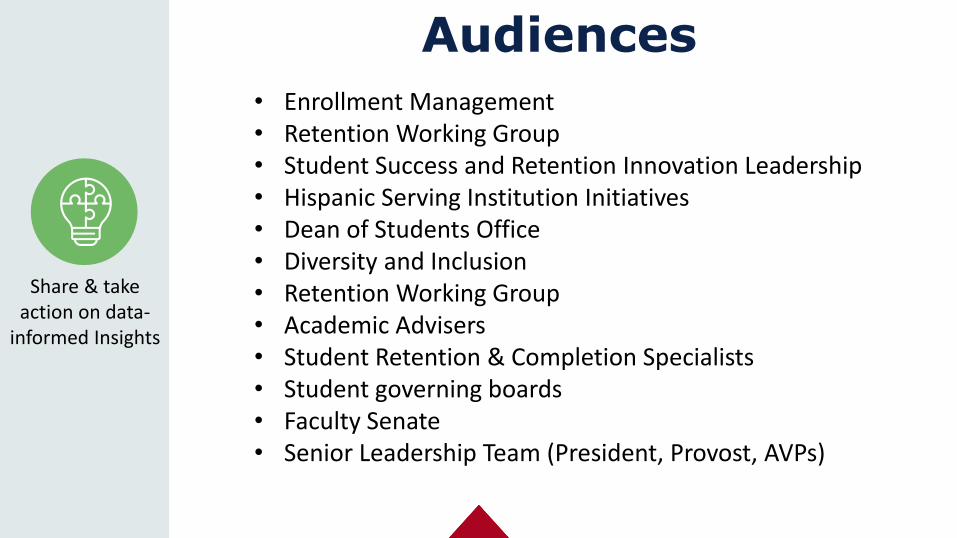
Audiences • Enrollment Management• Retention Working Group• Student Success and Retention Innovation Leadership • Hispanic Serving Institution Initiatives• Dean of Students Office • Diversity and Inclusion • Retention Working Group • Academic Advisers• Student Retention & Completion Specialists • Student governing boards• Faculty Senate• Senior Leadership Team (President, Provost, AVPs)
Share & take action on data-
informed Insights
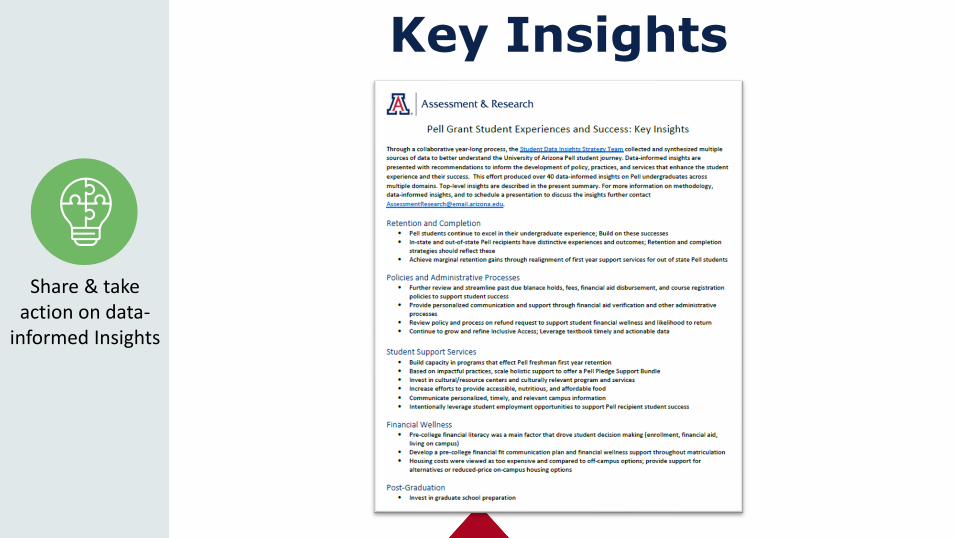
Key Insights
Share & take action on data-
informed Insights
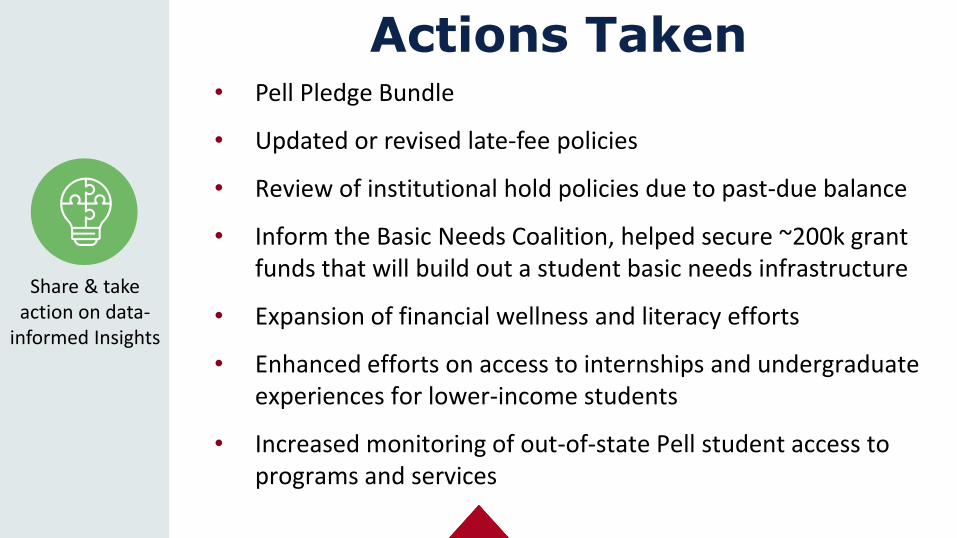
Actions Taken
Share & take action on data-
informed Insights
• Pell Pledge Bundle
• Updated or revised late-fee policies
• Review of institutional hold policies due to past-due balance
• Inform the Basic Needs Coalition, helped secure ~200k grant funds that will build out a student basic needs infrastructure
• Expansion of financial wellness and literacy efforts
• Enhanced efforts on access to internships and undergraduate experiences for lower-income students
• Increased monitoring of out-of-state Pell student access to programs and services
Data-Informed Insight Examples
Insight
Invest in on-campus jobs, scholarship information, free legal services, and social justice programming
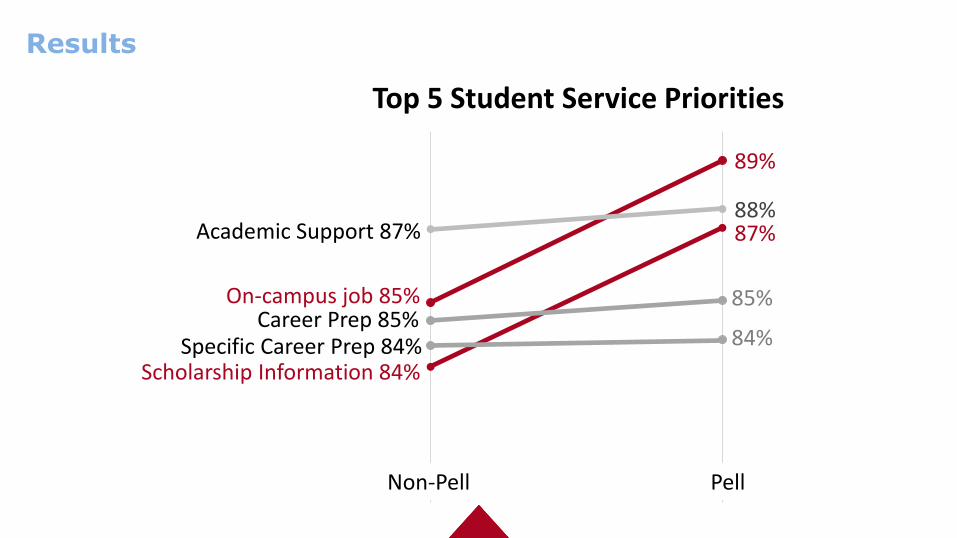
Top 5 Student Service Priorities
89%
88%87%
85%
84%
Non-Pell Pell
Academic Support 87%
On-campus job 85%Career Prep 85%
Specific Career Prep 84%Scholarship Information 84%
Results
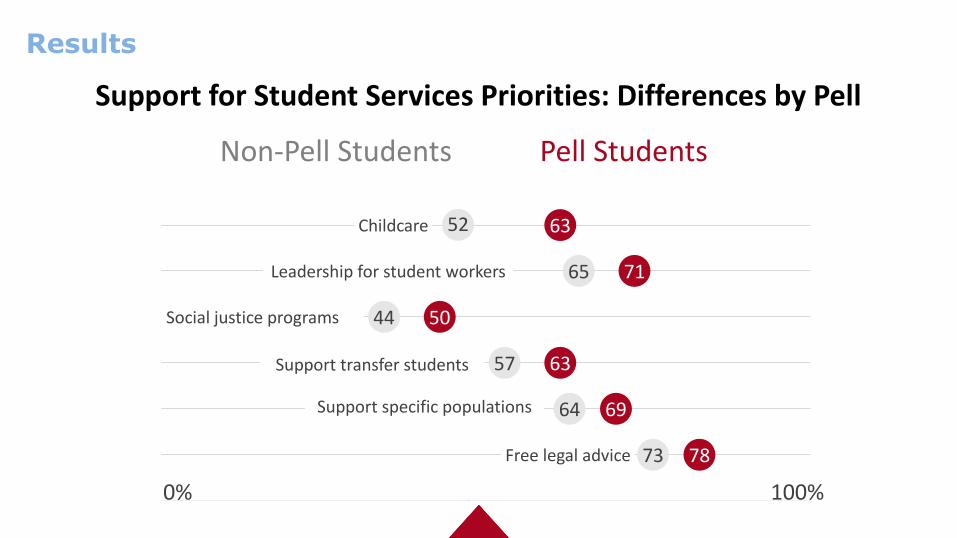
63
71
50
63
69
78
52
65
44
57
64
73
Childcare
Leadership for student workers
Social justice programs
Support transfer students
Support specific populations
Free legal advice
0% 100%
Support for Student Services Priorities: Differences by Pell
Non-Pell Students Pell Students
Results
Insight
Scale holistic support to offer a Pell Pledge Support Bundle
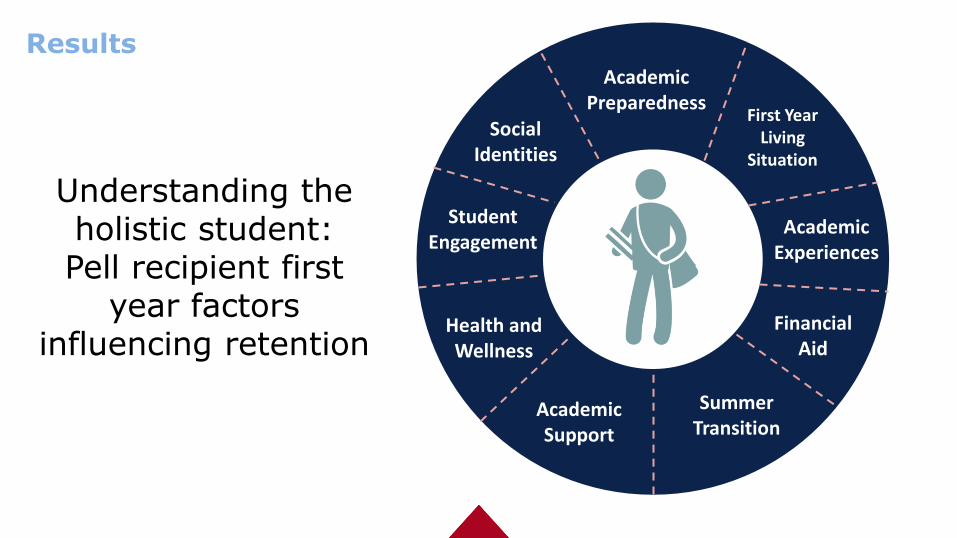
ResultsAcademic
PreparednessSocial
Identities
First Year Living
Situation
Academic Experiences
Financial Aid
Summer Transition
Academic Support
Student Engagement
Health and Wellness
Understanding the holistic student:Pell recipient first
year factors influencing retention
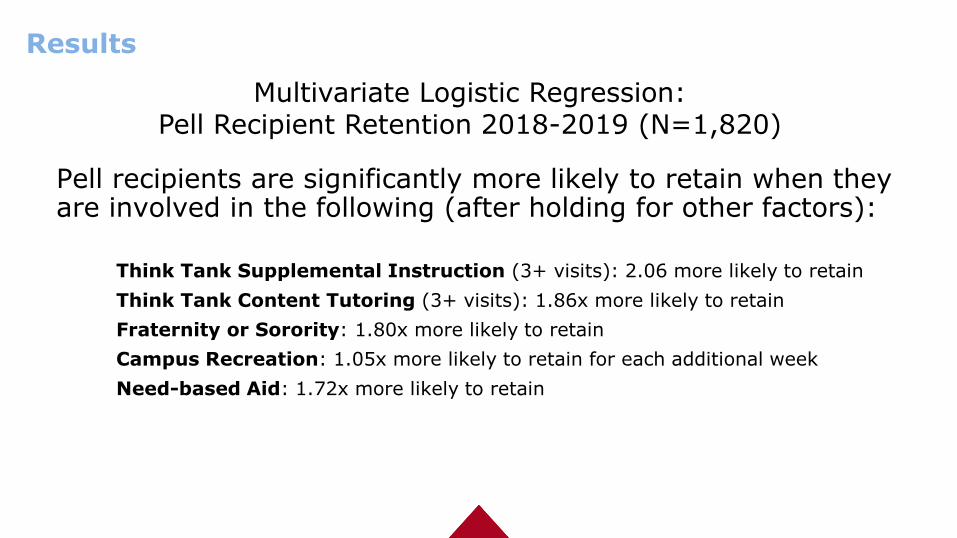
Pell recipients are significantly more likely to retain when they are involved in the following (after holding for other factors):
Think Tank Supplemental Instruction (3+ visits): 2.06 more likely to retain
Think Tank Content Tutoring (3+ visits): 1.86x more likely to retain
Fraternity or Sorority: 1.80x more likely to retain
Campus Recreation: 1.05x more likely to retain for each additional week
Need-based Aid: 1.72x more likely to retain
Results
Multivariate Logistic Regression: Pell Recipient Retention 2018-2019 (N=1,820)
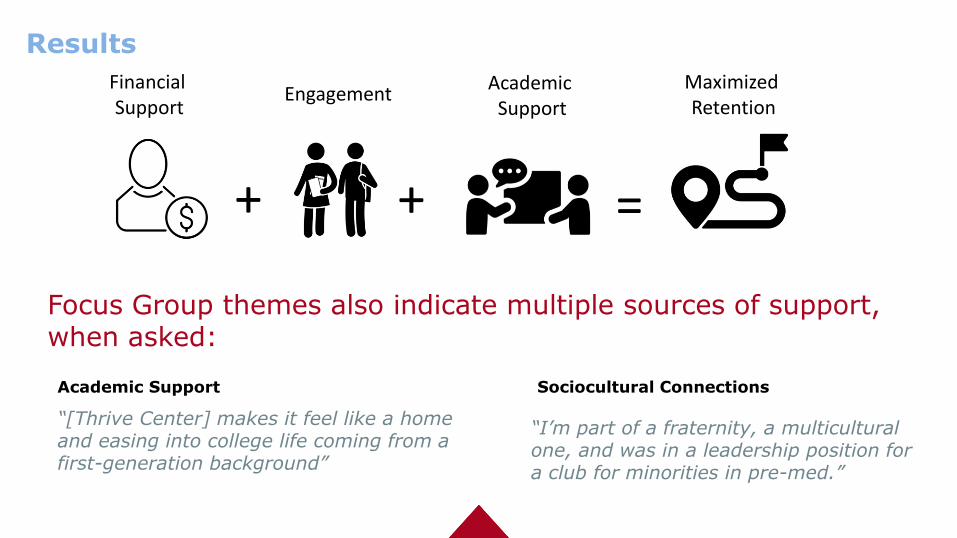
Focus Group themes also indicate multiple sources of support, when asked:
=++
Financial Support
EngagementAcademic
SupportMaximized Retention
Results
Academic Support
“[Thrive Center] makes it feel like a home and easing into college life coming from a first-generation background”
Sociocultural Connections
“I’m part of a fraternity, a multicultural one, and was in a leadership position for a club for minorities in pre-med.”
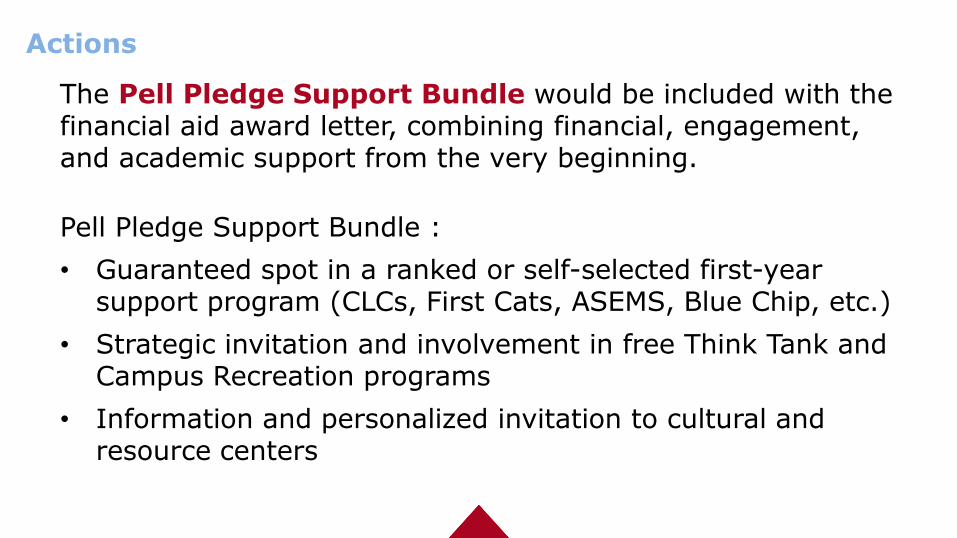
The Pell Pledge Support Bundle would be included with the financial aid award letter, combining financial, engagement, and academic support from the very beginning.
Pell Pledge Support Bundle :
• Guaranteed spot in a ranked or self-selected first-year support program (CLCs, First Cats, ASEMS, Blue Chip, etc.)
• Strategic invitation and involvement in free Think Tank and Campus Recreation programs
• Information and personalized invitation to cultural and resource centers
Actions
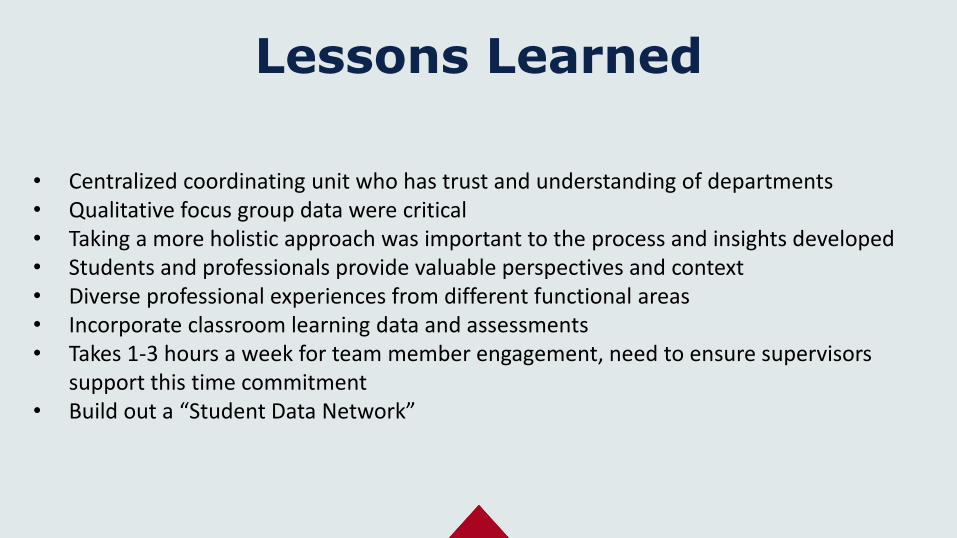
Lessons Learned
• Centralized coordinating unit who has trust and understanding of departments• Qualitative focus group data were critical • Taking a more holistic approach was important to the process and insights developed • Students and professionals provide valuable perspectives and context • Diverse professional experiences from different functional areas• Incorporate classroom learning data and assessments • Takes 1-3 hours a week for team member engagement, need to ensure supervisors
support this time commitment • Build out a “Student Data Network”
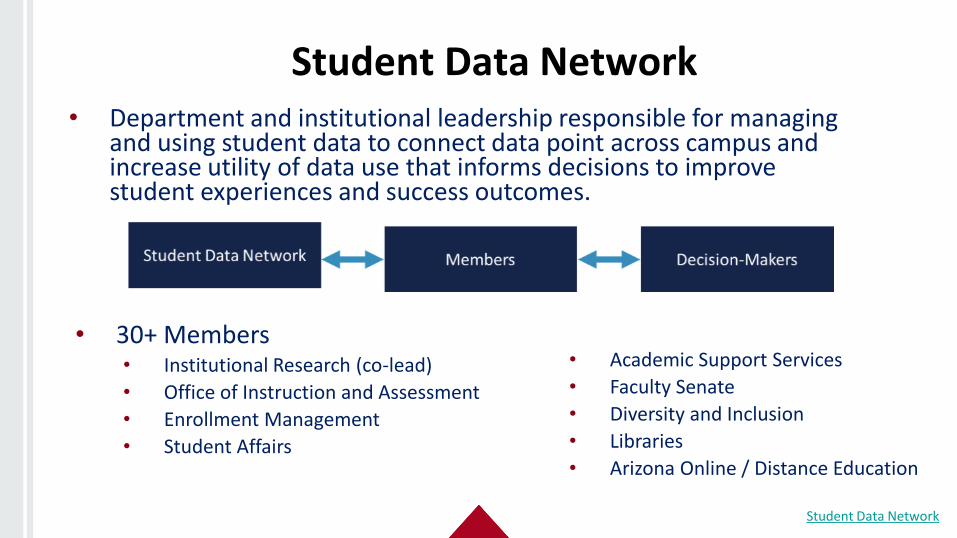
Student Data Network• Department and institutional leadership responsible for managing
and using student data to connect data point across campus and increase utility of data use that informs decisions to improve student experiences and success outcomes.
Student Data Network
• 30+ Members• Institutional Research (co-lead)
• Office of Instruction and Assessment
• Enrollment Management
• Student Affairs
• Academic Support Services
• Faculty Senate
• Diversity and Inclusion
• Libraries
• Arizona Online / Distance Education
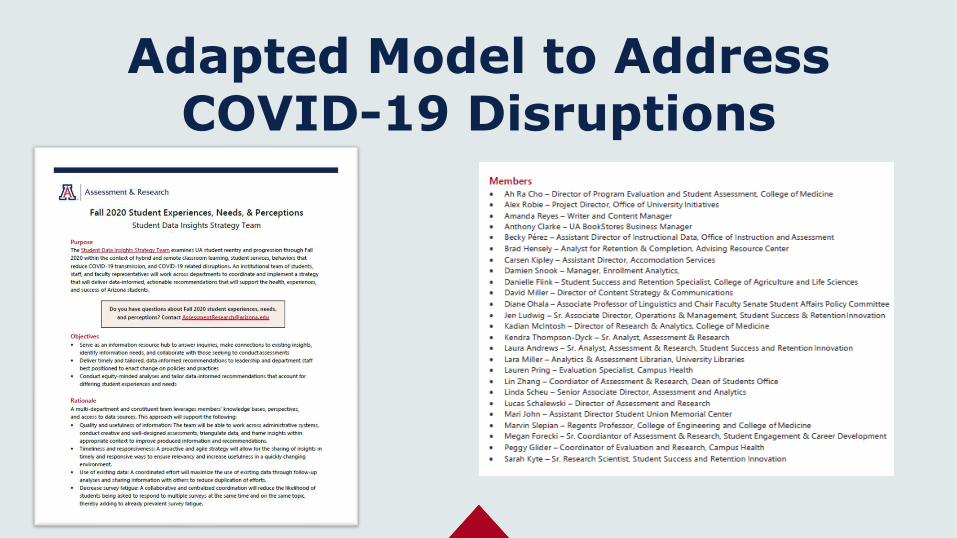
Adapted Model to Address COVID-19 Disruptions
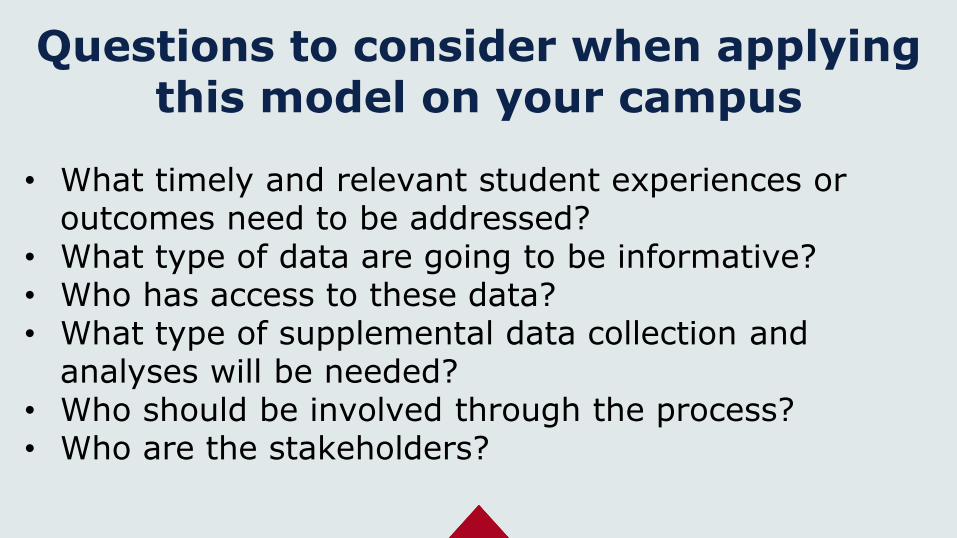
Questions to consider when applying this model on your campus
• What timely and relevant student experiences or outcomes need to be addressed?
• What type of data are going to be informative?• Who has access to these data?• What type of supplemental data collection and
analyses will be needed? • Who should be involved through the process?• Who are the stakeholders?
Thank you!
Dr. Lucas Schalewski, Director, Assessment & Research | [email protected]
Dr. Kendra Thompson-Dyck, Sr. Research Analyst, Assessment and Research | [email protected]
Consolidation of institutional data,
assessments, & research
Synthesis of data & research
Draw inferences
Share & take action on data-
informed Insights
Developinsights
Conduct focus groups