Embed Size (px)
Citation preview
CER
N-O
PEN
-201
4-02
819
/05/
2013
CERN – EUROPEAN ORGANIZATION FOR NUCLEAR RESEARCH
ADVANCES IN THE UNDERSTANDING OF THE PHYSICAL
PROCESSES OF VACUUM BREAKDOWN
Walter Wuensch CERN, Geneva, Switzerland
Abstract Advances in the fundamental understanding of vacuum breakdown achieved during the program to develop high-gradient accelerating structures for a TeV-range linear collider project are described.
Presented at: Symposium on High-Gradient Accelerating Structures Beijing, China May 19th, 2013
CLIC – Note – 1025

Advances in the Understanding of the Physical Processes of Vacuum Breakdown
Walter Wuensch CERN, Geneva, Switzerland.
Advances in the fundamental understanding of vacuum breakdown achieved during the program to develop high-gradient accelerating structures for a TeV-range linear collider project are described.
Introduction
One of the main parameters that determines the performance of CLIC, a TeV-range e+e- linear collider [1], is the accelerating gradient achievable in its normal-conducting, rf (radio-frequency) accelerating structures. This gradient is limited by a number of effects, but the dominant one is vacuum breakdown. As a consequence, significant effort has been invested into understanding vacuum breakdown, both into the aspects specific to high-gradient rf accelerating structures but also, more generally, into the fundamental physics of the process. Advances made by an international collaboration, roughly centered on the CLIC study, to understand vacuum breakdown are reviewed in this report.
CLIC accelerating structures operate at X-Band, specifically 11.994 GHz, and are made from copper. The operating accelerating gradient is 100 MV/m which results in a peak surface electric field of approximately 250 MV/m. Numerous different versions of prototype structures have now successfully operated at 100 MV/m accelerating gradient [2,3]. The aforementioned references [1,2,3] and references contained therein, contain detailed descriptions of the structure designs, fabrication methods and test conditions.
The effort to understand the basic physical processes of vacuum breakdown, and the implementation of numerous ideas based on this understanding, has contributed directly to the success in achieving the very ambitious accelerating gradient target of 100 MV/m. A summary of accelerating gradients achieved during testing is shown in fig.1. In the opinion of the author, the achieved high gradients give strong evidence of the validity of many of the new insights that were acquired during in the investigation. Some of the insights relate to specificities required for a high-energy linear collider but many apply quite broadly to vacuum breakdown in general. Also the high-gradient accelerator technology, developed for linear colliders, may be directly useful for other linac applications such as free electron lasers, Compton light sources and for medical linacs.
This report first covers the characteristics of vacuum breakdown in high-gradient rf accelerating structures and outlines how these relate to linac performance requirements. This gives the context for the breakdown study which has been driven by the linear collider project. The report then covers the basic physics of breakdown especially addressing the distinct experimental signatures which are observed in high-gradient rf. This section covers the importance of material microstructure, field emission, plasma build up and the interaction with external driving circuits.

Figure 1: Summary of performances of various versions of CLIC accelerating structure. CLIC operation requires a low breakdown rate, y-axis, as explained below.
Characteristics of vacuum breakdown in high-gradient rf The CLIC linac, like most normal conducting linacs, operates in a pulsed mode. The CLIC rf
pulse length is about 200 ns and the repetition rate is 50 Hz. One of the key measures of the performance of accelerating structure is the breakdown rate at the operating gradient. The breakdown rate is the probability that a breakdown occurs on any given pulse, and is determined experimentally by dividing the number of breakdowns by the total number of rf pulses during an operating period. The CLIC specification is very demanding, requiring a breakdown rate less than O(10-7) [1].
Breakdown rate (BDR) is observed to depend very strongly on the field level in the structure [4], and can be approximated by BDRαE30 [5]. Experimental data of BDR vs. E is shown in fig. 2. The E shown on the abscissa is accelerating gradient, but could be any field in the structure since the electromagnetic fields all scale proportionally, giving the same exponent. Most fully conditioned structures are best fit with an exponent of around 30, although this tends to lower values during the early stages of structure conditioning. Fitting the breakdown rate to a power of field inside the structure is not based on a physical model but it does allow a simple, single parameter, quantitative comparison between structures. Determining what determines the statistical properties and dependencies of breakdown rate has been an important priority for this study, both because our particular application requires operation in a low breakdown rate regime and because the dependence represents a distinctive experimental signal that has the potential to give deep insight in the breakdown process.

Figure 2: Experimental data showing the strong dependence of breakdown rate on field of a CLIC high-gradient test structure [6]. The structure was a so-called TD18 tested at the NEXTEF test stand at KEK.
The breakdown rate is also a strong function of the rf pulse length. This observed dependence is typically about BDRατ5 . Experimental data is shown in fig. 3. In addition to its relevance as an experimental signal for understanding breakdown, this dependence of breakdown rate on field is important since the efficiency of the CLIC linac is strongly dependent on the rf pulse length. A longer rf pulse length allows a longer bunch train to be accelerated.
An important insight into the mechanism that drives the statistics of breakdown can be deduced by considering the pulse length dependence and the distribution of the time inside pulses when breakdowns occur. If the chance of a breakdown was entirely independent on every pulse, the probability distribution would have to increase strongly at the end of the pulse to give the observed pulse length dependence. This is because the structure does not know at the beginning of a pulse how long the pulse will become, so the τ5 increase in breakdown probability would have to come from the end of the pulse. However, experiments show that the distribution of breakdown time within a pulse is essentially flat, fig. 5. This means that there is a memory effect or evolution of the structure surface over a certain number of pulses. The early part of a pulse can know how long the pulses are because it knows how long previous pulses have been. A possible mechanism to explain such an effect is a local fatigue process near the field emitter sites, which we will return to later.

Figure 3: Experimental data of breakdown rate as a function of rf pulse length from a TD24R05 tested at NEXTEF [3]. This particular data shows a fit of τ6, a more typical dependence is τ5.
Figure 4: Histogram of experimental data of breakdown time within a pulse from the same structure as fig. 2. The red points show a basically flat distribution of breakdown times with a pulse, and clearly does not rising towards the end. The red points are those breakdowns which are preceded by at least one pulse which had no breakdown, so represents the intrinsic statistics of breakdown. The blue points are from breakdowns which occur on those pulses which have been immediately

preceded by another breakdown. They show the effect of a breakdown, which may be to create a debris which must be cleaned up. The data was taken with 400 ns pulse length.
A schematic layout of a typical high-gradient experiment is shown in fig. 5. Incident, transmitted and reflected signals on pulses without and with breakdown taken during the test of a CLIC structure are shown in figs. 6a and 6b. Three distinct phases typically appear in pulses in which a breakdown occurs. The first phase is the unperturbed pulse before the breakdown. When the breakdown begins, the transmitted pulse drops to near zero transmission in a time of about 10 ns. A strong reflection eventually develops, rising up to nearly full reflection. When there is no breakdown the forward power is equal to the transmitted plus reflected power (usually less than 1%), once cavity ohmic losses are taken into account. The common jargon says that there is no ‘missing power’ or ‘missing energy’. However when a breakdown occurs, significant missing power is observed in the time between the transmission fall off and the reflection rise. The total missing energy of the pulse can exceed 50%.
Figure 5: Typical set-up of a high-gradient rf experiment. Drawing taken from [7].

Figure 6a: Incident (blue), transmitted (green) and reflected (red) signals on a pulse without breakdown [4.6]. The rf pulse traveling through the structure has been normalized for attenuation due to ohmic losses. The data are from a TD26CC structure tested at Xbox-1 at CERN.
Figure 6b: Incident, transmitted and reflected signals on a pulse during which a breakdown occurred. The signature is the abrupt cut-off of transmitted power, the drop in the green curve. Sometime later the incoming power is reflected from the breakdown.
Another important experimental observable in high-gradient rf experiments is the emission of currents from the structure. These currents are detected in Faraday cups that capture current emitted from the beam pipes of the structures (that is along the same path through the structure as the accelerated beam). Experimental data of current emission are shown in fig. 7a and 7b. During rf pulses without breakdown this emission has a level below a milli-ampere. When a breakdown occurs, however, this level rises to many amperes. It should be emphasized that the total currents generated by the breakdown will be significantly higher since only a small fractional solid angle of current can escape the structure.

Figure 7a: Current emission, so-called dark current, from a structure on pulse without breakdown.
Figure 7b: Current emission from the structure on pulses with breakdown. During structure testing dark current is usually monitored. This typically results in saturated signals during breakdown.
Prototype accelerating structures for CLIC are prepared according to a baseline procedure which has evolved over many years [8,9] for which the main features and steps are:
• The raw material is OFE copper.

• Final machining is made with single crystal diamond tools on micron precision lathes and mills.
• Assembly in a clean room. • Bonding at 1030°C in a 1 atm hydrogen atmosphere. • Vacuum bake-out at 650°C • Storage (and installation) under dry nitrogen (flow).
Despite the very elaborate preparation procedure, the structures still require an extensive rf
conditioning period. Many weeks of operation at 50 Hz are required to bring the structure up to operating parameters. The operational history of an accelerating structure is shown in fig. 8.
New structures are first run at low power level and with short pulse length. Initially there is a short period, of the order of days, during which the structure out-gasses during stable operation (without breakdown) and as the power is raised, the first breakdowns occur at low field level. These initial breakdowns are associated with large vacuum bursts. Gradually the field and pulse length can be increased. Breakdowns occur intermixed with stable operation, but overall the performance of a structure will improve. Vacuum activity, both in normal operation and from breakdown, decreases significantly during this initial period.
The strong vacuum activity and breakdowns with strong vacuum bursts during the early stages of conditioning seems to be removal of, and triggered by surface contaminants such as particles and oxide layers. After this phase, it seems that the surface has become quite clean. Breakdowns then occur due to the imperfections and dynamics of the metal surface itself. The breakdown studies described in this report concentrates on these later stage breakdowns, and consequently focuses on those breakdowns which are initiated by the material atomic and micro-structure of a metal surface itself.
In order to minimize conditioning time without compromising ultimate performance, the strategy that has been adopted by the CLIC study is to condition with short pulses, typically 50 ns, go somewhat above the nominal gradient, expand the pulse length, go somewhat above the nominal gradient again and so on (many other rf applications use the same basic strategy). The surface treatment process made during fabrication is elaborate and the conditioning period can take many weeks - consequently preparing the surface for high-gradient contributes significantly to the cost of a completed structure. A strong practical motivation for a basic study of breakdown is to be able to refine the fabrication technique in a targeted, intelligent, manner. This could reduce fabrication time, cost and risk. Additionally, the conditioning strategy currently under use has been developed through trial and error. For example no set of identical structures has been conditioning in differing ways, so no statistically validated comparison exists. Here again a detailed understanding of the breakdown process can help guide development in a strategic way.

Figure 8: Operational history of the conditioning process of an accelerating structure a CLIC TD26CC [6,2]. The green trace is accelerating gradient (right hand axis). The red curve is the total number of accumulated breakdowns (left-most axis) and the purple line its derivative. The structure is conditioned with constant breakdown rate. The blue data is dark current level which can be seen to decrease with conditioning (middle axis on left side).
Another significant experimental observation from vacuum breakdown in radio frequency structures is that the performance of a structure with a particular geometry is limited by a non-simple function of the fields inside the structure. For example, the maximum surface electric field one finds in a fully conditioned accelerating structure, running at a specified rf pulse length and breakdown rate, depends very strongly on the geometry of that structure, even given the same preparation techniques. That is, the peak surface electric field does not provide the limitation in high field operations as one might expect from extrapolating from dc experiments. Broadly speaking, the dependency one sees is that a structure with a low power flow will sustain a higher surface electric field than a structure with high power flow [10]. This has led to the introduction of two quantities P/λC and Sc [4,11] that predict at which field a structure will operate – which then allows the operating accelerating gradient to be determined. The two quantities are based on a broad analysis of the observed performances of many structures, along with general physical considerations. The quantities appear to be rather accurate. Indeed, implementing the quantities from one generation of CLIC test structure to the next resulted in an improved high-gradient performance as shown in table 1. Pairs of both the structures in the table were made with the same fabrication and surface treatment procedure, and were tested by the same teams, giving some level of assurance of reproducibility.
In addition to their direct application in raising accelerating gradient, the scaling laws P/λC and Sc are used in the overall optimization of linear accelerators for construction cost and power consumption. A better foundation for the scaling laws, and possibly a revision, would allow a better optimization of the accelerating structure and facility design to be made. A quantitative understanding of the physical process which underlie vacuum breakdown, and in particular rf breakdown, might allow an even more accurate prediction of gradient as a function of geometry to be made. Some new directions are described in the last section of this report.
Table 1: Comparison of peak field values for two generations of test structures: T18 and T24.
Both structures were tested at the NEXTEF facility at KEK. The data are given for a pulse length of 250 ns and a breakdown rate of 1x10⁻⁶ b/p/m.
Accelerating
gradient [MV/m] Surface electric field [MV/m]
Peak P/λC [W/ μm2]
Peak Sc
[W/ μm2] T18 103 238 0.090 4.69 T24 118 243 0.106 4.77
Breakdown physics
CLIC accelerating structures are constructed from copper disks machined on ultra-high-
precision lathes with a resulting surface roughness of below 10 nm. After high-gradient testing, structures are often cut open and inspected with optical and scanning electron microscopes. The craters seen in the rf test look very similar looking breakdown ‘craters’ are observed from sparks in the CERN dc spark system [12,13] as shown in figs. 9a and 9b.

Figure 9a: SEM image of a breakdown crater formed in the CERN dc spark system [14].
Figure 9b: SEM image of a breakdown crater formed in an X-band accelerating structure [14].
Typically a few thousand breakdowns, defined according to the rf and faraday cup signals described above, are recorded during an rf structure test. Very roughly, a factor ten more craters are observed on a structure surface after it is cut open than are recorded by the diagnostic systems during high-power operation, indicating that there are undetected breakdowns and/or secondary breakdowns during the detected events. As we will discuss below, the estimated size of the features which trigger the breakdown is of the order of 10 nm. Assuming that the observed craters form around the area where the breakdown starts, the fraction of an accelerating structure surface which directly leads to breakdown during a typical test is below 10-8 (the high field region of an X-band accelerating structure is of the order of a cm2). This is a very small number. In addition, structures are run at a breakdown rate of about 10-5 during conditioning and 10-7 during operation.
These simple considerations show that a very small fraction of a surface breaks down extremely rarely. What makes certain places on the surface weak and what aspect results in a particular pulse unleashing a breakdown? This rareness of individual events is contrasted by the strong reproducibility of field level from structure to structure. A summary of CLIC high-gradient

test results was shown in figure 1. One can see individual structure types show performances that are the same to within a few percent, as are the high-power scaling limits summarized in table 1.
The rareness of breakdown combined with the repeatability from sample to sample, plus the intra-pulse breakdown distribution combined with the observed τ5 pulse length dependence of breakdown rate indicate, in the opinion of the author, that the features which lead to breakdown evolve to a characteristic feature type on the structure surface. Furthermore, for reasons which will be elaborated below, there is a strong indication that this evolution occurs through the dynamics of dislocations at or near the material surface.
The dark currents shown in figure 7 are observed in many other high-voltage applications, often referred to as field emission currents. The field enhancement factors β in measured CLIC structures are typically 30-60. This discussion of breakdown will continue with the common assumption [15,] that these enhance emission sites are the locations at which breakdown can occur. Indeed experimental evidence of a threshold local electric field, βE value, has been obtained in the test in the CERN dc spark system [13], which supports this assumption.
What is the nature of these sites? In many high-voltage applications, breakdowns occur due to contaminants such as dust or oxides. These indeed seem to play a role in breakdowns early in the conditioning process of high-gradient accelerating structures, but the strong reproducibility of performance after conditioning, only a few percent as shown in table 2, between structures argues against this being relevant in late stage breakdowns. In addition, a strong material dependence of threshold electric field has been observed in measurements in the dc spark system, fig. 11. The material dependence indicates that the breakdowns which limit the ultimate gradient are features of the material itself.
Figure 11: Material dependence of threshold electric field from the CERN dc spark system [19].
A very compelling explanation for the ordering of the materials in fig. 11 has been made in
[20], which is that the crystal structure of the material determines the surface-field limit. Experimentally, face-centered cubic structures tolerate the lowest gradient, followed by body-centered cubic and ultimately hexagonal. This is consistent with the ordering of dislocation mobility, from highest in face-center to lowest in hexagonal. It is reasonable that higher dislocation mobility results in lower threshold surface field since features leading to breakdown become easier to form.
The common explanation for increased field emission current compared to that expected from the Fowler-Nordheim equation [21] applied to an ideal surface is a local geometrical field

enhancement factor (although enhanced emission is thought to come from dielectric dust particles in some applications). Our group has never independently observed, through SEM images for example, any features with the necessary aspect ratio to produce such a field enhancement on any of the surfaces we have analyzed, and this down to dimensions below a few hundred nm. It is interesting to note that geometrical surface features with dimensions of a few nm are thermodynamically unstable, and will disappear within a few seconds [22]. This limits the breakdown site size to between a few and a few hundred nm.
An additional contribution to field emission may be that a real surface is likely to have areas of locally reduced work function. The different crystal planes of copper have work functions which range from 4.48 to 4.98 eV [23]. Taking this idea further, interruptions in regular crystal structure, such as those caused by a dislocation at the crystal surface, should result in a locally lower work function compared to the bulk value. Experimental evidence for local areas of reduced work function has been reported in [24]. In this experiment, photo-emission from a copper surface using a 3.1 eV laser, that is less than the bulk work function, was observed. The total surface area of reduced field emission is small, and photo-emission is not enhanced exponentially like field emission, so the total current from the effect is small and the experiment is difficult to make. Studies to directly compute the effect of irregular crystal structure on work function are being made [25]. A first result from this study is that the effect of a single add-atom is to lower the work function of a copper surface by about 6%. This is a small contribution to a field enhancement factor of 50, but the effect is likely to be bigger for more complex structures. However the so-call DTF (Density Function Theory) method used to make this computation is very demanding computationally and the group is currently investigating ways of computing the change of work function on more complex geometries.
If these ideas are further validated, enhanced field emission would thus occur at locations with both geometrical enhancement and reduced work function. At the likely O(10) nm scale of field emission sites, it is likely that irregular geometry and change of work function occur together – an irregular surface inherently has a work function different than a uniform one. This insight has a practical consequence for the CLIC accelerating structures as it may explain the effectiveness of the very high-temperature treatment for the structures. The baseline fabrication procedure for structures includes a 1030°C heat treatment in a 1 bar hydrogen atmosphere, at which time the structure disks are bonded together. The hydrogen certainly makes the surface extremely clean, which is certainly important. However, the heating also fully anneals the copper. This makes it much softer, which might be expected to reduce the gradient potential of the structure. However the annealing reduces the dislocation density and consequently the number of emission sites. This may be the major reason why heating turns out to be so effective.
More weight to the idea that dislocations are the starting point of breakdowns comes from the success of a model which derives breakdown rate as a function of gradient based on the enthalpy of dislocation formation [26]. The model predicts the observed breakdown behavior very well. The two fitting parameters are dislocation formation energy and volume, and fits give physically reasonable values. The E30 fit described earlier in the paper work is quite accurate and convenient however does not have a physical basis. Experiments to probe a very wide range of breakdown rates to determine and eventually distinguish amongst breakdown rate dependencies using the CERN dc spark system are now underway. A new high-repetition rate pulser has been developed [28]. Preliminary data is shown in fig. 12.
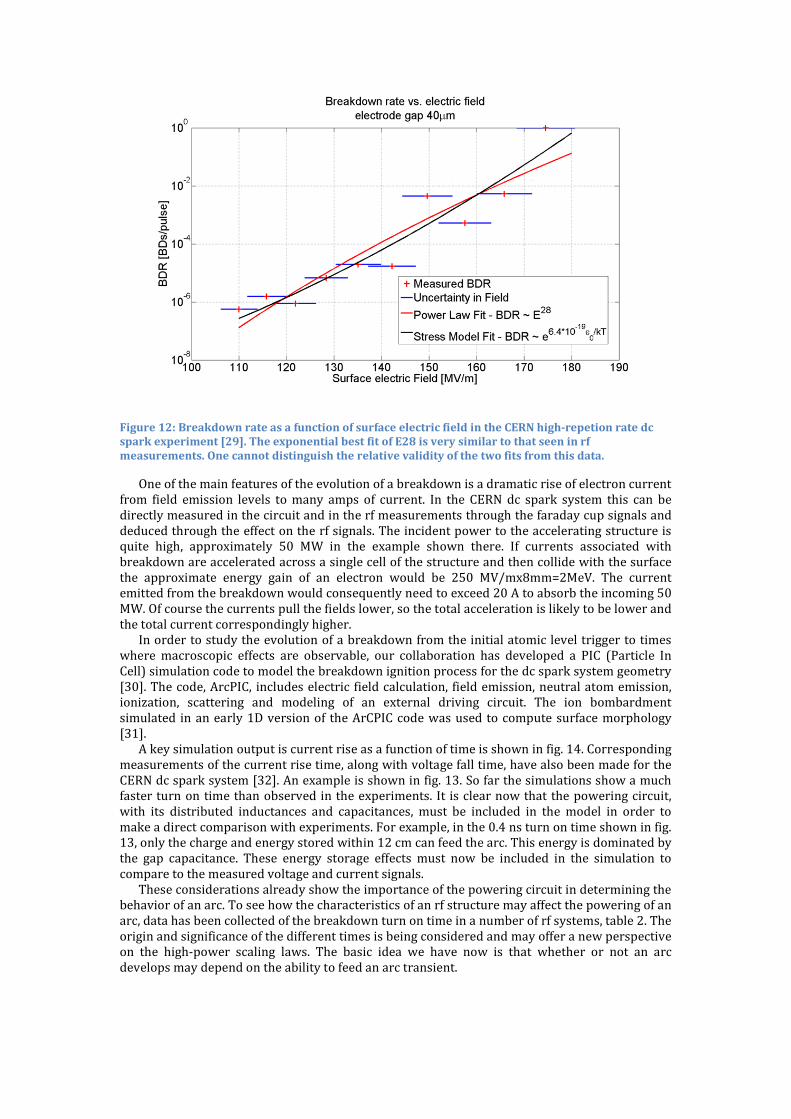
Figure 12: Breakdown rate as a function of surface electric field in the CERN high-repetion rate dc spark experiment [29]. The exponential best fit of E28 is very similar to that seen in rf measurements. One cannot distinguish the relative validity of the two fits from this data.
One of the main features of the evolution of a breakdown is a dramatic rise of electron current from field emission levels to many amps of current. In the CERN dc spark system this can be directly measured in the circuit and in the rf measurements through the faraday cup signals and deduced through the effect on the rf signals. The incident power to the accelerating structure is quite high, approximately 50 MW in the example shown there. If currents associated with breakdown are accelerated across a single cell of the structure and then collide with the surface the approximate energy gain of an electron would be 250 MV/mx8mm=2MeV. The current emitted from the breakdown would consequently need to exceed 20 A to absorb the incoming 50 MW. Of course the currents pull the fields lower, so the total acceleration is likely to be lower and the total current correspondingly higher.
In order to study the evolution of a breakdown from the initial atomic level trigger to times where macroscopic effects are observable, our collaboration has developed a PIC (Particle In Cell) simulation code to model the breakdown ignition process for the dc spark system geometry [30]. The code, ArcPIC, includes electric field calculation, field emission, neutral atom emission, ionization, scattering and modeling of an external driving circuit. The ion bombardment simulated in an early 1D version of the ArCPIC code was used to compute surface morphology [31].
A key simulation output is current rise as a function of time is shown in fig. 14. Corresponding measurements of the current rise time, along with voltage fall time, have also been made for the CERN dc spark system [32]. An example is shown in fig. 13. So far the simulations show a much faster turn on time than observed in the experiments. It is clear now that the powering circuit, with its distributed inductances and capacitances, must be included in the model in order to make a direct comparison with experiments. For example, in the 0.4 ns turn on time shown in fig. 13, only the charge and energy stored within 12 cm can feed the arc. This energy is dominated by the gap capacitance. These energy storage effects must now be included in the simulation to compare to the measured voltage and current signals.
These considerations already show the importance of the powering circuit in determining the behavior of an arc. To see how the characteristics of an rf structure may affect the powering of an arc, data has been collected of the breakdown turn on time in a number of rf systems, table 2. The origin and significance of the different times is being considered and may offer a new perspective on the high-power scaling laws. The basic idea we have now is that whether or not an arc develops may depend on the ability to feed an arc transient.

Figure 13: ArcPIC result for a 6 μm gap [28]. As the current in the arc rises as the conducting plasma is formed, the voltage across the gap falls. A series resistance of 5000 Ω is assumed in this simulation.

Figure 14: Breakdown turn on time in the CERN dc spark system [27]. The current rise and voltage fall times appear to be determined by the gap and local stray capacitances of the dc system.
Table 2: Breakdown turn on times in various experiments.
Test Frequency Measurement Result
Simulation dc spark dc Current rise time 0.4 ns
DC spark System DC Voltage fall and voltage rise time 7 ns
Swiss FEL (C-Band) 5.7GHz Transmitted Power Fall Time 110 - 140ns
KEK T24 (X-Band) 12GHz Transmitted Power Fall Time 20-40ns
CTF/TBTS TD24 (X-Band) 12GHz Transmitted Power Fall Time 20-40ns
CTF SICA (S-Band) 3GHz Transmitted Power 60-140ns
Summary
The effort to increase accelerating gradient in CLIC has led to significant new insights into the underlying physical processes of vacuum breakdown. These insights are now being used to direct continuing efforts to further improve structure performance and improve manufacturing techniques. The high-gradient technology is also being considered for a number of new accelerator applications. Acknowledgements
The author first wishes to thank Juwen Wang for his pioneering role in studying breakdown
in accelerating structures, his strong personal support for our CLIC X-band structure test at SLAC back in 1994 [33] and his contribution to fabricating many of the structures summarized in fig. 1. I also wish to thank Chris Adolphsen, Sergio Calatroni, Flyura Djurabekova, Alexej Grudiev, Toshi Higo, Kai Nordlund, Igor Syratchev for their insights, intellectual stimulation and intense discussions. I would like also to thank all the co-authors listed below for the hard experimental and simulation work on which the progress is based. References [1] M. Aicheler et. al., "A Multi-TeV Linear Collider Based on CLIC Technology,” CERN 2012-007. [2] A. Degiovanni, S. Doebert, W. Farabollini, A. Grudiev, J. Kovermann, E. Montessinos, G. Riddone, I. Syratchev, R. Wegner, W. Wuensch, A. Solodko B. Woolley, “High-Gradient Test Results From a CLIC Prototype Accelerating Structure: TD26CC,” to be published IPAC 2014. [3] T. Higo, T. Abe, Y. Arakida, S. Matsumoto, T. Shidara, T. Takatomi, M. Yamanaka, A. Grudiev, G. Riddone, W. Wuensch, “Comparison of High-Gradient Performance in Varying Cavity Geometries,” Proc. IPAC 2013. [4] C. Adolphsen, “Normal-Conducting RF Structure Test Facilities and Results”, Proc. PAC 2003, Portland, Oregon, USA (2003). [5] A. Grudiev, S. Calatroni, W. Wuensch, “New local field quantity describing the high gradient limit of accelerating structures”, Phys. Rev. ST- Accel. Beams 12, 102001 (2009). [6] T. Higo, private communication. [7] B. Woolley, http://indico.cern.ch/conferenceDisplay.py?confId=284650.
[8] I. Wilson, W. Wuensch, C. Achard, “The fabrication of a prototype 30 GHz accelerating section for CERN linear collider studies,” CERN-SL-90-84-RFL; CLIC-Note-114.- Geneva 1990. [9] J.W. Wang et al.,”Fabrication Technologies of the high gradient accelerator structures at 100 MV/m range”, IPAC 2010, Kyoto, Japan. [10] C. Adolphsen, “Advances in Normal Conducting Accelerator Technology From the X-Band Linear Collider Program”, Proceedings PAC2005. [11] W. Wuensch, “The Scaling of the Traveling-Wave RF Breakdown Limit” CERN-AB-2006-013 ; CLIC-Note-649, 2006. [12] M. Kildemo, “New spark-test device for material characterization” Nucl. Instrum. Methods Phys. Res., Sect. A. [13] A. Descoeudres, Y. Levinsen, S. Calatroni, M. Taborelli, W. Wuensch “ Investigation of the dc vacuum breakdown mechanism” Physical Review Special Topics – Accelerators and Beams 12, 092001 (2009). [14] A. T. Perez Fontenla, private communication. [15] J.W. Wang and G.A. Loew, “ Field Emission and RF Breakdown in High-Gradient Room-Temperature Linac Structure” SLAC-PUB-7684, 1997. [16] B. Jüttner, Beitr. Plasmaphys. 19, 25 (1979) [17] G. A. Mesyats and D.I Proskurovsky, “Pulsed Electrical Discharge in Vacuum” (Springer, Berlin 1989). [18] R. Latham, “High voltage vacuum insulation : basic concepts and technological practice” Academic Press, 1995. [19] A. Descoeudres, T. Ramsvik, S. Calatroni, M. Taborelli, W. Wuensch “dc breakdown conditioning and breakdown rate of metals and metallic alloys under ultrahigh vacuum” Physical Review Special Topics – Accelerators and Beams 12, 032001 (2009) [20] A. Descoeudres, F. Djurabekova and K. Nordlund “dc Breakdown Experiments with Cobalt Electrodes” CLIC Note 875, 2009. [21] R. H. Fowler and L. Nordheim “Electron Emission in Intense Electric Fields” Proc. R. Soc. Lond. A, 119:173-181, 1928. [22] J. Frantz, M. Rusanen, K. Nordlund, and I. T. Koponen, “Evolution of Cu nanoclusters on Cu(100)”, J. Phys.: Condens. Matter 16, 2995 (2004). [23] C. Kittel, “Introduction to Solid State Physics” [24] H. Chen, Y. Du, W. Gai, A. Grudiev, J. Hua, W. Huang, J. G. Power, E. E. Wisniewski, W. Wuensch, C. Tang, L. Yan, Y. You, “Surface-Emission Studies in a High-Field RF Gun based on Measurements of Field Emission and Schottky-Enabled Photoemission” Phys. Rev. Lett. 109, 204802 –14 November 2012. [25] F. Djurabekova, A. Ruzibaev, E. Holström, and M. O. Hakala,” Local changes of work function near rough features on Cu surfaces operated under high external electric field”, Jour. of Appl. Phys. 114, 243302 (2013). [26] K. Nordlund and F. Djurabekova,” Defect model for the dependence of breakdown rate on external electric fields” Phys. Rev. ST Accel. Beams 15, 071002 , 2012.

[28] Soares, R H (CERN) ; Barnes, M J (CERN) ; Kovermann, J (CERN) ; Calatroni, S (CERN) ; Wuensch, W (CERN), “A 12 kV, 1 kHz, Pulse Generator for Breakdown Studies of Samples for CLIC RF Accelerating Structures” Proc. IPAC2012. [29] N. Shipmann, private communication. [30] H. Timko, “Modelling Vacuum Arcs: From Plasma Initiation to Surface Interactions” University of Helsinki Report Series in Physics, HU-P-D188, 2011. [31] F. Djurabekova, J. Samela, H. Timko, K. Nordlund, S. Calatroni, « Crater Formation by Single Ions, Cluster Ions and Ion Showers », Nucl. Instr. And Meth. B (2011). [32] N. Shipman, S. Calatroni, R. M. Jones, W. Wuensch, “Measurement of the dynamic response of the CERN DC spark system and preliminary estimates of the breakdown turn-on time” Proc. IPAC2012. [33] J. W. Wang, G. A. Loew, R. J. Loewen, R. D. Ruth, A. E. Vlieks, I. Wilson, W. Wuensch, “SLAC/CERN high gradient tests on an X-band accelerating section” Proc. PAC95, Dallas.