Embed Size (px)
Citation preview
580 – 1188 West Georgia St. Vancouver, BC, V6E 4A2, Canada | +1.604.681.9770 | www.photosat.ca
by Gerry Mitchell, P. Geo, PhotoSat President
Vancouver BC, May 2018
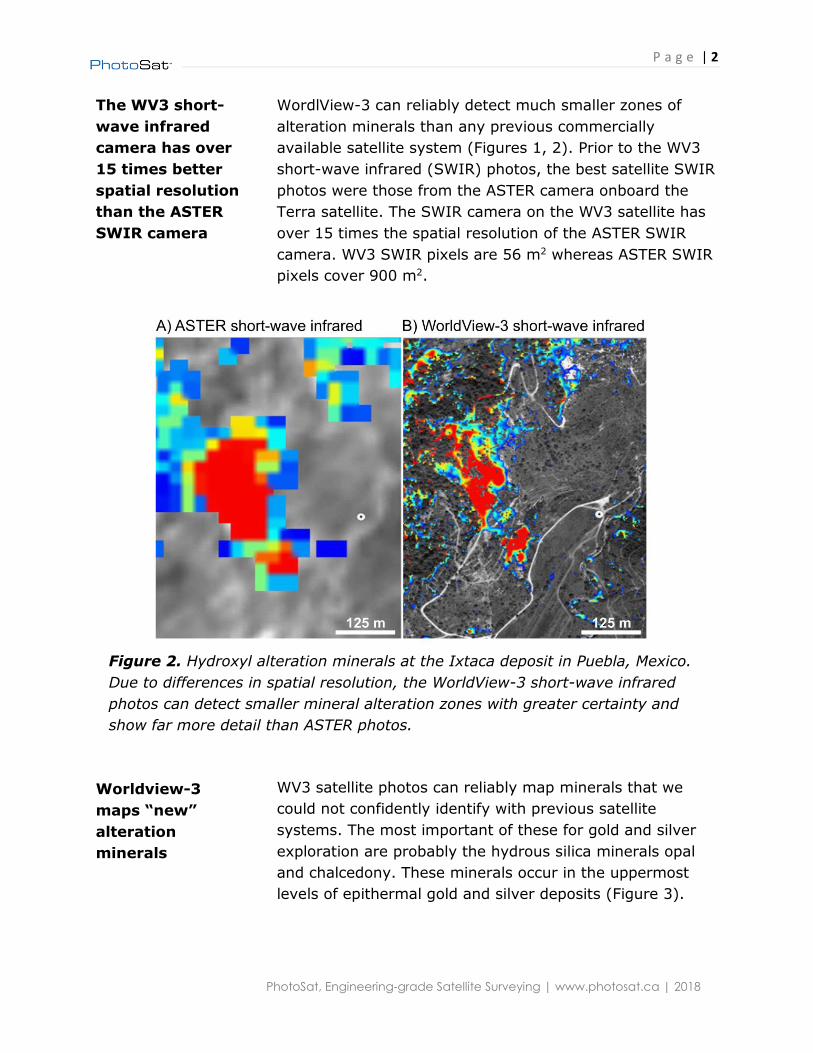
Zones of opal, chalcedony and other hydrous silica minerals at Cuprite, Nevada as detected by the short-wave infrared camera
on the WorldView-3 satellite. These hydrous silica zones can be important indicators of underlying gold and silver deposits.
Advances in satellite alteration mineral
mapping for gold and silver deposits
Higher spectral- and spatial-resolution data and
better algorithms for increasingly detailed predictive mapping

P a g e | 1
PhotoSat, Engineering-grade Satellite Surveying | www.photosat.ca | 2018
Many new
satellite
exploration tools
were developed
since the last
exploration cycle
The new
WorldView-3
(WV3) satellite
photos became
commercially
available in 2015
Figure 1. Silica
mapping in the
Cuprite, Nevada
using ASTER and
WorldView-3
satellite photos. The
WorldView-3 clearly
identifies only the
opal and chalcedony
in the Cuprite
epithermal
alteration zone
while the ASTER
shows all the areas
of high silica.
ew satellite alteration mineral mapping tools and
capabilities have been developed since the last mining
exploration cycle. The last cycle ended for most of us in
2012. Since then there has been very little funding for
mining exploration. Most of these new capabilities are
awaiting their first application in many promising
exploration districts.
The WorldView-3 (WV3) satellite was launched in
September 2014. The WV3 photos became commercially
available in early 2015. WV3 enables much better detection
and mapping of alteration minerals associated with gold
and silver deposits than did previous satellite systems
(Figure 1).
N
P a g e | 2
PhotoSat, Engineering-grade Satellite Surveying | www.photosat.ca | 2018
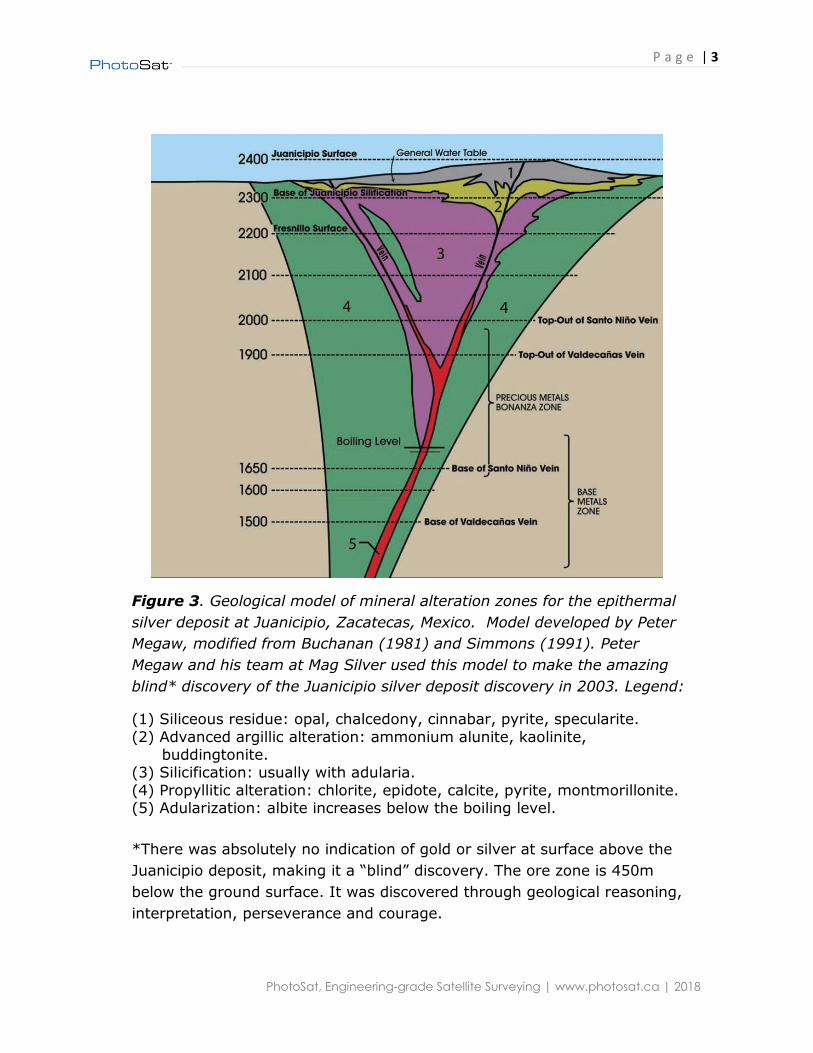
The WV3 short-
wave infrared
camera has over
15 times better
spatial resolution
than the ASTER
SWIR camera
Worldview-3
maps “new”
alteration
minerals
WordlView-3 can reliably detect much smaller zones of
alteration minerals than any previous commercially
available satellite system (Figures 1, 2). Prior to the WV3
short-wave infrared (SWIR) photos, the best satellite SWIR
photos were those from the ASTER camera onboard the
Terra satellite. The SWIR camera on the WV3 satellite has
over 15 times the spatial resolution of the ASTER SWIR
camera. WV3 SWIR pixels are 56 m2 whereas ASTER SWIR
pixels cover 900 m2.
WV3 satellite photos can reliably map minerals that we
could not confidently identify with previous satellite
systems. The most important of these for gold and silver
exploration are probably the hydrous silica minerals opal
and chalcedony. These minerals occur in the uppermost
levels of epithermal gold and silver deposits (Figure 3).
Figure 2. Hydroxyl alteration minerals at the Ixtaca deposit in Puebla, Mexico.
Due to differences in spatial resolution, the WorldView-3 short-wave infrared
photos can detect smaller mineral alteration zones with greater certainty and
show far more detail than ASTER photos.
P a g e | 3
PhotoSat, Engineering-grade Satellite Surveying | www.photosat.ca | 2018
Figure 3. Geological model of mineral alteration zones for the epithermal
silver deposit at Juanicipio, Zacatecas, Mexico. Model developed by Peter
Megaw, modified from Buchanan (1981) and Simmons (1991). Peter
Megaw and his team at Mag Silver used this model to make the amazing
blind* discovery of the Juanicipio silver deposit discovery in 2003. Legend:
(1) Siliceous residue: opal, chalcedony, cinnabar, pyrite, specularite.
(2) Advanced argillic alteration: ammonium alunite, kaolinite, buddingtonite.
(3) Silicification: usually with adularia.
(4) Propyllitic alteration: chlorite, epidote, calcite, pyrite, montmorillonite. (5) Adularization: albite increases below the boiling level.
*There was absolutely no indication of gold or silver at surface above the
Juanicipio deposit, making it a “blind” discovery. The ore zone is 450m
below the ground surface. It was discovered through geological reasoning,
interpretation, perseverance and courage.
P a g e | 4
PhotoSat, Engineering-grade Satellite Surveying | www.photosat.ca | 2018
WV3 has better
definition of the
minerals
associated with
gold and silver
deposits than
ASTER
Alteration
minerals
detectable with
WV3 and/or
ASTER
Many
opportunities to
be first with WV3
alteration mineral
mapping
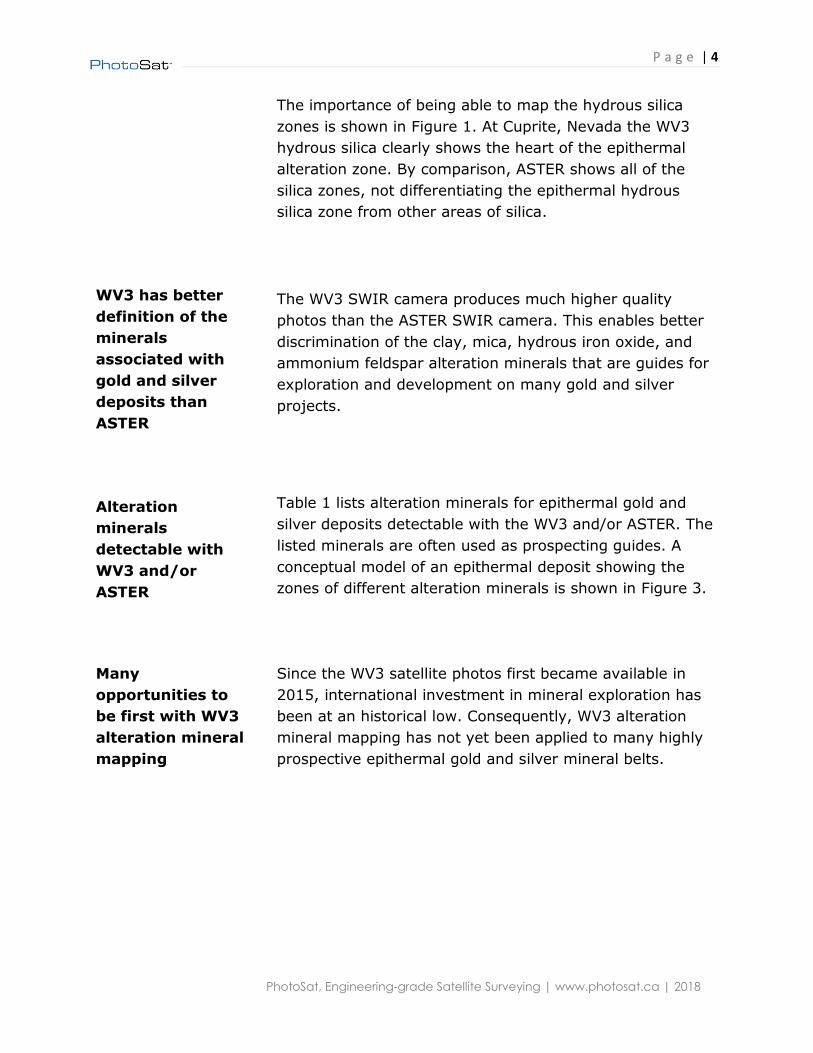
The importance of being able to map the hydrous silica
zones is shown in Figure 1. At Cuprite, Nevada the WV3
hydrous silica clearly shows the heart of the epithermal
alteration zone. By comparison, ASTER shows all of the
silica zones, not differentiating the epithermal hydrous
silica zone from other areas of silica.
The WV3 SWIR camera produces much higher quality
photos than the ASTER SWIR camera. This enables better
discrimination of the clay, mica, hydrous iron oxide, and
ammonium feldspar alteration minerals that are guides for
exploration and development on many gold and silver
projects.
Table 1 lists alteration minerals for epithermal gold and
silver deposits detectable with the WV3 and/or ASTER. The
listed minerals are often used as prospecting guides. A
conceptual model of an epithermal deposit showing the
zones of different alteration minerals is shown in Figure 3.
Since the WV3 satellite photos first became available in
2015, international investment in mineral exploration has
been at an historical low. Consequently, WV3 alteration
mineral mapping has not yet been applied to many highly
prospective epithermal gold and silver mineral belts.
P a g e | 5
PhotoSat, Engineering-grade Satellite Surveying | www.photosat.ca | 2018
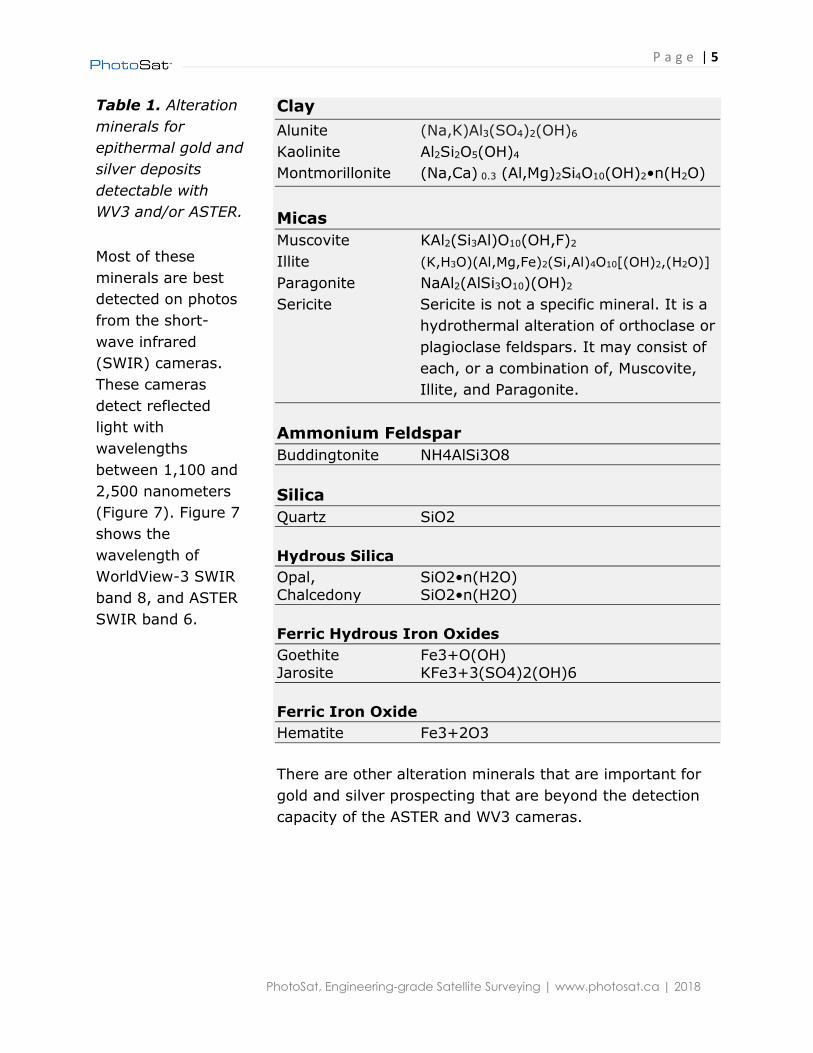
Table 1. Alteration
minerals for
epithermal gold and
silver deposits
detectable with
WV3 and/or ASTER.
Most of these
minerals are best
detected on photos
from the short-
wave infrared
(SWIR) cameras.
These cameras
detect reflected
light with
wavelengths
between 1,100 and
2,500 nanometers
(Figure 7). Figure 7
shows the
wavelength of
WorldView-3 SWIR
band 8, and ASTER
SWIR band 6.
Clay
Alunite (Na,K)Al3(SO4)2(OH)6
Kaolinite Al2Si2O5(OH)4
Montmorillonite (Na,Ca) 0.3 (Al,Mg)2Si4O10(OH)2•n(H2O)
Micas
Muscovite KAl2(Si3Al)O10(OH,F)2
Illite (K,H3O)(Al,Mg,Fe)2(Si,Al)4O10[(OH)2,(H2O)]
Paragonite NaAl2(AlSi3O10)(OH)2
Sericite Sericite is not a specific mineral. It is a
hydrothermal alteration of orthoclase or
plagioclase feldspars. It may consist of
each, or a combination of, Muscovite,
Illite, and Paragonite.
Ammonium Feldspar
Buddingtonite NH4AlSi3O8
Silica
Quartz SiO2
Hydrous Silica
Opal, SiO2•n(H2O) Chalcedony SiO2•n(H2O)
Ferric Hydrous Iron Oxides
Goethite Fe3+O(OH) Jarosite KFe3+3(SO4)2(OH)6
Ferric Iron Oxide
Hematite Fe3+2O3
There are other alteration minerals that are important for
gold and silver prospecting that are beyond the detection
capacity of the ASTER and WV3 cameras.

P a g e | 6
PhotoSat, Engineering-grade Satellite Surveying | www.photosat.ca | 2018
USGS High
Resolution
Spectral Library
The reflectance spectra of mineral samples form the basis
for much of the improvement in satellite mineral mapping.
The US Geological Survey has an extensive publicly
available library of mineral reflectance spectra: USGS
Spectral Library.
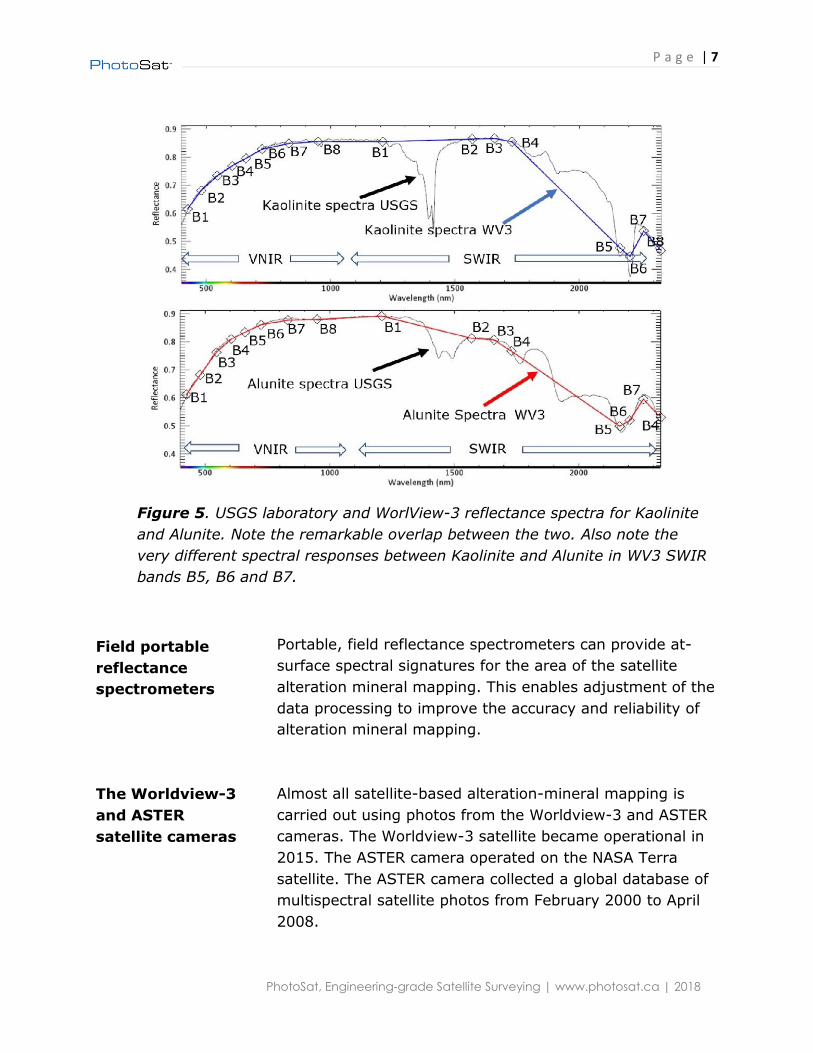
Mineral reflectance spectra from this library is used to
determine the expected spectral signatures of different
minerals in multiband satellite photos. Figure 5 shows the
expected spectral signatures of the clay alteration minerals
Kaolinite and Alunite on WV3 visible and near-infrared and
short-wave-infrared satellite photos. WV3 is much better at
differentiating the reflectance responses of kaolinite and
alunite than previous satellite systems.
Figure 4. WorldView-3 indications of kaolinite and alunite alteration at the
Juanicipio silver deposit, Zacatecas, Mexico. Worldview-3 is much better at
differentiating kaolinite and alunite than previous satellite systems. The silver
veins are more than 400m below the current ground surface.
P a g e | 7
PhotoSat, Engineering-grade Satellite Surveying | www.photosat.ca | 2018
Field portable
reflectance
spectrometers
The Worldview-3
and ASTER
satellite cameras
Portable, field reflectance spectrometers can provide at-
surface spectral signatures for the area of the satellite
alteration mineral mapping. This enables adjustment of the
data processing to improve the accuracy and reliability of
alteration mineral mapping.
Almost all satellite-based alteration-mineral mapping is
carried out using photos from the Worldview-3 and ASTER
cameras. The Worldview-3 satellite became operational in
2015. The ASTER camera operated on the NASA Terra
satellite. The ASTER camera collected a global database of
multispectral satellite photos from February 2000 to April
2008.
Figure 5. USGS laboratory and WorlView-3 reflectance spectra for Kaolinite
and Alunite. Note the remarkable overlap between the two. Also note the
very different spectral responses between Kaolinite and Alunite in WV3 SWIR
bands B5, B6 and B7.
P a g e | 8
PhotoSat, Engineering-grade Satellite Surveying | www.photosat.ca | 2018
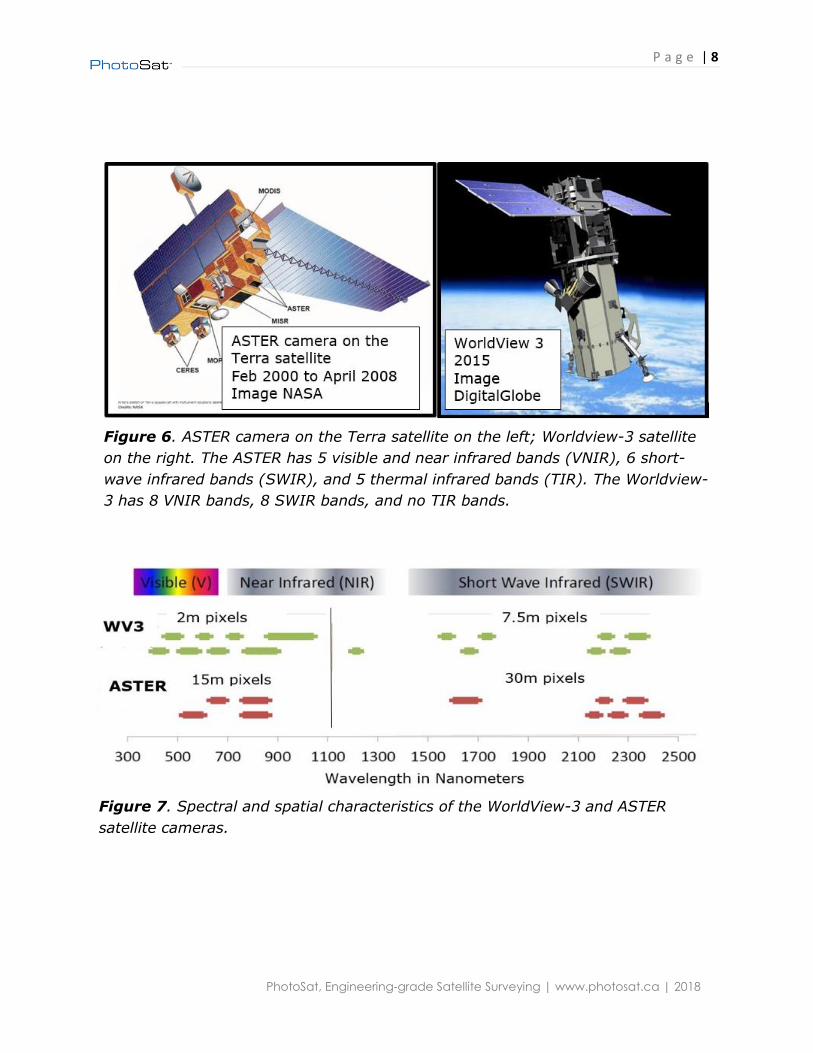
Figure 6. ASTER camera on the Terra satellite on the left; Worldview-3 satellite
on the right. The ASTER has 5 visible and near infrared bands (VNIR), 6 short-
wave infrared bands (SWIR), and 5 thermal infrared bands (TIR). The Worldview-
3 has 8 VNIR bands, 8 SWIR bands, and no TIR bands.
Figure 7. Spectral and spatial characteristics of the WorldView-3 and ASTER
satellite cameras.

P a g e | 9
PhotoSat, Engineering-grade Satellite Surveying | www.photosat.ca | 2018
Worldview-3 is
the only
operating
commercial
satellite with a
multiband SWIR
camera
ASTER alteration
mineral mapping
is still the best
technology for
regional
prospecting of
thousands of
square kilometers
The 8-band, 7.5m ground-resolution WV3 SWIR camera is
currently the only satellite camera in orbit with a multiband
short-wave infrared (SWIR) spectral range. The WV3 SWIR
satellite photos have better signal-to-noise ratio and a
wider dynamic range than any previous commercially
available SWIR satellite photos. The spectral and spatial
characteristics of the WV3 satellite camera are shown in
Figure 7.
The global database of ASTER satellite photos collected by
NASA and JAXA between 2000 and 2008 is still the best
data for alteration mineral studies of thousands of square
kilometers, covering large portions of mineral belts.
Figures 8 and 9 show examples of gold deposits with
distinctive alteration mineral anomalies on ASTER satellite
photos that were collected before the discovery of the
deposits.
Figure 8. ASTER silica and hydroxyl alteration over the El Sauzal gold mine in
western Chihuahua, Mexico. This ASTER photo predates the discovery of the
mine. Red represents strong, probable alteration. Blue represents weak, possible,
alteration.
P a g e | 10
PhotoSat, Engineering-grade Satellite Surveying | www.photosat.ca | 2018
Advances in
satellite image
processing
knowledge and
methods are
improving WV3
and ASTER
alteration mineral
mapping
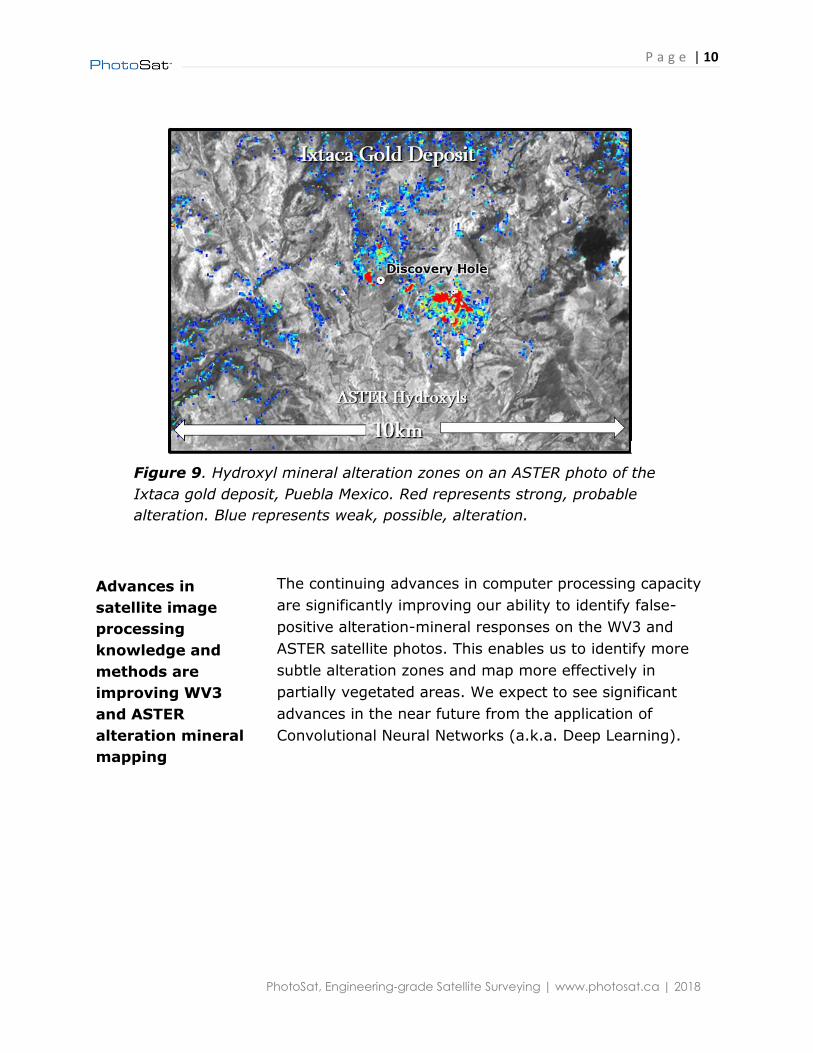
The continuing advances in computer processing capacity
are significantly improving our ability to identify false-
positive alteration-mineral responses on the WV3 and
ASTER satellite photos. This enables us to identify more
subtle alteration zones and map more effectively in
partially vegetated areas. We expect to see significant
advances in the near future from the application of
Convolutional Neural Networks (a.k.a. Deep Learning).
Figure 9. Hydroxyl mineral alteration zones on an ASTER photo of the
Ixtaca gold deposit, Puebla Mexico. Red represents strong, probable
alteration. Blue represents weak, possible, alteration.
P a g e | 11
PhotoSat, Engineering-grade Satellite Surveying | www.photosat.ca | 2018
References:
Megaw Peter K.M., 2010 Discovery of the Silver-Rich
Juanicipio-Valdecañas Vein Zone, Western Fresnillo District,
Zacatecas, Mexico, Society of Economic Geologists,
Inc.Special Publication 15, pp. 119–132
Swayze, G.A., R.N. Clark, A.F.H. Goetz, K.E. Livo, G.N.
Breit, F.A. Kruse, S.J. Stutley, L.W. Snee, H.A. Lowers, J.L.
Post, R.E. Stoffregen, and R.P. Ashley, 2014, Mapping
advanced argillic alteration at Cuprite, Nevada using
imaging spectroscopy: Economic Geology, v. 109, no. 5, p.
1179-1221. doi:10.2113/econgeo.109.5.1179
Fred A. Kruse, William M. Baugh, and Sandra L. Perry,
2015, Validation of DigitalGlobe WorldView-3 Earth
imaging,satellite shortwave infrared bands for mineral
mapping: Journal of Applied Remote Sensing 096044-1
Vol. 9, 2015


![Low temperature aqueous alteration of basalt: Mineral ... et al., 2012], hydrothermal and low temperature aqueous alteration of basalt in Svalbard, Norway [Hausrath et al., 2008a,](https://img.pdfslide.us/doc/110x75/5ab25bfc7f8b9a00728d2abf/low-temperature-aqueous-alteration-of-basalt-mineral-et-al-2012-hydrothermal.jpg)


![Mapping Subsurface Alteration Using Gravity and · PDF fileMapping Subsurface Alteration Using Gravity and Magnetic Inversion Models Williams, N. [1], Dipple, G. [1] _____ 1. Mineral](https://img.pdfslide.us/doc/110x75/5abe32647f8b9ad8278cdba9/mapping-subsurface-alteration-using-gravity-and-subsurface-alteration-using.jpg)