Embed Size (px)
Citation preview
CHAPTER 1
PLANT GROWTH AND DEVELOPMENT UNDERSALINITY STRESS
A. LÄUCHLI AND S.R. GRATTANDepartment of Land, Air and Water Resources, University of California, One Shields Ave.,Davis, CA 95616, USA
Abstract: Plant growth and development are adversely affected by salinity – a major environmentalstress that limits agricultural production. This chapter provides an overview of thephysiological mechanisms by which growth and development of crop plants are affectedby salinity. The initial phase of growth reduction is due to an osmotic effect, is similarto the initial response to water stress and shows little genotypic differences. The second,slower effect is the result of salt toxicity in leaves. In the second phase a salt sensitivespecies or genotype differs from a more salt tolerant one by its inability to prevent saltaccumulation in leaves to toxic levels. Most crop plants are salt tolerant at germinationbut salt sensitive during emergence and vegetative development. Root and shoot growthis inhibited by salinity; however, supplemental Ca partly alleviates the growth inhibition.The Ca effect appears related to the maintenance of plasma membrane selectivity forK over Na. Reproductive development is considered less sensitive to salt stress thanvegetative growth, although in wheat salt stress can hasten reproductive growth, inhibitspike development and decrease the yield potential, whereas in the more salt sensitiverice, low yield is primarily associated with reduction in tillers, and by sterile spikeletsin some cultivars.Plants with improved salt tolerance must thrive under saline field conditions withnumerous additional stresses. Salinity shows interactions with several stresses, amongothers with boron toxicity, but the mechanisms of salinity-boron interactions are stillpoorly known. To better understand crop tolerance under saline field conditions, futureresearch should focus on tolerance of crops to a combination of stresses
Keywords: Vegetative growth, reproductive growth, development, salinity stress, boron, osmotic,ionic, crop
1. INTRODUCTION
In the preface to the ‘Special Issue: Plants and salinity’, Tim Flowers (2006) empha-sized that “Salinity has been a threat to agriculture in some parts of the world forover 3000 years; in recent times, the threat has grown”. As the world populationcontinues to increase, more food needs to be grown to feed the people. This can
1
and Salt Tolerant Crops, 1–32.© 2007 Springer.
M.A. Jenks et al. (eds.), Advances in Molecular Breeding Toward Drought
2 LÄUCHLI AND GRATTAN
be achieved by an increase in cultivated land and by an increase in crop produc-tivity per area. The former has brought agriculture to marginal, salt-affected lands.Moreover, the salinity problem has been aggravated by the requirement of irrigationfor crop production in arid and semiarid environments. It is estimated that at least20% of all irrigated lands are salt-affected (Pitman and Läuchli, 2002). About 17%of the cultivated land is under irrigation; yet, irrigated agriculture contributes morethan 30% of the total agricultural production (Hillel, 2000). The total global areaof salt-affected soils has recently been estimated to be approximately 830 millionhectares (Martinez-Beltran and Manzur, 2005). The different types of soil salinitythat impact agricultural productivity, i.e. irrigation-induced salinity and ‘transient’dry-land salinity have been characterized in detail by Rengasamy (2006), withspecial emphasis on Australia. Clearly, soil salinity is one of the major environ-mental stresses that limit agricultural productivity worldwide.
Population growth on the one hand and land degradation by salinization on theother have led plant scientists to the concept of developing salt-tolerant crops bygenetic approaches (see recent reviews by Cuartero et al., 2006; Munns, 2005;Munns et al., 2006; Yamaguchi and Blumwald, 2005). However, the physiological,biochemical and molecular mechanisms of salt tolerance in plants are not yet suffi-ciently understood, and hence progress in developing salt tolerant crops has beenslow. This chapter provides a brief overview of our present physiological knowledgeof how growth and development of plants are affected by salinity. The focus is onannual crop species with special emphasis on cereals. Furthermore, crop growth anddevelopment under salinity stress will be discussed for both controlled and naturalagricultural environments. The still poorly-understood relationship between sodiumuptake and salt tolerance has been assessed in depth by Tester and Davenport (2003)but will only be covered briefly in this chapter. In the context of saline agriculturalenvironments, soil salinity is often accompanied by additional abiotic and bioticstresses. For example, high boron concentrations often occur in saline environ-ments. Therefore interactions between salinity and boron toxicity in crops are alsoexamined. Our chapter does not focus on biochemical and molecular mechanisms ofsalt tolerance. For recent reviews that focus on these mechanisms, see for exampleHasegawa et al. (2000), Zhu (2002), and Koiwa et al. (2006). Finally genomics-typetechnologies are beginning to enhance our understanding of how genes, proteins andmetabolite profiles and their interactions and dynamic changes respond to salinity.For more information on these complex interactions see Bohnert et al. (2006).
2. SALINITY STRESS AND PLANT DEVELOPMENT
Salinity affects plants in different ways such as osmotic effects, specific-ion toxicityand/or nutritional disorders (Läuchli and Epstein, 1990). The extent by which onemechanism affects the plant over the others depends upon many factors includingthe species, genotype, plant age, ionic strength and composition of the salinizingsolution, and the organ in question.
PLANT GROWTH AND DEVELOPMENT UNDER SALINITY STRESS 3
Plants undergo characteristic changes from the time salinity stress is imposeduntil they reach maturity (Munns, 2002a). This author describes these changes overdifferent time scales in the plant’s development. Moments after salinization, cellsdehydrate and shrink, but regain their original volume hours later. Despite thisrecovery, cell elongation and to a lesser extent cell division, are reduced leading tolower rates of leaf and root growth. Over the next days, reductions in cell divisionand elongation translate into slower leaf appearance and size. Plants that are severelysalt-stressed often develop visual injury due to excessive salt uptake. After weeks,lateral shoot development is affected and after months, clear differences in overallgrowth and injury are observed between salt-stressed plants and their non-stressedcontrols.
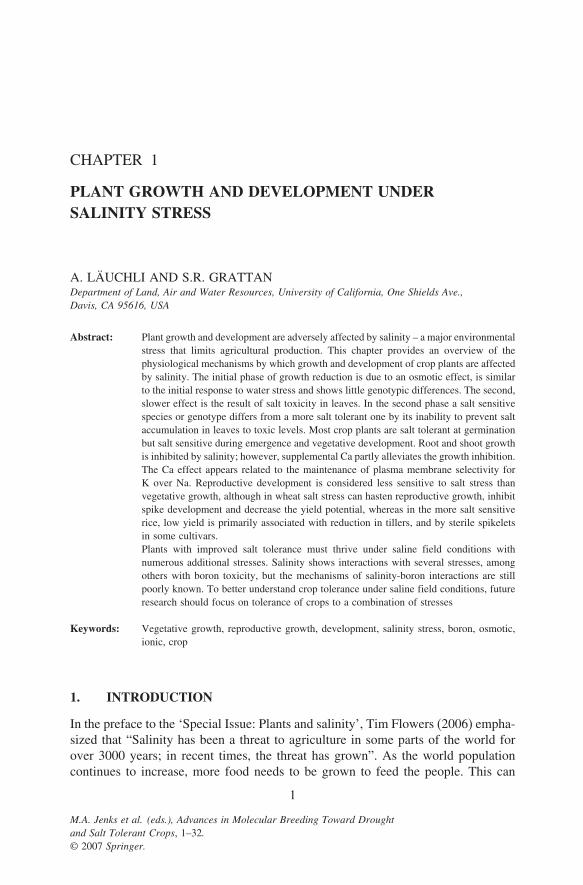
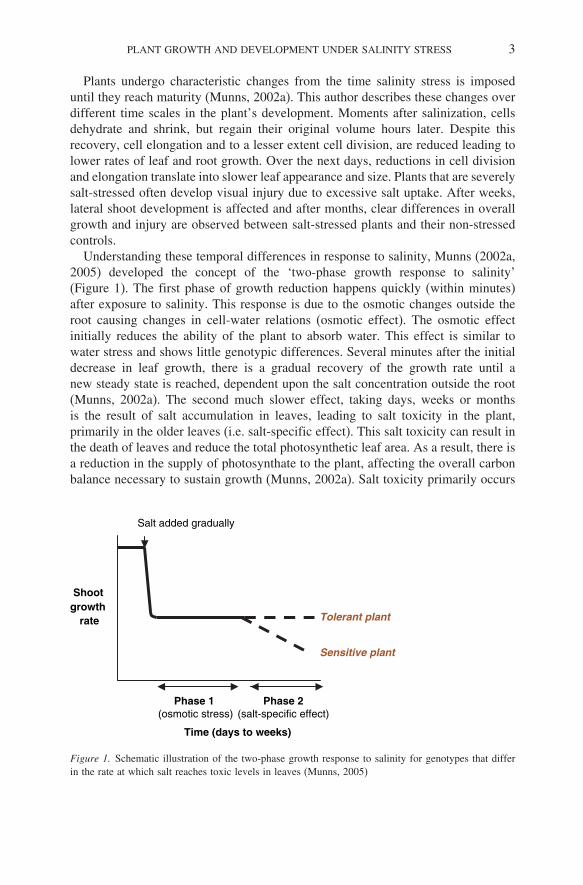
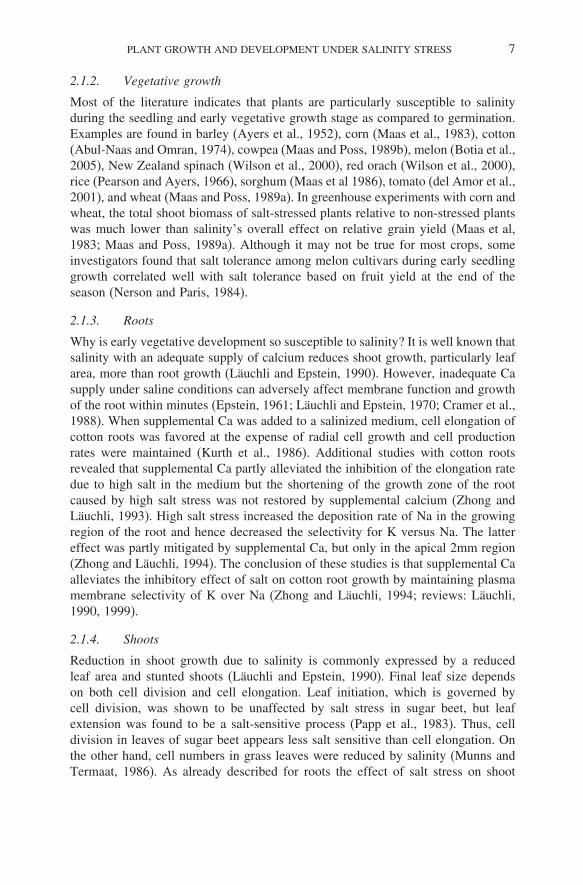
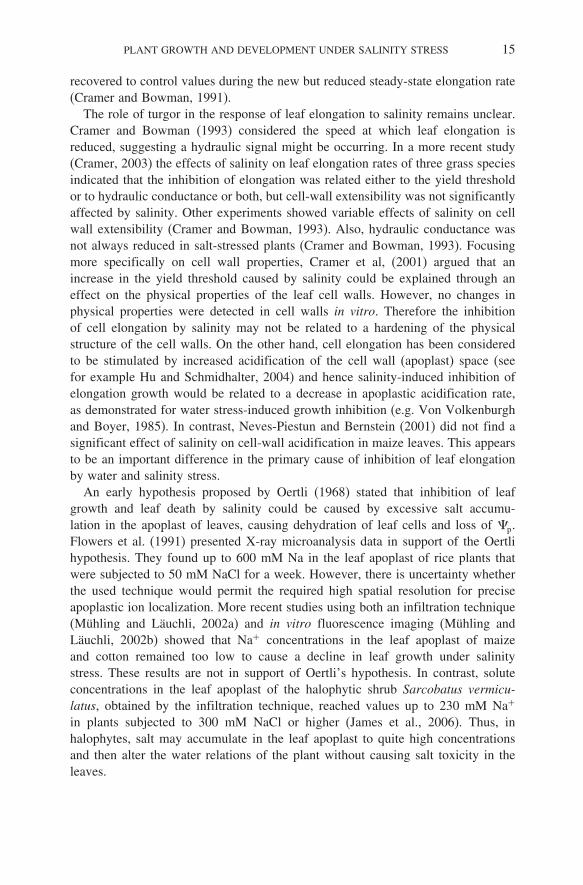
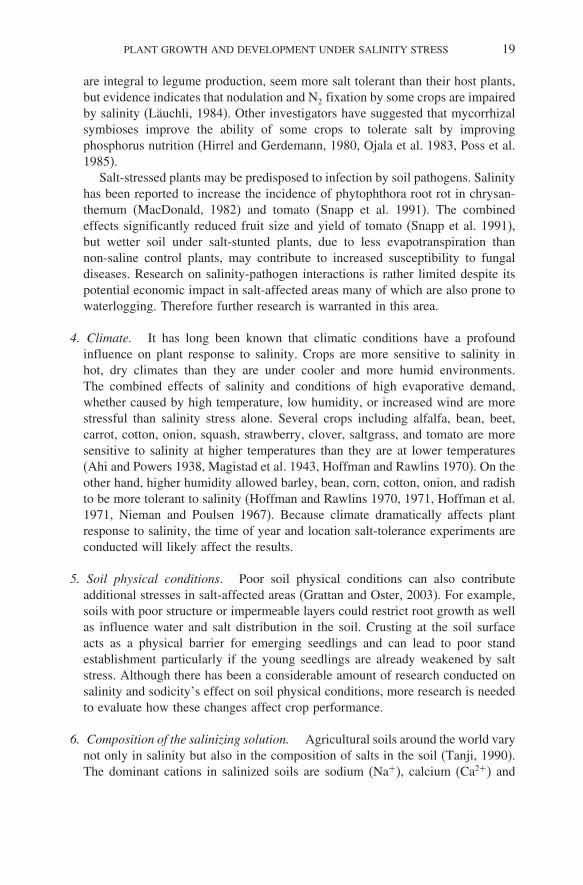
Understanding these temporal differences in response to salinity, Munns (2002a,2005) developed the concept of the ‘two-phase growth response to salinity’(Figure 1). The first phase of growth reduction happens quickly (within minutes)after exposure to salinity. This response is due to the osmotic changes outside theroot causing changes in cell-water relations (osmotic effect). The osmotic effectinitially reduces the ability of the plant to absorb water. This effect is similar towater stress and shows little genotypic differences. Several minutes after the initialdecrease in leaf growth, there is a gradual recovery of the growth rate until anew steady state is reached, dependent upon the salt concentration outside the root(Munns, 2002a). The second much slower effect, taking days, weeks or monthsis the result of salt accumulation in leaves, leading to salt toxicity in the plant,primarily in the older leaves (i.e. salt-specific effect). This salt toxicity can result inthe death of leaves and reduce the total photosynthetic leaf area. As a result, there isa reduction in the supply of photosynthate to the plant, affecting the overall carbonbalance necessary to sustain growth (Munns, 2002a). Salt toxicity primarily occurs
Salt added gradually
Phase 1 (osmotic stress)
Phase 2(salt-specific effect)
Shoot growth
rate
Time (days to weeks)
Tolerant plant
Sensitive plant
Figure 1. Schematic illustration of the two-phase growth response to salinity for genotypes that differin the rate at which salt reaches toxic levels in leaves (Munns, 2005)
4 LÄUCHLI AND GRATTAN
in the older leaves where Na and Cl build up in the transpiring leaves over a longperiod of time, resulting in high salt concentration and leaf death. Leaf injury anddeath is probably due to the high salt load in the leaf that exceeds the capacity ofsalt compartmentation in the vacuoles, causing salt to build up in the cytoplasm totoxic levels (Munns and Termaat, 1986; Munns 2002a; 2005; Munns et al, 2006).The rate at which leaves die and thus reduce the total photosynthetic leaf area deter-mines the survival of the plant. If new leaves are produced at a rate greater thanthe rate at which old leaves die, there are enough photosynthesizing leaves for theplant to flower and produce seeds, although at reduced numbers. If, however, oldleaves die faster than new leaves develop, the plant may not survive long enoughto supply sufficient photosynthate to the reproductive organs and produce viableseeds. Based on this two-phase concept, the initial growth reduction for both saltsensitive and salt tolerant plants is caused by an osmotic effect of the salts in themedium outside the roots. In contrast, in the second phase, a salt-sensitive speciesor genotype differs from a more salt tolerant one by its inability to prevent saltfrom accumulating in transpiring leaves to toxic levels (Munns et al, 2006).
In light of the different mechanisms of plant response to salinity (Läuchli andEpstein, 1990) and characteristic sequential changes which the plants endure afterbeing exposed to salinity (Munns, 2002a), are their specific developmental stageswhere the plants are more or less sensitive to salinity?
2.1. Salt Sensitivity in Relation to Developmental Growth Stage
It has long been recognized that a crop’s sensitivity to salinity varies from onedevelopmental growth stage to the next (Bernstein and Hayward, 1958). Althoughthere are exceptions, the majority of the research indicates that most annual cropsare tolerant at germination but are sensitive during emergence and early vegetativedevelopment (Läuchli and Epstein, 1990; Maas and Grattan, 1999). As plantsmature, they become progressively more tolerant to salinity, particularly at laterstages of development. While these statements are generally true (with the exceptionof perhaps a few crops), it is important to emphasize that the definition of salttolerance is not the same for each growth stage. During germination and emergence,tolerance is based on percent survival, while during the later developmental stages,tolerance is usually based on relative growth reductions.
Salinity affects both vegetative and reproductive development which has profoundimplications depending on whether the harvested organ is a stem, leaf, root, shoot,fruit, fiber or grain. Salinity often reduces shoot growth more than root growth(Läuchli and Epstein, 1990) and can reduce the number of florets per ear, increasesterility and affect the time of flowering and maturity in both wheat (Maas andPoss, 1989a) and rice (Khatun et al. 1995). Since salt-tolerance from an agronomicor horticulturist perspective is based on the yield of the harvestable organ, relativeto that in non-stressed environments, understanding how salinity affects vegetativeand reproductive development is important for developing management strategiesthat can minimize stress at critical times.
PLANT GROWTH AND DEVELOPMENT UNDER SALINITY STRESS 5
2.1.1. Germination and seedling emergence
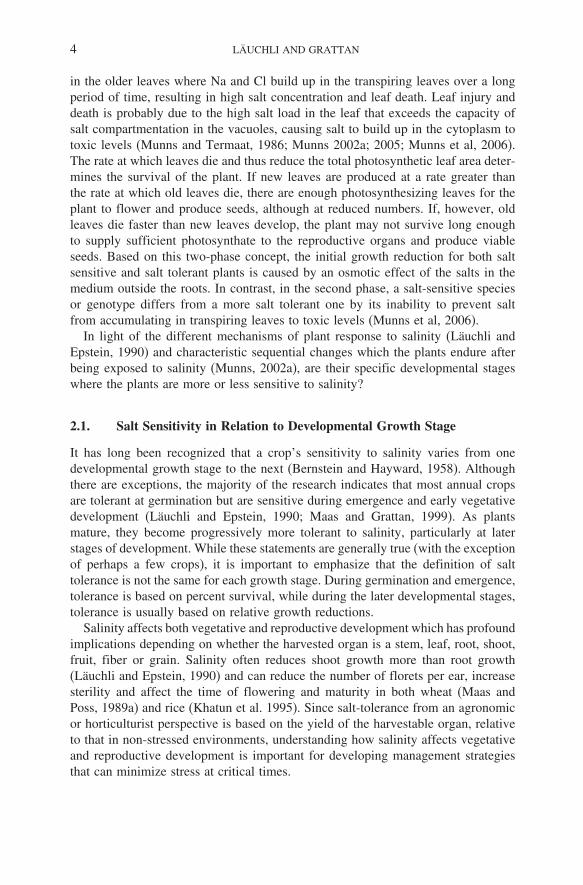
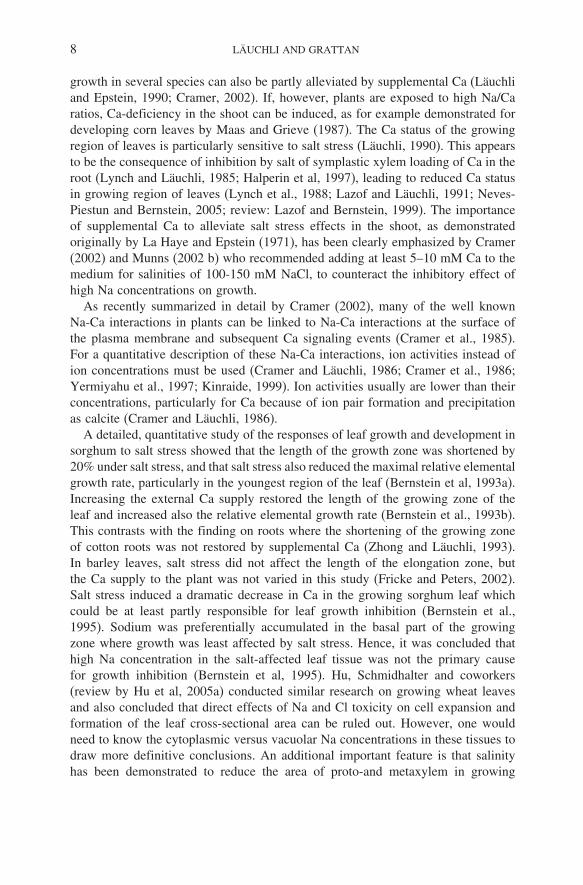
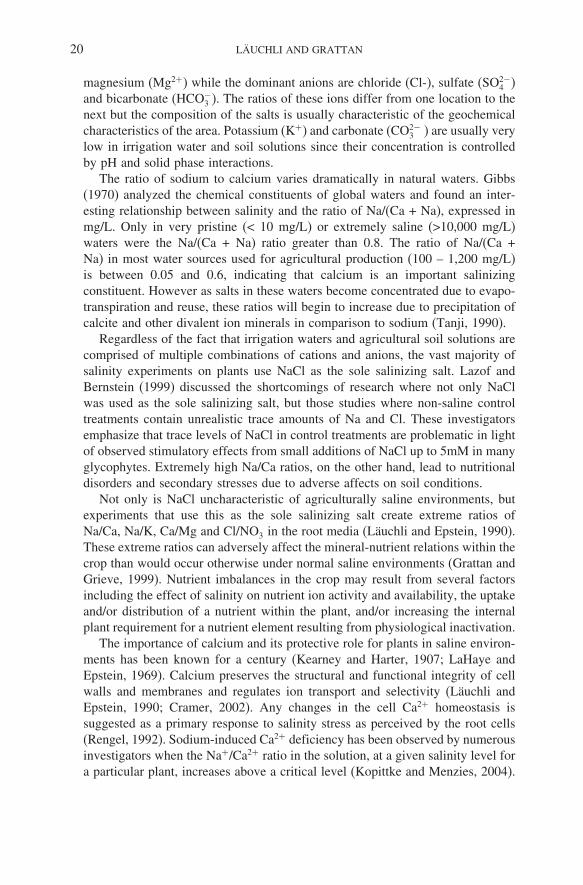
Although most plants are tolerant during germination, salinity stress delays thisprocess even though there may be no difference in the percentage of germi-nated seeds from one treatment to another (Maas and Poss, 1989a). It is thisobservation that categorizes this developmental stage for most crops as ‘salttolerant’. For example, salinity up to 10 dS/m actually stimulated the germi-nation of Limonium perezii seeds, a commercially grown ornamental flower, yetsalinities above 6 dS/m reduced stem length, adversely affecting quality andmarketability (Carter et. al., 2005). Even though salinity delays germination, highersalt concentrations will eventually reduce the percentage of germinated seeds (Kentand Läuchli, 1985; Badia and Meiri, 1994; Mauromicale and Licandro, 2002)(Figure 2). While most crops show enhanced tolerance to salinity during germi-nation, this is not true for sugar beet, a crop categorized as salt tolerant whichis somewhat sensitive to salinity at germination (Läuchli and Epstein, 1990).There are even differences in tolerance among cultivars (e.g. Ahmad et al., 2005;Bayuelo-Jimenez et al., 2002) and these differences do not necessarily corre-spond to seasonal tolerance, as shown for melon (Nerson and Paris, 1984), bean(Bayuelo-Jimenez et al., 2002) and rice (Heenan et al., 1988). On the other hand,salt tolerant barley varieties germinated faster and showed a much higher germi-nation percentage than the more sensitive ones (Tajbakhsh et al., 2006). Regardless,salt tolerance screening at germination provides little basis for assessing crop salttolerance.
The vast majority of these germination studies have been conducted in thelaboratory using Petri-dish like containers with germination paper saturated withsolutions that vary in salinity. While easy to observe germination, such artificialenvironments are uncharacteristic of field conditions (Esechie et. al., 2002). In
Time (days)
Per
cen
t G
erm
inat
ion
100
50
Low salinity Moderate
salinity
High salinity
0
Figure 2. Generalized relationship between percent germination and time after water addition at low,moderate and high salinity. The germination rates and percentage of germinated seeds at a particulartime various considerably among species and cultivars
6 LÄUCHLI AND GRATTAN
addition, other variables such as seed viability, dormancy, seed coat pretreatmentand permeability to water may complicate data interpretations and comparisonswith other crops or to other developmental stages.
Unlike at germination, most crops are susceptible to salinity during emergence,which is based more on observation than quantitative research. Emergence studieshave been conducted using different root media under various environmental condi-tions, making interpretation of the results and comparisons with other studiesdifficult, if not impossible. Moreover, most studies were conducted using NaCl asthe sole salinizing salt, which is uncharacteristic of most salt-affected soils. Whenstudies are conducted in mineral soils using NaCl solutions, sodicity (high sodiumrelative to calcium plus magnesium) can cause adverse effects on soil physicalconditions, reducing oxygen diffusion rates and increasing soil strength (Grattanand Oster, 2003). This could inadvertently add unwanted stresses to the emergingseedlings.
Salinity delays emergence and if the stress is severe enough, stand establishmentcan be reduced (Maas and Grattan, 1999). Crop tolerance during this sensitivegrowth-stage differs considerably among crops and like germination, does notcorrelate well with crop tolerances based on yield-response functions. For examplecotton, a crop known to be salt tolerant based on lint yields, is particularly prone topoor stands in fields that were previously irrigated with saline-sodic water (Grattanand Oster, 2003), despite the fact that salinity in the upper soil profile was lessthan the soil-salinity threshold1 for cotton. In a related long-term field study, plantdensity of cotton was severely reduced by irrigation with saline drainage water of4,500 mg/L TDS (EC∼ 7ds/m) for three consecutive years (Goyal et al., 1999).These authors concluded that stand establishment was possibly the main reason forreduction in lint yield.
Under field conditions, germinated seedlings encounter a number of biotic andabiotic stresses. In addition to salinity, young seedlings near the soil surface aresubjected to water stress (Katerji et al., 1994), fluctuating salinities due to capillaryrise and evaporation (Pasternak et al., 1979), diurnal changes in soil temperature andsurface crusts. Studies have shown that salinity is more detrimental to germinationof seeds outside their optimal temperature range for germination (Vinizky andRay, 1988). Also, because salinity delays germination and emergence, the youngsalt-stressed seedlings may be more susceptible to hypocotyl and cotyledon injury(Miyamoto et al., 1985; Esechie et al., 2002) or attack by pathogens. Although itis likely that this unavoidable combination of stresses that the emerging seedlingsendure under field conditions can reduce the percentage of emerged seedlings,we are not aware of any in-depth evaluation on the tolerance of young seedlingsunder field or simulated field conditions. Such research would be valuable tobetter understand how crops respond to integrated biotic and abiotic stresses theyencounter between germination and emergence.
1 Yield threshold refers to the maximum soil salinity (expressed as the electrical conductivity of thesaturated soil paste, ECe) that a plant can endure in the rootzone and still maintain optimal yield.
PLANT GROWTH AND DEVELOPMENT UNDER SALINITY STRESS 7
2.1.2. Vegetative growth
Most of the literature indicates that plants are particularly susceptible to salinityduring the seedling and early vegetative growth stage as compared to germination.Examples are found in barley (Ayers et al., 1952), corn (Maas et al., 1983), cotton(Abul-Naas and Omran, 1974), cowpea (Maas and Poss, 1989b), melon (Botia et al.,2005), New Zealand spinach (Wilson et al., 2000), red orach (Wilson et al., 2000),rice (Pearson and Ayers, 1966), sorghum (Maas et al 1986), tomato (del Amor et al.,2001), and wheat (Maas and Poss, 1989a). In greenhouse experiments with corn andwheat, the total shoot biomass of salt-stressed plants relative to non-stressed plantswas much lower than salinity’s overall effect on relative grain yield (Maas et al,1983; Maas and Poss, 1989a). Although it may not be true for most crops, someinvestigators found that salt tolerance among melon cultivars during early seedlinggrowth correlated well with salt tolerance based on fruit yield at the end of theseason (Nerson and Paris, 1984).
2.1.3. Roots
Why is early vegetative development so susceptible to salinity? It is well known thatsalinity with an adequate supply of calcium reduces shoot growth, particularly leafarea, more than root growth (Läuchli and Epstein, 1990). However, inadequate Casupply under saline conditions can adversely affect membrane function and growthof the root within minutes (Epstein, 1961; Läuchli and Epstein, 1970; Cramer et al.,1988). When supplemental Ca was added to a salinized medium, cell elongation ofcotton roots was favored at the expense of radial cell growth and cell productionrates were maintained (Kurth et al., 1986). Additional studies with cotton rootsrevealed that supplemental Ca partly alleviated the inhibition of the elongation ratedue to high salt in the medium but the shortening of the growth zone of the rootcaused by high salt stress was not restored by supplemental calcium (Zhong andLäuchli, 1993). High salt stress increased the deposition rate of Na in the growingregion of the root and hence decreased the selectivity for K versus Na. The lattereffect was partly mitigated by supplemental Ca, but only in the apical 2mm region(Zhong and Läuchli, 1994). The conclusion of these studies is that supplemental Caalleviates the inhibitory effect of salt on cotton root growth by maintaining plasmamembrane selectivity of K over Na (Zhong and Läuchli, 1994; reviews: Läuchli,1990, 1999).
2.1.4. Shoots
Reduction in shoot growth due to salinity is commonly expressed by a reducedleaf area and stunted shoots (Läuchli and Epstein, 1990). Final leaf size dependson both cell division and cell elongation. Leaf initiation, which is governed bycell division, was shown to be unaffected by salt stress in sugar beet, but leafextension was found to be a salt-sensitive process (Papp et al., 1983). Thus, celldivision in leaves of sugar beet appears less salt sensitive than cell elongation. Onthe other hand, cell numbers in grass leaves were reduced by salinity (Munns andTermaat, 1986). As already described for roots the effect of salt stress on shoot
8 LÄUCHLI AND GRATTAN
growth in several species can also be partly alleviated by supplemental Ca (Läuchliand Epstein, 1990; Cramer, 2002). If, however, plants are exposed to high Na/Caratios, Ca-deficiency in the shoot can be induced, as for example demonstrated fordeveloping corn leaves by Maas and Grieve (1987). The Ca status of the growingregion of leaves is particularly sensitive to salt stress (Läuchli, 1990). This appearsto be the consequence of inhibition by salt of symplastic xylem loading of Ca in theroot (Lynch and Läuchli, 1985; Halperin et al, 1997), leading to reduced Ca statusin growing region of leaves (Lynch et al., 1988; Lazof and Läuchli, 1991; Neves-Piestun and Bernstein, 2005; review: Lazof and Bernstein, 1999). The importanceof supplemental Ca to alleviate salt stress effects in the shoot, as demonstratedoriginally by La Haye and Epstein (1971), has been clearly emphasized by Cramer(2002) and Munns (2002 b) who recommended adding at least 5–10 mM Ca to themedium for salinities of 100-150 mM NaCl, to counteract the inhibitory effect ofhigh Na concentrations on growth.
As recently summarized in detail by Cramer (2002), many of the well knownNa-Ca interactions in plants can be linked to Na-Ca interactions at the surface ofthe plasma membrane and subsequent Ca signaling events (Cramer et al., 1985).For a quantitative description of these Na-Ca interactions, ion activities instead ofion concentrations must be used (Cramer and Läuchli, 1986; Cramer et al., 1986;Yermiyahu et al., 1997; Kinraide, 1999). Ion activities usually are lower than theirconcentrations, particularly for Ca because of ion pair formation and precipitationas calcite (Cramer and Läuchli, 1986).
A detailed, quantitative study of the responses of leaf growth and development insorghum to salt stress showed that the length of the growth zone was shortened by20% under salt stress, and that salt stress also reduced the maximal relative elementalgrowth rate, particularly in the youngest region of the leaf (Bernstein et al, 1993a).Increasing the external Ca supply restored the length of the growing zone of theleaf and increased also the relative elemental growth rate (Bernstein et al., 1993b).This contrasts with the finding on roots where the shortening of the growing zoneof cotton roots was not restored by supplemental Ca (Zhong and Läuchli, 1993).In barley leaves, salt stress did not affect the length of the elongation zone, butthe Ca supply to the plant was not varied in this study (Fricke and Peters, 2002).Salt stress induced a dramatic decrease in Ca in the growing sorghum leaf whichcould be at least partly responsible for leaf growth inhibition (Bernstein et al.,1995). Sodium was preferentially accumulated in the basal part of the growingzone where growth was least affected by salt stress. Hence, it was concluded thathigh Na concentration in the salt-affected leaf tissue was not the primary causefor growth inhibition (Bernstein et al, 1995). Hu, Schmidhalter and coworkers(review by Hu et al, 2005a) conducted similar research on growing wheat leavesand also concluded that direct effects of Na and Cl toxicity on cell expansion andformation of the leaf cross-sectional area can be ruled out. However, one wouldneed to know the cytoplasmic versus vacuolar Na concentrations in these tissues todraw more definitive conclusions. An additional important feature is that salinityhas been demonstrated to reduce the area of proto-and metaxylem in growing
PLANT GROWTH AND DEVELOPMENT UNDER SALINITY STRESS 9
leaves of sorghum (Baum et al, 2000) and wheat (Hu et al., 2005b) which may beresponsible for decreased water deposition into the growing region of leaves. Thiscould indirectly affect transport of Na and Cl and of nutrient ions to the growingleaves.
2.1.5. Reproductive growth
After the salt-sensitive early-vegetative growth stage, the bulk of the researchsuggests that most crops become progressively more tolerant as the plants grow older(Läuchli and Epstein, 1990; Maas and Grattan, 1999). There have been numerousstudies characterizing crop response to salinity at various developmental growthstages. However, many of them did not evaluate plant response during the entirelifespan of the crop and those that did, most studies imposed salt stress at varioustimes after emergence and continued the stress until harvest. The difficulty withthe latter group of studies is that treatments give preferential favoritism to the latergrowth stages since the duration of salt-stress was less.
There were several studies, however, where the duration of salinity stress washeld constant but the period of salt-stress imposition varied from one developmentalstage to the next. These studies were conducted using re-circulating sand tankswhere transient salinity conditions can readily be controlled. In experiments withwheat (Maas and Poss, 1989a), sorghum (Maas et al., 1986) and cowpea (Maasand Poss, 1989b), investigators found that these crops were most sensitive duringvegetative and early reproductive stages, less sensitive during flowering and leastsensitive during the seed filling stage. In all these studies, seed weight is the yieldcomponent of interest but similar conclusions regarding growth stage sensitivitywere obtained with both determinate crops (the grain crops) and indeterminate(cowpea) crops.
Wheat and rice are not only two of the most important grain crops in the worldbut they have been the most intensively studied agronomic crops regarding saltsensitivity at different growth stages. Studies on these grain crops were conductedin the field, greenhouse and laboratory to better understand detailed changes invegetative and reproductive developmental processes, as the plants endure variousdegrees of salt stress at different growth stages. Because of the extensive natureof the research on these crops, a summary of the key findings is presented below.Extensive research has also been conducted on the important horticultural croptomato, but research on this crop will not be covered in a separate section of thischapter and the reader is referred to review articles by Cuartero et al. (2006) andCuartero and Fernandez-Munoz (1999).
2.2. Wheat
It has long been known that salinity reduces the growth rate of the entire wheatplant and its specific organs, but it also affects plant development. The architectureof expanding wheat leaves from recently emerged seedlings subjected to 200 mMNaCl was greatly affected (Hu et al., 2005b). By close examination of the transverse
10 LÄUCHLI AND GRATTAN
section of leaf 4, investigators found that salinity reduced the cross sectional area,width and radii of epidermal and mesophyll cells along the leaf axis, indicating thatadverse effects from salinity were occurring during leaf initiation.
The duration of plant development is also affected by salinity. The salt sensi-tivity of wheat at various growth stages was evaluated by Maas and Poss (1989a)by imposing salt stress [-0.05 to -1.25 MPa (1.4–28 dS/m)], using a combinationof NaCl and CaCl2 salts, either 10, 56, or 101 days after planting (referred to asvegetative and spikelet differentiation, reproductive, and maturation stages, respec-tively). At each developmental stage, the stress was imposed for a 45-day durationand then removed. Salt stress retarded leaf development and tillering but hastenedplant maturity. When grain yield data were compared among treatments, ‘Aldura’and the more tolerant variety ‘Probred’, became less sensitive to salinity the laterplants were stressed, even though the duration of stress was held constant.
Salt stress, imposed while the shoot apex is in vegetative stage, can adverselyaffect spike development and decrease yields of wheat (Maas and Grieve, 1990).When wheat was salt-stressed during spike or panicle differentiation, reproductivedevelopment was stimulated but the number of spikelets was reduced. They foundthat salt stress accelerated the development of the shoot apex on the mainstem anddecreased the number of spikelet primordia. The terminal spikelet stage occurredabout two weeks earlier in salt-stressed wheat as compared to non-stressed controls.Anthesis also occurred earlier in salt-stressed plants but tillering was delayed severaldays. The investigators found that salt stress increased the phyllochron (the intervalbetween appearance of successive leaves on the main stem based on thermal time)and reduced the number of leaves initiated on the main stem. Salt stress decreasedthe yield potential mostly by reducing the number of spike-bearing tillers. Thisconclusion was also reached by El-Hendawy et al. (2005) in a comprehensiveevaluation of numerous wheat cultivars using cluster analysis. Therefore Maas andGrieve (1990) concluded that salinity stress needs to be avoided prior to and duringspikelet development on all tiller spikes if full yield potential is to be achieved.
Grieve et al. (2001) conducted another salt stress release study on spring wheatwhere salinity was imposed and withdrawn, before or after, three growth stages; 1)late leaf primordial initiation, 2) double ridge stage, and 3) terminal spike formation.They found that grain yields were maximized when salt stress was delayed untilafter the terminal spike formation or by withdrawing stress at the late leaf primordialstage or double ridge stage. They found that short periods of salt stress duringorganogenesis have irreversible consequences on wheat growth and development.
In a more in-depth examination of semidwarf wheat varieties, Grieve et al (1993)used a three-piece linear-spline model and found that salinity decreased the rate ofleaf primordium initiation but did not affect the duration of this phase. On the otherhand, they found salinity reduced the duration of the spikelet primordium initiationphase, even though it had no effect on the rate of spikelet primordium initiation.This combination of effects resulted in less leaves and caused a reduction in thenumber of grain-bearing spikelets, severely affecting the yield potential of thesewheat types.
PLANT GROWTH AND DEVELOPMENT UNDER SALINITY STRESS 11
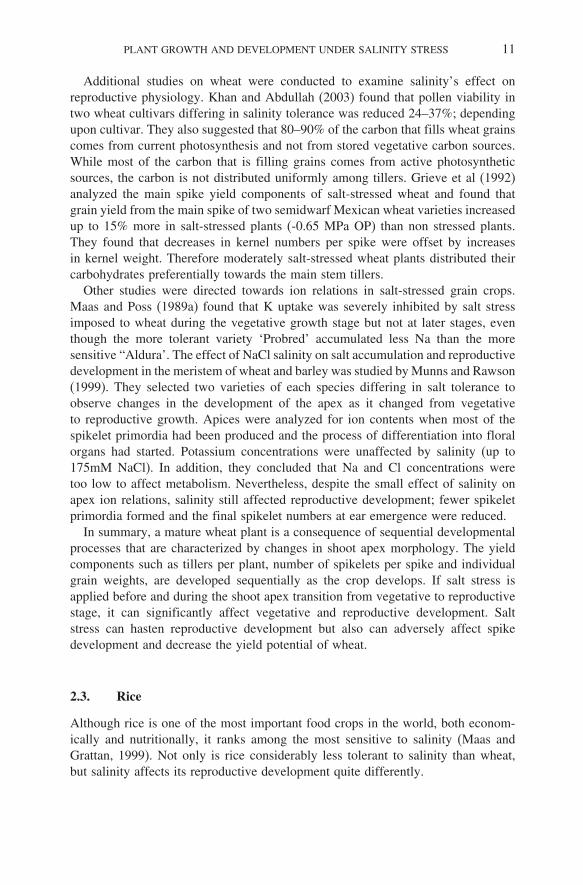
Additional studies on wheat were conducted to examine salinity’s effect onreproductive physiology. Khan and Abdullah (2003) found that pollen viability intwo wheat cultivars differing in salinity tolerance was reduced 24–37%; dependingupon cultivar. They also suggested that 80–90% of the carbon that fills wheat grainscomes from current photosynthesis and not from stored vegetative carbon sources.While most of the carbon that is filling grains comes from active photosyntheticsources, the carbon is not distributed uniformly among tillers. Grieve et al (1992)analyzed the main spike yield components of salt-stressed wheat and found thatgrain yield from the main spike of two semidwarf Mexican wheat varieties increasedup to 15% more in salt-stressed plants (-0.65 MPa OP) than non stressed plants.They found that decreases in kernel numbers per spike were offset by increasesin kernel weight. Therefore moderately salt-stressed wheat plants distributed theircarbohydrates preferentially towards the main stem tillers.
Other studies were directed towards ion relations in salt-stressed grain crops.Maas and Poss (1989a) found that K uptake was severely inhibited by salt stressimposed to wheat during the vegetative growth stage but not at later stages, eventhough the more tolerant variety ‘Probred’ accumulated less Na than the moresensitive “Aldura’. The effect of NaCl salinity on salt accumulation and reproductivedevelopment in the meristem of wheat and barley was studied by Munns and Rawson(1999). They selected two varieties of each species differing in salt tolerance toobserve changes in the development of the apex as it changed from vegetativeto reproductive growth. Apices were analyzed for ion contents when most of thespikelet primordia had been produced and the process of differentiation into floralorgans had started. Potassium concentrations were unaffected by salinity (up to175mM NaCl). In addition, they concluded that Na and Cl concentrations weretoo low to affect metabolism. Nevertheless, despite the small effect of salinity onapex ion relations, salinity still affected reproductive development; fewer spikeletprimordia formed and the final spikelet numbers at ear emergence were reduced.
In summary, a mature wheat plant is a consequence of sequential developmentalprocesses that are characterized by changes in shoot apex morphology. The yieldcomponents such as tillers per plant, number of spikelets per spike and individualgrain weights, are developed sequentially as the crop develops. If salt stress isapplied before and during the shoot apex transition from vegetative to reproductivestage, it can significantly affect vegetative and reproductive development. Saltstress can hasten reproductive development but also can adversely affect spikedevelopment and decrease the yield potential of wheat.
2.3. Rice
Although rice is one of the most important food crops in the world, both econom-ically and nutritionally, it ranks among the most sensitive to salinity (Maas andGrattan, 1999). Not only is rice considerably less tolerant to salinity than wheat,but salinity affects its reproductive development quite differently.
12 LÄUCHLI AND GRATTAN
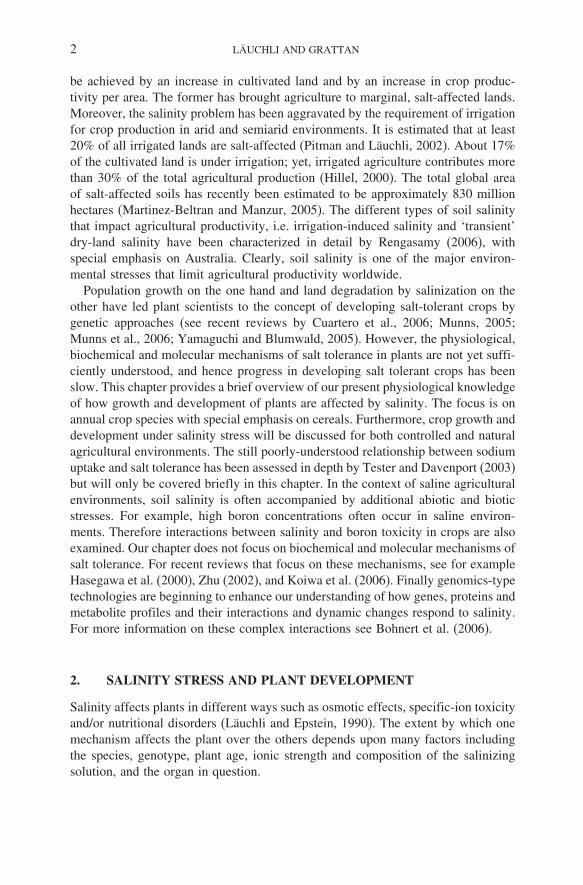
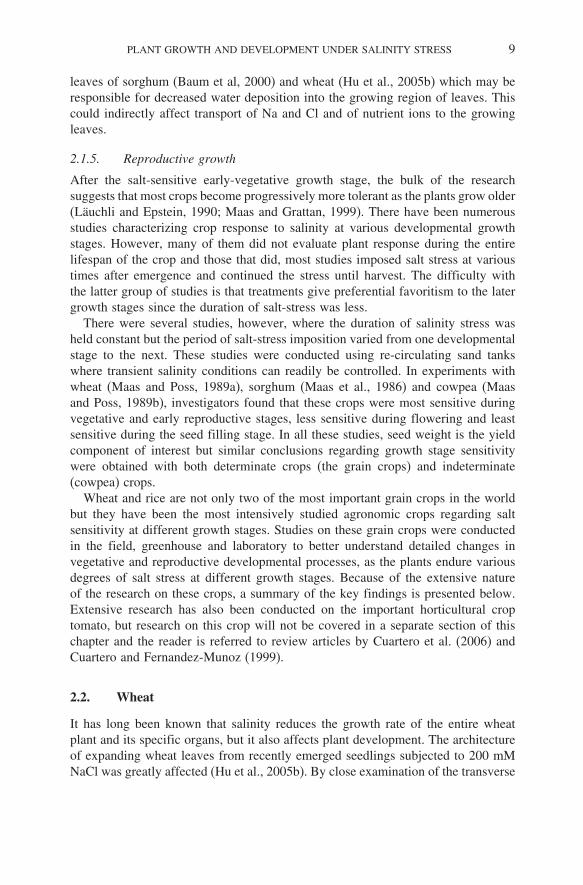
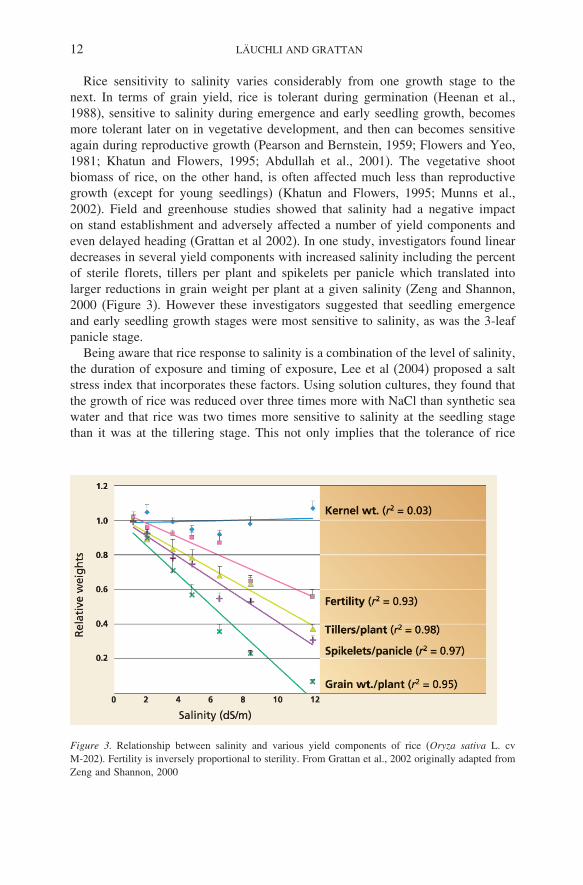
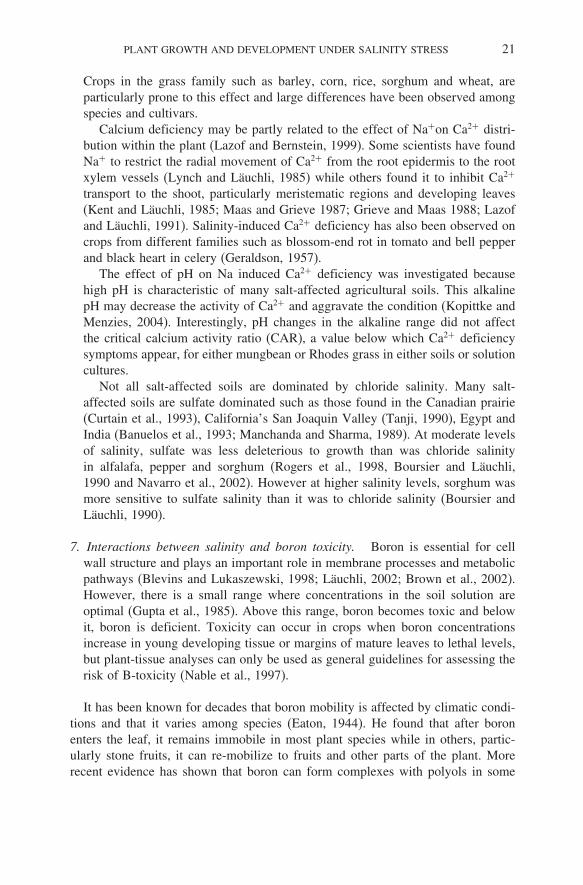
Rice sensitivity to salinity varies considerably from one growth stage to thenext. In terms of grain yield, rice is tolerant during germination (Heenan et al.,1988), sensitive to salinity during emergence and early seedling growth, becomesmore tolerant later on in vegetative development, and then can becomes sensitiveagain during reproductive growth (Pearson and Bernstein, 1959; Flowers and Yeo,1981; Khatun and Flowers, 1995; Abdullah et al., 2001). The vegetative shootbiomass of rice, on the other hand, is often affected much less than reproductivegrowth (except for young seedlings) (Khatun and Flowers, 1995; Munns et al.,2002). Field and greenhouse studies showed that salinity had a negative impacton stand establishment and adversely affected a number of yield components andeven delayed heading (Grattan et al 2002). In one study, investigators found lineardecreases in several yield components with increased salinity including the percentof sterile florets, tillers per plant and spikelets per panicle which translated intolarger reductions in grain weight per plant at a given salinity (Zeng and Shannon,2000 (Figure 3). However these investigators suggested that seedling emergenceand early seedling growth stages were most sensitive to salinity, as was the 3-leafpanicle stage.
Being aware that rice response to salinity is a combination of the level of salinity,the duration of exposure and timing of exposure, Lee et al (2004) proposed a saltstress index that incorporates these factors. Using solution cultures, they found thatthe growth of rice was reduced over three times more with NaCl than synthetic seawater and that rice was two times more sensitive to salinity at the seedling stagethan it was at the tillering stage. This not only implies that the tolerance of rice
Figure 3. Relationship between salinity and various yield components of rice (Oryza sativa L. cvM-202). Fertility is inversely proportional to sterility. From Grattan et al., 2002 originally adapted fromZeng and Shannon, 2000
PLANT GROWTH AND DEVELOPMENT UNDER SALINITY STRESS 13
varies with stage of growth but it is strongly affected by the composition of theroot media, particularly when NaCl is used as the sole salinizing salt.
Unlike what was observed on wheat, it has long been recognized that salinitycan cause sterility in rice, particularly if imposed during pollination and fertil-ization (Pearson and Bernstein, 1959). However this effect has not been consistentlyobserved. Akbar and Yabuno (1977) found that salinity caused panicle sterility inonly some rice cultivars suggesting some genetic control (Khatun et al., 1995).Salinity’s effect on rice resulted in delayed flowering, a decrease in the number ofproductive tillers and fertile florets per panicle and a reduction in individual grainweight (Khatun et. al, 1995; Lutts et al., 1995).
Zeng and Shannon (2000) examined salinity effects on seedling growth and yieldcomponents of rice. They found that seedling growth was adversely affected atsalinity levels as low as 1.9 dS/m, but this effect did not translate into a reductionin grain yield. They also found that seedling survival was adversely affected atsalinities >3.4 dS/m, confirming what has been known for decades that rice isextremely sensitive during early vegetative growth (Pearson and Ayers, 1966).Furthermore, individual seed size was not significantly affected by salinity but grainyield per plant was reduced primarily by a reduction in number of tillers per plant,number of spikelets per panicle, and the grain weight per panicle. Finally, they alsofound a substantial reduction in filled grains at 6 dS/m and higher suggesting thathigh salinity was causing some sterility.
Khatun and Flowers (1995) studied the effect of NaCl salinity on sterility andseed set in rice. Salinity increased the number of sterile florets and viability ofpollen, becoming more pronounced with increased salinity. Seed set was reducedby 38% when female plants were grown in as low as 10 mM NaCl. When theycompared crosses involving male and female parents grown at different salinities,effects on female plants dominated those on the pollinator plants.
The effects of 50 mM NaCl on floral characteristics, yield components andbiochemical and physiological attributes of rice were studied to better understandthe causes of sterility in rice (Abdullah et al., 2001). They concluded that sterilityand reduction in seed set were primarily due to reduced translocation of solublecarbohydrates to primary and secondary spikelets, accumulation of more sodiumand less potassium in all floral parts and inhibition of the specific activity of starchsynthetase in developing rice grains, thus reducing seed set.
In summary, the reduction in number of spike-bearing tillers by salt stress duringthe vegetative and early reproductive development in most cereal crops appears tohave a greater negative impact on grain yield than any other yield component. Thetime from planting to maturity in cereal crops typically decreases with increasedsalinity (Grieve et al (1993) but salinity has just the opposite effect on rice (Khatunet. al, 1995; Lutts et al., 1995). When salinity was applied to wheat from seedlingemergence, it had a profound influence on reproductive development (Grieve et al,1993). Leaf initiation rate decreased even though the time of flag leaf initiationwas unchanged indicating salinity had no influence on the timing of the transitionfrom vegetative to reproductive development, but greatly reduced the number of
14 LÄUCHLI AND GRATTAN
tillers and overall grain yield. Salt stress in rice can reduce seedling emergence andwhen imposed at early vegetative stages, it reduces tillers and grain-bearing paniclesleading to low yields. However unlike wheat, certain rice cultivars can developsterile spikelets, which appears to be genetically controlled, leading to further grainyield losses.
3. CELL ELONGATION AND CELL WALL PROCESSES UNDERSALINITY STRESS
Cell expansion is controlled by processes related to cellular water uptake andcell wall extension (Cramer and Bowman, 1993). Cell expansion is initiated bybiochemical loosening of the cell wall under turgor pressure and uptake of water andsolutes (Cosgrove, 1987, Hsiao et al., 1976; Boyer 1987). Although cell expansionis three-dimensional, it can be described in one dimensional space as a change inlength (Nonami and Boyer, 1990). Quantitatively, cell growth can be described bythe equation:
(1)1
�
��
�t= E�p
where v is the cell volume, t is the time, E describes the cell wall yielding properties,and �p is the turgor pressure. More comprehensively, a quantitative description ofgrowth should include mechanical and hydraulic components (Boyer, 1987):
(2)1�
��
�t= mL
m+L��0 −�S −Y�
where m, L, �o, �s and Y denote cell wall extensibility, hydraulic conductance,xylem water potential, cell osmotic potential and yield threshold, respectively. E inequation 1 and mL/(m+L) are comparable; the expression �o - �s – Y denotes thedriving force for cell growth (Cramer and Bowman, 1993). The yield threshold isthe minimum turgor pressure (turgor threshold) at which cells expand. Thus, cellwall extensibility, hydraulic conductance, turgor and yield threshold are importantcomponents of these complex cell- growth processes and control the rate of leafelongation. These growth parameters can be readily affected by salinity stress.
In an overview article, Hu and Schmidhalter (2004) concluded that the reductionof leaf elongation by salinity may either be related to decreases in cell wall exten-sibility or increases in yield threshold (see for example Cramer, 1991; Neumann,1993). Other investigators focused on the response of �p to salinity; the resultof these studies, however, were varied and not entirely conclusive (Cramer andBowman, 1993). Whereas Thiel et al. (1988) found that �p in leaf epidermal cellswas reduced by salinity, Yeo et al. (1991) determined that leaf elongation in ricedeclined after exposure to salinity, but no effect on �p in the growing zone wasdetected. In maize, leaf elongation was inhibited rapidly by salinity and then partiallyrecovered to a new steady-state, while �p initially declined but then completely
PLANT GROWTH AND DEVELOPMENT UNDER SALINITY STRESS 15
recovered to control values during the new but reduced steady-state elongation rate(Cramer and Bowman, 1991).
The role of turgor in the response of leaf elongation to salinity remains unclear.Cramer and Bowman (1993) considered the speed at which leaf elongation isreduced, suggesting a hydraulic signal might be occurring. In a more recent study(Cramer, 2003) the effects of salinity on leaf elongation rates of three grass speciesindicated that the inhibition of elongation was related either to the yield thresholdor to hydraulic conductance or both, but cell-wall extensibility was not significantlyaffected by salinity. Other experiments showed variable effects of salinity on cellwall extensibility (Cramer and Bowman, 1993). Also, hydraulic conductance wasnot always reduced in salt-stressed plants (Cramer and Bowman, 1993). Focusingmore specifically on cell wall properties, Cramer et al, (2001) argued that anincrease in the yield threshold caused by salinity could be explained through aneffect on the physical properties of the leaf cell walls. However, no changes inphysical properties were detected in cell walls in vitro. Therefore the inhibitionof cell elongation by salinity may not be related to a hardening of the physicalstructure of the cell walls. On the other hand, cell elongation has been consideredto be stimulated by increased acidification of the cell wall (apoplast) space (seefor example Hu and Schmidhalter, 2004) and hence salinity-induced inhibition ofelongation growth would be related to a decrease in apoplastic acidification rate,as demonstrated for water stress-induced growth inhibition (e.g. Von Volkenburghand Boyer, 1985). In contrast, Neves-Piestun and Bernstein (2001) did not find asignificant effect of salinity on cell-wall acidification in maize leaves. This appearsto be an important difference in the primary cause of inhibition of leaf elongationby water and salinity stress.
An early hypothesis proposed by Oertli (1968) stated that inhibition of leafgrowth and leaf death by salinity could be caused by excessive salt accumu-lation in the apoplast of leaves, causing dehydration of leaf cells and loss of �p.Flowers et al. (1991) presented X-ray microanalysis data in support of the Oertlihypothesis. They found up to 600 mM Na in the leaf apoplast of rice plants thatwere subjected to 50 mM NaCl for a week. However, there is uncertainty whetherthe used technique would permit the required high spatial resolution for preciseapoplastic ion localization. More recent studies using both an infiltration technique(Mühling and Läuchli, 2002a) and in vitro fluorescence imaging (Mühling andLäuchli, 2002b) showed that Na+ concentrations in the leaf apoplast of maizeand cotton remained too low to cause a decline in leaf growth under salinitystress. These results are not in support of Oertli’s hypothesis. In contrast, soluteconcentrations in the leaf apoplast of the halophytic shrub Sarcobatus vermicu-latus, obtained by the infiltration technique, reached values up to 230 mM Na+
in plants subjected to 300 mM NaCl or higher (James et al., 2006). Thus, inhalophytes, salt may accumulate in the leaf apoplast to quite high concentrationsand then alter the water relations of the plant without causing salt toxicity in theleaves.
16 LÄUCHLI AND GRATTAN
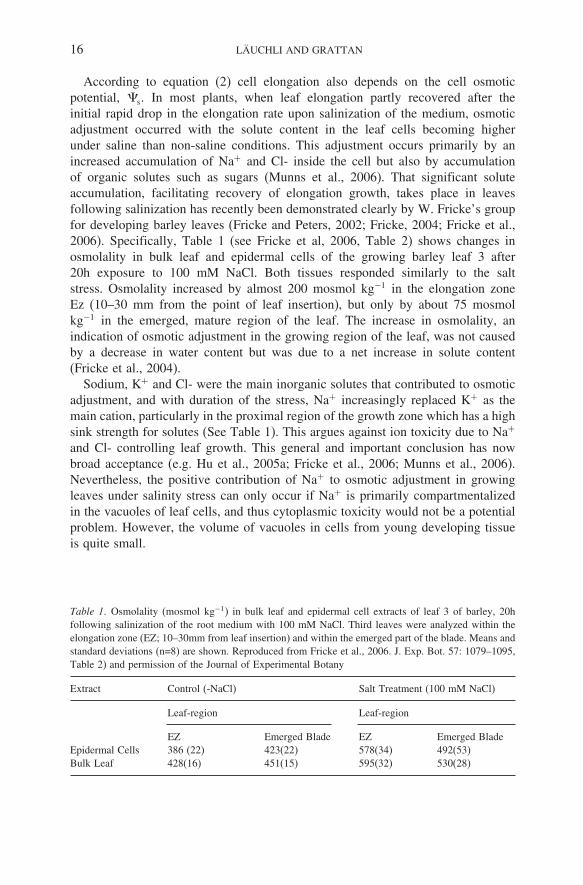
According to equation (2) cell elongation also depends on the cell osmoticpotential, �s. In most plants, when leaf elongation partly recovered after theinitial rapid drop in the elongation rate upon salinization of the medium, osmoticadjustment occurred with the solute content in the leaf cells becoming higherunder saline than non-saline conditions. This adjustment occurs primarily by anincreased accumulation of Na+ and Cl- inside the cell but also by accumulationof organic solutes such as sugars (Munns et al., 2006). That significant soluteaccumulation, facilitating recovery of elongation growth, takes place in leavesfollowing salinization has recently been demonstrated clearly by W. Fricke’s groupfor developing barley leaves (Fricke and Peters, 2002; Fricke, 2004; Fricke et al.,2006). Specifically, Table 1 (see Fricke et al, 2006, Table 2) shows changes inosmolality in bulk leaf and epidermal cells of the growing barley leaf 3 after20h exposure to 100 mM NaCl. Both tissues responded similarly to the saltstress. Osmolality increased by almost 200 mosmol kg−1 in the elongation zoneEz (10–30 mm from the point of leaf insertion), but only by about 75 mosmolkg−1 in the emerged, mature region of the leaf. The increase in osmolality, anindication of osmotic adjustment in the growing region of the leaf, was not causedby a decrease in water content but was due to a net increase in solute content(Fricke et al., 2004).
Sodium, K+ and Cl- were the main inorganic solutes that contributed to osmoticadjustment, and with duration of the stress, Na+ increasingly replaced K+ as themain cation, particularly in the proximal region of the growth zone which has a highsink strength for solutes (See Table 1). This argues against ion toxicity due to Na+
and Cl- controlling leaf growth. This general and important conclusion has nowbroad acceptance (e.g. Hu et al., 2005a; Fricke et al., 2006; Munns et al., 2006).Nevertheless, the positive contribution of Na+ to osmotic adjustment in growingleaves under salinity stress can only occur if Na+ is primarily compartmentalizedin the vacuoles of leaf cells, and thus cytoplasmic toxicity would not be a potentialproblem. However, the volume of vacuoles in cells from young developing tissueis quite small.
Table 1. Osmolality (mosmol kg−1) in bulk leaf and epidermal cell extracts of leaf 3 of barley, 20hfollowing salinization of the root medium with 100 mM NaCl. Third leaves were analyzed within theelongation zone (EZ; 10–30mm from leaf insertion) and within the emerged part of the blade. Means andstandard deviations (n=8) are shown. Reproduced from Fricke et al., 2006. J. Exp. Bot. 57: 1079–1095,Table 2) and permission of the Journal of Experimental Botany
Extract Control (-NaCl) Salt Treatment (100 mM NaCl)
Leaf-region Leaf-region
EZ Emerged Blade EZ Emerged BladeEpidermal Cells 386 (22) 423(22) 578(34) 492(53)Bulk Leaf 428(16) 451(15) 595(32) 530(28)
PLANT GROWTH AND DEVELOPMENT UNDER SALINITY STRESS 17
4. CROP GROWTH AND DEVELOPMENT IN SALINEAGRICULTURAL ENVIRONMENTS
Most research that studies the effect of salinity on crops has been conducted incontrolled laboratory and greenhouse environments, allowing scientists to betterunderstand detailed responses and determine possible mechanisms the plant usesto cope with this stress. However, such experimental conditions do not reflect thenatural conditions the plant encounters in salt-affected areas. There are a numberof additional abiotic and biotic stresses that plants may endure in the field such asextreme temperatures, water deficits, flooding, nutritional inadequacies, poor soilphysical conditions, pathogens and pests (Mittler, 2006). Moreover, these stressesare not constant, but vary both spatially and temporally. Therefore geneticistsmust be aware that genetically-altered plants with higher salt tolerance must alsothrive under field conditions with numerous additional interactive stresses for thisimproved plant to be commercially successful.
In the field, salt-affected crops must also contend with too much or too littlewater. Therefore, actual crop performance during the growing season is related tohow the plant responds to both salinity and fluctuating soil water conditions, eitherexcessive or deficit.
1. Flooding. The combined effects of salinity and flooding are common in salineareas, particularly where shallow saline-water tables exist or where soils arealso sodic, reducing water infiltration and causing water to pond on the soilsurface (Barrett-Lennard, 2003). In flooded or poorly-drained soils, diffusion ofoxygen to roots is reduced, thereby limiting root respiration and plant growth(Sharpley et al. 1992). In addition, important nutrients such as nitrate, sulfate,iron and manganese can be chemically reduced, decreasing their availability tothe plant (Kozlowski, 1997) and selective ion transport processes are disrupted(Drew et al., 1988). Such anaerobic conditions adversely affect crop growth anddevelopmental processes, influence morphological and anatomical adaptations,and cause many physiological dysfunctions in the plant. When combined withsalinity stress, Na and Cl concentrations increase in the shoot further decreasingplant growth and survival (Barrett-Lennard, 2003).
2. Water deficit. Plant stress from salinity and water deficit have much incommon (Munns, 2002a), but how the plant responds to the combination ofstresses remains unresolved (Meiri 1984; Homaee et al., 2002). Under fieldconditions, water deficit is practically unavoidable since the soil-water contentvaries temporally and spatially throughout the season. Therefore some degreeof both stresses can be occurring at different times and places in the rootzone(Homaee et al., 2002). For example, stress from water deficit may predominatein the upper portion of the rootzone while salt stress may predominate in thelower portion. Clearly the combination of stresses is more damaging than eitherone alone, but quantifying the growth-limiting contribution of each is difficultand can vary depending upon environmental conditions.
18 LÄUCHLI AND GRATTAN
Sixty years have passed since Wadleigh and Ayers (1945) first demonstratedthat bean plants responded to the additive combination of matric2 (i.e. relatedto water deficit) and osmotic (i.e. related to salinity) stresses. This controversialfinding, however, does not imply that these stresses are additive in all situations(Shani and Dudley, 2001). For example, Meiri (1984) concluded that the matricpotential preferentially affected the shoot growth of bean more than did theosmotic potential. Shalhevet and Hsiao (1986) also found that pepper and cottonwere affected more by water stress than by salinity at equivalent reductions insoil-water potential. Although matric and osmotic components are additive, froma thermodynamic perspective, there are kinetic factors (i.e. water uptake andtranspiration) that must be considered as well (Maas and Grattan, 1999). Forexample, plant response to these stresses under conditions of low evaporativedemand is likely to be different than that observed under high evaporative demandsince the matric and not the osmotic potential controls water flow to the rootsfrom the surrounding soil. As the soil dries, the matric potential decreases, butincreases the resistance of water flow to the roots in a non-linear fashion (Homaee,et al, 2002). On the other hand, increases in soil salinity, at a given water content,reduces the soil-water potential but does not reduce water flow to the root.Moreover the root cortical cells can osmotically adjust to some extent allowingwater to readily move into the root. This is consistent with the observation ofShalhevet and Hsiao (1986) who observed much lower leaf water potentials intranspiring pepper and cotton leaves in water-stressed plants than those stressedby salinity at equivalent soil-water potentials. Furthermore, these investigatorsfound that osmotic adjustment was incomplete in leaves of water-stressed plantsas compared to salt-stressed plants. Lower leaf-turgor in water-stressed plantsled to reduced transpiration, CO2 assimilation rates and growth. The overallmagnitude of the difference between matric and osmotic effects is likely relatedto differences in plant type, root-length density and evaporative demand.
More research is needed to assess the interactive effects of these stresses.A highly instrumented volumetric lysimeter system that characterizes osmoticand matric stresses continuously at various depths, such as the one describedby Poss et al., (2004), could provide valuable insights into whether the plantresponds equally to the combined stresses or whether one predominates over theother under certain environmental conditions. In addition, a newly introducedroot water extraction model for non-uniform conditions of salinity stress andwater stress (Homaee et al., 2002) may be appropriate to sort out individualcontributions of combined stresses under variable evaporative demands.
3. Plant pathogens. Salinity can affect the soil microbe populations in therhizospere and their interaction with roots. For example Rhizobium spp., which
2 Matric potential is the reduction in the free energy of soil water due to water’s attraction to the soilmatrix. The matric potential is zero in saturated soils and becomes progressively more negative as thesoil water content decreases.
PLANT GROWTH AND DEVELOPMENT UNDER SALINITY STRESS 19
are integral to legume production, seem more salt tolerant than their host plants,but evidence indicates that nodulation and N2 fixation by some crops are impairedby salinity (Läuchli, 1984). Other investigators have suggested that mycorrhizalsymbioses improve the ability of some crops to tolerate salt by improvingphosphorus nutrition (Hirrel and Gerdemann, 1980, Ojala et al. 1983, Poss et al.1985).
Salt-stressed plants may be predisposed to infection by soil pathogens. Salinityhas been reported to increase the incidence of phytophthora root rot in chrysan-themum (MacDonald, 1982) and tomato (Snapp et al. 1991). The combinedeffects significantly reduced fruit size and yield of tomato (Snapp et al. 1991),but wetter soil under salt-stunted plants, due to less evapotranspiration thannon-saline control plants, may contribute to increased susceptibility to fungaldiseases. Research on salinity-pathogen interactions is rather limited despite itspotential economic impact in salt-affected areas many of which are also prone towaterlogging. Therefore further research is warranted in this area.
4. Climate. It has long been known that climatic conditions have a profoundinfluence on plant response to salinity. Crops are more sensitive to salinity inhot, dry climates than they are under cooler and more humid environments.The combined effects of salinity and conditions of high evaporative demand,whether caused by high temperature, low humidity, or increased wind are morestressful than salinity stress alone. Several crops including alfalfa, bean, beet,carrot, cotton, onion, squash, strawberry, clover, saltgrass, and tomato are moresensitive to salinity at higher temperatures than they are at lower temperatures(Ahi and Powers 1938, Magistad et al. 1943, Hoffman and Rawlins 1970). On theother hand, higher humidity allowed barley, bean, corn, cotton, onion, and radishto be more tolerant to salinity (Hoffman and Rawlins 1970, 1971, Hoffman et al.1971, Nieman and Poulsen 1967). Because climate dramatically affects plantresponse to salinity, the time of year and location salt-tolerance experiments areconducted will likely affect the results.
5. Soil physical conditions. Poor soil physical conditions can also contributeadditional stresses in salt-affected areas (Grattan and Oster, 2003). For example,soils with poor structure or impermeable layers could restrict root growth as wellas influence water and salt distribution in the soil. Crusting at the soil surfaceacts as a physical barrier for emerging seedlings and can lead to poor standestablishment particularly if the young seedlings are already weakened by saltstress. Although there has been a considerable amount of research conducted onsalinity and sodicity’s effect on soil physical conditions, more research is neededto evaluate how these changes affect crop performance.
6. Composition of the salinizing solution. Agricultural soils around the world varynot only in salinity but also in the composition of salts in the soil (Tanji, 1990).The dominant cations in salinized soils are sodium (Na+), calcium (Ca2+) and
20 LÄUCHLI AND GRATTAN
magnesium (Mg2+) while the dominant anions are chloride (Cl-), sulfate (SO2−4 )
and bicarbonate (HCO−3 ). The ratios of these ions differ from one location to the
next but the composition of the salts is usually characteristic of the geochemicalcharacteristics of the area. Potassium (K+) and carbonate (CO2−
3 ) are usually verylow in irrigation water and soil solutions since their concentration is controlledby pH and solid phase interactions.
The ratio of sodium to calcium varies dramatically in natural waters. Gibbs(1970) analyzed the chemical constituents of global waters and found an inter-esting relationship between salinity and the ratio of Na/(Ca + Na), expressed inmg/L. Only in very pristine (< 10 mg/L) or extremely saline (>10,000 mg/L)waters were the Na/(Ca + Na) ratio greater than 0.8. The ratio of Na/(Ca +Na) in most water sources used for agricultural production (100 – 1,200 mg/L)is between 0.05 and 0.6, indicating that calcium is an important salinizingconstituent. However as salts in these waters become concentrated due to evapo-transpiration and reuse, these ratios will begin to increase due to precipitation ofcalcite and other divalent ion minerals in comparison to sodium (Tanji, 1990).
Regardless of the fact that irrigation waters and agricultural soil solutions arecomprised of multiple combinations of cations and anions, the vast majority ofsalinity experiments on plants use NaCl as the sole salinizing salt. Lazof andBernstein (1999) discussed the shortcomings of research where not only NaClwas used as the sole salinizing salt, but those studies where non-saline controltreatments contain unrealistic trace amounts of Na and Cl. These investigatorsemphasize that trace levels of NaCl in control treatments are problematic in lightof observed stimulatory effects from small additions of NaCl up to 5mM in manyglycophytes. Extremely high Na/Ca ratios, on the other hand, lead to nutritionaldisorders and secondary stresses due to adverse affects on soil conditions.
Not only is NaCl uncharacteristic of agriculturally saline environments, butexperiments that use this as the sole salinizing salt create extreme ratios ofNa/Ca, Na/K, Ca/Mg and Cl/NO3 in the root media (Läuchli and Epstein, 1990).These extreme ratios can adversely affect the mineral-nutrient relations within thecrop than would occur otherwise under normal saline environments (Grattan andGrieve, 1999). Nutrient imbalances in the crop may result from several factorsincluding the effect of salinity on nutrient ion activity and availability, the uptakeand/or distribution of a nutrient within the plant, and/or increasing the internalplant requirement for a nutrient element resulting from physiological inactivation.
The importance of calcium and its protective role for plants in saline environ-ments has been known for a century (Kearney and Harter, 1907; LaHaye andEpstein, 1969). Calcium preserves the structural and functional integrity of cellwalls and membranes and regulates ion transport and selectivity (Läuchli andEpstein, 1990; Cramer, 2002). Any changes in the cell Ca2+ homeostasis issuggested as a primary response to salinity stress as perceived by the root cells(Rengel, 1992). Sodium-induced Ca2+ deficiency has been observed by numerousinvestigators when the Na+/Ca2+ ratio in the solution, at a given salinity level fora particular plant, increases above a critical level (Kopittke and Menzies, 2004).
PLANT GROWTH AND DEVELOPMENT UNDER SALINITY STRESS 21
Crops in the grass family such as barley, corn, rice, sorghum and wheat, areparticularly prone to this effect and large differences have been observed amongspecies and cultivars.
Calcium deficiency may be partly related to the effect of Na+on Ca2+ distri-bution within the plant (Lazof and Bernstein, 1999). Some scientists have foundNa+ to restrict the radial movement of Ca2+ from the root epidermis to the rootxylem vessels (Lynch and Läuchli, 1985) while others found it to inhibit Ca2+
transport to the shoot, particularly meristematic regions and developing leaves(Kent and Läuchli, 1985; Maas and Grieve 1987; Grieve and Maas 1988; Lazofand Läuchli, 1991). Salinity-induced Ca2+ deficiency has also been observed oncrops from different families such as blossom-end rot in tomato and bell pepperand black heart in celery (Geraldson, 1957).
The effect of pH on Na induced Ca2+ deficiency was investigated becausehigh pH is characteristic of many salt-affected agricultural soils. This alkalinepH may decrease the activity of Ca2+ and aggravate the condition (Kopittke andMenzies, 2004). Interestingly, pH changes in the alkaline range did not affectthe critical calcium activity ratio (CAR), a value below which Ca2+ deficiencysymptoms appear, for either mungbean or Rhodes grass in either soils or solutioncultures.
Not all salt-affected soils are dominated by chloride salinity. Many salt-affected soils are sulfate dominated such as those found in the Canadian prairie(Curtain et al., 1993), California’s San Joaquin Valley (Tanji, 1990), Egypt andIndia (Banuelos et al., 1993; Manchanda and Sharma, 1989). At moderate levelsof salinity, sulfate was less deleterious to growth than was chloride salinityin alfalafa, pepper and sorghum (Rogers et al., 1998, Boursier and Läuchli,1990 and Navarro et al., 2002). However at higher salinity levels, sorghum wasmore sensitive to sulfate salinity than it was to chloride salinity (Boursier andLäuchli, 1990).
7. Interactions between salinity and boron toxicity. Boron is essential for cellwall structure and plays an important role in membrane processes and metabolicpathways (Blevins and Lukaszewski, 1998; Läuchli, 2002; Brown et al., 2002).However, there is a small range where concentrations in the soil solution areoptimal (Gupta et al., 1985). Above this range, boron becomes toxic and belowit, boron is deficient. Toxicity can occur in crops when boron concentrationsincrease in young developing tissue or margins of mature leaves to lethal levels,but plant-tissue analyses can only be used as general guidelines for assessing therisk of B-toxicity (Nable et al., 1997).
It has been known for decades that boron mobility is affected by climatic condi-tions and that it varies among species (Eaton, 1944). He found that after boronenters the leaf, it remains immobile in most plant species while in others, partic-ularly stone fruits, it can re-mobilize to fruits and other parts of the plant. Morerecent evidence has shown that boron can form complexes with polyols in some
22 LÄUCHLI AND GRATTAN
species allowing it to be phloem mobile (Brown and Shelp, 1997). In other specieswhere these simple sugars exist in small amounts, boron remains immobile. Thissheds light on why B-toxicity symptoms occur on margins of older leaves of someplants (‘boron immobile’) while toxicity symptoms appear on younger, developingtissue (i.e. tip die back) in others (‘boron mobile’). In those plants where boron isphloem immobile, boron concentrations in growing tips and reproductive tissue ismuch lower than concentrations in mature leaves. In boron mobile plants, just theopposite is found.
High boron, like salinity, is an important abiotic stress that adversely affectssensitive crops in many arid and semi-arid climates. There are many agriculturalareas around the world where both high salinity and high boron occur together(Tanji, 1990) or where both boron and salt concentrations in municipal waste-waters are high, potentially affecting the plant (Tsadilis, 1997). Despite the commonoccurrence of high boron and high salinity in many parts of the world, very littleresearch has been done to study the interaction of the two (Grattan and Grieve,1999; Ben-Gal and Shani, 2002).
The question has recently been raised, are the effects of salinity and boron oncrops additive, synergistic, or antagonistic? From a review of the limited numberof studies that addressed the combined effects of salinity and boron on the plant,it appears that the results are contradictory. In some cases salinity may enhanceboron sensitivity while in others, it may reduce its’ sensitivity or have no effect.
In sand-culture experiments conducted in a greenhouse, researchers found thatwheat responded to boron in the soil solution independently of salinity (Binghamet al., 1987). They found that there was no salinity - B interaction with respect toleaf B concentration. Similarly, others have found that boron and salinity effectswere independent of each other for corn, barley and alfalfa (Shani and Hanks, 1993and Mikkelsen et al., 1988).
However in more recent studies, investigators found that salinity enhanced B-sensitivity in wheat (Grieve and Poss, 2000; Wimmer et al. 2001; Wimmer et al.,2003). Wheat, a boron immobile plant, is one of those crops that is tolerant tosalinity relative to other crops but is relatively sensitive to B. Grieve and Poss (2000)found that salinity increased B accumulation in leaves and that boron concentrationsincreasing above 400 mg/kg dry wt were associated with more injury. Howeverboron is not equally distributed in the plant. Wimmer et al., (2003) found that undersaline conditions, total B concentration was reduced in the root, was unaffected inthe basal portion of the leaf, and increased dramatically in the leaf tip. In a morerecent study, Wimmer et al. (2005) found that in wheat, B-tolerance is multi-facetedand genotype specific. In one B tolerant genotype (GREEK) high B in the mediumled to accelerated reproductive development and early maturation which indirectlykept B accumulation in the leaves to a low level.
More important than salinity’s effect on boron distribution in wheat was it’seffect on B-soluble fractions within the shoot. Wimmer et al. (2001, 2003) foundthat combined salt and boron stress significantly increased the B-soluble fractions
PLANT GROWTH AND DEVELOPMENT UNDER SALINITY STRESS 23
in both inter- and intra-cellular portions of the basal leaf more than either stress didalone. They propose that the soluble-B fraction in cells is an indicator of B-toxicity.
In a greenhouse study using soil in pots, investigators found that salinity increasedB sensitivity in tomato and cucumber (Alpaslan and Gunes, 2001). However theyfound that salinity reduced total B concentration in tomato but increased it incucumber. Furthermore, these investigators found that NaCl increased membranepermeability but increasing B in the soil to toxic levels did not, except in thepresence of salinity. These investigators did not examine soluble vs insoluble boronfractions as was done by Wimmer et al. (2003). Therefore it is unknown why tomatowas more sensitive to boron in the presence of salinity when the total boron wasreduced.
Other investigators found that salinity reduced boron’s toxic effect. In one fieldstudy conducted in Northern Chile, a number of vegetable crop species and pricklypear cactus were irrigated with saline water (8.2 dS/m) containing a mixture ofions including 17 mg/L of boron (Ferreyra et al., 1997). Plant growth and cropyields of artichoke, asparagus, broad bean, red and sugar beets, Swiss chard,carrot, celery, a local variety of sweet corn, potato, prickly pear cactus, onion,shallot, spinach, were all greater than expected based on published salt and borontolerance coefficients. These investigators found that salinity reduced leaf boronconcentrations. Interactions likely occurred which increased the crop’s tolerancefor boron in the presence of saline conditions. The investigators suggested that areduction in plant water uptake, due to higher salinity levels, would reduce therate by which boron accumulates in the plant. This reduced rate would extend thetime by which boron would reach damaging concentrations that would affect plantgrowth.
Others also found that salinity reduced leaf B concentration of chickpea (Yadavet al., 1989), wheat (Holloway and Alston, 1992), Eucalyptus camaldulensis (Posset al., 1998), as well as reduced B uptake and accumulation in the stem of severalPrunus rootstocks (El-Motaium et al., 1994), decreasing B-toxicity symptoms. Inthe latter study, the investigators found a negative relationship between B andSO2−
4 concentrations in tissue suggesting that SO2−4 could be responsible for the
salinity-induced reduction in tissue B. However, recent experiments with broccoliin greenhouse sand tank systems indicated that Cl salinity was equally effectiveas mixed sulfate-chloride salinity in reducing boron’s detrimental effect (Grattanet al., 2004) even though the effect of the combined stresses was more detrimentalthan either one alone. Regardless of salt composition, they found that at low boronconcentrations (< 1mg/L), salinity increased shoot boron concentration while at veryhigh boron concentrations (24 mg/L), salinity reduced shoot boron concentration.These investigators also explored the hypothesis that boron is taken up passivelyvia the transpirational stream. By measuring changes in the isotopic fractionationof water samples in these closed sand tank systems over time, they were able toseparate transpiration from evapotranpiration and to make inferences regarding thepassive uptake of boron in relation to the cumulated plant transpiration. They found
24 LÄUCHLI AND GRATTAN
that at low boron (< 1mg/L), total shoot B was higher than would be accounted for bysimple transpirational mass flow (solution concentration x cumulative transpirationalvolume). One the other hand, at high boron concentrations (>14 mg/L), total shootboron was substantially less than that predicted based on mass flow suggesting theplant is somehow able to regulate the accumulation of boron in the shoot, whichis dependent upon the boron concentration of the external solution and not salinity.However, in cucumber, the 10B/11B ratio in the soil solution was equal to that in theplant tissue suggesting that the plant is unable to discriminate in uptake betweenthe two isotopic species of boron (Grattan et al.,2005).
Another important finding in salinity-boron interactions is the influence pH has onthis interaction (Grattan et al., 2005; 2006). Under slightly acidic conditions, boronin solution occurs as undissociated boric acid (B(OH)3). In contrast, under slightlybasic conditions, boron partly changes to borate (B(OH)−4 ). This change in thechemical speciation of boron under alkaline conditions may affect the mechanismand rate at which boron is transported through membranes. In a controlled sand tankexperiment with cucumber, increased salinity, boron and pH (from 6 to 8) decreasedfruit yield. Investigators did not find any significant salinity-boron interaction.However in slightly acidic conditions, regardless of salinity, increased boron wasmore detrimental than it was in slightly basic conditions. When the experiment wasrepeated with broccoli, these investigators found different results. They found thatan increase in soil-water boron from 1 to 21 mg/L at pH 6, did not significantlyreduce the head yields of broccoli at any salinity level. However at pH 8, as boronincreased from 1 to 21 mg/L, head yields at both low (EC 2 dS/m) and high (EC14 dS/m) were reduced by over 85%. Interestingly at moderate salinities (EC 5 to11 dS/m), increased boron had very little detrimental effect.
Much has been learned over the past decade regarding salinity-boron interactionsbut many questions remain unresolved. More research is needed to (1) under-stand the relationship between visual injury symptoms, tissue boron concentrations,soluble boron fractions, the role pH plays and how these all interact affectingcrop yield and (2) the influence of salinity on the soluble fractions of boron,boron mobility and distribution within the plant and how these relate to visualinjury.
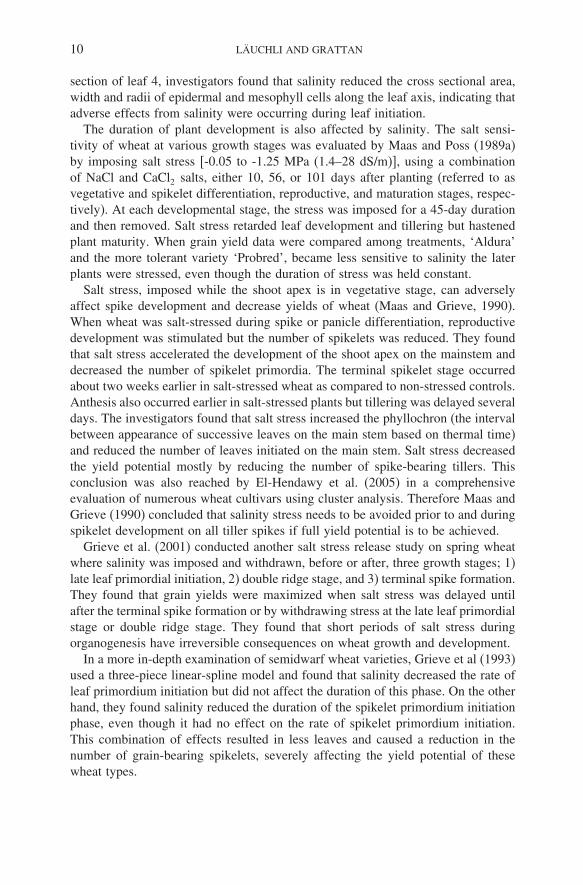
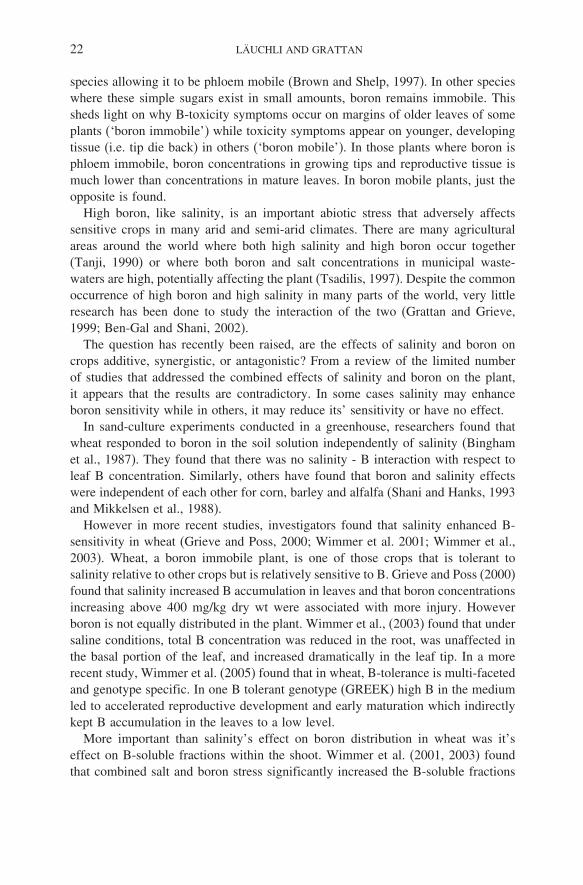
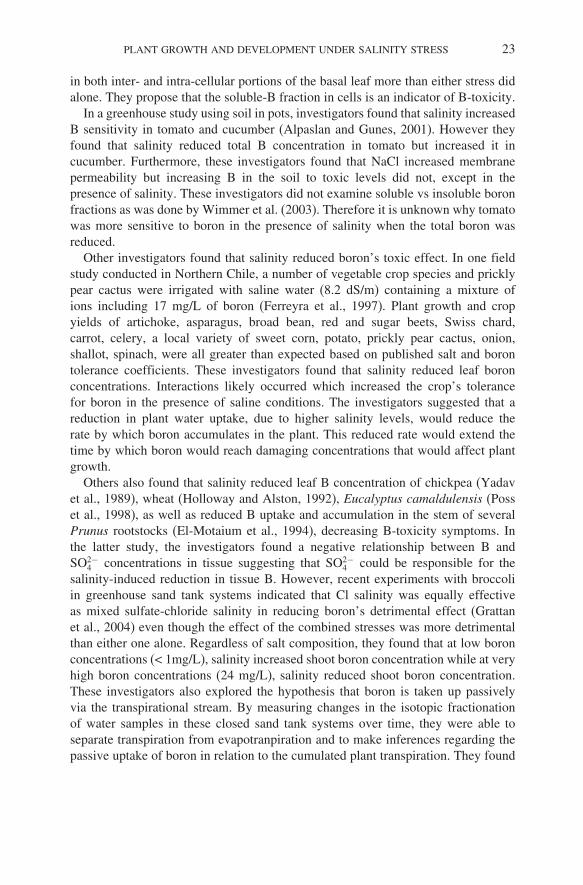
In summary, plants under field conditions often endure multiple stresses duringtheir development. However, the vast majority of research has focused on individualstresses in the absence of others. Plant response to combined stresses can not bereadily extrapolated based on their response to individual stresses (Mittler, 2006).Figure 4 shows potential interactions among several agricultural stress combina-tions. Some stress combinations show negative interactions while others exhibitpositive interactions. For some stress combinations, there are no or unknown modeof interactions. Therefore Mittler (2006) suggested that tolerance to a combinationof stresses should be the focus of future research, particularly those where the goalis to develop transgenic crops with enhanced tolerance to natural adverse fieldconditions.
PLANT GROWTH AND DEVELOPMENT UNDER SALINITY STRESS 25
Drought Heat Chilling Freezing Pathogen Nutrients Boron Flooding Humidity
? ?
? ? ? ?
? ? ? ?
? ? ? ? ?
? ? ? ? ?
?
? ?
Salinity
Drought
Heat
Chilling
Freezing
Pathogen
Nutrient
Boron
Flooding ?
Potential negativeinteraction
? Unknown mode of interaction
Potential positive ornegative interaction
No interaction
Potential positiveinteraction
Figure 4. Agriculturally important environmental factors and their potential interactions. Modified fromMittler (2006). Boron-nutrient interaction source (Marschner, 1995)
REFERENCES
Abdullah, Z., M.A. Khan and T.J. Flowers. 2001. Causes of sterility in seed set of rice under salinitystress. J. Agron. Crop Sci. 187:25–32.
Abul-Naas, A.A. and M.S. Omran. 1974. Salt tolerance of seventeen cotton cultivars during germinationand early seedling development. Acker Pflanzenbau 140:229–236.
Ahi, S.M., and W.L. Powers. 1938. Salt tolerance of plants at various temperatures. Plant Physiol.13:767–789.
Ahmad, S., A. Wahid, E. Rasul and A. Wahid. 2005. Comparative morphological and physiologicalresponses of green gram genotypes to salinity applied at different growth stages. Bot. Bull. Acad. Sin.46:135–142.
Akbar, M. and T. Yabuno. 1977. Breeding for saline-resistant varieties of rice. IV. Inheritance ofdelayed-type panicle sterility induced by salinity. Japan J. Breed. 27: 237–240.
Alpaslan, M. and A. Gunes. 2001. Interactive effects of boron and salinity stress on the growth, membranepermeability and mineral composition of tomato and cucumber plants. Plant Soil 236: 123–128
Ayers, A.D., J.W. Brown and C.H. Wadleigh. 1952. Salt tolerance of barley and wheat in soil plotsreceiving several salinization regimes. Agron. J. 44:307–310.
Badia, D. and A. Meiri. 1994. Tolerance of two tomato cultivars (Lycopersicum esculentum Mill) tosoil salinity during emergence phase. Agr. Med 124:301–310
Banuelos, G.S., R. Mead, and G.J. Hoffman. 1993. Accumulation of selenium in wild mustard irrigatedwith agricultural effluent. Agric. Ecosyst. Environ. 43:119–126.
Barrett-Lennard, E.G. 2003. The interaction between waterlogging and salinity in higher plants: causes,consequences and implications. Plant Soil 253:35–54
Baum S.F., Tran P.N. and W.K. Silk. 2000. Effects of salinity on xylem structure and water use ingrowing leaves of sorghum. New Phytol. 146:119–127.
26 LÄUCHLI AND GRATTAN
Bayuelo-Jimenez, J.S., R. Craig and J.P. Lynch. 2002. Salinity tolerance of Phaseolus species duringgermination and early seedling growth. Crop Sci. 42:1584–1594.
Ben-Gal, A. and U. Shani. 2002. Yield, transpiration and growth of tomatoes under combined excessboron and salinity stress. Plant Soil 247:211–221.
Bernstein, L. and H.E. Hayward. 1958. Physiology of salt tolerance. Ann. Rev. Plant Physiol. 9:25–46.Bernstein N., Silk W.K. and A. Läuchli. 1993a. Growth and development of sorghum leaves under
conditions of NaCl stress. Planta 191:433–439.Bernstein N. Läuchli A. and W.K. Silk. 1993b. Kinematics and dynamics of sorghum (Sorghum
bicolor L.) leaf development at various Na/Ca salinities. Plant Physiol. 103:1107–1114.Bernstein N., Silk W.K. and A. Läuchli i. 1995. Growth and development of sorghum leaves under
conditions of NaCl stress: possible role of some mineral elements in growth inhibition. Planta 196:699–705.
Bingham, F.T., Strong, J. E., Rhoades, J. D. and Keren, R., 1987. Effects of salinity and varying boronconcentrations on boron uptake and growth of wheat. Plant Soil 97: 345–351.
Blevins, D.G. and K.M. Lukaszewski. 1998. Boron in plant structure and function. Annu. Rev. PlantPhysiol. Plant Mol. Biol. 49:501–523
Bohnert H.J., Gong Q., Li P. and S. Ma. 2006. Unraveling abiotic stress tolerance mechanisms – gettinggenomics going. Current Opinion in Plant Biology 9:180–188.
Botia, P., J.M. Navarro, A. Cerda and V. Martinez. 2005. Yield and fruit quality of two melon cultivarsirrigated with saline water at different stages of development. Eur. J. Agron. 23:243–253
Boursier, P. and A. Läuchli. 1990. Growth responses and mineral nutrient relations of salt-stressedsorghum. Crop Sci. 30:1226–1233.
Boyer J.S. 1987. Hydraulics, wall extensibility and wall proteins. In: Physiology of Cell Expansionduring Plant Growth, Proc. Second Annual Penn. State Symposium in Plant Physiology. Penn. StateUniversity, University Park, PA 16802, pp. 109–121.
Brown, P.H., N. Bellaloui, M.A. Wimmer, E.S. Bassil, J. Ruis, H. Hu, H. Pfeffer, F. Dannel, V. Römheld.2002. Boron in plant biology. Plant boil. 4:211–229.
Brown, P.H and B.J. Shelp. 1997. Boron mobility in plants. Plant Soil:193:85–101Carter, C.T., C.M. Grieve and J.P. Poss. 2005. Salinity effects on emergence, survival, and ion accumu-
lation of Limonium perezii. J. Plant Nutr. 28:1243–1257.Cosgrove D.J. 1987. Linkage of wall extension with water and solute uptake. In: Physiology of Cell
Expansion during Plant Growth, Proc. Second Annual Penn. State Symposium in Plant Physiology.,Penn. State University, University Park PA 16802, pp. 88–100.
Cramer G.R. 1991. Kinetics of maize leaf elongation. II. Responses of a sodium excluding cultivar anda Na including cultivar to varying Na/Ca salinity. J. Exp. Bot. 43:857–864.
Cramer, G.R. 2002. Sodium-calcium interactions under salinity stress. In: Salinity. Environment-Plants-Molecules.. A. Läuchli and U. Lüttge (Eds) . Kluwer Academic Publishers, Dordrecht, pp. 205–227
Cramer G.R. 2003. Differential effects of salinity on leaf elongation kinetics of three grass species. PlantSoil 253:233–244.
Cramer G.R. and D.C. Bowman. 1991. Kinetics of maize leaf elongation. I. Increased yield thresholdlimits short-term elongation rates after exposure to salinity. J. Exp. Bot. 42:1417–1426.
Cramer G.R. and D.C. Bowman. 1993. Cell elongation control under stress conditions. In: Handbook ofPlant and Crop Stress, M Pessarakli (Ed.). Marcel Dekker, New York, pp. 303–319.
Cramer G.R., Epstein E. and A. Läuchli. 1988. Kinetics of root elongation of maize in response toshort-term exposure to NaCl and elevated calcium concentration. J. Exp. Bot. 39:1513–1522.
Cramer G.R. and A. Läuchli. 1986. Ion activities in solution in relation to Na+- Ca 2+ interactions atthe plasmalemma. J. Exp. Bot. 37:321–330.
Cramer G.R., Läuchli A. and E. Epstein. 1986. Effects of NaCl and CaCl2 on ion activities in complexnutrient solutions and root growth of cotton. Plant Physiol. 81:792–797.
Cramer G.R., Läuchli A and V.S. Polito. 1985. Displacement of Ca2+from the plasmalemma of rootcells. A primary response to salt stress? Plant Physiol. 79:297–211.
Cramer G.R., Schmidt C.L. and C. Bidart. 2001. Analysis of cell wall hardening and cell wall enzymesof salt-stressed maize (Zea mays) leaves. Aust. J. Plant Physiol. 28:101–109.
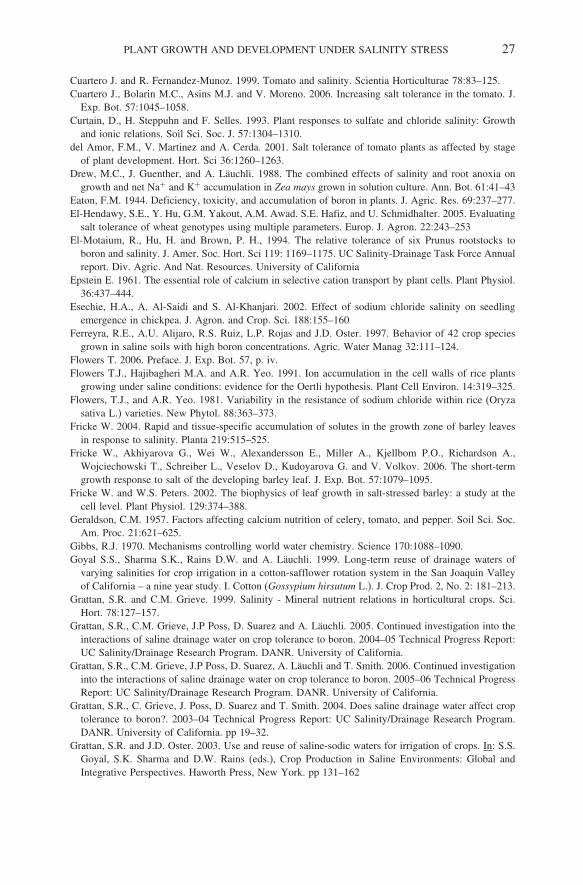
PLANT GROWTH AND DEVELOPMENT UNDER SALINITY STRESS 27
Cuartero J. and R. Fernandez-Munoz. 1999. Tomato and salinity. Scientia Horticulturae 78:83–125.Cuartero J., Bolarin M.C., Asins M.J. and V. Moreno. 2006. Increasing salt tolerance in the tomato. J.
Exp. Bot. 57:1045–1058.Curtain, D., H. Steppuhn and F. Selles. 1993. Plant responses to sulfate and chloride salinity: Growth
and ionic relations. Soil Sci. Soc. J. 57:1304–1310.del Amor, F.M., V. Martinez and A. Cerda. 2001. Salt tolerance of tomato plants as affected by stage
of plant development. Hort. Sci 36:1260–1263.Drew, M.C., J. Guenther, and A. Läuchli. 1988. The combined effects of salinity and root anoxia on
growth and net Na+ and K+ accumulation in Zea mays grown in solution culture. Ann. Bot. 61:41–43Eaton, F.M. 1944. Deficiency, toxicity, and accumulation of boron in plants. J. Agric. Res. 69:237–277.El-Hendawy, S.E., Y. Hu, G.M. Yakout, A.M. Awad. S.E. Hafiz, and U. Schmidhalter. 2005. Evaluating
salt tolerance of wheat genotypes using multiple parameters. Europ. J. Agron. 22:243–253El-Motaium, R., Hu, H. and Brown, P. H., 1994. The relative tolerance of six Prunus rootstocks to
boron and salinity. J. Amer. Soc. Hort. Sci 119: 1169–1175. UC Salinity-Drainage Task Force Annualreport. Div. Agric. And Nat. Resources. University of California
Epstein E. 1961. The essential role of calcium in selective cation transport by plant cells. Plant Physiol.36:437–444.
Esechie, H.A., A. Al-Saidi and S. Al-Khanjari. 2002. Effect of sodium chloride salinity on seedlingemergence in chickpea. J. Agron. and Crop. Sci. 188:155–160
Ferreyra, R.E., A.U. Alijaro, R.S. Ruiz, L.P. Rojas and J.D. Oster. 1997. Behavior of 42 crop speciesgrown in saline soils with high boron concentrations. Agric. Water Manag 32:111–124.
Flowers T. 2006. Preface. J. Exp. Bot. 57, p. iv.Flowers T.J., Hajibagheri M.A. and A.R. Yeo. 1991. Ion accumulation in the cell walls of rice plants
growing under saline conditions: evidence for the Oertli hypothesis. Plant Cell Environ. 14:319–325.Flowers, T.J., and A.R. Yeo. 1981. Variability in the resistance of sodium chloride within rice (Oryza
sativa L.) varieties. New Phytol. 88:363–373.Fricke W. 2004. Rapid and tissue-specific accumulation of solutes in the growth zone of barley leaves
in response to salinity. Planta 219:515–525.Fricke W., Akhiyarova G., Wei W., Alexandersson E., Miller A., Kjellbom P.O., Richardson A.,
Wojciechowski T., Schreiber L., Veselov D., Kudoyarova G. and V. Volkov. 2006. The short-termgrowth response to salt of the developing barley leaf. J. Exp. Bot. 57:1079–1095.
Fricke W. and W.S. Peters. 2002. The biophysics of leaf growth in salt-stressed barley: a study at thecell level. Plant Physiol. 129:374–388.
Geraldson, C.M. 1957. Factors affecting calcium nutrition of celery, tomato, and pepper. Soil Sci. Soc.Am. Proc. 21:621–625.
Gibbs, R.J. 1970. Mechanisms controlling world water chemistry. Science 170:1088–1090.Goyal S.S., Sharma S.K., Rains D.W. and A. Läuchli. 1999. Long-term reuse of drainage waters of
varying salinities for crop irrigation in a cotton-safflower rotation system in the San Joaquin Valleyof California – a nine year study. I. Cotton (Gossypium hirsutum L.). J. Crop Prod. 2, No. 2: 181–213.
Grattan, S.R. and C.M. Grieve. 1999. Salinity - Mineral nutrient relations in horticultural crops. Sci.Hort. 78:127–157.
Grattan, S.R., C.M. Grieve, J.P Poss, D. Suarez and A. Läuchli. 2005. Continued investigation into theinteractions of saline drainage water on crop tolerance to boron. 2004–05 Technical Progress Report:UC Salinity/Drainage Research Program. DANR. University of California.
Grattan, S.R., C.M. Grieve, J.P Poss, D. Suarez, A. Läuchli and T. Smith. 2006. Continued investigationinto the interactions of saline drainage water on crop tolerance to boron. 2005–06 Technical ProgressReport: UC Salinity/Drainage Research Program. DANR. University of California.
Grattan, S.R., C. Grieve, J. Poss, D. Suarez and T. Smith. 2004. Does saline drainage water affect croptolerance to boron?. 2003–04 Technical Progress Report: UC Salinity/Drainage Research Program.DANR. University of California. pp 19–32.
Grattan, S.R. and J.D. Oster. 2003. Use and reuse of saline-sodic waters for irrigation of crops. In: S.S.Goyal, S.K. Sharma and D.W. Rains (eds.), Crop Production in Saline Environments: Global andIntegrative Perspectives. Haworth Press, New York. pp 131–162
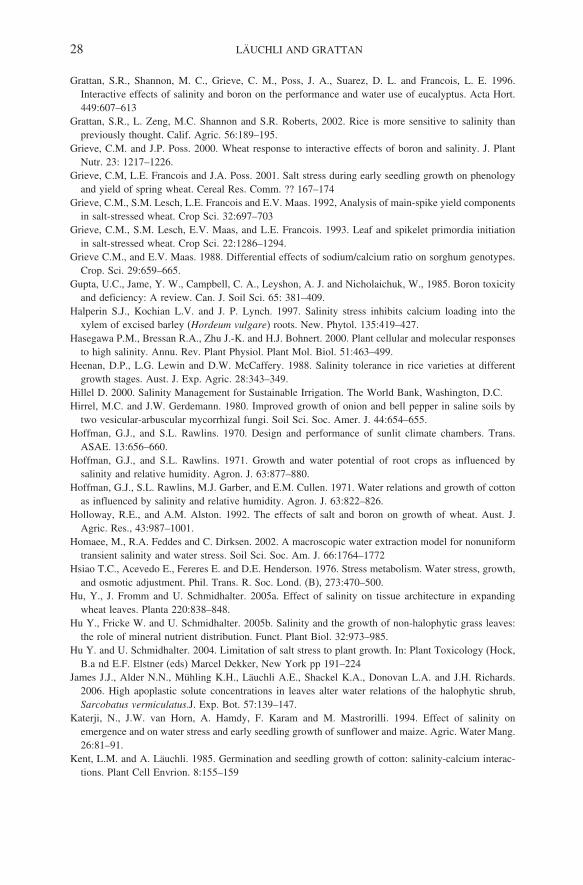
28 LÄUCHLI AND GRATTAN
Grattan, S.R., Shannon, M. C., Grieve, C. M., Poss, J. A., Suarez, D. L. and Francois, L. E. 1996.Interactive effects of salinity and boron on the performance and water use of eucalyptus. Acta Hort.449:607–613
Grattan, S.R., L. Zeng, M.C. Shannon and S.R. Roberts, 2002. Rice is more sensitive to salinity thanpreviously thought. Calif. Agric. 56:189–195.
Grieve, C.M. and J.P. Poss. 2000. Wheat response to interactive effects of boron and salinity. J. PlantNutr. 23: 1217–1226.
Grieve, C.M, L.E. Francois and J.A. Poss. 2001. Salt stress during early seedling growth on phenologyand yield of spring wheat. Cereal Res. Comm. ?? 167–174
Grieve, C.M., S.M. Lesch, L.E. Francois and E.V. Maas. 1992, Analysis of main-spike yield componentsin salt-stressed wheat. Crop Sci. 32:697–703
Grieve, C.M., S.M. Lesch, E.V. Maas, and L.E. Francois. 1993. Leaf and spikelet primordia initiationin salt-stressed wheat. Crop Sci. 22:1286–1294.
Grieve C.M., and E.V. Maas. 1988. Differential effects of sodium/calcium ratio on sorghum genotypes.Crop. Sci. 29:659–665.
Gupta, U.C., Jame, Y. W., Campbell, C. A., Leyshon, A. J. and Nicholaichuk, W., 1985. Boron toxicityand deficiency: A review. Can. J. Soil Sci. 65: 381–409.
Halperin S.J., Kochian L.V. and J. P. Lynch. 1997. Salinity stress inhibits calcium loading into thexylem of excised barley (Hordeum vulgare) roots. New. Phytol. 135:419–427.
Hasegawa P.M., Bressan R.A., Zhu J.-K. and H.J. Bohnert. 2000. Plant cellular and molecular responsesto high salinity. Annu. Rev. Plant Physiol. Plant Mol. Biol. 51:463–499.
Heenan, D.P., L.G. Lewin and D.W. McCaffery. 1988. Salinity tolerance in rice varieties at differentgrowth stages. Aust. J. Exp. Agric. 28:343–349.
Hillel D. 2000. Salinity Management for Sustainable Irrigation. The World Bank, Washington, D.C.Hirrel, M.C. and J.W. Gerdemann. 1980. Improved growth of onion and bell pepper in saline soils by
two vesicular-arbuscular mycorrhizal fungi. Soil Sci. Soc. Amer. J. 44:654–655.Hoffman, G.J., and S.L. Rawlins. 1970. Design and performance of sunlit climate chambers. Trans.
ASAE. 13:656–660.Hoffman, G.J., and S.L. Rawlins. 1971. Growth and water potential of root crops as influenced by
salinity and relative humidity. Agron. J. 63:877–880.Hoffman, G.J., S.L. Rawlins, M.J. Garber, and E.M. Cullen. 1971. Water relations and growth of cotton
as influenced by salinity and relative humidity. Agron. J. 63:822–826.Holloway, R.E., and A.M. Alston. 1992. The effects of salt and boron on growth of wheat. Aust. J.
Agric. Res., 43:987–1001.Homaee, M., R.A. Feddes and C. Dirksen. 2002. A macroscopic water extraction model for nonuniform
transient salinity and water stress. Soil Sci. Soc. Am. J. 66:1764–1772Hsiao T.C., Acevedo E., Fereres E. and D.E. Henderson. 1976. Stress metabolism. Water stress, growth,
and osmotic adjustment. Phil. Trans. R. Soc. Lond. (B), 273:470–500.Hu, Y., J. Fromm and U. Schmidhalter. 2005a. Effect of salinity on tissue architecture in expanding
wheat leaves. Planta 220:838–848.Hu Y., Fricke W. and U. Schmidhalter. 2005b. Salinity and the growth of non-halophytic grass leaves:
the role of mineral nutrient distribution. Funct. Plant Biol. 32:973–985.Hu Y. and U. Schmidhalter. 2004. Limitation of salt stress to plant growth. In: Plant Toxicology (Hock,
B.a nd E.F. Elstner (eds) Marcel Dekker, New York pp 191–224James J.J., Alder N.N., Mühling K.H., Läuchli A.E., Shackel K.A., Donovan L.A. and J.H. Richards.
2006. High apoplastic solute concentrations in leaves alter water relations of the halophytic shrub,Sarcobatus vermiculatus.J. Exp. Bot. 57:139–147.
Katerji, N., J.W. van Horn, A. Hamdy, F. Karam and M. Mastrorilli. 1994. Effect of salinity onemergence and on water stress and early seedling growth of sunflower and maize. Agric. Water Mang.26:81–91.
Kent, L.M. and A. Läuchli. 1985. Germination and seedling growth of cotton: salinity-calcium interac-tions. Plant Cell Envrion. 8:155–159
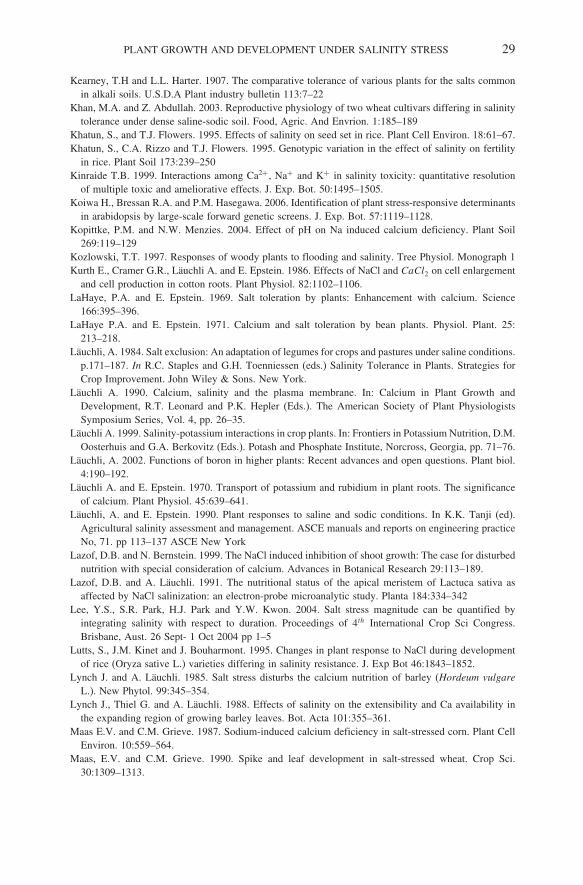
PLANT GROWTH AND DEVELOPMENT UNDER SALINITY STRESS 29
Kearney, T.H and L.L. Harter. 1907. The comparative tolerance of various plants for the salts commonin alkali soils. U.S.D.A Plant industry bulletin 113:7–22
Khan, M.A. and Z. Abdullah. 2003. Reproductive physiology of two wheat cultivars differing in salinitytolerance under dense saline-sodic soil. Food, Agric. And Envrion. 1:185–189
Khatun, S., and T.J. Flowers. 1995. Effects of salinity on seed set in rice. Plant Cell Environ. 18:61–67.Khatun, S., C.A. Rizzo and T.J. Flowers. 1995. Genotypic variation in the effect of salinity on fertility
in rice. Plant Soil 173:239–250Kinraide T.B. 1999. Interactions among Ca2+, Na+ and K+ in salinity toxicity: quantitative resolution
of multiple toxic and ameliorative effects. J. Exp. Bot. 50:1495–1505.Koiwa H., Bressan R.A. and P.M. Hasegawa. 2006. Identification of plant stress-responsive determinants
in arabidopsis by large-scale forward genetic screens. J. Exp. Bot. 57:1119–1128.Kopittke, P.M. and N.W. Menzies. 2004. Effect of pH on Na induced calcium deficiency. Plant Soil
269:119–129Kozlowski, T.T. 1997. Responses of woody plants to flooding and salinity. Tree Physiol. Monograph 1Kurth E., Cramer G.R., Läuchli A. and E. Epstein. 1986. Effects of NaCl and CaCl2 on cell enlargement
and cell production in cotton roots. Plant Physiol. 82:1102–1106.LaHaye, P.A. and E. Epstein. 1969. Salt toleration by plants: Enhancement with calcium. Science
166:395–396.LaHaye P.A. and E. Epstein. 1971. Calcium and salt toleration by bean plants. Physiol. Plant. 25:
213–218.Läuchli, A. 1984. Salt exclusion: An adaptation of legumes for crops and pastures under saline conditions.
p.171–187. In R.C. Staples and G.H. Toenniessen (eds.) Salinity Tolerance in Plants. Strategies forCrop Improvement. John Wiley & Sons. New York.
Läuchli A. 1990. Calcium, salinity and the plasma membrane. In: Calcium in Plant Growth andDevelopment, R.T. Leonard and P.K. Hepler (Eds.). The American Society of Plant PhysiologistsSymposium Series, Vol. 4, pp. 26–35.
Läuchli A. 1999. Salinity-potassium interactions in crop plants. In: Frontiers in Potassium Nutrition, D.M.Oosterhuis and G.A. Berkovitz (Eds.). Potash and Phosphate Institute, Norcross, Georgia, pp. 71–76.
Läuchli, A. 2002. Functions of boron in higher plants: Recent advances and open questions. Plant biol.4:190–192.
Läuchli A. and E. Epstein. 1970. Transport of potassium and rubidium in plant roots. The significanceof calcium. Plant Physiol. 45:639–641.
Läuchli, A. and E. Epstein. 1990. Plant responses to saline and sodic conditions. In K.K. Tanji (ed).Agricultural salinity assessment and management. ASCE manuals and reports on engineering practiceNo, 71. pp 113–137 ASCE New York
Lazof, D.B. and N. Bernstein. 1999. The NaCl induced inhibition of shoot growth: The case for disturbednutrition with special consideration of calcium. Advances in Botanical Research 29:113–189.
Lazof, D.B. and A. Läuchli. 1991. The nutritional status of the apical meristem of Lactuca sativa asaffected by NaCl salinization: an electron-probe microanalytic study. Planta 184:334–342
Lee, Y.S., S.R. Park, H.J. Park and Y.W. Kwon. 2004. Salt stress magnitude can be quantified byintegrating salinity with respect to duration. Proceedings of 4th International Crop Sci Congress.Brisbane, Aust. 26 Sept- 1 Oct 2004 pp 1–5
Lutts, S., J.M. Kinet and J. Bouharmont. 1995. Changes in plant response to NaCl during developmentof rice (Oryza sative L.) varieties differing in salinity resistance. J. Exp Bot 46:1843–1852.
Lynch J. and A. Läuchli. 1985. Salt stress disturbs the calcium nutrition of barley (Hordeum vulgareL.). New Phytol. 99:345–354.
Lynch J., Thiel G. and A. Läuchli. 1988. Effects of salinity on the extensibility and Ca availability inthe expanding region of growing barley leaves. Bot. Acta 101:355–361.
Maas E.V. and C.M. Grieve. 1987. Sodium-induced calcium deficiency in salt-stressed corn. Plant CellEnviron. 10:559–564.
Maas, E.V. and C.M. Grieve. 1990. Spike and leaf development in salt-stressed wheat. Crop Sci.30:1309–1313.
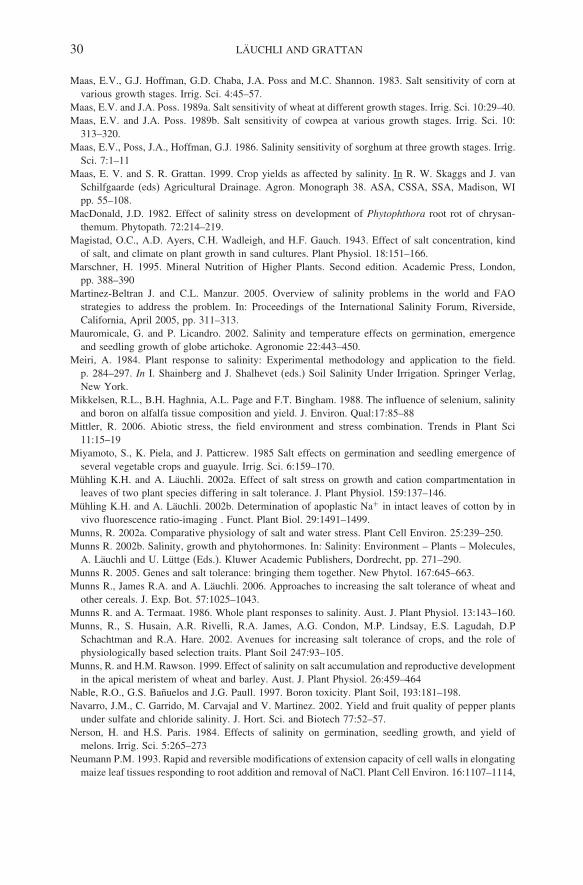
30 LÄUCHLI AND GRATTAN
Maas, E.V., G.J. Hoffman, G.D. Chaba, J.A. Poss and M.C. Shannon. 1983. Salt sensitivity of corn atvarious growth stages. Irrig. Sci. 4:45–57.
Maas, E.V. and J.A. Poss. 1989a. Salt sensitivity of wheat at different growth stages. Irrig. Sci. 10:29–40.Maas, E.V. and J.A. Poss. 1989b. Salt sensitivity of cowpea at various growth stages. Irrig. Sci. 10:
313–320.Maas, E.V., Poss, J.A., Hoffman, G.J. 1986. Salinity sensitivity of sorghum at three growth stages. Irrig.
Sci. 7:1–11Maas, E. V. and S. R. Grattan. 1999. Crop yields as affected by salinity. In R. W. Skaggs and J. van
Schilfgaarde (eds) Agricultural Drainage. Agron. Monograph 38. ASA, CSSA, SSA, Madison, WIpp. 55–108.
MacDonald, J.D. 1982. Effect of salinity stress on development of Phytophthora root rot of chrysan-themum. Phytopath. 72:214–219.
Magistad, O.C., A.D. Ayers, C.H. Wadleigh, and H.F. Gauch. 1943. Effect of salt concentration, kindof salt, and climate on plant growth in sand cultures. Plant Physiol. 18:151–166.
Marschner, H. 1995. Mineral Nutrition of Higher Plants. Second edition. Academic Press, London,pp. 388–390
Martinez-Beltran J. and C.L. Manzur. 2005. Overview of salinity problems in the world and FAOstrategies to address the problem. In: Proceedings of the International Salinity Forum, Riverside,California, April 2005, pp. 311–313.
Mauromicale, G. and P. Licandro. 2002. Salinity and temperature effects on germination, emergenceand seedling growth of globe artichoke. Agronomie 22:443–450.
Meiri, A. 1984. Plant response to salinity: Experimental methodology and application to the field.p. 284–297. In I. Shainberg and J. Shalhevet (eds.) Soil Salinity Under Irrigation. Springer Verlag,New York.
Mikkelsen, R.L., B.H. Haghnia, A.L. Page and F.T. Bingham. 1988. The influence of selenium, salinityand boron on alfalfa tissue composition and yield. J. Environ. Qual:17:85–88
Mittler, R. 2006. Abiotic stress, the field environment and stress combination. Trends in Plant Sci11:15–19
Miyamoto, S., K. Piela, and J. Patticrew. 1985 Salt effects on germination and seedling emergence ofseveral vegetable crops and guayule. Irrig. Sci. 6:159–170.
Mühling K.H. and A. Läuchli. 2002a. Effect of salt stress on growth and cation compartmentation inleaves of two plant species differing in salt tolerance. J. Plant Physiol. 159:137–146.
Mühling K.H. and A. Läuchli. 2002b. Determination of apoplastic Na+ in intact leaves of cotton by invivo fluorescence ratio-imaging . Funct. Plant Biol. 29:1491–1499.
Munns, R. 2002a. Comparative physiology of salt and water stress. Plant Cell Environ. 25:239–250.Munns R. 2002b. Salinity, growth and phytohormones. In: Salinity: Environment – Plants – Molecules,
A. Läuchli and U. Lüttge (Eds.). Kluwer Academic Publishers, Dordrecht, pp. 271–290.Munns R. 2005. Genes and salt tolerance: bringing them together. New Phytol. 167:645–663.Munns R., James R.A. and A. Läuchli. 2006. Approaches to increasing the salt tolerance of wheat and
other cereals. J. Exp. Bot. 57:1025–1043.Munns R. and A. Termaat. 1986. Whole plant responses to salinity. Aust. J. Plant Physiol. 13:143–160.Munns, R., S. Husain, A.R. Rivelli, R.A. James, A.G. Condon, M.P. Lindsay, E.S. Lagudah, D.P
Schachtman and R.A. Hare. 2002. Avenues for increasing salt tolerance of crops, and the role ofphysiologically based selection traits. Plant Soil 247:93–105.
Munns, R. and H.M. Rawson. 1999. Effect of salinity on salt accumulation and reproductive developmentin the apical meristem of wheat and barley. Aust. J. Plant Physiol. 26:459–464
Nable, R.O., G.S. Bañuelos and J.G. Paull. 1997. Boron toxicity. Plant Soil, 193:181–198.Navarro, J.M., C. Garrido, M. Carvajal and V. Martinez. 2002. Yield and fruit quality of pepper plants
under sulfate and chloride salinity. J. Hort. Sci. and Biotech 77:52–57.Nerson, H. and H.S. Paris. 1984. Effects of salinity on germination, seedling growth, and yield of
melons. Irrig. Sci. 5:265–273Neumann P.M. 1993. Rapid and reversible modifications of extension capacity of cell walls in elongating
maize leaf tissues responding to root addition and removal of NaCl. Plant Cell Environ. 16:1107–1114,
PLANT GROWTH AND DEVELOPMENT UNDER SALINITY STRESS 31
Neves-Piestun B.G. and N. Bernstein. 2001. Salinity-induced inhibition of leaf elongation in maize isnot mediated by changes in cell wall acidification capacity. Plant Physiol. 125:1419–1428.
Neves-Piestun B.G. and N. Bernstein. 2005. Salinity-induced changes in the nutritional status ofexpanding cells may impact leaf growth inhibition in maize. Funct. Plant Biol. 93:1610–1619.
Nieman, R.H., and L.L. Poulsen. 1967. Interactive effects of salinity and atmospheric humidity on thegrowth of bean and cotton plants. Bot. Gaz. 128:69–73.
Nonami H. and J.S. Boyer. 1990. Wall extensibility and cell hydraulic conductivity decrease in enlargingstem tissues at low water potentials. Plant Physiol. 93:1610–1619.
Oertli J.J. 1968. Extracellular salt accumulation, a possible mechanism of salt injury in plants.Agrochimica 12:461–469.
Ojala, J.C., W.M. Jarrell, J.A. Menge, and E.L.V. Johnson. 1983. Influence of mycorrhizal fungi on themineral nutrition and yield of onion in saline soil. Agron J. 75:255–259.
Papp J.C., Ball M.C. and N. Terry. 1983. A comparative study of the effects of NaCl salinity on respiration,photosynthesis and leaf extension growth in Beta vulgaris (sugar beet). Plant Cell Environ 6:675–677.
Pasternak, D.M., M. Twersky and Y. de Malach. 1979. Salt resistance in agricultural crops. In: Stressphysiology in crop plants (eds H. Mussell and R.C. Staples). Pp 127–142. Wiley, New York
Pearson, G.A. and A.D. Ayers. 1966. Relative salt tolerance of rice during germination and early seedlingdevelopment. Soil Sci. 102:151–156.
Pearson, G.A. and L. Bernstein, 1959. Salinity effects at several growth stages of rice. Agron. J.51:654:657.
Pitman MG. and A. Läuchli. 2002. Global impact of salinity and agricultural ecosystems. In: Salinity:Environment – Plants – Molecules, A. Läuchli and U. Lüttge (Eds.). Kluwer Academic Publishers,Dordrecht, pp. 3–20.
Poss, J.A., S.R. Grattan, and C. M. Grieve and M.C. Shannon. 1998. Characterization of leaf boroninjury in salt-stressed Eucalyptus by Image Analysis. Plant Soil: 206: 237–245.
Poss, J.A., E. Pond, J.A. Menge, and W. M. Jarrell. 1985. Effect of salinity on mycorrhizal onion andtomato in soil with and without additional phosphate. Plant Soil 88:307–319
Poss, J.A., W.B Russell, P.J. Shouse, R.S. Austin, S.R. Grattan, C.M. Grieve, J.H. Lieth and L. Zeng.2004. A volumetric lysimeter system (VLS): an alternative to weighing lysimeters for plant-waterrelations studies. Comp. Electronics Agric. 43:55–68.
Rogers, M.E., C.M. Grieve and M.C. Shannon. 1998. The response of lucerne (Medicago sativa L. tosodium sulfate and chloride salinity. Plant Soil 202:271–280.
Rengasamy P. 2006. World salinization with emphasis on Australia. J. Exp. Bot 57:1017–1023.Rengel, Z. 1992. The role of calcium in salt toxicity. Plant Cell Environ. 15:625–632Shalhevet, J. and T.C. Hsiao. 1986. Salinity and drought. Irrig. Sci. 7:249–264Shani, U. and L.M. Dudley. 2001. Field studies of crop response to water and salt stress. Soil Sci. Soc.
Am. J. 65:1522–1528Shani, U. and R.J. Hanks. 1993. Model of integrated effects on boron, inert salt, and water flow on crop
yield. Agron. J. 85:713–717.Sharpley, A.N., J.J. Meisinger, J.F. Power, and D.L. Suarez. 1992. Root extraction of nutrients associated
with long-term soil management. In J.L. Hatfield and B.A. Steward (eds.) Advances in Soil Science.Vol. 19. Springer-Verlag, New York.
Snapp, S.S., C. Shennan, and A.H.C. van Bruggen. 1991. Effects of salinity on severity of infection byPhytophthora parasitica Dast., ion concentrations and growth of tomato, Lycopersicon esculentumMill. New Phytol. 119:275–284.
Tajbakhsh, M., M.X. Zhou, Z.H. Chen and N.J. Mendham. 2006. Physiological and cytological responseof salt-tolerant and non-tolerant barley to salinity during germination and early growth. Aust. J. Exp.Agric. 46:555–562.
Tanji, K.K. 1990. (ed). Agricultural salinity assessment and management. ASCE manuals and reportson engineering practice No. 71. Am. Soc. Civil Eng., New York
Tester M. and R. Davenport. 2003. Na+ tolerance and Na+ transport in higher plants. Ann. Bot.91:503–527.
32 LÄUCHLI AND GRATTAN
Thiel G.H., Lynch J. and A. Läuchli. 1988. Short-term effects of salinity stress on the turgor andelongation of growing barley leaves. J. Plant Physiol. 132:38–44.
Tsadilas, C.D. 1997. Soil contamination with boron due to irrigation with treated municipal wastewater. In Boron in Soils and Plants. R.W. Bell and B. Rerkasem (eds) Kluwer Academic Publishers,Dordrecht pp 265–270.
Van Volkenburgh E. and J.S. Boyer. 1985. Inhibitory effect of water deficit on maize leaf elongation.Plant Physiol. 77:190–194.
Vinizky, I and D.T. Ray. 1988. Germination of guar seed under salt and temperature stress. J. Am. Soc.Hort. Sci. 113:437–440.
Wadleigh, C.H. and A.D. Ayers. 1945. Growth and biochemical composition of bean plants as condi-tioned by soil moisture tension and salt concentration. Plant Physiol. 20: 106–132.
Wilson, C., S.M. Lesch and C.M. Grieve. 2000. Growth stage modulates salinity tolerance of NewZealand spinach (Tetragonia tetragonioides, Pall) and Red Orach (Atriplex hortensis L.) Annals Bot.85:501–509.
Wimmer, M.A., K.H. Mühling, A. Läuchli, P.H. Brown and H.E. Goldbach. 2001. Interaction of salinityand boron toxicity in wheat (Triticum asetivum L.) In Plant nutrition - Food security and sustainabilityof agro-ecosystems. Kluwer Academic Publishers pp 426–427
Wimmer, M.A., K. H. Mühling, A. Läuchli, P.H. Brown and H.E. Goldbach. 2003. The interactionbetween salinity and boron toxicity affect subcellular distribution of in and proteins in wheat leaves.Plant Cell Envrion. 26:1267–1274
Wimmer M.A. Bassil E.S., Brown P.H. and A. Läuchli. 2005. Boron response in wheat is genotype-dependent and related to boron uptake, translocation, allocation, plant phenological development andgrowth rate. Funct. Plant Biol. 32:507–515.
Yadav, H. D., O. P.Yadav, O. P. Dhankar, and M. C. Oswal. 1989. Effect of chloride salinity and{\}boron on germination, growth, and mineral composition of chickpea (Cicer arietinum L.) Ann. AridZone 28:63–67.
Yamaguchi T. and E. Blumwald. 2005. Developing salt-tolerant crop plants: challenges and opportunities.Trends in Plant Science 10:615–620.
Yeo A.R., Lee K.S., Izard P., Boursier P. and T.J. Flowers. 1991. Short- and long-term effects of salinityon leaf growth in rice (Oryza sativa L.). J. Exp. Bot. 42:881–889.
Yermiyahu U., Nir S., Ben-Hayyim G., Kafkafi U. and T.B. Kinraide. 1997. Root elongation in salinesolution related to calcium binding to root cell plasma membranes. Plant Soil 191:67–76.
Zeng, L. and M.C. Shannon. 2000. Salinity effects on seedling growth and yield components of rice.Crop Sci. 40:996–1003
Zhong H. and A. Läuchli. 1993. Spatial and temporal aspects of growth in the primary root of cottonseedlings: effects of NaCl and CaCl2. J. Exp. Bot. 44:763–771.
Zhong H. and A. Läuchli. 1994. Spatial distribution of solutes, K, Na, and Ca and their deposition ratesin the growth zone of primary cotton roots: effects of NaCl and CaCl2. Planta 194:34–41.
Zhu J.-K. 2002. Salt and drought stress signal transduction in plants. Annu. Rev. Plant Biol. 53: 247–273.