Embed Size (px)
Citation preview

Advances in methods for evaluating
Tropical Cyclone precipitation forecasts
and hazards
Barbara Brown
NCAR, Boulder, CO USA
J. Chen2,3, G. Chen4, E. Ebert3, H. Yu4,
M. Biswas1, T. Jensen1, and J. Halley Gotway1
1National Center for Atmospheric Research, Boulder, Colorado USA 2University of Melbourne, Melbourne, Australia
3Bureau of Meteorology, Melbourne, Australia 4Shanghai Typhoon Institute, Shanghai, China
10 December 2014

2
TC Rainfall verification challenges
Extreme rainfall amounts Difficult to measure
Difficult to evaluate statistically
Adequate observations may be limited Gridded satellite or radar
estimates
Rain gauges or gauge analyses
Focused discrete regions of interest Verification greatly
impacted by position error
After landfall, may need to disaggregate from other systems
IWTCLP-III, December 2014, Jeju, Republic of Korea
Typhoon
Bolaven:
27 Aug 2012
TRMM Rainfall
rates >
75mm/hr

3
Goals
Discuss approaches for evaluating TC precipitation forecasts
Traditional methods
Spatial approaches
Brief discussion of extensions to ensembles and inclusion of time dimension
Resources
IWTCLP-III, December 2014, Jeju, Republic of Korea
2014-12-06 12Z, 24-h eTRaP for
HAGUPIT, 24-h total
PoP > 50 mm
Precip amount
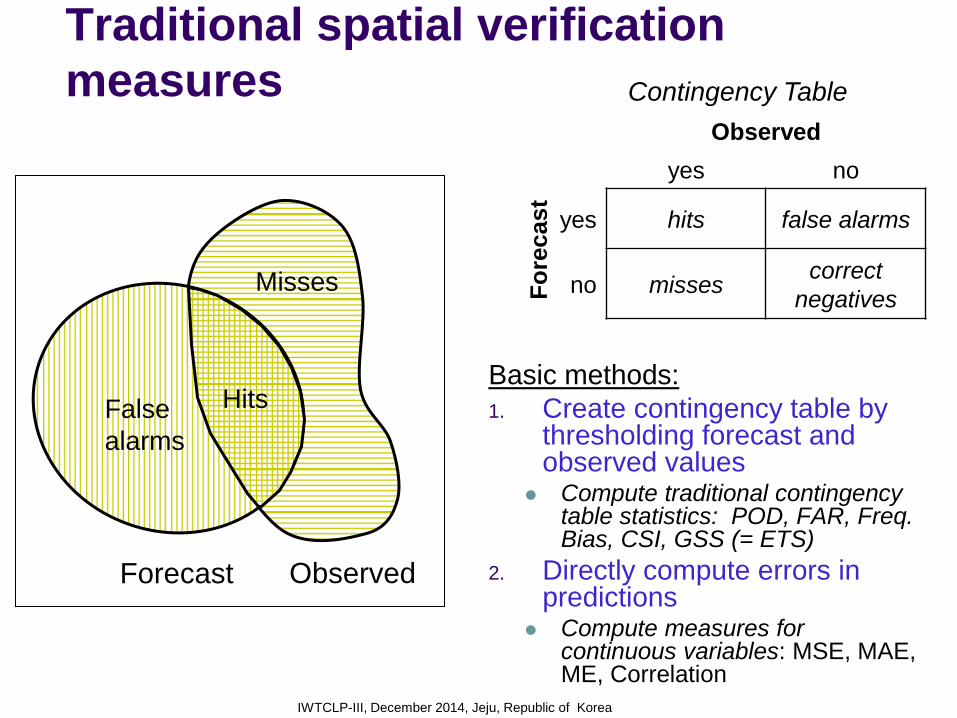
Traditional spatial verification
measures Observed
yes no
yes hits false alarms
no misses correct
negatives Fo
recast
Contingency Table
Forecast Observed
False
alarms
Hits
Misses
Basic methods:
1. Create contingency table by thresholding forecast and observed values
Compute traditional contingency table statistics: POD, FAR, Freq. Bias, CSI, GSS (= ETS)
2. Directly compute errors in predictions
Compute measures for continuous variables: MSE, MAE, ME, Correlation
IWTCLP-III, December 2014, Jeju, Republic of Korea

5
Example: Shanghai Typhoon Institute evaluation
of NWP model precipitation forecasts
2010-2012, 19 TCs affecting China
24-h precipitation from East China Region (~500 stations)
Two global models: ECMWF-IFS, JMA-GSM
Two regional models: GRAPES-TCM, GRMC
24hr precipitation verification: TS, ETS, POD, FAR
Thresholds: 0.1mm, 10mm, 25mm, 50mm
IWTCLP-III, December 2014, Jeju, Republic of Korea
Credit: H. Yu, STI
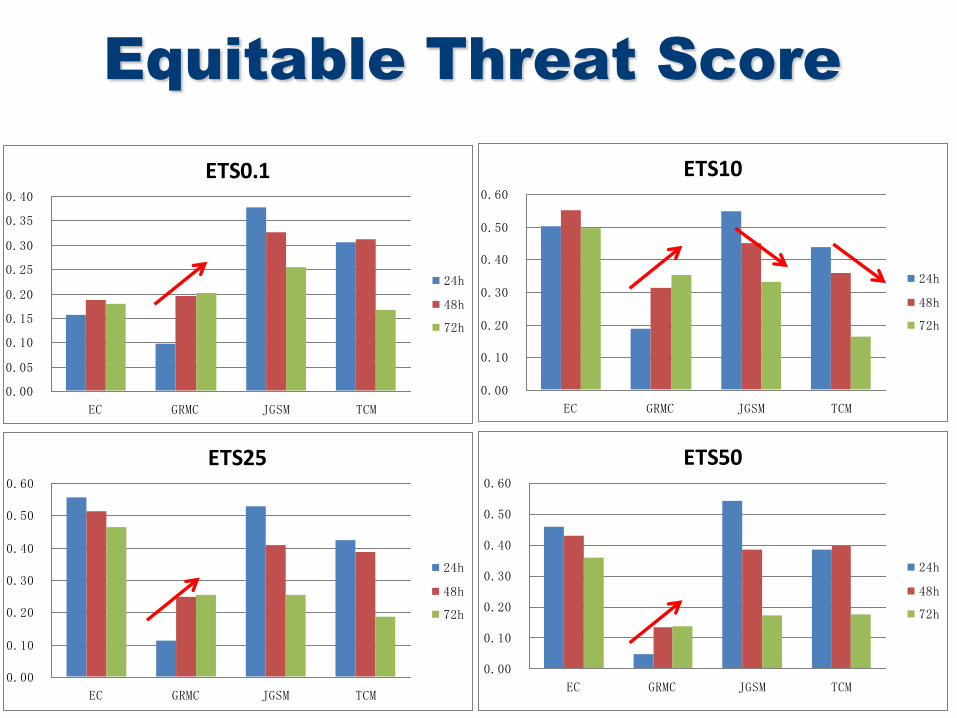
Equitable Threat Score
ETS0.1
0.00
0.05
0.10
0.15
0.20
0.25
0.30
0.35
0.40
EC GRMC JGSM TCM
24h
48h
72h
ETS10
0.00
0.10
0.20
0.30
0.40
0.50
0.60
EC GRMC JGSM TCM
24h
48h
72h
ETS25
0.00
0.10
0.20
0.30
0.40
0.50
0.60
EC GRMC JGSM TCM
24h
48h
72h
ETS50
0.00
0.10
0.20
0.30
0.40
0.50
0.60
EC GRMC JGSM TCM
24h
48h
72h
7
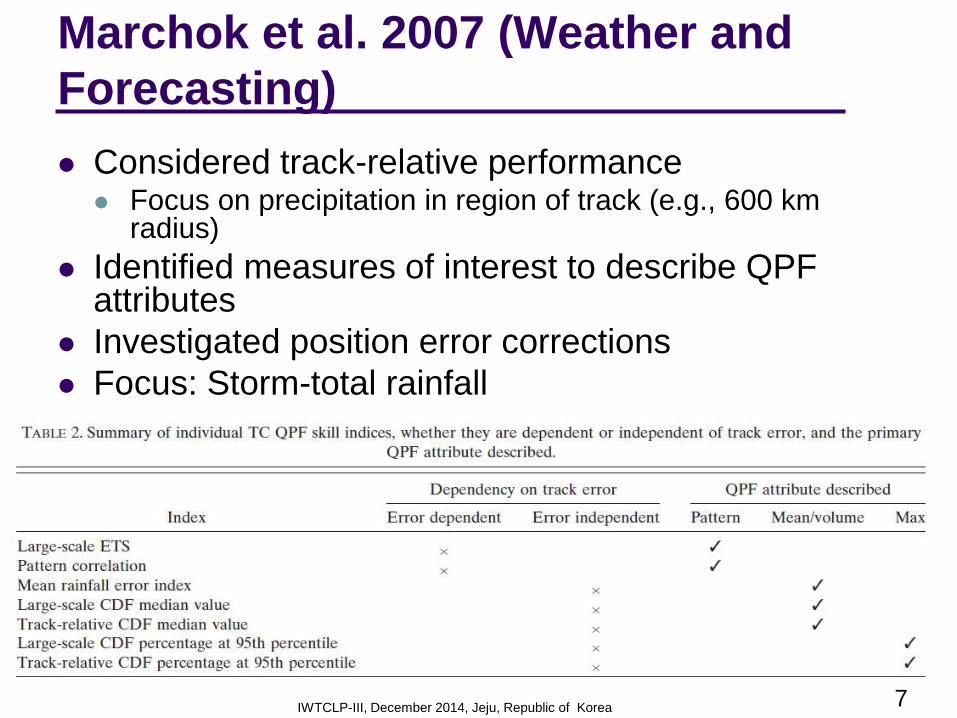
Marchok et al. 2007 (Weather and
Forecasting)
Considered track-relative performance Focus on precipitation in region of track (e.g., 600 km
radius)
Identified measures of interest to describe QPF attributes
Investigated position error corrections
Focus: Storm-total rainfall
IWTCLP-III, December 2014, Jeju, Republic of Korea

ETS and Pattern Correlation Storm-relative precipitation
distributions
Landfalling storms, 1998-2004 From Marchok et al. 2007

9
Impact of position error
HWRF
example
16 storms,
2010-2014
600 km storm
region
8 precipitation
thresholds: 1,
2, 3, 4, 5, 8,
10, 15 in
IWTCLP-III, December 2014, Jeju, Republic of Korea
Example: Gilbert Skill Score (GSS; also
known as ETS) as a function of lead time

10
Limitations of traditional approaches
verification approaches
Verification measures don’t provide
Information about kinds of errors (Placement?
Intensity? Pattern?)
Diagnostic information
What went wrong? What went right?
Does the forecast look realistic?
How can I improve this forecast?
How can I use it to make a decision?
Double penalty problem
IWTCLP-III, December 2014, Jeju, Republic of Korea

11
Double penalty problem
Traditional approach requires an exact match between
forecasts and observations at every grid point to score a hit
Hi res forecast
RMS ~ 4.7
POD=0, FAR=1
TS=0
Low res forecast
RMS ~ 2.7
POD~1, FAR~0.7
TS~0.3
10 10 10 3
fcst obs fcst obs Double penalty:
(1) Event predicted where it did
not occur => False alarm
(2) No event predicted where it
did occur => Miss
10 10
fcst obs
IWTCLP-III, December 2014, Jeju, Republic of Korea

Spatial Verification Approaches
IWTCLP-III, December 2014, Jeju, Republic of Korea
To address
limitations of
traditional
approaches, a new
set of spatial
verification
methods have been
developed
Goal is to provide
more useful
information about
forecast
performance

13
Spatial verification approaches
Neighborhood Successive smoothing of
forecasts/obs Gives credit to "close"
forecasts
Scale separation Measure scale-dependent error
Field deformation Measure distortion and displacement (phase error) for whole field
How should the forecast be adjusted to make the best
match with the observed field?
Object- and feature-based
Evaluate attributes of identifiable features
IWTCLP-III, December 2014, Jeju, Republic of Korea

14
Feature-based
methods
Contiguous Rain Area
(CRA) and Method for
Object-based Diagnostic
Evaluation (MODE) are
two promising approaches
for TC rainfall CRA method applied to Hurricane Ike
eTRAP forecasts
MODE applied to TC
precipitation in China (Tang et
al. 2012)
IWTCLP-III, December 2014, Jeju, Republic of Korea

15
Contiguous Rain Areas (CRA)
Ebert and McBride
(2000); Ebert and Gallus
(2009); Moise and
Delage (2011)…
Decompose total error
into four components:
o Displacement
o Rotation
o Volume
o Pattern
IWTCLP-III, December 2014, Jeju, Republic of Korea
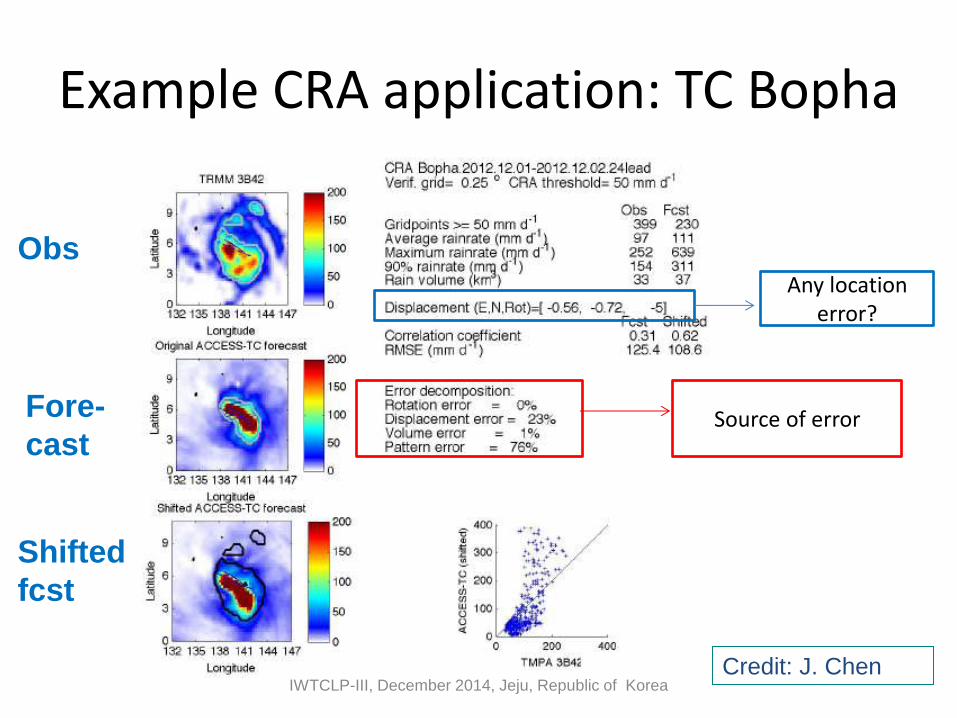
Example CRA application: TC Bopha
Source of error
Any location error?
IWTCLP-III, December 2014, Jeju, Republic of Korea Credit: J. Chen
Obs
Fore-
cast
Shifted
fcst

CRA error decomposition
2012-2013 ACCESS-TC; 63 runs
R=rotation
D=displacement; V=volume
P-=pattern
IWTCLP-III, December 2014, Jeju,
Republic of Korea
Credit: J. Chen

Method for Object-based Diagnostic Evaluation (MODE)
How it works
OBS ENS FCST Radius=5
ObjectThresh
>6.35 mm
MergingThresh
> 5.7 mm
Radius=5
ObjectThresh
>6.35 mm
MergingThresh
>5.7 mm
Merging
Matching
No false
alarms
Misses
Merging
Matched Object 1
Matched Object 2
Unmatched Object
IWTCLP-III, December 2014, Jeju,
Republic of Korea

Comparing objects can tell you things about your forecast like . . .
This: Instead of this:
30% Too Big (area ratio=1.3)
POD = 0.35
Shifted west 1 km (centroid distance = 1km)
FAR = 0.7235
Rotated 15° (angle diff = 15%)
CSI = 0.1587
Peak Rain 1/2” too much (diff in 90th percentile of intensities = 0.5)
IWTCLP-III, December 2014, Jeju,
Republic of Korea

6hr Accumulated Precipitation Near Peak (90th%) Intensity Difference (Fcst – Obs)
Diffe
rence(P
90 F
cst
– P
90 O
bs)
High Resolution Deterministic Does Fairly Well
High Resolution Ensemble Mean Underpredicts
Mesoscale Deterministic Underpredicts
Mesoscale Ensemble Underpredicts the most
Overforecast
Underforecast
IWTCLP-III, December 2014, Jeju, Republic of Korea

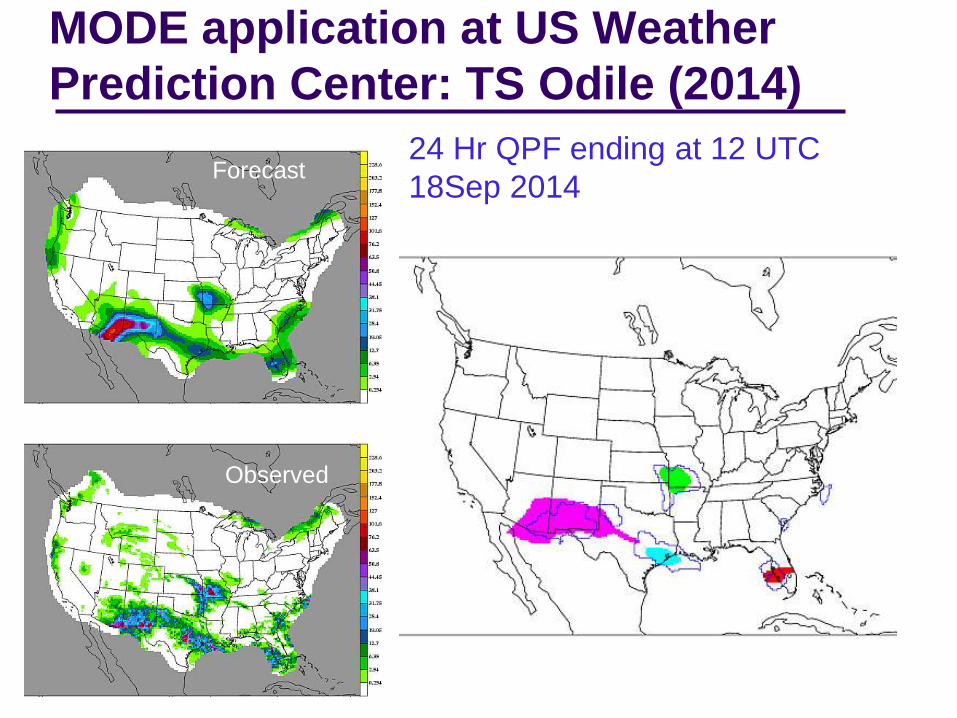
MODE application at US Weather
Prediction Center: TS Odile (2014)
MODE application at US Weather
Prediction Center: TS Odile (2014)
24 Hr QPF ending at 12 UTC
18Sep 2014
Observed
Forecast

SMB-WARMS (WRF, 9km)
MODE products for 24h precipitation
initialized at 00 UTC August 31.
(a) forecast of SMB-WARMS; (b) Observation.
Forecast is too large
Area ratio = 1.49
Centroid distance ~70 km
Axis angle difference is only
5.7 degree
Credit: H. Yu

IWTCLP-III, December 2014, Jeju, Republic of Korea
With multiple clusters: Lua2012
MODE-CRA Comparison
Credit:
J. Chen

CRA vs. MODE
IWTCLP-III, December 2014, Jeju, Republic of Korea
CRA MODE
Verification area
definition
CRA threshold Rain threshold
Error
decomposition
Y N
Location error Y (explicitly, show
direction)
Y (implicitly, through centroid
distance and locations)
Pattern match? Y, simply use
correlation coefficient
Y, Total interest (combination of
size, distance, intensity, volume,
etc)
Rain Volume Y Y
Rain Area Y, simply compare
CRA grid points
Y, also with Intersection and
Union, Symmetric difference area

Applying spatial methods to ensembles
As probabilities: Areas do not have “shape” of precipitation areas; may “spread” the area
As mean:
Area is not equivalent to any of the underlying ensemble members
As an ensemble of attributes:
May have many interesting features

Ensemble Mean
Matched Forecast Object
Unmatched Forecast Object
Matched Observed Object
Unmatched Observed Object
No Ensemble Mean Matched
MODE Example May 11,
2013
Short-Range Ensemble Forecast
Evaluation Credit: T. Jensen, J. Halley Gotway

Forecast Observed
Adding the time dimension: MODE-TD
Credit: R. Bullock Note: This example is an application to
climate model output
Time
is up

29
Summary / Conclusion
Evaluation of precipitation forecasts is
important for forecast users (including
forecasters’ application of NWP), forecasters,
and forecast guidance developers
Techniques for precipitation verification are
expanding quickly
Several new methods show promise (and are
being used) for TC verification
Resources exist for application of these
methods
IWTCLP-III, December 2014, Jeju, Republic of Korea

30
Resources
WMO documents on
Precipitation verification
and Tropical Cyclone
verification
http://www.wmo.int/pages/prog/arep/wwrp/new
/Forecast_Verification.html
IWTCLP-III, December 2014, Jeju, Republic of Korea
Verification Methods and FAQ:
http://www.cawcr.gov.au/projects/verifi
cation/
31
Software Tools
Model Evaluation Tools
(MET) and MET-TC
R Verification package
(http://www.r-
project.org/)
R spatial package
(Spatial-vx)
CRA available from
BOM (Beth Ebert)
http://www.dtcenter.org/met/users/
IWTCLP-III, December 2014, Jeju, Republic of Korea