Embed Size (px)
Citation preview
Joint Research Centre the European Commission's in-house science service
Serving society
Stimulating innovation
Supporting legislation
Advances in high temperature property determination for Gen-IV materials
Stefan Holmström
November 2015
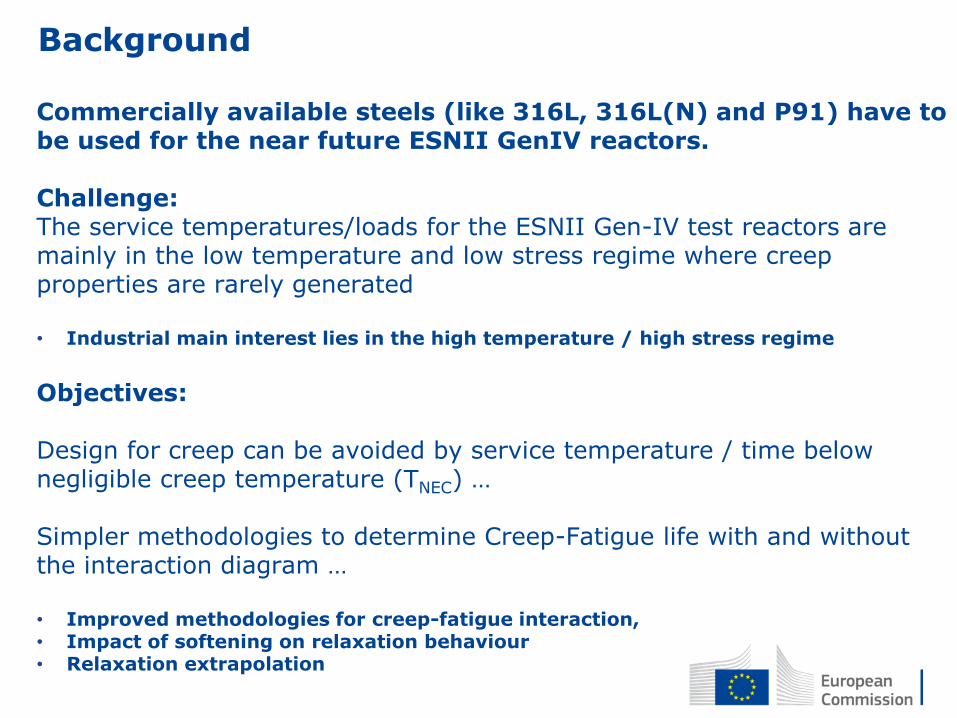
Commercially available steels (like 316L, 316L(N) and P91) have to be used for the near future ESNII GenIV reactors. Challenge: The service temperatures/loads for the ESNII Gen-IV test reactors are mainly in the low temperature and low stress regime where creep properties are rarely generated • Industrial main interest lies in the high temperature / high stress regime
Objectives: Design for creep can be avoided by service temperature / time below negligible creep temperature (TNEC) … Simpler methodologies to determine Creep-Fatigue life with and without the interaction diagram … • Improved methodologies for creep-fatigue interaction, • Impact of softening on relaxation behaviour • Relaxation extrapolation
Background
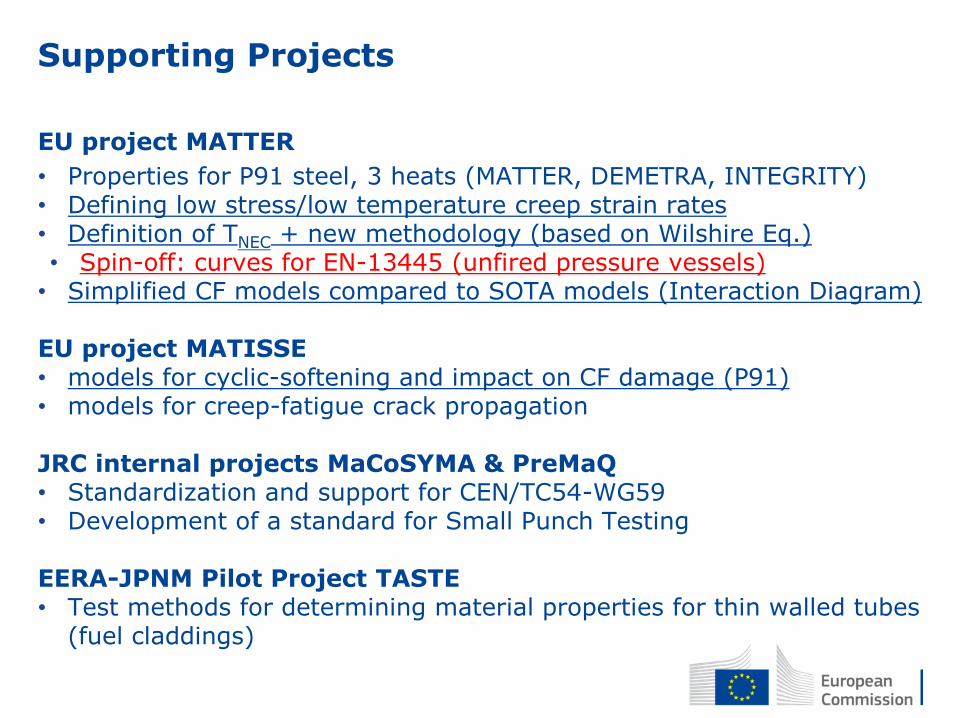
EU project MATTER
• Properties for P91 steel, 3 heats (MATTER, DEMETRA, INTEGRITY) • Defining low stress/low temperature creep strain rates • Definition of TNEC + new methodology (based on Wilshire Eq.) • Spin-off: curves for EN-13445 (unfired pressure vessels) • Simplified CF models compared to SOTA models (Interaction Diagram) EU project MATISSE • models for cyclic-softening and impact on CF damage (P91) • models for creep-fatigue crack propagation
JRC internal projects MaCoSYMA & PreMaQ • Standardization and support for CEN/TC54-WG59 • Development of a standard for Small Punch Testing
EERA-JPNM Pilot Project TASTE • Test methods for determining material properties for thin walled tubes
(fuel claddings)
Supporting Projects
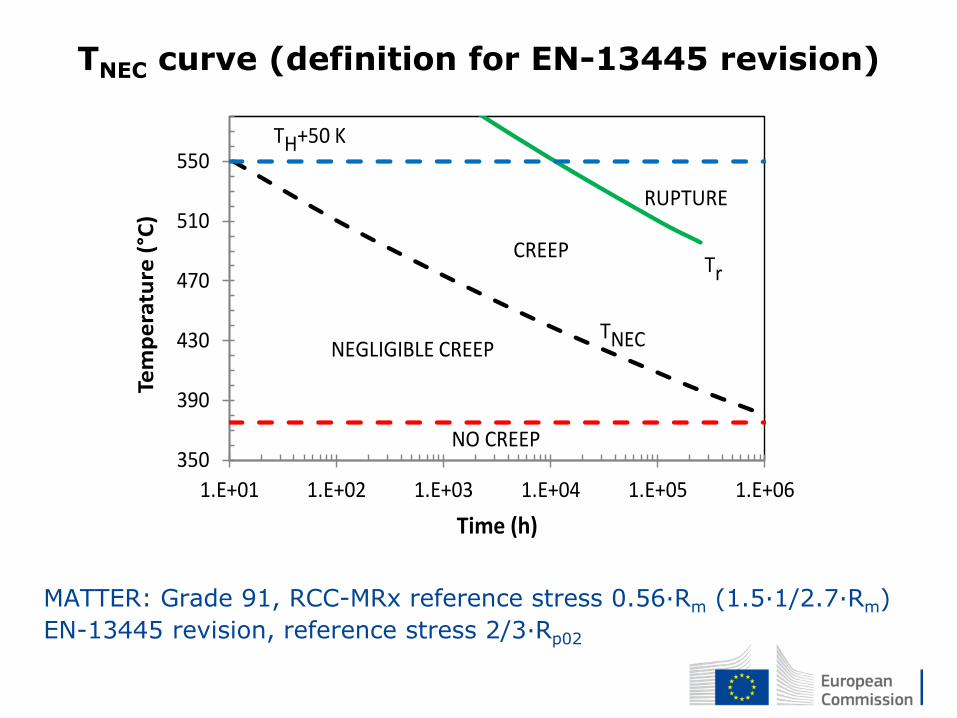
TNEC curve (definition for EN-13445 revision)
MATTER: Grade 91, RCC-MRx reference stress 0.56·Rm (1.5·1/2.7·Rm)
EN-13445 revision, reference stress 2/3·Rp02
350
390
430
470
510
550
1.E+01 1.E+02 1.E+03 1.E+04 1.E+05 1.E+06
Tem
pe
ratu
re (
°C)
Time (h)
Tr
RUPTURE
CREEP
NEGLIGIBLE CREEP
NO CREEP
TNEC
TH+50 K
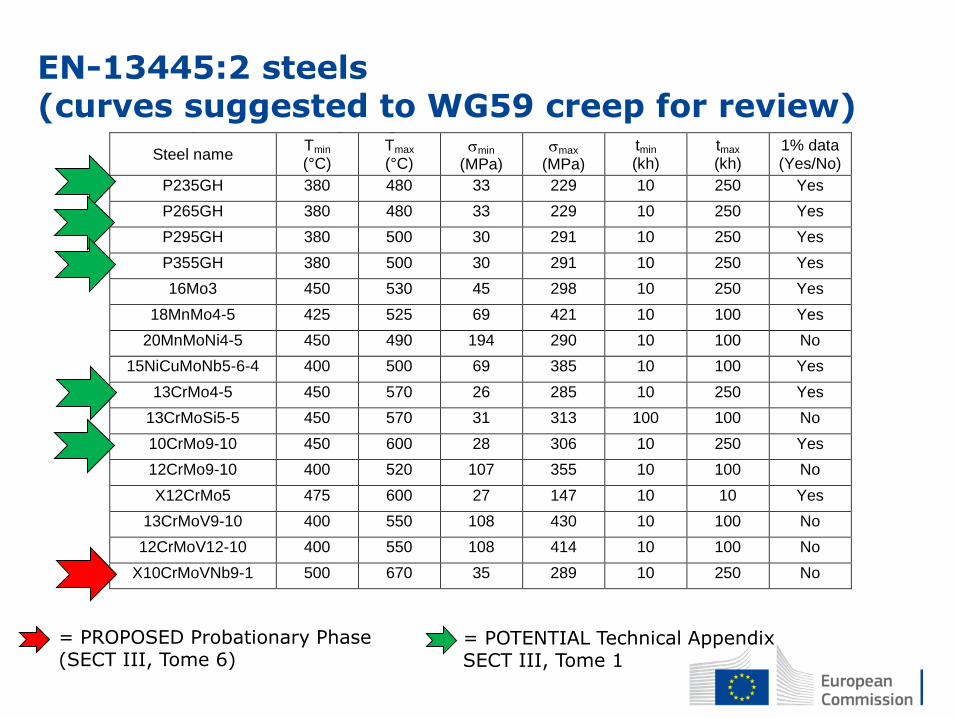
Table 1. Steels covered in EN10028-2 in the order given in the standard. The temperature range (Tmin and Tmax), stress range (min and max) and the time minimum and maximum of the creep rupture data (tmin, tmax) is given as well as the availability of time to 1% creep strength data.
Steel name Tmin
(°C) Tmax
(°C) min
(MPa) max
(MPa)
tmin (kh)
tmax (kh)
1% data (Yes/No)
P235GH 380 480 33 229 10 250 Yes
P265GH 380 480 33 229 10 250 Yes
P295GH 380 500 30 291 10 250 Yes
P355GH 380 500 30 291 10 250 Yes
16Mo3 450 530 45 298 10 250 Yes
18MnMo4-5 425 525 69 421 10 100 Yes
20MnMoNi4-5 450 490 194 290 10 100 No
15NiCuMoNb5-6-4 400 500 69 385 10 100 Yes
13CrMo4-5 450 570 26 285 10 250 Yes
13CrMoSi5-5 450 570 31 313 100 100 No
10CrMo9-10 450 600 28 306 10 250 Yes
12CrMo9-10 400 520 107 355 10 100 No
X12CrMo5 475 600 27 147 10 10 Yes
13CrMoV9-10 400 550 108 430 10 100 No
12CrMoV12-10 400 550 108 414 10 100 No
X10CrMoVNb9-1 500 670 35 289 10 250 No
EN-13445:2 steels (curves suggested to WG59 creep for review)
= PROPOSED Probationary Phase (SECT III, Tome 6)
= POTENTIAL Technical Appendix SECT III, Tome 1
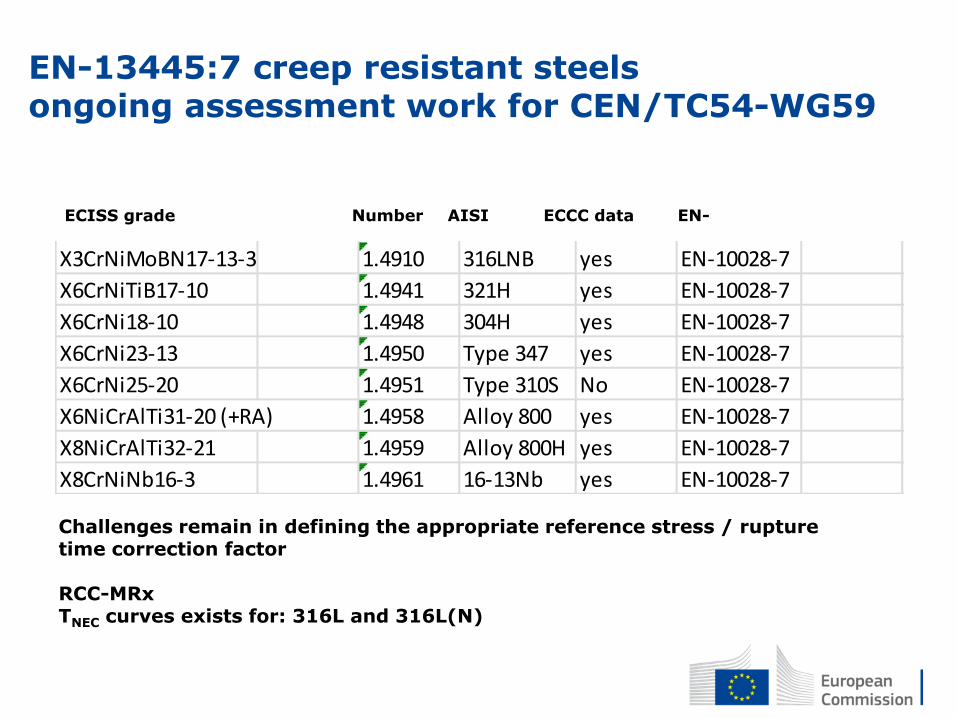
EN-13445:7 creep resistant steels ongoing assessment work for CEN/TC54-WG59
ECISS grade Number AISI ECCC Creep properties
ECCC
X3CrNiMoBN17-13-3 1.4910 316LNB yes EN-10028-7
X6CrNiTiB17-10 1.4941 321H yes EN-10028-7
X6CrNi18-10 1.4948 304H yes EN-10028-7
X6CrNi23-13 1.4950 Type 347 yes EN-10028-7
X6CrNi25-20 1.4951 Type 310S No EN-10028-7
X6NiCrAlTi31-20 (+RA) 1.4958 Alloy 800 yes EN-10028-7
X8NiCrAlTi32-21 1.4959 Alloy 800H yes EN-10028-7
X8CrNiNb16-3 1.4961 16-13Nb yes EN-10028-7
Challenges remain in defining the appropriate reference stress / rupture time correction factor RCC-MRx TNEC curves exists for: 316L and 316L(N)
ECISS grade Number AISI ECCC data EN-
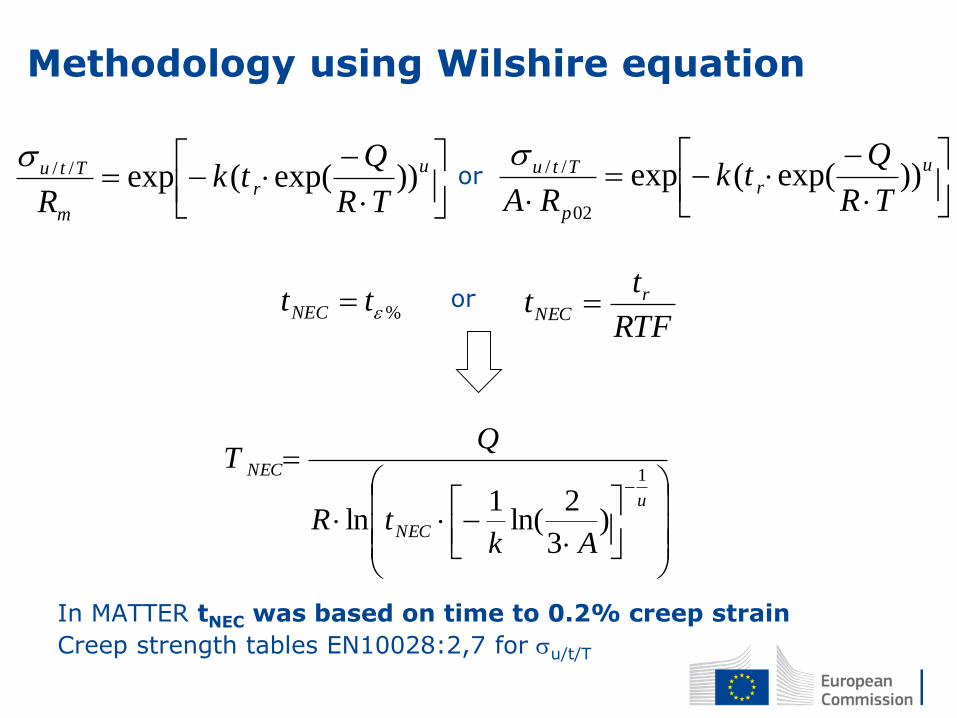
Methodology using Wilshire equation
In MATTER tNEC was based on time to 0.2% creep strain
Creep strength tables EN10028:2,7 for u/t/T
u
r
p
Ttu
TR
Qtk
RA))exp((exp
02
//
u
NEC
NEC
AktR
QT
1
)3
2ln(
1ln
or
u
r
m
Ttu
TR
Qtk
R))exp((exp//
RTF
tt r
NEC or %ttNEC
0.0
0.1
0.2
0.3
0.4
0.5
0.6
0.7
0.8
0.9
1.0
-37 -35 -33 -31 -29 -27
s/(2
.5*
Rp
02
)
ln(trexp(-Q/RT)) or ln(tRTFexp(-Q/RT))
10kh
100kh
250kh
Rupt
Rupt-RTF(1000)
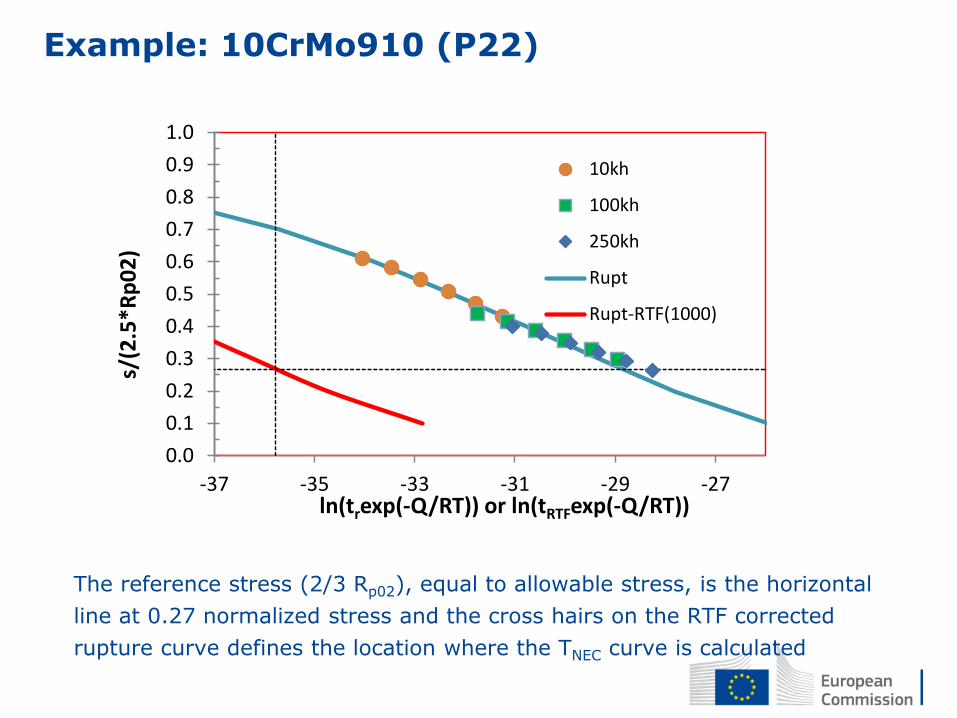
Example: 10CrMo910 (P22)
The reference stress (2/3 Rp02), equal to allowable stress, is the horizontal
line at 0.27 normalized stress and the cross hairs on the RTF corrected
rupture curve defines the location where the TNEC curve is calculated
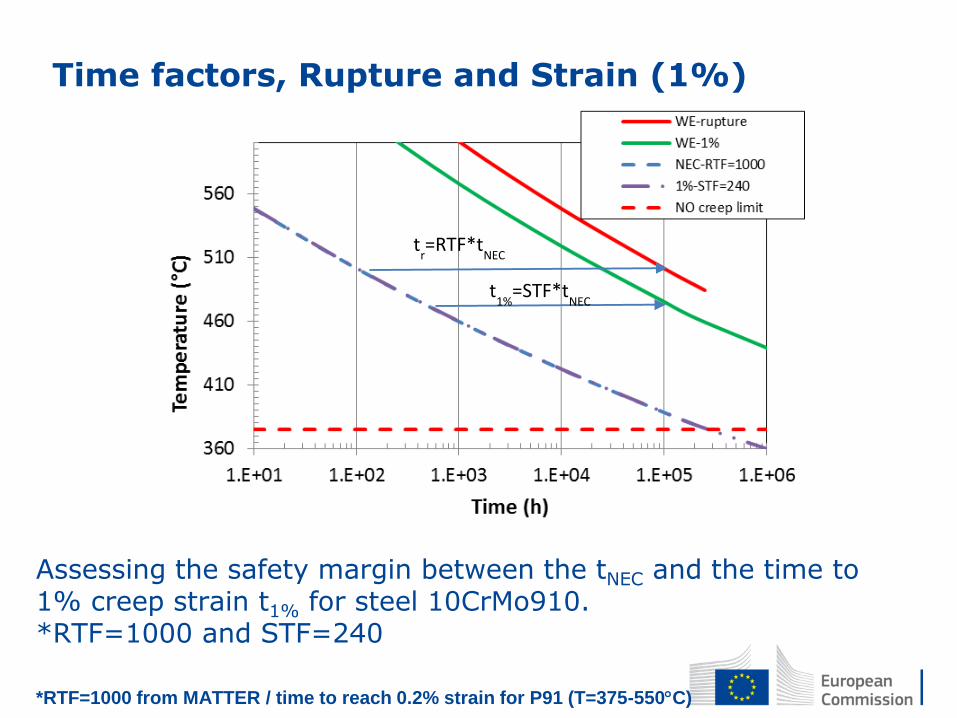
Time factors, Rupture and Strain (1%)
Assessing the safety margin between the tNEC and the time to 1% creep strain t1% for steel 10CrMo910. *RTF=1000 and STF=240 *RTF=1000 from MATTER / time to reach 0.2% strain for P91 (T=375-550C)
tr=RTF*t
NEC
t1%
=STF*tNEC
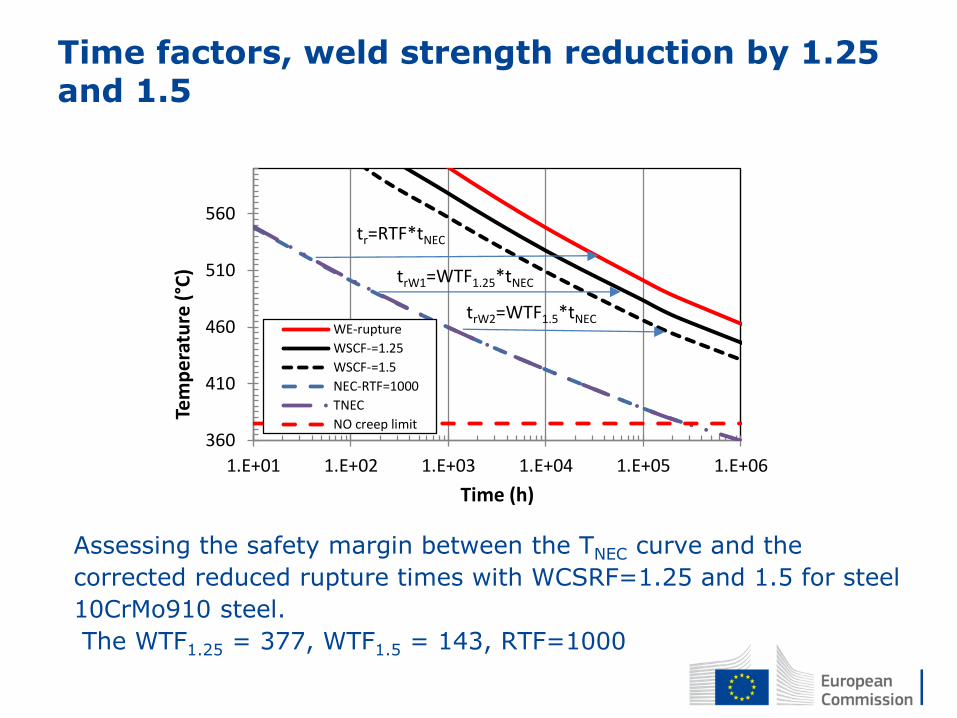
Time factors, weld strength reduction by 1.25 and 1.5
Assessing the safety margin between the TNEC curve and the
corrected reduced rupture times with WCSRF=1.25 and 1.5 for steel
10CrMo910 steel.
The WTF1.25 = 377, WTF1.5 = 143, RTF=1000
360
410
460
510
560
1.E+01 1.E+02 1.E+03 1.E+04 1.E+05 1.E+06
Tem
per
atu
re (
°C)
Time (h)
WE-rupture
WSCF-=1.25
WSCF-=1.5
NEC-RTF=1000
TNEC
NO creep limit
tr=RTF*tNEC
trW1=WTF1.25*tNEC
trW2=WTF1.5*tNEC

Inversely TNEC curves for welds using strength reduction by 1.25 and 1.5
"The same procedure defined for base materials applies with the
following modification: if the values of are different from those of the
base materials, these values are to be multiplied by the relevant
Weld Creep Strength Reduction Factor defined in 19.6."
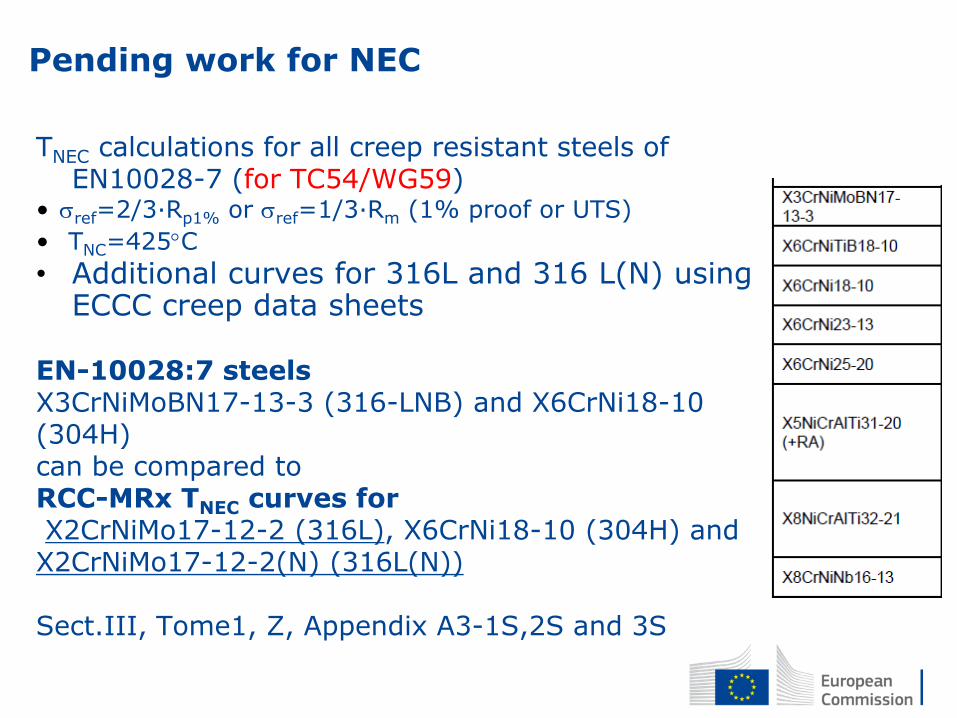
Pending work for NEC
TNEC calculations for all creep resistant steels of EN10028-7 (for TC54/WG59)
• ref=2/3·Rp1% or ref=1/3·Rm (1% proof or UTS)
• TNC=425C
• Additional curves for 316L and 316 L(N) using ECCC creep data sheets
EN-10028:7 steels X3CrNiMoBN17-13-3 (316-LNB) and X6CrNi18-10 (304H) can be compared to RCC-MRx TNEC curves for X2CrNiMo17-12-2 (316L), X6CrNi18-10 (304H) and X2CrNiMo17-12-2(N) (316L(N)) Sect.III, Tome1, Z, Appendix A3-1S,2S and 3S
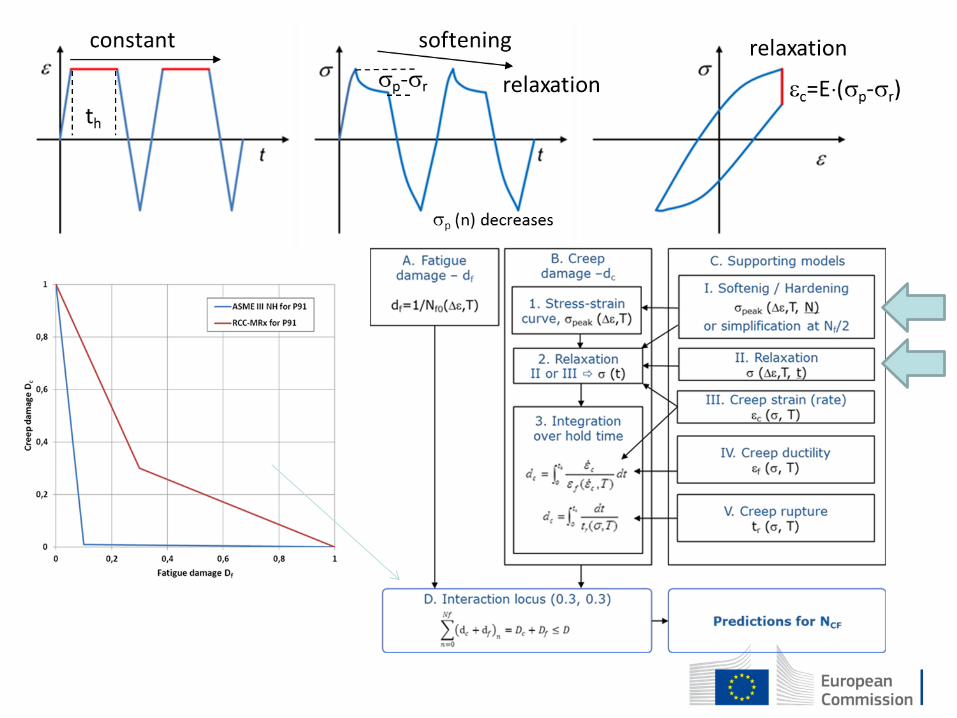
Predicting Creep-Fatigue life
In MATTER the P91 CF endurance (cycles to failure) was predicted by 3
methods
1. CF interaction diagram (RCC-MRx , R5 or ASME III-NH) with
creep damage from the relaxation (life fraction or ductility
exhaustion)
2. Simple LCF models with correction for creep strain accumulation,
i.e increased total strain range by relaxed strain or forward
creep strain (at Nf/2)
3. Simplified models based on reference stress and hold time th,
softening/hardening or strain range corrections not nesessary
• The simplified models were the most robust/accurate and
showed potential for design rule application …

European Commission Joint Research Centre - IET
European Commission Joint Research Centre - IET Examples of model predictions (P91 CF data set)
The calculated Z values for the different models applied on the same data set (strain controlled tests and 550°C). The test with the longest hold time is encircled.
Simplified CF models (Manson-Halford and -model) vs EMDE and SMDE (JRC, VTT, ANSTO paper*)
h
CFCFCF
t
tN
)(
u
CFCF tk )RT
Qexp(exp
*
c
m
bm
f
h
f
hMH
Nt
A
k
NtN
0
0
1
EMDE =Energy Modified Ductility Exhaustion
SMDE=Stress Mod. DE
*Holmstrom S., Pohja R., Payten W., Creep-Fatigue Interaction Models for Grade 91 Steel ASTM, Materials Performance and Characterization, DOI: 10.1520/MPC20130054,
TAtAA
ATt hhCF
432
1 )log(),,(
European Commission Joint Research Centre - IET
European Commission Joint Research Centre - IET
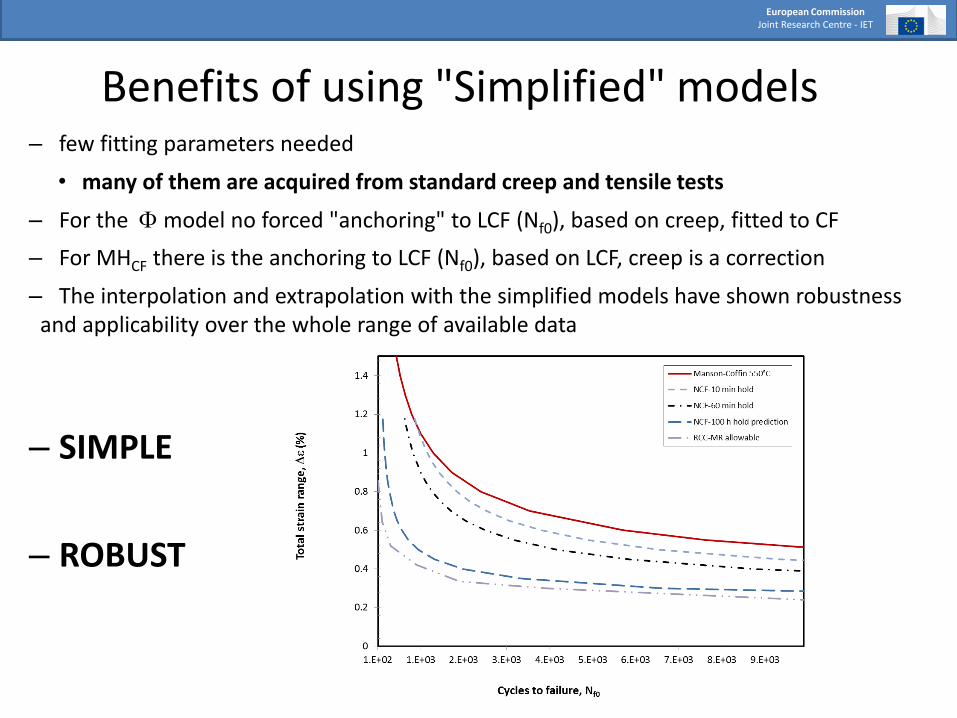
Benefits of using "Simplified" models – few fitting parameters needed
• many of them are acquired from standard creep and tensile tests
– For the model no forced "anchoring" to LCF (Nf0), based on creep, fitted to CF
– For MHCF there is the anchoring to LCF (Nf0), based on LCF, creep is a correction
– The interpolation and extrapolation with the simplified models have shown robustness and applicability over the whole range of available data
– SIMPLE
– ROBUST
European Commission
Joint Research Centre - IET
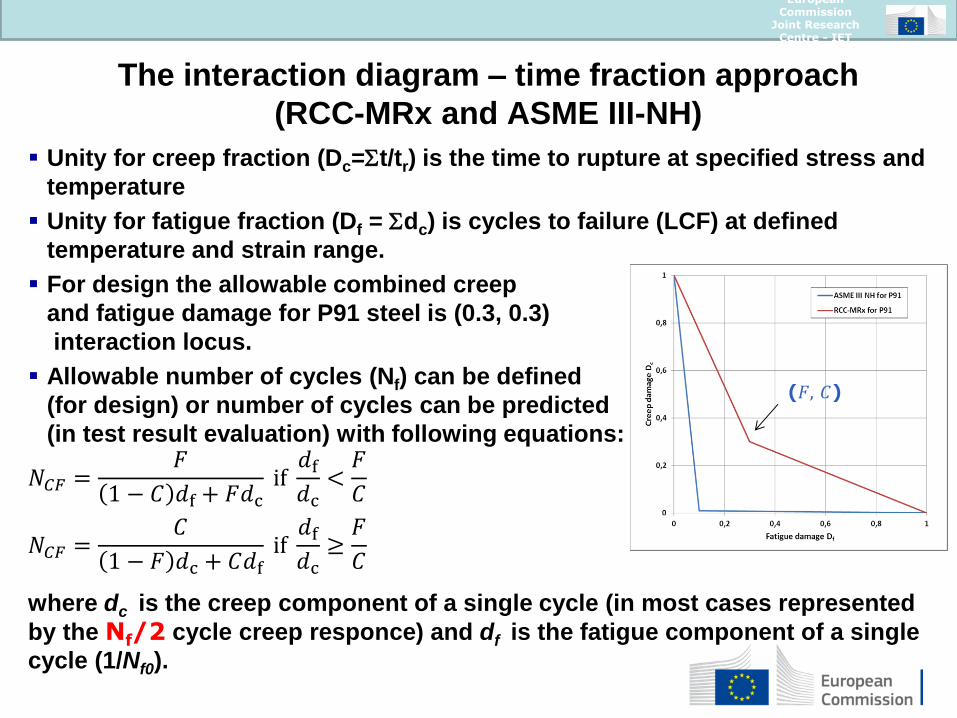
Unity for creep fraction (Dc=t/tr) is the time to rupture at specified stress and
temperature
Unity for fatigue fraction (Df = dc) is cycles to failure (LCF) at defined
temperature and strain range.
For design the allowable combined creep
and fatigue damage for P91 steel is (0.3, 0.3)
interaction locus.
Allowable number of cycles (Nf) can be defined
(for design) or number of cycles can be predicted
(in test result evaluation) with following equations:
𝑁𝐶𝐹 =𝐹
1 − 𝐶 𝑑f + 𝐹𝑑c if
𝑑f
𝑑c<
𝐹
𝐶
𝑁𝐶𝐹 =𝐶
1 − 𝐹 𝑑c + 𝐶𝑑f if
𝑑f
𝑑c≥
𝐹
𝐶
where dc is the creep component of a single cycle (in most cases represented
by the Nf/2 cycle creep responce) and df is the fatigue component of a single
cycle (1/Nf0).
The interaction diagram – time fraction approach
(RCC-MRx and ASME III-NH)
(𝐹, 𝐶)
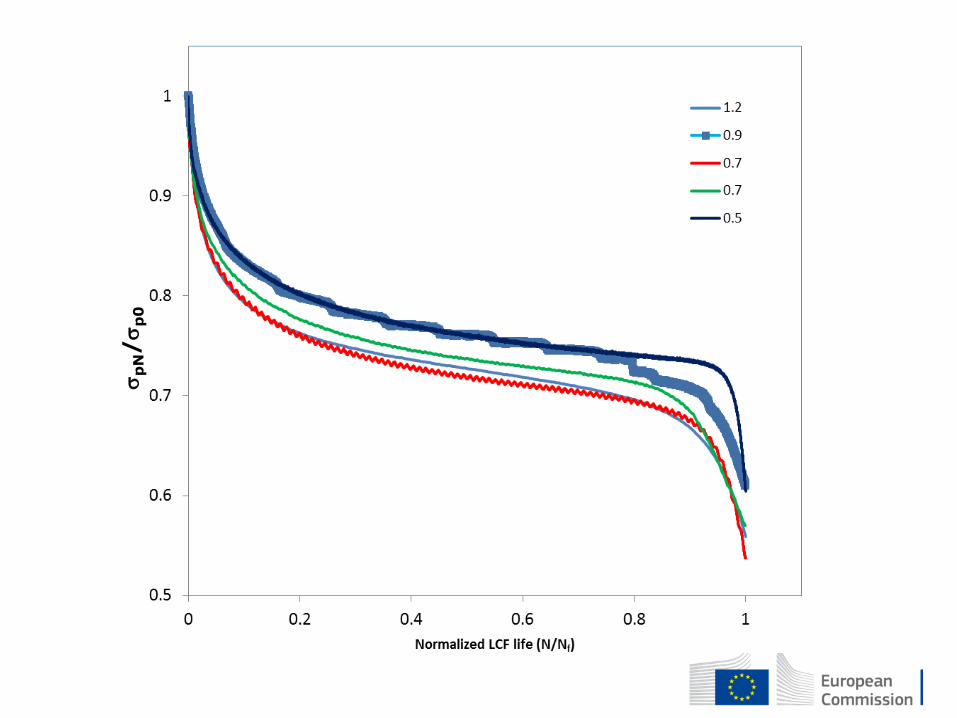
Initial (simple) softening model
• LCF softening curves as a function of normalized peak stress (pN/p0) and cycles to failure (Nf at 25% of drop in stress) are assessed:
• p0 is the tensile peak stress (virgin material) in the first cycle
• pN is the tensile peak stress at cycle N
The normalized cyclic peak stress curves fall "nearly" on top of each other …
First modelling assumption … they do …
p
N/
p0
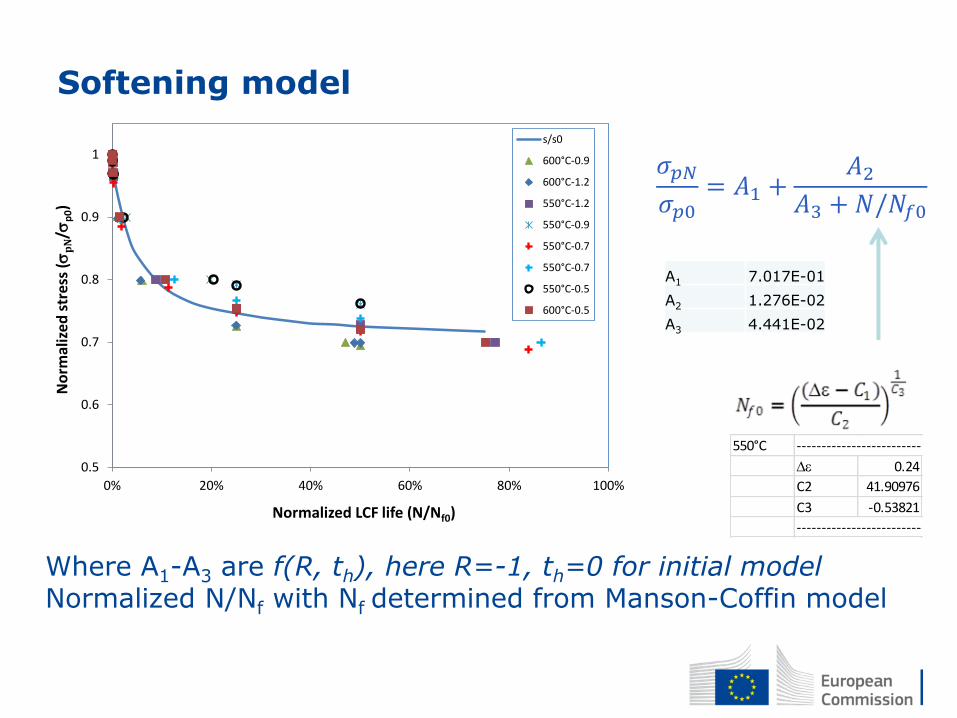
Softening model
A1 7.017E-01
A2 1.276E-02
A3 4.441E-02
Where A1-A3 are f(R, th), here R=-1, th=0 for initial model Normalized N/Nf with Nf determined from Manson-Coffin model
550°C ----------------------------------------
0.24
C2 41.90976
C3 -0.53821
----------------------------------------
𝜎𝑝𝑁
𝜎𝑝0= 𝐴1 +
𝐴2
𝐴3 + 𝑁/𝑁𝑓0
0.5
0.6
0.7
0.8
0.9
1
0% 20% 40% 60% 80% 100%
No
rmal
ize
d s
tres
s (
pN
/p
0)
Normalized LCF life (N/Nf0)
s/s0
600°C-0.9
600°C-1.2
550°C-1.2
550°C-0.9
550°C-0.7
550°C-0.7
550°C-0.5
600°C-0.5
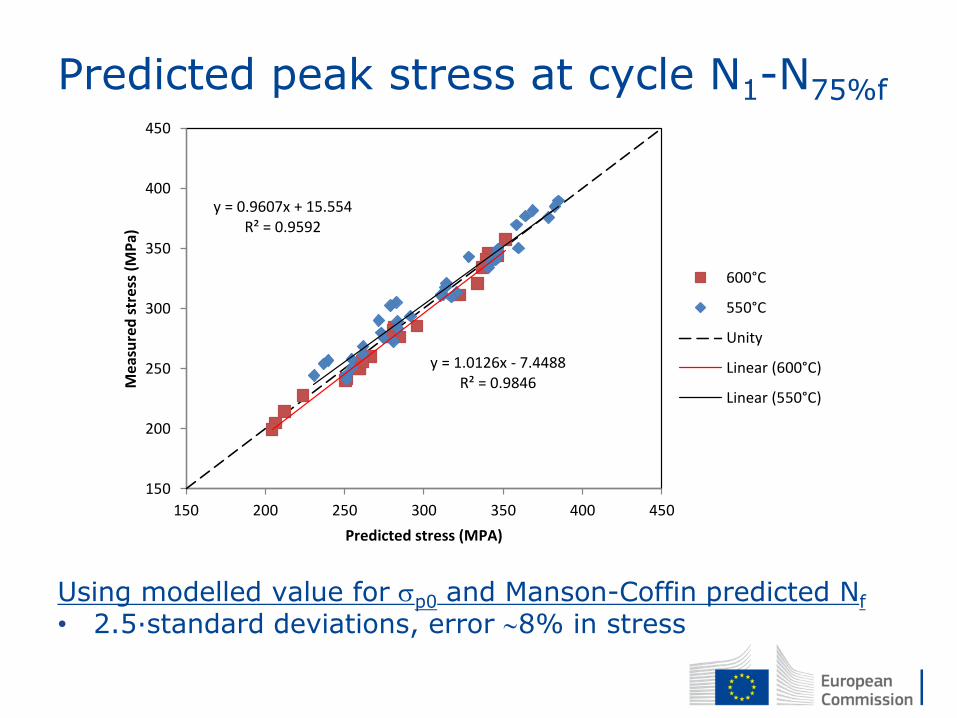
Predicted peak stress at cycle N1-N75%f
Using modelled value for p0 and Manson-Coffin predicted Nf
• 2.5·standard deviations, error 8% in stress
y = 1.0126x - 7.4488R² = 0.9846
y = 0.9607x + 15.554R² = 0.9592
150
200
250
300
350
400
450
150 200 250 300 350 400 450
Me
asu
red
str
ess
(M
Pa)
Predicted stress (MPA)
600°C
550°C
Unity
Linear (600°C)
Linear (550°C)
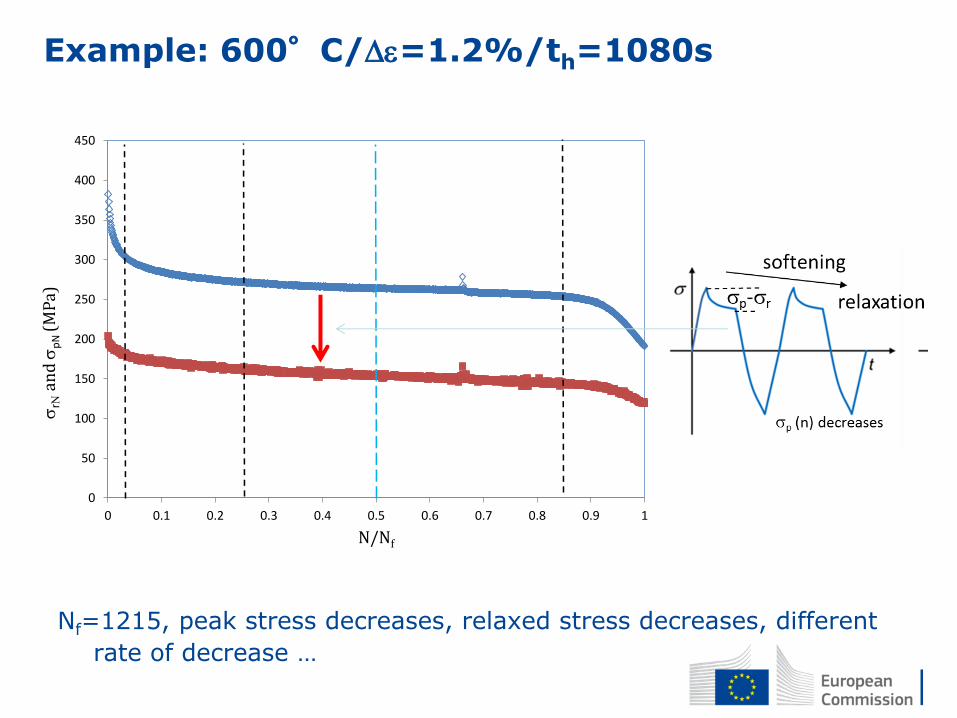
Example: 600°C/=1.2%/th=1080s
Nf=1215, peak stress decreases, relaxed stress decreases, different
rate of decrease …
0
50
100
150
200
250
300
350
400
450
0 0.1 0.2 0.3 0.4 0.5 0.6 0.7 0.8 0.9 1
rN
and
p
N (
MP
a)
N/Nf
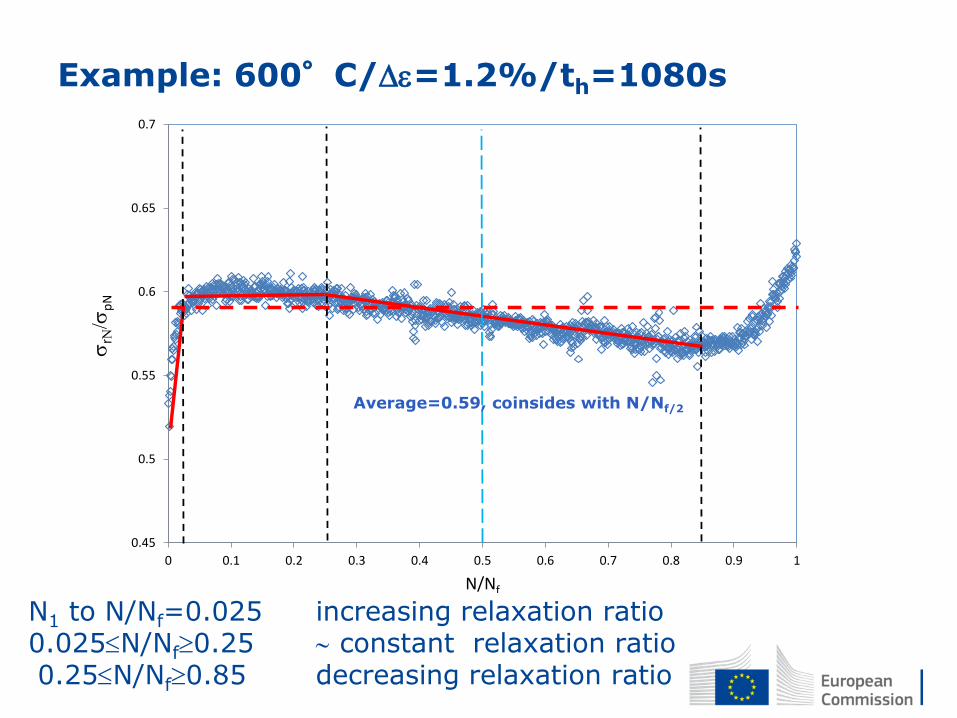
Example: 600°C/=1.2%/th=1080s
N1 to N/Nf=0.025 increasing relaxation ratio 0.025N/Nf0.25 constant relaxation ratio 0.25N/Nf0.85 decreasing relaxation ratio
0.45
0.5
0.55
0.6
0.65
0.7
0 0.1 0.2 0.3 0.4 0.5 0.6 0.7 0.8 0.9 1
rN/
pN
N/Nf
Average=0.59, coinsides with N/Nf/2
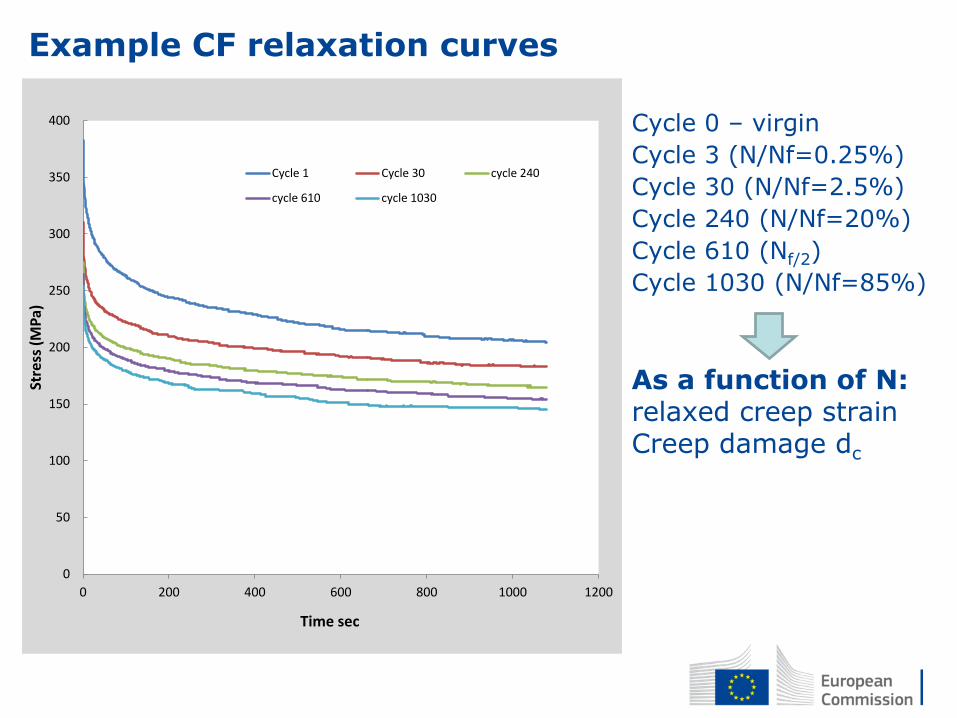
Example CF relaxation curves
Cycle 0 – virgin
Cycle 3 (N/Nf=0.25%)
Cycle 30 (N/Nf=2.5%)
Cycle 240 (N/Nf=20%)
Cycle 610 (Nf/2)
Cycle 1030 (N/Nf=85%)
As a function of N: relaxed creep strain Creep damage dc
0
50
100
150
200
250
300
350
400
0 200 400 600 800 1000 1200
Stre
ss (
MP
a)
Time sec
Cycle 1 Cycle 30 cycle 240
cycle 610 cycle 1030
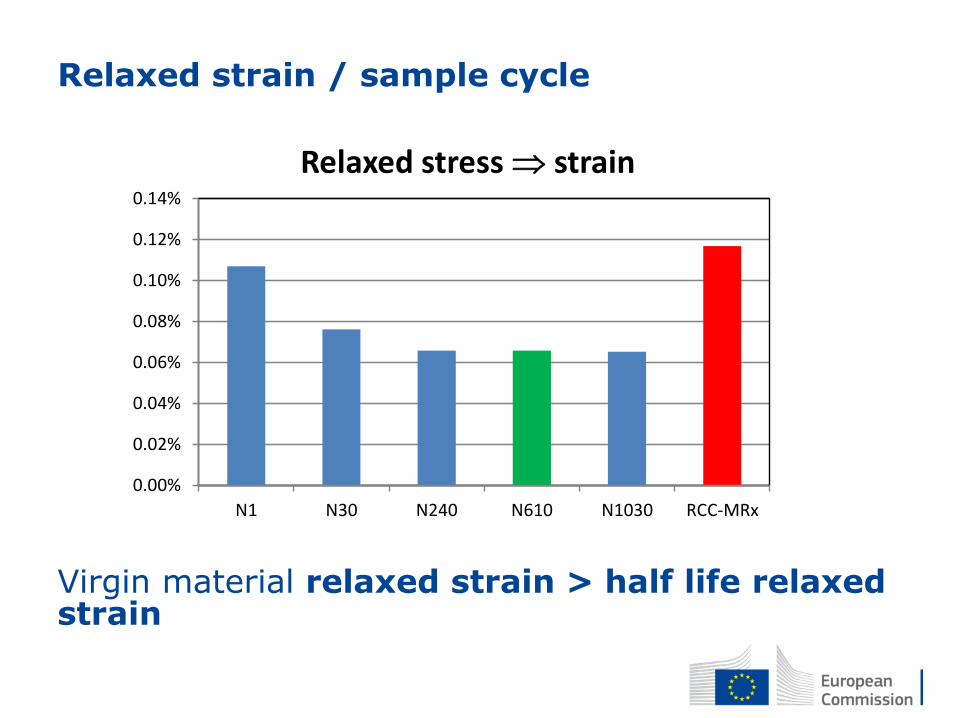
Relaxed strain / sample cycle
Virgin material relaxed strain > half life relaxed strain
0.00%
0.02%
0.04%
0.06%
0.08%
0.10%
0.12%
0.14%
N1 N30 N240 N610 N1030 RCC-MRx
Relaxed stress strain
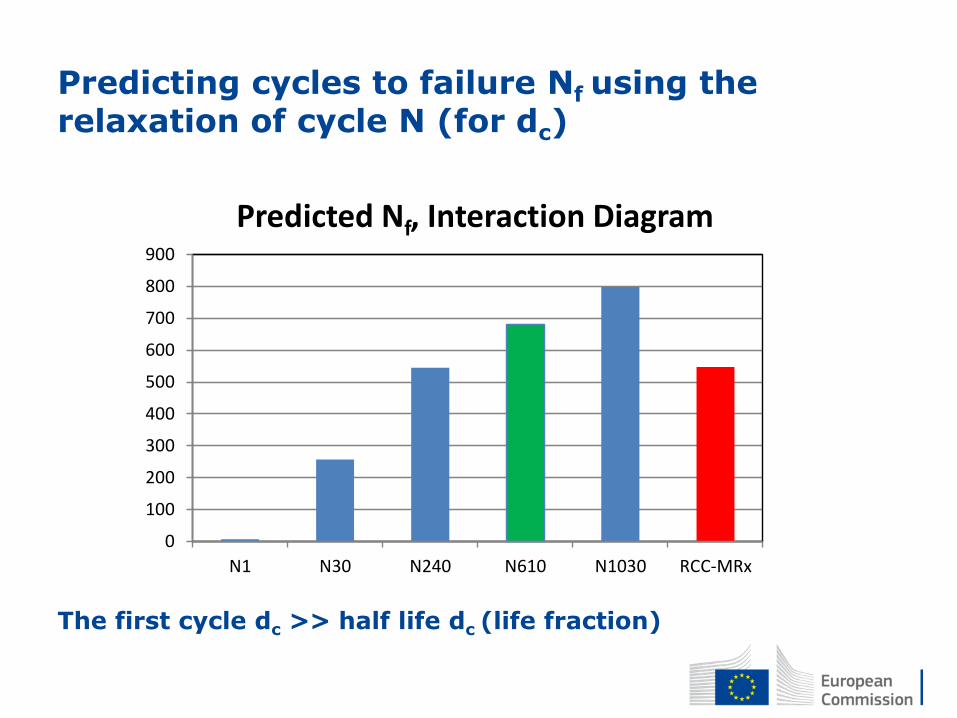
Predicting cycles to failure Nf using the relaxation of cycle N (for dc)
The first cycle dc >> half life dc (life fraction)
0
100
200
300
400
500
600
700
800
900
N1 N30 N240 N610 N1030 RCC-MRx
Predicted Nf, Interaction Diagram
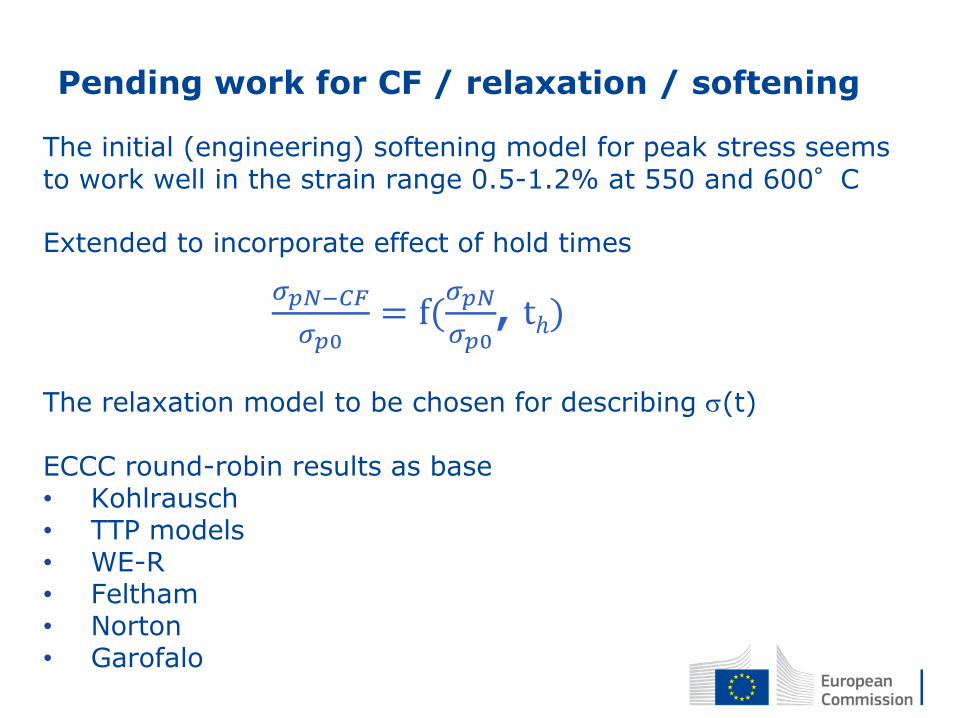
Pending work for CF / relaxation / softening
The initial (engineering) softening model for peak stress seems to work well in the strain range 0.5-1.2% at 550 and 600°C Extended to incorporate effect of hold times The relaxation model to be chosen for describing (t) ECCC round-robin results as base • Kohlrausch • TTP models • WE-R • Feltham • Norton • Garofalo
𝜎𝑝𝑁−𝐶𝐹
𝜎𝑝0= f(
𝜎𝑝𝑁
𝜎𝑝0, tℎ)
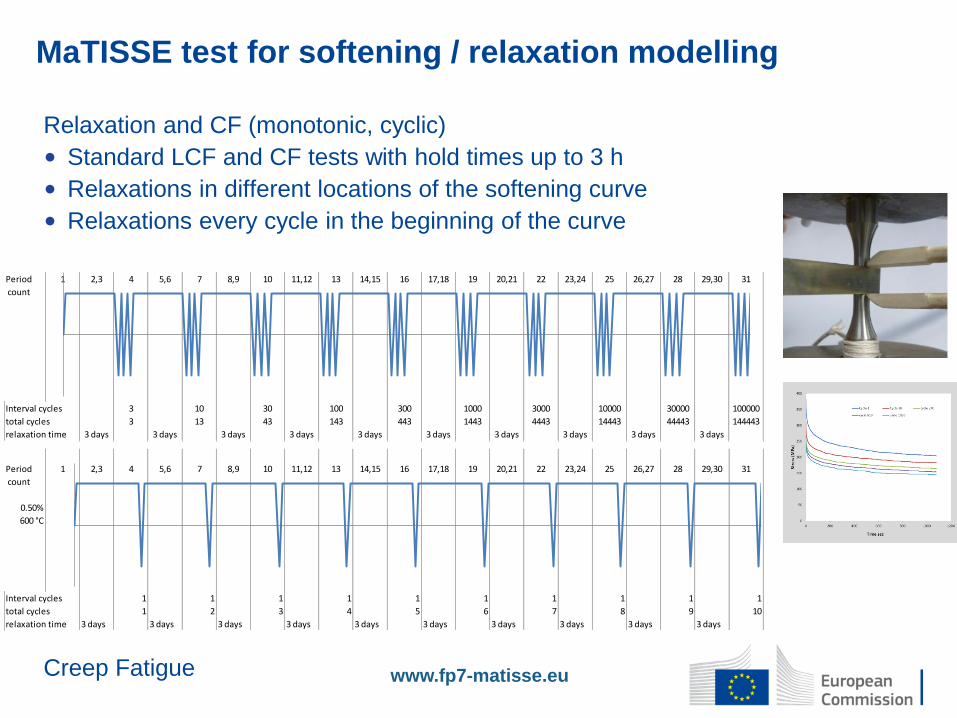
Relaxation and CF (monotonic, cyclic)
• Standard LCF and CF tests with hold times up to 3 h
• Relaxations in different locations of the softening curve
• Relaxations every cycle in the beginning of the curve
Creep Fatigue
MaTISSE test for softening / relaxation modelling
www.fp7-matisse.eu
Period 1 2,3 4 5,6 7 8,9 10 11,12 13 14,15 16 17,18 19 20,21 22 23,24 25 26,27 28 29,30 31
count
0.50%
600 °C
Interval cycles 1 1 1 1 1 1 1 1 1 1
total cycles 1 2 3 4 5 6 7 8 9 10
relaxation time 3 days 3 days 3 days 3 days 3 days 3 days 3 days 3 days 3 days 3 days
Period 1 2,3 4 5,6 7 8,9 10 11,12 13 14,15 16 17,18 19 20,21 22 23,24 25 26,27 28 29,30 31
count
Interval cycles 3 10 30 100 300 1000 3000 10000 30000 100000
total cycles 3 13 43 143 443 1443 4443 14443 44443 144443
relaxation time 3 days 3 days 3 days 3 days 3 days 3 days 3 days 3 days 3 days 3 days
Creep and NEC
• New TNEC curve suggested for RCC-MRx (proposed for P91)
• New methodology for EN-13445:9 for a number of other steels
Creep-Fatigue
• New (/old ) models for CF life determination (standards)
• Engineering model for softening and relaxation (interaction diagram)
• Verification in MATISSE …
Conclusions