Embed Size (px)
Citation preview
Steve LennonDivisional ExecutiveEskom
2011 Summer SeminarAugust 1, 2011
Advances in Dry Cooling Deployed at South African Power Stations
3© 2011 Electric Power Research Institute, Inc. All rights reserved.
Eskom’s Move to Dry-Cooling
• Eskom historically utilized wet-cooled power stations
• In 1966 it was decided to extend Grootvlei Power Station –3 factors had to be considered:
– Growing demand for electrical power
– Opportunity to exploit coal fields
– Obligation to optimize the utilization of water
• Eskom strategy:
– Add generation capacity without increase in water consumption
– Gain experience in dry-cooling
4© 2011 Electric Power Research Institute, Inc. All rights reserved.
Eskom’s Pioneer: Grootvlei PS
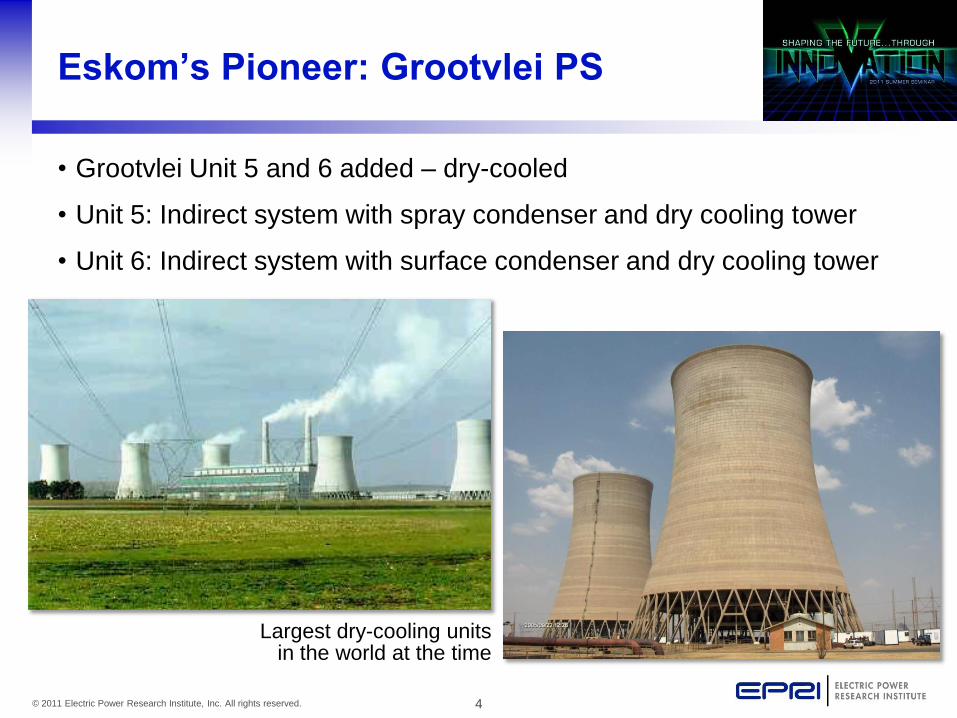
• Grootvlei Unit 5 and 6 added – dry-cooled
• Unit 5: Indirect system with spray condenser and dry cooling tower
• Unit 6: Indirect system with surface condenser and dry cooling tower
Largest dry-cooling units in the world at the time
5© 2011 Electric Power Research Institute, Inc. All rights reserved.
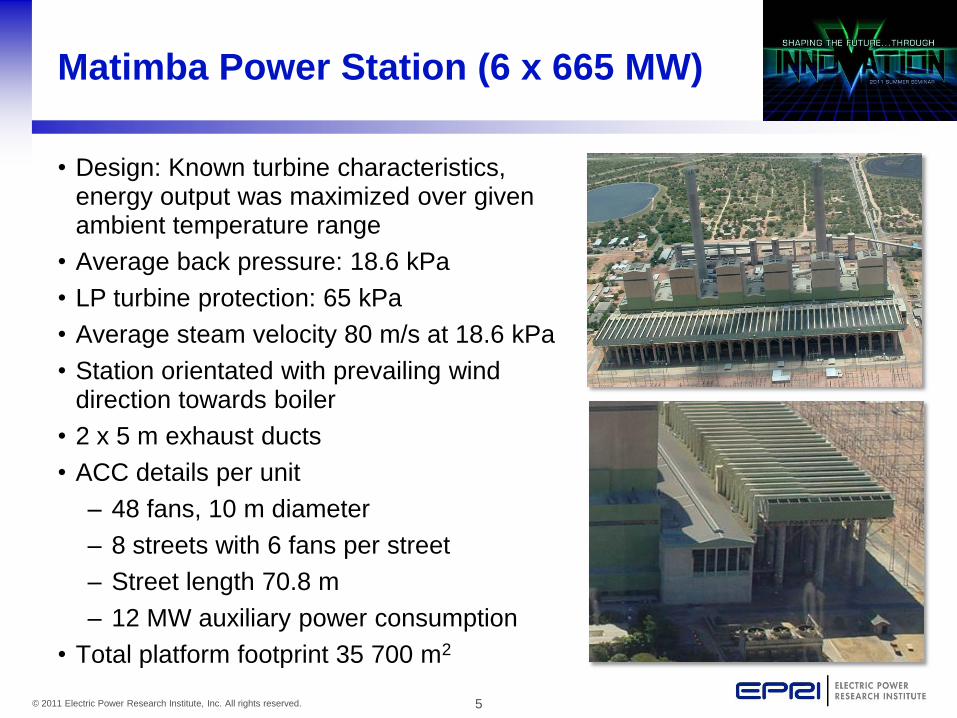
Matimba Power Station (6 x 665 MW)
• Design: Known turbine characteristics, energy output was maximized over given ambient temperature range
• Average back pressure: 18.6 kPa
• LP turbine protection: 65 kPa
• Average steam velocity 80 m/s at 18.6 kPa
• Station orientated with prevailing wind direction towards boiler
• 2 x 5 m exhaust ducts
• ACC details per unit
– 48 fans, 10 m diameter
– 8 streets with 6 fans per street
– Street length 70.8 m
– 12 MW auxiliary power consumption
• Total platform footprint 35 700 m2
6© 2011 Electric Power Research Institute, Inc. All rights reserved.
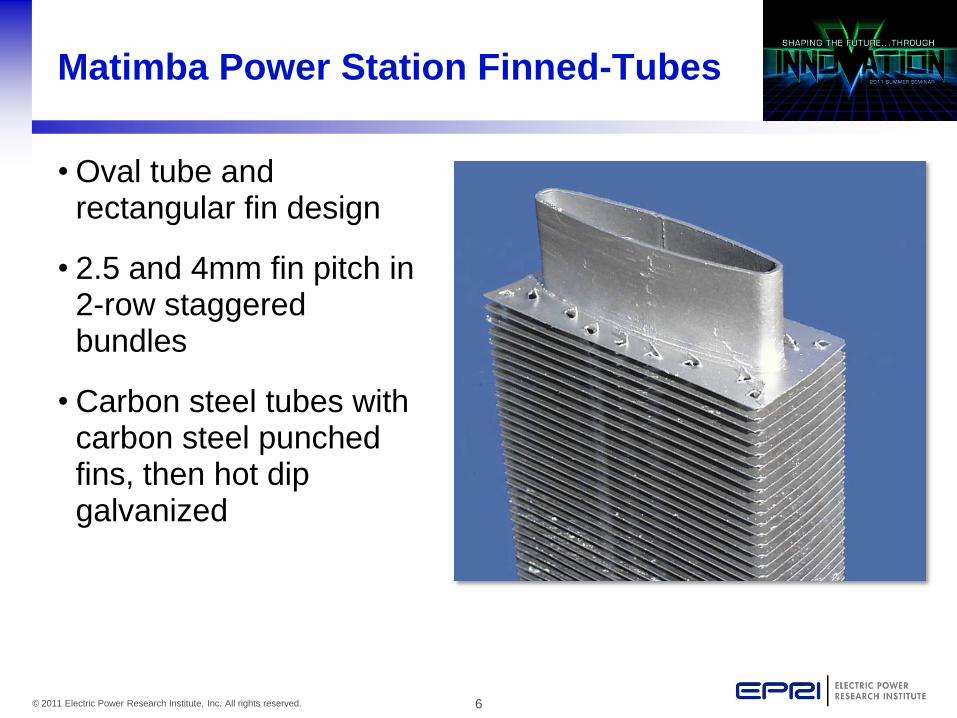
Matimba Power Station Finned-Tubes
• Oval tube and rectangular fin design
• 2.5 and 4mm fin pitch in 2-row staggered bundles
• Carbon steel tubes with carbon steel punched fins, then hot dip galvanized
7© 2011 Electric Power Research Institute, Inc. All rights reserved.
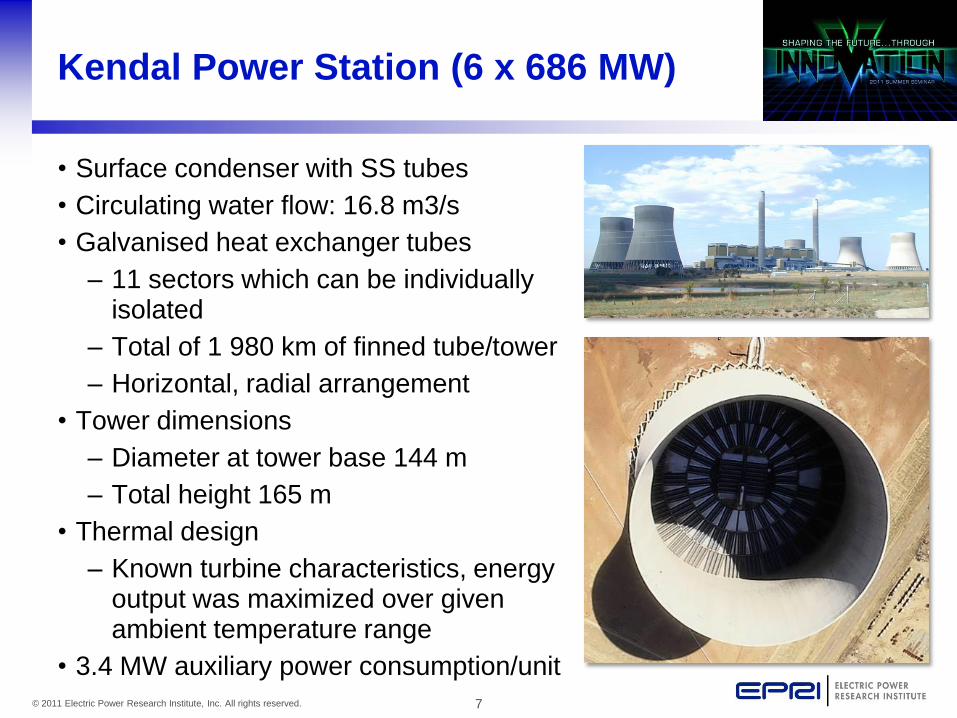
Kendal Power Station (6 x 686 MW)
• Surface condenser with SS tubes
• Circulating water flow: 16.8 m3/s
• Galvanised heat exchanger tubes
– 11 sectors which can be individually isolated
– Total of 1 980 km of finned tube/tower
– Horizontal, radial arrangement
• Tower dimensions
– Diameter at tower base 144 m
– Total height 165 m
• Thermal design
– Known turbine characteristics, energy output was maximized over given ambient temperature range
• 3.4 MW auxiliary power consumption/unit
8© 2011 Electric Power Research Institute, Inc. All rights reserved.
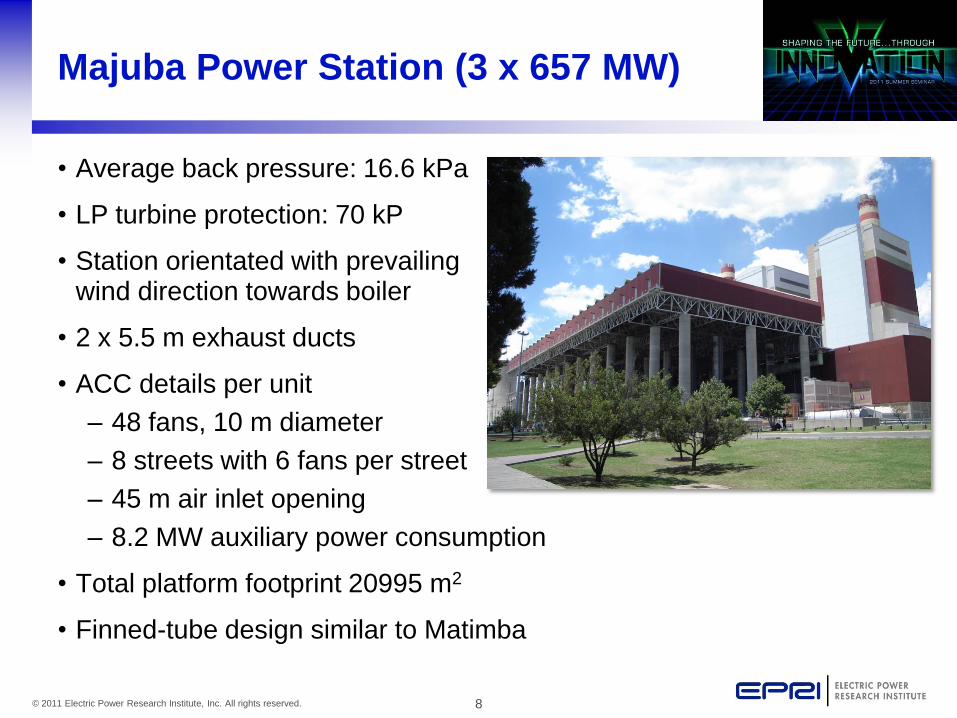
Majuba Power Station (3 x 657 MW)
• Average back pressure: 16.6 kPa
• LP turbine protection: 70 kP
• Station orientated with prevailing wind direction towards boiler
• 2 x 5.5 m exhaust ducts
• ACC details per unit
– 48 fans, 10 m diameter
– 8 streets with 6 fans per street
– 45 m air inlet opening
– 8.2 MW auxiliary power consumption
• Total platform footprint 20995 m2
• Finned-tube design similar to Matimba
9© 2011 Electric Power Research Institute, Inc. All rights reserved.
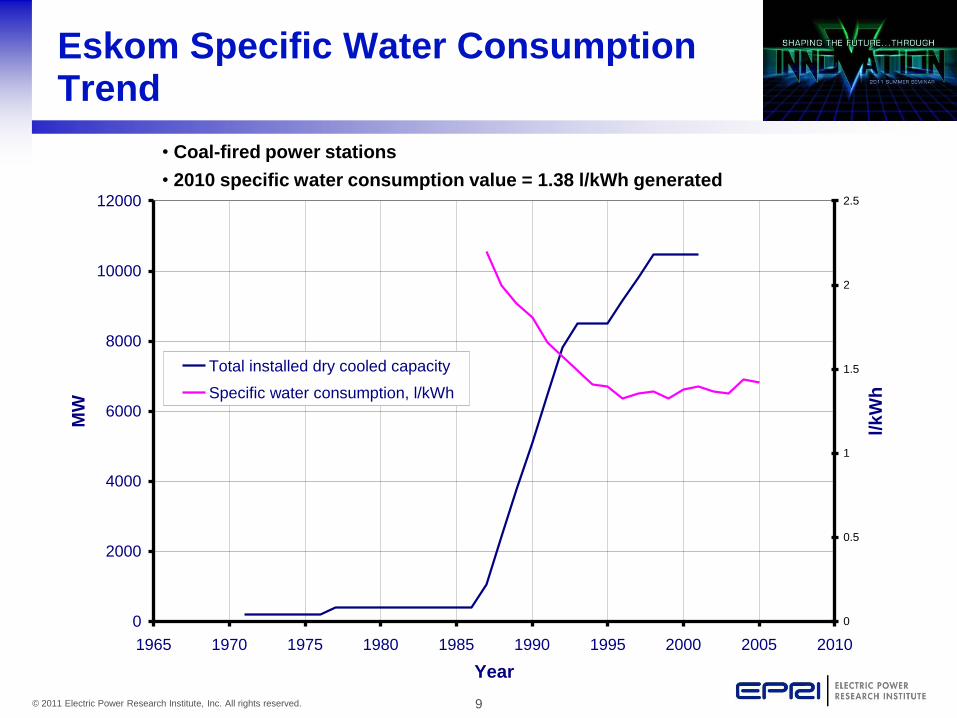
Eskom Specific Water Consumption Trend
0
2000
4000
6000
8000
10000
12000
1965 1970 1975 1980 1985 1990 1995 2000 2005 2010
Year
MW
0
0.5
1
1.5
2
2.5
l/k
Wh
Total installed dry cooled capacity
Specific water consumption, l/kWh
• Coal-fired power stations
• 2010 specific water consumption value = 1.38 l/kWh generated
10© 2011 Electric Power Research Institute, Inc. All rights reserved.
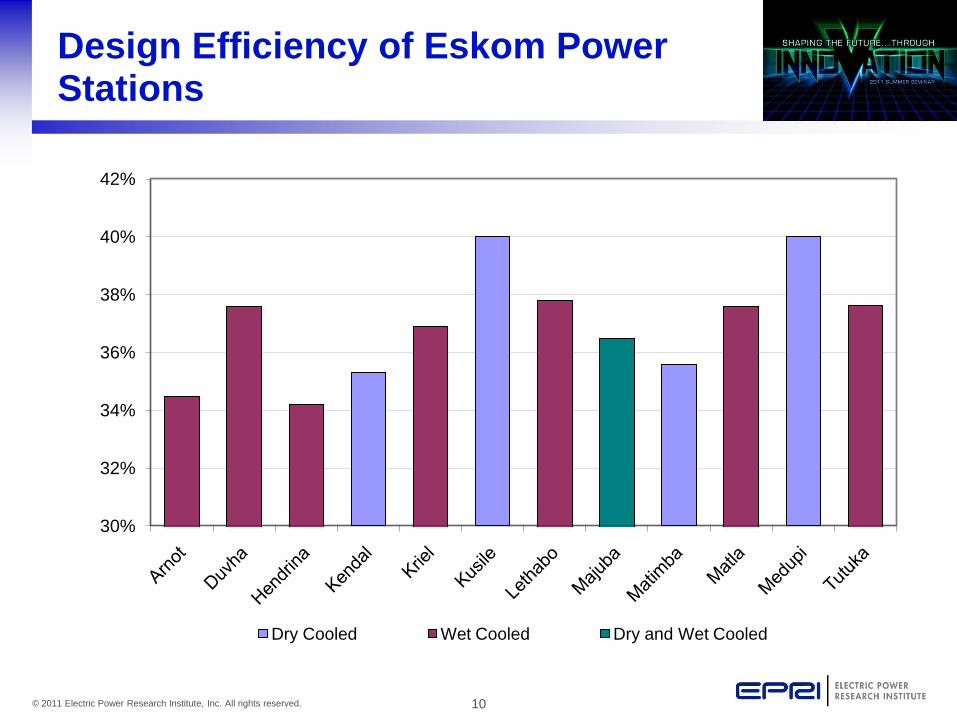
Design Efficiency of Eskom Power Stations
30%
32%
34%
36%
38%
40%
42%
Dry Cooled Wet Cooled Dry and Wet Cooled
11© 2011 Electric Power Research Institute, Inc. All rights reserved.
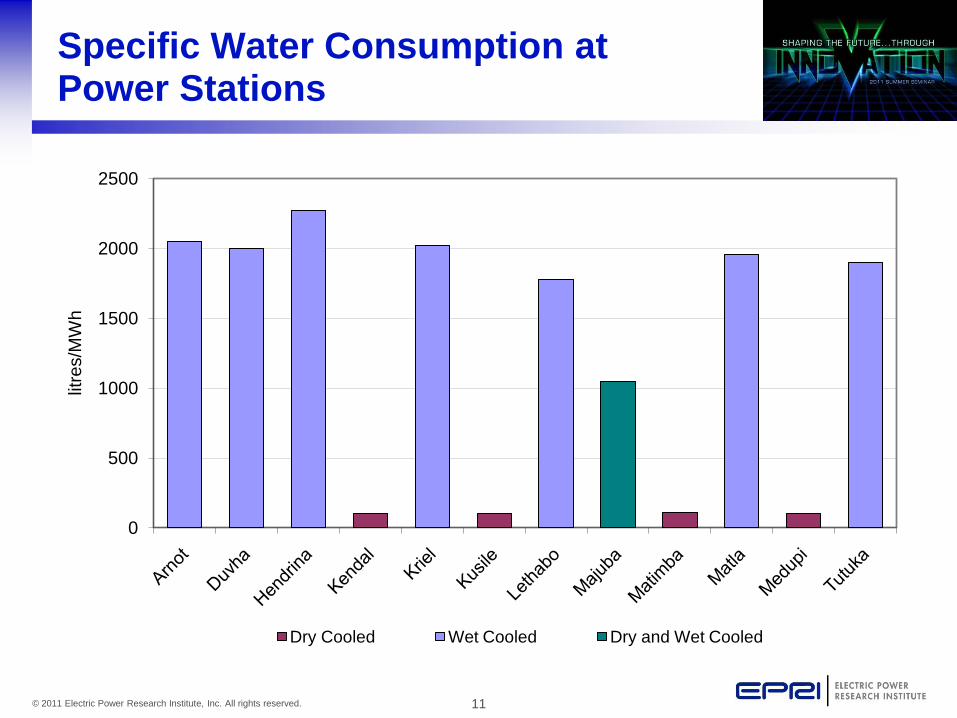
Specific Water Consumption at Power Stations
0
500
1000
1500
2000
2500
litre
s/M
Wh
Dry Cooled Wet Cooled Dry and Wet Cooled
12© 2011 Electric Power Research Institute, Inc. All rights reserved.
Cost of Dry vs. Wet Cooling
• Cooling system choice to be based on life cycle costing including capital, O&M, plant output and cost of water
• Relative costs for wet and dry indirect cooling systems in 1996:
– Capital cost of dry system was approximately 170% of wet system cost (surface condenser)
– More than 1% reduction in average unit output for dry system
• Footprint of dry natural draft cooling towers is typically 300% of that of a wet cooling tower of comparable size
• Challenge for retrofitting dry cooling systems is capital costs
13© 2011 Electric Power Research Institute, Inc. All rights reserved.
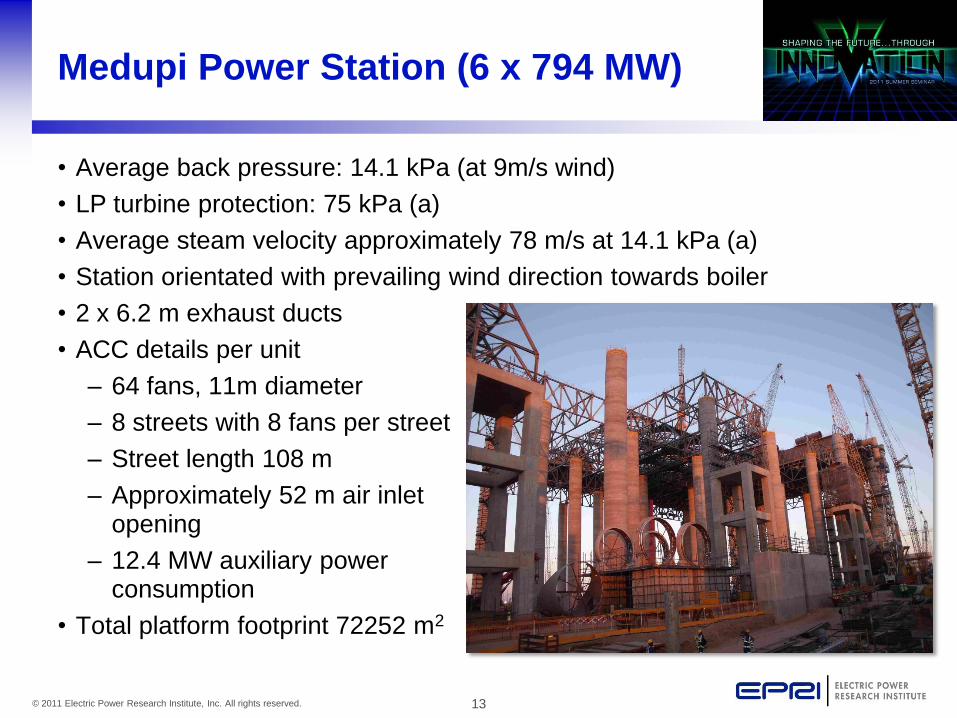
Medupi Power Station (6 x 794 MW)
• Average back pressure: 14.1 kPa (at 9m/s wind)
• LP turbine protection: 75 kPa (a)
• Average steam velocity approximately 78 m/s at 14.1 kPa (a)
• Station orientated with prevailing wind direction towards boiler
• 2 x 6.2 m exhaust ducts
• ACC details per unit
– 64 fans, 11m diameter
– 8 streets with 8 fans per street
– Street length 108 m
– Approximately 52 m air inlet opening
– 12.4 MW auxiliary power consumption
• Total platform footprint 72252 m2
14© 2011 Electric Power Research Institute, Inc. All rights reserved.
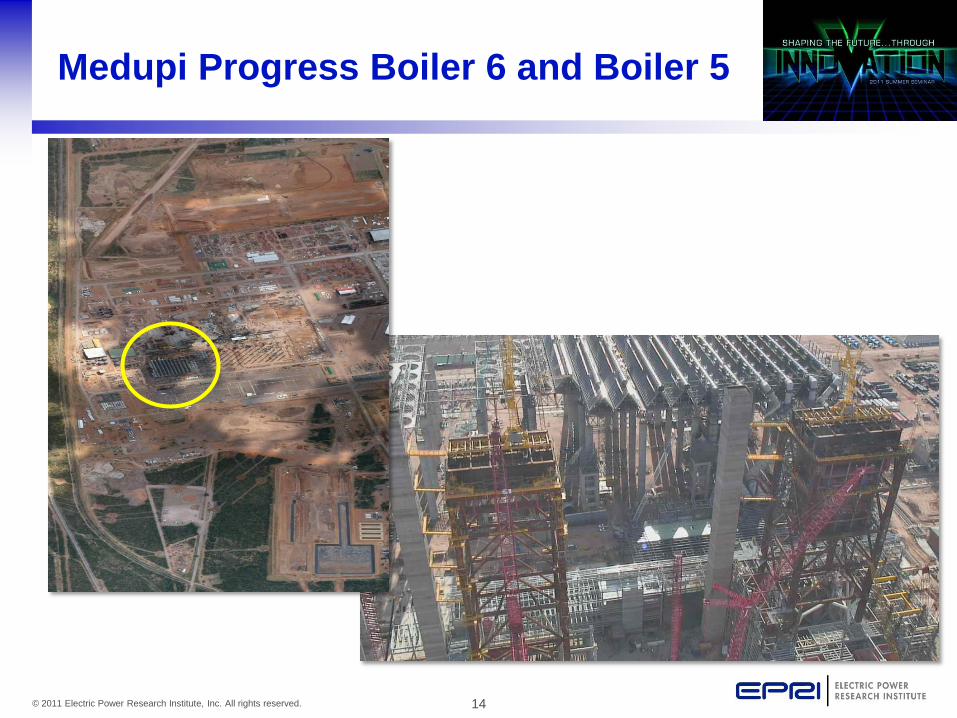
Medupi Progress Boiler 6 and Boiler 5
15© 2011 Electric Power Research Institute, Inc. All rights reserved.
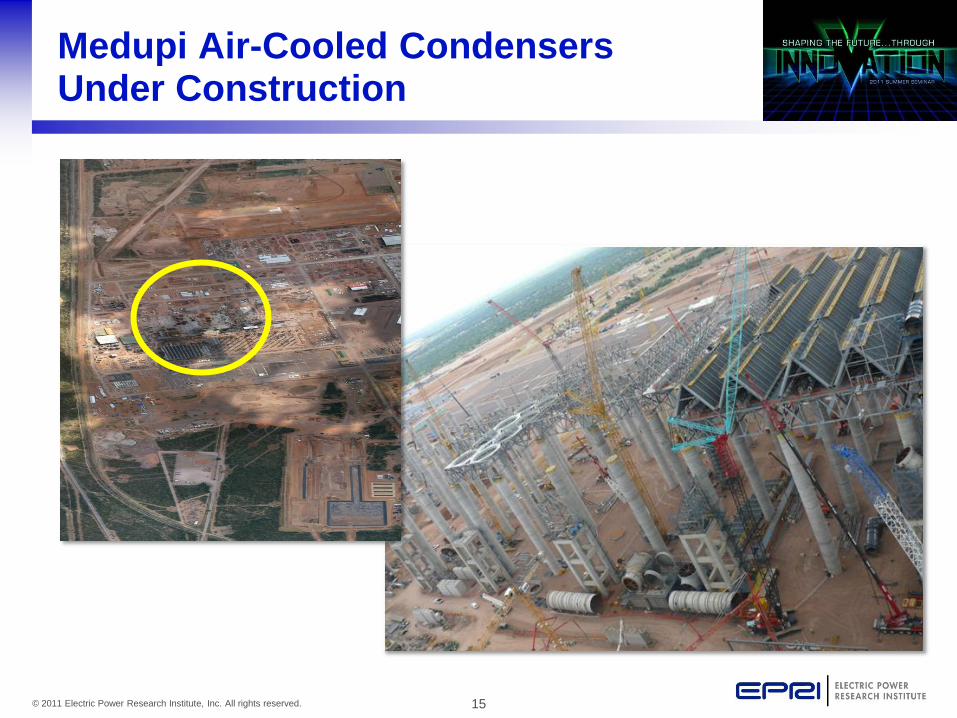
Medupi Air-Cooled Condensers Under Construction
16© 2011 Electric Power Research Institute, Inc. All rights reserved.
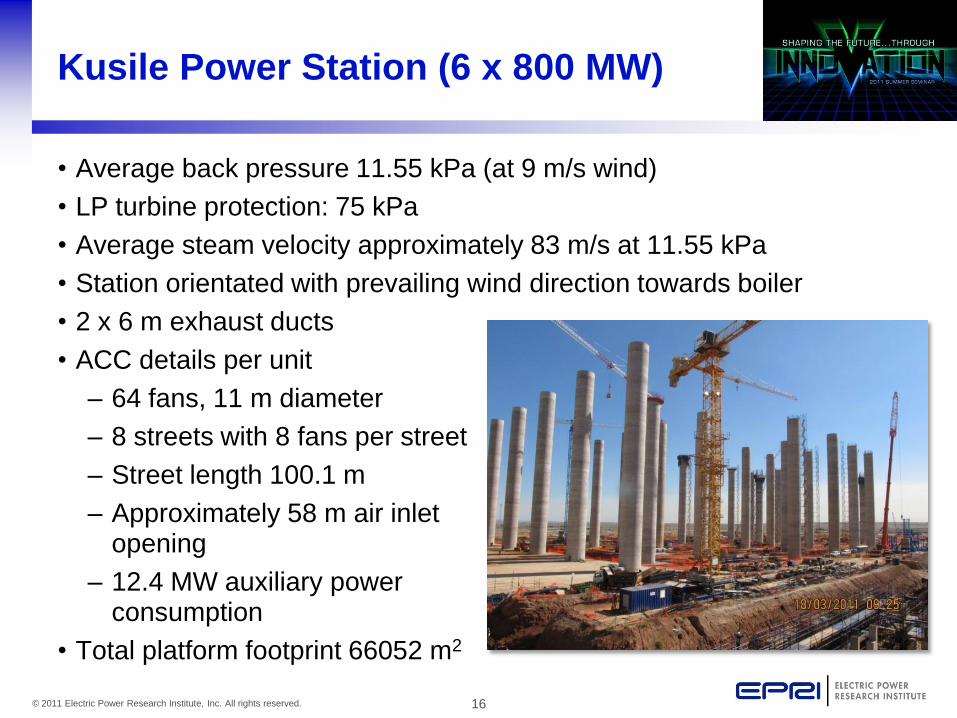
Kusile Power Station (6 x 800 MW)
• Average back pressure 11.55 kPa (at 9 m/s wind)
• LP turbine protection: 75 kPa
• Average steam velocity approximately 83 m/s at 11.55 kPa
• Station orientated with prevailing wind direction towards boiler
• 2 x 6 m exhaust ducts
• ACC details per unit
– 64 fans, 11 m diameter
– 8 streets with 8 fans per street
– Street length 100.1 m
– Approximately 58 m air inlet opening
– 12.4 MW auxiliary power consumption
• Total platform footprint 66052 m2
17© 2011 Electric Power Research Institute, Inc. All rights reserved.
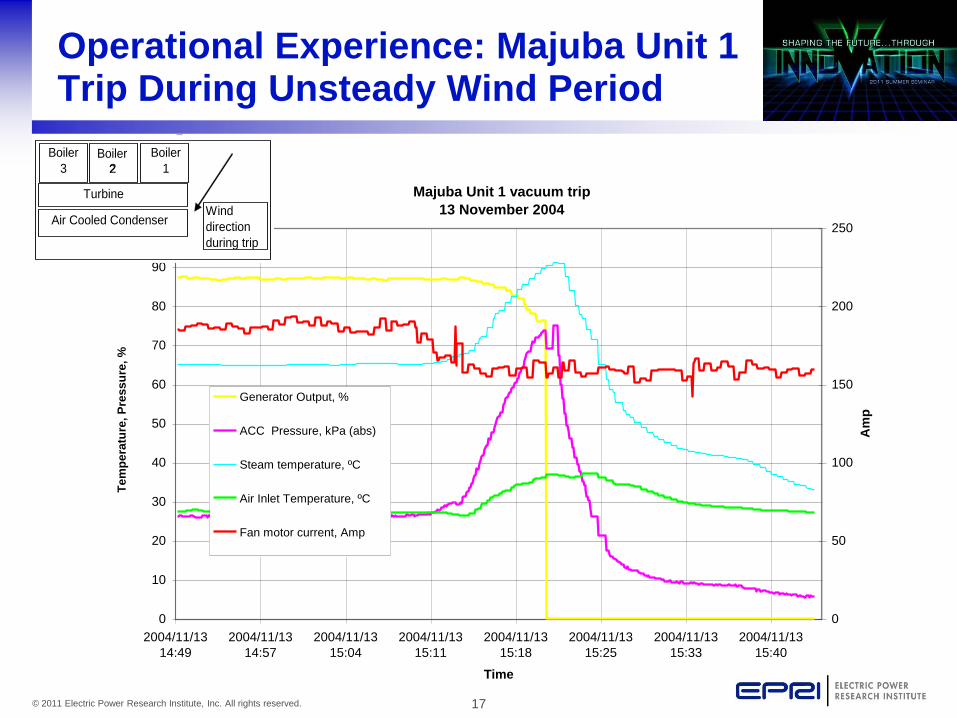
Operational Experience: Majuba Unit 1 Trip During Unsteady Wind Period
Majuba Unit 1 vacuum trip
13 November 2004
0
10
20
30
40
50
60
70
80
90
100
2004/11/13
14:49
2004/11/13
14:57
2004/11/13
15:04
2004/11/13
15:11
2004/11/13
15:18
2004/11/13
15:25
2004/11/13
15:33
2004/11/13
15:40
Time
Te
mp
era
ture
, P
ress
ure
, %
0
50
100
150
200
250
Am
p
Generator Output, %
ACC Pressure, kPa (abs)
Steam temperature, ºC
Air Inlet Temperature, ºC
Fan motor current, Amp
Air Cooled Condenser
Turbine
Boiler
2
Boiler
3
Boiler
1
Wind
direction
during trip
2
18© 2011 Electric Power Research Institute, Inc. All rights reserved.
Future Role of Dry Cooling
• Key technology in South Africa’s climate change impact adaptation strategy
• All future coal plants will be dry cooled
• Application to other technologies being evaluated –especially solar thermal
18
19© 2011 Electric Power Research Institute, Inc. All rights reserved.
Together…Shaping the Future of Electricity
Thank You