Embed Size (px)
Citation preview
1
Advances in Civil Engineering Materials土木工程材料进展
SHI, Caijun (史才军) Ph.D., P. Eng. FACI
ProfessorCivil Engineering College, Hunan Univ.
(湖南大学土木学院 教授)
个人简介 - 学术任职
美国土木工程学会期刊《土木工程材料》副主编
Elsevier著名学术期刊《水泥和混凝土研究》和《水泥和混凝土复合材料》编委
中国硅酸盐学会《硅酸盐学报》编委
美国混凝土学会(ACI)中的8个专业委员会的会员
美国材料与测试学会(ASTM) 中的4个专业委员会的会员
加拿大标准协会(CSA)中的2个专业委员会的会员
国际材料与结构研究实验联合会(RILEM)的高级会员及2个专业委员会的会员
中国硅酸盐学会水泥专业委员会、化学激发胶凝材料分会副主任委员
担任国际上30多个土木工程材料与环境领域的著名学术期刊的审稿人。
中南大学讲座教授、博士生导师
纽约州立大学水牛城分校、南京工业大学、武汉理工大学兼职教授
重庆大学、华南理工大学客座教授
Main Achievements/主要学术成果
发表论文140余篇,论文他引1400多次;
出版英文著作5本,合编国际会议论文集3本;
组织和主持国际学术会议3次和专题研讨会3次;
20余次应邀担任专家委员会委员或分会主席;
多次应邀做大会主题报告和大会报告;
应邀在国际上近40所大学和大公司做学术报告和专题讲座;
应邀当过国际上近30多个著名学术期刊的审稿人;
2
Books/著作
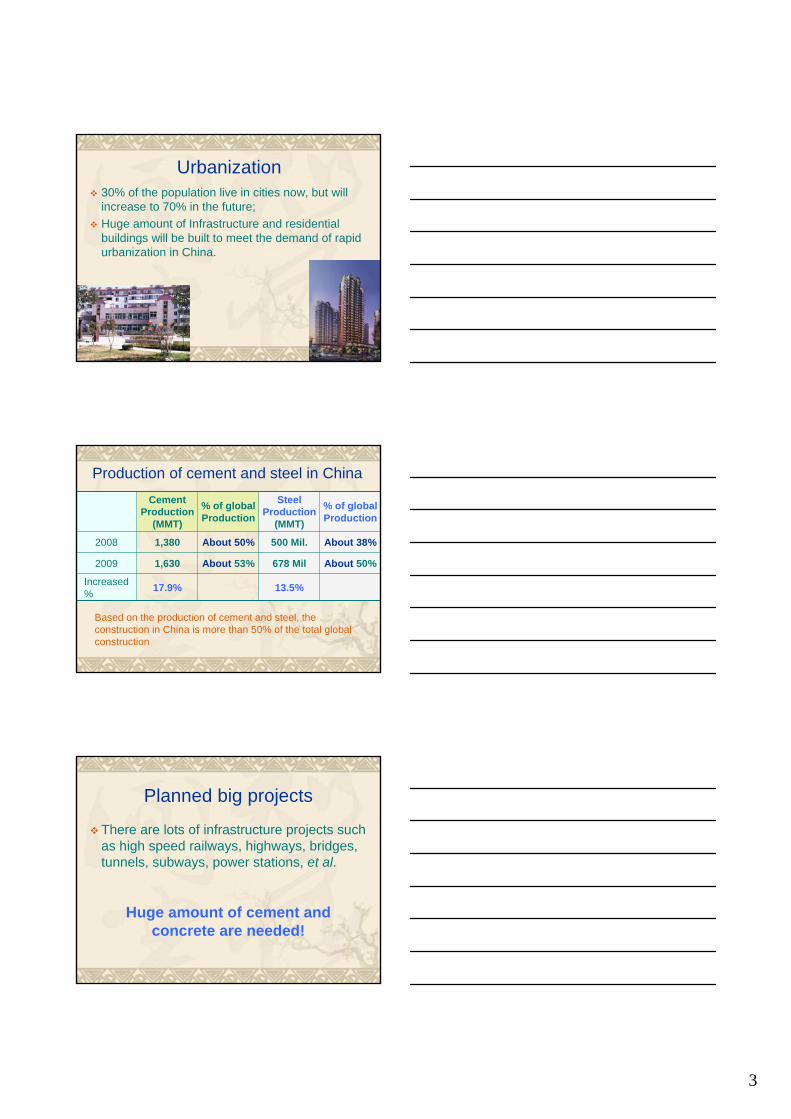
ContentsConstruction in ChinaCement Industry in ChinaConcrete Industry in ChinaHigh Performance ConcreteSelf-consolidating ConcreteLightweight ConcreteDurability of Concrete Materials and StructureThermal Insulation SystemSmart Self-repairing Barrier
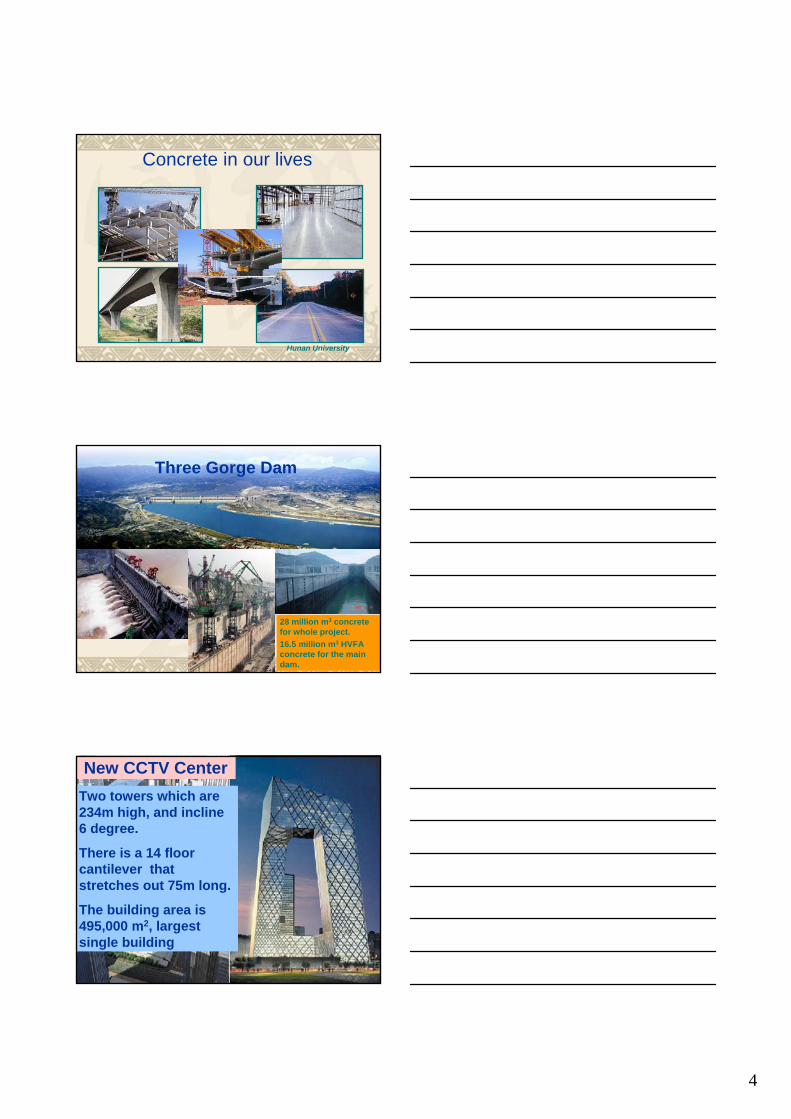
China – A Large Construction Site
海洋工程 大型桥梁高速公路
水电工程 高速铁路
核电工程西气东输
建筑工程
基本建设规模空前50% of bridges
22000 km in 5 years24 three gorges capacity by 2049
65000 km in 5 years
3
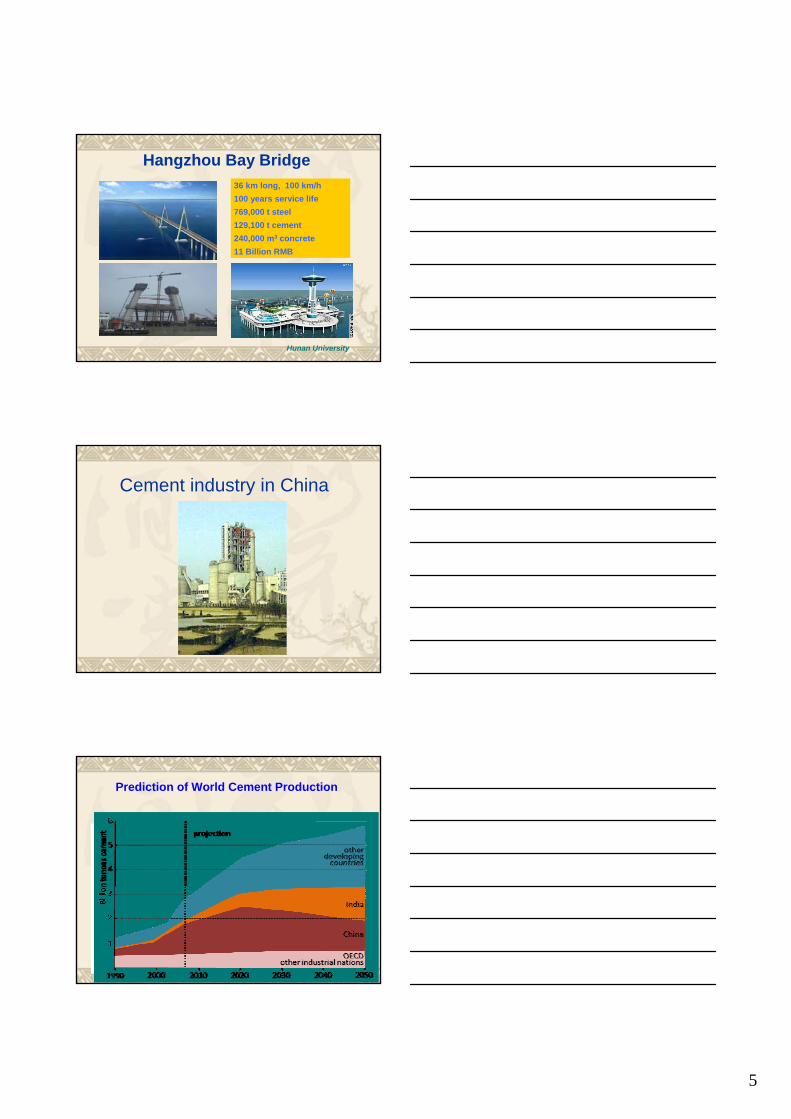
Urbanization30% of the population live in cities now, but will increase to 70% in the future;Huge amount of Infrastructure and residential buildings will be built to meet the demand of rapid urbanization in China.
Production of cement and steel in China
13.5%17.9%Increased %
About 50%678 MilAbout 53%1,6302009
About 38%500 Mil.About 50%1,3802008
% of global Production
Steel Production
(MMT)
% of global Production
Cement Production
(MMT)
Based on the production of cement and steel, the construction in China is more than 50% of the total global construction
Planned big projects
There are lots of infrastructure projects such as high speed railways, highways, bridges, tunnels, subways, power stations, et al.
Huge amount of cement and concrete are needed!
4
Hunan University
Concrete in our lives
Hunan University
Three Gorge Dam
28 million m3 concrete for whole project.16.5 million m3 HVFA concrete for the main dam.
Two towers which are 234m high, and incline 6 degree.
There is a 14 floor cantilever that stretches out 75m long.
The building area is 495,000 m2, largest single building
New CCTV Center
5
Hunan University
Hangzhou Bay Bridge36 km long, 100 km/h100 years service life769,000 t steel129,100 t cement240,000 m3 concrete 11 Billion RMB
Cement industry in China
Prediction of World Cement Production
15
0
500
1000
1500
2000
2500
3000
3500
Cem
ent P
rodu
ctio
n (M
MT)
2000
2001
2002
2003
2004
2005
2006
2007
2008
2009
2010
Year
China
World
6
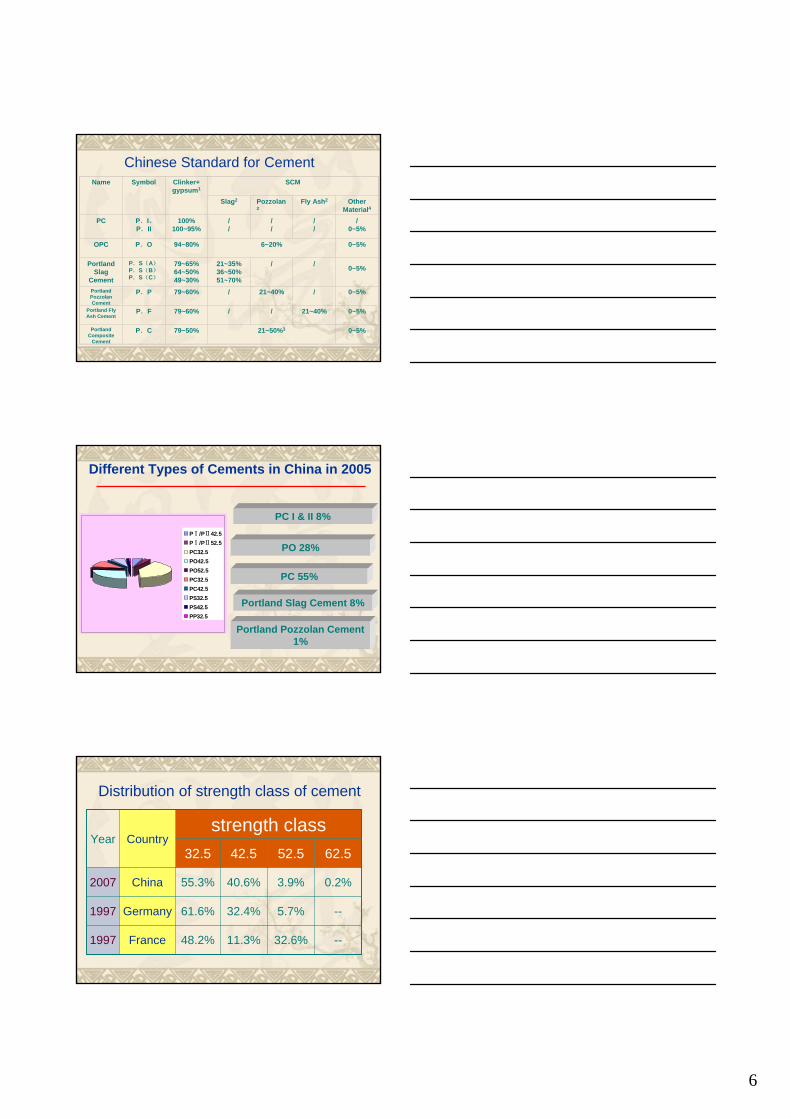
Name Symbol Clinker+gypsum1
SCM
Slag2 Pozzolan2
Fly Ash2 Other Material4
PC P.I、P.II
100%100~95%
//
//
//
/0~5%
OPC P.O 94~80% 6~20% 0~5%
Portland Slag
Cement
P.S(A)P.S(B)P.S(C)
79~65%64~50%49~30%
21~35%36~50%51~70%
/ / 0~5%
Portland PozzolanCement
P.P 79~60% / 21~40% / 0~5%
Portland Fly Ash Cement
P.F 79~60% / / 21~40% 0~5%
Portland Composite
Cement
P.C 79~50% 21~50%3 0~5%
Chinese Standard for Cement
PⅠ/PⅡ42.5PⅠ/PⅡ52.5PC32.5PO42.5PO52.5PC32.5PC42.5PS32.5PS42.5PP32.5
PC I & II 8%
PO 28%
PC 55%
Portland Slag Cement 8%
Portland Pozzolan Cement 1%
Different Types of Cements in China in 2005
Distribution of strength class of cement
strength class
--32.6%11.3%48.2%France1997
--5.7%32.4%61.6%Germany1997
0.2%3.9%40.6%55.3%China2007
62.552.542.532.5CountryYear
7
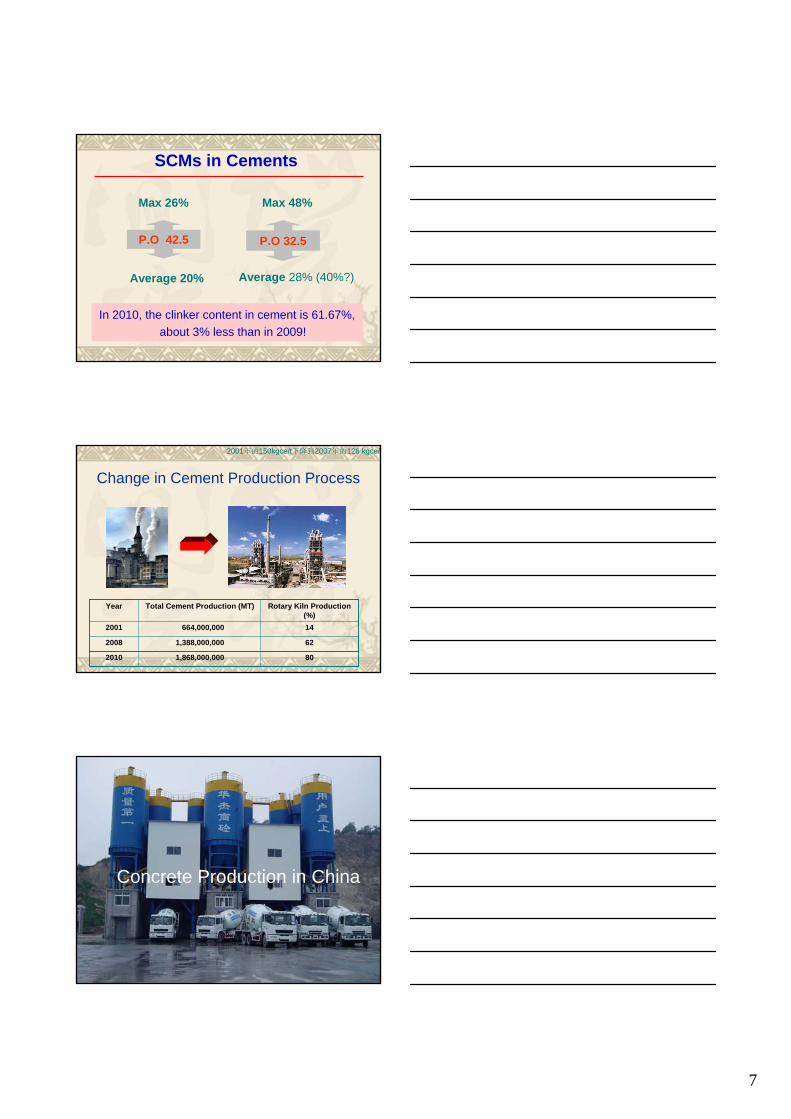
SCMs in Cements
P.O 42.5
Average 20%
P.O 32.5
Max 48%
Average 28% (40%?)
Max 26%
In 2010, the clinker content in cement is 61.67%, about 3% less than in 2009!
Change in Cement Production Process
2001年的150kgce/t下降到2007年的126 kgce/t
621,388,000,0002008
801,868,000,0002010
14664,000,0002001
Rotary Kiln Production (%)
Total Cement Production (MT)Year
Concrete Production in China
8
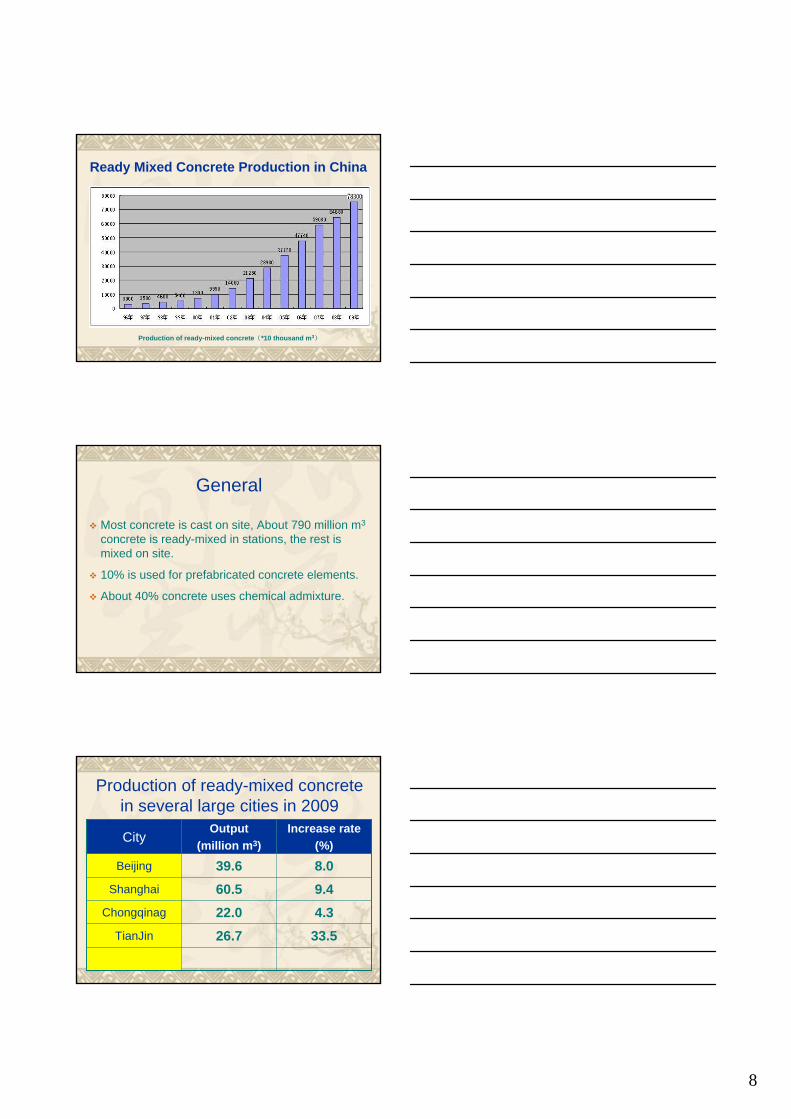
Production of ready-mixed concrete(*10 thousand m3)
Ready Mixed Concrete Production in China
General
Most concrete is cast on site, About 790 million m3
concrete is ready-mixed in stations, the rest is mixed on site.
10% is used for prefabricated concrete elements.
About 40% concrete uses chemical admixture.
Production of ready-mixed concrete in several large cities in 2009
33.526.7TianJin
4.322.0Chongqinag
9.460.5Shanghai
8.039.6Beijing
Increase rate(%)
Output (million m3)City
9
Chemical admixture
Extensive use of chemical admixture in concrete began in 80s, last century.The main ones include water reducer, then retarder, accelerator, air-entrainer, pumping aid, anti-freezing agent, et al.
Water reducer
The Production of superplasticizer is 4.85 million ton in 2009, 55% Naphthaline-type superplasticizer, 26% polycarboxyate.
我国聚羧酸减水剂生产企业已有百余家。2000年,我国聚羧酸减水剂产量仅2000吨,2006年为15万吨,2007年已发展到41.43万吨,2009年产量达到
了126.83万吨。
Mineral admixture
More than 100 million ton of mineral admixture is used in concrete industry.Main ones are fly ash and ground granulated blast furnace slag (GGBS).
10
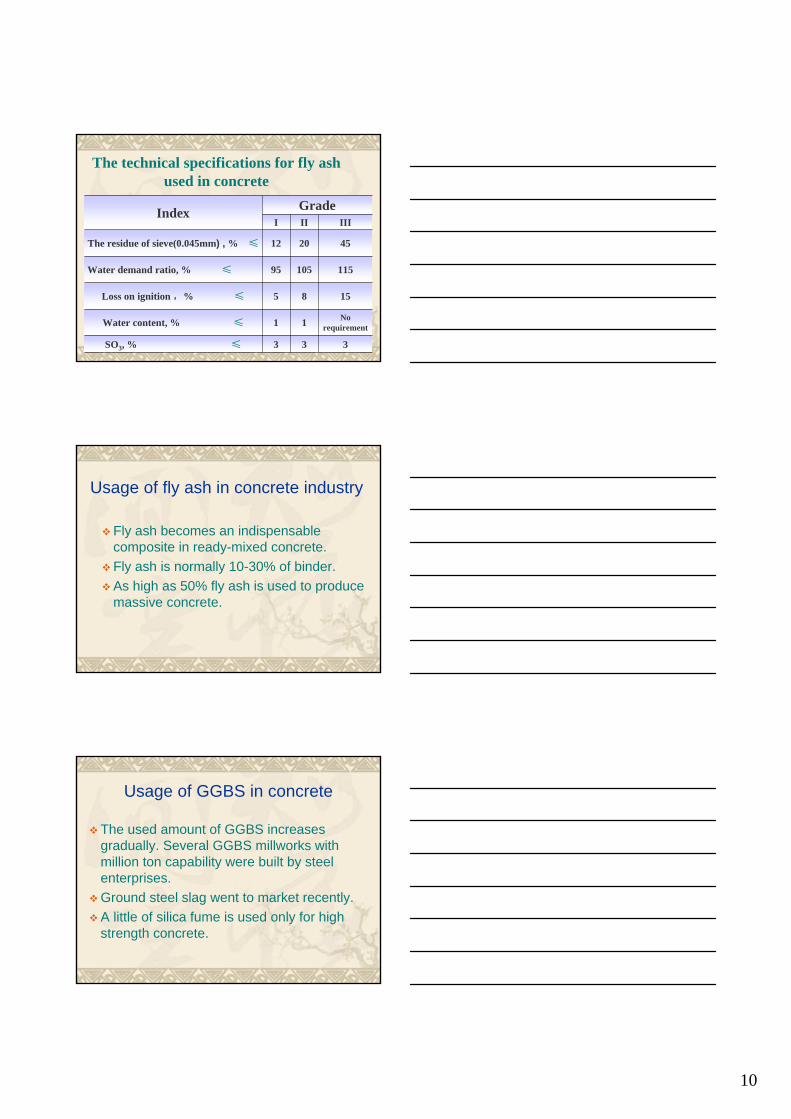
The technical specifications for fly ash used in concrete
333SO3, % ≤
No requirement11Water content, % ≤
1585Loss on ignition ,% ≤
11510595Water demand ratio, % ≤
452012The residue of sieve(0.045mm) , % ≤
IIIIIIGradeIndex
Usage of fly ash in concrete industry
Fly ash becomes an indispensable composite in ready-mixed concrete. Fly ash is normally 10-30% of binder. As high as 50% fly ash is used to produce massive concrete.
Usage of GGBS in concrete
The used amount of GGBS increases gradually. Several GGBS millworks with million ton capability were built by steel enterprises.Ground steel slag went to market recently.A little of silica fume is used only for high strength concrete.
11
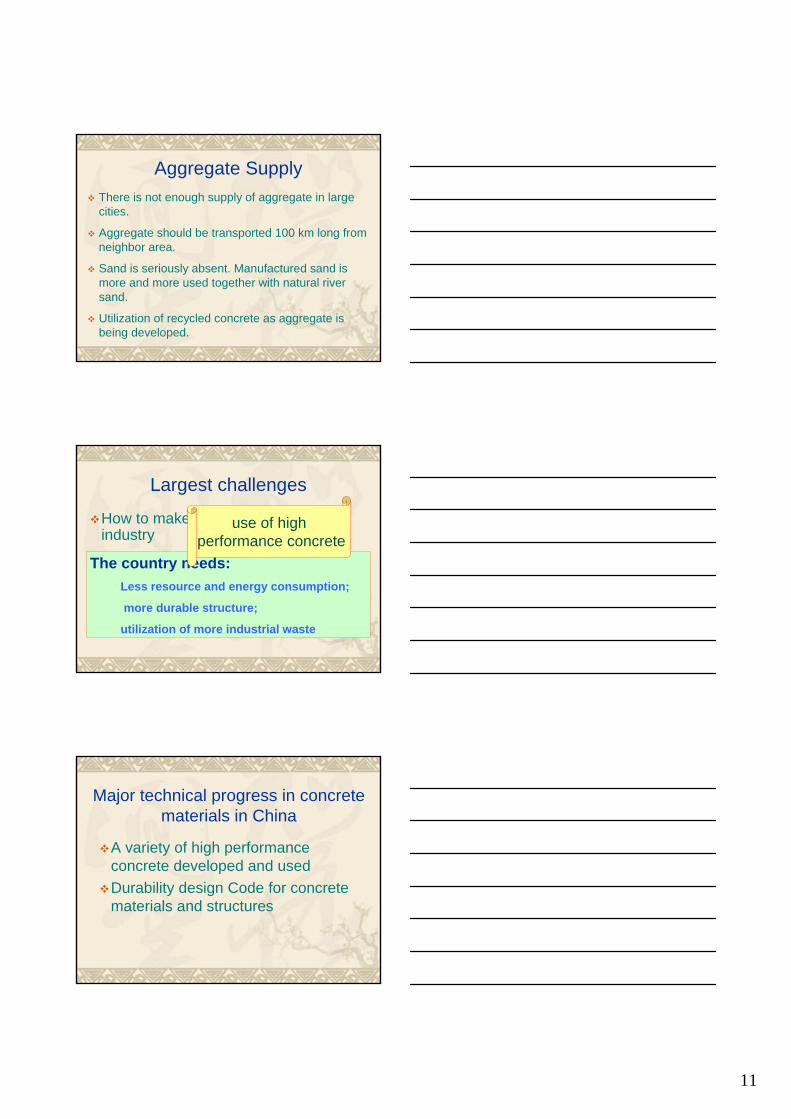
Aggregate SupplyThere is not enough supply of aggregate in large cities.
Aggregate should be transported 100 km long from neighbor area.
Sand is seriously absent. Manufactured sand is more and more used together with natural river sand.
Utilization of recycled concrete as aggregate is being developed.
Largest challenges
How to make a sustainable concrete industry
The country needs:Less resource and energy consumption;
more durable structure;
utilization of more industrial waste
use of high performance concrete
Major technical progress in concrete materials in China
A variety of high performance concrete developed and used Durability design Code for concrete materials and structures
12
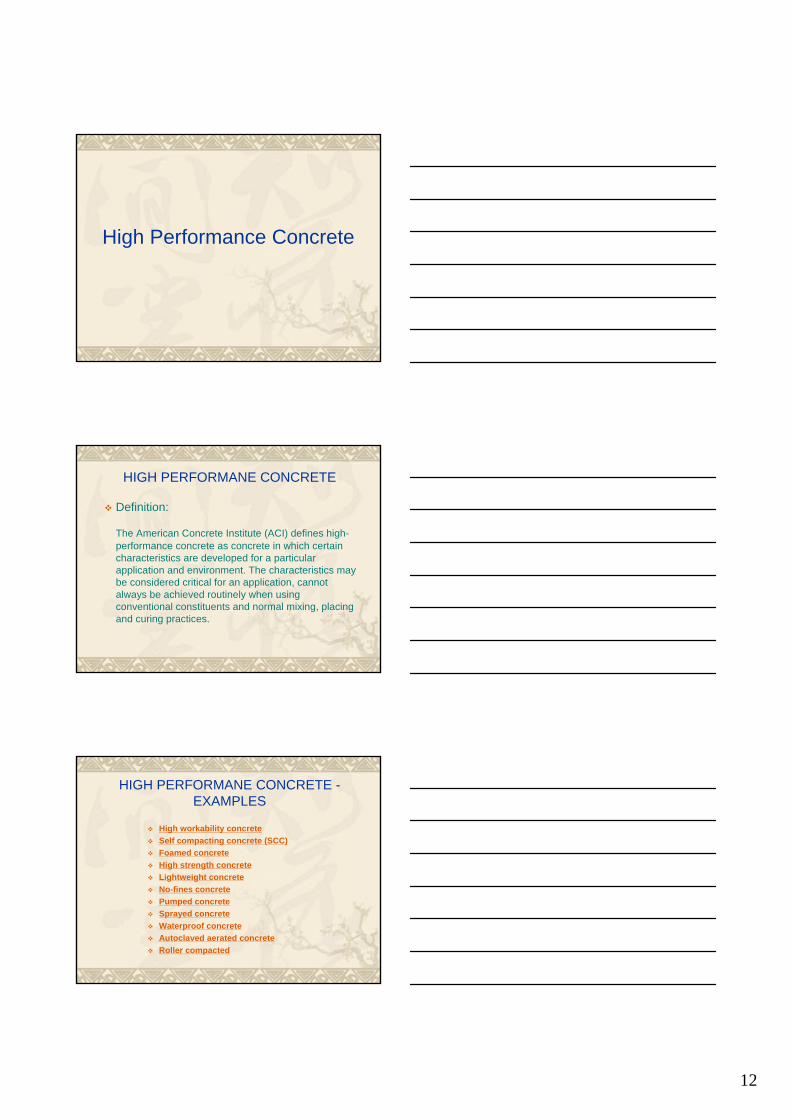
High Performance Concrete
HIGH PERFORMANE CONCRETE
Definition:
The American Concrete Institute (ACI) defines high-performance concrete as concrete in which certain characteristics are developed for a particular application and environment. The characteristics may be considered critical for an application, cannot always be achieved routinely when using conventional constituents and normal mixing, placing and curing practices.
HIGH PERFORMANE CONCRETE -EXAMPLES
High workability concreteSelf compacting concrete (SCC)Foamed concreteHigh strength concreteLightweight concreteNo-fines concretePumped concreteSprayed concreteWaterproof concreteAutoclaved aerated concreteRoller compacted
13
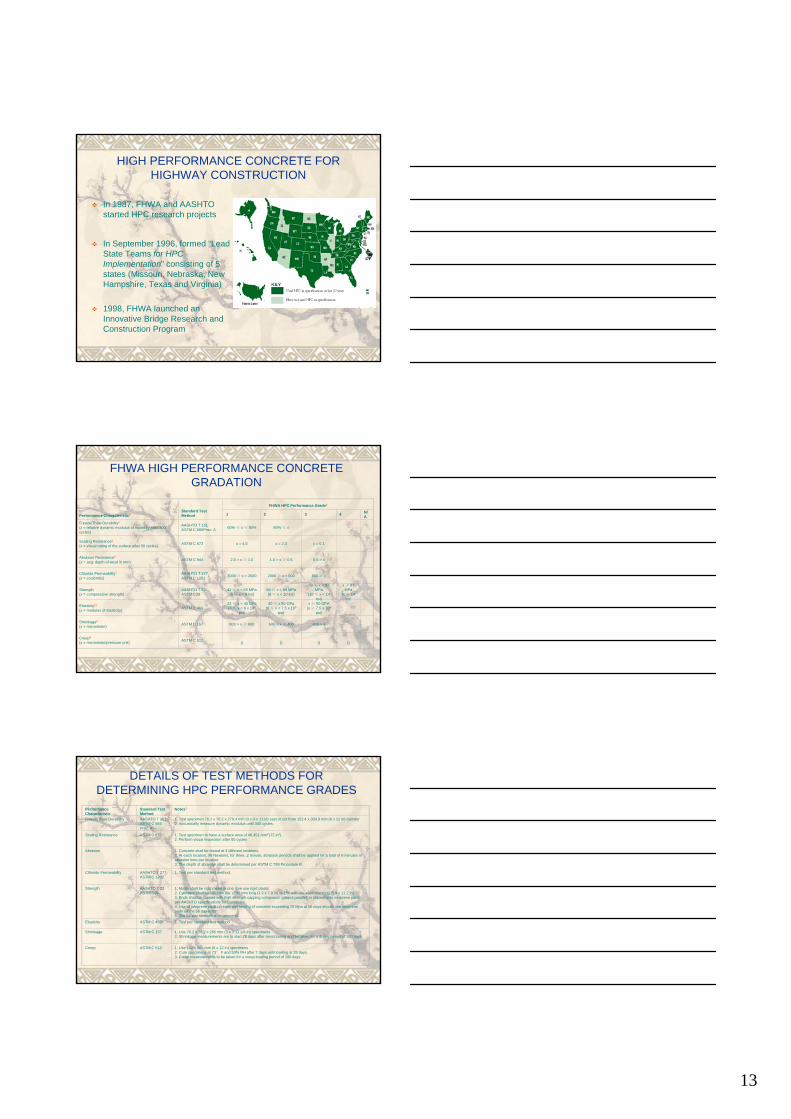
HIGH PERFORMANCE CONCRETE FOR HIGHWAY CONSTRUCTION
In 1987, FHWA and AASHTO started HPC research projects
In September 1996, formed “Lead State Teams for HPC Implementation” consisting of 5 states (Missouri, Nebraska, New Hampshire, Texas and Virginia)
1998, FHWA launched an Innovative Bridge Research and Construction Program
FHWA HIGH PERFORMANCE CONCRETE GRADATION
Performance Characteristic2Standard Test Method
FHWA HPC Performance Grade3
1 2 3 4 N/A
Freeze/Thaw Durability4
(x = relative dynamic modulus of elasticity after 300 cycles)
AASHTO T 161ASTM C 666Proc. A 60% ≤ x ≤ 80% 80% ≤ x
Scaling Resistance5
(x = visual rating of the surface after 50 cycles) ASTM C 672 x = 4,5 x = 2,3 x = 0,1
Abrasion Resistance6
(x = avg. depth of wear in mm) ASTM C 944 2.0 > x ≥ 1.0 1.0 > x ≥ 0.5 0.5 > x
Chloride Permeability7
(x = coulombs)AASHTO T 277ASTM C 1202 3000 ≥ x > 2000 2000 ≥ x > 800 800 ≥ x
Strength(x = compressive strength)
AASHTO T 22ASTM C39
41 ≤ x < 55 MPa(6 ≤ x < 8 ksi)
55 ≤ x < 69 MPa(8 ≤ x < 10 ksi)
69 ≤ x < 97 MPa
(10 ≤ x < 14 ksi)
x ≥ 97 MPa
(x ≥ 14 ksi)
Elasticity10
(x = modulus of elasticity) ASTM C 46924 ≤ x < 40 GPa(4 ≤ x < 6 x 10⁶
psi)
40 ≤ x 50 GPa(6 ≤ x < 7.5 x 10⁶
psi)
x ≥ 50 GPA(x ≥ 7.5 x 10⁶
psi)
Shrinkage8
(x = microstrain) ASTM C 157 800 > x ≥ 600 600 > x ≥ 400 400 > x
Creep9
(x = microstrain/pressure unit) ASTM C 512 () () () ()
DETAILS OF TEST METHODS FOR DETERMINING HPC PERFORMANCE GRADES
Performance Characteristic
Standard Test Method
Notes1
Freeze/Thaw Durability AASHTO T 161ASTM C 666 Proc. A
1. Test specimen 76.2 x 76.2 x 279.4 mm (3 x 3 x 11 in) cast or cut from 152.4 x 304.8 mm (6 x 12 in) cylinder 2. Acoustically measure dynamic modulus until 300 cycles.
Scaling Resistance ASTM C 672 1. Test specimen to have a surface area of 46,451 mm2 (72 in2).2. Perform visual inspection after 50 cycles
Abrasion 1. Concrete shall be tested at 3 different locations.2. At each location, 98 Newtons, for three, 2 minute, abrasion periods shall be applied for a total of 6 minutes of abrasion time per location.3. The depth of abrasion shall be determined per ASTM C 799 Procedure B.
Chloride Permeability AASHTO T 277ASTM C 1202
1. Test per standard test method.
Strength AASHTO T 22ASTM C39
1. Molds shall be rigid metal or one time use rigid plastic.2. Cylinders shall be 100 mm dia. x200 mm long (3.9 x 7.8 in) or 150 mm dia. x300 mm long (5.9 x 11.2 in).3. Ends shall be capped with high strength capping compound, ground parallel, or placed onto neoprene pads per AASHTO specifications for Concretes 4. Use of neoprene pads on early age testing of concrete exceeding 70 Mpa at 56 days should use neoprene pads on the 56 day tests 5. The 56 day strength is recommend
Elasticity ASTM C 469 1. Test per standard test method.
Shrinkage ASTM C 157 1. Use 76.2 x 76.2 x 285 mm (3 x 3 11 1/4 in) specimens 2. Shrinkage measurements are to start 28 days after moist curing and be taken for a drying period of 180 days.
Creep ASTM C 512 1. Use 152 x 305 mm (6 x 12 in) specimens 2. Cure specimens at 73° F and 50% RH after 7 days until loading at 28 days.3. Creep measurements to be taken for a creep loading period of 180 days.
14
SELF-CONSOLIDATING CONCRETE
Beijing, China June 5-7, 2009 http://scc2009.hnu.cn
第一届国际自密实混凝土设计、性能及应用会议
First International Symposium on Design, Performance and Use of Self-consolidating Concrete(SCC’2005)
International Conferences on SCC
SELF-CONSOLIDATING CONCRETEA concrete which can be placed and consolidated under its own weight without any vibration effort, and which is, at the same time, cohesive enough to be handled with acceptable segregation or bleeding.
Since the use of SCC eliminates vibration, it can have many technical, economical and environmental advantages over conventional concrete.
15
ADVANTAGES OF SCC
Eliminating the need for vibration; Decreasing the construction time and labor cost;Reducing the noise pollution; Improving the filling capacity of highly congested structural members; Improving the interfacial transitional zone between cement paste and aggregate or reinforcement, Decreasing the permeability and improving durability
of concrete, and Facilitating constructibility and ensuring good
structural performance.
DISADVANTAGES OF SCC
Higher autogenous shrinkage;
Lower stability of air voids;
Higher portion of large air bubbles;
Higher deformation (shrinkage and
creep)
Higher materials cost
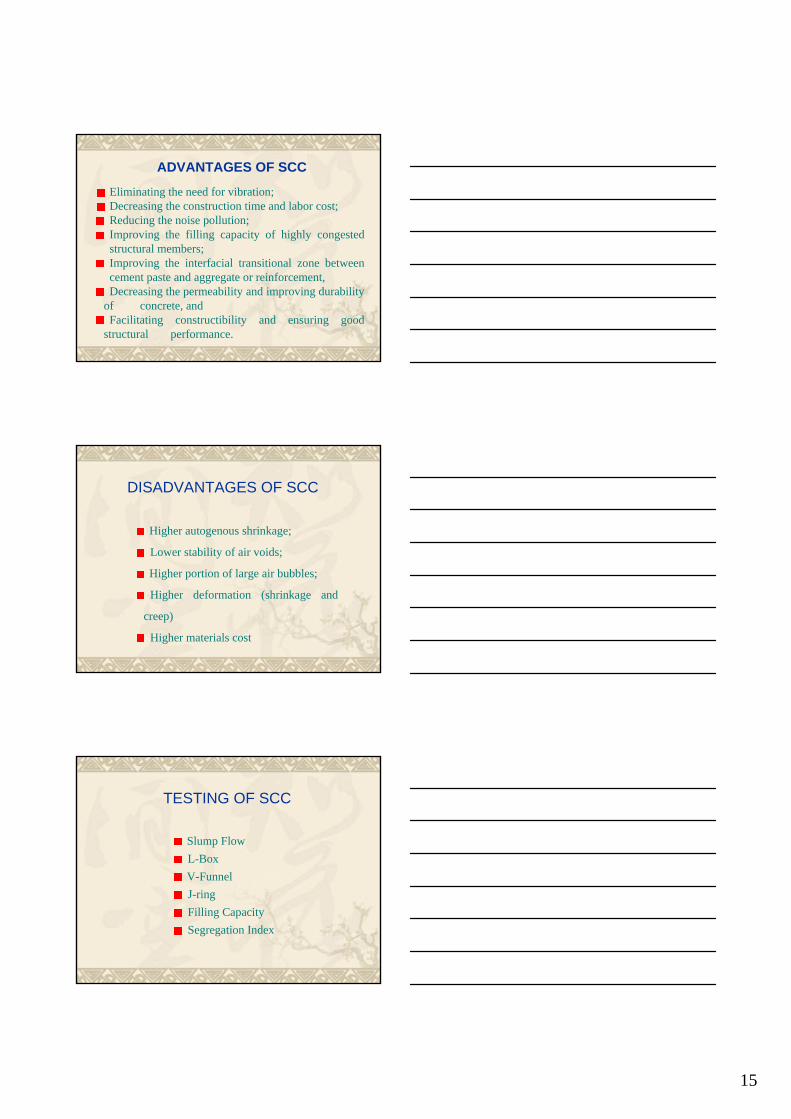
TESTING OF SCC
Slump Flow L-BoxV-FunnelJ-ringFilling CapacitySegregation Index
16
SLUMP CONE FLOW TEST
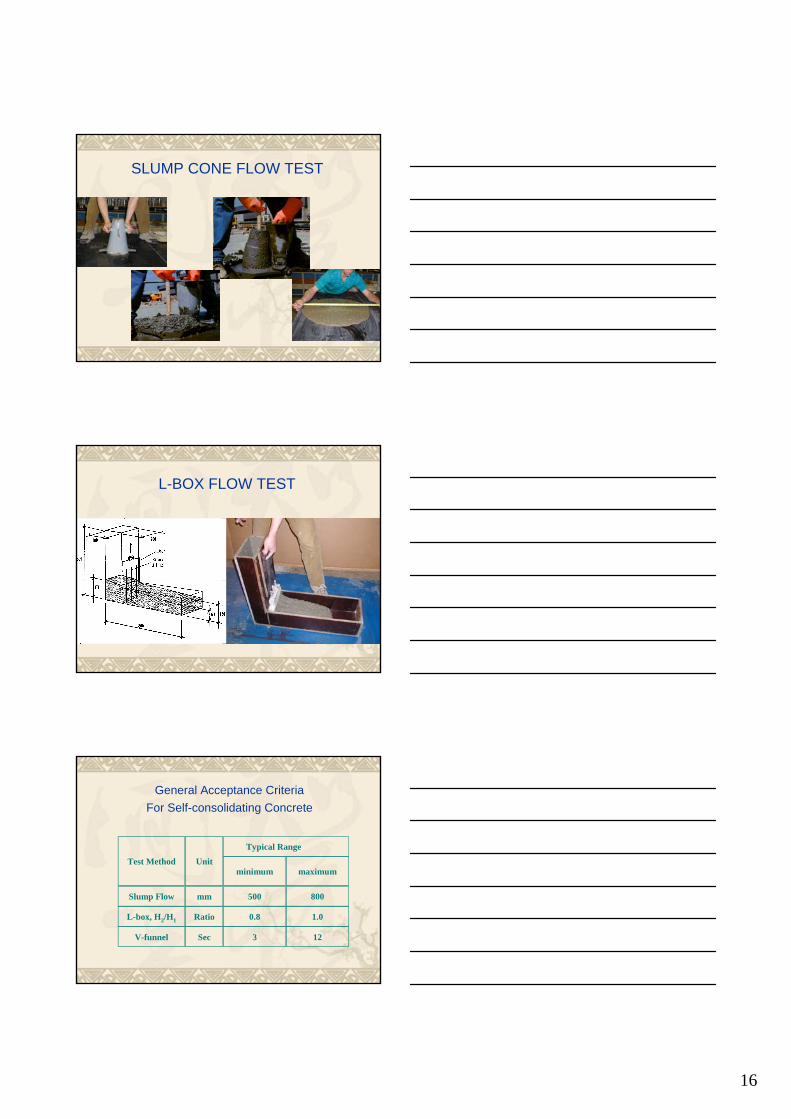
L-BOX FLOW TEST
General Acceptance Criteria For Self-consolidating Concrete
Typical Range
Test Method Unitminimum maximum
Slump Flow mm 500 800
L-box, H2/H1 Ratio 0.8 1.0
V-funnel Sec 3 12
17
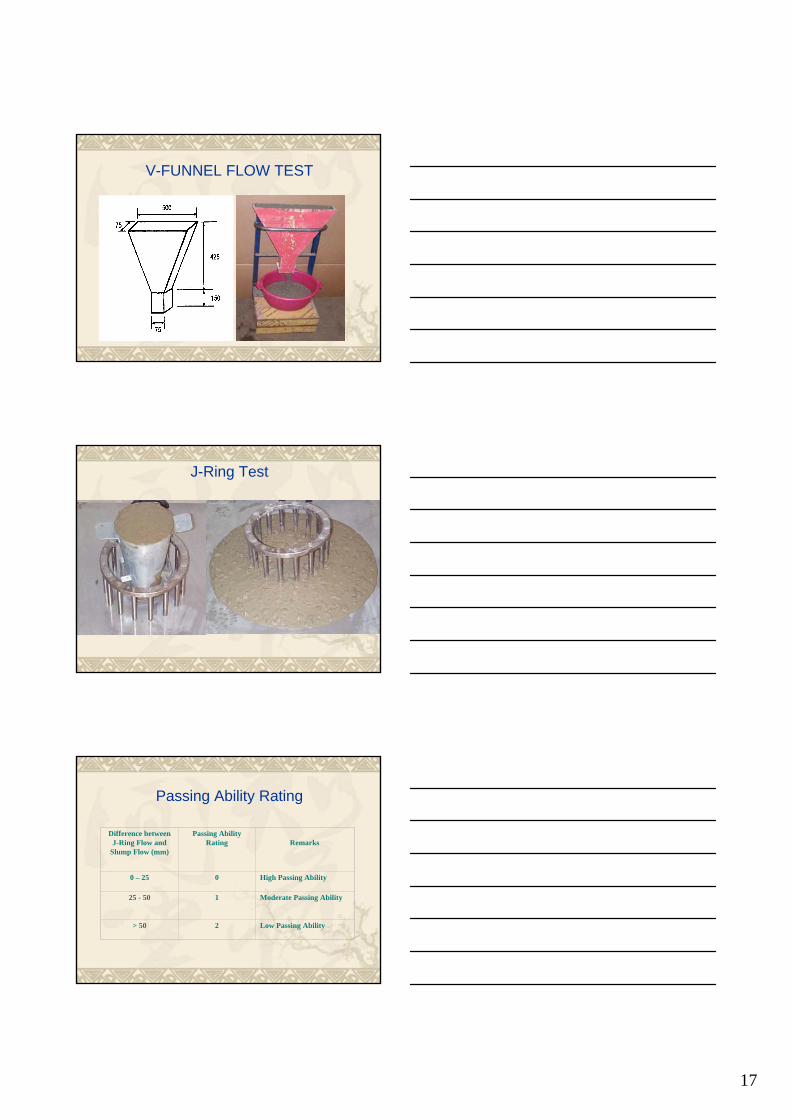
V-FUNNEL FLOW TEST
J-Ring Test
Passing Ability Rating
Difference between J-Ring Flow and
Slump Flow (mm)
Passing Ability Rating Remarks
0 – 25 0 High Passing Ability
25 - 50 1 Moderate Passing Ability
> 50 2 Low Passing Ability
18
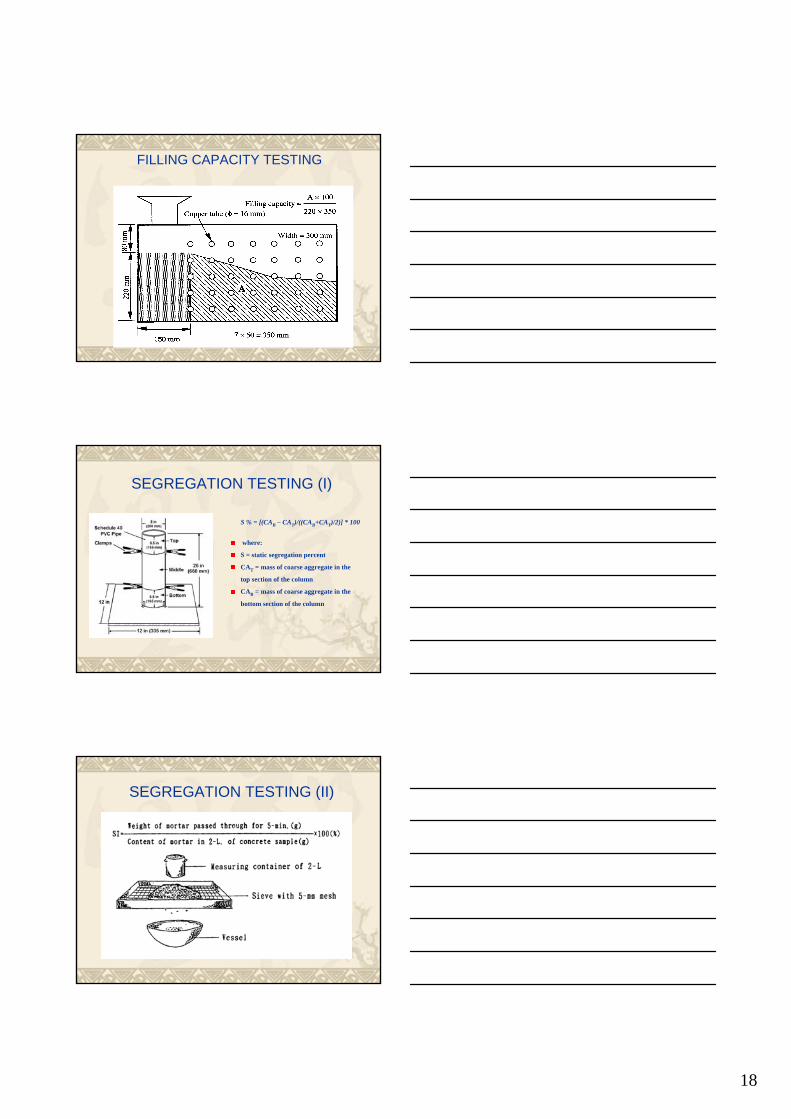
FILLING CAPACITY TESTING
SEGREGATION TESTING (I)
S % = [(CAB – CAT)/((CAB+CAT)/2)] * 100
where:
S = static segregation percent
CAT = mass of coarse aggregate in the
top section of the column
CAB = mass of coarse aggregate in the
bottom section of the column
SEGREGATION TESTING (II)
19
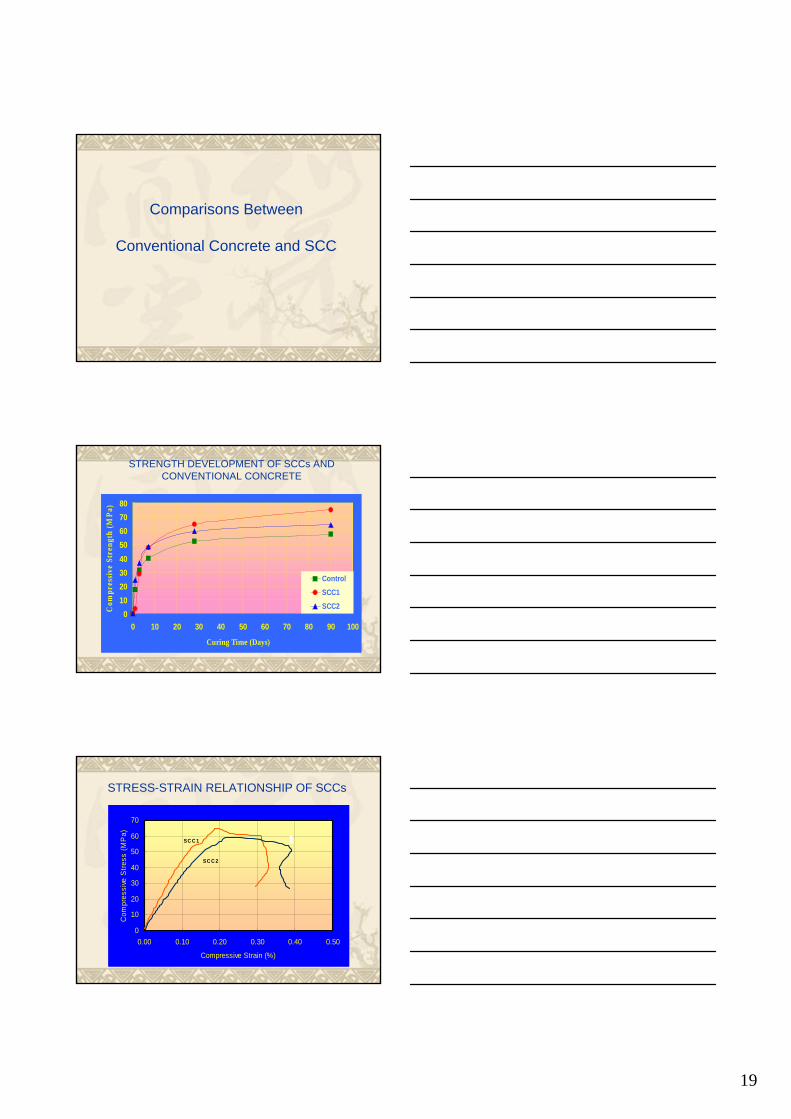
Comparisons Between
Conventional Concrete and SCC
STRENGTH DEVELOPMENT OF SCCs AND CONVENTIONAL CONCRETE
01020304050607080
0 10 20 30 40 50 60 70 80 90 100
Curing Time (Days)
Com
pres
sive
Stre
ngth
(MPa
)
Control
SCC1
SCC2
STRESS-STRAIN RELATIONSHIP OF SCCs
0
10
20
30
40
50
60
70
0.00 0.10 0.20 0.30 0.40 0.50
Compressive Strain (%)
Com
pres
sive
Stre
ss (M
Pa)
SC C 1
SC C 2
20
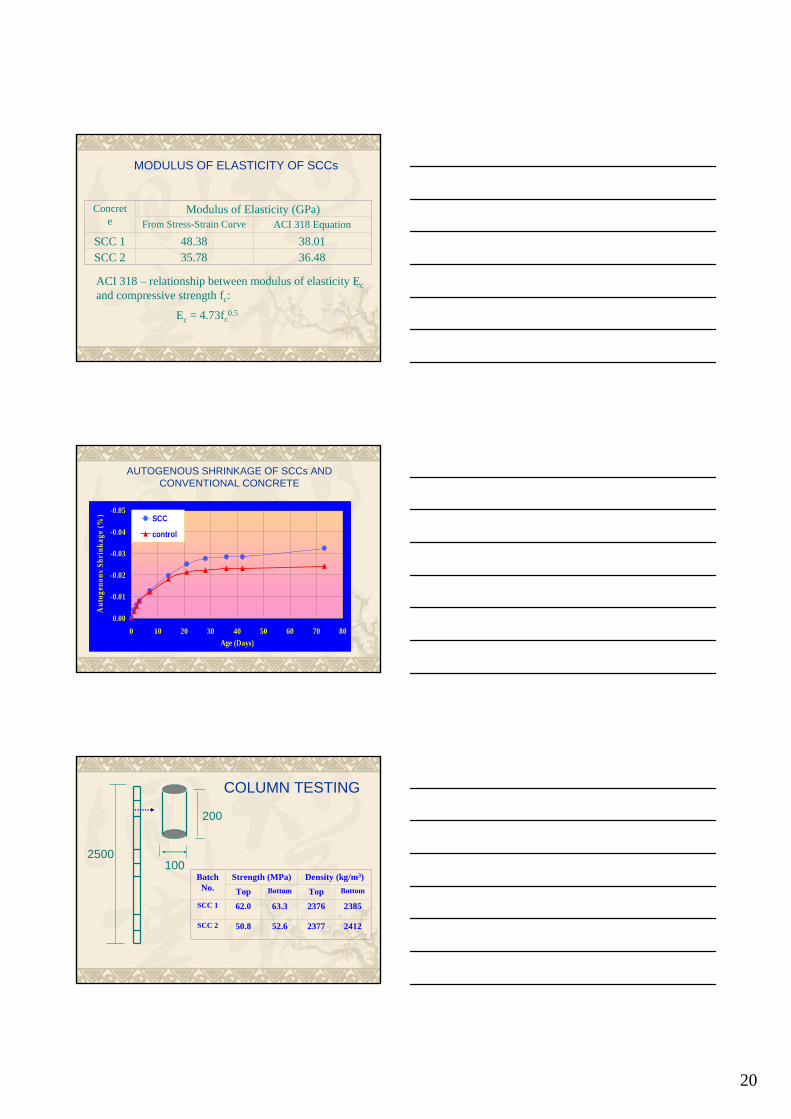
Concrete
Modulus of Elasticity (GPa) From Stress-Strain Curve ACI 318 Equation
SCC 1 48.38 38.01SCC 2 35.78 36.48
MODULUS OF ELASTICITY OF SCCs
ACI 318 – relationship between modulus of elasticity Ecand compressive strength fc:
Ec = 4.73fc0.5
AUTOGENOUS SHRINKAGE OF SCCs AND CONVENTIONAL CONCRETE
-0.05
-0.04
-0.03
-0.02
-0.01
0.000 10 20 30 40 50 60 70 80
Age (Days)
Aut
ogen
ous
Shri
nkag
e (%
) SCC
control
COLUMN TESTING
2500100
200
BatchNo.
Strength (MPa) Density (kg/m3)
Top Bottom Top Bottom
SCC 1 62.0 63.3 2376 2385
SCC 2 50.8 52.6 2377 2412
21
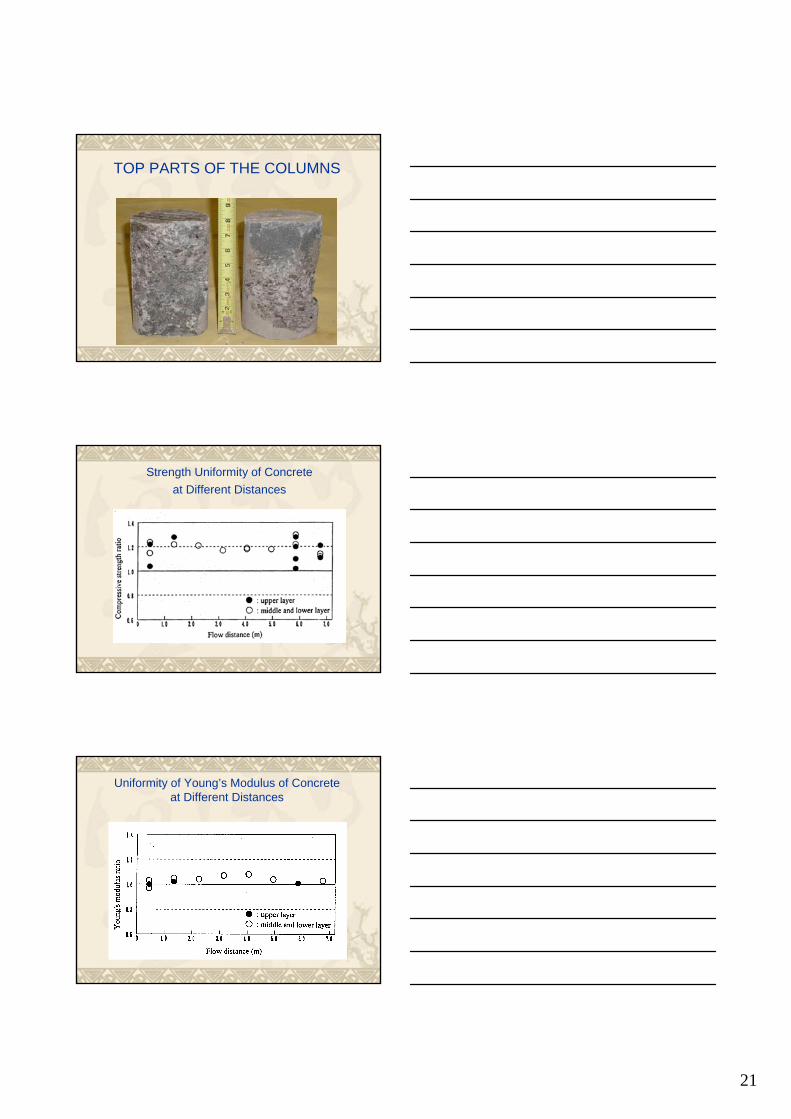
TOP PARTS OF THE COLUMNS
Strength Uniformity of Concrete at Different Distances
Uniformity of Young’s Modulus of Concrete at Different Distances
22
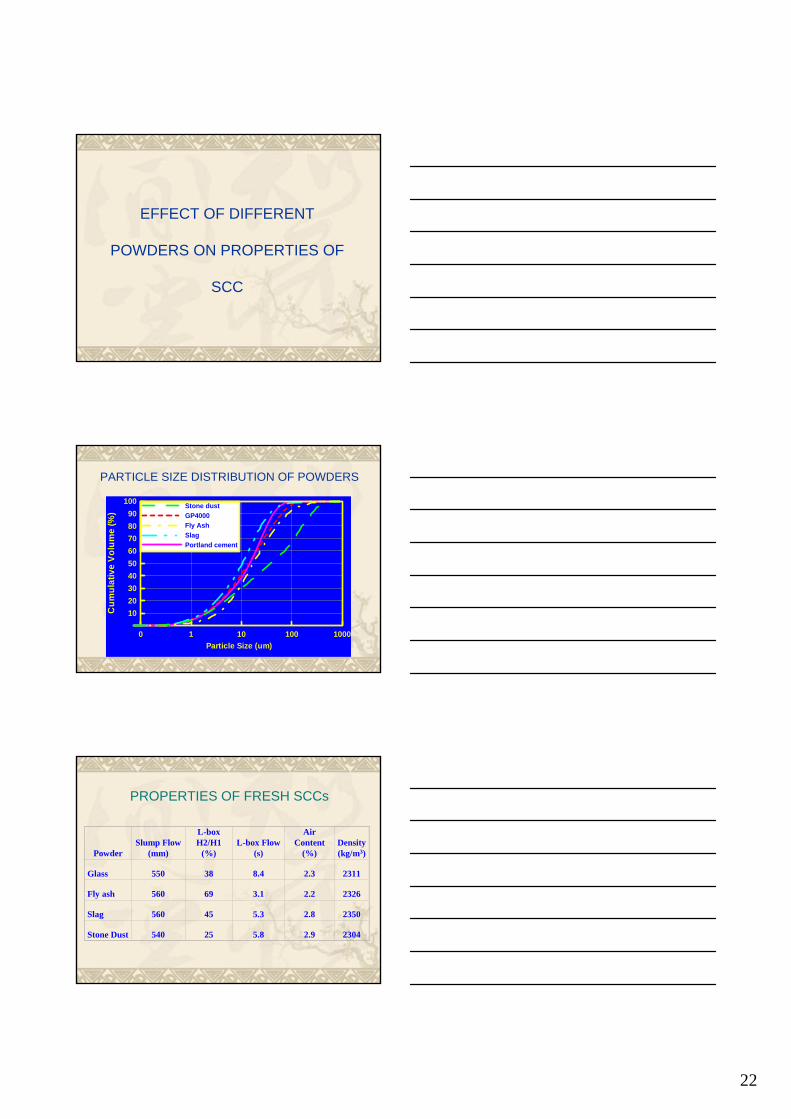
EFFECT OF DIFFERENT
POWDERS ON PROPERTIES OF
SCC
PARTICLE SIZE DISTRIBUTION OF POWDERS
0 1 10 100 1000Particle Size (um)
102030405060708090
100
Cum
ulat
ive
Volu
me
(%)
Stone dustGP4000Fly AshSlagPortland cement
PROPERTIES OF FRESH SCCs
PowderSlump Flow
(mm)
L-box H2/H1
(%)L-box Flow
(s)
Air Content
(%)Density(kg/m3)
Glass 550 38 8.4 2.3 2311
Fly ash 560 69 3.1 2.2 2326
Slag 560 45 5.3 2.8 2350
Stone Dust 540 25 5.8 2.9 2304
23
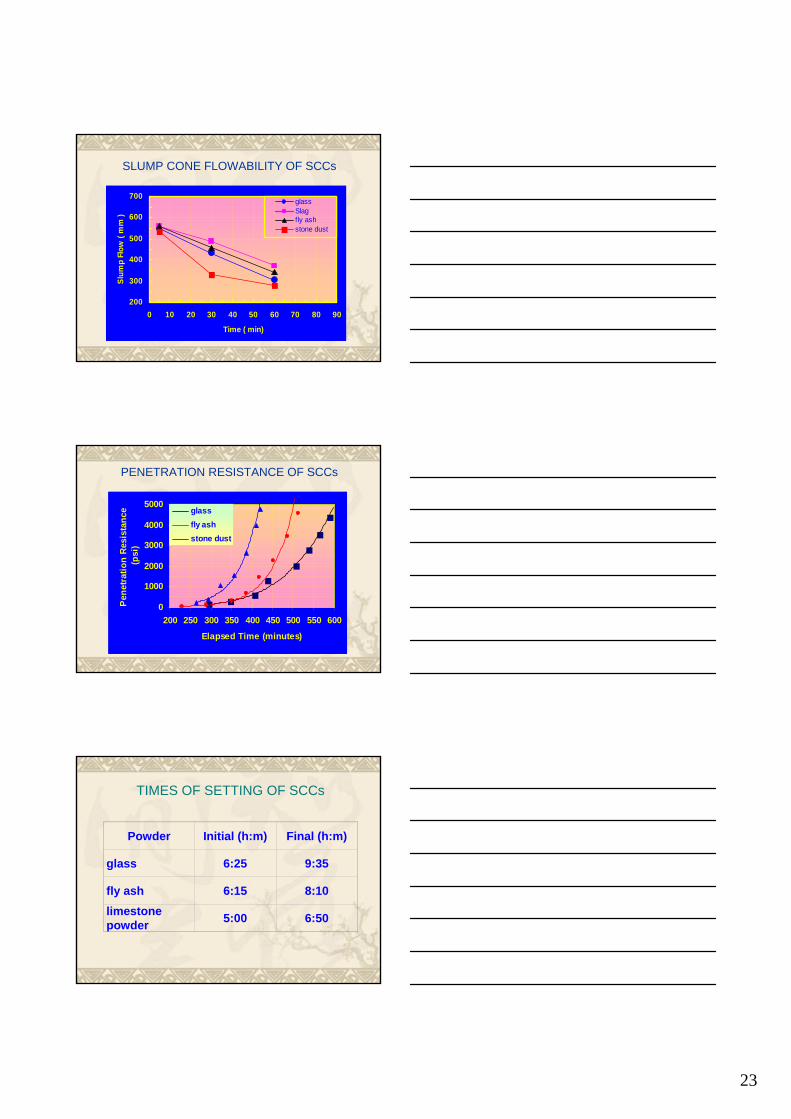
SLUMP CONE FLOWABILITY OF SCCs
200
300
400
500
600
700
0 10 20 30 40 50 60 70 80 90
Time ( min)
Slum
p Fl
ow (
mm
)
glassSlagfly ashstone dust
PENETRATION RESISTANCE OF SCCs
0
1000
2000
3000
4000
5000
200 250 300 350 400 450 500 550 600
Elapsed Time (minutes)
Pen
etra
tion
Resi
stan
ce
(psi
)
glassfly ashstone dust
TIMES OF SETTING OF SCCs
Powder Initial (h:m) Final (h:m)
glass 6:25 9:35
fly ash 6:15 8:10limestone powder 5:00 6:50
24
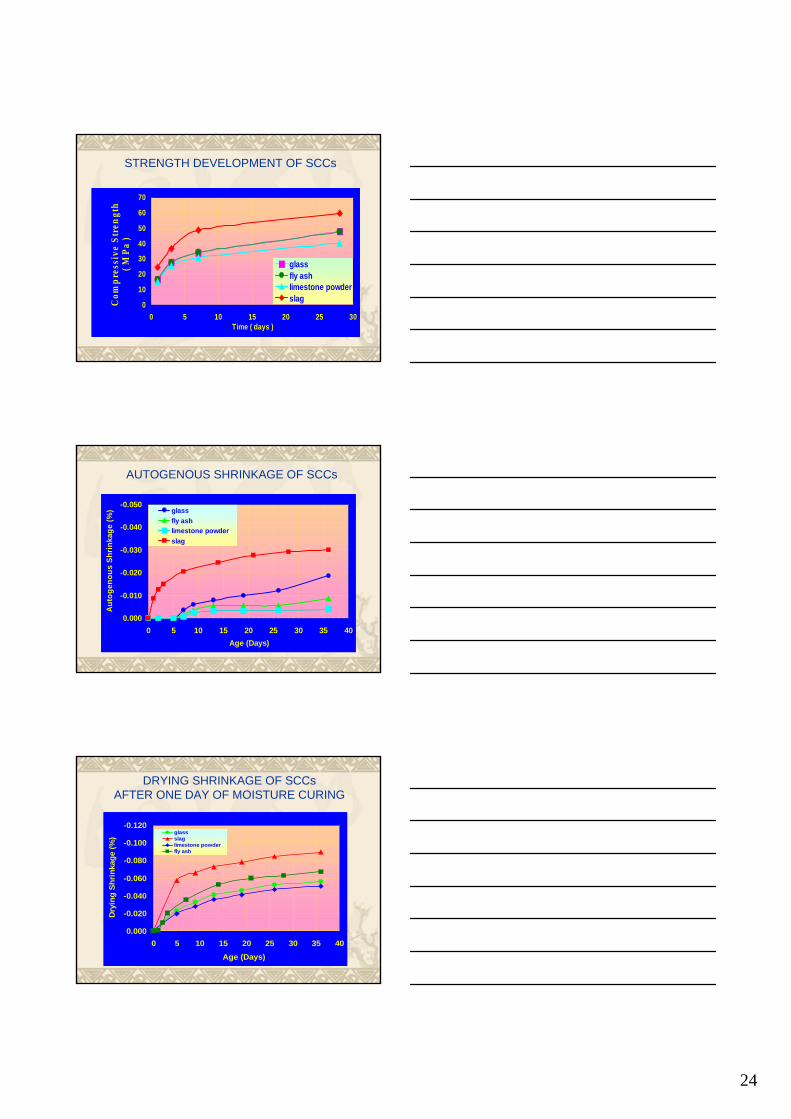
STRENGTH DEVELOPMENT OF SCCs
0
10
20
30
40
50
60
70
0 5 10 15 20 25 30Time ( days )
Com
pres
sive
Str
engt
h ( M
Pa )
glassfly ashlimestone powderslag
AUTOGENOUS SHRINKAGE OF SCCs
-0.050
-0.040
-0.030
-0.020
-0.010
0.0000 5 10 15 20 25 30 35 40
Age (Days)
Aut
ogen
ous
Shrin
kage
(%) glass
fly ashlimestone powderslag
DRYING SHRINKAGE OF SCCsAFTER ONE DAY OF MOISTURE CURING
-0.120
-0.100
-0.080
-0.060
-0.040
-0.020
0.0000 5 10 15 20 25 30 35 40
Age (Days)
Dry
ing
Shrin
kage
(%)
glassslaglimestone powderfly ash
25
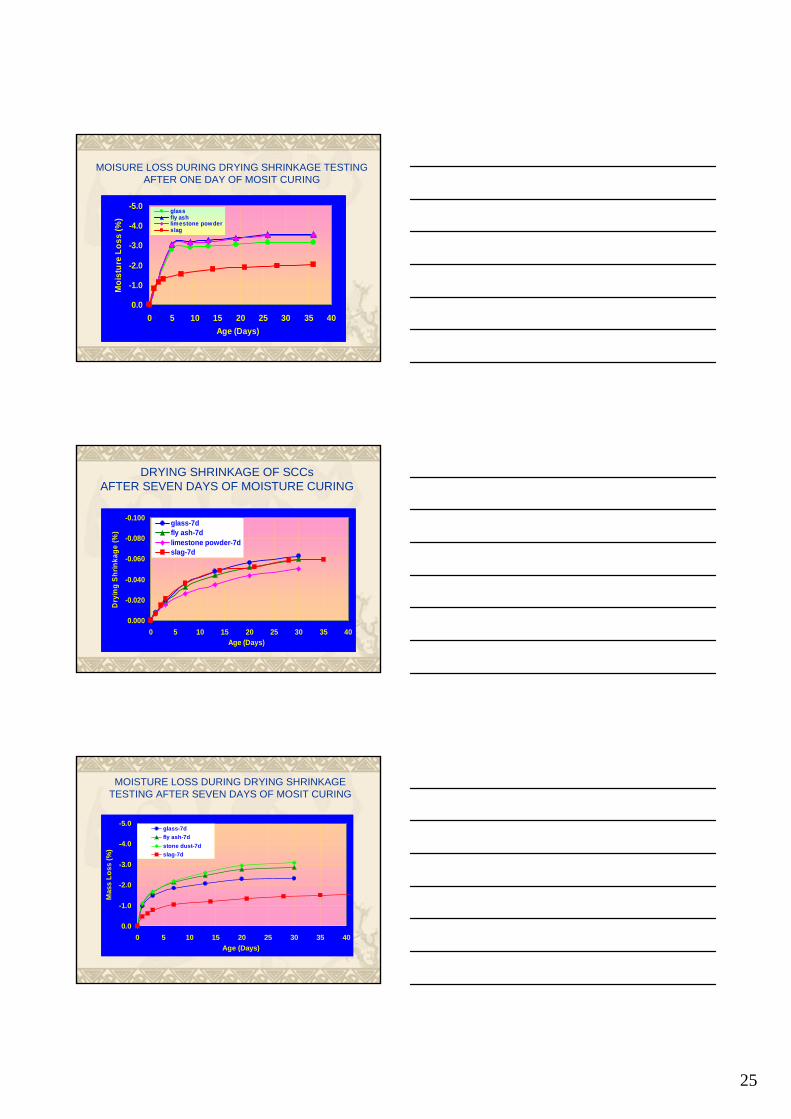
MOISURE LOSS DURING DRYING SHRINKAGE TESTING AFTER ONE DAY OF MOSIT CURING
-5.0
-4.0
-3.0
-2.0
-1.0
0.00 5 10 15 20 25 30 35 40
Age (Days)
Moi
stur
e Lo
ss (%
)
glassfly ashlimestone powderslag
DRYING SHRINKAGE OF SCCsAFTER SEVEN DAYS OF MOISTURE CURING
-0.100
-0.080
-0.060
-0.040
-0.020
0.0000 5 10 15 20 25 30 35 40
Age (Days)
Dry
ing
Shrin
kage
(%)
glass-7dfly ash-7dlimestone powder-7dslag-7d
MOISTURE LOSS DURING DRYING SHRINKAGE TESTING AFTER SEVEN DAYS OF MOSIT CURING
-5.0
-4.0
-3.0
-2.0
-1.0
0.00 5 10 15 20 25 30 35 40
Age (Days)
Mas
s Lo
ss (%
)
glass-7dfly ash-7dstone dust-7dslag-7d
26
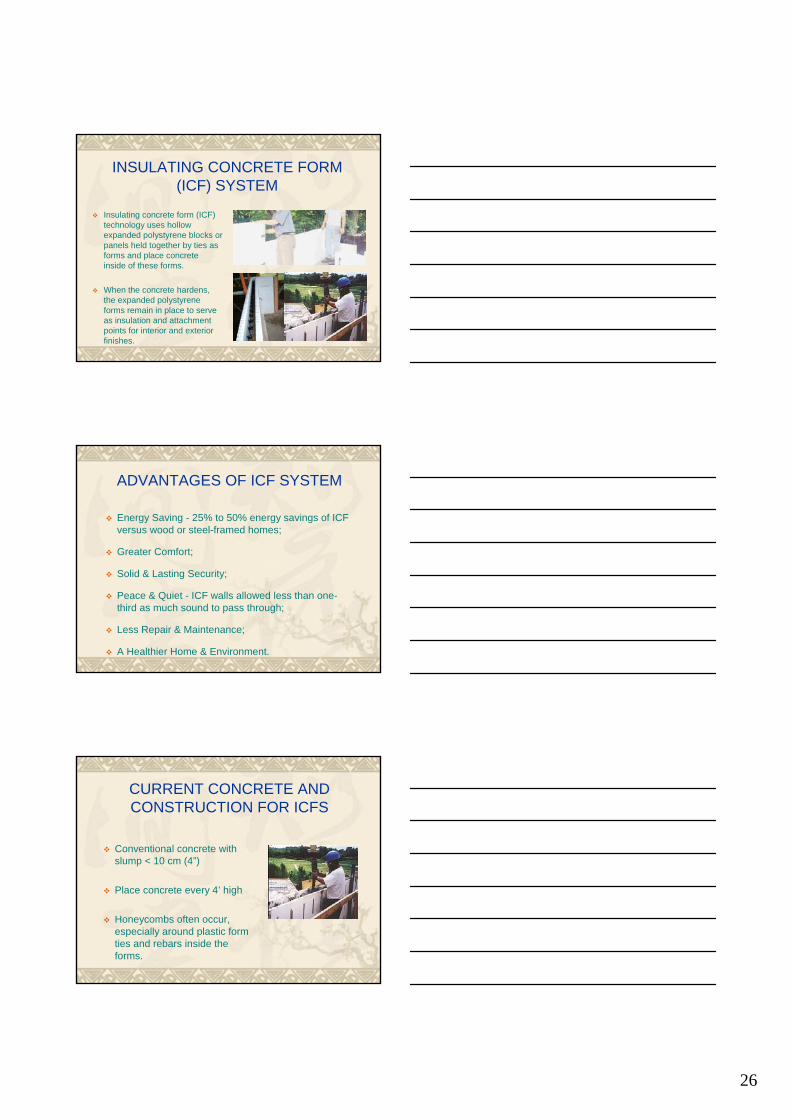
INSULATING CONCRETE FORM (ICF) SYSTEM
Insulating concrete form (ICF) technology uses hollow expanded polystyrene blocks or panels held together by ties as forms and place concrete inside of these forms.
When the concrete hardens, the expanded polystyrene forms remain in place to serve as insulation and attachment points for interior and exterior finishes.
ADVANTAGES OF ICF SYSTEM
Energy Saving - 25% to 50% energy savings of ICF versus wood or steel-framed homes;
Greater Comfort;
Solid & Lasting Security;
Peace & Quiet - ICF walls allowed less than one-third as much sound to pass through;
Less Repair & Maintenance;
A Healthier Home & Environment.
CURRENT CONCRETE AND CONSTRUCTION FOR ICFS
Conventional concrete with slump < 10 cm (4”)
Place concrete every 4’ high
Honeycombs often occur, especially around plastic form ties and rebars inside the forms.
27
SELF-CONSOLIDATING LIGHTWEIGHT CONCRETE (SCLC) FOR ICFS
Self-consolidating
Reduced density
Increased casting height
Enhanced thermal insulation
Reduced foundation requirement
Higher materials costs but lower total
construction costs
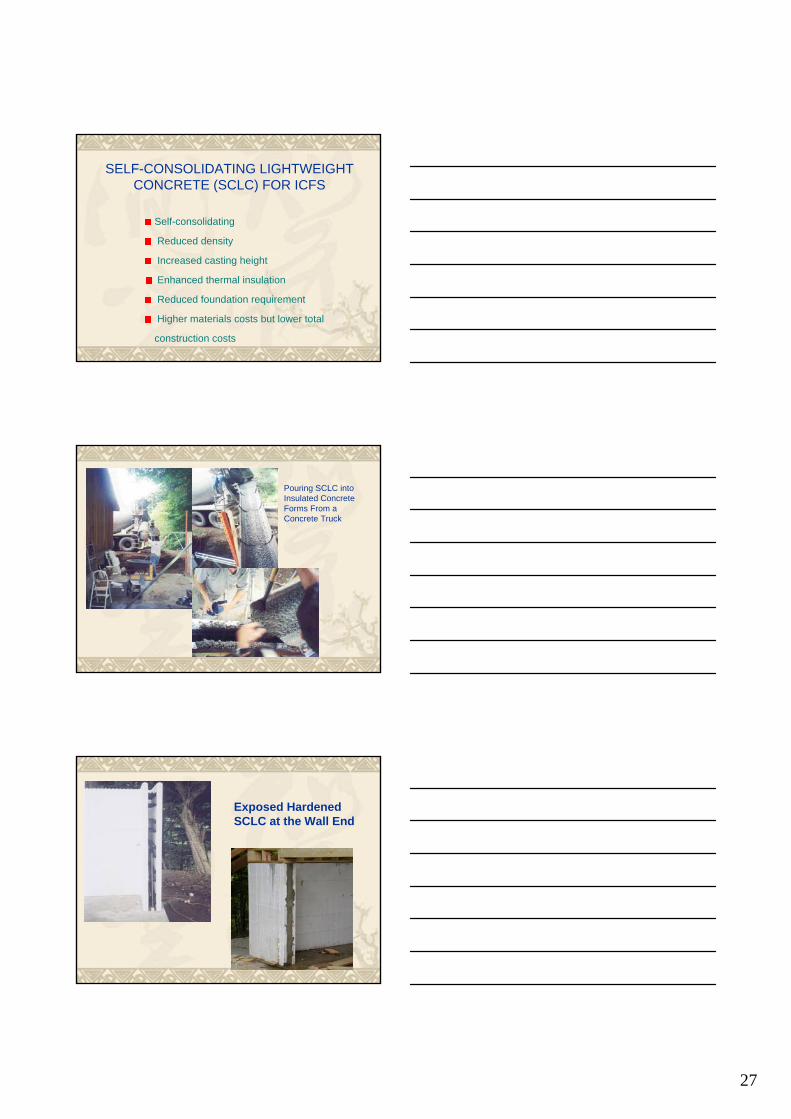
Pouring SCLC into Insulated Concrete Forms From a Concrete Truck
Exposed Hardened SCLC at the Wall End
28
Lightweight Concrete
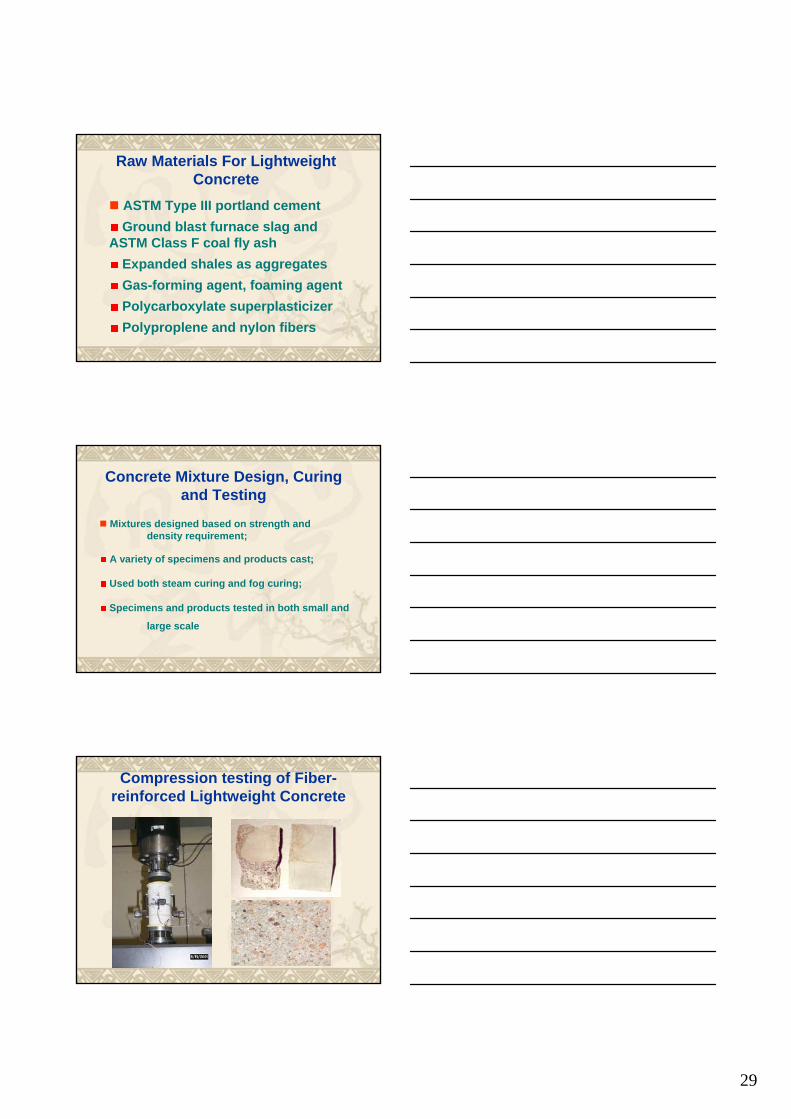
Production of Lightweight Concrete
Air Bubbles in AggregatesSynthetic lightweight aggregateNatural lightweight aggregate
Air Bubbles in PasteGas-forming methodFoaming method
Advantages of Lightweight Concrete
Good performance and durabilityLess dead load (reduced member size, seismic inertial mass and foundation forces)Better insulation propertyHigher materials costs but lower total construction costs
29
Raw Materials For Lightweight Concrete
ASTM Type III portland cementGround blast furnace slag and
ASTM Class F coal fly ash Expanded shales as aggregates Gas-forming agent, foaming agentPolycarboxylate superplasticizerPolyproplene and nylon fibers
Concrete Mixture Design, Curing and Testing
Mixtures designed based on strength and density requirement;
A variety of specimens and products cast;
Used both steam curing and fog curing;
Specimens and products tested in both small and
large scale
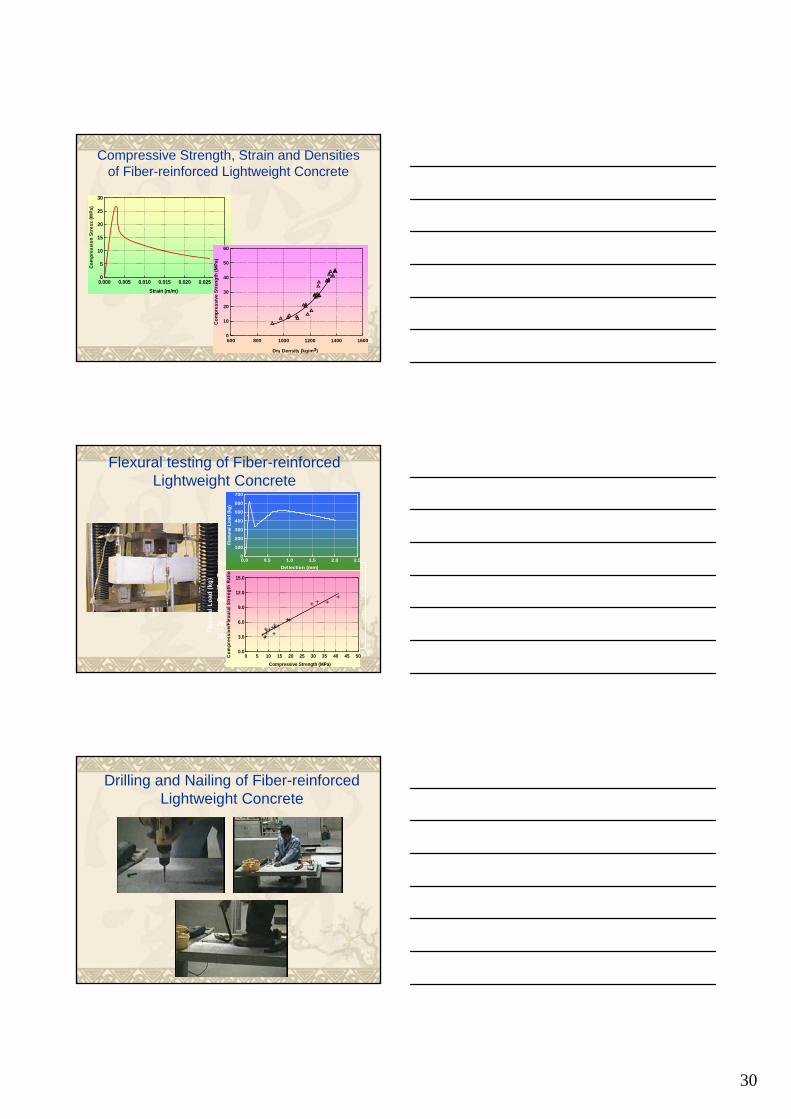
Compression testing of Fiber-reinforced Lightweight Concrete
30
0.000 0.005 0.010 0.015 0.020 0.025 0.030Strain (m/m)
0
5
10
15
20
25
30
Com
pres
sion
Str
ess
(MPa
)
600 800 1000 1200 1400 1600
Dry Density (kg/m3)
0
10
20
30
40
50
60
Com
pres
sive
Stre
ngth
(MPa
)
Compressive Strength, Strain and Densities of Fiber-reinforced Lightweight Concrete
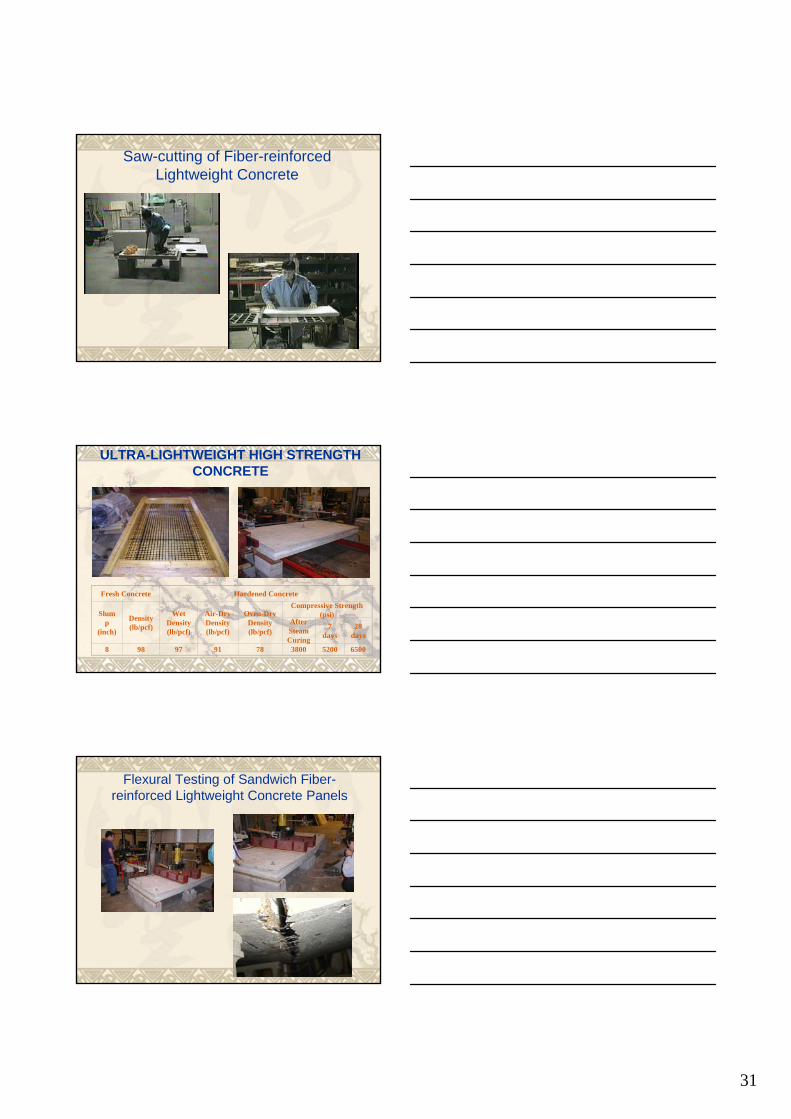
Flexural testing of Fiber-reinforced Lightweight Concrete
0.0 0.5 1.0 1.5 2.0 2.5Deflection (mm)
0
100
200
300
400
500
600
700
Flex
ural
Loa
d (k
g)
0 5 10 15 20 25 30 35 40 45 50Compressive Strength (MPa)
0.0
3.0
6.0
9.0
12.0
15.0
Com
pres
sive
/Fle
xura
l Str
engt
h R
atio
0.0 0.5 1.0 1.5 2.0 2.5Deflection (mm)
0
100
200
300
400
500
600
700
Flex
ural
Loa
d (k
g)
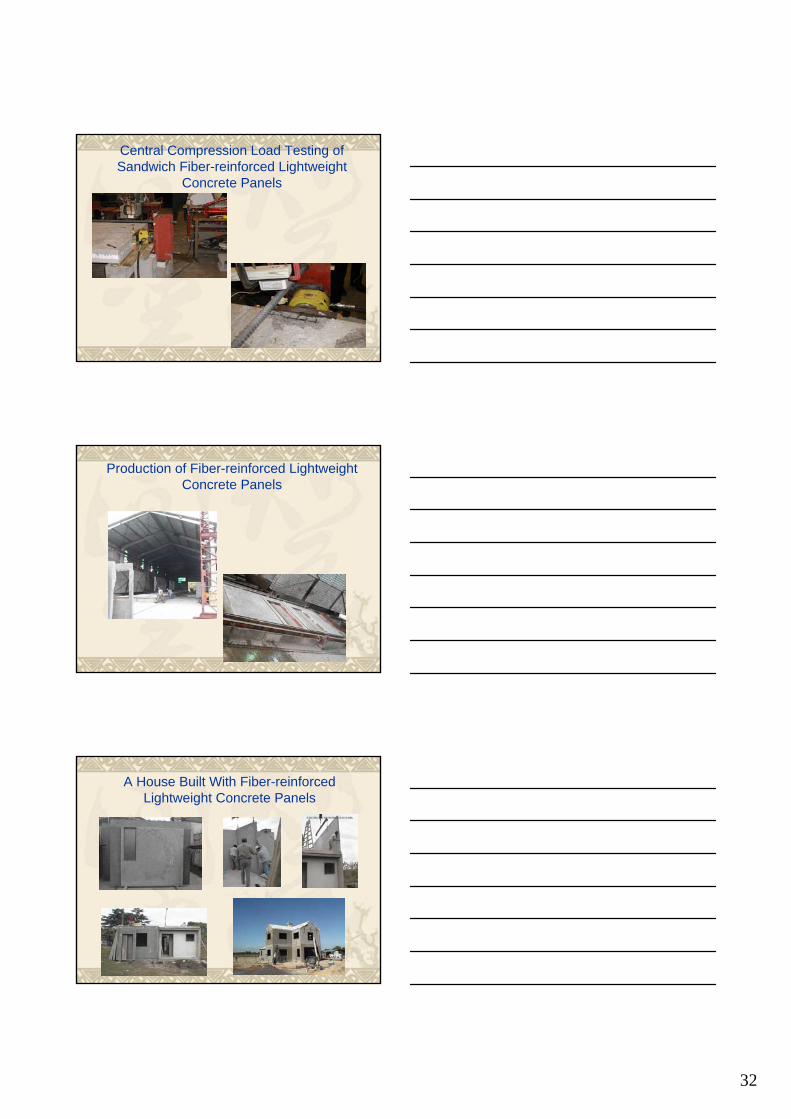
Drilling and Nailing of Fiber-reinforced Lightweight Concrete
31
Saw-cutting of Fiber-reinforced Lightweight Concrete
ULTRA-LIGHTWEIGHT HIGH STRENGTH CONCRETE
Fresh Concrete Hardened Concrete
Slump
(inch)
Density(lb/pcf)
Wet Density(lb/pcf)
Air-Dry Density(lb/pcf)
Oven-Dry Density(lb/pcf)
Compressive Strength (psi)
After Steam Curing
7 days
28 days
8 98 97 91 78 3800 5200 6500
Flexural Testing of Sandwich Fiber-reinforced Lightweight Concrete Panels
32
Central Compression Load Testing of Sandwich Fiber-reinforced Lightweight
Concrete Panels
Production of Fiber-reinforced Lightweight Concrete Panels
A House Built With Fiber-reinforced Lightweight Concrete Panels
33
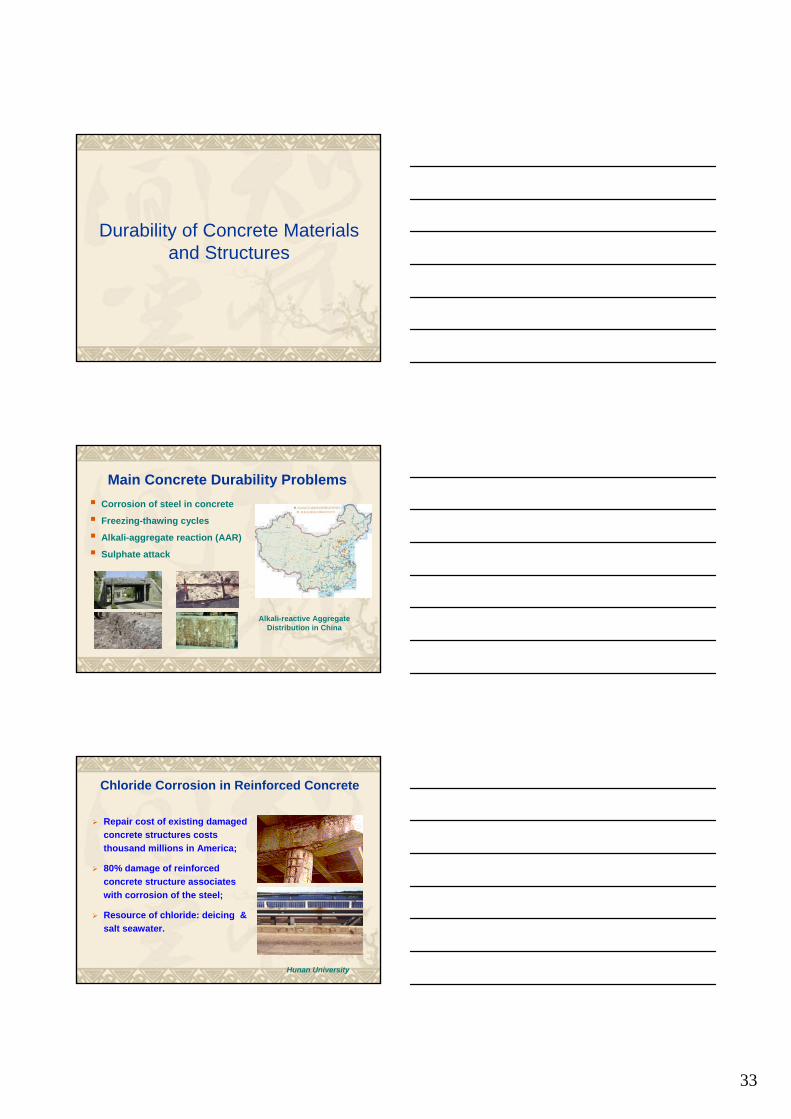
Durability of Concrete Materials and Structures
Main Concrete Durability ProblemsCorrosion of steel in concrete
Freezing-thawing cycles
Alkali-aggregate reaction (AAR)
Sulphate attack
Alkali-reactive Aggregate Distribution in China
Repair cost of existing damaged concrete structures costs thousand millions in America;
80% damage of reinforced concrete structure associates with corrosion of the steel;
Resource of chloride: deicing & salt seawater.
Hunan University
Chloride Corrosion in Reinforced Concrete
34
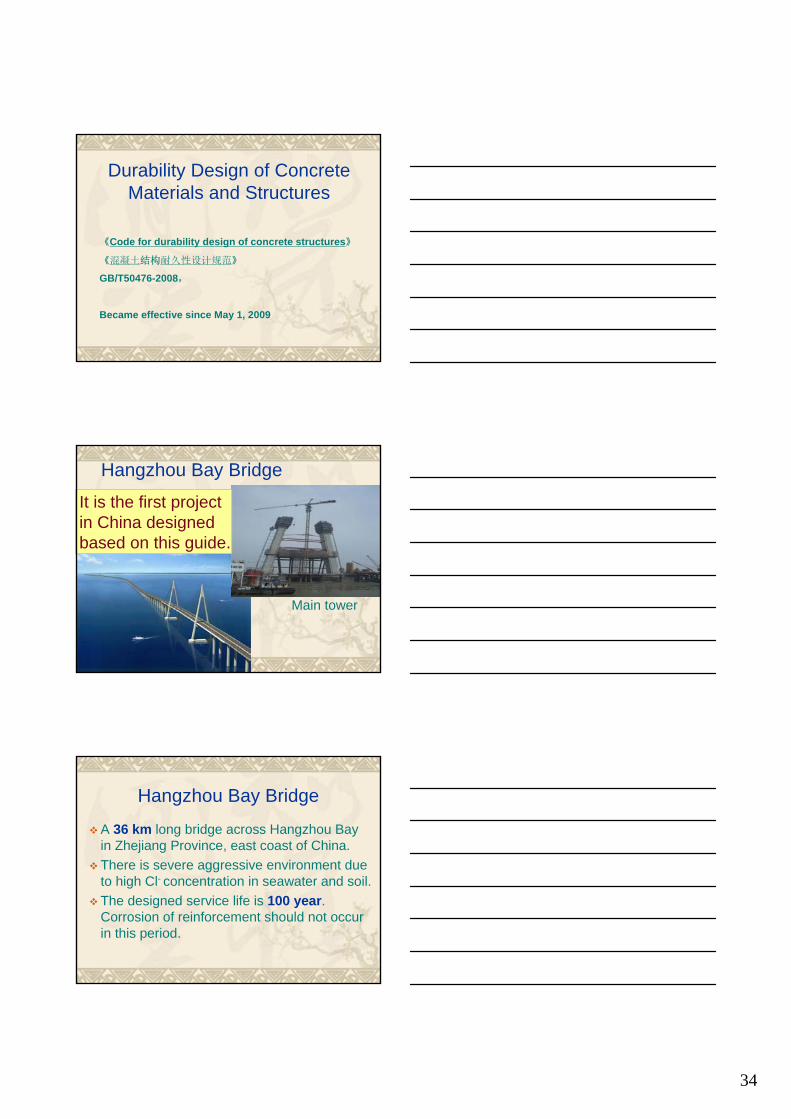
Durability Design of Concrete Materials and Structures
《Code for durability design of concrete structures》
《混凝土结构耐久性设计规范》
GB/T50476-2008,
Became effective since May 1, 2009
It is the first project in China designed based on this guide.
Main tower
Hangzhou Bay Bridge
Hangzhou Bay Bridge
A 36 km long bridge across Hangzhou Bay in Zhejiang Province, east coast of China.There is severe aggressive environment due to high Cl- concentration in seawater and soil.The designed service life is 100 year. Corrosion of reinforcement should not occur in this period.
35
Durable marine concrete
The controlling factor of concrete durability is Cl- ion diffusion efficiency.High volume mineral admixture concrete with low water-binder ratio was adopted to lower Cl- ion diffusion coefficient of concrete.
Properties of raw materialsCement: PII-42.5, 3d strength 32.0MPa, 28d strength 52.8MPa.Fly ash: low-Ca type, LOI=3.5%, water demand=91%, SO3=0.68%, 0.045mm sieve residue=9.1%GGBS: activity factor=116%, SSA=446 m2/kg
Aggregate: 5-25 mm, Non AAR activity
Sand: river sand, fineness module 2.6
Superplasticizer: Naphthaline-type for ready-mixing concrete, polycarboxylate-type for precasting concrete
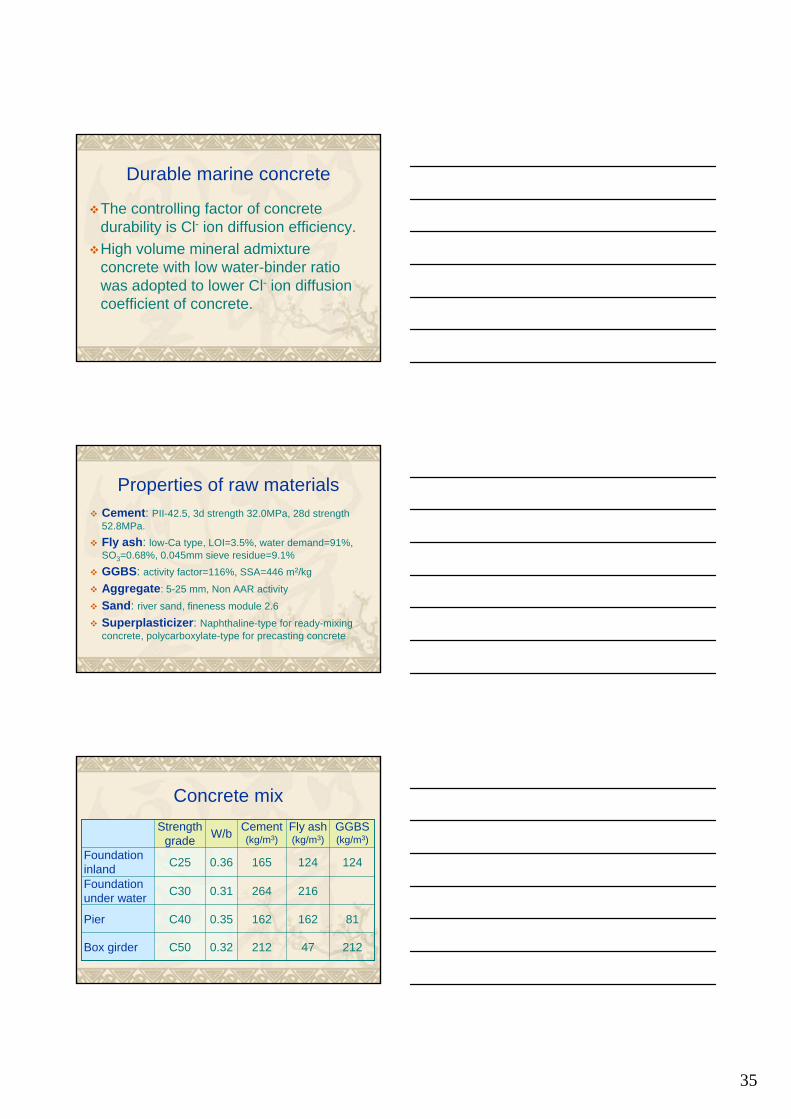
Concrete mix
212472120.32C50Box girder
811621620.35C40Pier
2162640.31C30Foundation under water
1241241650.36C25Foundation inland
GGBS (kg/m3)
Fly ash (kg/m3)
Cement (kg/m3)W/bStrength
grade
36
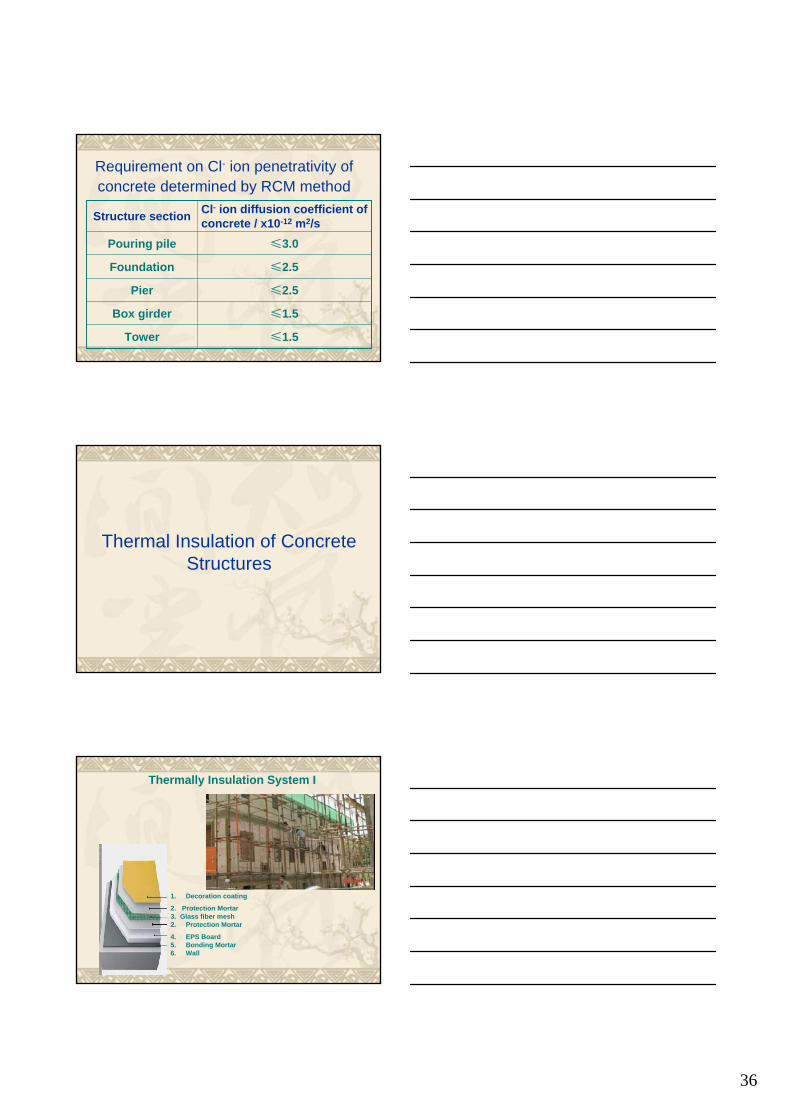
Requirement on Cl- ion penetrativity of concrete determined by RCM method
≤1.5Tower
≤1.5Box girder
≤2.5Pier
≤2.5Foundation
≤3.0Pouring pile
Cl- ion diffusion coefficient of concrete / x10-12 m2/sStructure section
Thermal Insulation of Concrete Structures
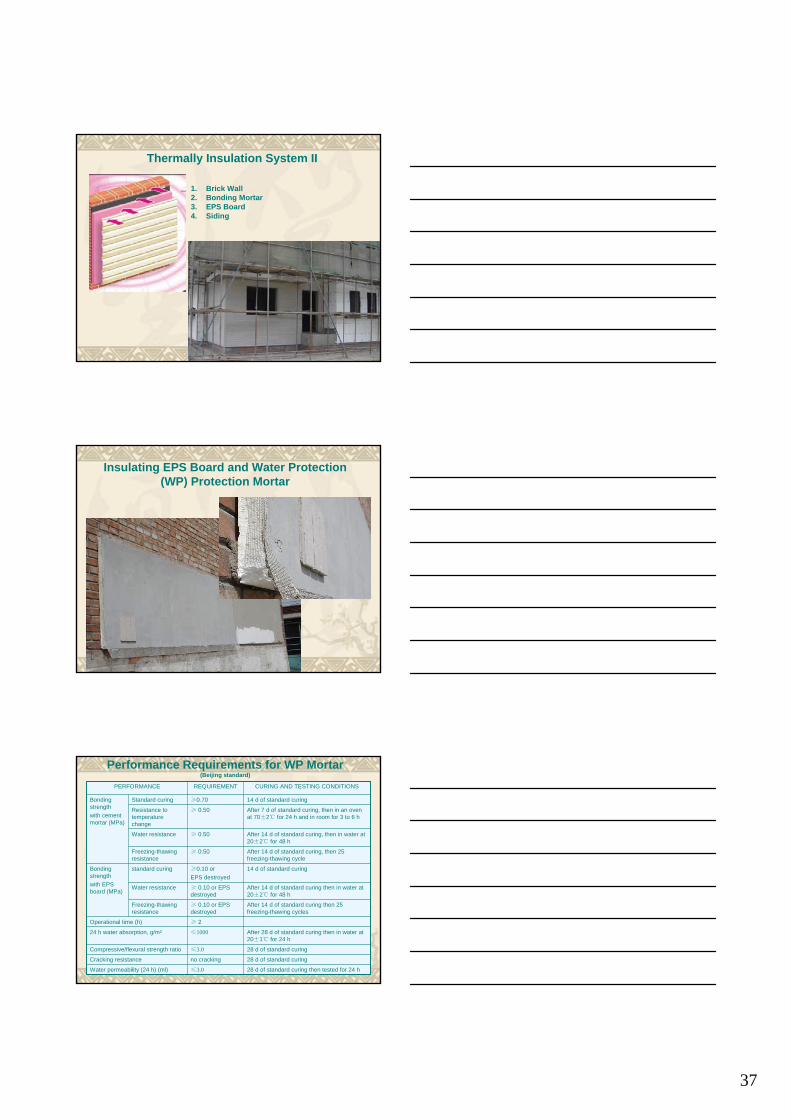
Thermally Insulation System I
1. Decoration coating
2. Protection Mortar3. Glass fiber mesh2. Protection Mortar
4. EPS Board5. Bonding Mortar6. Wall
37
Thermally Insulation System II
1. Brick Wall2. Bonding Mortar3. EPS Board4. Siding
Insulating EPS Board and Water Protection (WP) Protection Mortar
Performance Requirements for WP Mortar(Beijing standard)
28 d of standard curing then tested for 24 h ≤3.0Water permeability (24 h) (ml)
28 d of standard curingno crackingCracking resistance
28 d of standard curing≤3.0Compressive/flexural strength ratio
After 28 d of standard curing then in water at 20±1℃ for 24 h
≤100024 h water absorption, g/m2
≥ 2Operational time (h)
After 14 d of standard curing then 25 freezing-thawing cycles
≥ 0.10 or EPS destroyed
Freezing-thawing resistance
After 14 d of standard curing then in water at 20±2℃ for 48 h
≥ 0.10 or EPS destroyed
Water resistance
14 d of standard curing≥0.10 or EPS destroyed
standard curing Bonding strengthwith EPS board (MPa)
After 14 d of standard curing, then 25 freezing-thawing cycle
≥ 0.50Freezing-thawing resistance
After 14 d of standard curing, then in water at 20±2℃ for 48 h
≥ 0.50Water resistance
After 7 d of standard curing, then in an oven at 70±2℃ for 24 h and in room for 3 to 6 h
≥ 0.50Resistance to temperature change
14 d of standard curing≥0.70Standard curingBonding strengthwith cement mortar (MPa)
CURING AND TESTING CONDITIONSREQUIREMENTPERFORMANCE

38
Smart Self-Repairing Barrier
Landfill Liners and Covers
Mining Waste Liners and Covers
Hazardous Waste Containment Liners
Vertical Walls
Covers for Contaminated Sites
APPLICATIONS OF BARRIERS IN GEOENVIRONMENTAL ENGINEERING
Clayey BarriersGeomembranesGeosynthetic/Clay CompositesBentonite Based BarriersHydraulic Cement Based Barriers (Portland Cement Pastes, Soil Cement, Lime-PozzolanBlends, Lime-Slag Blends, Concrete, Polymer Concrete) AsphaltChemical Barriers (silicates, lignosulfites, phenoplasts, aminoplasts, etc..)
COMMON ENGINEERING BARRIERS
39
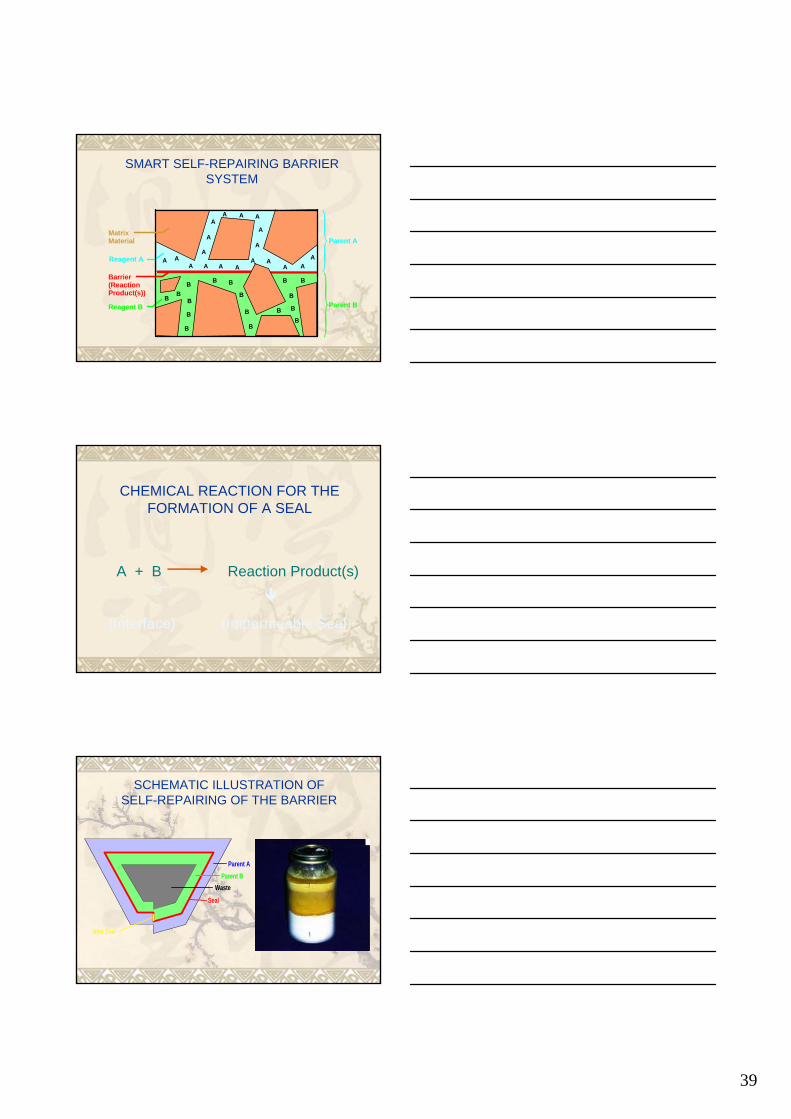
SMART SELF-REPAIRING BARRIER SYSTEM
B
MatrixMaterial
Reagent A
Reagent B
Barrier(Reaction Product(s))
A
B
A AA A
A
A
AA A A
A
A
AA A
A AA
B
B
B
B
B B
B
B
B
B B
B
BB
B
Parent A
Parent B
CHEMICAL REACTION FOR THE FORMATION OF A SEAL
A + B Reaction Product(s)
(Interface) (Impermeable Seal)
SCHEMATIC ILLUSTRATION OF SELF-REPAIRING OF THE BARRIER
Parent AParent B
Waste
Seal
New Seal
40
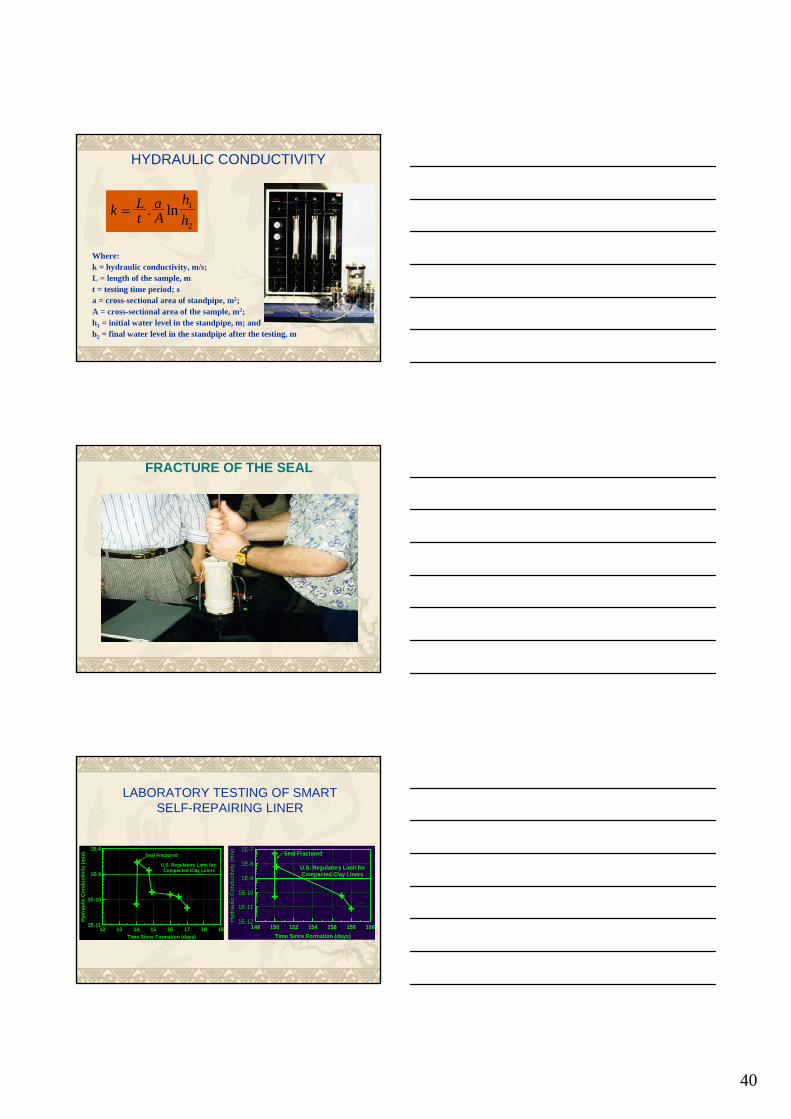
HYDRAULIC CONDUCTIVITY
k Lt
aA
hh
= . ln 1
2
Where:k = hydraulic conductivity, m/s;L = length of the sample, mt = testing time period; sa = cross-sectional area of standpipe, m2;A = cross-sectional area of the sample, m2;h1 = initial water level in the standpipe, m; andh2 = final water level in the standpipe after the testing, m
FRACTURE OF THE SEAL
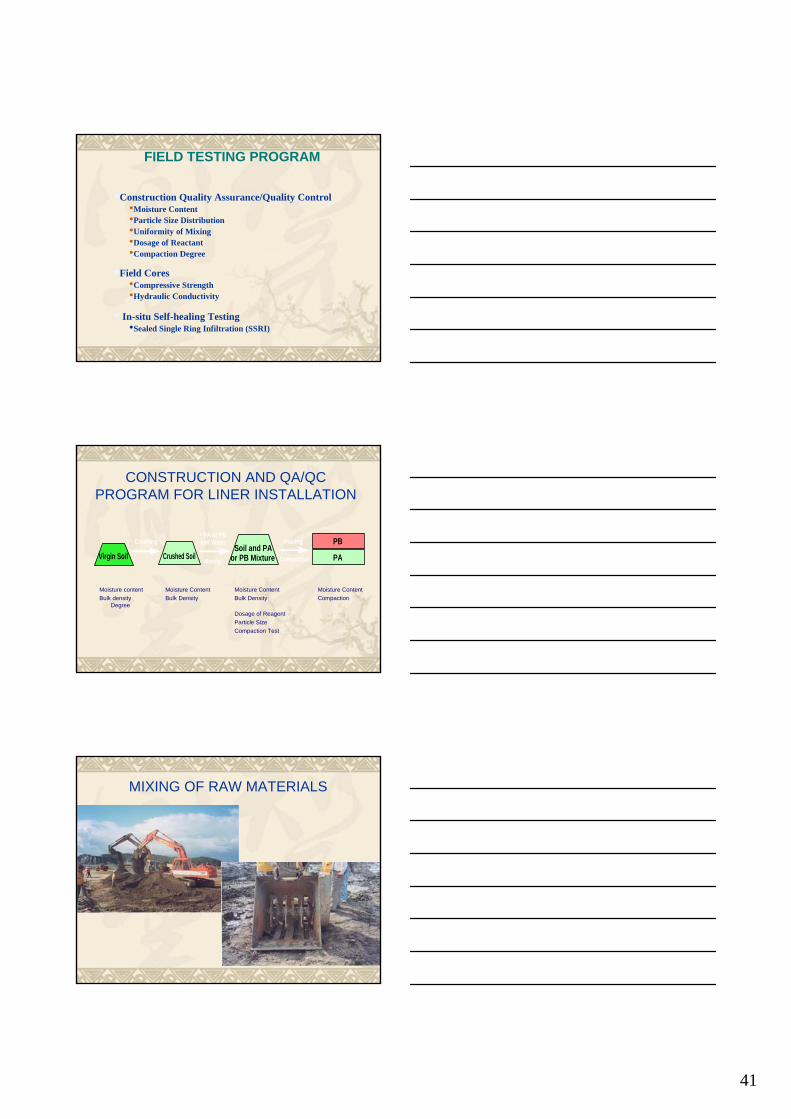
LABORATORY TESTING OF SMART SELF-REPAIRING LINER
12 13 14 15 16 17 18 19Time Since Formation (days)
1E-11
1E-10
1E-9
1E-8
Hydr
aulic
Con
duct
ivity
(m/s
) Seal Fractured
U.S. Regulatory Limit for Compacted Clay Liners
148 150 152 154 156 158 160Time Since Formation (days)
1E-12
1E-11
1E-10
1E-9
1E-8
1E-7
Hyd
raul
ic C
ondu
ctiv
ity (m
/s)
Seal Fractured
U.S. Regulatory Limit for Compacted Clay Liners
41
Construction Quality Assurance/Quality Control•Moisture Content•Particle Size Distribution•Uniformity of Mixing•Dosage of Reactant•Compaction Degree
Field Cores•Compressive Strength•Hydraulic Conductivity
In-situ Self-healing Testing•Sealed Single Ring Infiltration (SSRI)
FIELD TESTING PROGRAM
CONSTRUCTION AND QA/QC PROGRAM FOR LINER INSTALLATION
Moisture content Moisture Content Moisture Content Moisture ContentBulk density Bulk Density Bulk Density Compaction
DegreeDosage of ReagentParticle SizeCompaction Test
Crashing+ PA or PB and Water
Mixing PA
PBPlacing
Compaction.
.
Virgin Soil Soil and PAor PB MixtureCrushed Soil
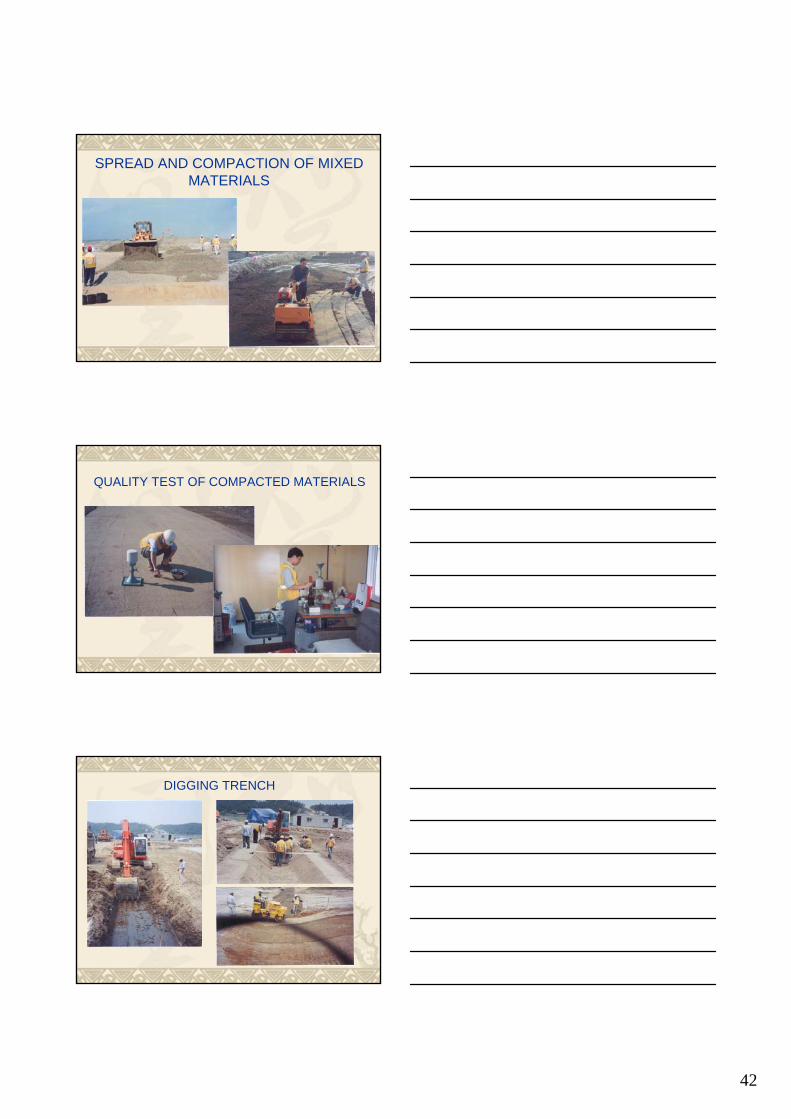
MIXING OF RAW MATERIALS
42
SPREAD AND COMPACTION OF MIXED MATERIALS
QUALITY TEST OF COMPACTED MATERIALS
DIGGING TRENCH
43
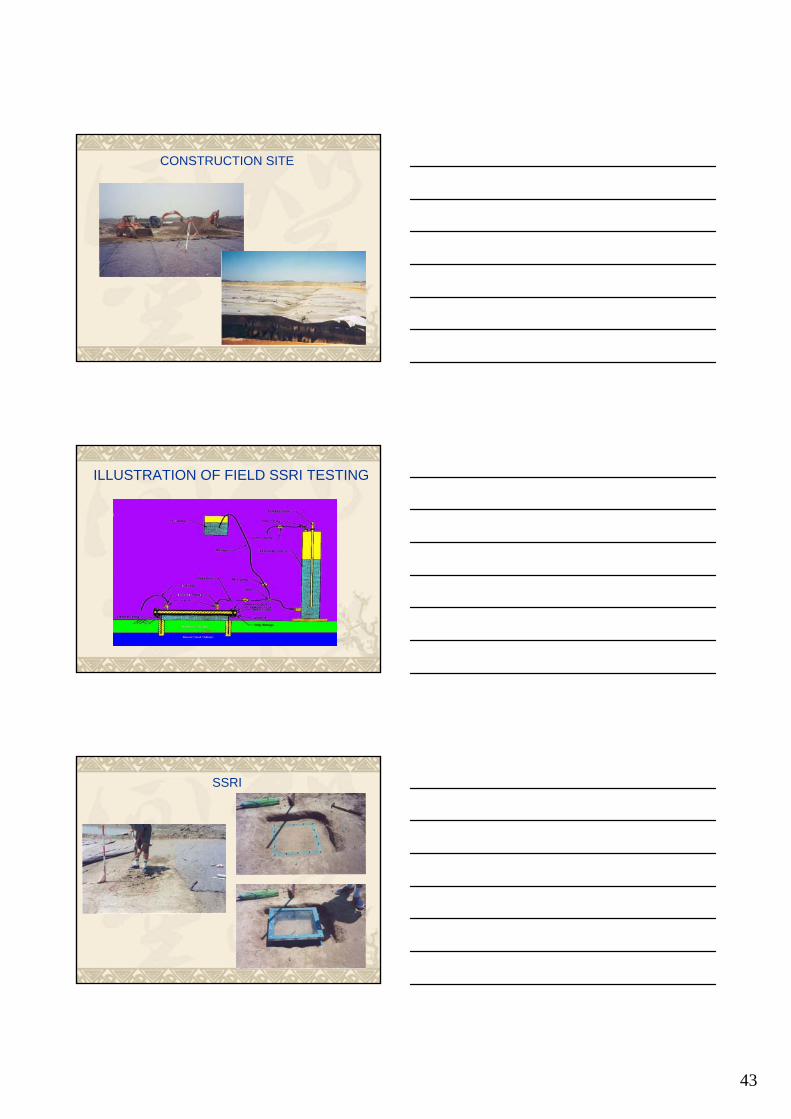
CONSTRUCTION SITE
ILLUSTRATION OF FIELD SSRI TESTING
SSRI
44
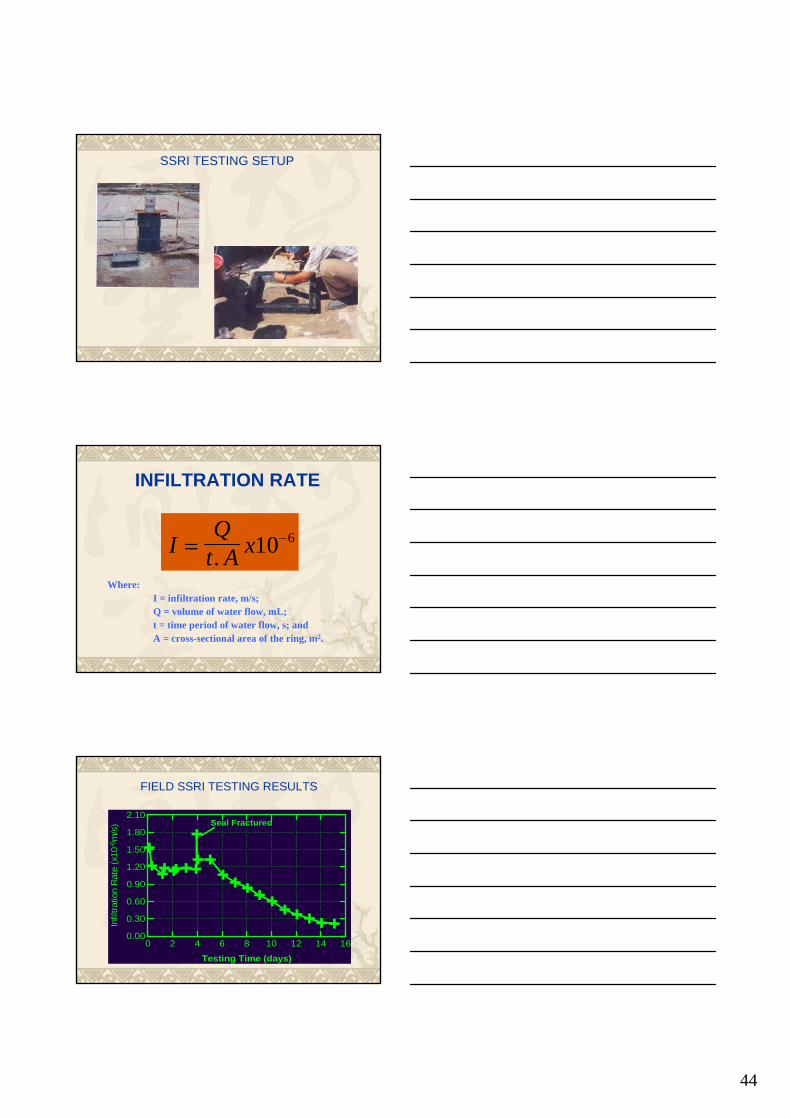
SSRI TESTING SETUP
INFILTRATION RATE
Where:I = infiltration rate, m/s;Q = volume of water flow, mL; t = time period of water flow, s; andA = cross-sectional area of the ring, m2.
IQ
t A x= −
. 10 6
FIELD SSRI TESTING RESULTS
0 2 4 6 8 10 12 14 16Testing Time (days)
0.00
0.30
0.60
0.90
1.20
1.50
1.80
2.10
Infil
tratio
n R
ate
(x10
-6m
/s) Seal Fractured
45
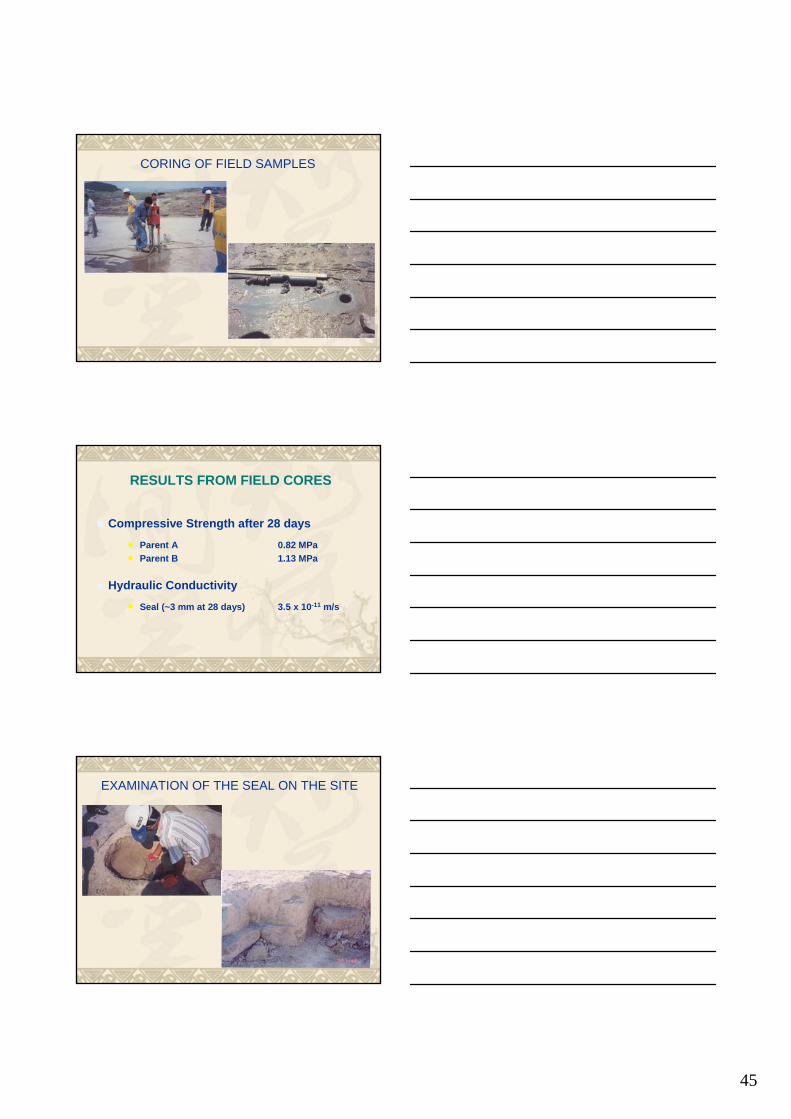
CORING OF FIELD SAMPLES
Compressive Strength after 28 days
n Parent A 0.82 MPan Parent B 1.13 MPa
Hydraulic Conductivity
n Seal (~3 mm at 28 days) 3.5 x 10⁻¹¹ m/s
RESULTS FROM FIELD CORES
EXAMINATION OF THE SEAL ON THE SITE

46
THANK YOU!Questions?