Embed Size (px)
Citation preview

Advances
Cash America International, Inc.
2007 Annual Report

CASh AmeRiCA inTeRnATionAl, inC. is a provider of specialty financial services to individuals in the United States, with 942 total locations. Cash America is the largest provider of secured non-recourse loans to individuals, commonly referred to as pawn loans, through 499 locations in 22 states under the brand names Cash America Pawn and SuperPawn. The Company also offers short-term cash advances in many of its locations, including 304 locations that offer this service under the brand names Cash America Payday Advance and Cashland. Short-term cash advances are also offered over the internet to customers in 32 states in the United States and the United Kingdom at www.cashnetusa.com and www.quickquid.co.uk, respectively. in addition, check cashing services are provided through its 139 franchised and Company-owned “mr. Payroll” check cashing centers. Cash America common shares are listed on the new York Stock exchange under the symbol “CSh.”
CoRe PURPoSe
We provide financial solutions that
help ordinary people meet their needs
and pursue their dreams!
CoRe VAlUeS
We are family.
We strive for excellence.
We bring honor to our team.
We have fun.
We act with a servant’s heart.
mankind has never really been satisfied – we’ve always pushed the limits of knowledge, of achievement, of
prosperity. With an innate need to advance and evolve, we press toward the sleekest, fastest and most efficient
solution to any challenge – with leaders emerging as those who adapt most effectively.
Cash America is that kind of leader. in 23 years, we’ve taken an industry married to images of dark, seedy street
corners and turned it on its head. We’ve developed the anti-pawnshop – a neighborhood financial center that offers
low-cost alternatives to customers who use traditional banks and those who do not. We’ve also built a corporate
culture that helps our employees better serve our customers while advancing their own careers. The best part is
that we’ve done it all while offering shareholders a sound, stable investment with a progressively high return.
now that’s advancement.
As you’ll see on our cover, currency itself has advanced right along with technology. From metal coins to banknotes
to electronic transfers, forms of money have evolved with our lifestyles. And Cash America has met and exceeded
customer needs through them all. in the next few pages, you’ll find more of the Cash America story – a story of
aggressively pursuing advances for our customers, employees and shareholders.
Advances
Financial Highlights
Cash America International, Inc. 1
$0
$200
$400
$600
$800
$1,000
Total Revenue from Continuing Operations(in millions)
$0
$30
$60
$90
$120
$150
Income from Operations(in millions)
$0
$10
$20
$30
$40
$50
$60
$70
$80
After-Tax Income from Continuing Operations(in millions)
$0$10$20$30$40$50$60$70$80$90
$100$110$120$130
03 04 05 06 07 03 04 05 06 07 03 04 05 06 07
03 04 05 06 07 03 04 05 06 07 03 04 05 06 07
Pre-Tax Income from Continuing Operations(in millions)
0%
2%
4%
6%
8%
10%
Return on AssetsContinuing Operations
0%
5%
10%
15%
20%
Return on EquityContinuing Operations
$0
$30
$60
$90
$120
$150
03 04 05 06 07
Income from Continuing Operations(in millions)
$0
$500
$1,000
$1,500
$2,000
$2,500
03 04 05 06 07
Total Cash Advances Written(in millions, as of December 31)
$0.0
$0.50
$1.00
$1.50
$2.00
$2.50
$3.00
03 04 05 06 07
Earnings Per Share from Continuing Operations
$0
$100
$200
$300
$400
$500
$600
03 04 05 06 07
Total Pawn Loans Writtenand Renewed(in millions, as of December 31)
0
200
400
600
800
1000
03 04 05 06 07
Total Lending Locations(as of December 31)
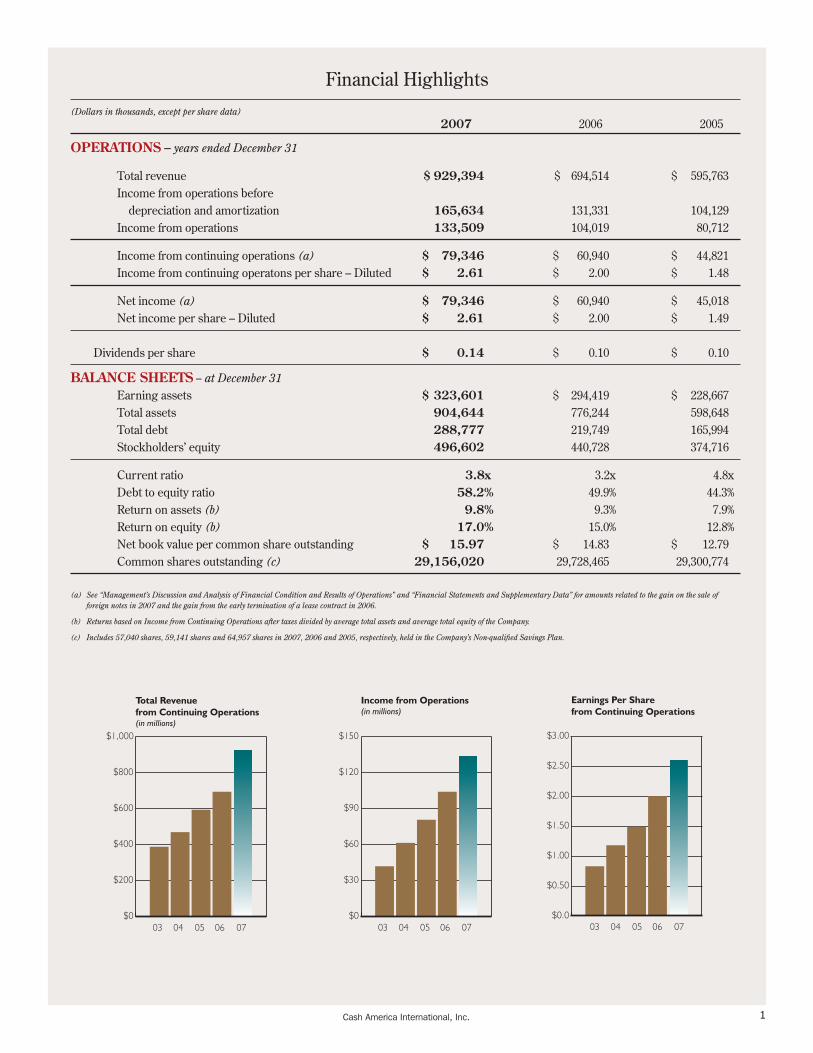
(Dollars in thousands, except per share data) 2007 2006 2005
OPERATIONS – years ended December 31 Total revenue $ 929,394 $ 694,514 $ 595,763 Income from operations before depreciation and amortization 165,634 131,331 104,129 Income from operations 133,509 104,019 80,712 Income from continuing operations (a) $ 79,346 $ 60,940 $ 44,821 Income from continuing operatons per share – Diluted $ 2.61 $ 2.00 $ 1.48 Net income (a) $ 79,346 $ 60,940 $ 45,018 Net income per share – Diluted $ 2.61 $ 2.00 $ 1.49 Dividends per share $ 0.14 $ 0.10 $ 0.10 BAlANcE ShEETS -- at December 31 Earning assets $ 323,601 $ 294,419 $ 228,667 Total assets 904,644 776,244 598,648 Total debt 288,777 219,749 165,994 Stockholders’ equity 496,602 440,728 374,716 Current ratio 3.8x 3.2x 4.8x Debt to equity ratio 58.2 % 49.9% 44.3% Return on assets (b) 9.8 % 9.3% 7.9% Return on equity (b) 17.0 % 15.0% 12.8% Net book value per common share outstanding $ 15.97 $ 14.83 $ 12.79 Common shares outstanding (c) 29,156,020 29,728,465 29,300,774
(a) See “Management’s Discussion and Analysis of Financial Condition and Results of Operations” and “Financial Statements and Supplementary Data” for amounts related to the gain on the sale of foreign notes in 2007 and the gain from the early termination of a lease contract in 2006.
(b) Returns based on Income from Continuing Operations after taxes divided by average total assets and average total equity of the Company.
(c) Includes 57,040 shares, 59,141 shares and 64,957 shares in 2007, 2006 and 2005, respectively, held in the Company’s Non-qualified Savings Plan.
With last year’s annual shareholders message heralding the doubling of our share price in 2006, I knew I was flirting with the proverbial Sports Illustrated jinx – a well-documented phenomenon where athletes appearing in a featured cover article during a breakout year often find themselves struggling with performance the following year. It’s as if the notoriety itself evoked some mystical power that disrupted their pitching motion, running stride, shooting touch, slap shot or putting stroke. In fact, the jinx is legendary enough that I would guess some athletes might even reject offers to appear on the cover.
I, however, chose to be a bit more brazen. After successfully facing a number of significant challenges in 2005 and 2006, I was justifiably proud of the record-setting performance your Company posted in 2006 and thrilled that our shareholders enjoyed the reward of significant price appreciation. I felt a little celebration was in order. I was also highly confident that our 2007 business plan would yield another record year of revenue and earnings. It seemed safe to toy with the jinx – unlike the cover-shy athlete, I was not worried about some mystical power.
Oh, well.
Mystical is now the term I apply to the mid-year meltdown of the subprime mortgage business. That debacle produced a downdraft broad enough to damage the market capitalization of the entire financial services sector – particularly those companies whose business description includes a combination of the words “subprime” and “lending.” As massive write-offs by mortgage companies surfaced in the late spring, investors began trimming their exposure to financial stocks. Additional bad news stressed the delicate infrastructure of derivative instruments underpinning the mortgage market to the point where liquidity contracted and some of the world’s largest financial institutions were forced to record multibillion-dollar losses and seek capital from rather unusual places. This evidently frightened the investment community so much that it grabbed the big broom and swept all the financial stocks into a time-out corner. We were all painted with a very wide swath of gloom. When I say painted, I am not thinking of a large brush or roller – I am thinking of an industrial-grade spray gun.
The specific coat of latex applied to Cash America over the past 12 months has eroded approximately 30% of shareholder value despite achieving the records we had expected. And while we fared better than many other financial stocks,
we remain perplexed by the investment market’s lack of surgical discretion in these short-term windows of economic turmoil. We would like to believe the market can understand the significant fundamental differences separating our business model from other financials like Countrywide, Citi, Merrill Lynch or Capital One. We would like to believe our shareholders win or lose on the performance of their management team, not by being tethered to a broad basket of financial stocks that might drag us off the cliff with the poor
performance of a notable few.
I recognize that our business model shares an important fundamental characteristic with subprime mortgage, auto and credit card providers. We all extend credit to subprime borrowers. Different players target different spots on the subprime scale, with our target generally falling below a 650 FICO score. I also recognize our spot on the scale creates extra anxiety for the buy-side analyst who may only be a casual student of subprime lending. Without a deeper dive into the characteristics of our particular model, one may intuitively conclude that loaning money to credit-strapped consumers in times of economic uncertainty may be more risky than common sense allows.
Closer scrutiny, however, will uncover the fact that extending credit to subprime borrowers is about all we have in common with our distant cousins in other forms of subprime lending.
First, our secured lending model (Pawn) enjoys the benefit of easily accessible collateral with a ready market for liquidation. Unlike the mortgage lenders of the past few years, we have
maintained discipline in our loan-to-value ratios, consistently managing our business to produce 35% to 40% profit margins on the disposition of forfeited collateral. We are not loaning 110% of value in hopes that price appreciation covers the potential shortfall of collateral value at the time the loan becomes due. We are loaning intelligently, and with our most prevalent item of collateral – gold jewelry – we even hedge our risk to assure that we will generate positive returns on disposition.
Next, our unsecured lending model (Cash Advance) is structured on the simple premise of providing very small loans of very short duration to people we fully expect will repay us. We do not relax documentation
requirements, and we verify data we believe is most critical. We also continually update our credit models for managing the inherent risk of default with first-time customers while remaining committed to managing repeat customers in a way that mitigates the risk of those customers falling into an extended cycle of debt. If loss rates escalate or we become
Cash America International, Inc.2
03 04 05 06 07
Quarterly Earnings Per Share Continuing Operations
$0.0
$0.20
$0.40
$0.60
$0.80
$1.00
Q-1 Q-2 Q-3 Q-4
To my fellow shareholders,

I will also argue that your Company’s operating performance in 2007 is another clearly discernable point of differentiation from other subprime lenders. Growth of both revenues and earnings for your Company exceeded 30% for the year, which coincidently is about the same percentage our share price declined in 2007 – I’m not sure I understand that math. Additionally, we managed our secured loan portfolio to produce a gross margin of 37.8% on the sale of unredeemed collateral, and our unsecured loan portfolio in a manner to report improving loss trends by segment in the latter part of the year – not exactly the kind of performance that warrants association with companies reporting billion-dollar losses. Most importantly, I believe we have silenced the naysayers who had predicted our demise at the hands of our Internet lending model – a business we entered in the fall of 2006 with the acquisition of CashNetUSA. The market penetration, revenue growth and improving marginal profitability of the online channel in 2007 have now clearly validated our decision to divert capital away from storefront expansion in favor of the complementary online channel.
At this point, I would like to thank our many long-term shareholders for their indulgence in reading my recitation of the attractive fundamentals of our business model that they know so well. I have done so in hopes of capturing the attention of prospective shareholders reading this message. Cash America is one stock in the financial sector that deserves a closer look.
For all shareholders, either existing or prospective, I will leave you with management’s commitment to continue moving forward with both diligence and innovation. We will not abandon the principles of sound underwriting, and we will not ignore the warning signs of changes in the macroeconomic market. And we will continue to search for new and innovative products and services that may be capable of transforming our business models in ways that provide greater value to our customers and less exposure to legislative or regulatory disruption. We are convinced the financial services market for the subprime consumer will look different in 10 years than it does today, and we are
determined to lead the evolution.
Thanks to our existing shareholders for your faith and support, and thanks to prospective shareholders for your consideration of Cash America as a beacon of opportunity in the midst of a currently stormy investment sector.
And for the record – damn that Sports Illustrated jinx!
Daniel R. FeehanChief Executive Officer and PresidentFebruary 2008
concerned about the economic outlook for our customers, we will tighten our standards and sacrifice loan volume in exchange for loan quality. We implemented this exact strategy in selected markets during the third and fourth quarters of 2007.
Perhaps the most overlooked benefit of our model is the small size and short duration of the loan obligation. Our experience over the past 23 years has led us to unequivocally conclude that the vast majority of our customers fully intend to repay their loan in accordance with the terms of the debt; this intent represents the willingness to repay. Our experience has also taught us that the ability to repay is frequently impacted by circumstances borrowers cannot necessarily foresee when committing to the repayment schedule. Short-term disruptions of income – layoffs, less overtime, job changes, construction slowdowns, etc. – and unexpected expenses – medical bills, car repairs, rising gasoline prices, etc. – are the primary culprits occasionally placing customers’ willingness to repay in conflict with their ability to repay. The majority of our pawn loans are written for a 30-day term and average approximately $100, and the majority of our short-term cash advances are written for a 14-day term and average approximately $400. The chance of circumstances changing for our borrowers over a 14- to 30-day horizon are infinitely smaller than the chance of circumstances changing for a subprime borrower over the term of a 30-year mortgage, 60-month auto loan or an open-ended credit card line. Additionally, the size of our customers’ obligation to us is far less imposing when customers find themselves in a pinch. Subprime borrowers are much more likely to feel overwhelmed enough to give up on a $100,000 mortgage, a $10,000 auto loan or a $3,000 credit card debt than they might on an obligation of $500 – particularly when they want to protect this short-term source of credit as their favored and most convenient alternative for meeting unexpected or emergency cash needs.
In fairness, I should also note that our business, together with other subprime lenders, bears the risk of being targeted by certain crusading social groups. I am pleased to report, however, that several recent academic studies have concluded that certain microfinance products are beneficial to customers and provide them a valuable credit alternative. For example, a recent report prepared by staff members of the Federal Reserve Bank of New York concluded that consumers in areas without access to payday loans experience increased credit problems, such as higher bounced check fees, more problems with debt collectors and other lenders, increases in bankruptcies and greater overall financial stress. Despite these studies, our cash advance model is more vulnerable to the travails of demagogue politicians than many other forms of subprime lending, including our own pawn business. This is a risk factor that must be considered when assessing the valuable benefits of our cash advance model.
Cash America International, Inc. 3
$0
$200
$400
$600
$800
$1,000
Total Revenue from Continuing Operations(in millions)
$0
$30
$60
$90
$120
$150
Income from Operations(in millions)
$0
$10
$20
$30
$40
$50
$60
$70
$80
After-Tax Income from Continuing Operations(in millions)
$0$10$20$30$40$50$60$70$80$90
$100$110$120$130
03 04 05 06 07 03 04 05 06 07 03 04 05 06 07
03 04 05 06 07 03 04 05 06 07 03 04 05 06 07
Pre-Tax Income from Continuing Operations(in millions)
0%
2%
4%
6%
8%
10%
Return on AssetsContinuing Operations
0%
5%
10%
15%
20%
Return on EquityContinuing Operations
From smoke signals to rotary phones to PDA phones, man continues to seek instantaneous communication. We’ve advanced from waiting months to receive information to accessing it within seconds. Similarly, Cash America’s products and services allow customers quick solutions to unexpected financial challenges.
Advances in perception and serviceLong past are the days when a cigar-smoking pawnbroker
arbitrarily assigned collateral value. From its inception in
1984, Cash America has boldly pioneered a new image
of the pawn industry. As the first publicly owned national
pawn chain, we have developed a high-
end, customer-focused pawn business:
bright, well-lit stores staffed with
knowledgeable, friendly associates who
access a comprehensive database to
make equitable, consistent assessments
of collateral to serve our customers.
The pawn loan process is simple.
A customer brings in an item of personal property in
support of a short-term loan to meet an immediate cash
need. Within minutes, he receives a loan based on Cash
America’s expected resale value of that property. At any
time during the loan period, the customer has the choice
of returning and paying the loan balance plus fees and
service charges to redeem the items, or electing to have
Cash America keep the property in complete satisfaction
of the customer’s obligation – all with
no negative effects on the customer’s
credit. The typical pawn loan is small –
usually less than $100.
About 70 percent of customers redeem their property.
But in the cases of those who don’t, retail customers
are offered attractively priced sale items in our stores.
In fact, Cash America pawn stores offer bright, friendly
environments for finding bargains on everything from
musical instruments to jewelry and electronics.
Since customers have come to rely on us as a
neighborhood financial resource, we’ve worked to give
them access to a variety of financial tools. Today we
offer cash advances and check cashing services in many
pawn locations, as well as money
orders, money transfers, stored value
cards, insurance and more. Not all
are available in every location, but we
continue to make advances according
to customer demand.
We’re proud to say that the impetus for
our existence – our traditional pawn
business – has become a viable alternative to traditional
financial institutions for millions of hardworking
Americans. We’ve come a long way in advancing the way
our industry functions, and the way it’s perceived by all of
our audiences – customers, regulators, law enforcement,
co-workers, the media and investors. The pawn industry
isn’t just growing, it’s growing up – by broadening service
lines and meeting the needs of customers.
Cash America International, Inc.
Communication
4
3% Check Cashing/Other
Composition of Net Revenue, Net of Loan Loss Expense
(12 months ended December 31, 2007)
Pawn Lending Collateral/Merchandise Mix(as of December 31, 2007)
Composition of Net Revenue
Pawn Lending Collateral/Merchandise Mix
38% Cash Advance Fees, Net of Loan Losses
31% Pawn Service Charges
28% Profit on Merchandise
Advances

“Experts” said the rise of television would kill radio – but radio refused to die, advancing to fill an unanticipated niche. The ways we receive information continue to evolve according to our ever-changing lifestyle needs. Those same needs have paved the way for Cash America to serve an increasingly informed and diverse customer base.
Cash America International, Inc. 5
Entertainment
Advances
Entertainment
Advances
Cash America International, Inc.6
Advances in convenienceCars break down. Unexpected bills arrive. Children
need medical care. Whatever the reason, Cash America
customers need money, and they need it now. Easy-to-use
and understand, fast and convenient solutions are what
our customers seek. Cash America has advanced its loan
products to include both traditional pawn loans and cash
advances – also called payday loans – because not all
customers choose a traditional pawn loan to satisfy
their needs.
Like a pawn loan, a cash advance is quick and easy. A
customer chooses this convenient solution by bringing in
paperwork such as a current pay stub, bank statements
and utility bills, and applies for a short-term loan. The
customer signs a promissory note and related documents
and, in many cases, leaves a personal check for the loan
amount plus fees. The customer has the option of paying
off the loan in cash or allowing Cash America to deposit
the check or electronically process the payment at the end
of the loan term, which is oriented to the customer’s future
pay date – usually about two weeks.
Unlike a pawn loan, a cash advance is based on the
Company’s assessment of a customer’s personal credit,
with no collateral, and is typically larger than the average
pawn loan. A customer with an active checking account
who qualifies under our applicable internally developed
proprietary scoring models has access to this
option for quickly getting the funds needed.
In 2007, Cash America extended over $2 billion in cash
advances – up from $1.2 billion in 2006. As with pawn
loans, Cash America leads the way in advancing the
industry standard of “fair practices” in an effort to make
the cash advance product as equitable and beneficial for
our customers as possible.
To further advance customer convenience, Cash America
began offering cash advances over the Internet in late
2006 through its wholly owned subsidiary CashNetUSA,
a leading provider of online cash advances. Through
CashNetUSA, customers in 32 states can arrange cash
advances via the Internet. It’s another quick and easy tool
to access funds – customers submit an online application
and are typically notified of approval within minutes.
Funds are electronically deposited into the customer’s
bank account, eliminating the need to travel to
a lending location.
The first “horseless carriages” outperformed their equine contenders in terms of speed – and man didn’t stop there. Through the years, we’ve pressed for advances in sleek, swift ways to reach our destinations. Destinations are paramount to Cash America customers, and our options ensure that they can find the right product to get them there. Vehicles
Advances
COM
MUNITY FINANCIAL SERVICES ASSOCIATION OF AMERICA
A Community of Responsible Lenders
COM
MUNITY FINANCIAL SERVICES ASSOCIATION OF AMERICA
A Community of Responsible LendersMember 2007 MEMBER
2007

Cash America International, Inc. 7

Primitive tools got the job done, but tediously, and with a healthy dose of elbow grease. With the advent of electricity and computer technology, tools took on a whole new life of efficiency. The tools of our industry have changed as well, resulting in unparalleled convenience for Cash America customers.
Cash America International, Inc.8
Tools
Advances
With its proprietary software and delivery platform,
CashNetUSA has served almost 600,000 customers since its
inception in 2004. As of year-end 2007, online cash advances
represented $74 million in gross loan balances, and in
July of 2007, Cash America began offering online service
to customers in the United Kingdom with the launch of
QuickQuid – demonstrating the ability to advance into new
markets outside the United States.
The expansion of online services is just another example
of our effort to use technology and innovations to provide
solutions for our customers.
We never sit still – we constantly
evaluate our performance and
adjust to meet the customer’s need
to conveniently and responsibly
borrow money.

Advances in customer diversityThe teacher, the medical technician, the student and the
musician are all potential Cash America customers. That
may not surprise you, but what may is the fact that these
customers are armed with facts and understand their
alternatives when they choose a Cash America
loan product.
They know that Cash America is a community resource
that provides a financial bridge to their next payday – a
short-term solution to an immediate problem. They also
care about maintaining good credit scores and other
indicators of financial responsibility.
Traditional lending institutions have all but ignored many
of our customers, leaving them with limited access to
financial options. In fact, data indicate that up to
10 percent of American families are not
served by banks. But many customers are
actively choosing Cash America over
traditional banks or credit cards because of
our ability to provide a lower-cost alternative in
a time of need. As the public becomes more
educated about the favorable cost comparison
of Cash America services, we’re able
to serve a larger and more
diverse clientele.
Offering small, short-term loans gives customers a lower-
cost option to high penalties or late fees because of the
inability to get cash when they need it. These advances are
preferable to increasingly high bank fees, NSF charges, late
fees on credit cards, and penalty charges and fees on
delinquent accounts from utility companies or mortgage
lenders. Our loans range from a few weeks to a few months,
giving customers the ability to tailor financial solutions that
are right for them.
And they know it. Today’s Cash America customer has
advanced to a savvy guardian of the household budget who
wants the fastest, lowest-cost option when an unexpected
need for cash arises. Our customers keep coming back
because they know
we’re convenient and
reliable, and that we
constantly adapt to best
understand and meet
their needs.
Cash America International, Inc. 9
Orville and Wilbur had no idea what they were pioneering with that first successful flying machine. Aeronautical engineers have continued to advance their technology, forging a path through the solar system into worlds unknown. In that spirit, Cash America forges ahead to seek new markets and opportunities for growth, benefiting customers, employees and shareholders.
Composition of Net Revenue, Net of Loan Loss Expense
(12 months ended December 31, 2007)
Pawn Lending Collateral/Merchandise Mix(as of December 31, 2007)
Composition of Net Revenue
Pawn Lending Collateral/Merchandise Mix
62% Jewelry15% Electronics
13% Musical Instruments/Other
10% Tools
$0
$30
$60
$90
$120
$150
03 04 05 06 07
Income from Continuing Operations(in millions)
$0
$500
$1,000
$1,500
$2,000
$2,500
03 04 05 06 07
Total Cash Advances Written(in millions, as of December 31)
$0.0
$0.50
$1.00
$1.50
$2.00
$2.50
$3.00
03 04 05 06 07
Earnings Per Share from Continuing Operations
$0
$100
$200
$300
$400
$500
$600
03 04 05 06 07
Total Pawn Loans Writtenand Renewed(in millions, as of December 31)
0
200
400
600
800
1000
03 04 05 06 07
Total Lending Locations(as of December 31)
$0
$30
$60
$90
$120
$150
03 04 05 06 07
Income from Continuing Operations(in millions)
$0
$500
$1,000
$1,500
$2,000
$2,500
03 04 05 06 07
Total Cash Advances Written(in millions, as of December 31)
$0.0
$0.50
$1.00
$1.50
$2.00
$2.50
$3.00
03 04 05 06 07
Earnings Per Share from Continuing Operations
$0
$100
$200
$300
$400
$500
$600
03 04 05 06 07
Total Pawn Loans Writtenand Renewed(in millions, as of December 31)
0
200
400
600
800
1000
03 04 05 06 07
Total Lending Locations(as of December 31)
Transportation
Advances
Advances in employee developmentAt Cash America, we’re a family. We don’t want people
to work for us and then leave to advance their careers
somewhere else. Instead, we want to foster leadership and
a desire for success so that our employees can progress
within our company.
Our goal is to attract talented, enthusiastic and professional
people – and once we’ve hired them, we do everything
in our power to keep them. In 2006, we implemented a
learning management system to help store employees
foster the skills they need to further their Cash America
careers. The program is expected to fully launch by the
end of 2008.
We’ve also pioneered the innovative Cash America
management training program – comprehensive
preparation that includes in-class instruction, partnerships
with mentor managers and education in basic appraisal.
All of our operations-level management co-workers
have graduated from our in-house management training
program, and many members of our operations team
participate in Cash America University. More than
450 store managers have taken part in this weeklong
educational and motivational program since it launched in
2004. By giving store managers a chance to interact with
each other and with field support personnel, Cash America
University keeps our mission and values top-of-mind.
And those who work in our Field Support Center aren’t left
out of the process. Many field support co-workers spend
part of their orientation working in Cash America pawn
locations, ensuring that both customer and co-worker
needs are at the forefront of all Company strategy and
development.
Opportunities for career growth are plentiful – we
promote from within whenever possible – and we offer
a compensation program that makes it possible to earn
a great living. We continue to listen to our employees,
evolving our benefits to make Cash America a great place
to foster long-term careers.
We also want to give our employees the most advanced
tools for achieving their best. We’re committed to the
ongoing development and expansion of our industry-
leading point-of-sale and management information
systems, advancing to a more customer-centric platform
that enhances information flow and keeps our operations
quick and efficient. These changes will make it possible
for employees to add products and services with ease, and
will result in more user-friendly transactions at every level.
Advances to our systems will debut throughout 2008
and 2009.
Pharaohs looked for simple brawn and endurance from pyramid builders, but today’s employers need something more. Modern workers have advanced to offer insight and adaptability in our global workplace, and today’s Cash America employees are at the top of their field, ensuring prompt and professional customer service at every point of contact. Workforces
Advances
Cash America International, Inc.10

Cash America International, Inc. 11

Cash America International, Inc.12

Advances in profitsOur passion for pressing forward and advancing every
level of customer and employee experience reaps
substantial rewards for shareholders. We remain pioneers
in a dynamic, quickly changing industry, and our numbers
tell a compelling story.
Total revenue for
the fiscal year ended
December 31, 2007,
was $929.4 million, up
34 percent from $694.5
million in 2006. Cash
America finished fiscal
year 2007 with a 30-
percent increase in net
income to $79.3 million ($2.61 per share) for the 12-month
period compared to $60.9 million ($2.00 per share) in fiscal
year 2006.
The 30-percent increase follows 36- and 28-percent
increases in fiscal years 2006 and 2005, respectively. Our
total assets have grown from $377.2 million in 2003 to
$904.6 million as of year-end 2007.
Revenue from the sale of merchandise increased 19
percent to $396.8 million in the year ended 2007 compared
to the year ended 2006. Finance and service charges
on pawn loans increased 8% to $161.0 million in 2007
compared to 2006, and cash advance fees increased 82% to
$355.2 million during the same period.
And we’re not finished. We believe that the opportunities
for sustained growth in revenue and earnings are
abundant, directly correlated to customer demand for
pawn loans and short-term cash advances, plus the ability
to sell value-priced merchandise from unredeemed
pawn loans.
History has shown that
the most successful
businesses advance
and evolve to give
people more effective
solutions. That’s Cash
America. We’re going
to keep pressing, keep
advancing, keep expanding. We’ll push the boundaries of
technology, and we’ll recruit dynamic people who want to
make a difference as part of our Company. We invite our
shareholders to be with us for the journey.
As far back as the wheel, technology has catalyzed economic growth – the world’s technological advancements in everything from medicine to computer science will continue to pave the way for tomorrow’s economy. And Cash America is poised to remain an innovator in that economy by continually evolving as an industry leader.
Technology
Advances
Cash America International, Inc. 13
Products and items depicted on this page and preceding pages are representative ofthe previously owned merchandise offered for resale by Cash America.The manufacturers of these items do not in any way sponsor or promote Cash America.
Cash America International, Inc.Cash America International, Inc.14 15
As of December 31 PAWN 2007 2006 2005Texas 199 195 181Florida 68 67 67Nevada 27 25 26Tennessee 22 21 22Louisiana 20 20 20Arizona 18 18 16Illinois 18 15 12 Georgia 17 17 17Missouri 17 16 16Oklahoma 15 15 15Indiana 13 13 13Kentucky 10 10 10North Carolina 10 10 10Alabama 9 9 9Utah 7 7 7Ohio 6 6 6South Carolina 6 6 6Alaska 5 5 –Colorado 5 5 5Washington 5 5 4California 1 1 1Nebraska 1 1 1Total Pawn 499 487 464CASH ADVANCEOhio 139 137 135Texas 54 54 55California 33 37 35Indiana 32 32 33Kentucky 16 16 16Michigan 12 12 12Illinois 18 7 – Total Cash Advance 304 295 286TOTAL LENDING LOCATIONS 803 782 750
lENDING lOcATIONS
Ft. Wayne
Cincinnati
Pensacola
Winston-Salem
Alaska
Anchorage
Hawaii
Omaha
United Kingdom
Storefront and Internet Lending
Internet Lending Only
Storefront Lending Only
No Lending Activity
Santa Barbara
Cash America Market CoverageCash America Pawn, SuperPawn, CashNetUSA, Cashland and Cash America Payday Advance locations and market coverage as of December 31, 2007
Cash America International, Inc.16
$0
$200
$400
$600
$800
$1,000
Total Revenue from Continuing Operations(in millions)
$0
$30
$60
$90
$120
$150
Income from Operations(in millions)
$0
$10
$20
$30
$40
$50
$60
$70
$80
After-Tax Income from Continuing Operations(in millions)
$0$10$20$30$40$50$60$70$80$90
$100$110$120$130
03 04 05 06 07 03 04 05 06 07 03 04 05 06 07
03 04 05 06 07 03 04 05 06 07 03 04 05 06 07
Pre-Tax Income from Continuing Operations(in millions)
0%
2%
4%
6%
8%
10%
Return on AssetsContinuing Operations
0%
5%
10%
15%
20%
Return on EquityContinuing Operations
$0
$200
$400
$600
$800
$1,000
Total Revenue from Continuing Operations(in millions)
$0
$30
$60
$90
$120
$150
Income from Operations(in millions)
$0
$10
$20
$30
$40
$50
$60
$70
$80
After-Tax Income from Continuing Operations(in millions)
$0$10$20$30$40$50$60$70$80$90
$100$110$120$130
03 04 05 06 07 03 04 05 06 07 03 04 05 06 07
03 04 05 06 07 03 04 05 06 07 03 04 05 06 07
Pre-Tax Income from Continuing Operations(in millions)
0%
2%
4%
6%
8%
10%
Return on AssetsContinuing Operations
0%
5%
10%
15%
20%
Return on EquityContinuing Operations
0
100
200
300
400
500
600
0
100
200
300
400
500
600
12/31/02 12/31/03 12/31/04 12/31/05 12/31/06 12/31/07
Total Return Performance
Inde
x V
alue
Cash America International, Inc.
S&P 500
Russell 2000
Cash America 2007 Peer Group*
$0
$200
$400
$600
$800
$1,000 Period EndingIndex 12/31/02 12/31/03 12/31/04 12/31/05 12/31/06 12/31/07Cash America International, Inc. 100.00 223.56 318.40 249.57 506.25 349.95S&P 500 100.00 128.68 142.69 149.70 173.34 182.86Russell 2000 100.00 147.25 174.24 182.18 215.64 212.26Cash America 2007 Peer Group* 100.00 250.78 492.12 331.22 551.22 423.62
* The Cash America 2007 Peer Group includes First Cash Financial Services, Inc., EZCORP, Inc., Dollar Financial Corp., QC Holdings, Inc., and Advance America, Cash Advance Centers, Inc. Source: SNL Financial LC, Charlottesville, VA
02 03 04 05 06
Pawn loans
0
50
100
150
200
250
300
Cash Advances
Pawn Loans
Cash Advance Storefront*
Cash Advance Internet*$0
$50
$100
$150
$200
$250
$300
$0
$200
$400
$600
$800
$1,000
Total Revenue from Continuing Operations(in millions)
03 04 05 06 07 03 04 05 06 07
Gross Lending Assets(in millions, as of December 31)
0
100
200
300
400
500
600
0
100
200
300
400
500
600
12/31/02 12/31/03 12/31/04 12/31/05 12/31/06 12/31/07
Total Return Performance
Inde
x V
alue
Cash America International, Inc.
S&P 500
Russell 2000
Cash America 2007 Peer Group*
$0
$200
$400
$600
$800
$1,000
*Gross Cash Advances includes amounts extended by third parties.

UNITED STATES
SECURITIES AND EXCHANGE COMMISSION Washington, D.C. 20549
FORM 10-K [X] ANNUAL REPORT PURSUANT TO SECTION 13 OR 15(d) OF THE SECURITIES EXCHANGE ACT OF 1934 For the fiscal year ended December 31, 2007
OR [ ] TRANSITION REPORT PURSUANT TO SECTION 13 OR 15(d) OF THE SECURITIES EXCHANGE ACT OF 1934 For the transition period from ____________________ to ____________________
Commission File Number 1-9733
(Exact name of registrant as specified in its charter) Texas 75-2018239
(State or other jurisdiction of (I.R.S. Employer incorporation or organization) Identification No.)
1600 West 7th Street Fort Worth, Texas 76102 – 2599
(Address of principal executive offices) (Zip Code)
Registrant’s telephone number, including area code: (817) 335-1100
Securities Registered Pursuant to Section 12(b) of the Act: Title of Each Class Name of Each Exchange on Which Registered
Common Stock, $.10 par value per share New York Stock Exchange Securities Registered Pursuant to Section 12(g) of the Act:
Common Stock Purchase Rights Indicate by check mark if the registrant is a well-known seasoned issuer, as defined in Rule 405 of the Securities Act. Yes No Indicate by check if the registrant is not required to file reports pursuant to Section 13 or Section 15(d) of the Act. Yes No Indicate by check mark whether the registrant (1) has filed all reports required to be filed by Section 13 or 15(d) of the Securities Exchange Act of 1934 during the preceding 12 months (or for such shorter period that the registrant was required to file such reports), and (2) has been subject to such filing requirements for the past 90 days. Yes No Indicate by check mark if disclosure of delinquent filers pursuant to Item 405 of Regulation S-K is not contained herein, and will not be contained, to the best of registrant’s knowledge, in definitive proxy or information statements incorporated by reference in Part III of this Form 10-K or any amendment to this Form 10-K. Indicate by check mark whether the registrant is a large accelerated filer, an accelerated filer, a non-accelerated filer, or a smaller reporting company. See definitions of “large accelerated filer,” “accelerated filer” and “small reporting company” in Rule 12b-2 of the Exchange Act. Large accelerated filer Accelerated filer Non-accelerated filer Smaller reporting company (Do not check if a smaller reporting company) Indicate by check mark whether the registrant is a shell company (as defined in Rule 12b-2 of the Act). Yes No The aggregate market value of 28,276,919 shares of the registrant’s Common Stock held by non-affiliates on June 30, 2007 was approximately $1,121,180,000. At February 14, 2008 there were 29,209,689 shares of the registrant’s Common Stock, $.10 par value, issued and outstanding.
DOCUMENTS INCORPORATED BY REFERENCE Portions of the Registrant’s definitive Proxy Statement pertaining to the 2008 Annual Meeting of Shareholders are incorporated herein by reference into PART III of this Form 10-K.

CASH AMERICA INTERNATIONAL, INC.
YEAR ENDED DECEMBER 31, 2007
INDEX TO FORM 10-K
PART I Item 1. Business .......................................................................................................................... 1 Item 1A. Risk Factors .................................................................................................................... 14 Item 1B. Unresolved Staff Comments........................................................................................... 17 Item 2. Properties ........................................................................................................................ 18 Item 3. Legal Proceedings........................................................................................................... 19 Item 4. Submission of Matters to a Vote of Security Holders .................................................... 20 PART II Item 5. Market for Registrant’s Common Equity, Related Stockholder Matters and Issuer
Purchases of Equity Securities ....................................................................................... 20 Item 6. Selected Financial Data .................................................................................................. 22 Item 7. Management’s Discussion and Analysis of Financial Condition and Results of
Operations....................................................................................................................... 23 Item 7A. Quantitative and Qualitative Disclosures about Market Risk......................................... 52 Item 8. Financial Statements and Supplementary Data .............................................................. 54
Item 9. Changes in and Disagreements with Accountants on Accounting and Financial Disclosure ....................................................................................................................... 91
Item 9A. Controls and Procedures................................................................................................. 91 PART III Item 10. Directors, Executive Officers and Corporate Governance ............................................. 91 Item 11. Executive Compensation ................................................................................................ 92 Item 12. Security Ownership of Certain Beneficial Owners and Management and Related
Stockholder Matters........................................................................................................ 92 Item 13. Certain Relationships and Related Transactions, and Director Independence ............... 92 Item 14. Principal Accounting Fees and Services......................................................................... 92 PART IV Item 15. Exhibits, Financial Statement Schedules........................................................................ 92 SIGNATURES............................................................................................................................................ 93
1
PART I
ITEM 1. BUSINESS General Cash America International, Inc. (the “Company”) provides pawn loans, short-term cash advances, check cashing services and other specialty financial services to individuals. The Company also sells merchandise in its pawnshops, primarily personal property that has been forfeited in connection with its pawn lending operations. The Company was incorporated in 1984 to engage in the business of owning and operating pawnshops. Since its formation, the Company has significantly broadened the scale and geographic scope of its pawn operations so that, as of December 31, 2007, it was the nation’s largest provider of pawn loans and, it believes, is the largest operator of pawnshops in the world. The Company also has expanded its financial services offerings by offering cash advances and other specialty financial services. As of December 31, 2007, the Company operated 499 pawnshops in 22 states (including 14 pawnshops that are franchises). Most of the Company’s pawnshops operate under the “Cash America” trade name; 44 pawnshops (located in Arizona, California, Nevada and Washington) operate under the “SuperPawn” trade name. The Company offers unsecured cash advances through 431 of its pawnshops, in 87 standalone Cash America Payday Advance locations, in 217 locations operated by its wholly-owned subsidiary Cashland Financial Services, Inc. under the “Cashland” trade name, and, since September 2006, over the internet under the trade name “CashNetUSA” at www.cashnetusa.com in the United States. In July 2007, the Company began offering short-term unsecured loans to customers who reside throughout the United Kingdom through its internet platform under the trade name “QuickQuid” at www.quickquid.co.uk.
Through its wholly-owned subsidiary Mr. Payroll Corporation (“Mr. Payroll”), the Company offers check cashing services through 134 franchised and five company-owned check cashing centers. Many of the Company’s pawn and cash advance locations also offer check cashing services and other retail financial services such as stored value cards, money orders and money transfers. Since its inception, the Company has grown by acquiring existing pawnshops and establishing new ones in locations that can benefit from its centralized management and standardized operations. The Company has pursued a similar strategy for acquiring and establishing cash advance locations since 2003. With both pawnshops and cash advance locations, the Company seeks to increase its share of the consumer loan business and concentrate multiple lending locations in regional and local markets in order to expand market penetration, enhance name recognition and reinforce marketing programs. The Company intends to continue this strategy for acquiring and establishing new lending locations, and intends to offer new products and services at its physical lending locations in order to meet the growing financial services needs of its customers. The Company began offering cash advances online with its acquisition of CashNetUSA in September 2006. The Company is also actively exploring strategies to increase and enhance its online presence, with the goal of becoming the premier online cash advance provider. The Company also intends to offer new products and services that complement its specialty financial services and to meet the growing financial services needs of its customers both at its physical lending locations and online.
Recent Developments. On September 15, 2006, the Company, through its wholly-owned subsidiary Cash America Net
Holdings, LLC, purchased substantially all of the assets of The Check Giant, LLC (“TCG”), which offered

2
short-term cash advances over the internet under the name “CashNetUSA” for an initial purchase price of approximately $35.9 million in cash and transaction costs of approximately $2.9 million. The Company also agreed to pay up to five supplemental earn-out payments during the two year period after the closing. The amount of each supplemental payment will be based on a multiple of earnings attributable to CashNetUSA’s business for the twelve months preceding the date of determining each scheduled supplemental payment, as described more fully in the asset purchase agreement, and will be reduced by amounts previously paid. The supplemental payments are to be paid in cash within 45 days of the measurement date; the Company may, however, at its option pay up to 25% of each supplemental payment in shares of its common stock based on an average share price value as of the measurement date. Management expects all of these supplemental payments will be accounted for as goodwill. Through December 31, 2007, the Company had made two supplemental payments. The first supplemental payment of approximately $33.8 million, which was paid in cash in February 2007, was determined as of December 31, 2006. A second payment of approximately $43.4 million was paid in cash in November 2007 and was determined as of September 30, 2007. Each payment reflected adjustments for amounts previously paid. The operating results of CashNetUSA have been included in the Company’s consolidated financial statements from the date of acquisition.
In August 2007, the Company received gross proceeds in the amount of $16.8 million on the sale of notes receivable that it had received in 2004 as part of the proceeds from its sale of Svensk Pantbelåning, its former Swedish pawn lending subsidiary. In September 2004, the Company sold Svensk Pantbelåning to Rutland Partners LLP for cash and two subordinated notes receivable. One of the notes receivable was convertible into approximately 27.7% of the parent company of Svensk Pantbelåning on a fully-diluted basis. In August 2007, Rutland Partners LLP sold Svensk Pantbelåning to a third party who also purchased the notes receivable from the Company. The Company’s total proceeds of $16.8 million represent $12.4 million in the repayment of principal, including $0.3 million of accrued interest owed on notes receivable and $4.4 million for the value of its conversion rights under the convertible note. For the year ended December 31, 2007, the Company recognized a pre-tax gain of approximately $6.3 million from the sale of the notes and related rights. The Company’s principal executive offices are located at 1600 West 7th Street, Fort Worth, Texas 76102-2599, and its telephone number is (817) 335-1100. As used in this report, the term “Company” includes Cash America International, Inc. and its subsidiaries. Access to Reports. Through its home page at www.cashamerica.com, the Company provides free access to its Annual Report on Form 10-K, Quarterly Reports on Form 10-Q, Current Reports on Form 8-K, and all amendments to those reports filed or furnished pursuant to Sections 13(a) and 15(d) of the Securities Exchange Act of 1934 as soon as reasonably practicable after such reports are electronically filed with or furnished to the Securities and Exchange Commission (the “SEC”). These reports may also be read and copied at the SEC’s Public Reference Room at 100 F Street, NE, Washington, D.C. 20549, or at the SEC website at www.sec.gov. Information on the operation of the Public Reference Room may be obtained by calling the SEC at 1-800-SEC-0330. Pawn Lending and Merchandise Disposition Activities Pawnshops are convenient sources of consumer loans. They also sell previously-owned merchandise acquired from customers who do not redeem their pawned goods or purchased directly from customers. A pawnshop may also sell items purchased from third-party vendors.
Lending. When receiving a pawn loan from the Company, a customer pledges personal property to the Company as security for the loan. The Company delivers a pawn transaction agreement, commonly referred to as a pawn ticket, to the customer, along with the proceeds of the loan. If the customer does not repay the loan or redeem the property, the customer forfeits the property to the Company, and the Company sells the property.

3
The Company relies on the disposition of pawned property to recover the principal amount of an
unpaid pawn loan, plus a yield on the investment. It does not have recourse against the customer for the loan. As a result, the customer’s creditworthiness is not a factor in the loan decision, and a decision not to redeem pawned property does not affect the customer’s personal credit status. Goods pledged to secure pawn loans are generally tangible personal property such as jewelry, tools, televisions and stereos, musical instruments, firearms, and other miscellaneous items. (Pawn transactions can also take the form of a “buy-sell agreement” involving the actual sale of the property by the customer to the pawnshop with the customer retaining an option to repurchase the property. Pledge and buy-sell transactions are referred to throughout this report as “pawn loans.”)
The Company contracts for a finance and service charge to compensate it for the use of the funds loaned. The finance and service charge is typically calculated as a percentage of the pawn loan amount based on the size and duration of the transaction, in a manner similar to which interest is charged on a bank loan, and generally ranges from 12% to 300% annually, as permitted by applicable state pawnshop laws. These finance and service charges contributed approximately 17.3% of the Company’s total revenue in 2007, 21.5% in 2006 and 23.5% in 2005. The amounts of these charges are disclosed to the customer on the pawn ticket. The pawn ticket also sets forth, among other items: the name and address of the pawnshop and the customer; the customer’s identification number from his or her driver’s license or other approved identification; the loan date; the identification and description of the pledged goods, including applicable serial numbers; the amount financed; the maturity date; the total amount that must be paid to redeem the pledged goods on the maturity date; and the annual percentage rate. The Company sets the amount of a pawn loan generally as a percentage of the pledged personal property’s estimated disposition value. The Company relies on many sources to determine the estimated disposition value, including its proprietary automated product valuation system, catalogs, “blue books,” newspapers, internet research and its (or its employees’) experience in disposing of similar items of merchandise in particular pawnshops. The Company does not use a standard or mandated percentage of estimated disposition value in determining the loan amount. Instead, its employees may set the percentage for a particular item and determine whether the item’s disposition, if it is forfeited to the pawnshop, would yield a profit margin consistent with the Company’s historical experience with similar items. The Company holds the pledged property through the term of the loan, which, unless earlier repaid, renewed or extended, is generally one month plus an additional period (typically 30-60 days) for the customer to redeem his merchandise by paying off the loan and all accrued charges. A majority of the Company’s pawn loans are either paid in full with accrued finance and service charges or are renewed or extended by the customer’s payment of accrued finance and service charges. If a customer does not repay, renew or extend his loan, the unredeemed collateral is forfeited to the Company and becomes merchandise available for disposition through the Company’s pawnshops, wholesale sources, internet sales or through a major gold bullion bank. The Company does not record pawn loan losses or charge-offs because the amount advanced becomes the carrying cost of the forfeited collateral that is to be recovered through the merchandise disposition function described below. The recovery of the amount advanced and the realization of a profit on the disposition of merchandise depends on the Company’s initial assessment of the property’s estimated disposition value when the pawn loan is made. While the Company has historically realized profits when disposing of merchandise, the improper assessment of the disposition value could result in the disposition of the merchandise for an amount less than the loan amount. For 2007, 2006 and 2005, the Company experienced profit margins on disposition of merchandise of 37.8%, 38.7% and 38.8%, respectively. Changes in gold prices generally will also increase or decrease the disposition value of jewelry items acquired in pawn transactions and could enhance or adversely affect the Company’s profit or recovery of the carrying cost of the acquired collateral.
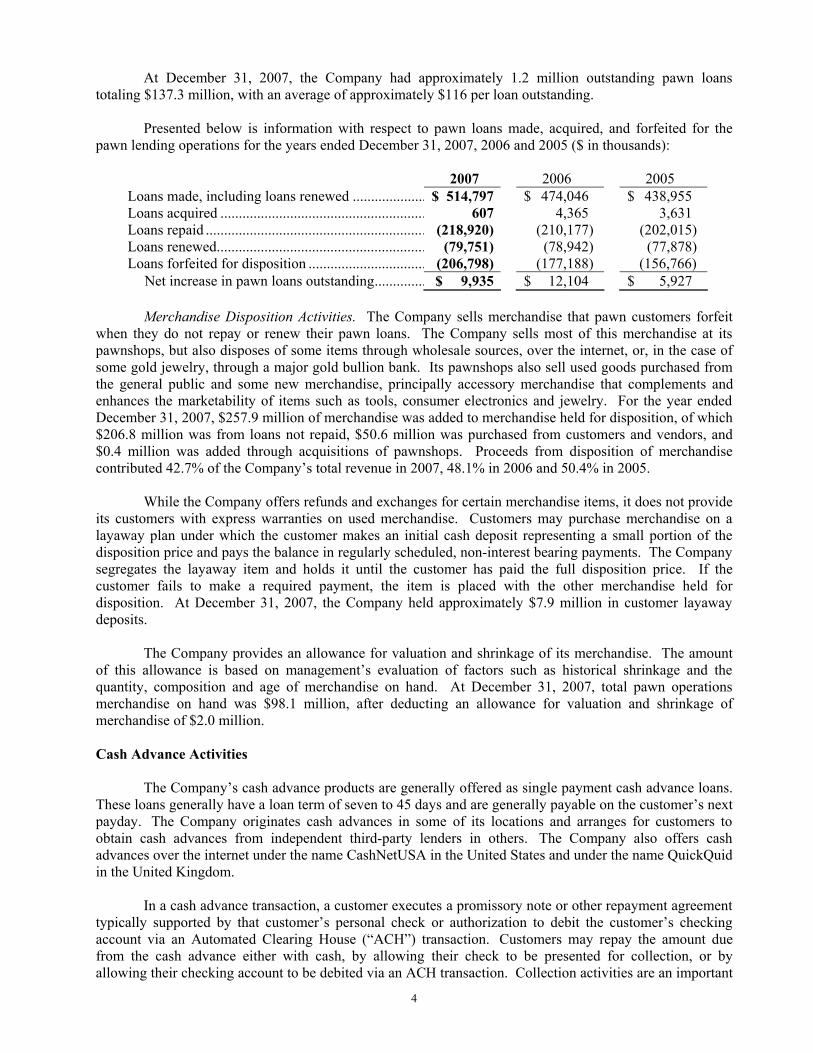
4
At December 31, 2007, the Company had approximately 1.2 million outstanding pawn loans totaling $137.3 million, with an average of approximately $116 per loan outstanding. Presented below is information with respect to pawn loans made, acquired, and forfeited for the pawn lending operations for the years ended December 31, 2007, 2006 and 2005 ($ in thousands):
2007 2006 2005 Loans made, including loans renewed .................... $ 514,797 $ 474,046 $ 438,955 Loans acquired ........................................................ 607 4,365 3,631 Loans repaid ............................................................ (218,920) (210,177) (202,015) Loans renewed......................................................... (79,751) (78,942) (77,878) Loans forfeited for disposition ................................ (206,798) (177,188) (156,766) Net increase in pawn loans outstanding.............. $ 9,935 $ 12,104 $ 5,927
Merchandise Disposition Activities. The Company sells merchandise that pawn customers forfeit
when they do not repay or renew their pawn loans. The Company sells most of this merchandise at its pawnshops, but also disposes of some items through wholesale sources, over the internet, or, in the case of some gold jewelry, through a major gold bullion bank. Its pawnshops also sell used goods purchased from the general public and some new merchandise, principally accessory merchandise that complements and enhances the marketability of items such as tools, consumer electronics and jewelry. For the year ended December 31, 2007, $257.9 million of merchandise was added to merchandise held for disposition, of which $206.8 million was from loans not repaid, $50.6 million was purchased from customers and vendors, and $0.4 million was added through acquisitions of pawnshops. Proceeds from disposition of merchandise contributed 42.7% of the Company’s total revenue in 2007, 48.1% in 2006 and 50.4% in 2005. While the Company offers refunds and exchanges for certain merchandise items, it does not provide its customers with express warranties on used merchandise. Customers may purchase merchandise on a layaway plan under which the customer makes an initial cash deposit representing a small portion of the disposition price and pays the balance in regularly scheduled, non-interest bearing payments. The Company segregates the layaway item and holds it until the customer has paid the full disposition price. If the customer fails to make a required payment, the item is placed with the other merchandise held for disposition. At December 31, 2007, the Company held approximately $7.9 million in customer layaway deposits. The Company provides an allowance for valuation and shrinkage of its merchandise. The amount of this allowance is based on management’s evaluation of factors such as historical shrinkage and the quantity, composition and age of merchandise on hand. At December 31, 2007, total pawn operations merchandise on hand was $98.1 million, after deducting an allowance for valuation and shrinkage of merchandise of $2.0 million. Cash Advance Activities
The Company’s cash advance products are generally offered as single payment cash advance loans. These loans generally have a loan term of seven to 45 days and are generally payable on the customer’s next payday. The Company originates cash advances in some of its locations and arranges for customers to obtain cash advances from independent third-party lenders in others. The Company also offers cash advances over the internet under the name CashNetUSA in the United States and under the name QuickQuid in the United Kingdom.
In a cash advance transaction, a customer executes a promissory note or other repayment agreement
typically supported by that customer’s personal check or authorization to debit the customer’s checking account via an Automated Clearing House (“ACH”) transaction. Customers may repay the amount due from the cash advance either with cash, by allowing their check to be presented for collection, or by allowing their checking account to be debited via an ACH transaction. Collection activities are an important

5
aspect of the cash advance product offering due to the high incidence of unpaid balances beyond stated terms. The Company operates centralized collection centers to coordinate a consistent approach to customer service and collections.
The Company offers cash advances in which it lends its own funds and cash advances originated by
independent third-party lenders under a program in which the Company acts as a credit services organization on behalf of consumers in accordance with applicable state laws (the “CSO program”). Credit services that the Company provides to its customers under the CSO program include arranging loans with independent third-party lenders, assisting in the preparation of loan applications and loan documents, and accepting loan payments at the location where the loans were arranged. For the customer who obtains a loan from a third-party lender through the CSO program, the Company also, as part of its credit services, guarantees, on behalf of the customer, the customer’s payment obligations to the third-party lender. A customer who obtains a loan through the CSO program pays the Company a fee for the credit services, including the guaranty, and enters into a contract with the Company governing the credit services arrangement. Losses on cash advances acquired by the Company as a result of its guaranty obligations are the responsibility of the Company. As of December 31, 2007, the CSO program was offered in Texas and Florida. The Company discontinued the CSO program in Michigan in February 2007, and has since offered only cash advances underwritten by the Company to customers in that state. In January 2008, the Company began offering a CSO program in the state of Maryland through its online platform. The Company offers short-term unsecured cash advances in many of its pawnshops, in standalone Cash America Payday Advance and Cashland locations, and, since its acquisition of CashNetUSA in September 2006, over the internet. As of December 31, 2007, a cash advance product was available in 735 total locations, including 431 pawnshop locations and 304 standalone cash advance locations, and the internet lending operations had cash advances outstanding in 32 states and in the United Kingdom. Cash advance products offered under the CSO program were available at 319 locations and through the CashNetUSA website. Although cash advance transactions may take the form of loans or deferred check deposit transactions, this report refers to cash advances originated both by the Company and by third-party lenders under the CSO program as “cash advances” for convenience. Cash advance fees earned by the Company contributed approximately 38.2% of the Company’s total revenue in 2007, 28.1% in 2006 and 23.8% in 2005.
If the Company collects a delinquent amount that exceeds the amount it has acquired as a result of its guaranty to third-party lenders, the Company is entitled to the excess when collected. Since the Company may not succeed in collecting all of its delinquent accounts, it records an accrual for amounts estimated to be adequate to absorb credit losses from cash advances in the aggregate cash advance portfolio, including those it expects to acquire as a result of its guaranty obligations. As of December 31, 2007, $148.4 million of combined gross cash advances was outstanding, including $34.6 million owned by the third-party lenders that is not included in the Company’s consolidated balance sheet. An allowance for losses of $25.7 million has been provided in the consolidated financial statements. The Company also provided accrued losses for third-party owned portfolios of $1.8 million at December 31, 2007, which is included in “Accounts payable and accrued expenses” in the accompanying consolidated balance sheet. See Item 8. Financial Statements and Supplementary Data, Note 4 of “Notes to Consolidated Financial Statements.”
6
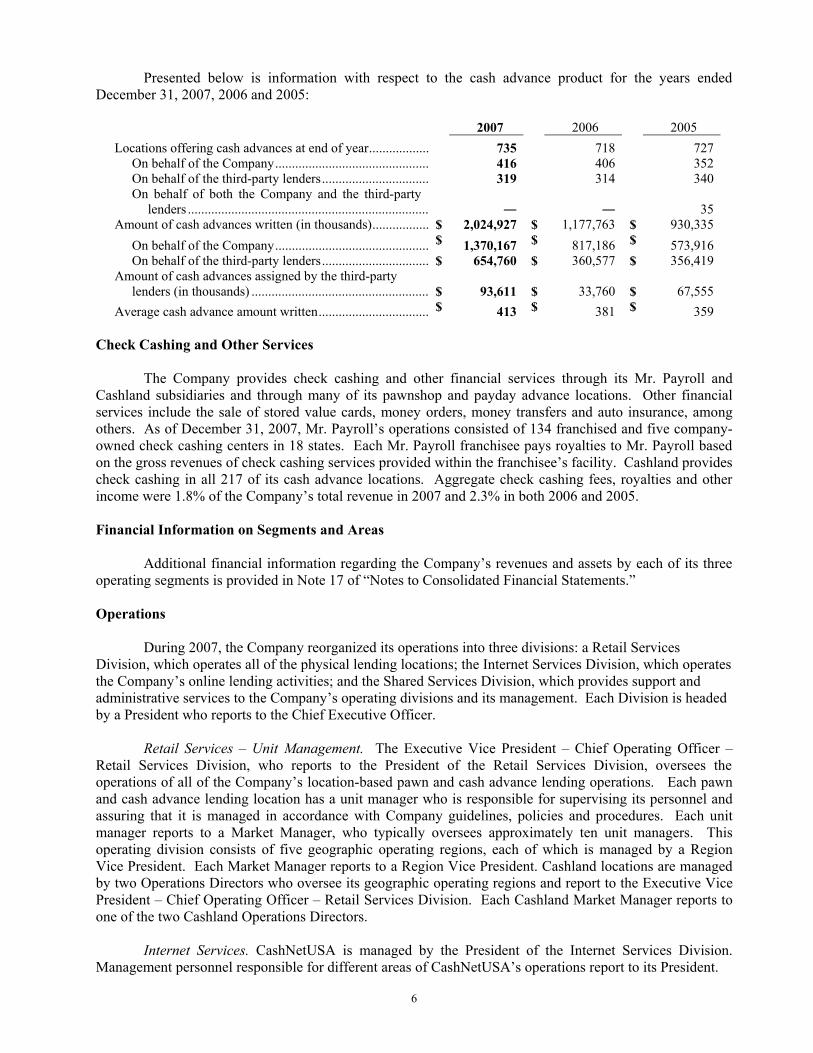
Presented below is information with respect to the cash advance product for the years ended December 31, 2007, 2006 and 2005:
2007 2006 2005 Locations offering cash advances at end of year.................. 735 718 727 On behalf of the Company.............................................. 416 406 352 On behalf of the third-party lenders................................ 319 314 340 On behalf of both the Company and the third-party
lenders ........................................................................
35 Amount of cash advances written (in thousands)................. $ 2,024,927 $ 1,177,763 $ 930,335 On behalf of the Company.............................................. $ 1,370,167 $ 817,186 $ 573,916 On behalf of the third-party lenders................................ $ 654,760 $ 360,577 $ 356,419 Amount of cash advances assigned by the third-party
lenders (in thousands) ..................................................... $ 93,611
$ 33,760
$ 67,555
Average cash advance amount written................................. $ 413 $ 381 $ 359 Check Cashing and Other Services The Company provides check cashing and other financial services through its Mr. Payroll and Cashland subsidiaries and through many of its pawnshop and payday advance locations. Other financial services include the sale of stored value cards, money orders, money transfers and auto insurance, among others. As of December 31, 2007, Mr. Payroll’s operations consisted of 134 franchised and five company-owned check cashing centers in 18 states. Each Mr. Payroll franchisee pays royalties to Mr. Payroll based on the gross revenues of check cashing services provided within the franchisee’s facility. Cashland provides check cashing in all 217 of its cash advance locations. Aggregate check cashing fees, royalties and other income were 1.8% of the Company’s total revenue in 2007 and 2.3% in both 2006 and 2005. Financial Information on Segments and Areas Additional financial information regarding the Company’s revenues and assets by each of its three operating segments is provided in Note 17 of “Notes to Consolidated Financial Statements.” Operations During 2007, the Company reorganized its operations into three divisions: a Retail Services Division, which operates all of the physical lending locations; the Internet Services Division, which operates the Company’s online lending activities; and the Shared Services Division, which provides support and administrative services to the Company’s operating divisions and its management. Each Division is headed by a President who reports to the Chief Executive Officer. Retail Services – Unit Management. The Executive Vice President – Chief Operating Officer – Retail Services Division, who reports to the President of the Retail Services Division, oversees the operations of all of the Company’s location-based pawn and cash advance lending operations. Each pawn and cash advance lending location has a unit manager who is responsible for supervising its personnel and assuring that it is managed in accordance with Company guidelines, policies and procedures. Each unit manager reports to a Market Manager, who typically oversees approximately ten unit managers. This operating division consists of five geographic operating regions, each of which is managed by a Region Vice President. Each Market Manager reports to a Region Vice President. Cashland locations are managed by two Operations Directors who oversee its geographic operating regions and report to the Executive Vice President – Chief Operating Officer – Retail Services Division. Each Cashland Market Manager reports to one of the two Cashland Operations Directors.
Internet Services. CashNetUSA is managed by the President of the Internet Services Division. Management personnel responsible for different areas of CashNetUSA’s operations report to its President.

7
Shared Services. The Shared Services Division provides support and administrative services to the
Company’s operating divisions and its management. Trade Names. The Company operates its locations under the trade names “Cash America,” “Payday Advance,” “Cashland,” “Mr. Payroll,” “SuperPawn,” “CashNetUSA” and “QuickQuid.” The Company’s marks “Cash America,” “Cashland,” “SuperPawn,” “Cash When It Counts,” “CashNetUSA” and “Mr. Payroll” are registered with the United States Patent and Trademark Office. Personnel. At December 31, 2007, the Company employed 5,501 persons in its operations, of whom 521 were in executive and administrative functions. Training. The Company provides extensive training to its store employees through training programs that are tailored to both pawn and cash advance lending locations, and combine classroom instruction, video and online presentations, and on-the-job training. A new employee is introduced to the business through an orientation program and through training programs covering job-appropriate topics such as pawn lending, cash advances, layaways, merchandising, collections, anti-money laundering, compliance, and general administration of unit operations. The experienced store employee receives additional training and an introduction to the fundamentals of management to acquire the skills necessary to move into management positions within the organization. Manager training involves a program that includes additional management principles and more extensive training in topics such as income maximization, recruitment, merchandise control, and cost efficiency. Future Expansion The Company has expanded both by acquiring existing pawnshops and cash advance locations (collectively referred to as “lending locations”) from others and by establishing new start-up locations. The Company intends to continue to increase the number of lending locations in this manner. Its business strategy is to continue expanding its lending business within its existing geographic markets and into other markets that meet its risk/reward considerations. Management believes that such expansion will continue to provide economies of scale in supervision, purchasing, administration and marketing by decreasing the overall average cost of such functions per unit owned. By concentrating multiple lending units in regional and local markets, the Company seeks to expand market penetration, enhance name recognition and reinforce marketing programs. Since acquiring CashNetUSA, the Company is also actively exploring strategies to increase and enhance its online presence, with the goal of becoming the premier online cash advance provider. The Company continues to evaluate new markets in which to establish its online presence, similar to its entry into the United Kingdom during 2007. The Company also intends to continue evaluating and offering new products and services that complement its specialty financial services both at its physical lending locations and online in order to meet the growing financial services needs of its customers.
When considering acquiring an existing lending location, the Company evaluates the annual volume of loan transactions at that location, the carrying cost of merchandise, outstanding loan balances and lease terms of the facility or, if it is to be purchased, the facility’s fair market value. When considering the startup of a new lending location, the Company evaluates the location of the prospective location, whether conditions in the surrounding community indicate a sufficient level of potential customers, and whether a suitable facility is available on acceptable terms.
A new pawnshop can be ready for business within four to six weeks and a new cash advance location can be ready within two to four weeks after the Company has leased or acquired a suitable location and obtained a license. The finish-out of a new location includes the completion of counters, installation of vaults and a security system and the transfer of merchandise from other locations (for pawnshop locations). The approximate start-up costs, which consist of the investment in property and equipment, for recently

8
established pawnshops have ranged from $385,000 to $410,000, with an average estimated cost per location of approximately $400,000 in 2007. This amount does not include merchandise transferred from other locations, funds to advance on pawn loans and cash advances or operating expenses. The start-up costs for recently established cash advance locations have ranged from $75,000 to $150,000, with an average estimated cost per location of approximately $100,000 in 2007. This amount does not include funds to advance on cash advances or operating expenses. The Company’s expansion program is subject to numerous unpredictable factors, such as the availability of attractive acquisition candidates or sites on suitable terms, market conditions in the pawn or cash advance business, general economic conditions and other factors described in Item 1A – “Risk Factors” of this report. Among the primary factors that could affect the Company’s future planned expansion are:
Statutory Requirements. The Company’s ability to add start-up locations depends on the Company’s ability to obtain all necessary licenses required to open. In addition, the current statutory and regulatory environment of some states renders expansion into those states impractical. See “Business – Regulation.”
Availability of Real Estate. The Company’s ability to add start-up locations is subject to locating satisfactory real estate sites on terms and conditions acceptable to the Company. Factors that could limit the availability of acceptable real estate sites could include changes in general economic conditions, increases in real estate values or market rents, increases in competition for suitable real estate, changing demographics in surrounding areas, restrictive zoning or sign ordinances, limited visibility or accessibility to public streets, and excessive finish-out costs, among other factors.
Competition. Several competing pawnshop and cash advance companies are also pursuing expansion and acquisition programs. A number of smaller companies and private equity firms have also entered the market, particularly for cash advance businesses. While the Company believes that it is the largest pawnshop operator in the United States, and one of the largest cash advance operators, there can be no assurance that it will be more successful than its competitors in pursuing acquisition opportunities and securing attractive start-up locations. Increased competition could also increase prices for attractive acquisition candidates, and could also adversely affect the performance of potential acquisition targets.
Availability of Qualified Unit Management Personnel. The Company’s ability to expand may also be limited by the availability of qualified unit management personnel. While the Company seeks to train its existing personnel to enable those capable to assume management positions, there can be no assurance that sufficient qualified personnel will be available to satisfy the Company’s needs with respect to its planned expansion.
Capital Requirements. In some states, the Company is required by law to maintain a minimum amount of certain unencumbered net assets per licensed location. The Company’s expansion plans will therefore be limited in these states to the extent the Company is able to maintain these required levels of unencumbered net assets. At present, these requirements do not limit the Company’s growth opportunities.
Competition While pawnbroking is a time-honored industry, the pawnshop industry in the United States remains very fragmented, with approximately 10,000 to 15,000 stores nationwide. Most pawnshops are owned by independent operators. The three largest publicly traded pawnshop companies operate approximately 900 total pawnshops in the United States. Management continues to believe that the Company can achieve economies of scale and increased operating efficiencies by increasing the number of stores under operation and utilizing modern point-of-sale systems and proven operating methods.

9
While the cash advance industry has grown at a rapid rate in the past several years, its growth has begun to moderate and the Company has begun to observe some consolidation. Nonetheless, competition for customers and for desirable locations remains strong. According to the investment banking firm Stephens, Inc., the overall annual growth rate for the cash advance industry is 8% to 10% per year. Despite the concentration of major competitors in the cash advance industry, management believes that opportunities for growth remain in this business. While management believes that the Company is a major provider in the distribution of the cash advance product via the internet, it is difficult to determine exactly how much of the market it provides since all other providers are privately held. Stephens, Inc. estimates that total industry internet loan volume represents 12% of total store and internet volume and is growing at approximately 40% per year. Regulation The Company’s operations are subject to extensive regulation, supervision and licensing under various federal, state and local statutes, ordinances and regulations. (For a geographic breakdown of operating locations, see “Properties.”) Pawnshop Regulations The Company’s pawnshops are regulated by the states in which they are located, and generally must be licensed by the state. The statutes and regulations applicable to pawnshops vary from state to state. In general, however, these statutes and regulations cover the licensing requirements for pawnbrokers and pawnshops and regulate various aspects of the pawn loan, such as the service charges and interest rates that a pawnshop may charge, the maximum amount of a pawn loan, the minimum and/or maximum term of a pawn loan, the content and format of the pawn ticket, and the length of time after a loan default that a pawnshop must hold a pawned item before disposing of it. Some states require that pawn borrowers be notified before their pawned items can be offered for sale. Depending upon the severity of a violation, failure to observe a state’s legal requirements for pawnbrokering could result, among other things, in a loss of pawn licenses in that state, the imposition of fines or refunds, and other civil and/or criminal penalties. The Company must also comply with the various disclosure requirements under the Federal Truth in Lending Act (and Federal Reserve Regulation Z under that Act) in connection with disclosing the interest, fees, total payments and annual percentage rate related to each pawn loan transaction. Additional federal regulations governing pawn operations are described in Other Regulations Affecting Lending Operations below. Individual states and municipalities also regulate numerous other aspects of pawnshops’ operations. Many of the Company’s pawnshops are also subject to municipal ordinances that may require, for example, local licenses or permits and specified recordkeeping procedures, among other things. Most of the Company’s pawnshops voluntarily, or pursuant to applicable laws, provide to a law enforcement department having jurisdiction daily information on all transactions involving pawn loans and over-the-counter purchases. These information reports are designed to provide local law enforcement with a detailed description of the goods involved, including serial numbers (if any) and the name and address of the owner obtained from a valid identification card. This information is provided to local law enforcement agencies for processing to determine conflicting claims of rightful ownership. The Company also voluntarily participates with other pawn lenders to provide similar information to a national database available to law enforcement in multiple jurisdictions. Goods held to secure pawn loans or goods purchased that are determined to belong to an owner other than the borrower or seller are subject to recovery by the rightful owner. However, the Company historically has not experienced a material number of claims of this nature, and the claims experienced have not had a material adverse effect on the Company’s results of operations. Each pawnshop that handles firearms must comply with the Brady Handgun Violence Prevention Act (the “Brady Act”). The Brady Act requires that federally licensed firearms dealers conduct a background check in connection with any disposition of handguns. In addition, the Company must comply with the regulations of the U.S. Department of Justice–Bureau of Alcohol, Tobacco and Firearms that
10
require each pawnshop dealing in guns to maintain a permanent written record of all receipts and dispositions of firearms. Cash Advance Regulations
The Company offers cash advance products in most of its pawnshops, in all of its cash advance locations and over the internet. Each state in which the Company originates cash advance products, including cash advances made online, has specific laws dealing with the conduct of this business. The same regulations generally apply to cash advances made both in physical lending locations and online. These laws and regulations typically restrict the amount of finance and service charges that may be assessed and limit the customer’s ability to renew or extend these cash advances. In many instances, the regulations also limit the aggregate amount that a provider may advance (and, in some cases, the number of cash advances the provider may make) to any one customer at one time. Cash advance lenders typically must be licensed by the state licensing authority in order to offer the cash advance product in that state. Some states require cash advance lenders to report their customers’ cash advance activities to a state-wide database, and such lenders are generally restricted from making cash advance loans to customers who may have a certain amount of cash advances outstanding with other lenders. Depending upon the severity of a violation, failure to observe a state’s legal requirements for cash advance lending could result, among other things, in a loss of cash advance licenses in that state, the imposition of fines or customer refunds, and other civil and/or criminal penalties. The Company must also comply with the various disclosure requirements under the Federal Truth in Lending Act (and Federal Reserve Regulation Z under that Act) in connection with disclosing the interest, fees, total payments and annual percentage rate related to each cash advance transaction. The cash advance business is also subject to various laws, rules and guidelines relating to the procedures and disclosures needed for debiting a debtor’s checking account for amounts due via an ACH transaction. Additionally the Company must comply with the Federal Fair Debt Collection Practices Act and similar state collection practices laws with respect to its collection activities related to cash advances. Furthermore, with respect to online cash advances, the Company is subject to various state and federal e-signature rules mandating that certain disclosures be made and certain steps be followed in order to obtain and authenticate e-signatures. Additional federal regulations governing cash advance businesses are described in Other Regulations Affecting Lending Operations below. As of December 31, 2007, the Company made available cash advance products offered by third-party lenders in 319 of its 735 locations. Certain states require that the Company be registered or licensed under state law in order to perform the administrative services that it performs for the third-party lenders. The Company began offering the CSO program in Texas, Michigan and Florida in July 2005. The Company discontinued the CSO program in Michigan in February 2007 and has since offered only cash advances underwritten by the Company to customers in that state. In January of 2008, the Company began offering a CSO program in the state of Maryland through its online platform.
Because the regulatory environment related to cash advances is increasingly scrutinized by
regulators and legislators, the Company expects that legislation currently pending or that might later be introduced in some state legislatures could, if enacted, further limit or eliminate the availability of the cash advance product in some states, despite the significant demand for it. While the Company, along with other leaders of the cash advance industry, opposes such overly restrictive regulation and legislation, it is possible that some combination of federal and state regulation and legislation could be enacted that could restrict or eliminate the availability of cash advance products in some or all of the states in which the Company offers the cash advance product. Check Cashing Regulations
The Company offers check cashing services at its Mr. Payroll branded check cashing facilities and at many of its pawnshops and cash advance locations. Some states require check cashing companies to meet minimum bonding or capital requirements and to comply with record-keeping requirements. Some states
11
require check cashers to be licensed and the Company maintains licenses in states where it cashes checks and that require check cashing licenses. Additionally, some states have adopted ceilings on check cashing fees, those ceilings are in excess of or equal to the fees charged by the Company. Depending upon the severity of a violation, failure to observe a state’s legal requirements for check cashing could result, among other things, in a loss of the check cashing license in that state, the imposition of fines or customer refunds, and other civil and/or criminal penalties. In addition to state regulations applicable to check cashing companies, the Company’s check cashing activities also must comply with applicable federal regulations. The principal federal regulations governing check cashing operations include the Bank Secrecy Act, the USA PATRIOT Act and the Gramm-Leach-Bliley Act, each of which are described in Other Regulations Affecting Lending Operations below. Other Regulations Affecting Lending Operations Under the federal Gramm-Leach-Bliley Act and its underlying regulations as well as under various state laws and regulations relating to privacy and data security, the Company must disclose to its customers its privacy policy and practices, including those relating to the sharing of customers’ nonpublic personal information with third parties. This disclosure must be made to customers when the customer relationship is established and, in some cases, at least annually thereafter. These regulations also require the Company to ensure that its systems are designed to protect the confidentiality of customers’ nonpublic personal information and many of these regulations dictate certain actions the Company must take to notify consumers if their personal information is disclosed in an unauthorized manner.
The federal Equal Credit Opportunity Act ("ECOA") prohibits discrimination against any credit applicant on the basis of any protected category, such as race, color, religion, national origin, sex, marital status, or age, and requires the Company to notify credit applicants of any action taken on the individual’s credit application. The Company must provide a loan applicant a Notice of Adverse Action ("NOAA") when the Company denies an application for credit. The NOAA must inform the applicant of: the action taken regarding the credit application; a statement of the ECOA’s prohibition on discrimination; the name and address of both the creditor and the federal agency that monitors compliance with the ECOA; and the applicant’s right to learn the specific reasons for the denial of credit and the contact information for the parties the applicant can contact to obtain those reasons. The Company provides NOAA letters and maintains records of all such letters as required by the ECOA and its implementing regulations. Under the USA PATRIOT Act, the Company must maintain an anti-money laundering compliance program covering certain of its business activities. The program must include: (1) the development of internal policies, procedures, and controls; (2) designation of a compliance officer; (3) an ongoing employee training program; and (4) an independent audit function to test the program. The United States Department of the Treasury is expected to issue regulations clarifying the requirements for anti-money laundering compliance programs for the pawnbroking and cash advance industries, but as of February 1, 2008 these regulations had not yet been issued.
Under the Bank Secrecy Act and regulations of the U.S. Department of the Treasury, the Company must report transactions occurring in a single day involving currency in an amount greater than $10,000, and also must retain records for five years for purchases of monetary instruments for cash in amounts from $3,000 to $10,000. In addition, multiple currency transactions must be treated as single transactions if the financial institution has knowledge that the transactions are by, or on behalf of, any person or entity and result in either cash in or cash out totaling more than $10,000 during any one day. In addition, federal regulations require the Company to report suspicious transactions involving at least $2,000 in a single day to the Financial Crimes Enforcement Network of the Treasury Department (“FinCen”). The regulations generally describe three classes of reportable suspicious transactions—one or more related transactions that the business knows, suspects, or has reason to suspect (1) involve funds derived from illegal activity or are intended to hide or disguise such funds, (2) are designed to evade the requirements of the Bank Secrecy Act, or (3) appear to serve no legitimate business or lawful purpose. Management believes that the Company’s
12
point-of-sale system, transaction monitoring systems and employee-training programs permit it to effectively comply with the foregoing requirements.
Certain subsidiaries of the Company are registered as money services businesses with the U.S. Treasury Department and must re-register with FinCEN at least every two years. The Company must also maintain a list of names and addresses of, and other information about, the Company’s stores and must make that list available to any requesting law enforcement agency. The store list must be updated at least annually.
A new law passed by the United States Congress in 2006 that became effective in October 2007 caps the annual percentage rate that may be charged on loans made to active duty military personnel and their immediate families at 36%. This 36% annual percentage rate cap applies to a variety of loan products, including cash advances, though it does not apply to pawn loans. The Company does not have any loan products bearing an interest rate of 36% per annum or less, as the Company believes the losses and servicing costs associated with lending to the Company’s traditional customer base would exceed the revenue produced at that rate. The Company does not expect this new law to have a material adverse effect on the Company’s financial condition or results of operations due to the relatively small number of cash advance loans extended to military historically. Casualty insurance, including burglary coverage, is maintained for each of the Company’s locations, and fidelity coverage is maintained on each of the Company’s employees. Management of the Company believes its operations are conducted in material compliance with all federal, state and local laws and ordinances applicable to its business. The Company’s franchising activities may be subject to various state regulations that, among other things, mandate disclosures to prospective franchisees and other requirements. Executive Officers of the Registrant The Company elects its executive officers annually. The Company’s executive officers, and information about each, are listed below. There is no family relationship between any of the executive officers.
Name Age Position Daniel R. Feehan 57 Chief Executive Officer and President Albert Goldstein 27 President – Internet Services Division John A. McDorman 60 President – Shared Services Division Jerry A. Wackerhagen 52 President – Retail Services Division Thomas A. Bessant, Jr. 49 Executive Vice President – Chief Financial Officer Robert D. Brockman 53 Executive Vice President – Administration Michael D. Gaston 63 Executive Vice President – Corporate Development James H. Kauffman 63 Executive Vice President – Corporate Development J. Curtis Linscott 42 Executive Vice President – General Counsel and Secretary Dennis J. Weese 44 Executive Vice President & Chief Operating Officer – Retail
Services Division Daniel R. Feehan has been Chief Executive Officer and President since February 2000. He served as the Company’s President and Chief Operating Officer from January 1990 until February 2000, except that he served as Chairman and Co-Chief Executive Officer of Mr. Payroll Corporation from February 1998 to February 1999 before returning to the position of President and Chief Operating Officer of the Company.
Albert Goldstein, CFA, joined the Company in September 2006 as Executive Vice President – Internet Lending, as part of the Company's acquisition of CashNetUSA, and was named President of the

13
Internet Services Division in July 2007. Mr. Goldstein founded CashNetUSA in 2004 and was President and CEO from inception of the business until its sale to the Company. Prior to that, Mr. Goldstein was part of Deutsche Bank's Leveraged Finance practice in New York and worked on various secured and unsecured leveraged debt transactions. Mr. Goldstein received a Bachelor of Science in Finance from the University of Illinois in 2002.
John A. McDorman joined the Company in August 2007 as President – Shared Services Division.
From 1990 until joining the Company, Mr. McDorman was the Managing Partner of Transition Consulting, a consulting firm assisting organizations with professional development and project management. While with Transition Consulting, Mr. McDorman provided consulting services to the Company for several years related to its human resources, organizational structure and the development of its new point-of-sale operating system. Prior to founding Transition Consulting, Mr. McDorman was a partner of Accenture. Mr. McDorman received Bachelor of Science and Masters of Business Administration degrees from Southern Methodist University.
Jerry A. Wackerhagen joined the Company in June 2005 as Executive Vice President – Chief
Information Officer and was named as President of the Company’s Retail Services Division in July 2007. Prior to joining the Company, Mr. Wackerhagen served as Chief Executive Officer of EFT Services, Inc., a consumer financial services company based in Columbia, South Carolina from 2001 to 2005. In 2000, he was Vice President of Sales for Trade Management Company, a joint venture between International Business Machines Corporation, Fluor Corporation and the Royal Bank of Canada. From 1999 to 2000, Mr. Wackerhagen was Vice President and Chief Information Officer at AGL Resources. Prior to that, he served as a Principal at IBM Global Services from 1996 to 1999 and as the Vice President and Chief Information Officer of CMI Industries, Inc. from 1991 to 1996.
Thomas A. Bessant, Jr. has been the Company’s Executive Vice President – Chief Financial Officer since July 1998. He joined the Company in May 1993 as Vice President – Finance and Treasurer and was elected Senior Vice President – Chief Financial Officer in July 1997. Prior to joining the Company, Mr. Bessant was a Senior Manager in the Corporate Finance Consulting Services Group of Arthur Andersen & Co., S.C. in Dallas, Texas from June 1989 to April 1993. Prior to that, Mr. Bessant was a Vice President in the Corporate Banking Division of NCNB Texas, N.A., and its predecessor banking corporations, beginning in 1981. Robert D. Brockman joined the Company in July 1995 as Executive Vice President – Administration. Prior to that, he served as Vice President – Human Resources of THORN Americas, Inc., the then-operator of the Rent-A-Center chain of rent-to-own stores, from December 1986 to June 1995. Michael D. Gaston joined the Company in April 1997 as Executive Vice President – Business Development. He was named as Executive Vice President – Corporate Development in July 2007. Prior to joining the Company, Mr. Gaston served as President of The Gaston Corporation, a private consulting firm, from 1984 to April 1997, and Executive Vice President of Barkley & Evergreen, an advertising and consulting agency, from 1991 to April 1997. James H. Kauffman has been the Company’s Executive Vice President – Corporate Development since July 2007. He was the Executive Vice President – Financial Services from September 2004 until July 2007. He joined the Company in July 1996 as Executive Vice President – Chief Financial Officer. He served as President – Cash America Pawn from July 1997 to July 1998, and as Chief Executive Officer of Rent-A-Tire, Inc. from July 1998 until August 2002, and as Executive Vice President – International Operations from October 1999 to September 2004. Before joining the Company, Mr. Kauffman served as President of Keystone Steel & Wire Company, a wire products manufacturer, from July 1991 to June 1996.
J. Curtis Linscott became Executive Vice President – General Counsel & Corporate Secretary in May 2006. He was appointed Vice President, General Counsel and Corporate Secretary in May 2005. Mr. Linscott joined the Company in 1995, serving as Associate General Counsel and Vice President – Associate

14
General Counsel. Before joining the Company, he was in private law practice with Kelly, Hart & Hallman, P.C., Fort Worth, Texas, for five years. He received his law degree from the University of Kansas School of Law in 1990.
Dennis J. Weese joined the Company as Executive Vice President & Chief Operating Officer – Retail Services Division in September 2007. Prior to joining the Company, Mr. Weese was Chief Operating Officer of On The Border Mexican Grill and Cantina, a restaurant company within the Brinker International family of restaurants from July 2004 until September 2007. He also served in a number of Vice President and Director Level positions at Limited Inc. from May 2001 until July 2004, and with YUM Brands from September 1990 to May 2001. He is a graduate of the United States Military Academy, and has earned a master's degree in business administration from Auburn University and a master's degree in business management from the University of Central Texas. ITEM 1A. RISK FACTORS Important risk factors that could cause results or events to differ from current expectations are described below. These factors are not intended to be an all-encompassing list of risks and uncertainties that may affect the operations, performance, development and results of the Company’s business.
A decreased demand for the Company’s products and specialty financial services and failure of the Company to adapt to such decrease could adversely affect results. Although the Company’s products and services are a staple of its customer base, the demand for a particular product or service may decrease due to a variety of factors, such as the availability of competing products, changes in customers’ financial conditions, or regulatory restrictions that reduce customer access to particular products. Should the Company fail to adapt to a significant change in its customers’ demand for, or access to, its products, the Company’s revenues could decrease significantly. Even if the Company does make adaptations, customers may resist or may reject products whose adaptations make them less attractive or less available. In any event, the effect of any product change on the results of the Company’s business may not be fully ascertainable until the change has been in effect for some time. In particular, the Company has changed, and will continue to change, some of the cash advance products and services it offers due to regulatory guidelines that have a direct or indirect effect on the governance of the Company and the products it offers.
Adverse changes in laws or regulations affecting the Company’s short-term consumer loan services could negatively impact the Company’s operations. The Company’s products and services are subject to extensive regulation and supervision under various federal, state and local laws, ordinances and regulations. The Company faces the risk that restrictions or limitations resulting from the enactment, change, or interpretation of laws and regulations could negatively affect the Company’s business activities. In particular, short-term consumer loans have come under increased regulatory scrutiny in recent years that has resulted in increasingly restrictive regulations. Some regulatory activity may limit the number of short-term loans that customers may receive or have outstanding, and regulations adopted by some states requiring that all borrowers of certain short-term loan products be listed on a database and limiting the number of such loans they may have outstanding; and regulations limiting the availability of the Company’s cash advance products to active duty military personnel. Certain consumer advocacy groups and federal and state legislators have also asserted that laws and regulations should be tightened so as to severely limit, if not eliminate, the availability of certain cash advance products to consumers, despite the significant demand for it. Legislation relating to cash advances is pending in some state legislatures. Adoption of such federal and state regulations or legislation could restrict, or even eliminate, the availability of cash advance products in some or all of the states in which the Company offers a short term cash advance product.
In addition to state and federal laws and regulations, our business is subject to various local rules and regulations such as local zoning regulation and permit licensing. We have seen efforts by local jurisdictions to restrict pawnshop operations and cash advance lending through the use of local zoning

15
and permitting laws. Actions taken in the future by local governing bodies to require special use permits for, or impose other restrictions on pawnshops or cash advance lenders could have a material adverse effect on our business, results of operations and financial condition. Finally, in recent years, the cash advance industry has been subject to regulatory proceedings, class action lawsuits and other litigation concerning the offering of cash advances, and we could suffer losses from interpretations of state laws in those lawsuits or regulatory proceedings, even if we are not a party to those proceedings.
The failure of third-parties who provide products, services or support to the Company to maintain their products, services or support could disrupt Company operations or result in a loss of revenue. The Company’s cash advance revenues depend in part on the willingness and ability of unaffiliated third-party lenders to make loans to customers and with other third parties to provide services to facilitate lending and loan underwriting in both the storefront and online cash advance channels. The loss of the relationship with any of these third parties, and an inability to replace them, or the failure of these third parties to maintain quality and consistency in their programs or services could cause the Company to lose customers and substantially decrease the revenues and earnings of the Company’s cash advance business. The Company makes other non-cash advance products and services provided by various third-party vendors available to its customers. If a third-party provider fails to provide its product or service or to maintain its quality and consistency, the Company could lose customers and related revenue from those products or services. The Company also uses third parties to support and maintain certain of its communication systems and computerized point-of-sale and information systems. The failure of such third parties to fulfill their support and maintenance obligations could disrupt the Company’s operations.
The Company’s business depends on the uninterrupted operation of the Company’s facilities, systems and business functions, including its information technology and other business systems. The Company’s business, particularly its online business, depends highly upon its employees’ ability to perform, in an efficient and uninterrupted fashion, necessary business functions, such as Internet support, call centers, and processing and making cash advances. A shut-down of or inability to access the facilities in which the Company’s online operations and other technology infrastructure are based, such as a power outage, a failure of one or more of its information technology, telecommunications or other systems, or sustained or repeated disruptions of such systems could significantly impair its ability to perform such functions on a timely basis and could result in a deterioration of the Company’s ability to write and process online cash advances, provide customer service, perform collections activities, or perform other necessary business functions.
A security breach of the Company’s computer systems could also interrupt or damage its operations or harm its reputation. In addition, the Company could be subject to liability if confidential customer information is misappropriated from its computer systems. Despite the implementation of significant security measures these systems may still be vulnerable to physical break-ins, computer viruses, programming errors, attacks by third parties or similar disruptive problems. Any compromise of security could deter people from entering into transactions that involve transmitting confidential information to the Company’s systems, which could have a material, adverse effect on the Company’s business.
The Company may be unable to protect its proprietary technology or keep up with that of its competitors. The success of the Company’s business, particularly its online business, depends to a significant degree upon the protection of its software and other proprietary intellectual property rights. The Company may be unable to deter misappropriation of its proprietary information, detect unauthorized use or take appropriate steps to enforce its intellectual property rights. In addition, competitors could, without violating the Company’s proprietary rights, develop technologies that are as good as or better than its technology. The Company’s failure to protect its software and other proprietary intellectual property rights or to develop technologies that are as good as its competitors’
16
could put the company at a disadvantage to its competitors. Any such failures could have a material adverse effect on the Company’s business.
The Company’s growth is subject to external factors and other circumstances over which the Company has limited control or that are beyond the Company’s control. These factors and circumstances could adversely affect the Company’s ability to grow through the opening and acquisition of new operating units. The Company’s expansion strategy includes acquiring existing stores and opening new ones. The success of this strategy is subject to numerous external factors, such as the availability of attractive acquisition candidates, the availability of sites with acceptable restrictions and suitable terms, the Company’s ability to attract, train and retain qualified unit management personnel, the ability to access capital and the ability to obtain required government permits and licenses. Some of these factors are beyond the Company’s control. The failure to execute this expansion strategy would adversely affect the Company’s ability to expand its business and could materially adversely affect its business, prospects, results of operations and financial condition.
Increased competition from banks, savings and loans, other short-term consumer lenders, and other entities offering similar financial services, as well as retail businesses that offer products and services offered by the Company, could adversely affect the Company’s results of operations. The Company has many competitors to its core lending and merchandise disposition operations. Its principal competitors are other pawnshops, cash advance companies, online lenders, consumer finance companies and other financial institutions that serve the Company’s primary customer base. Many other financial institutions or other businesses that do not now offer products or services directed toward the Company’s traditional customer base, many of whom may be much larger than the Company, could begin doing so. Significant increases in the number and size of competitors for the Company’s business could result in a decrease in the number of cash advances or pawn loans that the Company writes, resulting in lower levels of revenues and earnings in these categories. Furthermore, the Company has many competitors to its retail operations, such as retailers of new merchandise, retailers of pre-owned merchandise, other pawnshops, thrift shops, online retailers and online auction sites. Increased competition or aggressive marketing and pricing practices by these competitors could result in decreased revenues, margins and turnover rates in the Company’s retail operations.
A sustained deterioration in the economy could reduce demand for the Company’s products and services and result in reduced earnings. A sustained deterioration in the economy could cause deterioration in the performance of the Company’s pawn loan or cash advance portfolios and in consumer demand for pre-owned merchandise such as that sold in the Company’s pawnshops. An economic slowdown could result in an increase in loan defaults in our cash advance products. During such a slowdown, the Company could be required to tighten its underwriting standards, which would reduce cash advance balances, and could face more difficulty in collecting defaulted cash advances, which could lead to an increase in loan losses. While the credit risk for much of the Company’s pawn lending is mitigated by the collateralized nature of pawn lending, a sustained deterioration in the economy could reduce the demand and resale value of pre-owned merchandise and reduce the amount that the Company could effectively lend on an item of collateral. Such reductions could adversely affect pawn loan balances, pawn loan redemption rates, inventory balances, inventory mixes and gross profit margins.
The Company’s earnings and financial position are subject to changes in the value of gold. A significant or sudden decline in the price of gold could materially affect the Company’s earnings. A significant portion of the Company’s pawn loans are secured by gold jewelry. The Company’s pawn service charges, sales proceeds and ability to dispose of excess jewelry inventory at an acceptable margin depend on the value of gold. A significant decline in gold prices could result in decreases in merchandise sales margins, in inventory valuations, in the value of collateral securing outstanding pawn loans, and in the balance of pawn loans secured by gold jewelry.

17
Adverse real estate market fluctuations could affect the Company’s profits. The Company leases most of its locations. A significant rise in real estate prices could result in an increase in store lease costs as the Company opens new locations and renews leases for existing locations.
The Company’s foreign operations subject the Company to foreign exchange risk. The Company is subject to the risk of unexpected changes in foreign currency exchange rates by virtue of its loans to United Kingdom residents. Our results of operations and certain of our intercompany balances associated with our United Kingdom loans are denominated in British pounds and are, as a result, exposed to foreign exchange rate fluctuations. Upon consolidation, as exchange rates vary, net sales and other operating results may differ materially from expectations, and we may record significant gains or losses on the remeasurement of intercompany balances.
Changes in the capital markets or the Company’s financial condition could reduce available capital. The Company regularly accesses the debt capital markets to refinance existing debt obligations and to obtain capital to finance growth. Efficient access to these markets is critical to the Company’s ongoing financial success; however, the Company’s future access to the debt capital markets could become restricted due to a variety of factors, including a deterioration of the Company’s earnings, cash flows, balance sheet quality, or overall business or industry prospects, a significant deterioration in the state of the capital markets or a negative bias toward the Company’s industry by market participants.
Media reports and public perception of short-term consumer loans as being predatory or abusive could materially adversely affect the Company’s cash advance business. In recent years, consumer advocacy groups and some media reports have advocated governmental action to prohibit or place severe restrictions on short-term consumer loans. The consumer advocacy groups and media reports generally focus on the cost to a consumer for this type of loan, which is alleged to be higher than the interest typically charged by banks to consumers with better credit histories. Though the consumer advocacy groups and media reports do not discuss the lack of viable alternatives for our customers’ borrowing needs or the comparative cost to the customer when alternatives are not available, they do typically characterize these short-term consumer loans as predatory or abusive despite the large customer demand for these loans. If the negative characterization of these types of loans becomes increasingly accepted by consumers, demand for the cash advance products could significantly decrease, which could materially affect the Company’s results of operations and financial condition. Additionally, if the negative characterization of these types of loans is accepted by legislators and regulators, the Company could become subject to more restrictive laws and regulations that could materially adversely affect the Company’s financial condition and results of operations.
Other risk factors are discussed under Quantitative and Qualitative Disclosures about Market Risk.
Other risks that are indicated in the Company’s filings with the Securities and Exchange Commission may apply as well.
ITEM 1B. UNRESOLVED STAFF COMMENTS None.
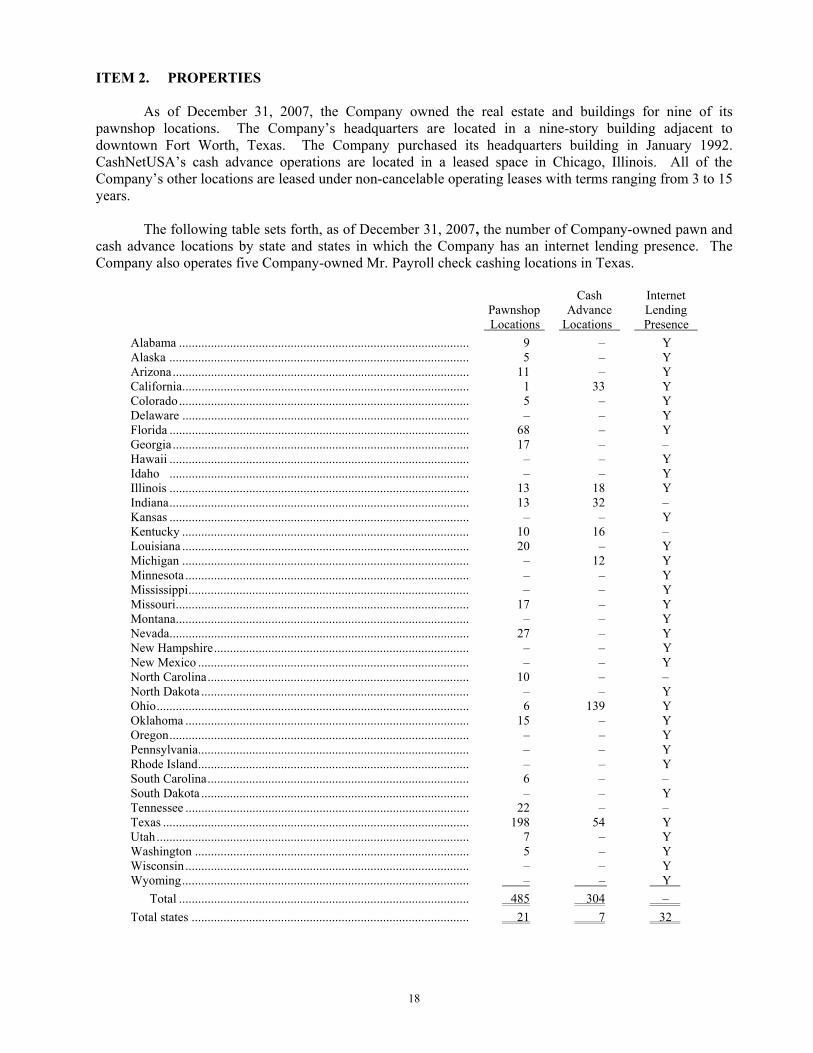
18
ITEM 2. PROPERTIES As of December 31, 2007, the Company owned the real estate and buildings for nine of its pawnshop locations. The Company’s headquarters are located in a nine-story building adjacent to downtown Fort Worth, Texas. The Company purchased its headquarters building in January 1992. CashNetUSA’s cash advance operations are located in a leased space in Chicago, Illinois. All of the Company’s other locations are leased under non-cancelable operating leases with terms ranging from 3 to 15 years. The following table sets forth, as of December 31, 2007, the number of Company-owned pawn and cash advance locations by state and states in which the Company has an internet lending presence. The Company also operates five Company-owned Mr. Payroll check cashing locations in Texas.
Cash Internet Pawnshop Advance Lending Locations Locations Presence Alabama ........................................................................................... 9 – Y Alaska .............................................................................................. 5 – Y Arizona............................................................................................. 11 – Y California.......................................................................................... 1 33 Y Colorado........................................................................................... 5 – Y Delaware .......................................................................................... – – Y Florida .............................................................................................. 68 – Y Georgia............................................................................................. 17 – – Hawaii .............................................................................................. – – Y Idaho .............................................................................................. – – Y Illinois .............................................................................................. 13 18 Y Indiana .............................................................................................. 13 32 – Kansas .............................................................................................. – – Y Kentucky .......................................................................................... 10 16 – Louisiana .......................................................................................... 20 – Y Michigan .......................................................................................... – 12 Y Minnesota ......................................................................................... – – Y Mississippi........................................................................................ – – Y Missouri............................................................................................ 17 – Y Montana............................................................................................ – – Y Nevada.............................................................................................. 27 – Y New Hampshire................................................................................ – – Y New Mexico ..................................................................................... – – Y North Carolina.................................................................................. 10 – – North Dakota .................................................................................... – – Y Ohio.................................................................................................. 6 139 Y Oklahoma ......................................................................................... 15 – Y Oregon .............................................................................................. – – Y Pennsylvania..................................................................................... – – Y Rhode Island..................................................................................... – – Y South Carolina.................................................................................. 6 – – South Dakota .................................................................................... – – Y Tennessee ......................................................................................... 22 – – Texas ................................................................................................ 198 54 Y Utah .................................................................................................. 7 – Y Washington ...................................................................................... 5 – Y Wisconsin ......................................................................................... – – Y Wyoming.......................................................................................... – – Y Total ........................................................................................... 485 304 – Total states ....................................................................................... 21 7 32
19
The Company considers its equipment, furniture and fixtures and owned buildings to be in good condition. The Company has its own construction supervisors who engage local contractors to selectively remodel and upgrade its lending facilities throughout the year.
The Company’s leases typically require the Company to pay all maintenance costs, insurance costs and property taxes. For additional information concerning the Company’s leases, see Item 8. Financial Statements and Supplementary Data, Note 10 of “Notes to Consolidated Financial Statements.” ITEM 3. LEGAL PROCEEDINGS
On August 6, 2004, James E. Strong filed a purported class action lawsuit in the State Court of Cobb County, Georgia against Georgia Cash America, Inc., Cash America International, Inc. (together with Georgia Cash America, Inc., “Cash America”), Daniel R. Feehan, and several unnamed officers, directors, owners and “stakeholders” of Cash America. The lawsuit alleges many different causes of action, among the most significant of which is that Cash America made illegal payday loans in Georgia in violation of Georgia’s usury law, the Georgia Industrial Loan Act and Georgia’s Racketeer Influenced and Corrupt Organizations Act. Community State Bank (“CSB”) for some time made loans to Georgia residents through Cash America’s Georgia operating locations. The complaint in this lawsuit claims that Cash America was the true lender with respect to the loans made to Georgia borrowers and that CSB’s involvement in the process is “a mere subterfuge.” Based on this claim, the suit alleges that Cash America is the “de facto” lender and is illegally operating in Georgia. The complaint seeks unspecified compensatory damages, attorney’s fees, punitive damages and the trebling of any compensatory damages. A previous decision by the trial judge to strike Cash America’s affirmative defenses based on arbitration (without ruling on Cash America’s previously filed motion to compel arbitration) was upheld by the Georgia Court of Appeals, and on September 24, 2007, the Georgia Supreme Court declined to review the decision. The case has been returned to the State Court of Cobb County, Georgia, where Cash America filed a motion requesting that the trial court rule on Cash America’s pending motion to compel arbitration and stay the State Court proceedings. The Court denied the motion to stay and ruled that the motion to compel arbitration was rendered moot after the discovery sanction was handed down by the Court. Cash America is currently in the process of appealing these latest orders from the Court. If Cash America’s further attempts to enforce the arbitration agreement are unsuccessful, discovery relating to the propriety of continuing this suit as a class action would proceed. Cash America believes that the plaintiffs’ claims in this suit are without merit and is vigorously defending this lawsuit.
Cash America and CSB also commenced a federal lawsuit in the U.S. District Court for the Northern District of Georgia seeking to compel Plaintiffs to arbitrate their claims against Cash America and CSB. The U.S. District Court dismissed the federal action for lack of subject matter jurisdiction, and Cash America and CSB appealed the dismissal of their complaint to the U.S. Court of Appeals for the 11th Circuit. The 11th Circuit issued a panel decision on April 27, 2007 reversing the district court’s dismissal of the action and remanding the action to the district court for a determination of the issue of the enforceability of the parties’ arbitration agreements. Plaintiff requested the 11th Circuit to review this decision en banc and this request has been granted. The en banc rehearing took place on February 26, 2008. The Strong litigation is still at an early stage, and neither the likelihood of an unfavorable outcome nor the ultimate liability, if any, with respect to this litigation can be determined at this time.
On October 23, 2007, a complaint, styled Ryan Bonner, individually and on behalf of all others similarly situated, v. Cash America International, Inc., Cash America Net of Nevada, LLC, Cash America Net of Pennsylvania, LLC and Cash America of PA, LLC, d/b/a CashNetUSA.com (collectively, “CashNetUSA”), was filed in the United States District Court for the Eastern District of Pennsylvania, alleging, on behalf of a purported class, that the defendants located outside Pennsylvania had engaged in unfair or deceptive acts or practices by making loans to Pennsylvania consumers in violation of Pennsylvania law, including its usury, fair credit extension, and unfair trade practices and consumer protection laws. The complaint also alleges that the arbitration, class action waiver and dispute resolution provisions contained in the loan documents involved in these loans are unenforceable. The complaint seeks
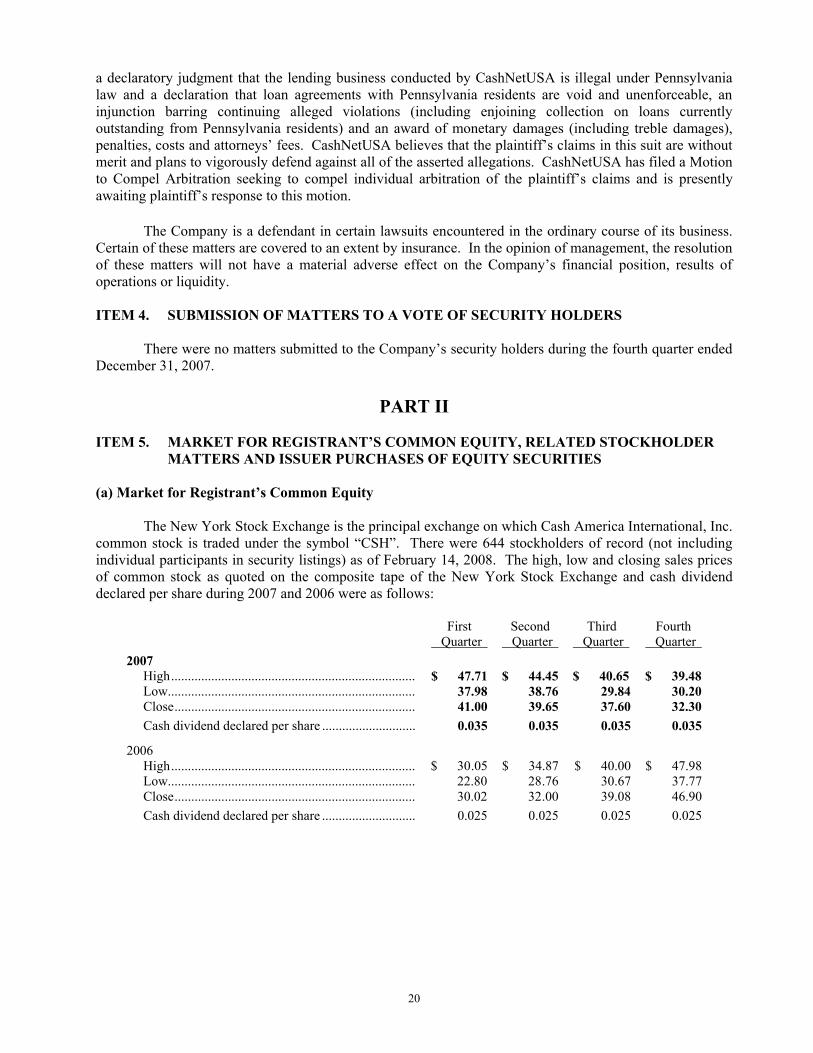
20
a declaratory judgment that the lending business conducted by CashNetUSA is illegal under Pennsylvania law and a declaration that loan agreements with Pennsylvania residents are void and unenforceable, an injunction barring continuing alleged violations (including enjoining collection on loans currently outstanding from Pennsylvania residents) and an award of monetary damages (including treble damages), penalties, costs and attorneys’ fees. CashNetUSA believes that the plaintiff’s claims in this suit are without merit and plans to vigorously defend against all of the asserted allegations. CashNetUSA has filed a Motion to Compel Arbitration seeking to compel individual arbitration of the plaintiff’s claims and is presently awaiting plaintiff’s response to this motion.
The Company is a defendant in certain lawsuits encountered in the ordinary course of its business. Certain of these matters are covered to an extent by insurance. In the opinion of management, the resolution of these matters will not have a material adverse effect on the Company’s financial position, results of operations or liquidity. ITEM 4. SUBMISSION OF MATTERS TO A VOTE OF SECURITY HOLDERS There were no matters submitted to the Company’s security holders during the fourth quarter ended December 31, 2007.
PART II
ITEM 5. MARKET FOR REGISTRANT’S COMMON EQUITY, RELATED STOCKHOLDER
MATTERS AND ISSUER PURCHASES OF EQUITY SECURITIES (a) Market for Registrant’s Common Equity The New York Stock Exchange is the principal exchange on which Cash America International, Inc. common stock is traded under the symbol “CSH”. There were 644 stockholders of record (not including individual participants in security listings) as of February 14, 2008. The high, low and closing sales prices of common stock as quoted on the composite tape of the New York Stock Exchange and cash dividend declared per share during 2007 and 2006 were as follows:
First Second Third Fourth Quarter Quarter Quarter Quarter
2007 High......................................................................... $ 47.71 $ 44.45 $ 40.65 $ 39.48 Low.......................................................................... 37.98 38.76 29.84 30.20 Close........................................................................ 41.00 39.65 37.60 32.30 Cash dividend declared per share ............................ 0.035 0.035 0.035 0.035
2006 High......................................................................... $ 30.05 $ 34.87 $ 40.00 $ 47.98 Low.......................................................................... 22.80 28.76 30.67 37.77 Close........................................................................ 30.02 32.00 39.08 46.90 Cash dividend declared per share ............................ 0.025 0.025 0.025 0.025
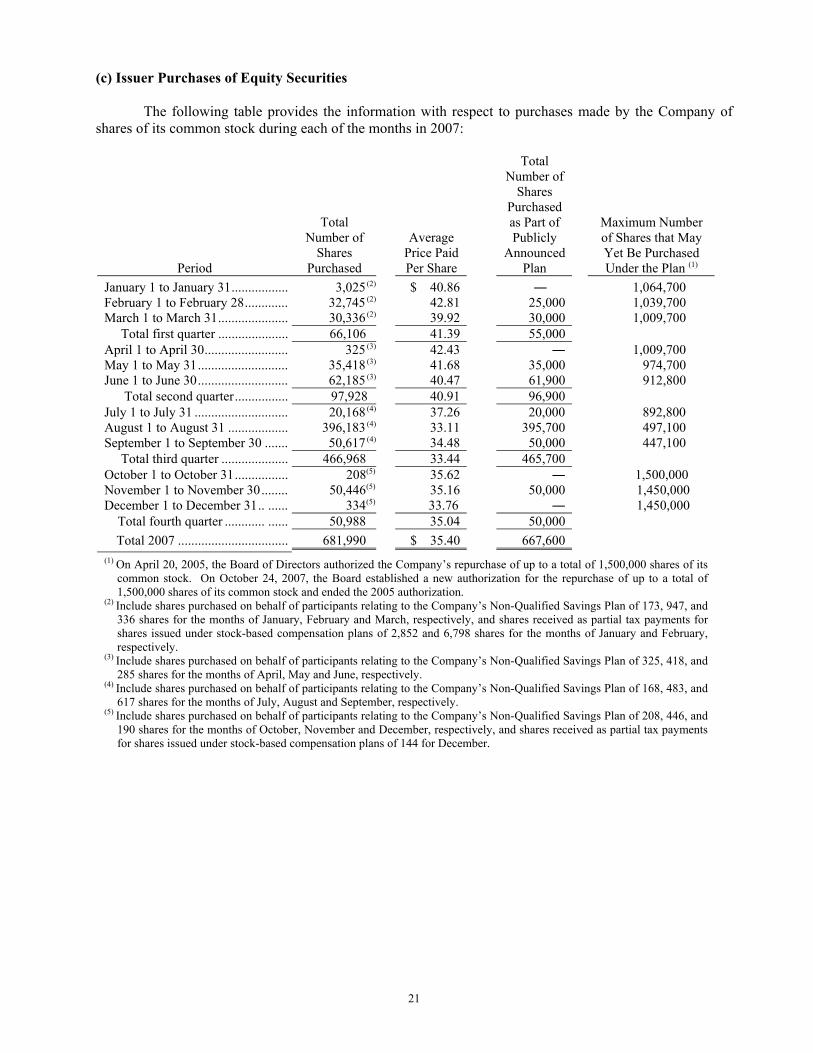
21
(c) Issuer Purchases of Equity Securities
The following table provides the information with respect to purchases made by the Company of shares of its common stock during each of the months in 2007:
Period
Total
Number of Shares
Purchased
Average Price Paid Per Share
Total Number of
Shares Purchased as Part of Publicly
Announced Plan
Maximum Number of Shares that May Yet Be Purchased Under the Plan (1)
January 1 to January 31................. 3,025 (2) $ 40.86 1,064,700 February 1 to February 28............. 32,745 (2) 42.81 25,000 1,039,700 March 1 to March 31..................... 30,336 (2) 39.92 30,000 1,009,700 Total first quarter ..................... 66,106 41.39 55,000 April 1 to April 30......................... 325 (3) 42.43 1,009,700 May 1 to May 31........................... 35,418 (3) 41.68 35,000 974,700 June 1 to June 30........................... 62,185 (3) 40.47 61,900 912,800 Total second quarter................ 97,928 40.91 96,900 July 1 to July 31 ............................ 20,168 (4) 37.26 20,000 892,800 August 1 to August 31 .................. 396,183 (4) 33.11 395,700 497,100 September 1 to September 30 ....... 50,617 (4) 34.48 50,000 447,100 Total third quarter .................... 466,968 33.44 465,700 October 1 to October 31................ 208(5) 35.62 1,500,000 November 1 to November 30........ 50,446(5) 35.16 50,000 1,450,000 December 1 to December 31.. ...... 334(5) 33.76 1,450,000 Total fourth quarter ............ ...... 50,988 35.04 50,000 Total 2007 ................................. 681,990 $ 35.40 667,600 (1) On April 20, 2005, the Board of Directors authorized the Company’s repurchase of up to a total of 1,500,000 shares of its
common stock. On October 24, 2007, the Board established a new authorization for the repurchase of up to a total of 1,500,000 shares of its common stock and ended the 2005 authorization.
(2) Include shares purchased on behalf of participants relating to the Company’s Non-Qualified Savings Plan of 173, 947, and 336 shares for the months of January, February and March, respectively, and shares received as partial tax payments for shares issued under stock-based compensation plans of 2,852 and 6,798 shares for the months of January and February, respectively.
(3) Include shares purchased on behalf of participants relating to the Company’s Non-Qualified Savings Plan of 325, 418, and 285 shares for the months of April, May and June, respectively.
(4) Include shares purchased on behalf of participants relating to the Company’s Non-Qualified Savings Plan of 168, 483, and 617 shares for the months of July, August and September, respectively.
(5) Include shares purchased on behalf of participants relating to the Company’s Non-Qualified Savings Plan of 208, 446, and 190 shares for the months of October, November and December, respectively, and shares received as partial tax payments for shares issued under stock-based compensation plans of 144 for December.
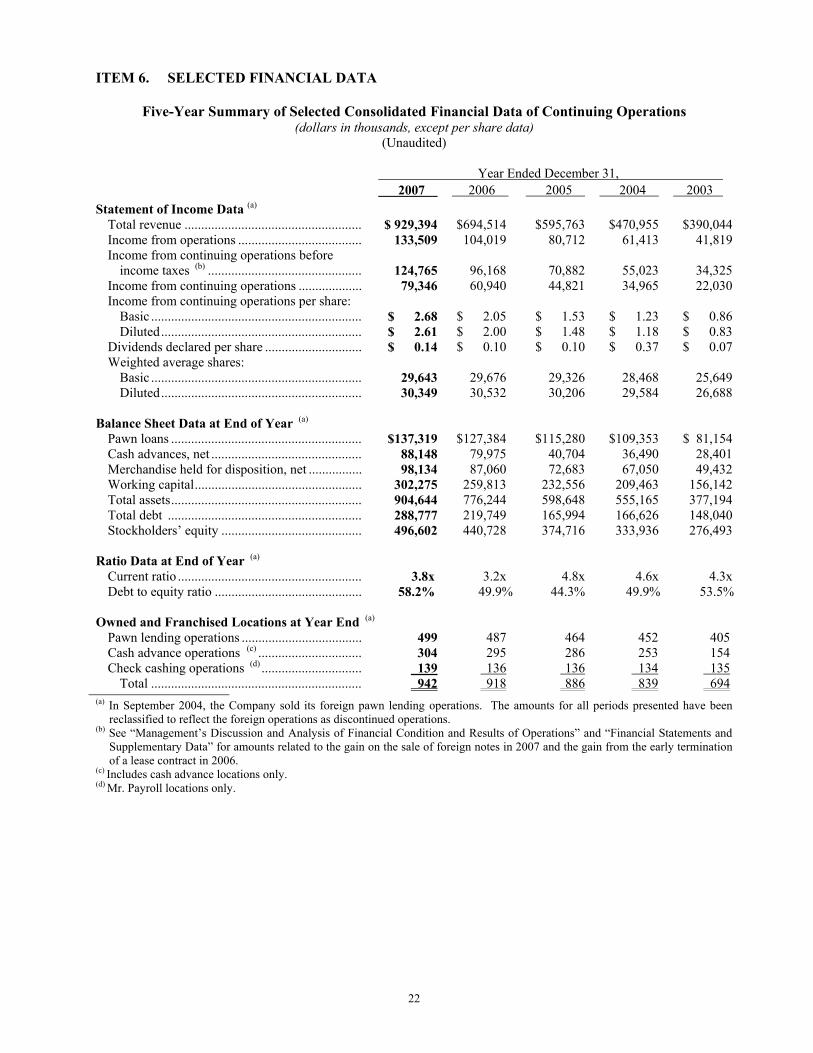
22
ITEM 6. SELECTED FINANCIAL DATA
Five-Year Summary of Selected Consolidated Financial Data of Continuing Operations (dollars in thousands, except per share data)
(Unaudited)
Year Ended December 31, 2007 2006 2005 2004 2003
Statement of Income Data (a) Total revenue ..................................................... $ 929,394 $694,514 $595,763 $470,955 $390,044 Income from operations ..................................... 133,509 104,019 80,712 61,413 41,819 Income from continuing operations before
income taxes (b) .............................................. 124,765 96,168 70,882 55,023 34,325 Income from continuing operations ................... 79,346 60,940 44,821 34,965 22,030 Income from continuing operations per share: Basic ............................................................... $ 2.68 $ 2.05 $ 1.53 $ 1.23 $ 0.86 Diluted............................................................ $ 2.61 $ 2.00 $ 1.48 $ 1.18 $ 0.83 Dividends declared per share ............................. $ 0.14 $ 0.10 $ 0.10 $ 0.37 $ 0.07 Weighted average shares: Basic ............................................................... 29,643 29,676 29,326 28,468 25,649 Diluted............................................................ 30,349 30,532 30,206 29,584 26,688 Balance Sheet Data at End of Year (a) Pawn loans ......................................................... $137,319 $127,384 $115,280 $109,353 $ 81,154 Cash advances, net ............................................. 88,148 79,975 40,704 36,490 28,401 Merchandise held for disposition, net ................ 98,134 87,060 72,683 67,050 49,432 Working capital.................................................. 302,275 259,813 232,556 209,463 156,142 Total assets......................................................... 904,644 776,244 598,648 555,165 377,194 Total debt .......................................................... 288,777 219,749 165,994 166,626 148,040 Stockholders’ equity .......................................... 496,602 440,728 374,716 333,936 276,493 Ratio Data at End of Year (a) Current ratio ....................................................... 3.8x 3.2x 4.8x 4.6x 4.3x Debt to equity ratio ............................................ 58.2% 49.9% 44.3% 49.9% 53.5% Owned and Franchised Locations at Year End (a) Pawn lending operations .................................... 499 487 464 452 405 Cash advance operations (c) ............................... 304 295 286 253 154 Check cashing operations (d) .............................. 139 136 136 134 135 Total ............................................................... 942 918 886 839 694 (a) In September 2004, the Company sold its foreign pawn lending operations. The amounts for all periods presented have been
reclassified to reflect the foreign operations as discontinued operations. (b) See “Management’s Discussion and Analysis of Financial Condition and Results of Operations” and “Financial Statements and
Supplementary Data” for amounts related to the gain on the sale of foreign notes in 2007 and the gain from the early termination of a lease contract in 2006.
(c) Includes cash advance locations only. (d) Mr. Payroll locations only.

23
ITEM 7. MANAGEMENT’S DISCUSSION AND ANALYSIS OF FINANCIAL CONDITION AND RESULTS OF OPERATIONS
GENERAL The Company provides specialty financial services to individuals. These services include secured non-recourse loans, commonly referred to as pawn loans, to individuals through its pawn lending operations, unsecured cash advances in selected lending locations and on behalf of independent third-party lenders in other locations, and check cashing and related financial services through many of its lending locations and through franchised and Company-owned check cashing centers. The pawn loan portfolio generates finance and service charges revenue. A related activity of the pawn lending operations is the disposition of collateral from unredeemed pawn loans. In September 2006, the Company began offering online cash advances over the internet and began arranging loans online on behalf of independent third-party lenders in November 2006 through its internet distribution platform. In July 2007, the Company began offering short-term unsecured loans to customers who reside throughout the United Kingdom through its internet distribution platform.
On September 15, 2006, the Company, through its wholly-owned subsidiary Cash America Net Holdings, LLC, purchased substantially all of the assets of The Check Giant LLC (“TCG”), which offered short-term cash advances exclusively over the internet under the name “CashNetUSA.” The Company paid an initial purchase price of approximately $35.9 million in cash at closing and transaction costs of approximately $2.9 million. As of December 31, 2007, the Company had 942 total locations offering products and services to its customers. The Company operates in three segments: pawn lending, cash advance and check cashing. As of December 31, 2007, the Company’s pawn lending operations consisted of 499 pawnshops, including 485 Company-owned units and 14 unconsolidated franchised units located in 22 states in the United States. During the three-year period ended December 31, 2007, the Company acquired 33 operating units, established 15 locations, and combined or closed four locations for a net increase in owned pawn lending units of 44. In addition, it acquired or opened seven franchise locations, and either terminated or converted four locations to Company-owned locations. At December 31, 2007, the Company’s cash advance operations consisted of 304 cash advance locations in seven states and its internet distribution channel. For the three year period ended December 31, 2007, the Company acquired one location, established 60 locations and combined or closed 10 locations for a net increase in cash advance locations of 51. CashNetUSA serves multiple markets through its internet distribution channel and had cash advances outstanding in 32 states and in the United Kingdom as of December 31, 2007. As of December 31, 2007, the Company’s check cashing operations consisted of 134 franchised and five company-owned check cashing centers in 18 states. For the three year period ended December 31, 2007, the Company established 31 locations and combined or closed 26 locations for a net increase in check cashing locations of five. CRITICAL ACCOUNTING POLICIES AND ESTIMATES Management’s Discussion and Analysis of Financial Condition and Results of Operations is based on the Company’s consolidated financial statements, which have been prepared in accordance with accounting principles generally accepted in the United States. The preparation of these financial statements requires management to make estimates and assumptions that affect the reported amounts of assets and liabilities, and disclosure of contingent assets and liabilities, at the dates of the consolidated financial statements and the reported amounts of revenues and expenses during the reporting periods. On an on-going basis, management evaluates its estimates and judgments, including those related to revenue recognition,
24
merchandise held for disposition, allowance for losses on cash advances, long-lived and intangible assets, income taxes, contingencies and litigation. Management bases its estimates on historical experience, empirical data and on various other assumptions that are believed to be reasonable under the circumstances, the results of which form the basis for making judgments about the carrying values of assets and liabilities. Actual results may differ from these estimates under different assumptions or conditions. The development and selection of the critical accounting policies and the related disclosures below have been reviewed with the Audit Committee of the Board of Directors. Management believes the following critical accounting policies affect its more significant judgments and estimates used in the preparation of its consolidated financial statements. Finance and service charges revenue recognition. The Company accrues finance and service charges revenue only on those pawn loans that the Company deems collectible based on historical loan redemption statistics. Pawn loans written during each calendar month are aggregated and tracked for performance. The gathering of this empirical data allows the Company to analyze the characteristics of its outstanding pawn loan portfolio and estimate the probability of collection of finance and service charges. If the future actual performance of the loan portfolio differs significantly (positively or negatively) from expectations, revenue for the next reporting period would be likewise affected. Due to the short-term nature of pawn loans, the Company can quickly identify performance trends. For 2007, $159.5 million, or 99.1%, of recorded finance and service charges represented cash collected from customers and the remaining $1.5 million, or 0.9%, represented an increase in the finance and service charges receivable during the year. At the end of the current year and based on the revenue recognition method described above, the Company had accrued $27.0 million of finance and service charges receivable. Assuming the year-end accrual of finance and service charges revenue was overestimated by 10%, finance and service charges revenue would decrease by $2.7 million in 2008 and net income would decrease by $1.8 million. Some or all of the decrease would potentially be mitigated through the profit on the disposition of the related forfeited loan collateral. Merchandise held for disposition. Merchandise held for disposition consists primarily of forfeited collateral from pawn loans not repaid. The carrying value of the forfeited collateral is stated at the lower of cost (cash amount loaned) or market. Management provides an allowance for shrinkage and valuation based on its evaluation of the merchandise. Because pawn loans are made without recourse to the borrower, the Company does not investigate or rely upon the borrower’s creditworthiness, but instead bases its lending decision on an evaluation of the pledged personal property. The amount the Company is willing to finance is typically based on a percentage of the pledged personal property’s estimated disposition value. The Company uses numerous sources in determining an item’s estimated disposition value, including the Company’s automated product valuation system as well as catalogs, “blue books,” newspapers, internet research and previous experience with similar items. The Company performs a physical count of its merchandise in each location on a cyclical basis and reviews the composition of inventory by category and age in order to assess the adequacy of the allowance, which was $2.0 million, representing 2.0% of the balance of merchandise held for disposition at December 31, 2007. Adverse changes in the disposition value of the Company’s merchandise may require an increase in the valuation allowance.
Allowance for losses on cash advances. The Company maintains an allowance for losses on Company-owned cash advances (including fees and interest) and accrues losses for third-party lender-owned cash advances at a level estimated to be adequate to absorb credit losses in the outstanding combined cash advance portfolio. The cash advance product typically serves a customer base with high risk credit performance histories. These advances are typically single payment cash advances with a typical term of seven to 45 days. Cash advances written during each calendar month are aggregated and tracked to develop a performance history. The Company stratifies the outstanding portfolio by age, delinquency and stage of collection when assessing the adequacy of the allowance for losses. The Company uses current portfolio performance, as well as the performance of cash advances made during the same calendar period twelve months earlier to develop expected loss rates used in determining the allowance. Increased defaults and
25
credit losses, which could occur during a national or regional economic downturn or for other reasons, could require an increase in the allowance. Since cash advances are unsecured, unlike pawn loans, the portfolio’s performance depends on the Company’s ability to collect on defaulted loans. The Company believes it effectively manages the risks inherent in this product by utilizing a variety of underwriting criteria to evaluate prospective borrowers, maintaining a customer database to track individual borrowers’ performance and by closely monitoring the performance of the portfolio. Any remaining unpaid balance of a cash advance is charged off once it has been in default for 60 days or sooner if deemed uncollectible. At December 31, 2007, allowance for losses on cash advances was $25.7 million and accrued losses on third-party lender-owned cash advances were $1.8 million, in aggregate representing 18.5% of the combined cash advance portfolio. During fiscal year 2007, the cash advance loss provision for the combined cash advance portfolio, which increases the allowance for loan losses, was $155.2 million and reflects 7.7% of gross combined cash advances written by the Company and third-party lenders. If future loss rates increased, or decreased, by 10% (0.77%) from 2007 levels, the cash advance loss provision would increase, or decrease, by $15.5 million and net income would decrease, or increase, by $10.1 million, assuming the same volume of cash advances written in 2007. Valuation of long-lived and intangible assets. The Company assesses the impairment of long-lived assets whenever events or changes in circumstances indicate that the carrying value may not be recoverable. Intangible assets having an indefinite useful life are tested for impairment annually or more frequently if events or changes in circumstances indicate that the assets might be impaired. Factors that could trigger an impairment review include significant underperformance relative to expected historical or projected future cash flows, significant changes in the manner of use of acquired assets or the strategy for the overall business, and significant negative industry trends. When management determines that the carrying value of long-lived and intangible assets may not be recoverable, impairment is measured based on the excess of the assets’ carrying value over the estimated fair value. Income taxes. As part of the process of preparing its consolidated financial statements, the Company is required to estimate income taxes in each of the jurisdictions in which it operates. This process involves estimating the actual current tax exposure together with assessing temporary differences in recognition of income for tax and accounting purposes. These differences result in deferred tax assets and liabilities and are included within the Company’s consolidated balance sheets. Management must then assess the likelihood that the deferred tax assets will be recovered from future taxable income and, to the extent it believes that recovery is not likely, it must establish a valuation allowance. An expense, or benefit, is included within the tax provision in the statement of operations for any increase, or decrease, in the valuation allowance for a given period. Effective January 1, 2007, the Company began accounting for uncertainty in income taxes recognized in the financial statements in accordance with Financial Accounting Standards Board (“FASB”) Interpretation No. 48, “Accounting for Uncertainty in Income Taxes” (“FIN 48”). FIN 48 requires that a more-likely-than-not threshold be met before the benefit of a tax position may be recognized in the financial statements and prescribes how such benefit should be measured. Management must evaluate tax positions taken on the Company’s tax returns for all periods that are open to examination by taxing authorities and make a judgment as to whether and to what extent such positions are more likely than not to be sustained based on merit.
Management judgment is required in determining the provision for income taxes, the deferred tax assets and liabilities and any valuation allowance recorded against deferred tax assets. Management judgment is also required in evaluating whether tax benefits meet the more-likely-than-not threshold for recognition under FIN 48.
26
RECENT ACCOUNTING PRONOUNCEMENTS In September 2006, FASB issued Statement of Financial Accounting Standards No. 157, “Fair Value Measurements” (“SFAS 157”). SFAS 157 defines fair value to be the price that would be received to sell an asset or paid to transfer a liability in an orderly transaction between market participants at the measurement date and emphasizes that fair value is a market-based measurement, not an entity-specific measurement. It establishes a fair value hierarchy and expands disclosures about fair value measurements in both interim and annual periods. SFAS 157 will be effective for fiscal years beginning after November 15, 2007 and interim periods within those fiscal years. In December 2007, FASB issued proposed FASB Staff Position (“FSP”) FAS 157-b, which delays the effective date of SFAS 157 for nonfinancial assets and nonfinancial liabilities that are recognized or disclosed in the financial statements on a nonrecurring basis. The proposed FSP partially defers the effective date of SFAS 157 to fiscal years beginning after November 15, 2008, and interim periods within those fiscal years for items within the scope of this FSP. The Company does not expect SFAS 157 to have a material effect on the Company’s financial position or results of operations.
In February 2007, FASB issued Statement of Financial Accounting Standards No. 159, “The Fair Value Option for Financial Assets and Financial Liabilities” (“SFAS 159”). SFAS 159 permits entities to choose, at specified election dates, to measure eligible items at fair value (the “fair value option”) and requires an entity to report unrealized gains and losses on items for which the fair value option has been elected in earnings at each subsequent reporting date. Upfront costs and fees related to items for which the fair value option is elected shall be recognized in earnings as incurred and not deferred. SFAS 159 will be effective for fiscal years beginning after November 15, 2007. The Company does not expect SFAS 159 to have a material effect on the Company’s financial position or results of operations.
In December 2007, FASB issued Statement of Financial Accounting Standards No. 141, “Business Combinations – Revised” (“SFAS 141(R)”). SFAS 141(R) establishes principles and requirements for how an acquirer in a business combination: recognizes and measures in its financial statements the identifiable assets acquired, the liabilities assumed, and any non-controlling interest in the acquiree; recognizes and measures the goodwill acquired in the business combination or a gain from a bargain purchase price; and, determines what information to disclose to enable users of the consolidated financial statements to evaluate the nature and financial effects of the business combination. SFAS 141(R) applies prospectively to business combinations for which the acquisition date is on or after the beginning of the first annual reporting period beginning on or after December 15, 2008. In the past, the Company has completed significant acquisitions. The application of SFAS 141(R) will cause management to evaluate future transaction returns under different conditions, particularly the near term and long term economic impact of expensing transaction costs up front.
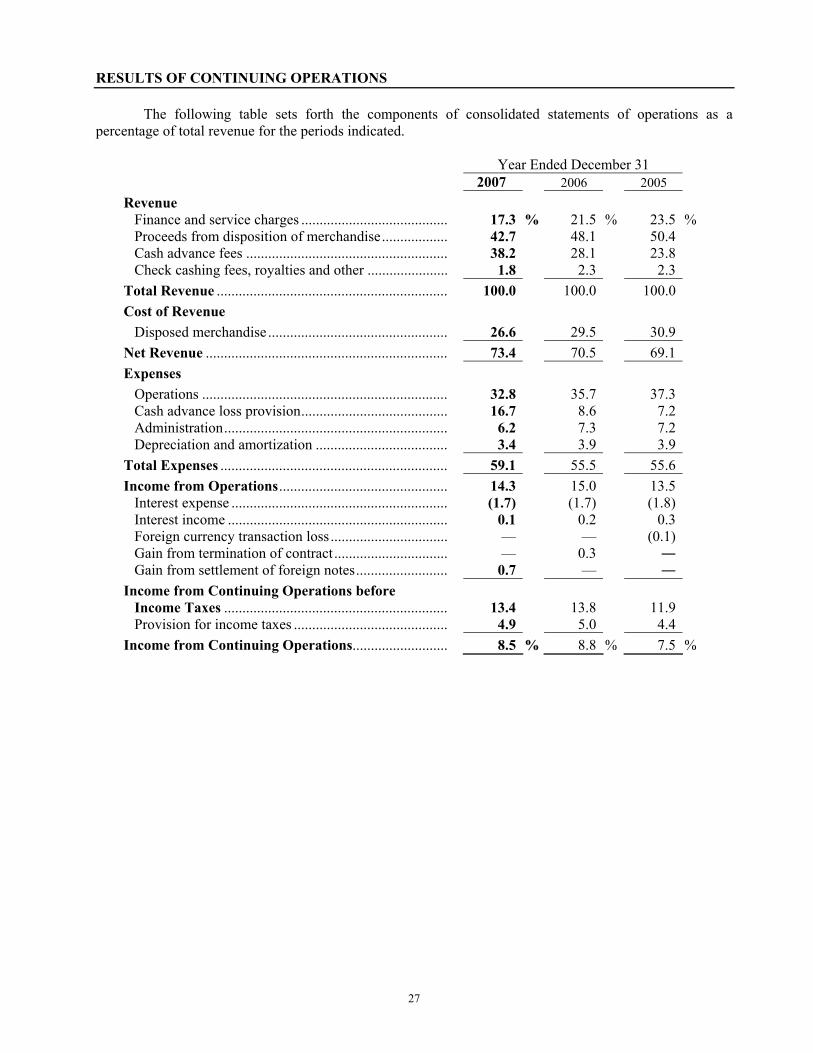
27
RESULTS OF CONTINUING OPERATIONS The following table sets forth the components of consolidated statements of operations as a percentage of total revenue for the periods indicated.
Year Ended December 31 2007 2006 2005 Revenue Finance and service charges ........................................ 17.3 % 21.5 % 23.5 % Proceeds from disposition of merchandise.................. 42.7 48.1 50.4 Cash advance fees ....................................................... 38.2 28.1 23.8 Check cashing fees, royalties and other ...................... 1.8 2.3 2.3 Total Revenue ............................................................... 100.0 100.0 100.0 Cost of Revenue Disposed merchandise ................................................. 26.6 29.5 30.9 Net Revenue .................................................................. 73.4 70.5 69.1 Expenses Operations ................................................................... 32.8 35.7 37.3 Cash advance loss provision........................................ 16.7 8.6 7.2 Administration............................................................. 6.2 7.3 7.2 Depreciation and amortization .................................... 3.4 3.9 3.9 Total Expenses .............................................................. 59.1 55.5 55.6 Income from Operations.............................................. 14.3 15.0 13.5 Interest expense ........................................................... (1.7) (1.7) (1.8) Interest income ............................................................ 0.1 0.2 0.3 Foreign currency transaction loss................................ — — (0.1) Gain from termination of contract ............................... — 0.3 Gain from settlement of foreign notes......................... 0.7 — Income from Continuing Operations before
Income Taxes ............................................................. 13.4
13.8
11.9
Provision for income taxes .......................................... 4.9 5.0 4.4 Income from Continuing Operations.......................... 8.5 % 8.8 % 7.5 %
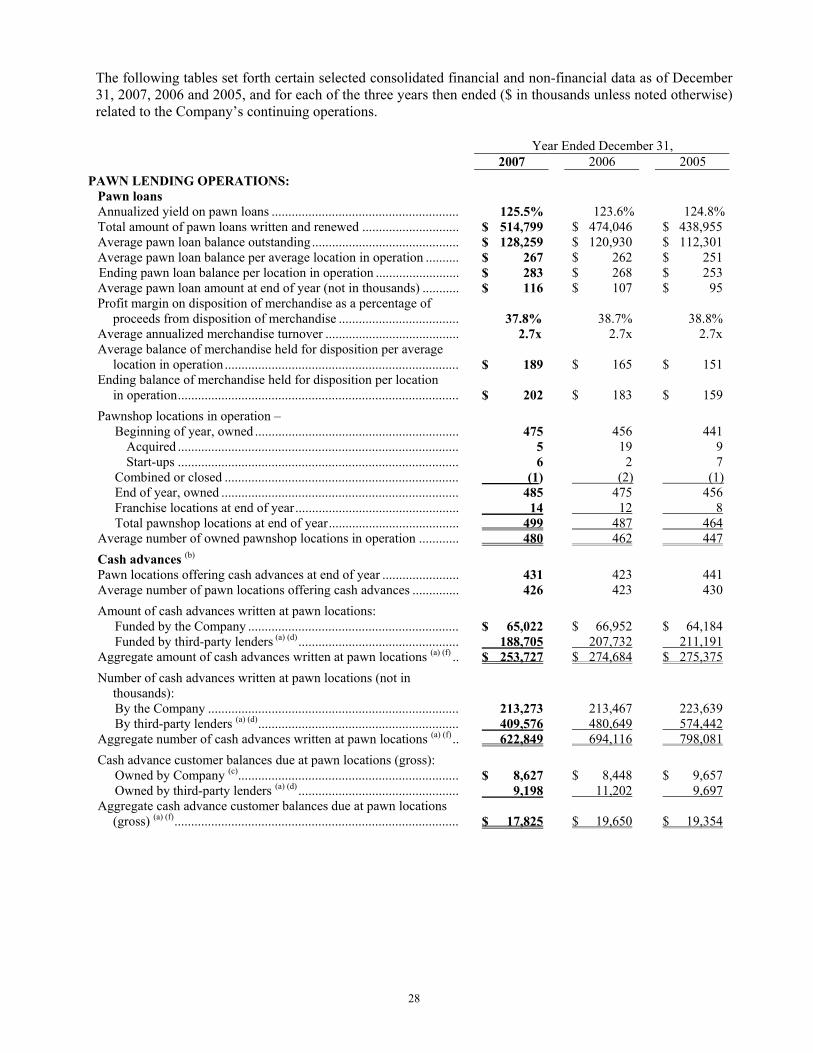
28
The following tables set forth certain selected consolidated financial and non-financial data as of December 31, 2007, 2006 and 2005, and for each of the three years then ended ($ in thousands unless noted otherwise) related to the Company’s continuing operations.
Year Ended December 31, 2007 2006 2005 PAWN LENDING OPERATIONS: Pawn loans Annualized yield on pawn loans ........................................................ 125.5% 123.6% 124.8% Total amount of pawn loans written and renewed ............................. $ 514,799 $ 474,046 $ 438,955 Average pawn loan balance outstanding............................................ $ 128,259 $ 120,930 $ 112,301 Average pawn loan balance per average location in operation .......... $ 267 $ 262 $ 251 Ending pawn loan balance per location in operation ......................... $ 283 $ 268 $ 253 Average pawn loan amount at end of year (not in thousands) ........... $ 116 $ 107 $ 95 Profit margin on disposition of merchandise as a percentage of
proceeds from disposition of merchandise ....................................
37.8%
38.7%
38.8%
Average annualized merchandise turnover ........................................ 2.7x 2.7x 2.7x Average balance of merchandise held for disposition per average
location in operation ......................................................................
$ 189
$ 165
$ 151
Ending balance of merchandise held for disposition per location in operation....................................................................................
$ 202
$ 183
$ 159
Pawnshop locations in operation – Beginning of year, owned ............................................................. 475 456 441 Acquired .................................................................................... 5 19 9 Start-ups .................................................................................... 6 2 7 Combined or closed ...................................................................... (1) (2) (1) End of year, owned ....................................................................... 485 475 456 Franchise locations at end of year................................................. 14 12 8 Total pawnshop locations at end of year....................................... 499 487 464 Average number of owned pawnshop locations in operation ............ 480 462 447 Cash advances (b) Pawn locations offering cash advances at end of year ....................... 431 423 441 Average number of pawn locations offering cash advances .............. 426 423 430 Amount of cash advances written at pawn locations: Funded by the Company ............................................................... $ 65,022 $ 66,952 $ 64,184 Funded by third-party lenders (a) (d) ................................................ 188,705 207,732 211,191 Aggregate amount of cash advances written at pawn locations (a) (f) .. $ 253,727 $ 274,684 $ 275,375 Number of cash advances written at pawn locations (not in
thousands):
By the Company ........................................................................... 213,273 213,467 223,639 By third-party lenders (a) (d)............................................................ 409,576 480,649 574,442 Aggregate number of cash advances written at pawn locations (a) (f) .. 622,849 694,116 798,081 Cash advance customer balances due at pawn locations (gross): Owned by Company (c).................................................................. $ 8,627 $ 8,448 $ 9,657 Owned by third-party lenders (a) (d) ................................................ 9,198 11,202 9,697 Aggregate cash advance customer balances due at pawn locations
(gross) (a) (f)..................................................................................... $ 17,825
$ 19,650
$ 19,354
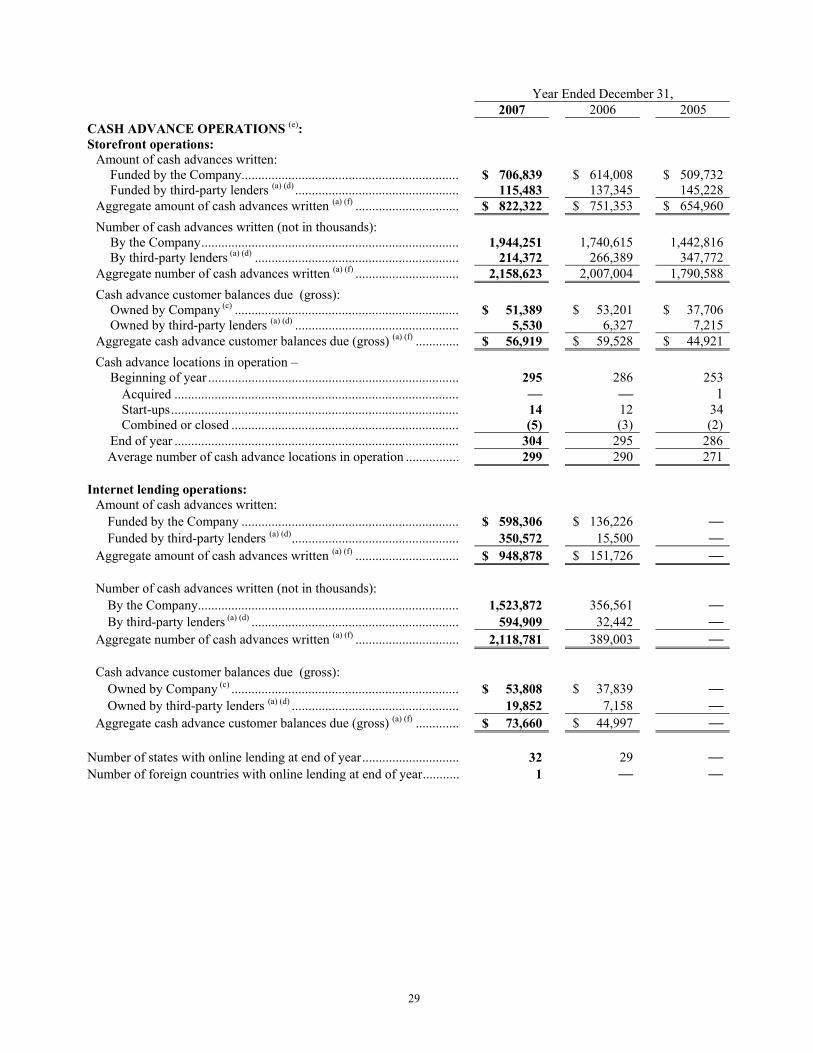
29
Year Ended December 31, 2007 2006 2005
CASH ADVANCE OPERATIONS (e): Storefront operations: Amount of cash advances written: Funded by the Company................................................................. $ 706,839 $ 614,008 $ 509,732 Funded by third-party lenders (a) (d) ................................................. 115,483 137,345 145,228 Aggregate amount of cash advances written (a) (f) ............................... $ 822,322 $ 751,353 $ 654,960 Number of cash advances written (not in thousands): By the Company............................................................................. 1,944,251 1,740,615 1,442,816 By third-party lenders (a) (d) ............................................................. 214,372 266,389 347,772 Aggregate number of cash advances written (a) (f) ............................... 2,158,623 2,007,004 1,790,588 Cash advance customer balances due (gross): Owned by Company (c) ................................................................... $ 51,389 $ 53,201 $ 37,706 Owned by third-party lenders (a) (d) ................................................. 5,530 6,327 7,215 Aggregate cash advance customer balances due (gross) (a) (f) ............. $ 56,919 $ 59,528 $ 44,921 Cash advance locations in operation – Beginning of year ........................................................................... 295 286 253 Acquired ..................................................................................... — — 1 Start-ups...................................................................................... 14 12 34 Combined or closed .................................................................... (5) (3) (2) End of year ..................................................................................... 304 295 286 Average number of cash advance locations in operation ................ 299 290 271 Internet lending operations: Amount of cash advances written: Funded by the Company ................................................................. $ 598,306 $ 136,226 — Funded by third-party lenders (a) (d).................................................. 350,572 15,500 — Aggregate amount of cash advances written (a) (f) ............................... $ 948,878 $ 151,726 — Number of cash advances written (not in thousands): By the Company.............................................................................. 1,523,872 356,561 — By third-party lenders (a) (d) .............................................................. 594,909 32,442 — Aggregate number of cash advances written (a) (f) ............................... 2,118,781 389,003 — Cash advance customer balances due (gross): Owned by Company (c) .................................................................... $ 53,808 $ 37,839 — Owned by third-party lenders (a) (d) .................................................. 19,852 7,158 — Aggregate cash advance customer balances due (gross) (a) (f) ............. $ 73,660 $ 44,997 — Number of states with online lending at end of year............................. 32 29 — Number of foreign countries with online lending at end of year........... 1 — —
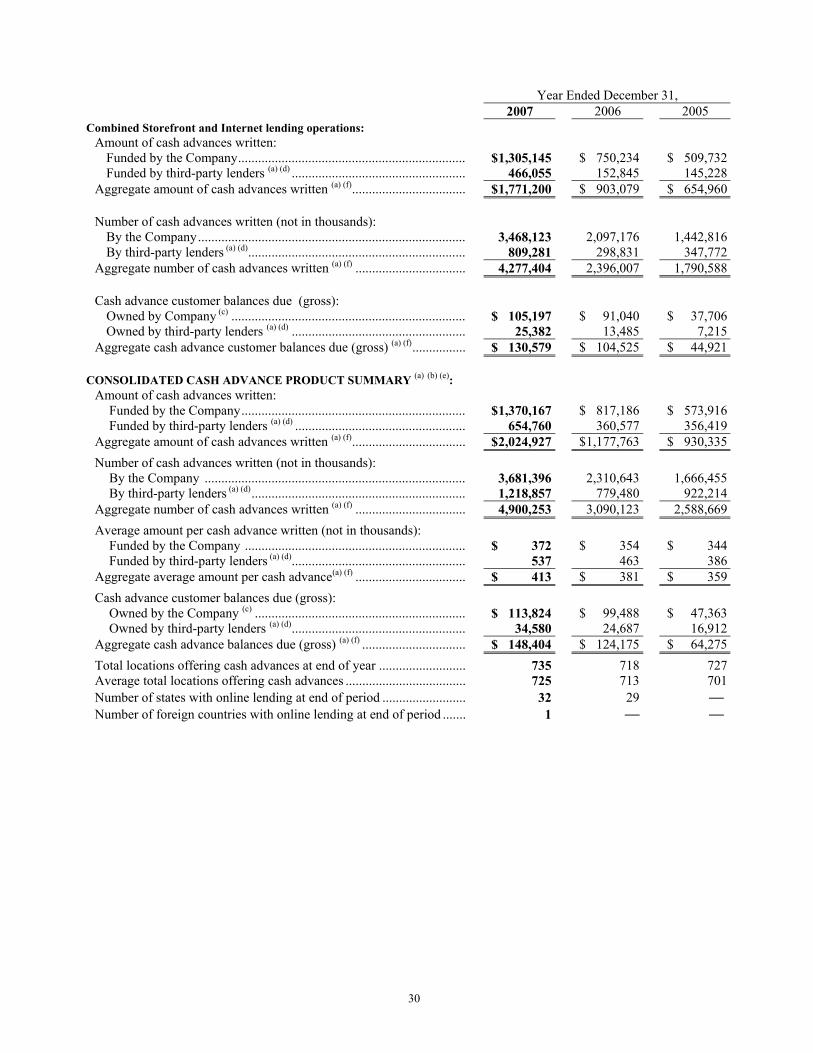
30
Year Ended December 31, 2007 2006 2005 Combined Storefront and Internet lending operations: Amount of cash advances written: Funded by the Company.................................................................... $ 1,305,145 $ 750,234 $ 509,732 Funded by third-party lenders (a) (d) .................................................... 466,055 152,845 145,228 Aggregate amount of cash advances written (a) (f).................................. $ 1,771,200 $ 903,079 $ 654,960 Number of cash advances written (not in thousands): By the Company................................................................................ 3,468,123 2,097,176 1,442,816 By third-party lenders (a) (d)................................................................. 809,281 298,831 347,772 Aggregate number of cash advances written (a) (f) ................................. 4,277,404 2,396,007 1,790,588 Cash advance customer balances due (gross): Owned by Company (c) ...................................................................... $ 105,197 $ 91,040 $ 37,706 Owned by third-party lenders (a) (d) .................................................... 25,382 13,485 7,215 Aggregate cash advance customer balances due (gross) (a) (f)................ $ 130,579 $ 104,525 $ 44,921 CONSOLIDATED CASH ADVANCE PRODUCT SUMMARY (a) (b) (e): Amount of cash advances written: Funded by the Company................................................................... $ 1,370,167 $ 817,186 $ 573,916 Funded by third-party lenders (a) (d) ................................................... 654,760 360,577 356,419 Aggregate amount of cash advances written (a) (f).................................. $ 2,024,927 $ 1,177,763 $ 930,335 Number of cash advances written (not in thousands): By the Company .............................................................................. 3,681,396 2,310,643 1,666,455 By third-party lenders (a) (d)................................................................ 1,218,857 779,480 922,214 Aggregate number of cash advances written (a) (f) ................................. 4,900,253 3,090,123 2,588,669 Average amount per cash advance written (not in thousands): Funded by the Company .................................................................. $ 372 $ 354 $ 344 Funded by third-party lenders (a) (d).................................................... 537 463 386 Aggregate average amount per cash advance(a) (f) ................................. $ 413 $ 381 $ 359 Cash advance customer balances due (gross): Owned by the Company (c) ............................................................... $ 113,824 $ 99,488 $ 47,363 Owned by third-party lenders (a) (d).................................................... 34,580 24,687 16,912 Aggregate cash advance balances due (gross) (a) (f) ............................... $ 148,404 $ 124,175 $ 64,275 Total locations offering cash advances at end of year .......................... 735 718 727 Average total locations offering cash advances .................................... 725 713 701 Number of states with online lending at end of period ......................... 32 29 — Number of foreign countries with online lending at end of period ....... 1 — —

31
Year Ended December 31, 2007 2006 2005 CHECK CASHING OPERATIONS (Mr. Payroll): Centers in operation at end of year (not in thousands): Company-owned locations................................................................ 5 5 5 Franchised locations (a) ...................................................................... 134 131 131 Combined centers in operation at end of year (a).................................... 139 136 136 Revenue from Company-owned locations............................................. $ 484 $ 569 $ 565 Revenue from franchise royalties and other ......................................... 3,135 3,356 3,254 Total revenue (c)................................................................................. $ 3,619 $ 3,925 $ 3,819 Face amount of checks cashed: Company-owned locations................................................................ $ 33,746 $ 38,446 $ 38,699 Franchised locations (a) ...................................................................... 1,260,995 1,269,724 1,181,682 Combined face amount of check cashed (a)............................................ $ 1,294,741 $ 1,308,170 $ 1,220,381 Fees collected from customers: Company-owned locations (c) ............................................................ $ 484 $ 569 $ 565 Franchised locations (a) ...................................................................... 17,678 17,889 16,399 Combined fees collected from customers (a) .......................................... $ 18,162 $ 18,458 $ 16,964 Fees as a percentage of check cashed: Company-owned locations................................................................ 1.4% 1.5% 1.5% Franchised locations (a) ...................................................................... 1.4 1.4 1.4 Combined fees as a percentage of check cashed (a)................................ 1.4% 1.4% 1.4% Average check cashed (not in thousands): Company-owned locations................................................................ $ 392 $ 393 $ 386 Franchised locations (a) ...................................................................... 436 421 386 Combined average check cashed (a) ....................................................... $ 435 $ 420 $ 386 (a) Non-GAAP presentation. For informational purposes and to provide a greater understanding of the Company’s businesses.
Management believes that information provided with this level of detail is meaningful and useful in understanding the activities and business metrics of the Company’s operations.
(b) Includes cash advance activities at the Company’s pawn lending locations.
(c) Amounts recorded in the Company’s consolidated financial statements.
(d) Cash advances written by third-party lenders that were arranged by the Company on behalf of the third-party lenders, all at the Company’s pawn locations, cash advance locations and through the internet distribution channel.
(e) Includes cash advance activities at the Company’s cash advance storefront locations and through the Company’s internet distribution channel.
(f) Includes (i) cash advances written by the Company, and (ii) cash advances written by third-party lenders that were arranged by the Company on behalf of the third-party lenders, all at the Company’s pawn and cash advance locations and through the Company’s internet distribution channel.

32
OVERVIEW Components of Consolidated Net Revenue. Consolidated net revenue is total revenue reduced by the cost of merchandise sold in the period. It represents the income available to satisfy expenses and is the measure management uses to evaluate top line performance. The components of consolidated net revenue are: finance and service charges from pawn loans, profit from the disposition of merchandise, cash advance fees, and other revenue. Other revenue is comprised mostly of check cashing fees but includes royalties and small miscellaneous other revenue items. Growth in cash advance fees has increased the related contribution of the cash advance products to consolidated net revenue during each of the three years of 2007, 2006 and 2005. Net revenue related to cash advance fees eclipsed pawn related net revenue, defined as finance and service charges on pawn loans plus the profit from disposition of merchandise, to become the largest component of net revenue in 2007. The growth in cash advance fees is primarily attributable to higher average balances, the addition of new units and the addition of cash advances made over the internet beginning in mid-September of 2006. Net revenue from pawn lending activities contributed 45.6%, 56.9% and 62.2% of net revenue for 2007, 2006 and 2005, respectively. The following graphs show consolidated net revenue and depict the mix of the components of net revenue for the years ended December 31, 2007, 2006 and 2005:
Contribution to Increase in Net Revenue. The Company’s net revenue increased 39.4% and 18.8% for the years ended December 31, 2007 and 2006, respectively, compared to the prior year periods. Cash advance fees have contributed the majority of the increase primarily because of the additional revenue and subsequent growth in revenue that followed the September 2006 acquisition of a business offering cash advances over the internet. In addition, higher average balances owed by customers, and the growth and development of newly opened cash advance locations contributed to the increase. As illustrated below, these increases represented 82.9% of the overall increase in net revenue from 2006 to 2007 and 68.3% of the Company’s overall increase in net revenue from 2005 to 2006. The increase in aggregate pawn related net revenue, including both finance and service charges and profit from the disposition of merchandise, contributed 16.8% of the year over year increase in net revenue for 2007 compared to 28.9% of growth in 2006.
While the percentage of pawn lending operations’ contribution to the growth in consolidated net revenue was smaller in the years ended December 31, 2007 and 2006 than in each of the respective prior years, net revenue from pawn lending activities increased 9.6% and 8.2% for the years ended December 31,
2007$682.6 million
22.0%
26.4% 28.3%
33.9%
3.3%
34.5%30.5%23.6%
3.2%2.4%
39.9%
52.0%
2006$489.6 million
2005$412.0 million
Finance and service charges
Profit from the disposition of merchandise
Cash advance fees
Other revenue
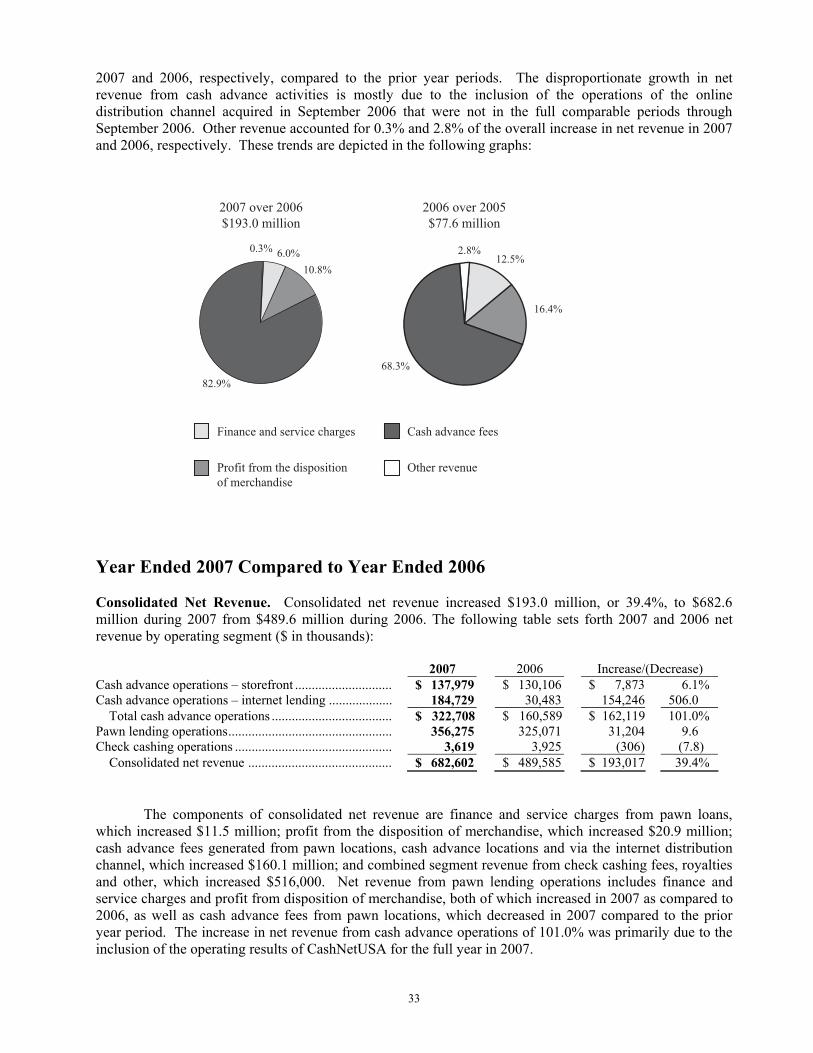
33
2007 and 2006, respectively, compared to the prior year periods. The disproportionate growth in net revenue from cash advance activities is mostly due to the inclusion of the operations of the online distribution channel acquired in September 2006 that were not in the full comparable periods through September 2006. Other revenue accounted for 0.3% and 2.8% of the overall increase in net revenue in 2007 and 2006, respectively. These trends are depicted in the following graphs: Year Ended 2007 Compared to Year Ended 2006 Consolidated Net Revenue. Consolidated net revenue increased $193.0 million, or 39.4%, to $682.6 million during 2007 from $489.6 million during 2006. The following table sets forth 2007 and 2006 net revenue by operating segment ($ in thousands): 2007 2006 Increase/(Decrease) Cash advance operations – storefront ............................. $ 137,979 $ 130,106 $ 7,873 6.1% Cash advance operations – internet lending ................... 184,729 30,483 154,246 506.0 Total cash advance operations .................................... $ 322,708 $ 160,589 $ 162,119 101.0% Pawn lending operations................................................. 356,275 325,071 31,204 9.6 Check cashing operations ............................................... 3,619 3,925 (306) (7.8) Consolidated net revenue ........................................... $ 682,602 $ 489,585 $ 193,017 39.4%
The components of consolidated net revenue are finance and service charges from pawn loans, which increased $11.5 million; profit from the disposition of merchandise, which increased $20.9 million; cash advance fees generated from pawn locations, cash advance locations and via the internet distribution channel, which increased $160.1 million; and combined segment revenue from check cashing fees, royalties and other, which increased $516,000. Net revenue from pawn lending operations includes finance and service charges and profit from disposition of merchandise, both of which increased in 2007 as compared to 2006, as well as cash advance fees from pawn locations, which decreased in 2007 compared to the prior year period. The increase in net revenue from cash advance operations of 101.0% was primarily due to the inclusion of the operating results of CashNetUSA for the full year in 2007.
2006 over 2005$77.6 million
16.4%
82.9%
10.8%12.5%6.0% 2.8%0.3%
68.3%
2007 over 2006$193.0 million
Finance and service charges
Profit from the disposition of merchandise
Cash advance fees
Other revenue
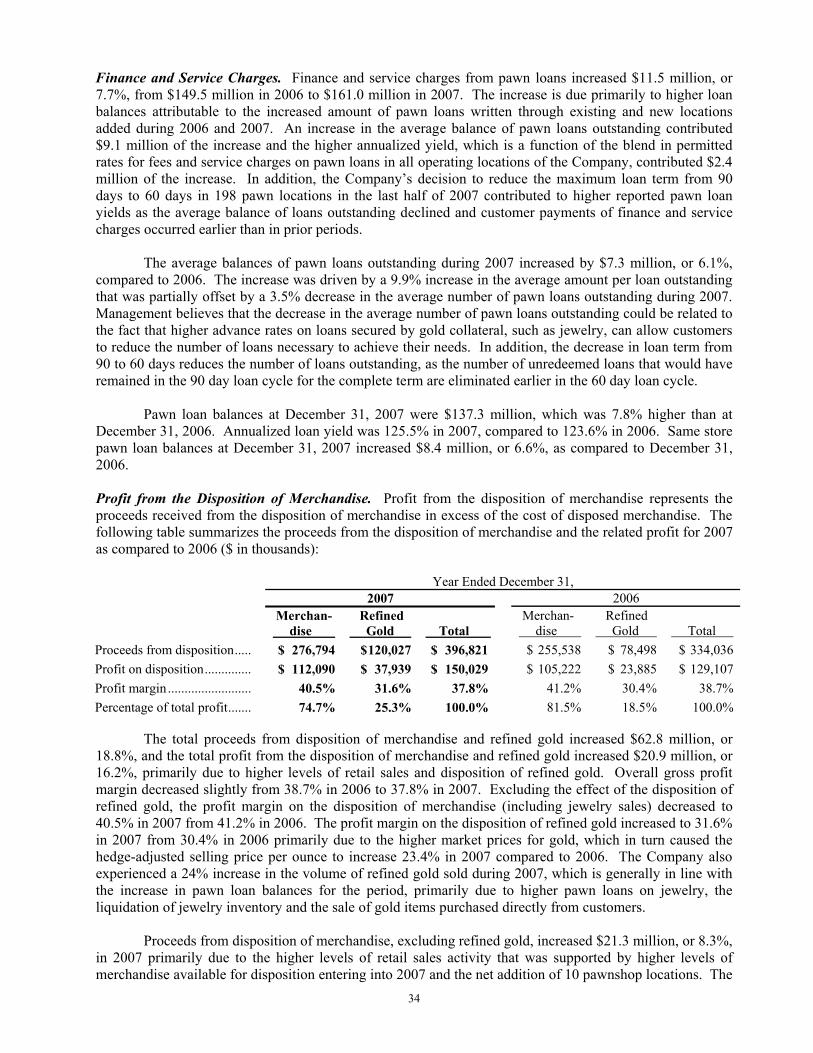
34
Finance and Service Charges. Finance and service charges from pawn loans increased $11.5 million, or 7.7%, from $149.5 million in 2006 to $161.0 million in 2007. The increase is due primarily to higher loan balances attributable to the increased amount of pawn loans written through existing and new locations added during 2006 and 2007. An increase in the average balance of pawn loans outstanding contributed $9.1 million of the increase and the higher annualized yield, which is a function of the blend in permitted rates for fees and service charges on pawn loans in all operating locations of the Company, contributed $2.4 million of the increase. In addition, the Company’s decision to reduce the maximum loan term from 90 days to 60 days in 198 pawn locations in the last half of 2007 contributed to higher reported pawn loan yields as the average balance of loans outstanding declined and customer payments of finance and service charges occurred earlier than in prior periods. The average balances of pawn loans outstanding during 2007 increased by $7.3 million, or 6.1%, compared to 2006. The increase was driven by a 9.9% increase in the average amount per loan outstanding that was partially offset by a 3.5% decrease in the average number of pawn loans outstanding during 2007. Management believes that the decrease in the average number of pawn loans outstanding could be related to the fact that higher advance rates on loans secured by gold collateral, such as jewelry, can allow customers to reduce the number of loans necessary to achieve their needs. In addition, the decrease in loan term from 90 to 60 days reduces the number of loans outstanding, as the number of unredeemed loans that would have remained in the 90 day loan cycle for the complete term are eliminated earlier in the 60 day loan cycle.
Pawn loan balances at December 31, 2007 were $137.3 million, which was 7.8% higher than at December 31, 2006. Annualized loan yield was 125.5% in 2007, compared to 123.6% in 2006. Same store pawn loan balances at December 31, 2007 increased $8.4 million, or 6.6%, as compared to December 31, 2006. Profit from the Disposition of Merchandise. Profit from the disposition of merchandise represents the proceeds received from the disposition of merchandise in excess of the cost of disposed merchandise. The following table summarizes the proceeds from the disposition of merchandise and the related profit for 2007 as compared to 2006 ($ in thousands): Year Ended December 31, 2007 2006 Merchan- Refined Merchan- Refined dise Gold Total dise Gold Total Proceeds from disposition..... $ 276,794 $ 120,027 $ 396,821 $ 255,538 $ 78,498 $ 334,036 Profit on disposition.............. $ 112,090 $ 37,939 $ 150,029 $ 105,222 $ 23,885 $ 129,107 Profit margin ......................... 40.5% 31.6% 37.8% 41.2% 30.4 % 38.7% Percentage of total profit....... 74.7% 25.3% 100.0% 81.5% 18.5 % 100.0% The total proceeds from disposition of merchandise and refined gold increased $62.8 million, or 18.8%, and the total profit from the disposition of merchandise and refined gold increased $20.9 million, or 16.2%, primarily due to higher levels of retail sales and disposition of refined gold. Overall gross profit margin decreased slightly from 38.7% in 2006 to 37.8% in 2007. Excluding the effect of the disposition of refined gold, the profit margin on the disposition of merchandise (including jewelry sales) decreased to 40.5% in 2007 from 41.2% in 2006. The profit margin on the disposition of refined gold increased to 31.6% in 2007 from 30.4% in 2006 primarily due to the higher market prices for gold, which in turn caused the hedge-adjusted selling price per ounce to increase 23.4% in 2007 compared to 2006. The Company also experienced a 24% increase in the volume of refined gold sold during 2007, which is generally in line with the increase in pawn loan balances for the period, primarily due to higher pawn loans on jewelry, the liquidation of jewelry inventory and the sale of gold items purchased directly from customers.
Proceeds from disposition of merchandise, excluding refined gold, increased $21.3 million, or 8.3%, in 2007 primarily due to the higher levels of retail sales activity that was supported by higher levels of merchandise available for disposition entering into 2007 and the net addition of 10 pawnshop locations. The
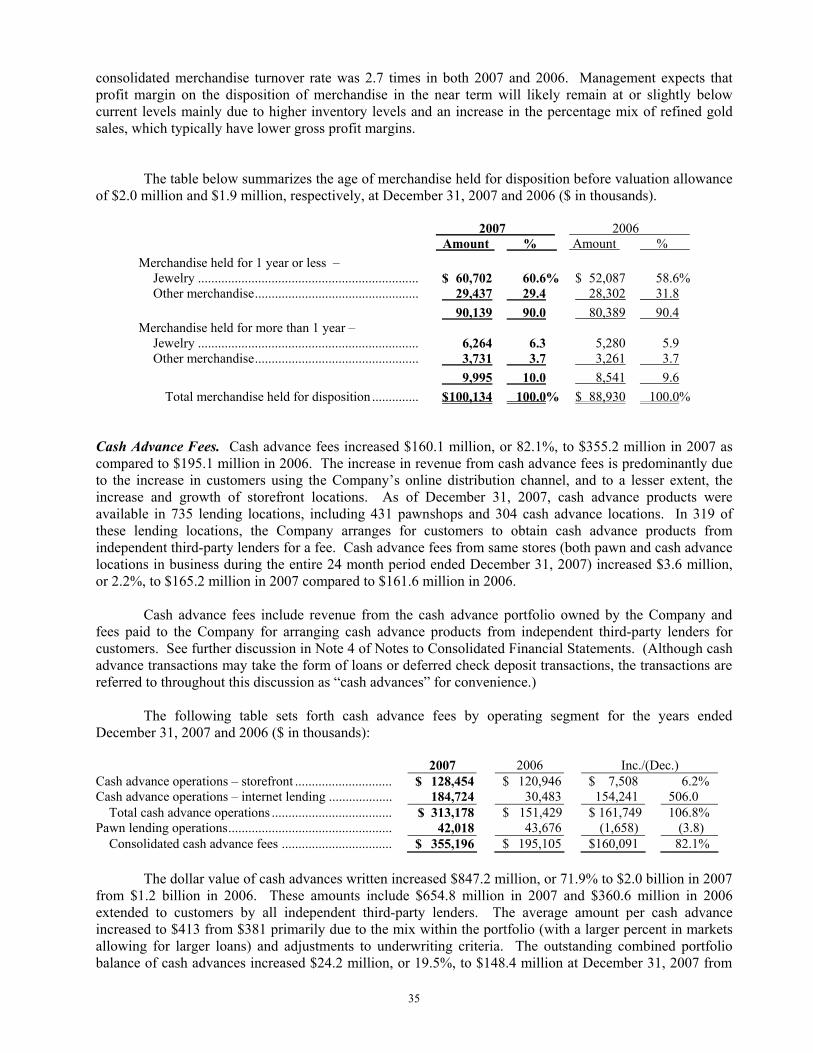
35
consolidated merchandise turnover rate was 2.7 times in both 2007 and 2006. Management expects that profit margin on the disposition of merchandise in the near term will likely remain at or slightly below current levels mainly due to higher inventory levels and an increase in the percentage mix of refined gold sales, which typically have lower gross profit margins.
The table below summarizes the age of merchandise held for disposition before valuation allowance of $2.0 million and $1.9 million, respectively, at December 31, 2007 and 2006 ($ in thousands).
2007 2006 Amount % Amount % Merchandise held for 1 year or less – Jewelry .................................................................. $ 60,702 60.6% $ 52,087 58.6% Other merchandise................................................. 29,437 29.4 28,302 31.8 90,139 90.0 80,389 90.4 Merchandise held for more than 1 year – Jewelry .................................................................. 6,264 6.3 5,280 5.9 Other merchandise................................................. 3,731 3.7 3,261 3.7 9,995 10.0 8,541 9.6 Total merchandise held for disposition .............. $ 100,134 100.0% $ 88,930 100.0%
Cash Advance Fees. Cash advance fees increased $160.1 million, or 82.1%, to $355.2 million in 2007 as compared to $195.1 million in 2006. The increase in revenue from cash advance fees is predominantly due to the increase in customers using the Company’s online distribution channel, and to a lesser extent, the increase and growth of storefront locations. As of December 31, 2007, cash advance products were available in 735 lending locations, including 431 pawnshops and 304 cash advance locations. In 319 of these lending locations, the Company arranges for customers to obtain cash advance products from independent third-party lenders for a fee. Cash advance fees from same stores (both pawn and cash advance locations in business during the entire 24 month period ended December 31, 2007) increased $3.6 million, or 2.2%, to $165.2 million in 2007 compared to $161.6 million in 2006. Cash advance fees include revenue from the cash advance portfolio owned by the Company and fees paid to the Company for arranging cash advance products from independent third-party lenders for customers. See further discussion in Note 4 of Notes to Consolidated Financial Statements. (Although cash advance transactions may take the form of loans or deferred check deposit transactions, the transactions are referred to throughout this discussion as “cash advances” for convenience.) The following table sets forth cash advance fees by operating segment for the years ended December 31, 2007 and 2006 ($ in thousands): 2007 2006 Inc./(Dec.) Cash advance operations – storefront ............................. $ 128,454 $ 120,946 $ 7,508 6.2% Cash advance operations – internet lending ................... 184,724 30,483 154,241 506.0 Total cash advance operations .................................... $ 313,178 $ 151,429 $ 161,749 106.8% Pawn lending operations................................................. 42,018 43,676 (1,658) (3.8) Consolidated cash advance fees ................................. $ 355,196 $ 195,105 $160,091 82.1% The dollar value of cash advances written increased $847.2 million, or 71.9% to $2.0 billion in 2007 from $1.2 billion in 2006. These amounts include $654.8 million in 2007 and $360.6 million in 2006 extended to customers by all independent third-party lenders. The average amount per cash advance increased to $413 from $381 primarily due to the mix within the portfolio (with a larger percent in markets allowing for larger loans) and adjustments to underwriting criteria. The outstanding combined portfolio balance of cash advances increased $24.2 million, or 19.5%, to $148.4 million at December 31, 2007 from
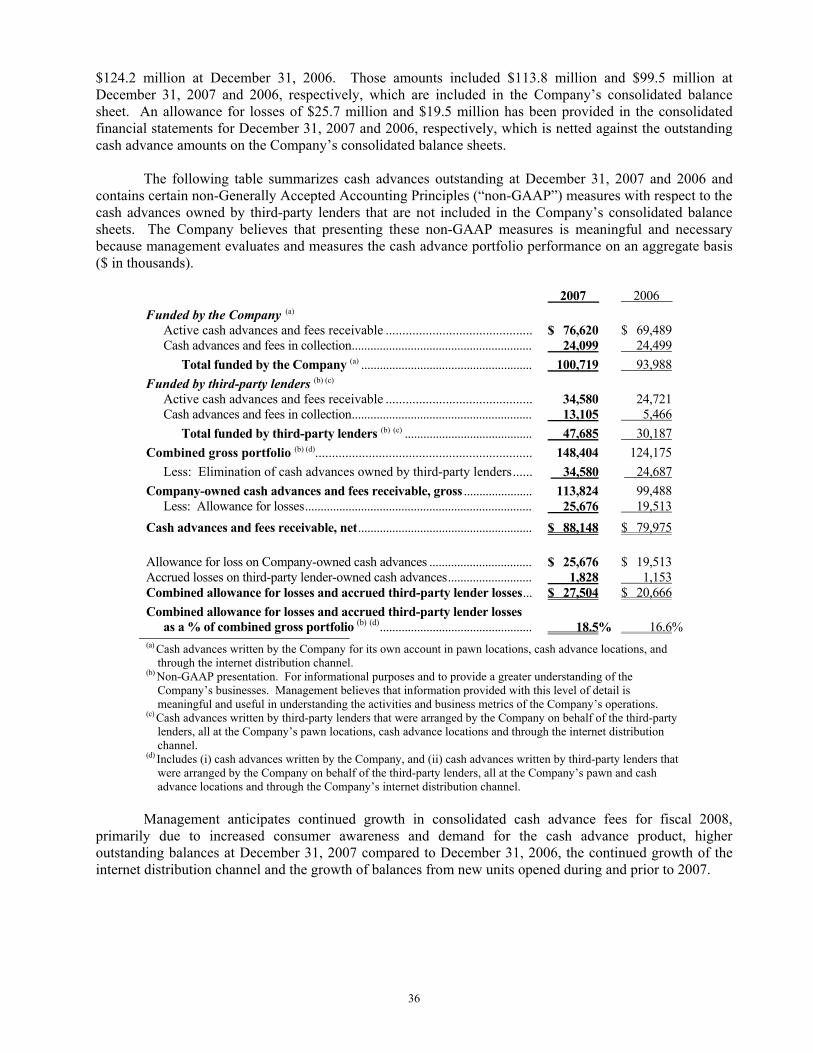
36
$124.2 million at December 31, 2006. Those amounts included $113.8 million and $99.5 million at December 31, 2007 and 2006, respectively, which are included in the Company’s consolidated balance sheet. An allowance for losses of $25.7 million and $19.5 million has been provided in the consolidated financial statements for December 31, 2007 and 2006, respectively, which is netted against the outstanding cash advance amounts on the Company’s consolidated balance sheets.
The following table summarizes cash advances outstanding at December 31, 2007 and 2006 and contains certain non-Generally Accepted Accounting Principles (“non-GAAP”) measures with respect to the cash advances owned by third-party lenders that are not included in the Company’s consolidated balance sheets. The Company believes that presenting these non-GAAP measures is meaningful and necessary because management evaluates and measures the cash advance portfolio performance on an aggregate basis ($ in thousands).
2007 2006 Funded by the Company (a) Active cash advances and fees receivable ............................................ $ 76,620 $ 69,489 Cash advances and fees in collection.......................................................... 24,099 24,499 Total funded by the Company (a) ....................................................... 100,719 93,988 Funded by third-party lenders (b) (c) Active cash advances and fees receivable ............................................ 34,580 24,721 Cash advances and fees in collection.......................................................... 13,105 5,466 Total funded by third-party lenders (b) (c) ......................................... 47,685 30,187 Combined gross portfolio (b) (d)................................................................. 148,404 124,175 Less: Elimination of cash advances owned by third-party lenders...... 34,580 24,687 Company-owned cash advances and fees receivable, gross ...................... 113,824 99,488 Less: Allowance for losses......................................................................... 25,676 19,513 Cash advances and fees receivable, net........................................................ $ 88,148 $ 79,975 Allowance for loss on Company-owned cash advances ................................. $ 25,676 $ 19,513 Accrued losses on third-party lender-owned cash advances........................... 1,828 1,153 Combined allowance for losses and accrued third-party lender losses... $ 27,504 $ 20,666 Combined allowance for losses and accrued third-party lender losses
as a % of combined gross portfolio (b) (d)................................................. 18.5% 16.6% (a) Cash advances written by the Company for its own account in pawn locations, cash advance locations, and
through the internet distribution channel. (b) Non-GAAP presentation. For informational purposes and to provide a greater understanding of the
Company’s businesses. Management believes that information provided with this level of detail is meaningful and useful in understanding the activities and business metrics of the Company’s operations.
(c) Cash advances written by third-party lenders that were arranged by the Company on behalf of the third-party lenders, all at the Company’s pawn locations, cash advance locations and through the internet distribution channel.
(d) Includes (i) cash advances written by the Company, and (ii) cash advances written by third-party lenders that were arranged by the Company on behalf of the third-party lenders, all at the Company’s pawn and cash advance locations and through the Company’s internet distribution channel.
Management anticipates continued growth in consolidated cash advance fees for fiscal 2008, primarily due to increased consumer awareness and demand for the cash advance product, higher outstanding balances at December 31, 2007 compared to December 31, 2006, the continued growth of the internet distribution channel and the growth of balances from new units opened during and prior to 2007.
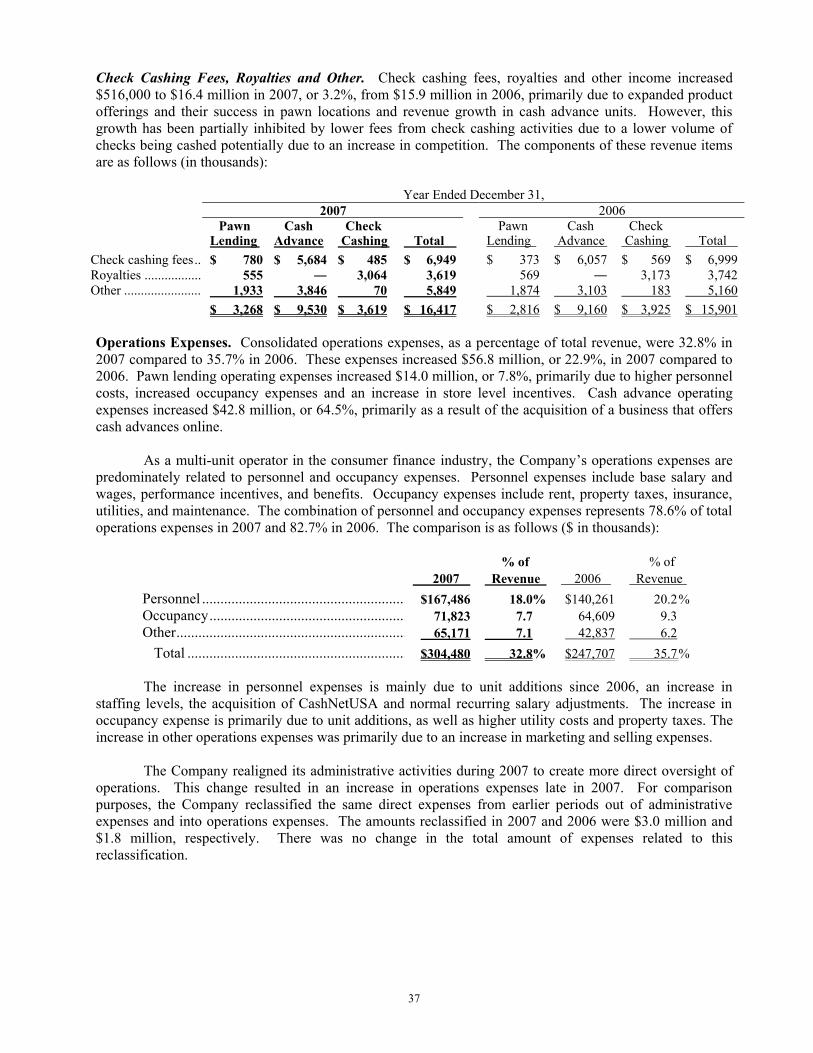
37
Check Cashing Fees, Royalties and Other. Check cashing fees, royalties and other income increased $516,000 to $16.4 million in 2007, or 3.2%, from $15.9 million in 2006, primarily due to expanded product offerings and their success in pawn locations and revenue growth in cash advance units. However, this growth has been partially inhibited by lower fees from check cashing activities due to a lower volume of checks being cashed potentially due to an increase in competition. The components of these revenue items are as follows (in thousands):
Year Ended December 31, 2007 2006 Pawn Cash Check Pawn Cash Check Lending Advance Cashing Total Lending Advance Cashing Total Check cashing fees... $ 780 $ 5,684 $ 485 $ 6,949 $ 373 $ 6,057 $ 569 $ 6,999 Royalties .................. 555 3,064 3,619 569 3,173 3,742 Other ........................ 1,933 3,846 70 5,849 1,874 3,103 183 5,160 $ 3,268 $ 9,530 $ 3,619 $ 16,417 $ 2,816 $ 9,160 $ 3,925 $ 15,901 Operations Expenses. Consolidated operations expenses, as a percentage of total revenue, were 32.8% in 2007 compared to 35.7% in 2006. These expenses increased $56.8 million, or 22.9%, in 2007 compared to 2006. Pawn lending operating expenses increased $14.0 million, or 7.8%, primarily due to higher personnel costs, increased occupancy expenses and an increase in store level incentives. Cash advance operating expenses increased $42.8 million, or 64.5%, primarily as a result of the acquisition of a business that offers cash advances online. As a multi-unit operator in the consumer finance industry, the Company’s operations expenses are predominately related to personnel and occupancy expenses. Personnel expenses include base salary and wages, performance incentives, and benefits. Occupancy expenses include rent, property taxes, insurance, utilities, and maintenance. The combination of personnel and occupancy expenses represents 78.6% of total operations expenses in 2007 and 82.7% in 2006. The comparison is as follows ($ in thousands):
% of % of 2007 Revenue 2006 Revenue Personnel ........................................................ $167,486 18.0% $140,261 20.2 %Occupancy...................................................... 71,823 7.7 64,609 9.3 Other............................................................... 65,171 7.1 42,837 6.2 Total ............................................................ $304,480 32.8% $247,707 35.7 %
The increase in personnel expenses is mainly due to unit additions since 2006, an increase in
staffing levels, the acquisition of CashNetUSA and normal recurring salary adjustments. The increase in occupancy expense is primarily due to unit additions, as well as higher utility costs and property taxes. The increase in other operations expenses was primarily due to an increase in marketing and selling expenses.
The Company realigned its administrative activities during 2007 to create more direct oversight of operations. This change resulted in an increase in operations expenses late in 2007. For comparison purposes, the Company reclassified the same direct expenses from earlier periods out of administrative expenses and into operations expenses. The amounts reclassified in 2007 and 2006 were $3.0 million and $1.8 million, respectively. There was no change in the total amount of expenses related to this reclassification.
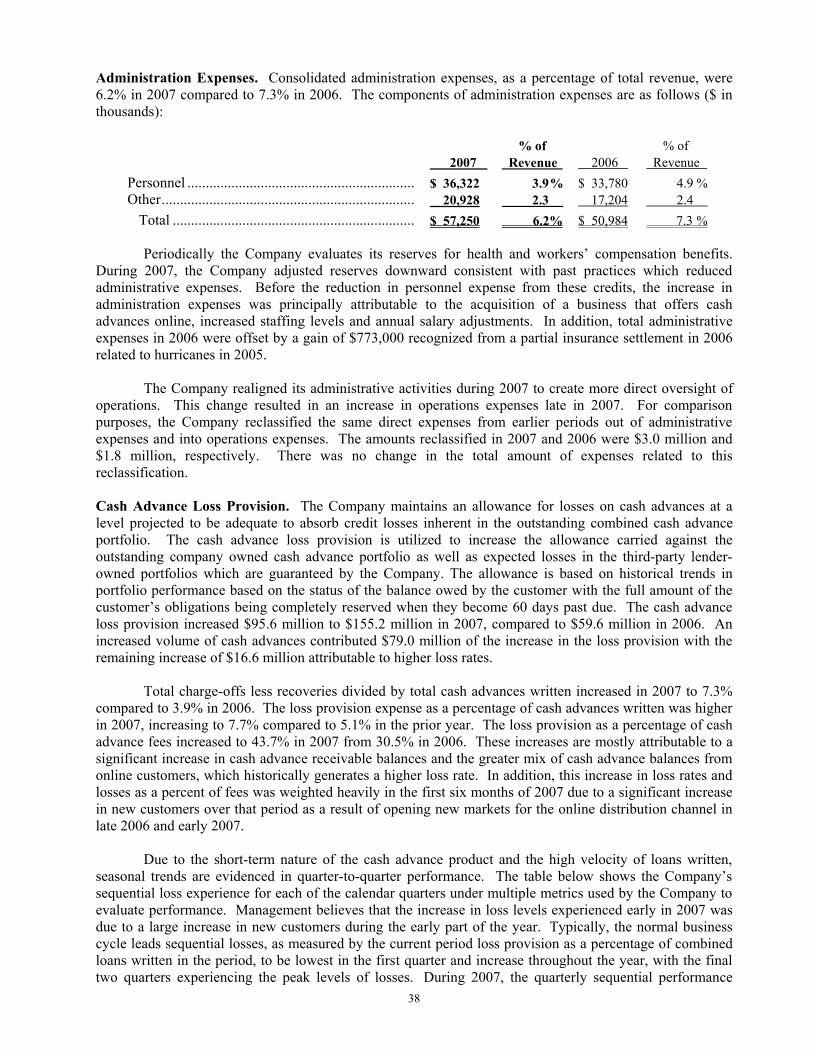
38
Administration Expenses. Consolidated administration expenses, as a percentage of total revenue, were 6.2% in 2007 compared to 7.3% in 2006. The components of administration expenses are as follows ($ in thousands):
% of % of 2007 Revenue 2006 Revenue Personnel .............................................................. $ 36,322 3.9 % $ 33,780 4.9 %Other..................................................................... 20,928 2.3 17,204 2.4
1 1 Total .................................................................. $ 57,250 6.2% $ 50,984 7.3 %
Periodically the Company evaluates its reserves for health and workers’ compensation benefits. During 2007, the Company adjusted reserves downward consistent with past practices which reduced administrative expenses. Before the reduction in personnel expense from these credits, the increase in administration expenses was principally attributable to the acquisition of a business that offers cash advances online, increased staffing levels and annual salary adjustments. In addition, total administrative expenses in 2006 were offset by a gain of $773,000 recognized from a partial insurance settlement in 2006 related to hurricanes in 2005.
The Company realigned its administrative activities during 2007 to create more direct oversight of operations. This change resulted in an increase in operations expenses late in 2007. For comparison purposes, the Company reclassified the same direct expenses from earlier periods out of administrative expenses and into operations expenses. The amounts reclassified in 2007 and 2006 were $3.0 million and $1.8 million, respectively. There was no change in the total amount of expenses related to this reclassification. Cash Advance Loss Provision. The Company maintains an allowance for losses on cash advances at a level projected to be adequate to absorb credit losses inherent in the outstanding combined cash advance portfolio. The cash advance loss provision is utilized to increase the allowance carried against the outstanding company owned cash advance portfolio as well as expected losses in the third-party lender-owned portfolios which are guaranteed by the Company. The allowance is based on historical trends in portfolio performance based on the status of the balance owed by the customer with the full amount of the customer’s obligations being completely reserved when they become 60 days past due. The cash advance loss provision increased $95.6 million to $155.2 million in 2007, compared to $59.6 million in 2006. An increased volume of cash advances contributed $79.0 million of the increase in the loss provision with the remaining increase of $16.6 million attributable to higher loss rates. Total charge-offs less recoveries divided by total cash advances written increased in 2007 to 7.3% compared to 3.9% in 2006. The loss provision expense as a percentage of cash advances written was higher in 2007, increasing to 7.7% compared to 5.1% in the prior year. The loss provision as a percentage of cash advance fees increased to 43.7% in 2007 from 30.5% in 2006. These increases are mostly attributable to a significant increase in cash advance receivable balances and the greater mix of cash advance balances from online customers, which historically generates a higher loss rate. In addition, this increase in loss rates and losses as a percent of fees was weighted heavily in the first six months of 2007 due to a significant increase in new customers over that period as a result of opening new markets for the online distribution channel in late 2006 and early 2007.
Due to the short-term nature of the cash advance product and the high velocity of loans written, seasonal trends are evidenced in quarter-to-quarter performance. The table below shows the Company’s sequential loss experience for each of the calendar quarters under multiple metrics used by the Company to evaluate performance. Management believes that the increase in loss levels experienced early in 2007 was due to a large increase in new customers during the early part of the year. Typically, the normal business cycle leads sequential losses, as measured by the current period loss provision as a percentage of combined loans written in the period, to be lowest in the first quarter and increase throughout the year, with the final two quarters experiencing the peak levels of losses. During 2007, the quarterly sequential performance
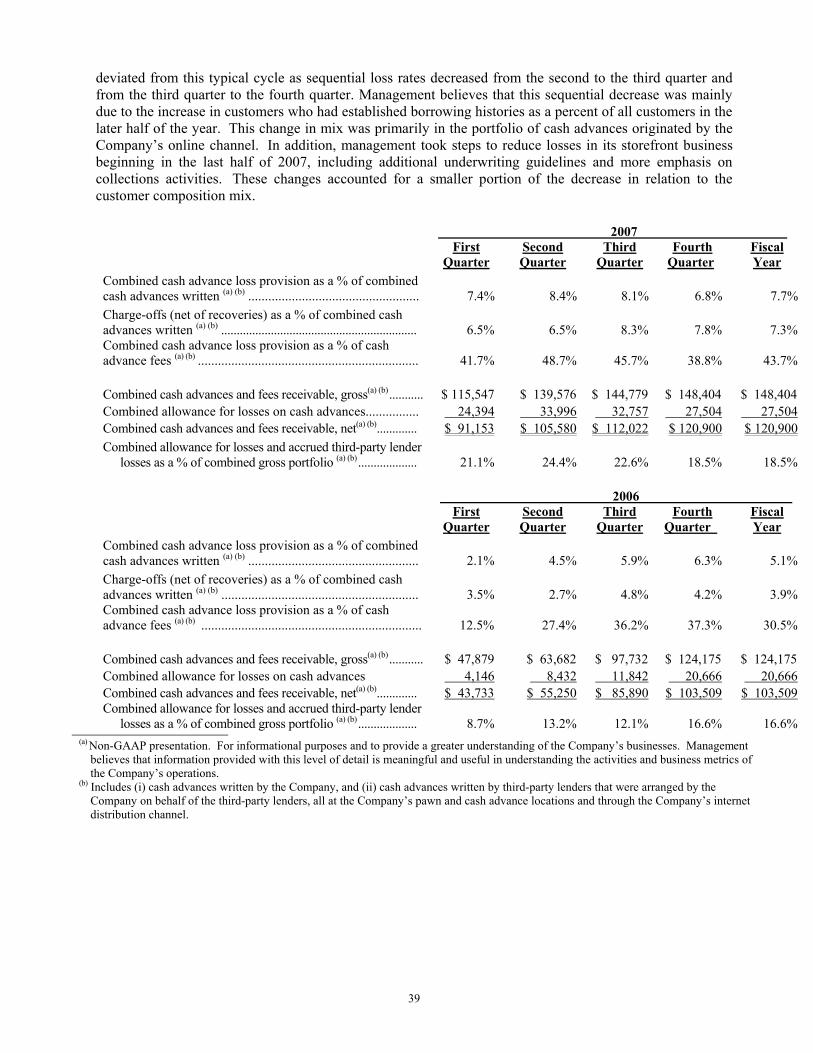
39
deviated from this typical cycle as sequential loss rates decreased from the second to the third quarter and from the third quarter to the fourth quarter. Management believes that this sequential decrease was mainly due to the increase in customers who had established borrowing histories as a percent of all customers in the later half of the year. This change in mix was primarily in the portfolio of cash advances originated by the Company’s online channel. In addition, management took steps to reduce losses in its storefront business beginning in the last half of 2007, including additional underwriting guidelines and more emphasis on collections activities. These changes accounted for a smaller portion of the decrease in relation to the customer composition mix.
2007 ,
First
Quarter Second Quarter
Third Quarter
Fourth Quarter,
Fiscal Year
Combined cash advance loss provision as a % of combined cash advances written (a) (b) ................................................... 7.4% 8.4% 8.1% 6.8% 7.7% Charge-offs (net of recoveries) as a % of combined cash advances written (a) (b) ............................................................... 6.5% 6.5% 8.3% 7.8% 7.3% Combined cash advance loss provision as a % of cash advance fees (a) (b) .................................................................. 41.7% 48.7% 45.7% 38.8% 43.7% Combined cash advances and fees receivable, gross(a) (b)........... $ 115,547 $ 139,576 $ 144,779 $ 148,404 $ 148,404 Combined allowance for losses on cash advances................ 24,394 33,996 32,757 27,504 27,504 Combined cash advances and fees receivable, net(a) (b)............. $ 91,153 $ 105,580 $ 112,022 $ 120,900 $ 120,900 Combined allowance for losses and accrued third-party lender
losses as a % of combined gross portfolio (a) (b)................... 21.1% 24.4% 22.6% 18.5% 18.5% 2006 ,
First
Quarter Second Quarter
Third Quarter
Fourth Quarter ,
Fiscal Year
Combined cash advance loss provision as a % of combined cash advances written (a) (b) ................................................... 2.1% 4.5% 5.9% 6.3% 5.1% Charge-offs (net of recoveries) as a % of combined cash advances written (a) (b) ........................................................... 3.5% 2.7% 4.8% 4.2% 3.9% Combined cash advance loss provision as a % of cash advance fees (a) (b) .................................................................. 12.5% 27.4% 36.2% 37.3% 30.5% Combined cash advances and fees receivable, gross(a) (b)........... $ 47,879 $ 63,682 $ 97,732 $ 124,175 $ 124,175 Combined allowance for losses on cash advances 4,146 8,432 11,842 20,666 20,666 Combined cash advances and fees receivable, net(a) (b)............. $ 43,733 $ 55,250 $ 85,890 $ 103,509 $ 103,509 Combined allowance for losses and accrued third-party lender
losses as a % of combined gross portfolio (a) (b)................... 8.7% 13.2% 12.1% 16.6% 16.6% (a) Non-GAAP presentation. For informational purposes and to provide a greater understanding of the Company’s businesses. Management
believes that information provided with this level of detail is meaningful and useful in understanding the activities and business metrics of the Company’s operations.
(b) Includes (i) cash advances written by the Company, and (ii) cash advances written by third-party lenders that were arranged by the Company on behalf of the third-party lenders, all at the Company’s pawn and cash advance locations and through the Company’s internet distribution channel.
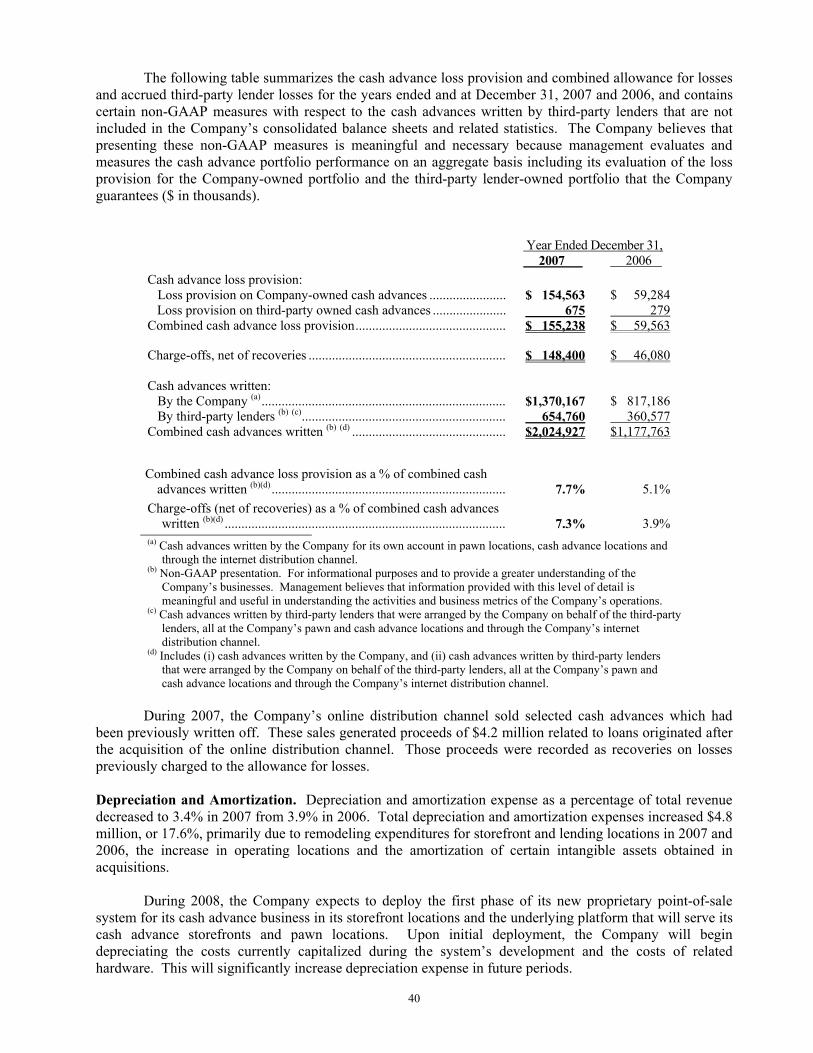
40
The following table summarizes the cash advance loss provision and combined allowance for losses and accrued third-party lender losses for the years ended and at December 31, 2007 and 2006, and contains certain non-GAAP measures with respect to the cash advances written by third-party lenders that are not included in the Company’s consolidated balance sheets and related statistics. The Company believes that presenting these non-GAAP measures is meaningful and necessary because management evaluates and measures the cash advance portfolio performance on an aggregate basis including its evaluation of the loss provision for the Company-owned portfolio and the third-party lender-owned portfolio that the Company guarantees ($ in thousands).
Year Ended December 31, 2007 2006 Cash advance loss provision: Loss provision on Company-owned cash advances ....................... $ 154,563 $ 59,284 Loss provision on third-party owned cash advances ...................... 675 279 Combined cash advance loss provision............................................. $ 155,238 $ 59,563 Charge-offs, net of recoveries ........................................................... $ 148,400 $ 46,080 Cash advances written: By the Company (a)......................................................................... $1,370,167 $ 817,186 By third-party lenders (b) (c)............................................................. 654,760 360,577 Combined cash advances written (b) (d) .............................................. $2,024,927 $1,177,763
Combined cash advance loss provision as a % of combined cash advances written (b)(d) ...................................................................... 7.7% 5.1%
Charge-offs (net of recoveries) as a % of combined cash advances written (b)(d) .................................................................................... 7.3% 3.9%
(a) Cash advances written by the Company for its own account in pawn locations, cash advance locations and through the internet distribution channel.
(b) Non-GAAP presentation. For informational purposes and to provide a greater understanding of the Company’s businesses. Management believes that information provided with this level of detail is meaningful and useful in understanding the activities and business metrics of the Company’s operations.
(c) Cash advances written by third-party lenders that were arranged by the Company on behalf of the third-party lenders, all at the Company’s pawn and cash advance locations and through the Company’s internet distribution channel.
(d) Includes (i) cash advances written by the Company, and (ii) cash advances written by third-party lenders that were arranged by the Company on behalf of the third-party lenders, all at the Company’s pawn and cash advance locations and through the Company’s internet distribution channel.
During 2007, the Company’s online distribution channel sold selected cash advances which had
been previously written off. These sales generated proceeds of $4.2 million related to loans originated after the acquisition of the online distribution channel. Those proceeds were recorded as recoveries on losses previously charged to the allowance for losses.
Depreciation and Amortization. Depreciation and amortization expense as a percentage of total revenue decreased to 3.4% in 2007 from 3.9% in 2006. Total depreciation and amortization expenses increased $4.8 million, or 17.6%, primarily due to remodeling expenditures for storefront and lending locations in 2007 and 2006, the increase in operating locations and the amortization of certain intangible assets obtained in acquisitions.
During 2008, the Company expects to deploy the first phase of its new proprietary point-of-sale system for its cash advance business in its storefront locations and the underlying platform that will serve its cash advance storefronts and pawn locations. Upon initial deployment, the Company will begin depreciating the costs currently capitalized during the system’s development and the costs of related hardware. This will significantly increase depreciation expense in future periods.
41
Interest Expense. Interest expense as a percentage of total revenue was 1.7% in both 2007 and 2006. Interest expense increased $4.1 million, or 34.1%, to $16.0 million in 2007 as compared to $11.9 million in 2006. The increase was primarily due to the higher weighted average floating interest rate borrowings ($121.3 million during 2007 and $81.2 million during 2006) and the higher average floating interest rate (6.3% during 2007 compared to 6.2% during 2006) and the issuance in December 2006 of $60 million of senior unsecured long-term notes. The average amount of debt outstanding increased during 2007 to $249.8 million from $160.7 million during 2006. This increase was primarily attributable to the acquisition of CashNetUSA in the third quarter of 2006 and the funding of two earn-out payments in February and November 2007. The effective blended borrowing cost was 6.4% in 2007 and 6.6% in 2006. Interest Income. Interest income was $1.0 million in 2007 compared to $1.6 million in 2006. The interest income is primarily from the two notes receivable denominated in Swedish kronor that the Company held until August 2007 and had received in connection with its 2004 sale of its foreign pawn lending operations. The notes were sold in August 2007; therefore, the Company expects interest income in 2008 will be insignificant. Foreign Currency Transaction Gain (Loss). The Company held two notes receivable denominated in Swedish kronor until they were sold in August 2007. Exchange rate changes between the United States dollar and the Swedish kronor resulted in a net gain of $63,000 (including a gain of $52,000 from foreign currency forward contracts) in 2007 and $296,000 (net of a loss of $1.1 million from foreign currency forward contracts) in 2006. The functional currency of the Company’s United Kingdom operations is the British pound. In 2007, the Company recorded foreign currency transaction losses of approximately $87,000 on the intercompany balances, which are denominated in U.S. dollars, between the U.S. and United Kingdom operations. Gain on Sale of Foreign Notes. The Company received gross proceeds in the amount of $16.8 million on the sale of notes receivable that it had received in 2004 as part of the proceeds from its sale of Svensk Pantbelåning, its former Swedish pawn lending subsidiary. In September 2004, the Company sold Svensk Pantbelåning to Rutland Partners LLP, for cash and two subordinated notes receivable. One of the notes receivable was convertible into approximately 27.7% of the parent company of Svensk Pantbelåning on a fully-diluted basis. In August 2007, Rutland Partners LLP sold Svensk Pantbelåning to a third party who also purchased the notes receivable from the Company. The Company received total proceeds of $16.8 million, $12.4 million for the repayment of the face value of the principal, including $0.3 million of accrued interest owed on notes receivable and $4.4 million for the value of its conversion rights under the convertible note. The Company recognized a pre-tax gain of approximately $6.3 million from the sale of the notes and related rights. Proceeds from the sale were used for general corporate purposes, including the repayment of debt and the repurchase of shares in the open market pursuant to an existing share repurchase authorization. Income Taxes. The Company’s effective tax rate for continuing operations for 2007 was 36.4% as compared to 36.6% for 2006. The Company recognized a $1.1 million one-time deferred Texas margin tax credit, net of the federal income tax effect of the credit, during the second quarter of 2007. This credit resulted from a change in Texas law enacted during the second quarter. Excluding the effect of the one-time Texas deferred tax benefit, the effective tax rate for 2007 would have been 37.3%. Excluding the effect of the one-time deferred tax benefit, the increase over 2006 is primarily attributable to an increase in state and local income taxes, including the Texas margin tax that was enacted in 2006 and is imposed on the Company’s earnings beginning in 2007.

42
Year Ended 2006 Compared to Year Ended 2005 Consolidated Net Revenue. Consolidated net revenue increased $77.6 million, or 18.8%, to $489.6 million during 2006 from $412.0 million during 2005. The following table sets forth 2006 and 2005 net revenue by operating segment ($ in thousands): 2006 2005 Increase Cash advance operations – storefront ............................. $ 130,106 $ 107,848 $ 22,258 20.6% Cash advance operations – internet lending ................... 30,483 — 30,483 N/A Total cash advance operations .................................... $ 160,589 $ 107,848 $ 52,741 48.9% Pawn lending operations................................................. 325,071 300,297 24,774 8.2 Check cashing operations ............................................... 3,925 3,819 106 2.8 Consolidated net revenue ........................................... $ 489,585 $ 411,964 $ 77,621 18.8% The components of net revenue are finance and service charges from pawn loans, which increased $9.7 million; profit from the disposition of merchandise, which increased $12.7 million; cash advance fees generated from cash advance locations, pawn locations and the internet distribution channel increased $53.0 million; and check cashing fees, royalties and other income increased $2.2 million. Finance and Service Charges. Finance and service charges from pawn loans increased $9.7 million, or 6.9%, from $139.8 million in 2005 to $149.5 million in 2006. The increase was primarily due to higher pawn loan balances attributable to an increased amount of pawn loans written. An increase in the average balance of pawn loans outstanding contributed $11.1 million of the increase, which was offset by a $1.4 million decrease resulting from the lower annualized yield of the pawn loan portfolio. The change in the annualized yield of the pawn loan portfolio is a function of the blend in permitted rates for fees and service charges on pawn loans in all operating locations of the Company and slightly lower redemption rates. The average balances of pawn loans outstanding were 7.9% higher in 2006 than in 2005. The increase in the average balance of pawn loans outstanding was driven by a 9.5% increase in the average amount per loan that was partially offset by a 1.5% decrease in the average number of pawn loans outstanding during 2006.
Pawn loan balances at December 31, 2006 were $127.4 million, which was 10.5% higher than at December 31, 2005. Annualized loan yield was 123.6% in 2006, compared to 124.8% in 2005. Same store pawn loan balances at December 31, 2006 were $8.1 million, or 7.0%, higher than at December 31, 2005. Profit from the Disposition of Merchandise. Profit from the disposition of merchandise represents the proceeds received from the disposition of merchandise in excess of the cost of disposed merchandise. The following table summarizes the proceeds from the disposition of merchandise and the related profit for 2006 as compared to 2005 ($ in thousands): Year Ended December 31, 2006 2005 Merchan- Refined Merchan- Refined dise Gold Total dise Gold Total Proceeds from disposition..... $ 255,538 $ 78,498 $ 334,036 $ 243,349 $ 56,843 $ 300,192 Profit on disposition.............. $ 105,222 $ 23,885 $ 129,107 $ 100,979 $ 15,414 $ 116,393 Profit margin ......................... 41.2% 30.4% 38.7% 41.5% 27.1% 38.8% Percentage of total profit....... 81.5% 18.5% 100.0% 86.8% 13.2 % 100.0% The total proceeds from disposition of merchandise and refined gold increased $33.8 million, or 11.3%, and the total profit from the disposition of merchandise and refined gold increased $12.7 million, or 10.9%, primarily due to higher levels of retail sales and the disposition of refined gold. Overall gross profit margin decreased slightly from 38.8% in 2005 to 38.7% in 2006. Excluding the effect of the disposition of
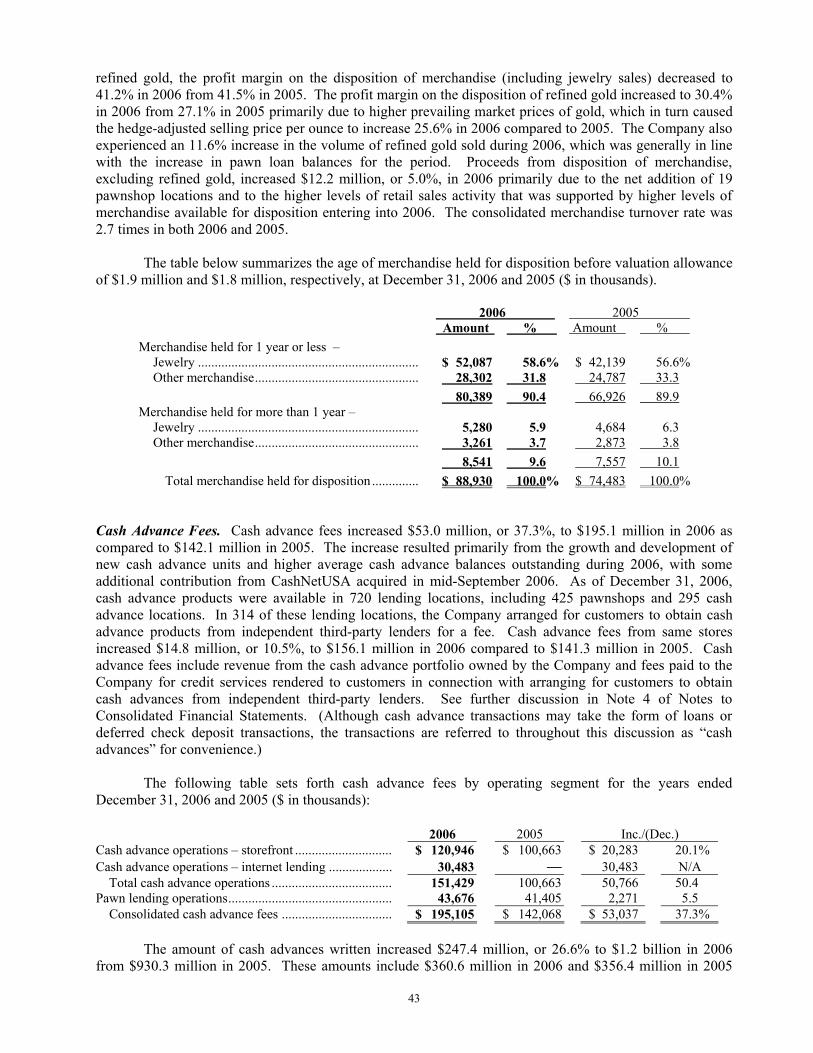
43
refined gold, the profit margin on the disposition of merchandise (including jewelry sales) decreased to 41.2% in 2006 from 41.5% in 2005. The profit margin on the disposition of refined gold increased to 30.4% in 2006 from 27.1% in 2005 primarily due to higher prevailing market prices of gold, which in turn caused the hedge-adjusted selling price per ounce to increase 25.6% in 2006 compared to 2005. The Company also experienced an 11.6% increase in the volume of refined gold sold during 2006, which was generally in line with the increase in pawn loan balances for the period. Proceeds from disposition of merchandise, excluding refined gold, increased $12.2 million, or 5.0%, in 2006 primarily due to the net addition of 19 pawnshop locations and to the higher levels of retail sales activity that was supported by higher levels of merchandise available for disposition entering into 2006. The consolidated merchandise turnover rate was 2.7 times in both 2006 and 2005. The table below summarizes the age of merchandise held for disposition before valuation allowance of $1.9 million and $1.8 million, respectively, at December 31, 2006 and 2005 ($ in thousands).
2006 2005 Amount % Amount % Merchandise held for 1 year or less – Jewelry .................................................................. $ 52,087 58.6% $ 42,139 56.6% Other merchandise................................................. 28,302 31.8 24,787 33.3 80,389 90.4 66,926 89.9 Merchandise held for more than 1 year – Jewelry .................................................................. 5,280 5.9 4,684 6.3 Other merchandise................................................. 3,261 3.7 2,873 3.8 8,541 9.6 7,557 10.1 Total merchandise held for disposition .............. $ 88,930 100.0% $ 74,483 100.0%
Cash Advance Fees. Cash advance fees increased $53.0 million, or 37.3%, to $195.1 million in 2006 as compared to $142.1 million in 2005. The increase resulted primarily from the growth and development of new cash advance units and higher average cash advance balances outstanding during 2006, with some additional contribution from CashNetUSA acquired in mid-September 2006. As of December 31, 2006, cash advance products were available in 720 lending locations, including 425 pawnshops and 295 cash advance locations. In 314 of these lending locations, the Company arranged for customers to obtain cash advance products from independent third-party lenders for a fee. Cash advance fees from same stores increased $14.8 million, or 10.5%, to $156.1 million in 2006 compared to $141.3 million in 2005. Cash advance fees include revenue from the cash advance portfolio owned by the Company and fees paid to the Company for credit services rendered to customers in connection with arranging for customers to obtain cash advances from independent third-party lenders. See further discussion in Note 4 of Notes to Consolidated Financial Statements. (Although cash advance transactions may take the form of loans or deferred check deposit transactions, the transactions are referred to throughout this discussion as “cash advances” for convenience.) The following table sets forth cash advance fees by operating segment for the years ended December 31, 2006 and 2005 ($ in thousands): 2006 2005 Inc./(Dec.) Cash advance operations – storefront ............................. $ 120,946 $ 100,663 $ 20,283 20.1% Cash advance operations – internet lending ................... 30,483 — 30,483 N/A Total cash advance operations .................................... 151,429 100,663 50,766 50.4 Pawn lending operations................................................. 43,676 41,405 2,271 5.5 Consolidated cash advance fees ................................. $ 195,105 $ 142,068 $ 53,037 37.3% The amount of cash advances written increased $247.4 million, or 26.6% to $1.2 billion in 2006 from $930.3 million in 2005. These amounts include $360.6 million in 2006 and $356.4 million in 2005

44
extended to customers by all independent third-party lenders. The average amount per cash advance increased to $381 from $359 mostly due to changes in permitted loan amounts and adjustments to underwriting criteria. The outstanding combined portfolio balance of cash advances increased $59.9 million, or 93.2%, to $124.2 million at December 31, 2006 from $64.3 million at December 31, 2005. A portion of the increase was attributable to the addition of the online distribution channel established through the acquisition of CashNetUSA in September of 2006 with the remainder related primarily to store maturity and development during the year. Included in the combined portfolio balance referenced above were $99.5 million and $47.0 million for 2006 and 2005, respectively, which are included in the Company’s consolidated balance sheets. An allowance for losses of $19.5 million and $6.3 million has been provided in the consolidated financial statements for December 31, 2006 and 2005, respectively, which is netted against the outstanding cash advance amounts on the Company’s consolidated balance sheets.
The following table summarizes cash advances outstanding at December 31, 2006 and 2005 and contains certain non-Generally Accepted Accounting Principles (“non-GAAP”) measures with respect to the cash advances owned by third-party lenders that are not included in the Company’s consolidated balance sheets. The Company believes that presenting these non-GAAP measures is meaningful and necessary because management evaluates and measures the cash advance portfolio performance on an aggregate basis ($ in thousands).
2006 2005 Funded by the Company (a) Active cash advances and fees receivable............................................ $ 69,489 $ 32,207 Cash advances and fees in collection ......................................................... 24,499 7,510 Total funded by the Company (a) ....................................................... 93,988 39,717 Funded by third-party lenders (b) (c) Active cash advances and fees receivable............................................ 24,721 19,548 Cash advances and fees in collection ......................................................... 5,466 5,010 Total funded by third-party lenders (b) (c) ......................................... 30,187 24,558 Combined gross portfolio (b) (d) ................................................................ 124,175 64,275 Less: Elimination of cash advances owned by third-party lenders ..... 24,687 16,912 Less: Discount on cash advances assigned by third-party lenders........... 350 Company-owned cash advances and fees receivable, gross...................... 99,488 47,013 Less: Allowance for losses ........................................................................ 19,513 6,309 Cash advances and fees receivable, net ....................................................... $ 79,975 $ 40,704
Allowance for loss on Company-owned cash advances................................. $ 19,513 $ 6,309 Accrued losses on third-party lender-owned cash advances .......................... 1,153 874 Combined allowance for losses and accrued third-party lender losses .. $ 20,666 $ 7,183 Combined allowance for losses and accrued third-party lender losses as
a % of combined gross portfolio (b) (d) .................................................... 16.6% 11.2% (a) Cash advances written by the Company for its own account in its pawn locations, cash advance locations and
through the internet distribution channel. (b) Non-GAAP presentation. For informational purposes and to provide a greater understanding of the Company’s
businesses. Management believes that information provided with this level of detail is meaningful and useful in understanding the activities and business metrics of the Company’s operations.
(c) Cash advances written by third-party lenders that were arranged by the Company on behalf of the third-party lenders, all at the Company’s pawn and cash advance locations and through the Company’s internet distribution channel.
(d) Includes (i) cash advances written by the Company, and (ii) cash advances written by third-party lenders that were arranged by the Company on behalf of the third-party lenders, all at the Company’s pawn and cash advance locations and through the Company’s internet distribution channel.
Cash advance fees related to cash advances originated by all third-party lenders (bank and non-bank) were $61.6 million in 2006 on $360.6 million in cash advances originated by third-party lenders, representing 31.1% of combined cash advance revenue and 8.9% of consolidated total revenue of the

45
Company. The cash advance loss provision expense associated with these cash advances was $19.8 million. Direct operating expenses, excluding allocated administrative expenses, were $18.4 million, and depreciation and amortization expense was $1.6 million in 2006. Management estimates that the approximate contribution before interest and taxes on cash advances originated by all third-party lenders in 2006 was $21.8 million. This estimate does not include shared operating costs in pawn locations where the product is offered. In March 2005, the Federal Deposit Insurance Corporation (“FDIC”) issued revised guidelines affecting certain short-term cash advance products offered by FDIC regulated banks. The revised guidance applied to the cash advance product that was offered by third-party banks in many of the Company’s locations. The revised guidance, which became effective July 1, 2005, restricted banks from providing cash advances to customers for more than three months out of a twelve month period. In order to address the short-term credit needs of customers who no longer had access to the banks’ cash advance product, the Company began offering an alternative short-term credit product in selected markets in 2005. On July 1, 2005, the Company introduced a credit services organization program (the “CSO program”). Under the CSO program, the Company acts as a credit services organization on behalf of consumers in accordance with applicable state laws. Credit services that the Company provides to its customers include arranging loans with independent third-party lenders, assisting in the preparation of loan applications and loan documents, and accepting loan payments at the location where the loans were arranged. To assist the customer in obtaining a loan from a third-party lender through the CSO program, the Company, on behalf of its customer, guarantees the customer’s payment obligations under the loan to the third-party lender. A CSO program customer pays the Company a CSO fee for the credit services, including the guaranty, and enters into a contract with the Company governing the credit services arrangement. The Company is responsible for losses on cash advances assigned to or acquired by it under its guaranty. At December 31, 2006, the Company offered the CSO program in Texas, Florida and, on a limited basis, Michigan. In February 2007, the Company discontinued the CSO program in Michigan. Check Cashing Fees, Royalties and Other. Check cashing fees, royalties and other income increased $2.2 million to $15.9 million in 2006, or 15.8%, from $13.7 million in 2005 predominantly due to the growth in cash advance units. The components of these fees were as follows (in thousands):
Year Ended December 31, 2006 2005 Pawn Cash Check Pawn Cash Check Lending Advance Cashing Total Lending Advance Cashing Total Check cashing fees... $ 373 $ 6,057 $ 569 $ 6,999 $ 167 $ 5,339 $ 565 $ 6,071 Royalties .................. 569 3,173 3,742 559 3,116 3,675 Other ........................ 1,874 3,103 183 5,160 2,001 1,846 138 3,985 $ 2,816 $ 9,160 $ 3,925 $ 15,901 $ 2,727 $ 7,185 $ 3,819 $ 13,731 Operations Expenses. Consolidated operations expenses, as a percentage of total revenue, were 35.7% in 2006 compared to 37.3% in 2005. These expenses increased $25.7 million, or 11.6%, in 2006 compared to 2005. Pawn lending operating expenses increased $11.1 million, or 6.5%, primarily due to the net addition of 19 pawnshop locations in 2006. Cash advance operating expenses increased $14.7 million, or 28.5%, primarily as a result of increased advertising expenditures, growth in expenses in the Company’s collection centers, the acquisition of CashNetUSA and the net establishment of 9 locations, which resulted in higher staffing levels. As a multi-unit operator in the consumer finance industry, the Company’s operations expenses are predominately related to personnel and occupancy expenses. Personnel expenses include base salary and wages, performance incentives, and benefits. Occupancy expenses include rent, property taxes, insurance, utilities, and maintenance. The combination of personnel and occupancy expenses represents 82.7% of total operations expenses in 2006 and 84.4% in 2005. The comparison is as follows ($ in thousands):
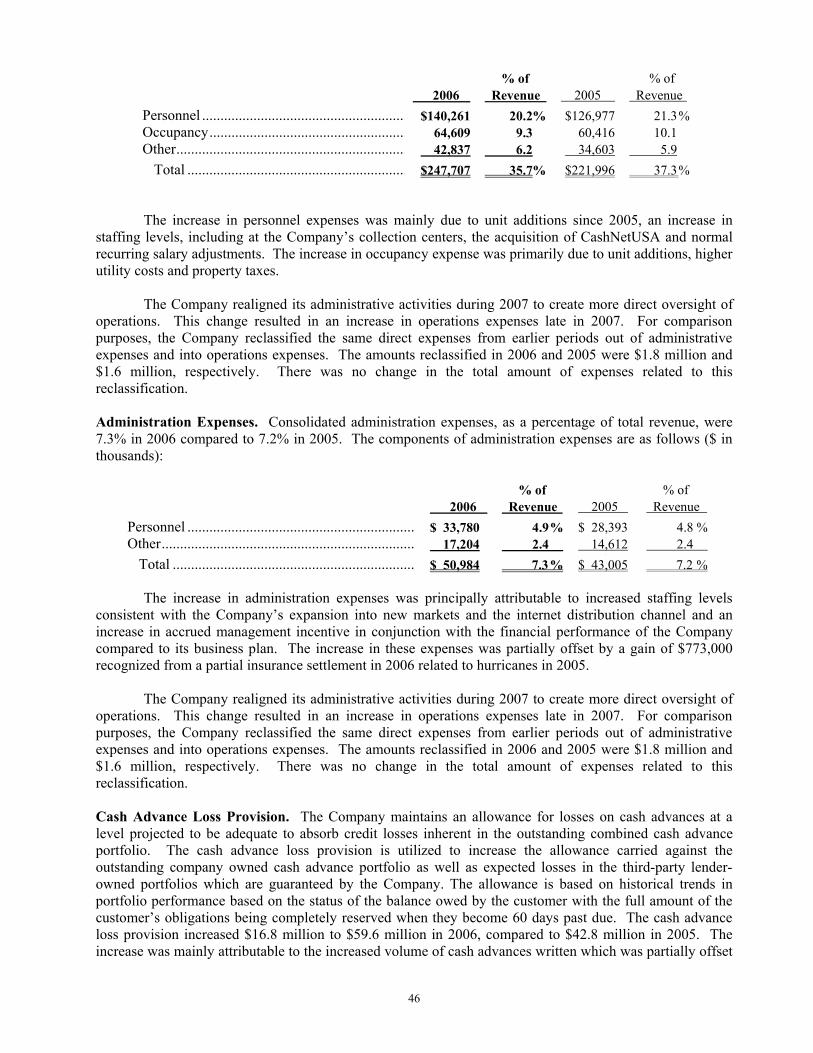
46
% of % of 2006 Revenue 2005 Revenue Personnel ........................................................ $140,261 20.2% $126,977 21.3 %Occupancy...................................................... 64,609 9.3 60,416 10.1 Other............................................................... 42,837 6.2 34,603 5.9 Total ............................................................ $247,707 35.7% $221,996 37.3 %
The increase in personnel expenses was mainly due to unit additions since 2005, an increase in staffing levels, including at the Company’s collection centers, the acquisition of CashNetUSA and normal recurring salary adjustments. The increase in occupancy expense was primarily due to unit additions, higher utility costs and property taxes.
The Company realigned its administrative activities during 2007 to create more direct oversight of
operations. This change resulted in an increase in operations expenses late in 2007. For comparison purposes, the Company reclassified the same direct expenses from earlier periods out of administrative expenses and into operations expenses. The amounts reclassified in 2006 and 2005 were $1.8 million and $1.6 million, respectively. There was no change in the total amount of expenses related to this reclassification.
Administration Expenses. Consolidated administration expenses, as a percentage of total revenue, were 7.3% in 2006 compared to 7.2% in 2005. The components of administration expenses are as follows ($ in thousands):
% of % of 2006 Revenue 2005 Revenue Personnel .............................................................. $ 33,780 4.9 % $ 28,393 4.8 %Other..................................................................... 17,204 2.4 14,612 2.4
1 1 Total .................................................................. $ 50,984 7.3 % $ 43,005 7.2 %
The increase in administration expenses was principally attributable to increased staffing levels consistent with the Company’s expansion into new markets and the internet distribution channel and an increase in accrued management incentive in conjunction with the financial performance of the Company compared to its business plan. The increase in these expenses was partially offset by a gain of $773,000 recognized from a partial insurance settlement in 2006 related to hurricanes in 2005.
The Company realigned its administrative activities during 2007 to create more direct oversight of
operations. This change resulted in an increase in operations expenses late in 2007. For comparison purposes, the Company reclassified the same direct expenses from earlier periods out of administrative expenses and into operations expenses. The amounts reclassified in 2006 and 2005 were $1.8 million and $1.6 million, respectively. There was no change in the total amount of expenses related to this reclassification. Cash Advance Loss Provision. The Company maintains an allowance for losses on cash advances at a level projected to be adequate to absorb credit losses inherent in the outstanding combined cash advance portfolio. The cash advance loss provision is utilized to increase the allowance carried against the outstanding company owned cash advance portfolio as well as expected losses in the third-party lender-owned portfolios which are guaranteed by the Company. The allowance is based on historical trends in portfolio performance based on the status of the balance owed by the customer with the full amount of the customer’s obligations being completely reserved when they become 60 days past due. The cash advance loss provision increased $16.8 million to $59.6 million in 2006, compared to $42.8 million in 2005. The increase was mainly attributable to the increased volume of cash advances written which was partially offset
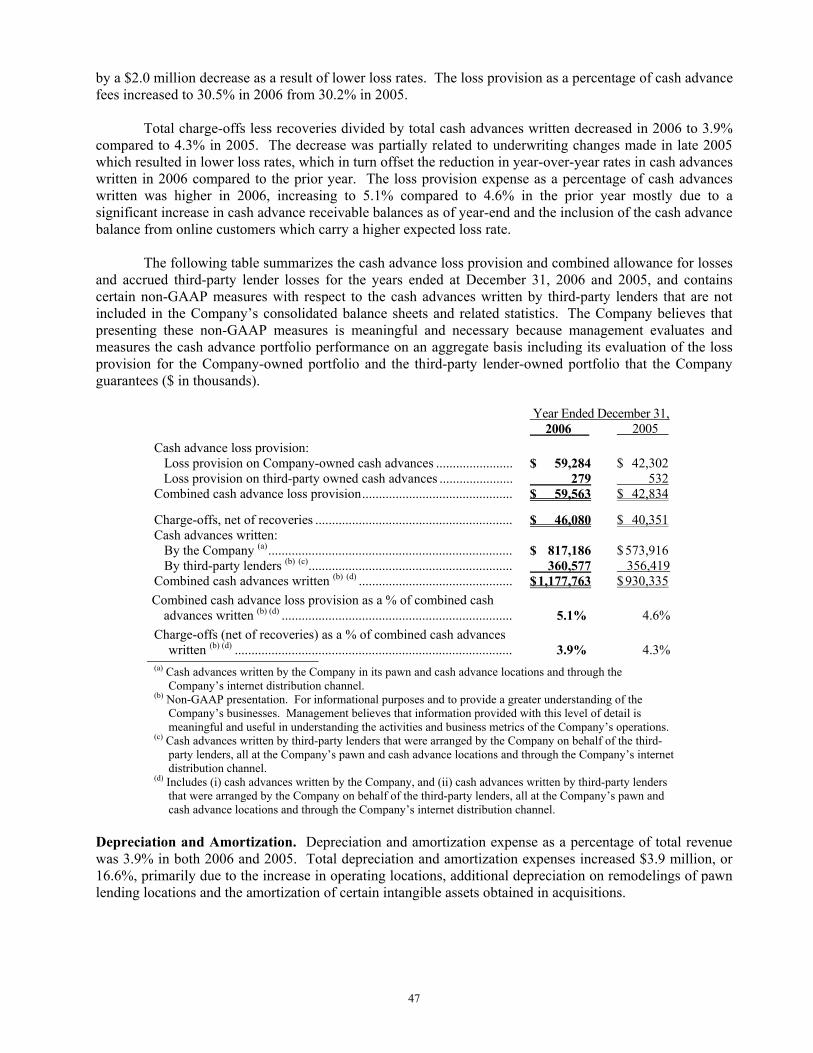
47
by a $2.0 million decrease as a result of lower loss rates. The loss provision as a percentage of cash advance fees increased to 30.5% in 2006 from 30.2% in 2005. Total charge-offs less recoveries divided by total cash advances written decreased in 2006 to 3.9% compared to 4.3% in 2005. The decrease was partially related to underwriting changes made in late 2005 which resulted in lower loss rates, which in turn offset the reduction in year-over-year rates in cash advances written in 2006 compared to the prior year. The loss provision expense as a percentage of cash advances written was higher in 2006, increasing to 5.1% compared to 4.6% in the prior year mostly due to a significant increase in cash advance receivable balances as of year-end and the inclusion of the cash advance balance from online customers which carry a higher expected loss rate.
The following table summarizes the cash advance loss provision and combined allowance for losses
and accrued third-party lender losses for the years ended at December 31, 2006 and 2005, and contains certain non-GAAP measures with respect to the cash advances written by third-party lenders that are not included in the Company’s consolidated balance sheets and related statistics. The Company believes that presenting these non-GAAP measures is meaningful and necessary because management evaluates and measures the cash advance portfolio performance on an aggregate basis including its evaluation of the loss provision for the Company-owned portfolio and the third-party lender-owned portfolio that the Company guarantees ($ in thousands).
Year Ended December 31, 2006 2005 Cash advance loss provision: Loss provision on Company-owned cash advances ....................... $ 59,284 $ 42,302 Loss provision on third-party owned cash advances ...................... 279 532 Combined cash advance loss provision............................................. $ 59,563 $ 42,834
Charge-offs, net of recoveries ........................................................... $ 46,080 $ 40,351 Cash advances written: By the Company (a)......................................................................... $ 817,186 $ 573,916 By third-party lenders (b) (c)............................................................. 360,577 356,419 Combined cash advances written (b) (d) .............................................. $ 1,177,763 $ 930,335 Combined cash advance loss provision as a % of combined cash
advances written (b) (d) ..................................................................... 5.1% 4.6% Charge-offs (net of recoveries) as a % of combined cash advances
written (b) (d) ................................................................................... 3.9% 4.3% (a) Cash advances written by the Company in its pawn and cash advance locations and through the
Company’s internet distribution channel. (b) Non-GAAP presentation. For informational purposes and to provide a greater understanding of the
Company’s businesses. Management believes that information provided with this level of detail is meaningful and useful in understanding the activities and business metrics of the Company’s operations.
(c) Cash advances written by third-party lenders that were arranged by the Company on behalf of the third-party lenders, all at the Company’s pawn and cash advance locations and through the Company’s internet distribution channel.
(d) Includes (i) cash advances written by the Company, and (ii) cash advances written by third-party lenders that were arranged by the Company on behalf of the third-party lenders, all at the Company’s pawn and cash advance locations and through the Company’s internet distribution channel.
Depreciation and Amortization. Depreciation and amortization expense as a percentage of total revenue was 3.9% in both 2006 and 2005. Total depreciation and amortization expenses increased $3.9 million, or 16.6%, primarily due to the increase in operating locations, additional depreciation on remodelings of pawn lending locations and the amortization of certain intangible assets obtained in acquisitions.
48
Interest Expense. Interest expense as a percentage of total revenue decreased to 1.7% in 2006 from 1.8% in 2005. Interest expense increased $1.3 million, or 12.6%, to $11.9 million in 2006 as compared to $10.6 million in 2005. The increase was primarily due to the higher weighted average floating interest rate (6.2% during 2006 compared to 4.7% during 2005). The average amount of debt outstanding decreased during 2006 to $160.7 million from $168.3 million during 2005. The effective blended borrowing cost was 6.6% in 2006 and 6.3% in 2005.
On December 19, 2006, the Company issued $60.0 million of senior unsecured long-term notes. The notes were comprised of $35.0 million 6.09% senior notes due 2016 payable in five annual installment payments of $7.0 million beginning December 19, 2012; and $25.0 million 6.21% senior notes due 2021 payable in eleven annual payments of $2.3 million beginning December 19, 2011. Net proceeds received from the issuance of the notes were used to reduce the amount outstanding under the bank line of credit and for general corporate purposes.
Interest Income. Interest income was $1.6 million for both 2006 and 2005. Interest income was comprised of the interest earned on excess cash and on two subordinated notes denominated in Swedish kronor that the Company received in the sale of the foreign pawn lending operations. Foreign Currency Transaction Gain (Loss). The Company held two notes receivable denominated in Swedish kronor in connection with its 2004 sale of its foreign pawn lending operations with a carrying value of $9.8 million at December 31, 2006. Exchange rate changes between the United States dollar and the Swedish kronor resulted in a net gain of $296,000 (net of a loss of $1.1 million from foreign currency forward contracts) in 2006 and a net loss of $834,000 (net of a gain of $731,000 from foreign currency forward contracts) in 2005. The foreign currency forward contracts totaling 68 million Swedish kronor (approximately $9.9 million at maturity) were established by the Company in 2005 to minimize the financial impact of currency market fluctuations. Gain from Termination of Contract. In April 2006, the Company reached an agreement with a landlord of a lending location to terminate the lease and vacate the property for $2.2 million. The Company recorded a pre-tax net gain of $2.2 million ($1.4 million net of related taxes) from this transaction at that time. The closure of this significant pawn lending location reduced consolidated earnings for the remainder of the year. Income Taxes. The Company’s effective tax rate for 2006 was 36.6% as compared to 36.8% for 2005.
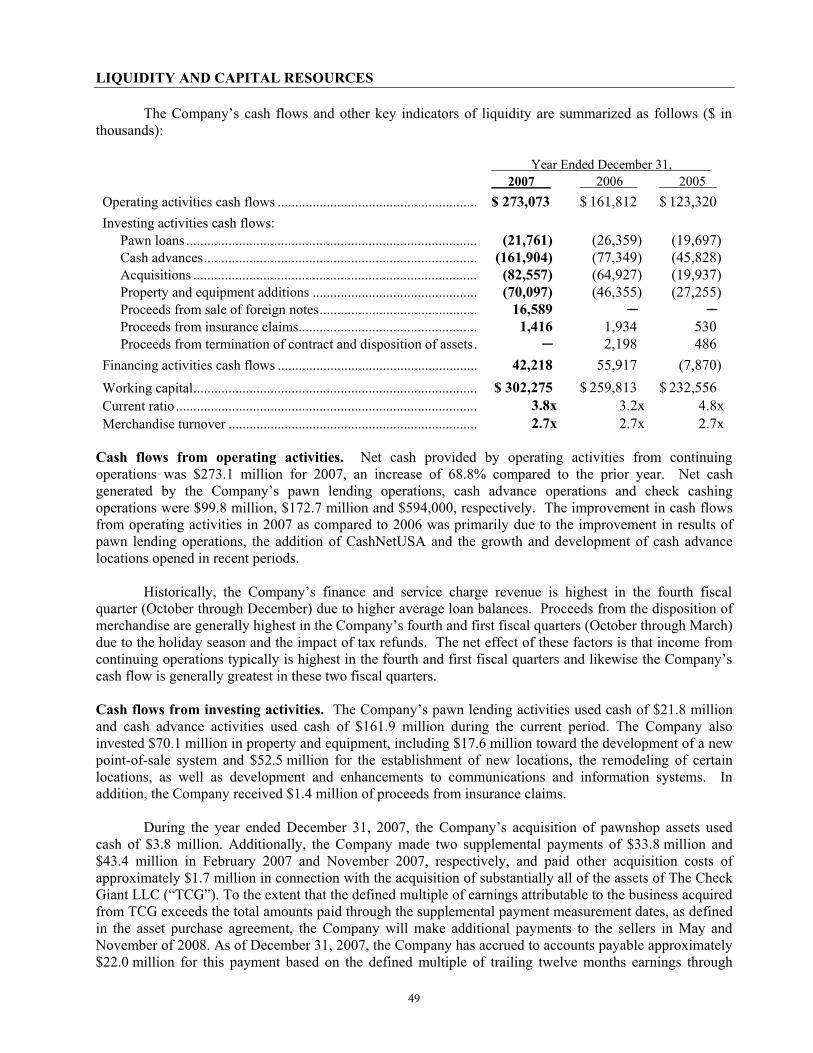
49
LIQUIDITY AND CAPITAL RESOURCES The Company’s cash flows and other key indicators of liquidity are summarized as follows ($ in thousands):
Year Ended December 31, 2007 2006 2005
Operating activities cash flows ......................................................... $ 273,073 $ 161,812 $ 123,320 Investing activities cash flows:
Pawn loans ................................................................................... (21,761) (26,359) (19,697) Cash advances.............................................................................. (161,904) (77,349) (45,828) Acquisitions ................................................................................. (82,557) (64,927) (19,937) Property and equipment additions ............................................... (70,097) (46,355) (27,255) Proceeds from sale of foreign notes............................................. 16,589 Proceeds from insurance claims................................................... 1,416 1,934 530 Proceeds from termination of contract and disposition of assets. 2,198 486
Financing activities cash flows ......................................................... 42,218 55,917 (7,870) Working capital................................................................................. $ 302,275 $ 259,813 $ 232,556 Current ratio ...................................................................................... 3.8x 3.2x 4.8x Merchandise turnover ....................................................................... 2.7x 2.7x 2.7x
Cash flows from operating activities. Net cash provided by operating activities from continuing operations was $273.1 million for 2007, an increase of 68.8% compared to the prior year. Net cash generated by the Company’s pawn lending operations, cash advance operations and check cashing operations were $99.8 million, $172.7 million and $594,000, respectively. The improvement in cash flows from operating activities in 2007 as compared to 2006 was primarily due to the improvement in results of pawn lending operations, the addition of CashNetUSA and the growth and development of cash advance locations opened in recent periods. Historically, the Company’s finance and service charge revenue is highest in the fourth fiscal quarter (October through December) due to higher average loan balances. Proceeds from the disposition of merchandise are generally highest in the Company’s fourth and first fiscal quarters (October through March) due to the holiday season and the impact of tax refunds. The net effect of these factors is that income from continuing operations typically is highest in the fourth and first fiscal quarters and likewise the Company’s cash flow is generally greatest in these two fiscal quarters. Cash flows from investing activities. The Company’s pawn lending activities used cash of $21.8 million and cash advance activities used cash of $161.9 million during the current period. The Company also invested $70.1 million in property and equipment, including $17.6 million toward the development of a new point-of-sale system and $52.5 million for the establishment of new locations, the remodeling of certain locations, as well as development and enhancements to communications and information systems. In addition, the Company received $1.4 million of proceeds from insurance claims.
During the year ended December 31, 2007, the Company’s acquisition of pawnshop assets used cash of $3.8 million. Additionally, the Company made two supplemental payments of $33.8 million and $43.4 million in February 2007 and November 2007, respectively, and paid other acquisition costs of approximately $1.7 million in connection with the acquisition of substantially all of the assets of The Check Giant LLC (“TCG”). To the extent that the defined multiple of earnings attributable to the business acquired from TCG exceeds the total amounts paid through the supplemental payment measurement dates, as defined in the asset purchase agreement, the Company will make additional payments to the sellers in May and November of 2008. As of December 31, 2007, the Company has accrued to accounts payable approximately $22.0 million for this payment based on the defined multiple of trailing twelve months earnings through

50
December 31, 2007. The next measurement date will be March 31, 2008. The magnitude of these payments could be significant if the past success of the business continues throughout 2008.
In August 2007, the Company received gross proceeds in the amount of $16.8 million on the sale of notes receivable that it had received in September 2004 as part of the proceeds from its sale of Svensk Pantbelåning, its former Swedish pawn lending subsidiary to Rutland Partners LLP, for cash and two subordinated notes receivable. One of the notes receivable was convertible into approximately 27.7% of the parent company of Svensk Pantbelåning on a fully-diluted basis. In August 2007, Rutland Partners LLP sold Svensk Pantbelåning to a third party who also purchased the notes receivable from the Company. The Company’s total proceeds of $16.8 million represent $12.4 million in the repayment of principal, including $0.3 million of accrued interest owed on notes receivable and $4.4 million for the value of its conversion rights under the convertible note. For the year ended December 31, 2007, the Company recognized a pre-tax gain of approximately $6.3 million from the sale of the notes and related rights. Proceeds from the sale were used for general corporate purposes, including the repayment of debt and the repurchase of shares in the open market pursuant to an existing share repurchase authorization.
Management anticipates that capital expenditures for 2008 will be approximately $50 to $60 million, primarily for the remodeling of selected operating units, for the continuing development and enhancements to communications and information systems, including the multi-year project to upgrade the Company’s proprietary point-of-sale and information system, and for the establishment of approximately three to ten combined total of new cash advance-only locations and pawnshops. The additional capital required to make supplemental acquisition payments related to the CashNetUSA acquisition and to pursue other acquisition opportunities is not included in the estimate of capital expenditures because of the uncertainties surrounding such payments or any potential transaction of this nature at this time. Management expects the implementation of the new point-of-sale system, which will occur during 2008, will result in a substantial increase in depreciation expense.
Cash flows from financing activities. During 2007, the Company borrowed $90.1 million under its bank lines of credit. The Company reduced the balance owed on its senior unsecured notes by $21.1 million through the scheduled principal payments. Additional uses of cash included $4.1 million for dividends paid. On April 20, 2005, the Board of Directors authorized the Company’s repurchase of up to a total of 1,500,000 shares of its common stock (the “2005 authorization”). At its regularly scheduled meeting of its Board of Directors on October 24, 2007, the Board established a new authorization (the “2007 authorization”) for the repurchase of 1,500,000 shares and ended the 2005 authorization. Management expects to purchase shares of the Company from time to time in the open market, and funding will come from operating cash flow. During the year ended December 31, 2007, 667,600 shares were purchased for an aggregate amount of $23.6 million under the 2005 authorization and the 2007 authorization. In addition, 9,794 shares were acquired as partial payments of taxes for shares issued under stock-based compensation plans for an aggregate amount of $408,000. During 2007, stock options for 69,854 shares were exercised which generated $0.8 million of additional equity.
In March 2007, the Company amended its line of credit to extend the final maturity by two years, to March 2012. The amended credit agreement also contained a provision for the ratable $50.0 million increase in the committed amounts, up to $300.0 million, upon the Company’s request and approval by the lenders. The Company exercised the increase provision on February 29, 2008. As a result, as of that date, the committed amount under its line of credit is $300.0 million. The line of credit agreement and the senior unsecured notes require that the Company maintain certain financial ratios. The Company is in compliance with all covenants and other requirements set forth in its debt agreements. A significant decline in demand for the Company’s products and services may cause the Company to reduce its planned level of capital expenditures and lower its working capital needs in order to maintain compliance with the financial ratios in those agreements. A violation of the credit agreement or the senior unsecured note agreements could result in an acceleration of the Company’s debt and increase the Company’s borrowing costs and could adversely affect the Company’s ability to renew its existing credit facility or obtain new credit on favorable terms in
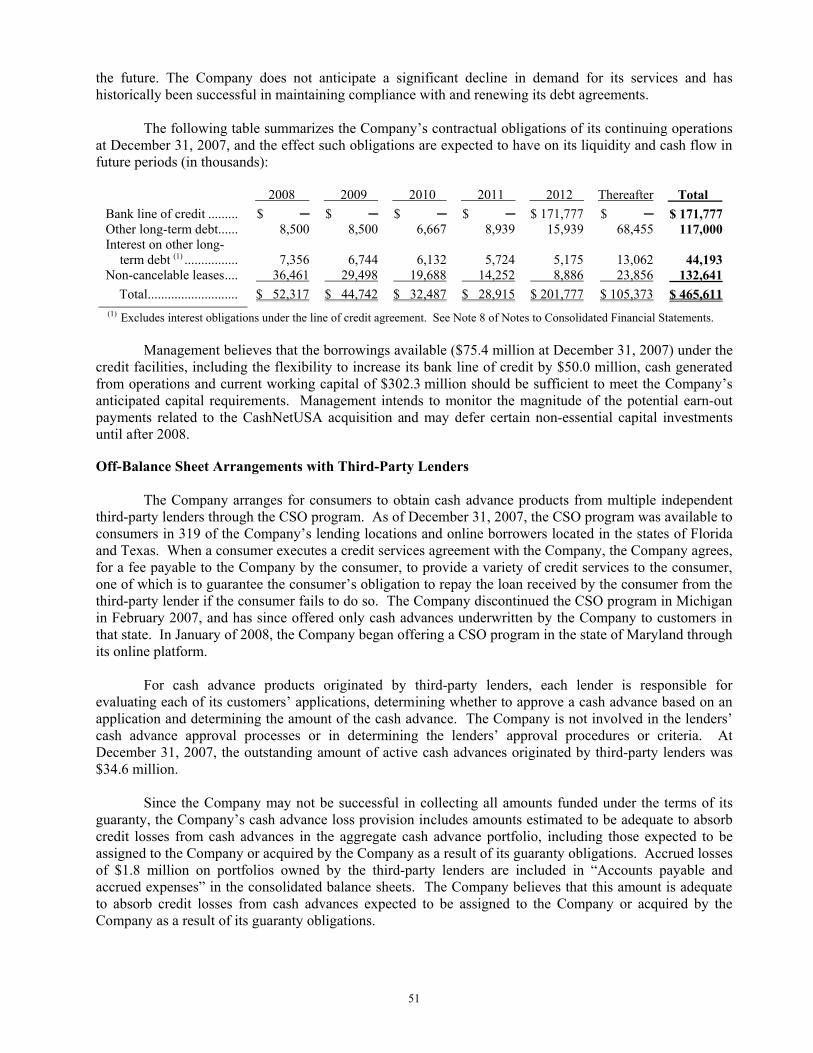
51
the future. The Company does not anticipate a significant decline in demand for its services and has historically been successful in maintaining compliance with and renewing its debt agreements.
The following table summarizes the Company’s contractual obligations of its continuing operations at December 31, 2007, and the effect such obligations are expected to have on its liquidity and cash flow in future periods (in thousands):
2008 2009 2010 2011 2012 Thereafter Total Bank line of credit ......... $ $ $ $ $ 171,777 $ $ 171,777 Other long-term debt...... 8,500 8,500 6,667 8,939 15,939 68,455 117,000 Interest on other long-
term debt (1) ................ 7,356 6,744 6,132 5,724 5,175 13,062 44,193 Non-cancelable leases.... 36,461 29,498 19,688 14,252 8,886 23,856 132,641 Total........................... $ 52,317 $ 44,742 $ 32,487 $ 28,915 $ 201,777 $ 105,373 $ 465,611 (1) Excludes interest obligations under the line of credit agreement. See Note 8 of Notes to Consolidated Financial Statements.
Management believes that the borrowings available ($75.4 million at December 31, 2007) under the
credit facilities, including the flexibility to increase its bank line of credit by $50.0 million, cash generated from operations and current working capital of $302.3 million should be sufficient to meet the Company’s anticipated capital requirements. Management intends to monitor the magnitude of the potential earn-out payments related to the CashNetUSA acquisition and may defer certain non-essential capital investments until after 2008. Off-Balance Sheet Arrangements with Third-Party Lenders
The Company arranges for consumers to obtain cash advance products from multiple independent third-party lenders through the CSO program. As of December 31, 2007, the CSO program was available to consumers in 319 of the Company’s lending locations and online borrowers located in the states of Florida and Texas. When a consumer executes a credit services agreement with the Company, the Company agrees, for a fee payable to the Company by the consumer, to provide a variety of credit services to the consumer, one of which is to guarantee the consumer’s obligation to repay the loan received by the consumer from the third-party lender if the consumer fails to do so. The Company discontinued the CSO program in Michigan in February 2007, and has since offered only cash advances underwritten by the Company to customers in that state. In January of 2008, the Company began offering a CSO program in the state of Maryland through its online platform. For cash advance products originated by third-party lenders, each lender is responsible for evaluating each of its customers’ applications, determining whether to approve a cash advance based on an application and determining the amount of the cash advance. The Company is not involved in the lenders’ cash advance approval processes or in determining the lenders’ approval procedures or criteria. At December 31, 2007, the outstanding amount of active cash advances originated by third-party lenders was $34.6 million. Since the Company may not be successful in collecting all amounts funded under the terms of its guaranty, the Company’s cash advance loss provision includes amounts estimated to be adequate to absorb credit losses from cash advances in the aggregate cash advance portfolio, including those expected to be assigned to the Company or acquired by the Company as a result of its guaranty obligations. Accrued losses of $1.8 million on portfolios owned by the third-party lenders are included in “Accounts payable and accrued expenses” in the consolidated balance sheets. The Company believes that this amount is adequate to absorb credit losses from cash advances expected to be assigned to the Company or acquired by the Company as a result of its guaranty obligations.

52
CAUTIONARY STATEMENT REGARDING RISKS AND UNCERTAINTIES THAT MAY AFFECT FUTURE RESULTS This Annual Report on Form 10-K, including Management’s Discussion and Analysis of Financial Condition and Results of Operations, contains statements that are forward-looking, as that term is defined by the Private Securities Litigation Reform Act of 1995 or by the Securities and Exchange Commission in its rules. The Company intends that all forward-looking statements be subject to the safe harbors created by these laws and rules. The actual results of the Company could differ materially from those indicated by the forward-looking statements because of various risks and uncertainties including, without limitation, changes in demands for the Company’s services, the actions of third parties who offer products and services at the Company’s locations, fluctuations in the price of gold, changes in competition, the ability of the Company to open new operating units in accordance with its plans, economic conditions, real estate market fluctuations, interest rate fluctuations, changes in the capital markets, changes in foreign currency exchange rates, changes in tax and other laws and governmental rules and regulations applicable to the Company’s business, the effect of such changes on the Company’s business or the markets in which it operates, or the ability to successfully integrate newly acquired businesses into the Company’s operations. When used in this Annual Report on Form 10-K, the words “believes,” “estimates,” “plans,” “expects,” “anticipates,” and similar expressions as they relate to the Company or its management are intended to identify forward-looking statements. All forward-looking statements are based on current expectations regarding important risk factors. These risks and uncertainties are beyond the ability of the Company to control, and, in many cases, the Company cannot predict all of the risks and uncertainties that could cause its actual results to differ materially from those expressed in the forward-looking statements. Such statements should not be regarded as a representation by the Company or any other person that the results expressed in the statements will be achieved. ITEM 7A. QUANTITATIVE AND QUALITATIVE DISCLOSURES ABOUT MARKET RISK Market risks relating to the Company’s operations result primarily from changes in interest rates, foreign currency exchange rates and gold prices. The Company does not engage in speculative or leveraged transactions, nor does it hold or issue financial instruments for trading purposes. Interest Rate Risk. Management’s objective is to minimize the cost of borrowing through an appropriate mix of fixed and floating rate debt. Derivative financial instruments, such as interest rate cap agreements, may be used for the purpose of managing fluctuating interest rate exposures that exist from ongoing business operations. In December 2007, the Company entered into an interest rate cap agreement with a notional amount of $10.0 million of the Company’s outstanding floating rate line of credit for a term of 24 months at a fixed LIBOR rate of 4.75%. This interest rate cap agreement was perfectly effective at December 31, 2007. The Company had variable rate borrowings outstanding of $171.8 million and $81.7 million at December 31, 2007 and 2006, respectively. Interest rates on $10.0 million of the net variable rate borrowings at December 31, 2007 were capped at 4.75%. Interest rates on $15.0 million of the net variable rate borrowings at December 31, 2006 were capped at 4.5%. If prevailing interest rates were to increase 100 basis points over the rates at December 31, 2007 and 2006, respectively, and the variable rate borrowings outstanding remained constant, the Company’s interest expense would increase by $1.6 million and $667,000, and net income after taxes would decrease by $1.1 million and $433,000 in 2007 and 2006, respectively. Gold Price Risk. The Company periodically uses forward sale contracts with a major gold bullion bank to sell a portion of the expected amount of refined gold produced in the normal course of business from its liquidation of forfeited gold merchandise. A significant decrease in the price of gold would result in a reduction of proceeds from the disposition of refined gold to the extent that amounts sold were in excess of the amount of contracted forward sales. In addition, a significant and sustained decline in the price of gold would negatively impact the value of some of the goods pledged as collateral by customers and identified for liquidation as refined gold. In this instance, management believes some customers would be willing to add additional items of value to their pledge in order to obtain the desired loan amount. However, those
53
customers unable or unwilling to provide additional collateral would receive lower loan amounts, possibly resulting in a lower balance of pawn loans outstanding for the Company. Foreign Currency Exchange Risk. The Company is subject to the risk of an unexpected change in British pound exchange rates as a result of its loans to residents of the United Kingdom. As a result of fluctuations in the British pound, the Company recorded foreign currency transaction losses of $87,000 in 2007. Forward contracts in the amount of 1.0 million British pounds were established in 2007 to minimize the effect of market fluctuations. A hypothetical 10% decline in the exchange rate of the British pound at December 31, 2007 would have decreased net income by $171,000.
In addition, the notes receivable received in the sale of the Company’s foreign operations subjected the Company to the risk of unexpected changes in Swedish kronor exchange rates. The Company recorded a net gain of $63,000 as a result of fluctuations in the Swedish kronor during 2007. These notes receivable were sold in August 2007.
54
ITEM 8. FINANCIAL STATEMENTS AND SUPPLEMENTARY DATA
Index to Consolidated Financial Statements
Report of Independent Registered Public Accounting Firm........................................................................ 55
Report of Management on Internal Control over Financial Reporting ........................................................ 56 Consolidated Balance Sheets – December 31, 2007 and 2006 .................................................................... 57 Consolidated Statements of Income – Years Ended December 31, 2007, 2006 and 2005 .......................... 58 Consolidated Statements of Stockholders’ Equity – Years Ended December 31, 2007, 2006 and 2005 .... 59 Consolidated Statements of Comprehensive Income – Years Ended December 31, 2007, 2006 and 2005 59 Consolidated Statements of Cash Flows – Years Ended December 31, 2007, 2006 and 2005 ................... 60 Notes to Consolidated Financial Statements................................................................................................ 61
55
REPORT OF INDEPENDENT REGISTERED PUBLIC ACCOUNTING FIRM To the Board of Directors and Stockholders of Cash America International, Inc.: In our opinion, the accompanying consolidated balance sheets and the related consolidated statements of income, stockholders' equity, comprehensive income and cash flows present fairly, in all material respects, the financial position of Cash America International, Inc. and its subsidiaries at December 31, 2007 and 2006, and the results of their operations and their cash flows for each of the three years in the period ended December 31, 2007 in conformity with accounting principles generally accepted in the United States of America. Also in our opinion, the Company maintained, in all material respects, effective internal control over financial reporting as of December 31, 2007, based on criteria established in Internal Control - Integrated Framework issued by the Committee of Sponsoring Organizations of the Treadway Commission (COSO). The Company's management is responsible for these financial statements, for maintaining effective internal control over financial reporting and for its assessment of the effectiveness of internal control over financial reporting, included in the accompanying Report of Management on Internal Control over Financial Reporting. Our responsibility is to express opinions on these financial statements and on the Company's internal control over financial reporting based on our integrated audits. We conducted our audits in accordance with the standards of the Public Company Accounting Oversight Board (United States). Those standards require that we plan and perform the audits to obtain reasonable assurance about whether the financial statements are free of material misstatement and whether effective internal control over financial reporting was maintained in all material respects. Our audits of the financial statements included examining, on a test basis, evidence supporting the amounts and disclosures in the financial statements, assessing the accounting principles used and significant estimates made by management, and evaluating the overall financial statement presentation. Our audit of internal control over financial reporting included obtaining an understanding of internal control over financial reporting, assessing the risk that a material weakness exists, and testing and evaluating the design and operating effectiveness of internal control based on the assessed risk. Our audits also included performing such other procedures as we considered necessary in the circumstances. We believe that our audits provide a reasonable basis for our opinions. A company’s internal control over financial reporting is a process designed to provide reasonable assurance regarding the reliability of financial reporting and the preparation of financial statements for external purposes in accordance with generally accepted accounting principles. A company’s internal control over financial reporting includes those policies and procedures that (i) pertain to the maintenance of records that, in reasonable detail, accurately and fairly reflect the transactions and dispositions of the assets of the company; (ii) provide reasonable assurance that transactions are recorded as necessary to permit preparation of financial statements in accordance with generally accepted accounting principles, and that receipts and expenditures of the company are being made only in accordance with authorizations of management and directors of the company; and (iii) provide reasonable assurance regarding prevention or timely detection of unauthorized acquisition, use, or disposition of the company’s assets that could have a material effect on the financial statements. Because of its inherent limitations, internal control over financial reporting may not prevent or detect misstatements. Also, projections of any evaluation of effectiveness to future periods are subject to the risk that controls may become inadequate because of changes in conditions, or that the degree of compliance with the policies or procedures may deteriorate.
Fort Worth, Texas February 20, 2008
56
REPORT OF MANAGEMENT ON INTERNAL CONTROL OVER FINANCIAL REPORTING
Management is responsible for establishing and maintaining adequate internal control over financial
reporting and for the assessment of the effectiveness of the Company’s internal control over financial reporting. The Company’s internal control over financial reporting is a process designed to provide reasonable assurance regarding the reliability of financial reporting and the preparation of financial statements for external purposes in accordance with generally accepted accounting principles. The Company’s internal control over financial reporting includes those policies and procedures that (i) pertain to the maintenance of records that, in reasonable detail, accurately and fairly reflect the transactions and dispositions of the assets of the Company; (ii) provide reasonable assurance that transactions are recorded as necessary to permit preparation of financial statements in accordance with generally accepted accounting principles, and that receipts and expenditures of the Company are being made only in accordance with authorizations of management and directors of the Company; and (iii) provide reasonable assurance regarding prevention or timely detection of unauthorized acquisition, use, or disposition of the Company’s assets that could have a material effect on the financial statements. Management assessed the effectiveness of the Company’s internal control over financial reporting as of December 31, 2007. In making its assessment of the effectiveness of the Company’s internal control over financial reporting, management of the Company has utilized the criteria established in Internal Control – Integrated Framework issued by the Committee of Sponsoring Organizations of the Treadway Commission (COSO).
Based on management’s assessment, we concluded that, as of December 31, 2007, the Company’s internal control over financial reporting is effective based on those criteria. The effectiveness of the Company’s internal control over financial reporting as of December 31, 2007 has been audited by PricewaterhouseCoopers LLP, an independent registered public accounting firm, as stated in their report which appears in this Form 10-K. /s/ DANIEL R. FEEHAN /s/ THOMAS A. BESSANT, JR. Daniel R. Feehan Thomas A. Bessant, Jr. President and Chief Executive Officer Executive Vice President and Chief Financial Officer February 29, 2008 February 29, 2008

57
CASH AMERICA INTERNATIONAL, INC. AND SUBSIDIARIES CONSOLIDATED BALANCE SHEETS
(in thousands, except share data) December 31,
2007 2006 Assets Current assets: Cash and cash equivalents.................................................................................... $ 22,725 $ 25,723 Pawn loans ........................................................................................................... 137,319 127,384 Cash advances, net ............................................................................................... 88,148 79,975 Merchandise held for disposition, net .................................................................. 98,134 87,060 Finance and service charges receivable................................................................ 26,963 25,377 Other receivables and prepaid expenses............................................................... 16,292 16,128 Deferred tax assets ............................................................................................... 20,204 16,324 Total current assets ........................................................................................... 409,785 377,971 Property and equipment, net .................................................................................... 161,676 119,261 Goodwill .................................................................................................................. 306,221 238,499 Intangible assets, net ................................................................................................ 23,484 27,477 Other assets .............................................................................................................. 3,478 13,036 Total assets ....................................................................................................... $ 904,644 $ 776,244 Liabilities and Stockholders’ Equity Current liabilities: Accounts payable and accrued expenses .............................................................. $ 87,399 $ 91,217 Customer deposits ................................................................................................ 7,856 7,464 Income taxes currently payable ............................................................................ 3,755 2,691 Current portion of long-term debt ........................................................................ 8,500 16,786 Total current liabilities...................................................................................... 107,510 118,158 Deferred tax liabilities.............................................................................................. 18,584 12,770 Other liabilities ........................................................................................................ 1,671 1,625 Long-term debt ........................................................................................................ 280,277 202,963 Total liabilities...................................................................................................... 408,042 335,516 Commitments and contingencies (Note 10) Stockholders’ equity: Common stock, $.10 par value per share, 80,000,000 shares authorized,
30,235,164 shares issued ..................................................................................
3,024 3,024 Additional paid-in capital ..................................................................................... 163,581 161,683 Retained earnings ................................................................................................. 363,180 287,962 Accumulated other comprehensive income.......................................................... 16 20 Notes receivable secured by common stock......................................................... (18) Treasury shares, at cost (1,136,203 shares and 565,840 shares at December 31,
2007 and 2006, respectively) ............................................................................
(33,199) (11,943) Total stockholders’ equity ............................................................................. 496,602 440,728 Total liabilities and stockholders’ equity....................................................... $ 904,644 $ 776,244
See notes to consolidated financial statements.
58
CASH AMERICA INTERNATIONAL, INC. AND SUBSIDIARIES CONSOLIDATED STATEMENTS OF INCOME
(in thousands, except per share data) Year Ended December 31, 2007 2006 2005 Revenue Finance and service charges .......................................................... $ 160,960 $ 149,472 $ 139,772 Proceeds from disposition of merchandise .................................... 396,821 334,036 300,192 Cash advance fees ......................................................................... 355,196 195,105 142,068 Check cashing fees, royalties and other......................................... 16,417 15,901 13,731 Total Revenue ................................................................................. 929,394 694,514 595,763 Cost of Revenue Disposed merchandise ................................................................... 246,792 204,929 183,799 Net Revenue .................................................................................... 682,602 489,585 411,964 Expenses Operations ..................................................................................... 304,480 247,707 221,996 Cash advance loss provision.......................................................... 155,238 59,563 42,834 Administration............................................................................... 57,250 50,984 43,005 Depreciation and amortization....................................................... 32,125 27,312 23,417 Total Expenses ................................................................................ 549,093 385,566 331,252 Income from Operations................................................................ 133,509 104,019 80,712 Interest expense ............................................................................. (16,021) (11,945) (10,610) Interest income .............................................................................. 1,041 1,631 1,614 Foreign currency transaction (loss) gain ....................................... (24) 296 (834) Gain from termination of contract ................................................. 2,167 Gain on sale of foreign notes......................................................... 6,260 Income from Continuing Operations before Income Taxes ....... 124,765 96,168 70,882 Provision for income taxes ............................................................ 45,419 35,228 26,061 Income from Continuing Operations............................................ 79,346 60,940 44,821 Loss from disposal of discontinued operations before income
tax benefit...................................................................................
(56) Income tax benefit ......................................................................... 253 Income from discontinued operations ........................................... 197 Net Income ...................................................................................... $ 79,346 $ 60,940 $ 45,018 Earnings Per Share: Basic – Income from continuing operations............................................ $ 2.68 $ 2.05 $ 1.53 Income from discontinued operations ........................................ $ $ $ 0.01 Net income ................................................................................. $ 2.68 $ 2.05 $ 1.54 Diluted – Income from continuing operations............................................ $ 2.61 $ 2.00 $ 1.48 Income from discontinued operations ........................................ $ $ $ 0.01 Net income ................................................................................. $ 2.61 $ 2.00 $ 1.49 Weighted average common shares outstanding: Basic .............................................................................................. 29,643 29,676 29,326 Diluted........................................................................................... 30,349 30,532 30,206 Dividends declared per common share............................................. $ 0.14 $ 0.10 $ 0.10
See notes to consolidated financial statements.
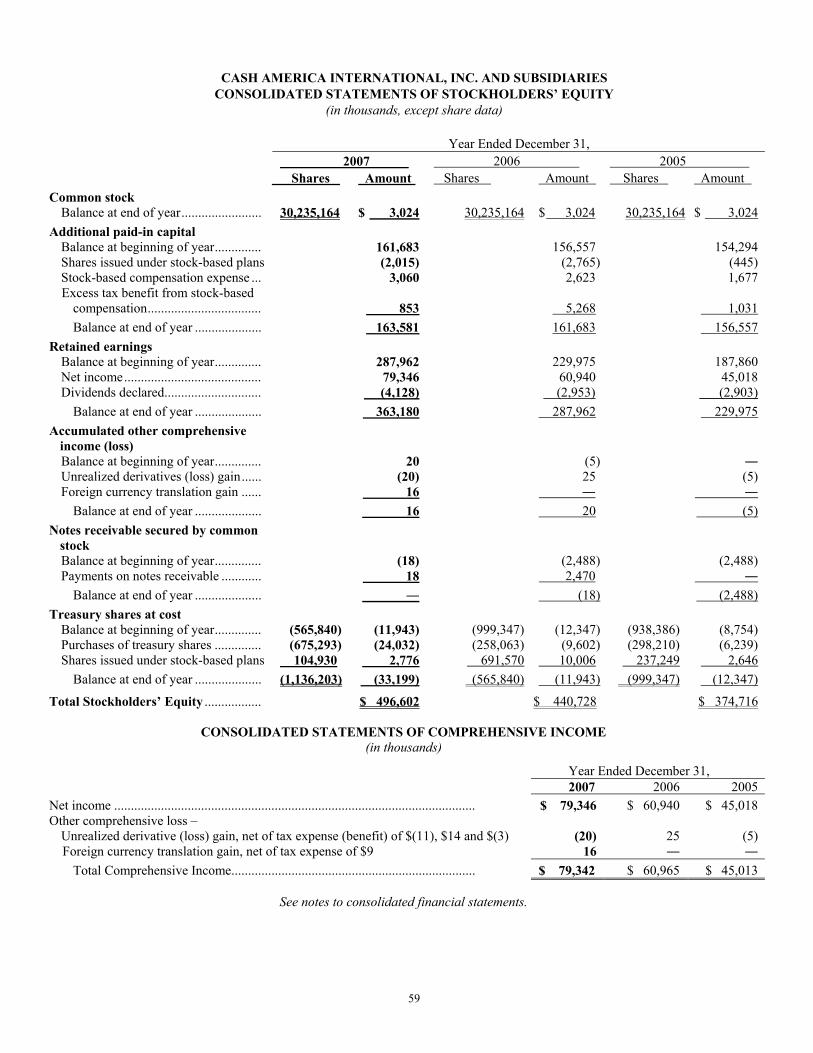
59
CASH AMERICA INTERNATIONAL, INC. AND SUBSIDIARIES CONSOLIDATED STATEMENTS OF STOCKHOLDERS’ EQUITY
(in thousands, except share data) Year Ended December 31, 2007 2006 2005 Shares Amount Shares Amount Shares Amount Common stock Balance at end of year........................ 30,235,164 $ 3,024 30,235,164 $ 3,024 30,235,164 $ 3,024 Additional paid-in capital Balance at beginning of year.............. 161,683 156,557 154,294 Shares issued under stock-based plans (2,015) (2,765) (445) Stock-based compensation expense ... 3,060 2,623 1,677 Excess tax benefit from stock-based
compensation.................................. 853 5,268
1,031 Balance at end of year .................... 163,581 161,683 156,557 Retained earnings Balance at beginning of year.............. 287,962 229,975 187,860 Net income......................................... 79,346 60,940 45,018 Dividends declared............................. (4,128) (2,953) (2,903) Balance at end of year .................... 363,180 287,962 229,975 Accumulated other comprehensive
income (loss)
Balance at beginning of year.............. 20 (5) Unrealized derivatives (loss) gain...... (20) 25 (5) Foreign currency translation gain ...... 16 Balance at end of year .................... 16 20 (5) Notes receivable secured by common
stock
Balance at beginning of year.............. (18) (2,488) (2,488) Payments on notes receivable ............ 18 2,470 Balance at end of year .................... (18) (2,488) Treasury shares at cost Balance at beginning of year.............. (565,840) (11,943) (999,347) (12,347) (938,386) (8,754) Purchases of treasury shares .............. (675,293) (24,032) (258,063) (9,602) (298,210) (6,239) Shares issued under stock-based plans 104,930 2,776 691,570 10,006 237,249 2,646 Balance at end of year .................... (1,136,203) (33,199) (565,840) (11,943) (999,347) (12,347)
Total Stockholders’ Equity ................. $ 496,602 $ 440,728 $ 374,716
CONSOLIDATED STATEMENTS OF COMPREHENSIVE INCOME (in thousands)
Year Ended December 31, 2007 2006 2005Net income ............................................................................................................ $ 79,346 $ 60,940 $ 45,018 Other comprehensive loss – Unrealized derivative (loss) gain, net of tax expense (benefit) of $(11), $14 and $(3) (20) 25 (5) Foreign currency translation gain, net of tax expense of $9 16 Total Comprehensive Income......................................................................... $ 79,342 $ 60,965 $ 45,013
See notes to consolidated financial statements.

60
CASH AMERICA INTERNATIONAL, INC. AND SUBSIDIARIES CONSOLIDATED STATEMENTS OF CASH FLOWS
(in thousands)
Year Ended December 31, 2007 2006 2005Cash Flows from Operating Activities of Continuing Operations: Net income ............................................................................................................. $ 79,346 $ 60,940 $ 45,018 Income from discontinued operations .................................................................... (197) Adjustments to reconcile net income to net cash provided by operating activities: Depreciation and amortization............................................................................ 32,125 27,312 23,417 Cash advance loss provision............................................................................... 155,238 59,563 42,834 Stock-based compensation expense.................................................................... 3,060 2,623 1,677 Foreign currency transaction (gain) loss............................................................. 24 (296) 834 Gain on termination of contract.......................................................................... (2,167) Gain on sale of foreign notes .............................................................................. (6,260) Changes in operating assets and liabilities – Merchandise held for disposition........................................................................ 1,765 7,128 12,499 Finance and service charges receivable .............................................................. (2,305) (4,579) (1,861) Other receivables and prepaid expenses ............................................................. (2,216) (4,981) (3,191) Accounts payable and accrued expenses ............................................................ 8,968 17,969 4,264 Customer deposits, net........................................................................................ 328 696 461 Current income taxes, net ................................................................................... 1,917 6,510 229 Excess income tax benefit from stock-based compensation............................... (853) (5,268) (1,031) Deferred income taxes, net ................................................................................. 1,936 (3,638) (1,633) Net cash provided by operating activities of continuing operations ............... 273,073 161,812 123,320 Cash Flows from Investing Activities of Continuing Operations: Pawn loans made.................................................................................................... (435,046) (395,104) (361,077) Pawn loans repaid .................................................................................................. 218,920 210,177 202,015 Principal recovered on forfeited loans through dispositions .................................. 194,365 158,568 139,365 Cash advances made, assigned or purchased ......................................................... (1,162,952) (759,822) (624,303) Cash advances repaid ............................................................................................. 1,001,048 682,473 578,475 Acquisitions, net of cash acquired.......................................................................... (82,557) (64,927) (19,937) Purchases of property and equipment .................................................................... (70,097) (46,355) (27,255) Proceeds from sale of foreign notes....................................................................... 16,589 Proceeds from insurance claims............................................................................. 1,416 1,934 530 Proceeds from disposition of assets and termination of contract ........................... 2,198 486 Net cash used by investing activities of continuing operations .......................... (318,314) (210,858) (111,701) Cash Flows from Financing Activities of Continuing Operations: Net borrowings (repayments) under bank line of credit......................................... 90,100 10,540 (21,346) Issuance of long-term notes ................................................................................... 60,000 40,000 Debt issuance costs paid......................................................................................... (282) (261) (1,328) Payments on notes payable and other obligations.................................................. (21,072) (16,786) (19,286) Payments on notes receivable secured by common stock ...................................... 18 2,470 Proceeds from exercise of stock options ................................................................ 761 7,241 2,202 Excess income tax benefit from stock-based compensation .................................. 853 5,268 1,031 Treasury shares purchased ..................................................................................... (24,032) (9,602) (6,240) Dividends paid ....................................................................................................... (4,128) (2,953) (2,903) Net cash provided (used) by financing activities of continuing operations ........ 42,218 55,917 (7,870)
Effect of exchange rates on cash ............................................................................ 25 Net (decrease) increase in cash and cash equivalents ................................................ (2,998) 6,871 3,749 Cash and cash equivalents at beginning of year ........................................................ 25,723 18,852 15,103 Cash and cash equivalents at end of year................................................................... $ 22,725 $ 25,723 $ 18,852
See notes to consolidated financial statements.

CASH AMERICA INTERNATIONAL, INC. AND SUBSIDIARIES NOTES TO CONSOLIDATED FINANCIAL STATEMENTS
61
1. Nature of the Company Cash America International, Inc. (the “Company”) is a provider of specialty financial services to individuals. The Company offers secured non-recourse loans, commonly referred to as pawn loans, to individuals through its pawn lending operations. The pawn loan portfolio generates finance and service charges revenue. A related activity of the pawn lending operations is the disposition of merchandise, primarily collateral from unredeemed pawn loans. The Company also offers unsecured cash advances in selected lending locations and over the internet and on behalf of independent third-party lenders in other locations and over the internet. In addition, the Company provides check cashing and related financial services through many of its lending locations and through its franchised and company-owned check cashing centers. Since the acquisition of the assets of The Check Giant, LLC (“TCG”) in September 2006, the Company has offered short-term cash advances exclusively over the internet under the name “CashNetUSA” in the United States and, beginning in July 2007, under the name “QuickQuid” in the United Kingdom. On September 15, 2006, the Company, through its wholly-owned subsidiary Cash America Net Holdings, LLC, purchased substantially all of the assets of TCG, which offered short-term cash advances exclusively over the internet under the name “CashNetUSA.” The Company paid an initial purchase price of approximately $35.9 million in cash at closing and transaction costs of approximately $2.9 million. The operating results of CashNetUSA have been included in the Company’s consolidated financial statements from the date of acquisition. See Note 3. As of December 31, 2007, the Company had 942 total locations and an internet-based subsidiary offering products and services to its customers. The pawn lending operations consisted of 499 pawnshops, including 485 owned units and 14 unconsolidated franchised units in 22 states. The cash advance operations consisted of 304 locations in seven states, and CashNetUSA which serves multiple markets through its internet distribution channel and had cash advances outstanding in 32 states and the United Kingdom. The check cashing operations consisted of 139 total locations, including 134 franchised and five company-owned check cashing centers in 18 states. 2. Summary of Significant Accounting Policies Basis of Presentation The consolidated financial statements include the accounts of the Company and its majority-owned subsidiaries. All significant intercompany accounts and transactions have been eliminated in consolidation. Use of Estimates The preparation of financial statements in conformity with generally accepted accounting principles requires management to make estimates and assumptions that affect the reported amounts of assets and liabilities and disclosure of contingent assets and liabilities at the dates of the consolidated financial statements and the reported amounts of revenue and expenses during the reporting periods. On an ongoing basis, management evaluates its estimates and judgments, including those related to revenue recognition, merchandise held for disposition, allowance for losses on cash advances, long-lived and intangible assets, income taxes, contingencies and litigation. Management bases its estimates on historical experience and on various other assumptions that are believed to be reasonable under the circumstances the results of which form the basis for making judgments about the carrying values of assets and liabilities. Actual results may differ from these estimates under different assumptions or conditions.

CASH AMERICA INTERNATIONAL, INC. AND SUBSIDIARIES NOTES TO CONSOLIDATED FINANCIAL STATEMENTS (Continued)
62
Foreign Currency Translations Notes receivable and related interest receivable resulting from the sale of the Company’s foreign pawn lending operations are denominated in Swedish kronor. The balances are translated into U.S. dollars at the exchange rates in effect at the balance sheet date. Interest income on the notes was translated at the monthly average exchange rates. In August 2007, the Company completed the sale of these notes. See Note 21. All realized and unrealized transaction gains and losses are included in determining net income for the reporting period. The functional currency for the Company’s subsidiary (CashEuroNet UK, LLC) is the British pound. The assets and liabilities of this subsidiary are translated into U.S. dollars at the exchange rates in effect at each balance sheet date, and the resulting adjustments are accumulated in other comprehensive income (loss) as a separate component of stockholders’ equity. Revenue and expenses are translated at the monthly average exchange rates occurring during each year. Cash and Cash Equivalents The Company considers cash on hand in operating locations, deposits in banks and short-term marketable securities with original maturities of 90 days or less as cash and cash equivalents. Revenue Recognition Pawn Lending Pawn loans are made on the pledge of tangible personal property. The Company accrues finance and service charges revenue only on those pawn loans that the Company deems collectible based on historical loan redemption statistics. Pawn loans written during each calendar month are aggregated and tracked for performance. The gathering of this empirical data allows the Company to analyze the characteristics of its outstanding pawn loan portfolio and estimate the probability of collection of finance and service charges. For loans not repaid, the carrying value of the forfeited collateral (“merchandise held for disposition”) is stated at the lower of cost (cash amount loaned) or market. Revenue is recognized at the time that merchandise is sold. Interim customer payments for layaway sales are recorded as customer deposits and subsequently recognized as revenue during the period in which the final payment is received. Cash Advances Cash advances provide customers with cash in exchange for a promissory note or other repayment agreement supported, in most cases, by that customer’s personal check or authorization to debit that customer’s account via an Automated Clearing House (“ACH”) transaction for the aggregate amount of the payment due. The customer may repay the cash advance either in cash, or, as applicable, by allowing the check to be presented for collection, or by allowing the customer’s checking account to be debited through an ACH for the amount due. The Company accrues fees and interest on cash advances on a constant yield basis ratably over the period of the cash advance, pursuant to its terms. (Although cash advance transactions may take the form of loans or deferred check deposit transactions, the transactions are referred to throughout this discussion as “cash advances” for convenience.)
The Company provides a cash advance product in some markets under a credit services organization program, in which the Company assists in arranging loans for customers from independent third-party lenders. The Company also guarantees the customer’s payment obligations in the event of default if the customer is approved for and accepts the loan. The borrower pays fees to the Company under the credit services organization program (“CSO fees”) for performing services on the borrower’s behalf, including credit services, and for agreeing to guaranty the borrower’s payment obligations to the lender. As a result of providing the guaranty, the CSO fees are deferred and amortized over the term of the loan and recorded as cash advance fees in the accompanying consolidated statements of income. The contingent loss on the guaranteed loans is accrued and recorded as a liability. See Note 4.
CASH AMERICA INTERNATIONAL, INC. AND SUBSIDIARIES NOTES TO CONSOLIDATED FINANCIAL STATEMENTS (Continued)
63
Check Cashing Fees, Royalties and Other The Company records check cashing fees derived from both check cashing locations it owns and many of its lending locations in the period in which the check cashing service is provided. It records royalties derived from franchise locations on an accrual basis. Revenues derived from other financial services such as money order commissions, prepaid debit card fees, etc. are recognized when earned. Allowance for Losses on Cash Advances In order to manage the portfolio of cash advances effectively, the Company utilizes a variety of underwriting criteria, monitors the performance of the portfolio, and maintains either an allowance or accrual for losses. The Company maintains either an allowance or accrual for losses on cash advances (including fees and interest) at a level estimated to be adequate to absorb credit losses inherent in the outstanding combined Company and third-party lender portfolio (the portion owned by independent third-party lenders). The allowance for losses on Company-owned cash advances offsets the outstanding cash advance amounts in the consolidated balance sheets. Active third-party lender-originated cash advances are not included in the consolidated balance sheets. An accrual for contingent losses on third-party lender-owned cash advances that are guaranteed by the Company is maintained and included in “Accounts payable and accrued expenses” in the consolidated balance sheets.
The Company aggregates and tracks cash advances written during each calendar month to develop a performance history. The Company stratifies the outstanding combined portfolio by age, delinquency, and stage of collection when assessing the adequacy of the allowance for losses. It uses historical collection performance adjusted for recent portfolio performance trends to develop the expected loss rates used to establish either the allowance or accrual. Increases in either the allowance or accrual are created by recording a cash advance loss provision in the consolidated statements of income. The Company charges off all cash advances once they have been in default for 60 days or sooner if deemed uncollectible. Recoveries on losses previously charged to the allowance are credited to the allowance when collected.
The Company’s online distribution channel periodically sells selected cash advances that have been previously written off. Proceeds from these sales are recorded as recoveries on losses previously charged to the allowance for losses. The allowance deducted from the carrying value of cash advances was $25.7 million and $19.5 million at December 31, 2007 and 2006, respectively. The accrual for losses on third-party lender-owned cash advances was $1.8 million and $1.2 million at December 31, 2007 and 2006, respectively. See Note 4. Merchandise Held for Disposition and Cost of Disposed Merchandise Merchandise held for disposition includes merchandise acquired from unredeemed loans, merchandise purchased directly from the public and merchandise purchased from vendors. Merchandise held for disposition is stated at the lower of cost (specific identification) or market. The cost of merchandise, computed on the specific identification basis, is removed from merchandise held for disposition and recorded as a cost of revenue at the time of sale. Cash received upon the sale of forfeited merchandise is classified as a recovery of principal on unredeemed loans under investing activities and any related profit or loss on disposed merchandise is included in operating activities in the period when the merchandise is sold. The Company provides an allowance for valuation and shrinkage based on management’s evaluation of the characteristics of the merchandise. The allowance deducted from the carrying value of merchandise held for disposition amounted to $2.0 million and $1.9 million at December 31, 2007 and 2006, respectively.
CASH AMERICA INTERNATIONAL, INC. AND SUBSIDIARIES NOTES TO CONSOLIDATED FINANCIAL STATEMENTS (Continued)
64
Property and Equipment Property and equipment is recorded at cost. The cost of property retired or sold and the related accumulated depreciation are removed from the accounts, and any resulting gain or loss is recognized in the consolidated statements of income. Depreciation expense is generally provided on a straight-line basis, using the following estimated useful lives:
Buildings and building improvements (1) ........................................................... 7 to 40 years Leasehold improvements (2) ............................................................................... 2 to 10 years Furniture, fixtures and equipment ...................................................................... 3 to 7 years Computer software ............................................................................................. 3 to 5 years (1) Structural components are depreciated over 30 to 40 years and the remaining building systems and
features are depreciated over 7 to 20 years. (2) Leasehold improvements are depreciated over the terms of the lease agreements with a maximum of 10
years. Software Development Costs The Company develops computer software for internal use. Internal and external costs incurred for the development of computer applications, as well as for upgrades and enhancements that result in additional functionality of the applications, are capitalized. Internal and external training and maintenance costs are charged to expense as incurred. When an application is placed in service, the Company begins amortizing the related capitalized software costs using the straight-line method based on its estimated useful life which currently ranges from 3 to 5 years. Goodwill and Other Intangible Assets SFAS No. 142, “Goodwill and Other Intangible Assets,” became effective January 1, 2002, and, as a result, the Company discontinued the amortization of goodwill as of that date. In lieu of amortization, the Company is required to perform an impairment review of goodwill at least annually. The Company completed its reviews during 2007, 2006 and 2005. Based on the results of these tests, management determined that there was no impairment as the respective fair values of each of the Company’s reporting units exceeded their respective carrying amounts. See Note 6. The Company amortizes intangible assets with an estimable life on the basis of their expected periods of benefit, generally 3 to 10 years. The costs of start-up activities and organization costs are charged to expense as incurred. Impairment of Long-Lived Assets An evaluation of the recoverability of property and equipment and intangible assets is performed whenever the facts and circumstances indicate that the carrying value may be impaired. An impairment loss is recognized if the future undiscounted cash flows associated with the asset are less than the asset’s corresponding carrying value. The amount of the impairment loss, if any, is the excess of the asset’s carrying value over its estimated fair value. Income Taxes The provision for income taxes is based on income before income taxes as reported for financial statement purposes. Deferred income taxes are provided for in accordance with the assets and liability method of accounting for income taxes in order to recognize the tax effects of temporary differences between financial statement and income tax accounting. Effective January 1, 2007, the Company began accounting for uncertainty in income taxes recognized in the consolidated financial statements in accordance with Financial Accounting Standards Board (“FASB”) Interpretation No. 48, “Accounting for Uncertainty in Income Taxes” (“FIN 48”). FIN 48 requires that a more-likely-than-not threshold be met before the benefit of a tax position may be recognized in the consolidated financial statements and prescribes how such benefit should be measured. It also provides guidance on derecognition, classification, accrual of interest and penalties, accounting in interim periods, disclosure and transition. It requires that the new standard be applied to the balances of assets and
CASH AMERICA INTERNATIONAL, INC. AND SUBSIDIARIES NOTES TO CONSOLIDATED FINANCIAL STATEMENTS (Continued)
65
liabilities as of the beginning of the period of adoption and that a corresponding adjustment be made to the opening balance of retained earnings. See Note 9.
It is the Company’s policy to classify interest and penalties on income tax liabilities as interest expense and administrative expense, respectively. The Company did not change its policy on classification of such amounts upon adoption of FIN 48. Hedging and Derivatives Activity As a policy, the Company does not engage in speculative or leveraged transactions, nor does it hold or issue financial instruments for trading purposes. The Company does periodically use derivative financial instruments, such as interest rate cap agreements, for the purpose of managing interest rate exposures that exist from ongoing business operations. In December 2007, the Company entered into an interest rate cap agreement that has been determined to be a perfectly effective cash flow hedge pursuant to SFAS No. 133, “Accounting for Derivative Instruments and Hedging Activities” (“SFAS 133”), and its corresponding amendments under SFAS No. 138 “Accounting for Certain Derivative Instruments and Certain Hedging Activities – an Amendment of FASB Statement No. 133” (“SFAS 138”) and SFAS No. 149 “Amendment of FASB Statement No. 133 on Derivative and Hedging Activities” (“SFAS 149”). The fair value of the interest rate cap agreement is recognized in the accompanying consolidated balance sheets and changes in its fair value are recognized in accumulated other comprehensive income/loss. The Company also entered into foreign currency forward contracts in 2007 to minimize the effect of market fluctuations. See Note 13. The Company may periodically enter into forward sale contracts with a major gold bullion bank to sell refined gold that is produced in the normal course of business from the Company’s liquidation of forfeited gold merchandise. These contracts are not accounted for as derivatives because they meet the criteria for the normal purchases and normal sales scope exception in SFAS 133. Operations and Administration Expenses Operations expenses include expenses incurred for personnel, occupancy and marketing that are directly related to the pawn lending, cash advance and check cashing operations. These costs are incurred within the lending locations and the Company’s call centers for customer service and collections. In addition, similar costs related to non-home office management supervision, oversight of locations and similar costs incurred by the Retail Services Division for the oversight of the Company’s physical lending locations are included in operations expenses. Administration expenses include expenses incurred for personnel and general office activities such as accounting and legal directly related to corporate administrative functions. Marketing Expenses Costs of advertising and direct customer procurement are expensed at the time of first occurrence and included in operating expenses. Advertising expense for continuing operations was $35.0 million, $18.5 million and $12.9 million for the years ended December 31, 2007, 2006, and 2005, respectively. Stock-Based Compensation Beginning January 1, 2006, the Company has accounted for its stock-based employee compensation plans in accordance with Statement of Financial Accounting Standards No. 123R, “Share-Based Payment” (“SFAS 123R”), using the modified prospective method. Under the modified prospective method, the Company is required to recognize compensation expense over the remaining vesting periods for the portion of stock-based awards for which the requisite service had not been rendered as of January 1, 2006. Prior to January 1, 2006, stock-based compensation was accounted for in accordance with Accounting Principles Board Opinion No. 25, “Accounting for Stock Issued to Employees,” often referred to as the “intrinsic value” based method, and no compensation expense was recognized for the stock options. The consolidated financial statements for the year ended December 31, 2005, which was prior to the adoption of SFAS 123R, have not been restated and do not reflect the recognition of the compensation cost related to the stock options. The Company has elected to use the transition method of FASB Staff
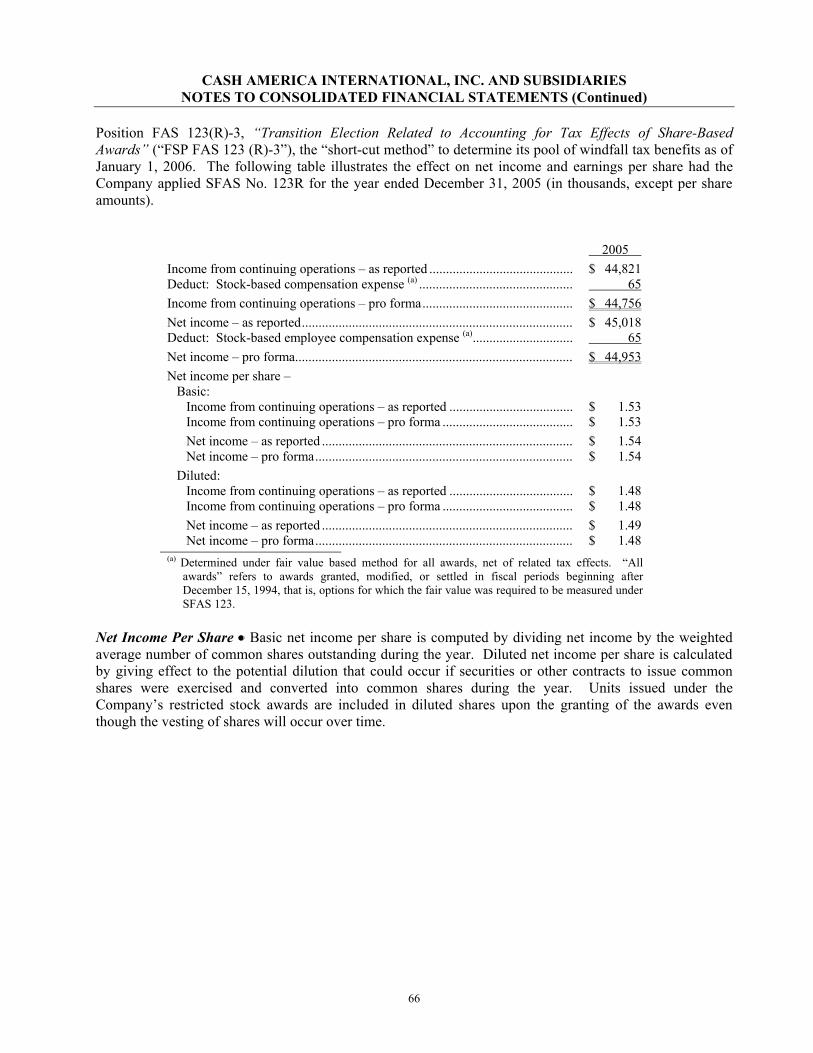
CASH AMERICA INTERNATIONAL, INC. AND SUBSIDIARIES NOTES TO CONSOLIDATED FINANCIAL STATEMENTS (Continued)
66
Position FAS 123(R)-3, “Transition Election Related to Accounting for Tax Effects of Share-Based Awards” (“FSP FAS 123 (R)-3”), the “short-cut method” to determine its pool of windfall tax benefits as of January 1, 2006. The following table illustrates the effect on net income and earnings per share had the Company applied SFAS No. 123R for the year ended December 31, 2005 (in thousands, except per share amounts).
2005 Income from continuing operations – as reported ........................................... $ 44,821 Deduct: Stock-based compensation expense (a) .............................................. 65 Income from continuing operations – pro forma............................................. $ 44,756 Net income – as reported................................................................................. $ 45,018 Deduct: Stock-based employee compensation expense (a).............................. 65 Net income – pro forma................................................................................... $ 44,953 Net income per share – Basic: Income from continuing operations – as reported ..................................... $ 1.53 Income from continuing operations – pro forma ....................................... $ 1.53 Net income – as reported ........................................................................... $ 1.54 Net income – pro forma............................................................................. $ 1.54 Diluted: Income from continuing operations – as reported ..................................... $ 1.48 Income from continuing operations – pro forma ....................................... $ 1.48 Net income – as reported ........................................................................... $ 1.49 Net income – pro forma............................................................................. $ 1.48 (a) Determined under fair value based method for all awards, net of related tax effects. “All
awards” refers to awards granted, modified, or settled in fiscal periods beginning after December 15, 1994, that is, options for which the fair value was required to be measured under SFAS 123.
Net Income Per Share Basic net income per share is computed by dividing net income by the weighted average number of common shares outstanding during the year. Diluted net income per share is calculated by giving effect to the potential dilution that could occur if securities or other contracts to issue common shares were exercised and converted into common shares during the year. Units issued under the Company’s restricted stock awards are included in diluted shares upon the granting of the awards even though the vesting of shares will occur over time.

CASH AMERICA INTERNATIONAL, INC. AND SUBSIDIARIES NOTES TO CONSOLIDATED FINANCIAL STATEMENTS (Continued)
67
The following table sets forth the reconciliation of numerators and denominators of basic and diluted earnings per share computations for the years ended December 31, 2007, 2006 and 2005 (in thousands, except per share amounts):
2007 2006 2005 Numerator: Income from continuing operations available to common
stockholders ............................................................................ $ 79,346 $ 60,940 $ 44,821 Income from discontinued operations available to common
stockholders ............................................................................ 197 Net income available to common shareholders .......................... $ 79,346 $ 60,940 $ 45,018
Denominator: Total weighted average basic shares(1) ........................................... 29,643 29,676 29,326 Effect of shares applicable to stock option plans........................ 351 488 528 Effect of restricted stock unit compensation plans ..................... 355 368 352 Total weighted average diluted shares .................................... 30,349 30,532 30,206 Basic earnings per share: Income from continuing operations............................................ $ 2.68 $ 2.05 $ 1.53 Income from discontinued operations......................................... 0.01 Net income.................................................................................. $ 2.68 $ 2.05 $ 1.54 Diluted earnings per share: Income from continuing operations............................................ $ 2.61 $ 2.00 $ 1.48 Income from discontinued operations......................................... 0.01 Net income.................................................................................. $ 2.61 $ 2.00 $ 1.49
(1) Included in “Total weighted average basic shares” are vested restricted stock units of 160, 98 and 47 as well as shares in a non-qualified savings plan of 57, 59 and 64 for the years ended December 31, 2007, 2006 and 2005, respectively.
There were no anti-dilutive shares for the years ended December 31, 2007, 2006 and 2005. Recent Accounting Pronouncements In September 2006, FASB issued Statement of Financial Accounting Standards No. 157, “Fair Value Measurements” (“SFAS 157”). SFAS 157 defines fair value to be the price that would be received to sell an asset or paid to transfer a liability in an orderly transaction between market participants at the measurement date and emphasizes that fair value is a market-based measurement, not an entity-specific measurement. It establishes a fair value hierarchy and expands disclosures about fair value measurements in both interim and annual periods. SFAS 157 will be effective for fiscal years beginning after November 15, 2007 and interim periods within those fiscal years. In December 2007, FASB issued proposed FASB Staff Position (“FSP”) FAS 157-b, which delays the effective date of SFAS 157 for nonfinancial assets and nonfinancial liabilities that are recognized or disclosed in the financial statements on a nonrecurring basis. The proposed FSP partially defers the effective date of SFAS 157 to fiscal years beginning after November 15, 2008, and interim periods within those fiscal years for items within the scope of this FSP. The Company does not expect SFAS 157 to have a material effect on the Company’s financial position or results of operations. In February 2007, FASB issued Statement of Financial Accounting Standards No. 159, “The Fair Value Option for Financial Assets and Financial Liabilities” (“SFAS 159”). SFAS 159 permits entities to choose, at specified election dates, to measure eligible items at fair value (the “fair value option”) and requires an entity to report unrealized gains and losses on items for which the fair value option has been elected in earnings at each subsequent reporting date. Upfront costs and fees related to items for which the
CASH AMERICA INTERNATIONAL, INC. AND SUBSIDIARIES NOTES TO CONSOLIDATED FINANCIAL STATEMENTS (Continued)
68
fair value option is elected shall be recognized in earnings as incurred and not deferred. SFAS 159 will be effective for fiscal years beginning after November 15, 2007. The Company does not expect SFAS 159 to have a material effect on the Company’s financial position or results of operations.
In December 2007, FASB issued Statement of Financial Accounting Standards No. 141, “Business Combinations – Revised” (“SFAS 141(R)”). SFAS 141(R) establishes principles and requirements for how an acquirer in a business combination: recognizes and measures in its financial statements the identifiable assets acquired, the liabilities assumed, and any non-controlling interest in the acquiree; recognizes and measures the goodwill acquired in the business combination or a gain from a bargain purchase price; and, determines what information to disclose to enable users of the consolidated financial statements to evaluate the nature and financial effects of the business combination. SFAS 141(R) applies prospectively to business combinations for which the acquisition date is on or after the beginning of the first annual reporting period beginning on or after December 15, 2008. In the past, the Company has completed significant acquisitions. The application of SFAS 141(R) will cause management to evaluate future transaction returns under different conditions, particularly the near term and long term economic impact of expensing transaction costs up front. Reclassifications Certain amounts in the consolidated financial statements for 2006 and 2005 have been reclassified to conform to the presentation format adopted in 2007. These reclassifications have no effect on net income previously reported. 3. Acquisitions
Pursuant to its business strategy of expanding its reach into new markets with new customers and new financial services, on September 15, 2006, the Company, through its wholly-owned subsidiary Cash America Net Holdings, LLC, purchased substantially all of the assets of The Check Giant LLC (“TCG”). TCG offered short-term cash advances exclusively over the internet under the name “CashNetUSA.” The Company paid an initial purchase price of approximately $35.9 million in cash and transaction costs of approximately $2.9 million, and has continued to use the CashNetUSA trade name in connection with its online operations.
The Company also agreed to pay up to five supplemental earn-out payments during the two-year
period after the closing. The amount of supplemental payments are based on a multiple of earnings attributable to CashNetUSA’s business for the twelve months preceding the date of determining each scheduled supplemental payment. Each supplemental payment is reduced by amounts previously paid. The supplemental payments are to be paid in cash within 45 days of the payment measurement date. The Company may, at its option, pay up to 25% of each supplemental payment in shares of its common stock based on an average share price as of the measurement date thereby reducing the amount of the cash payment. Management expects all of these supplemental payments will be accounted for as goodwill.
The first supplemental payment of approximately $33.8 million, which was paid in February 2007 in
cash, was based on the trailing twelve months earnings of CashNetUSA through December 31, 2006 and reflects adjustments for amounts previously paid. A second payment of $43.4 million was determined as of September 30, 2007 and was paid in cash in November 2007. Total purchase price payments through the September 2007 measurement date were $113.1 million. Subsequent measurement dates of March 31 and September 30, 2008 will be calculated at 5.0 times trailing twelve month earnings. As of December 31, 2007, the Company has accrued for the payment of approximately $22.0 million as an addition to goodwill and accounts payable based on the defined multiple of 5.0 times trailing twelve months earnings through December 31, 2007. Pursuant to the terms of the purchase agreement with CashNetUSA, payments
CASH AMERICA INTERNATIONAL, INC. AND SUBSIDIARIES NOTES TO CONSOLIDATED FINANCIAL STATEMENTS (Continued)
69
determined at the March 31 and September 30, 2007 measurement dates were calculated at 5.5 times trailing twelve month earnings. As of December 31, 2006, the purchase price of CashNetUSA, including the accrued contingent payment as of December 31, 2006, was allocated as follows (in thousands):
Cash advances .............................................................................................................................. $ 18,677 Property and equipment................................................................................................................ 1,562 Goodwill....................................................................................................................................... 46,871 Intangible assets ........................................................................................................................... 6,264 Other assets , net........................................................................................................................... 9 Net assets acquired .................................................................................................................... 73,383 Cash considerations payable......................................................................................................... (33,761) Acquisition costs payable ............................................................................................................. (844) Total cash paid for acquisition .................................................................................................. $ 38,778
During the year ended December 31, 2007, the Company also acquired the assets of five pawnshops and made payment on a pawnshop over which it acquired management control in December 2006. The aggregate cash payments for these acquisitions were $3.8 million.
During 2006, the Company acquired certain assets of 19 pawnshop locations in purchase transactions for a total purchase price of $27.2 million. The excess of cost of acquired assets over the net amounts assigned to assets acquired and liabilities assumed was recognized as goodwill.
In 2005 the Company acquired the assets of nine pawnshops and a cash advance location in purchase transactions for an aggregate purchase price of $19.0 million. Three of the nine pawnshops acquired in 2005 were franchised locations operated by an entity controlled by the Chairman of the Board of Directors of the Company. See Note 19. All of the amounts of goodwill recorded in the acquisitions are expected to be deductible for tax purposes.
CASH AMERICA INTERNATIONAL, INC. AND SUBSIDIARIES NOTES TO CONSOLIDATED FINANCIAL STATEMENTS (Continued)
70
The following table provides information concerning the other acquisitions made by the Company’s continuing operations during 2007, 2006 and 2005 (excluding CashNetUSA) ($ in thousands):
2007 2006 2005 Number of stores acquired: Pawnshops............................................................... 5 19 9 Cash advance locations ........................................... 1 Purchase price allocated to: Pawn loans .............................................................. $ 607 $ 4,365 $ 3,631 Finance and service charges receivable................... 75 467 383 Cash advances and fees receivable.......................... 38 810 34 Merchandise held for disposition, net ..................... 406 2,885 1,283 Property and equipment .......................................... 47 178 189 Goodwill.................................................................. 1,632 16,668 11,386 Intangible assets ...................................................... 217 1,475 2,170 Other (liabilities) assets, net .................................... (65) 367 (78) Total purchase price, net of cash acquired........... 2,957 27,215 18,998 Final cash settlement for prior year acquisition .......... 850 Purchase price adjustments for prior year acquisition. 852 159 Cash consideration payable......................................... (1,066) (70) Total cash paid for acquisitions ........................... $ 3,809 $ 26,149 $ 19,937
4. Cash Advances, Allowance for Losses and Accruals for Losses on Third-Party Lender-Owned Cash Advances The Company offers cash advance products through its cash advance locations, in most of its pawnshops and over the internet. The cash advance products are generally offered as single payment cash advance loans. These cash advance loans typically have a term of 7 to 45 days and are generally payable on the customer’s next payday. The Company originates cash advances in some of its locations and online. It arranges for customers to obtain cash advances from independent third-party lenders in other locations and online. In a cash advance transaction, a customer executes a promissory note or other repayment agreement typically supported by that customer’s personal check or authorization to debit the customer’s checking account via an ACH transaction. Customers may repay the amount due either with cash, by allowing their check to be presented for collection, or by allowing their checking account to be debited via an ACH transaction.
The Company offers services in connection with single payment cash advances originated by independent third-party lenders, whereby the Company acts as a credit services organization on behalf of consumers in accordance with applicable state laws (the “CSO program”). The CSO program includes arranging loans with independent third-party lenders, assisting in the preparation of loan applications and loan documents, and accepting loan payments. To assist the customer in obtaining a loan through the CSO program, the Company also, as part of the credit services it provides to the customer, guarantees, on behalf of the customer, the customer’s payment obligations to the third-party lender under the loan. A customer who obtains a loan through the CSO program pays the Company a fee for the credit services, including the guaranty, and enters into a contract with the Company governing the credit services arrangement. Losses on cash advances acquired by the Company as a result of its guaranty obligations are the responsibility of the Company. As of December 31, 2007, the CSO program was offered in Texas and Florida. The Company discontinued the CSO program in Michigan in February 2007, and has since offered only cash advances underwritten by the Company to customers in that state. In January of 2008, the Company began offering a CSO program in the state of Maryland through its online platform.
CASH AMERICA INTERNATIONAL, INC. AND SUBSIDIARIES NOTES TO CONSOLIDATED FINANCIAL STATEMENTS (Continued)
71
If the Company collects a customer’s delinquent payment in an amount that is less than the amount the Company paid to the third-party lender pursuant to the guaranty, the Company must absorb the shortfall. If the amount collected exceeds the amount paid under the guaranty, the Company is entitled to the excess and recognizes the excess amount in income. Since the Company may not be successful in collection of these delinquent amounts, the Company’s cash advance loss provision includes amounts estimated to be adequate to absorb credit losses from cash advances in the aggregate cash advance portfolio, including those expected to be acquired by the Company as a result of its guaranty obligations. The estimated amounts of losses on portfolios owned by the third-party lenders are included in “Accounts payable and accrued expenses” in the consolidated balance sheets.
Prior to the program’s discontinuance, for cash advances originated by commercial banks, the banks sold participation interests in the bank-originated cash advances to third parties, and the Company purchased sub-participation interests in certain of those participations. The Company also received an administrative fee for its services. In order to benefit from the use of the Company’s collection resources and proficiency, the banks assigned cash advances unpaid after their payment due date to the Company at a discount from the amount owed by the borrower.
The Company discontinued offering single payment third-party bank-originated cash advances to its
Texas, Florida and North Carolina customers in January 2006, discontinued offering single and multi-payment third-party bank-originated cash advances to its Georgia customers in April 2006, and discontinued offering multi-payment third-party bank-originated cash advances to its California customers in July 2006.
Cash advances outstanding at December 31, 2007 and 2006, were as follows (in thousands):
December 31, 2007 2006 Funded by the Company: Active cash advances and fees receivable .................................................... $ 76,620 $ 69,489 Cash advances and fees in collection ................................................................... 24,099 24,499 Total Funded by the Company ................................................................... 100,719 93,988 Purchased by the Company from third-party lenders............................................... 13,105 5,500 Company-owned cash advances and fees receivable, gross ................................... 113,824 99,488 Less: Allowance for losses ......................................................................................... 25,676 19,513 Cash advances and fees receivable, net ................................................................... $ 88,148 $ 79,975
CASH AMERICA INTERNATIONAL, INC. AND SUBSIDIARIES NOTES TO CONSOLIDATED FINANCIAL STATEMENTS (Continued)
72
Changes in the allowance for losses for the Company-owned portfolio and the accrued loss for third-party lender-owned portfolio for the years ended December 31, 2007, 2006 and 2005 were as follows (in thousands):
2007 2006 2005 Allowance for Company-owned cash advances Balance at beginning of year .................................................... $ 19,513 $ 6,309 $ 4,358 Cash advance loss provision................................................. 154,563 59,284 42,302 Charge-offs........................................................................... (163,350) (56,276) (50,145) Recoveries ............................................................................ 14,950 10,196 9,794 Balance at end of year .............................................................. $ 25,676 $ 19,513 $ 6,309 Accrual for third-party lender-owned cash advances Balance at beginning of year .................................................... $ 1,153 $ 874 $ 342 Increase in loss provision ..................................................... 675 279 532 Balance at end of year .............................................................. $ 1,828 $ 1,153 $ 874
Cash advances assigned to the Company for collection were $93.6 million, $33.8 million and $67.6 million during 2007, 2006 and 2005, respectively. The Company’s participation interest in unrelated third-party lender originated cash advances was $-0- at December 31, 2007 and 2006. As of December 31, 2005, the Company held participation interests of $2.6 million related to programs funded through banks.
5. Property and Equipment Major classifications of property and equipment at December 31, 2007 and 2006 were as follows (in thousands):
2007 2006 Accumulated Accumulated Cost Depreciation Net Cost Depreciation Net Land ............................... $ 4,955 $ — $ 4,955 $ 4,955 $ — $ 4,955 Buildings and leasehold
improvements.............. 150,908 (71,381) 79,527 130,230 (64,520) 65,710 Furniture, fixtures and
equipment.................... 95,667 (59,284) 36,383 79,931 (48,272) 31,659 Computer software......... 62,124 (21,313) 40,811 35,358 (18,421) 16,937 Total .......................... $ 313,654 $ (151,978) $161,676 $250,474 $ (131,213) $119,261
The Company recognized depreciation expense of $27.7 million, $23.7 million and $20.1 million during 2007, 2006 and 2005, respectively. 6. Goodwill and Other Intangible Assets Goodwill and other intangible assets having an indefinite useful life are tested for impairment annually at June 30, or more frequently if events or changes in circumstances indicate that the assets might be impaired, using a two-step impairment assessment. The first step of the goodwill impairment test, used to identify potential impairment, compares the fair value of a reporting unit with its carrying amount, including goodwill. If the fair value of a reporting unit exceeds its carrying amount, goodwill of the reporting unit is considered not impaired, and the second step of the impairment test is not necessary. If the carrying amount of a reporting unit exceeds its fair value, the second step of the goodwill impairment test is performed to measure the amount of impairment loss, if any. The useful lives of other intangible assets must be reassessed and the remaining amortization periods adjusted accordingly. Based on the results of the

CASH AMERICA INTERNATIONAL, INC. AND SUBSIDIARIES NOTES TO CONSOLIDATED FINANCIAL STATEMENTS (Continued)
73
initial and the subsequent annual impairment tests, management determined that there have been no impairments. Goodwill Changes in the carrying value of goodwill for the years ended December 31, 2007 and 2006 were as follows (in thousands):
Pawn Cash Check Lending Advance Cashing Consolidated
Balance as of January 1, 2007, net of amortization of $20,788..................... $ 141,700 $ 91,489 $ 5,310 $ 238,499 Acquisitions ..................................................... 1,632 65,866 67,498 Adjustments ..................................................... 224 224 Balance as of December 31, 2007................ $ 143,556 $ 157,355 $ 5,310 $ 306,221
Balance as of January 1, 2006, net of amortization of $20,788.....................
$ 125,059
$ 44,618 $ 5,310
$ 174,987
Acquisitions ..................................................... 16,668 46,871 63,539 Adjustments ..................................................... (27) (27)
Balance as of December 31, 2006................ $ 141,700 $ 91,489 $ 5,310 $ 238,499 Acquired Intangible Assets Acquired intangible assets that are subject to amortization as of December 31, 2007 and 2006, were as follows (in thousands):
2007 2006 Accumulated Accumulated Cost Depreciation Net Cost Depreciation Net Non-competition agreements . $ 11,155 $ (5,230) $ 5,925 $ 11,065 $ (3,403) $ 7,662 Customer relationships........... 9,798 (7,095) 2,703 9,674 (5,017) 4,657 Lead provider relationships.... 1,939 (501) 1,438 1,877 (125) 1,752 Other ...................................... 456 (122) 334 526 (120) 406 Total .................................. $ 23,348 $ (12,948) $ 10,400 $ 23,142 $ (8,665) $ 14,477 Non-competition agreements are amortized over the applicable terms of the contracts. Customer and lead provider relationships are generally amortized over five to six years based on the pattern of economic benefits provided. At December 31, 2007 and 2006, tradenames of $5.4 million and $5.3 million, respectively, and licenses of $7.7 million obtained in conjunction with acquisitions are not subject to amortization. Amortization Amortization expense for the acquired intangible assets is as follows (in thousands):
Actual amortization expense for the year ended December 31: 2007 ............................................................................................................................. $ 4,396 2006............................................................................................................................. 3,653 2005............................................................................................................................. 3,230 Estimated future amortization expense for the years ended December 31: 2008............................................................................................................................. $ 3,604 2009............................................................................................................................. 2,738 2010............................................................................................................................. 1,012 2011............................................................................................................................. 693 2012............................................................................................................................. 338

CASH AMERICA INTERNATIONAL, INC. AND SUBSIDIARIES NOTES TO CONSOLIDATED FINANCIAL STATEMENTS (Continued)
74
7. Accounts Payable and Accrued Expenses
Accounts payable and accrued expenses at December 31, 2007 and 2006, were as follows (in thousands):
2007 2006 Trade accounts payable ................................................................................... $ 20,754 $ 16,248 Accrued taxes, other than income taxes................................................................. 5,664 3,850 Accrued payroll and fringe benefits ....................................................................... 21,198 21,326 Accrued interest payable......................................................................................... 800 1,456 Purchase consideration payable.............................................................................. 22,704 33,761 Accrual for losses on third-party lender-owned cash advances............................ 1,828 1,153 Acquisition costs payable ....................................................................................... 844 Other accrued liabilities .................................................................................. 14,451 12,579
Total ................................................................................................................... $ 87,399 $ 91,217 8. Long-term Debt The Company’s long-term debt instruments and balances outstanding at December 31, 2007 and 2006, were as follows (in thousands):
2007 2006 Line of credit up to $250.0 million, due 2012 ........................................... $ 171,777 $ 81,677 6.21% senior unsecured notes due 2021 .................................................... 25,000 25,000 6.09% senior unsecured notes due 2016 .................................................... 35,000 35,000 6.12% senior unsecured notes due 2015 .................................................... 40,000 40,000 7.20% senior unsecured notes due 2009 .................................................... 17,000 25,500 7.10% senior unsecured notes due 2008 .................................................... 8,572 8.14% senior unsecured notes due 2007 .................................................... 4,000 Total debt.............................................................................................. 288,777 219,749 Less current portion ................................................................................... 8,500 16,786 Total long-term debt ............................................................................. $ 280,277 $ 202,963
In March 2007, the Company amended its line of credit to extend the final maturity by two years, to
March 2012. The amended credit agreement also contained a provision for the ratable $50.0 million increase in the committed amounts, up to $300.0 million, upon the Company’s request and approval by the lenders. See Note 23.
Interest on the amended line of credit is charged, at the Company’s option, at either LIBOR plus a
margin or at the agent’s base rate. The margin on the line of credit varies from 0.875% to 1.625% (1.125% at December 31, 2007), depending on the Company’s cash flow leverage ratios as defined in the amended agreement. The Company also pays a fee on the unused portion ranging from 0.25% to 0.30% (0.25% at December 31, 2007) based on the Company’s cash flow leverage ratios. The weighted average interest rate (including margin) on the line of credit at December 31, 2007 was 6.2%. On December 27, 2007, the Company entered into an interest rate cap agreement with a notional amount of $10.0 million of the Company’s outstanding floating rate line of credit for a term of 24 months at a fixed rate of 4.75%. See Note 13.

CASH AMERICA INTERNATIONAL, INC. AND SUBSIDIARIES NOTES TO CONSOLIDATED FINANCIAL STATEMENTS (Continued)
75
At December 31, 2007 and 2006, borrowings under the Company’s bank line of credit consisted of three pricing tranches with conclusion dates ranging from 1 to 32 days, respectively. However, pursuant to the bank line of credit agreement which expires in 2012, the Company routinely refinances these borrowings within its long-term facility. Therefore, these borrowings are reported as part of the line of credit and as long-term debt. On December 19, 2006, the Company issued $60.0 million of senior unsecured long-term notes. The notes were comprised of $35.0 million 6.09% senior notes due 2016 payable in five annual payments of $7.0 million beginning December 19, 2012; and $25.0 million 6.21% senior notes due 2021 payable in eleven annual payments of $2.3 million beginning December 19, 2011. Net proceeds received from the issuance of the notes were used to reduce the amount outstanding under the line of credit and for general corporate purposes. In December 2005, the Company issued $40.0 million of 6.12% senior unsecured notes, due in December 2015. The notes are payable in six equal annual payments of approximately $6.7 million beginning December 2010. Net proceeds received from the issuance of the notes were used to reduce the amount outstanding under the Company’s bank line of credit.
The credit agreements governing the line of credit and the senior unsecured notes require the Company to maintain certain financial ratios. The Company is in compliance with all covenants or other requirements set forth in its credit agreements as amended.
As of December 31, 2007, annual maturities of the outstanding long-term debt, including the Company’s line of credit, for each of the five years after December 31, 2007 are as follows (in thousands):
2008 ......................................................................................................................................... $ 8,500 2009 ......................................................................................................................................... 8,500 2010 ......................................................................................................................................... 6,667 2011 ......................................................................................................................................... 8,940 2012 ......................................................................................................................................... 187,716 Thereafter ................................................................................................................................ 68,454 $ 288,777

CASH AMERICA INTERNATIONAL, INC. AND SUBSIDIARIES NOTES TO CONSOLIDATED FINANCIAL STATEMENTS (Continued)
76
9. Income Taxes The components of the Company’s deferred tax assets and liabilities as of December 31, 2007 and 2006, were as follows (in thousands):
2007 2006 Deferred tax assets: Allowance for valuation of merchandise held for disposition.................. $ 472 $ 427 Tax over book accrual of finance and service charges............................. 5,266 5,511
Allowance for cash advance losses.......................................................... 9,691 7,351 Valuation of notes receivable – sale of discontinued operations ............. 947
Deferred compensation ............................................................................ 5,353 4,193 Net capital losses...................................................................................... 20 Deferred state credits ............................................................................... 1,258 137 Other ........................................................................................................ 1,621 1,503 Total deferred tax assets........................................................................ 23,661 20,089 Deferred tax liabilities: Amortization of acquired intangibles ....................................................... $ 15,799 $ 11,524 Property and equipment ........................................................................... 4,488 3,717 Other ........................................................................................................ 1,754 1,294 Total deferred tax liabilities .................................................................. 22,041 16,535 Net deferred tax assets ....................................................................... $ 1,620 $ 3,554 Balance sheet classification: Current deferred tax assets ....................................................................... $ 20,204 $ 16,324 Non-current deferred tax liabilities .......................................................... (18,584) (12,770) Net deferred tax assets................................................................................. $ 1,620 $ 3,554
The components of the provision for income taxes and the income to which it relates for the years ended December 31, 2007, 2006 and 2005 are shown below (in thousands):
2007 2006 2005 Income from continuing operations before income taxes................ $ 124,765 $ 96,168 $ 70,882 Current provision: Federal.......................................................................................... $ 40,141 $ 36,582 $ 26,291 State and local .............................................................................. 3,345 2,284 1,401 43,486 38,866 27,692 Deferred provision (benefit): Federal.......................................................................................... 3,381 (3,203) (1,845) State and local .............................................................................. (1,448) (435) 214 1,933 (3,638) (1,631) Total provision .......................................................................... $ 45,419 $ 35,228 $ 26,061
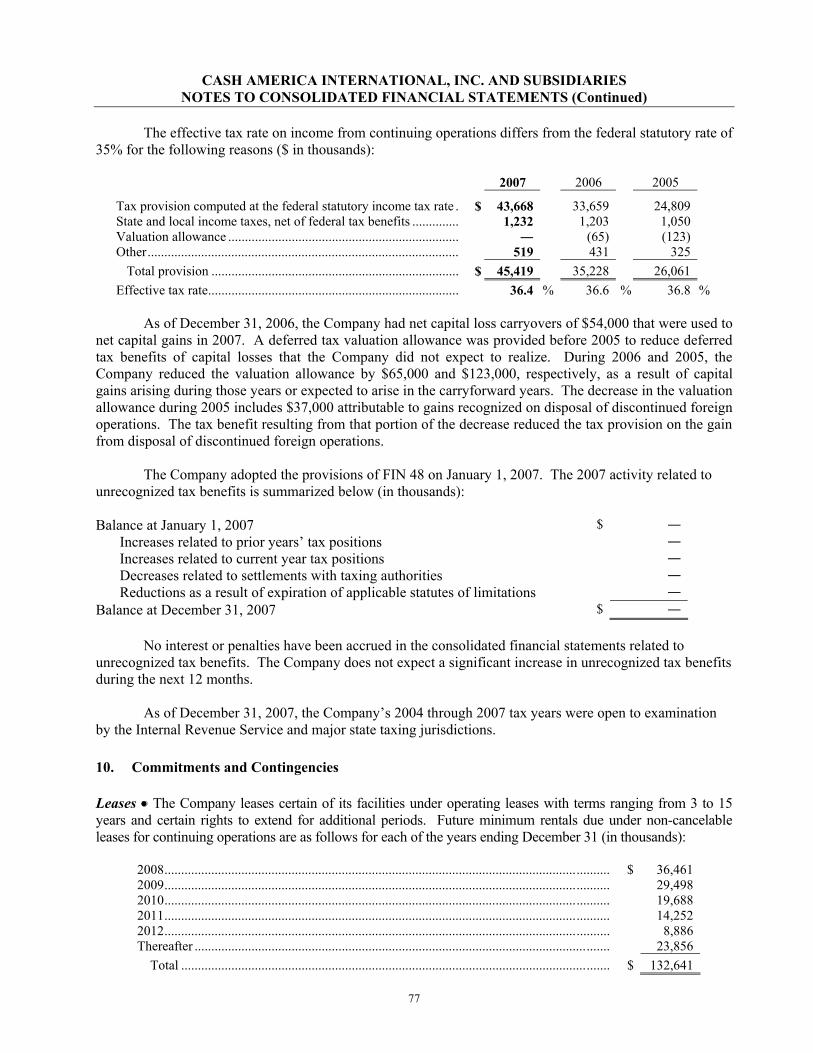
CASH AMERICA INTERNATIONAL, INC. AND SUBSIDIARIES NOTES TO CONSOLIDATED FINANCIAL STATEMENTS (Continued)
77
The effective tax rate on income from continuing operations differs from the federal statutory rate of 35% for the following reasons ($ in thousands):
2007 2006 2005
Tax provision computed at the federal statutory income tax rate . $ 43,668 33,659 24,809 State and local income taxes, net of federal tax benefits .............. 1,232 1,203 1,050 Valuation allowance ..................................................................... (65) (123) Other............................................................................................. 519 431 325 Total provision .......................................................................... $ 45,419 35,228 26,061 Effective tax rate........................................................................... 36.4 % 36.6 % 36.8 %
As of December 31, 2006, the Company had net capital loss carryovers of $54,000 that were used to net capital gains in 2007. A deferred tax valuation allowance was provided before 2005 to reduce deferred tax benefits of capital losses that the Company did not expect to realize. During 2006 and 2005, the Company reduced the valuation allowance by $65,000 and $123,000, respectively, as a result of capital gains arising during those years or expected to arise in the carryforward years. The decrease in the valuation allowance during 2005 includes $37,000 attributable to gains recognized on disposal of discontinued foreign operations. The tax benefit resulting from that portion of the decrease reduced the tax provision on the gain from disposal of discontinued foreign operations.
The Company adopted the provisions of FIN 48 on January 1, 2007. The 2007 activity related to unrecognized tax benefits is summarized below (in thousands):
Balance at January 1, 2007 $ Increases related to prior years’ tax positions Increases related to current year tax positions Decreases related to settlements with taxing authorities Reductions as a result of expiration of applicable statutes of limitations Balance at December 31, 2007 $
No interest or penalties have been accrued in the consolidated financial statements related to
unrecognized tax benefits. The Company does not expect a significant increase in unrecognized tax benefits during the next 12 months.
As of December 31, 2007, the Company’s 2004 through 2007 tax years were open to examination
by the Internal Revenue Service and major state taxing jurisdictions. 10. Commitments and Contingencies Leases The Company leases certain of its facilities under operating leases with terms ranging from 3 to 15 years and certain rights to extend for additional periods. Future minimum rentals due under non-cancelable leases for continuing operations are as follows for each of the years ending December 31 (in thousands):
2008..................................................................................................................................... $ 36,461 2009..................................................................................................................................... 29,498 2010..................................................................................................................................... 19,688 2011..................................................................................................................................... 14,252 2012..................................................................................................................................... 8,886 Thereafter ............................................................................................................................ 23,856 Total ................................................................................................................................ $ 132,641

CASH AMERICA INTERNATIONAL, INC. AND SUBSIDIARIES NOTES TO CONSOLIDATED FINANCIAL STATEMENTS (Continued)
78
Rent expense for continuing operations was $37.1 million, $34.0 million and $32.6 million for 2007, 2006 and 2005, respectively. Earn-Out Payments The Company has agreed to pay up to five supplemental earn-out payments during the two-year period after the closing of the acquisition of CashNetUSA. See Note 3 for further discussion. Guarantees The Company guarantees borrowers’ payment obligations to unrelated third-party lenders. At December 31, 2007, the amount of cash advances guaranteed by the Company was $34.6 million representing amounts due under cash advances originated by third-party lenders under the CSO program. The fair value of the liability related to these guarantees of $1.8 million was included in “Accounts payable and accrued expenses” in the accompanying financial statements.
The Company guarantees obligations under certain operating leases for the premises related to 3 stores sold in June 2002 from a discontinued operating segment. In the event the buyer is unable to perform under the operating leases, the Company’s maximum aggregate potential obligation under these guarantees was approximately $402,000 at December 31, 2007. This amount is reduced dollar-for-dollar by future amounts paid on these operating leases by the buyer. If the buyer fails to perform and the Company must make payments under these leases, the Company will seek to mitigate its losses by subleasing the properties or buying out of the leases.
Litigation On August 6, 2004, James E. Strong filed a purported class action lawsuit in the State Court of Cobb County, Georgia against Georgia Cash America, Inc., Cash America International, Inc. (together with Georgia Cash America, Inc., “Cash America”), Daniel R. Feehan, and several unnamed officers, directors, owners and “stakeholders” of Cash America. The lawsuit alleges many different causes of action, among the most significant of which is that Cash America made illegal payday loans in Georgia in violation of Georgia’s usury law, the Georgia Industrial Loan Act and Georgia’s Racketeer Influenced and Corrupt Organizations Act. Community State Bank (“CSB”) for some time made loans to Georgia residents through Cash America’s Georgia operating locations. The complaint in this lawsuit claims that Cash America was the true lender with respect to the loans made to Georgia borrowers and that CSB’s involvement in the process is “a mere subterfuge.” Based on this claim, the suit alleges that Cash America is the “de facto” lender and is illegally operating in Georgia. The complaint seeks unspecified compensatory damages, attorney’s fees, punitive damages and the trebling of any compensatory damages. A previous decision by the trial judge to strike Cash America’s affirmative defenses based on arbitration (without ruling on Cash America’s previously filed motion to compel arbitration) was upheld by the Georgia Court of Appeals, and on September 24, 2007, the Georgia Supreme Court declined to review the decision. The case has been returned to the State Court of Cobb County, Georgia, where Cash America filed a motion requesting that the trial court rule on Cash America’s pending motion to compel arbitration and stay the State Court proceedings. The Court denied the motion to stay and ruled that the motion to compel arbitration was rendered moot after the discovery sanction was handed down by the Court. Cash America is currently in the process of appealing these latest orders from the Court. If Cash America’s further attempts to enforce the arbitration agreement are unsuccessful, discovery relating to the propriety of continuing this suit as a class action would proceed. Cash America believes that the plaintiffs’ claims in this suit are without merit and is vigorously defending this lawsuit.
Cash America and CSB also commenced a federal lawsuit in the U.S. District Court for the Northern District of Georgia seeking to compel Plaintiffs to arbitrate their claims against Cash America and CSB. The U.S. District Court dismissed the federal action for lack of subject matter jurisdiction, and Cash America and CSB appealed the dismissal of their complaint to the U.S Court of Appeals for the 11th Circuit. The 11th Circuit issued a panel decision on April 27, 2007 reversing the district court’s dismissal of
CASH AMERICA INTERNATIONAL, INC. AND SUBSIDIARIES NOTES TO CONSOLIDATED FINANCIAL STATEMENTS (Continued)
79
the action and remanding the action to the district court for a determination of the issue of the enforceability of the parties’ arbitration agreements. Plaintiff requested the 11th Circuit to review this decision en banc and this request has been granted. The en banc rehearing took place on February 26, 2008. The Strong litigation is still at an early stage, and neither the likelihood of an unfavorable outcome nor the ultimate liability, if any, with respect to this litigation can be determined at this time.
On October 23, 2007, a complaint, styled Ryan Bonner, individually and on behalf of all others similarly situated, v. Cash America International, Inc., Cash America Net of Nevada, LLC, Cash America Net of Pennsylvania, LLC and Cash America of PA, LLC, d/b/a CashNetUSA.com (collectively, “CashNetUSA”), was filed in the United States District Court for the Eastern District of Pennsylvania, alleging, on behalf of a purported class, that the defendants located outside Pennsylvania had engaged in unfair or deceptive acts or practices by making loans to Pennsylvania consumers in violation of Pennsylvania law, including its usury, fair credit extension, and unfair trade practices and consumer protection laws. The complaint also alleges that the arbitration, class action waiver and dispute resolution provisions contained in the loan documents involved in these loans are unenforceable. The complaint seeks a declaratory judgment that the lending business conducted by CashNetUSA is illegal under Pennsylvania law and a declaration that loan agreements with Pennsylvania residents are void and unenforceable, an injunction barring continuing alleged violations (including enjoining collection on loans currently outstanding from Pennsylvania residents) and an award of monetary damages (including treble damages), penalties, costs and attorneys’ fees. CashNetUSA believes that the plaintiff’s claims in this suit are without merit and plans to vigorously defend against all of the asserted allegations. CashNetUSA has filed a Motion to Compel Arbitration seeking to compel individual arbitration of the plaintiff’s claims and is presently awaiting plaintiff’s response to this motion.
The Company is a defendant in certain lawsuits encountered in the ordinary course of its business. Certain of these matters are covered to an extent by insurance. In the opinion of management, the resolution of these matters will not have a material adverse effect on the Company’s financial position, results of operations or liquidity.
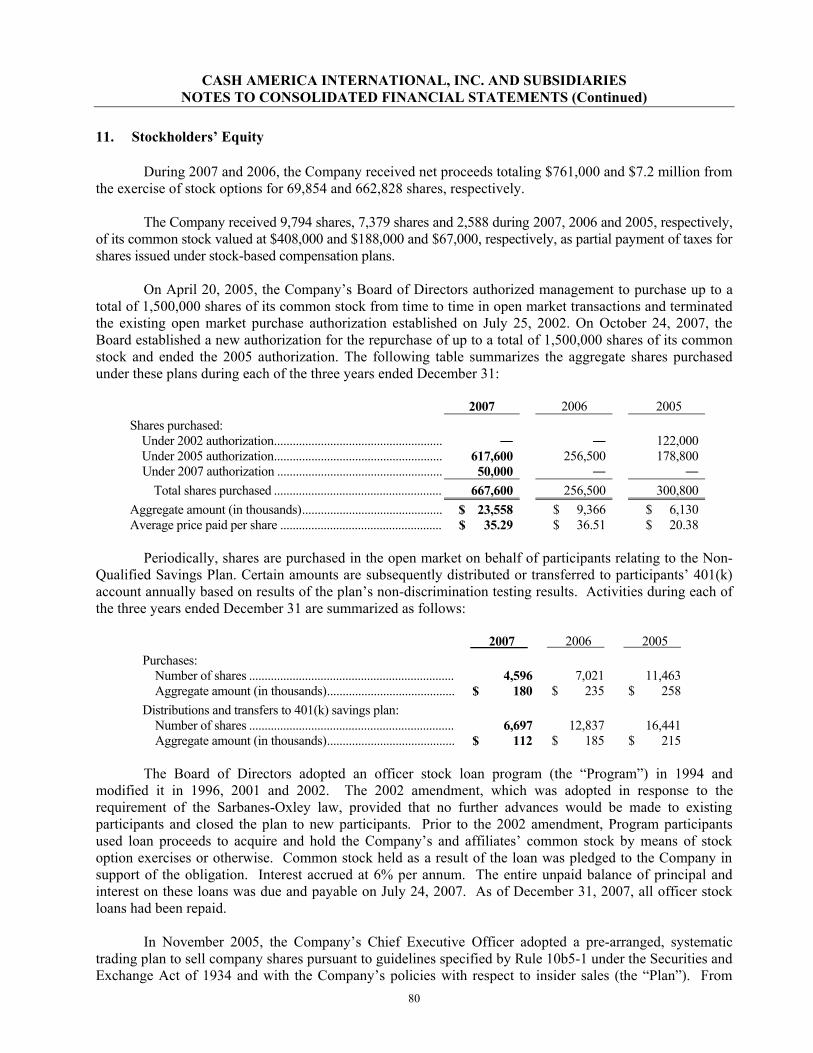
CASH AMERICA INTERNATIONAL, INC. AND SUBSIDIARIES NOTES TO CONSOLIDATED FINANCIAL STATEMENTS (Continued)
80
11. Stockholders’ Equity During 2007 and 2006, the Company received net proceeds totaling $761,000 and $7.2 million from the exercise of stock options for 69,854 and 662,828 shares, respectively. The Company received 9,794 shares, 7,379 shares and 2,588 during 2007, 2006 and 2005, respectively, of its common stock valued at $408,000 and $188,000 and $67,000, respectively, as partial payment of taxes for shares issued under stock-based compensation plans. On April 20, 2005, the Company’s Board of Directors authorized management to purchase up to a total of 1,500,000 shares of its common stock from time to time in open market transactions and terminated the existing open market purchase authorization established on July 25, 2002. On October 24, 2007, the Board established a new authorization for the repurchase of up to a total of 1,500,000 shares of its common stock and ended the 2005 authorization. The following table summarizes the aggregate shares purchased under these plans during each of the three years ended December 31:
2007 2006 2005 Shares purchased: Under 2002 authorization...................................................... 122,000 Under 2005 authorization...................................................... 617,600 256,500 178,800 Under 2007 authorization ..................................................... 50,000 Total shares purchased ...................................................... 667,600 256,500 300,800 Aggregate amount (in thousands)............................................. $ 23,558 $ 9,366 $ 6,130 Average price paid per share .................................................... $ 35.29 $ 36.51 $ 20.38
Periodically, shares are purchased in the open market on behalf of participants relating to the Non-Qualified Savings Plan. Certain amounts are subsequently distributed or transferred to participants’ 401(k) account annually based on results of the plan’s non-discrimination testing results. Activities during each of the three years ended December 31 are summarized as follows:
2007 2006 2005 Purchases: Number of shares .................................................................. 4,596 7,021 11,463 Aggregate amount (in thousands)......................................... $ 180 $ 235 $ 258 Distributions and transfers to 401(k) savings plan: Number of shares .................................................................. 6,697 12,837 16,441 Aggregate amount (in thousands)......................................... $ 112 $ 185 $ 215
The Board of Directors adopted an officer stock loan program (the “Program”) in 1994 and modified it in 1996, 2001 and 2002. The 2002 amendment, which was adopted in response to the requirement of the Sarbanes-Oxley law, provided that no further advances would be made to existing participants and closed the plan to new participants. Prior to the 2002 amendment, Program participants used loan proceeds to acquire and hold the Company’s and affiliates’ common stock by means of stock option exercises or otherwise. Common stock held as a result of the loan was pledged to the Company in support of the obligation. Interest accrued at 6% per annum. The entire unpaid balance of principal and interest on these loans was due and payable on July 24, 2007. As of December 31, 2007, all officer stock loans had been repaid.
In November 2005, the Company’s Chief Executive Officer adopted a pre-arranged, systematic trading plan to sell company shares pursuant to guidelines specified by Rule 10b5-1 under the Securities and Exchange Act of 1934 and with the Company’s policies with respect to insider sales (the “Plan”). From

CASH AMERICA INTERNATIONAL, INC. AND SUBSIDIARIES NOTES TO CONSOLIDATED FINANCIAL STATEMENTS (Continued)
81
November 2005 through June 2006, the Company’s Chief Executive Officer exercised stock options and sold Company shares under the Plan. The Chief Executive Officer used proceeds from the sale of shares under the Plan to fully repay his pre-2003 secured loan under the Company’s now discontinued officer stock loan program and accrued interest thereon totaling $2.1 million. In 2006, the Company’s Chief Financial Officer and another executive officer also paid a total of $985,000 (including accrued interest) to fully repay similar officer stock loans.
12. Employee Benefit Plans The Cash America International, Inc. 401(k) Savings Plan is open to substantially all employees. Beginning January 1, 2006, new employees are automatically enrolled in this plan unless they elect not to participate. The Cash America International, Inc. Nonqualified Savings Plan is available to certain members of management. Participants may contribute up to 50% of their earnings to these plans subject to regulatory restrictions. The Company makes matching cash contributions of 50% of each participant’s contributions, based on participant contributions of up to 5% of compensation. Company contributions vest at the rate of 20% each year after one year of service; thus a participant is 100% vested after five years of service. The Company’s total contributions to the 401(k) Savings Plan and the Nonqualified Savings Plan were $2.3 million, $1.6 million and $1.1 million in 2007, 2006 and 2005, respectively. In addition to the plans mentioned above, the Company established a Supplemental Executive Retirement Plan (“SERP”) for its officers in 2003. Under this defined contribution plan, the Company makes an annual discretionary cash contribution to the SERP based on the objectives of the plan as approved by the Management Development and Compensation Committee of the Board of Directors. The Company recorded compensation expense of $730,000, $561,000 and $510,000 for contributions to the SERP during 2007, 2006 and 2005, respectively. Amounts included in the consolidated balance sheets relating to the Nonqualified Savings Plan and the SERP were as follows (in thousands):
As of December 31, 2007 2006 Other receivables and prepaid expenses...................................................... $ 7,994 $ 7,211 Accounts payable and accrued expenses ..................................................... 8,725 7,764 Other liabilities............................................................................................ 972 913 Treasury shares............................................................................................ 1,017 950
13. Derivative Instruments and Hedging Activities
In 2007, the Company entered into foreign currency contracts totaling 1.0 million British pounds (approximately $2.0 million at maturity), to minimize the effect of market fluctuations. Under the contracts, the Company will receive fixed total payments of $2.0 million and will pay the counter parties a total of 1.0 million British pounds upon maturity (January 28, 2008) unless the contracts are effectively extended through the establishment of a new contract maturing in the future. Any gain and loss related to this forward contract will be netted in the foreign currency transaction gain (loss) in the consolidated statements of income.
On December 27, 2007, the Company entered into an interest rate cap agreement with a notional
amount of $10.0 million of the Company’s outstanding floating rate line of credit for a term of 24 months at a fixed rate of 4.75%. This interest rate cap agreement has been determined to be a perfectly effective cash flow hedge. For derivatives designated as cash flow hedges, the effective portions of changes in fair value of the derivative are reported in other comprehensive income and are subsequently reclassified into earnings
CASH AMERICA INTERNATIONAL, INC. AND SUBSIDIARIES NOTES TO CONSOLIDATED FINANCIAL STATEMENTS (Continued)
82
when the hedged item affects earnings. The change in the fair value of the ineffective portion of the hedge, if any, will be recorded as income or expense. The fair value of the interest rate cap agreement is included in “Other receivables and prepaid expenses” of the accompanying consolidated balance sheet.
14. Stock Purchase Rights In August 1997, the Board of Directors declared a dividend distribution of one Common Stock Purchase Right (the “Rights”) for each outstanding share of its common stock. The Rights were to become exercisable in the event a person or group acquired 15% or more of the Company’s common stock or announced a tender offer, the consummation of which would result in ownership by a person or group of 15% or more of the common stock. If any person were to become a 15% or more shareholder of the Company, each Right (subject to certain limits) would have entitled its holder (other than such person or members of such group) to purchase, for $37.00, the number of shares of the Company’s common stock determined by dividing $74.00 by the then current market price of the common stock. The Rights expired on August 5, 2007. 15. Stock-Based Compensation Under the equity compensation plans (the “Plans”) it sponsors, the Company is authorized to issue 9,150,000 shares of Common Stock pursuant to “Awards” granted as incentive stock options (intended to qualify under Section 422 of the Internal Revenue Code of 1986, as amended), nonqualified stock options and restricted stock units. At December 31, 2007, 1,197,904 shares were reserved for future grants under these equity compensation plans. Historically, the Company has purchased its shares on the open market from time to time and reissued those shares upon stock option exercises and stock unit conversions under its stock-based compensation plans. During 2007, 667,600 shares were purchased on the open market with an average purchase price of $35.29 per share. Stock Options While no stock options have been granted since April 2003, stock options currently outstanding under the Plans had original contractual terms of up to 10 years with an exercise price equal to or greater than the fair market value of the stock at grant date. On their respective grant dates, these stock options had vesting periods ranging from 1 to 7 years. However, the terms of options with the 7-year vesting periods and certain of the 4-year and 5-year vesting periods included provisions that accelerated vesting if specified share price appreciation criteria were met. During 2006, all of the previously unvested outstanding stock options, representing 22,500 shares, were accelerated. The Company recognized total compensation expense of $378,000 ($246,000 net of related income tax benefit) for 2006, including a cost of $199,000 ($130,000 net of related income tax benefit) for the effect of the accelerated vesting. At December 31, 2007, there was no remaining unrecognized stock option expense.
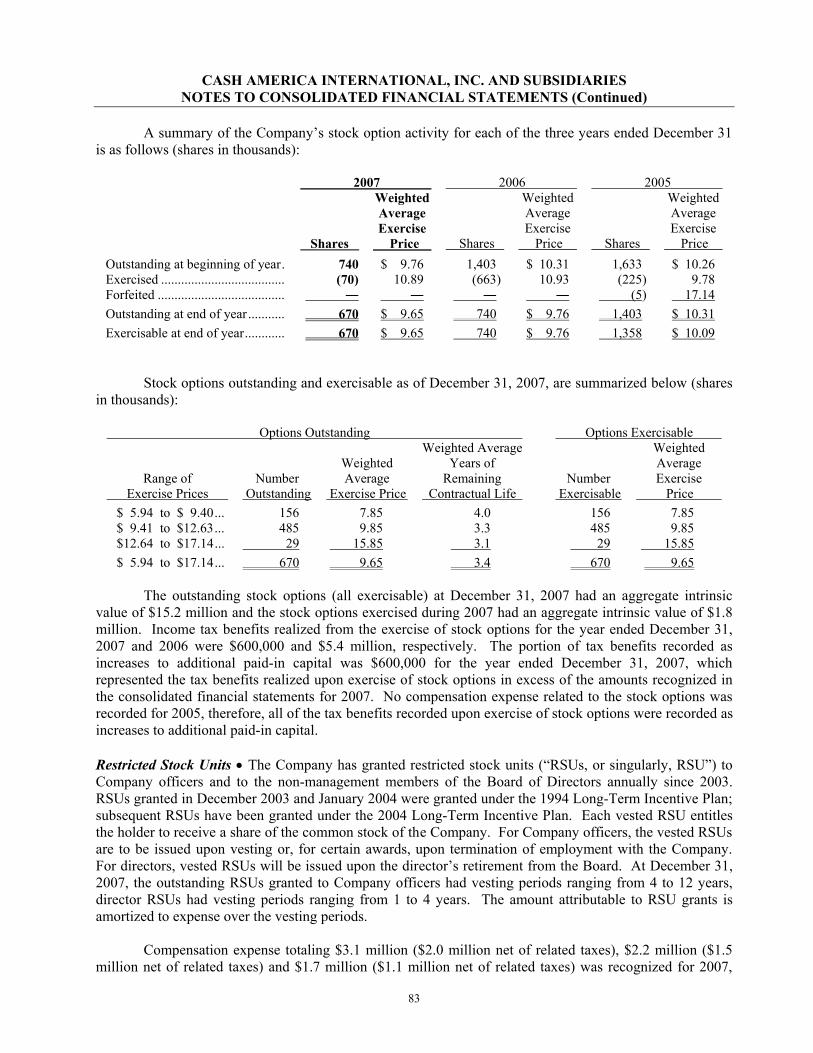
CASH AMERICA INTERNATIONAL, INC. AND SUBSIDIARIES NOTES TO CONSOLIDATED FINANCIAL STATEMENTS (Continued)
83
A summary of the Company’s stock option activity for each of the three years ended December 31 is as follows (shares in thousands):
2007 2006 2005 Weighted Weighted Weighted Average Average Average Exercise Exercise Exercise Shares Price Shares Price Shares Price Outstanding at beginning of year. 740 $ 9.76 1,403 $ 10.31 1,633 $ 10.26 Exercised ..................................... (70) 10.89 (663) 10.93 (225) 9.78 Forfeited ...................................... (5) 17.14 Outstanding at end of year........... 670 $ 9.65 740 $ 9.76 1,403 $ 10.31 Exercisable at end of year............ 670 $ 9.65 740 $ 9.76 1,358 $ 10.09
Stock options outstanding and exercisable as of December 31, 2007, are summarized below (shares in thousands):
Options Outstanding Options Exercisable Weighted Average Weighted Weighted Years of Average
Range of Number Average Remaining Number Exercise Exercise Prices Outstanding Exercise Price Contractual Life Exercisable Price $ 5.94 to $ 9.40... 156 7.85 4.0 156 7.85 $ 9.41 to $12.63... 485 9.85 3.3 485 9.85 $12.64 to $17.14... 29 15.85 3.1 29 15.85 $ 5.94 to $17.14... 670 9.65 3.4 670 9.65
The outstanding stock options (all exercisable) at December 31, 2007 had an aggregate intrinsic value of $15.2 million and the stock options exercised during 2007 had an aggregate intrinsic value of $1.8 million. Income tax benefits realized from the exercise of stock options for the year ended December 31, 2007 and 2006 were $600,000 and $5.4 million, respectively. The portion of tax benefits recorded as increases to additional paid-in capital was $600,000 for the year ended December 31, 2007, which represented the tax benefits realized upon exercise of stock options in excess of the amounts recognized in the consolidated financial statements for 2007. No compensation expense related to the stock options was recorded for 2005, therefore, all of the tax benefits recorded upon exercise of stock options were recorded as increases to additional paid-in capital.
Restricted Stock Units The Company has granted restricted stock units (“RSUs, or singularly, RSU”) to Company officers and to the non-management members of the Board of Directors annually since 2003. RSUs granted in December 2003 and January 2004 were granted under the 1994 Long-Term Incentive Plan; subsequent RSUs have been granted under the 2004 Long-Term Incentive Plan. Each vested RSU entitles the holder to receive a share of the common stock of the Company. For Company officers, the vested RSUs are to be issued upon vesting or, for certain awards, upon termination of employment with the Company. For directors, vested RSUs will be issued upon the director’s retirement from the Board. At December 31, 2007, the outstanding RSUs granted to Company officers had vesting periods ranging from 4 to 12 years, director RSUs had vesting periods ranging from 1 to 4 years. The amount attributable to RSU grants is amortized to expense over the vesting periods. Compensation expense totaling $3.1 million ($2.0 million net of related taxes), $2.2 million ($1.5 million net of related taxes) and $1.7 million ($1.1 million net of related taxes) was recognized for 2007,

CASH AMERICA INTERNATIONAL, INC. AND SUBSIDIARIES NOTES TO CONSOLIDATED FINANCIAL STATEMENTS (Continued)
84
2006 and 2005, respectively, for all of the above restricted stock units granted. Total unrecognized compensation cost related to restricted units at December 31, 2007 was $6.5 million which will be recognized over a weighted average period of approximately 4.0 years. The following table summarizes the restricted stock unit activity during 2007, 2006 and 2005:
2007 2006 2005 Weighted Weighted Weighted Average Average Average Fair Value Fair Value Fair Value at Date of at Date of at Date of Units Grant Units Grant Units Grant Outstanding at beginning of year. 471,029 $ 21.83 395,591 $ 21.30 342,798 $ 20.31 Units granted ............................... 87,739 43.01 106,248 24.87 100,061 24.99 Shares issued ............................... (35,076) 24.47 (28,742) 25.57 (12,115) 22.46 Units forfeited.............................. (6,395) 24.94 (2,068) 25.18 (35,153) 21.75 Outstanding at end of year........... 517,297 $ 25.21 471,029 $ 21.83 395,591 $ 21.30 Units vested at end of year........... 163,807 $ 19.71 127,267 $ 19.56 74,901 $ 20.12
The outstanding RSUs had an aggregate intrinsic value of $19.5 million and the outstanding vested RSUs had an aggregate intrinsic value of $6.2 million at December 31, 2007. Income tax benefits realized from the issuance of common stock for the vested RSUs for the year ended December 31, 2007, 2006 and 2005 were $512,000, $259,000 and $111,000, respectively. The portions of these benefits recorded as increases to additional paid-in capital were $211,000, $2,000 and $15,000 for the year ended December 31, 2007, 2006 and 2005, respectively. The income tax benefits recorded as increases to additional paid-in capital represent the tax benefits realized upon issuance of common stock in excess of the amounts previously recognized in the consolidated financial statements. 16. Supplemental Disclosures of Cash Flow Information The following table sets forth certain cash and non-cash activities for the years ended December 31 (in thousands):
2007 2006 2005 Cash paid during the year for – Interest .............................................................................................. $ 17,367 $ 12,311 $ 11,153 Income taxes..................................................................................... 41,567 32,355 27,464 Non-cash investing and financing activities – Pawn loans forfeited and transferred to merchandise held for
disposition ................................................................................... $ 206,798 $ 177,188 $ 156,766 Pawn loans renewed ......................................................................... 79,751 78,942 77,878 Cash advances renewed.................................................................... 300,826 89,427 14,336 Liabilities assumed in acquisitions ................................................... 64 536 172
17. Operating Segment Information
The Company has three reportable operating segments: pawn lending, cash advance and check cashing. The cash advance and check cashing segments are managed separately due to the different operational strategies required and, therefore, are reported as separate segments. Check cashing fees, royalties and other income at pawn lending locations, which were previously included in either proceeds from disposition of merchandise or netted into administration expenses, are reclassified out of those line
CASH AMERICA INTERNATIONAL, INC. AND SUBSIDIARIES NOTES TO CONSOLIDATED FINANCIAL STATEMENTS (Continued)
85
items. All prior periods in the tables below have been revised to reflect this change. These revisions have not changed the consolidated performance of the Company for any period.
Information concerning the operating segments is set forth below (in thousands):
Pawn Cash Check Year Ended December 31, 2007: Lending Advance(2) Cashing Consolidated Revenue Finance and service charges ........................... $ 160,960 $ $ $ 160,960 Proceeds from disposition of merchandise ..... 396,821 396,821 Cash advance fees........................................... 42,018 313,178 355,196 Check cashing fees, royalties and other .......... 3,268 9,530 3,619 16,417 Total revenue...................................................... 603,067 322,708 3,619 929,394 Cost of revenue – disposed merchandise............ 246,792 246,792 Net revenue ........................................................ 356,275 322,708 3,619 682,602 Expenses Operations....................................................... 193,950 109,260 1,270 304,480 Cash advance loss provision ........................... 14,985 140,253 155,238 Administration ................................................ 31,564 24,727 959 57,250 Depreciation and amortization........................ 20,750 10,988 387 32,125 Total expenses .................................................... 261,249 285,228 2,616 549,093 Income from operations...................................... $ 95,026 $ 37,480 $ 1,003 $ 133,509 Expenditures for property and equipment(1) ....... $ 52,559 $ 17,389 $ 149 $ 70,097 As of December 31, 2007: Total assets ......................................................... $ 593,514 $ 304,170 $ 6,960 $ 904,644 Goodwill............................................................. $ 143,556 $ 157,355 $ 5,310 $ 306,221 Year Ended December 31, 2006: Revenue Finance and service charges ........................... $ 149,472 $ — $ — $ 149,472 Proceeds from disposition of merchandise ..... 334,036 — — 334,036 Cash advance fees........................................... 43,676 151,429 — 195,105 Check cashing fees, royalties and other .......... 2,816 9,160 3,925 15,901 Total revenue...................................................... 530,000 160,589 3,925 694,514 Cost of revenue – disposed merchandise............ 204,929 — — 204,929 Net revenue ........................................................ 325,071 160,589 3,925 489,585 Expenses Operations....................................................... 179,965 66,438 1,304 247,707 Cash advance loss provision ........................... 15,377 44,186 — 59,563 Administration ................................................ 27,998 21,494 1,492 50,984 Depreciation and amortization........................ 18,579 8,357 376 27,312 Total expenses .................................................... 241,919 140,475 3,172 385,566 Income from operations...................................... $ 83,152 $ 20,114 $ 753 $ 104,019 Expenditures for property and equipment(1) ....... $ 37,645 $ 8,274 $ 436 $ 46,355 As of December 31, 2006: Total assets ......................................................... $ 545,593 $ 223,131 $ 7,520 $ 776,244 Goodwill............................................................. $ 141,700 $ 91,489 $ 5,310 $ 238,499
CASH AMERICA INTERNATIONAL, INC. AND SUBSIDIARIES NOTES TO CONSOLIDATED FINANCIAL STATEMENTS (Continued)
86
Pawn Cash Check Year Ended December 31, 2005: Lending Advance(2) Cashing Consolidated Revenue Finance and service charges............................ $ 139,772 $ — $ — $ 139,772 Proceeds from disposition of merchandise...... 300,192 — — 300,192 Cash advance fees ........................................... 41,405 100,663 — 142,068 Check cashing fees, royalties and other .......... 2,727 7,185 3,819 13,731 Total revenue ...................................................... 484,096 107,848 3,819 595,763 Cost of revenue – disposed merchandise ............ 183,799 — — 183,799 Net revenue......................................................... 300,297 107,848 3,819 411,964 Expenses Operations ....................................................... 168,911 51,706 1,379 221,996 Cash advance loss provision ........................... 15,663 27,171 — 42,834 Administration ................................................ 25,529 16,325 1,151 43,005 Depreciation and amortization ........................ 15,786 7,299 332 23,417 Total expenses .................................................... 225,889 102,501 2,862 331,252 Income from operations...................................... $ 74,408 $ 5,347 $ 957 $ 80,712 Expenditures for property and equipment .......... $ 19,961 $ 7,086 $ 208 $ 27,255 As of December 31, 2005: Total assets ......................................................... $ 475,526 $ 115,777 $ 7,344 $ 598,647 Goodwill ............................................................. $ 125,059 $ 44,618 $ 5,310 $ 174,987
______________________ (1) Included in “Expenditures for property and equipment” for the Pawn Lending segment for the years
ended December 31, 2007 and 2006 are substantially all of the capital expenditures for the development of the new proprietary point of sale system software and other general corporate investment expenditures.
(2) The Cash Advance segment is comprised of two distribution channels for the same product: a multi-unit, “storefront” platform of 304 units and an online, internet based lending platform. The amounts for the year ended December 31, 2006 include activity from September 15, 2006 through December 31, 2006 for the internet based lending platform, which was purchased on September 15, 2006. The following table summarizes the results from each channel’s contributions to the Cash Advance segment for the years ended December 31, 2007 and 2006:
Internet Total Cash Year Ended December 31, 2007: Storefront Lending Advance Revenue Cash advance fees ........................................... $ 128,454 $ 184,724 $ 313,178 Check cashing fees, royalties and other........... 9,525 5 9,530 Total revenue ...................................................... 137,979 184,729 322,708
Expenses Operations ....................................................... 68,249 41,011 109,260 Cash advance loss provision............................ 37,383 102,870 140,253 Administration................................................. 10,797 13,930 24,727 Depreciation and amortization ........................ 7,980 3,008 10,988 Total expenses..................................................... 124,409 160,819 285,228 Income from operations ...................................... $ 13,570 $ 23,910 $ 37,480

CASH AMERICA INTERNATIONAL, INC. AND SUBSIDIARIES NOTES TO CONSOLIDATED FINANCIAL STATEMENTS (Continued)
87
As of December 31, 2007: Total assets.......................................................... $ 123,760 $ 180,410 $304,170 Goodwill ............................................................. $ 44,618 $ 112,737 $157,355
Internet Total Cash Year Ended December 31, 2006: Storefront Lending Advance Revenue Cash advance fees........................................... $ 120,946 $ 30,483 $ 151,429 Check cashing fees, royalties and other .......... 9,160 — 9,160 Total revenue...................................................... 130,106 30,483 160,589
Expenses Operations....................................................... 58,632 7,806 66,438 Cash advance loss provision ........................... 29,369 14,817 44,186 Administration ................................................ 19,512 1,982 21,494 Depreciation and amortization ........................ 7,698 659 8,357 Total expenses .................................................... 115,211 25,264 140,475 Income from operations...................................... $ 14,895 $ 5,219 $ 20,114 As of December 31, 2006: Total assets ......................................................... $ 130,361 $ 92,770 $ 223,131 Goodwill............................................................. $ 44,618 $ 46,871 $ 91,489
18. Pro Forma Financial Information
The following unaudited pro forma financial information reflects the consolidated results of operations of the Company as if the acquisition of CashNetUSA had occurred on January 1, 2005. The unaudited pro forma financial information has been prepared for informational purposes only and does not purport to be indicative of what would have resulted had the acquisition transaction occurred on the date indicated or what may result in the future ($ in thousands, except per share data):
Year Ended Year Ended December 31, 2006 December 31, 2005
As Reported As Reported (a) As Reported As Reported (a) Total revenue ...................................................... $ 694,514 $ 732,094 $ 595,763 $ 604,923 Net revenue......................................................... 489,585 527,165 411,964 421,124 Total expenses .................................................... 385,566 420,241 331,252 343,511 Income from continuing operations .................... 60,940 61,908 44,821 41,731 Income from continuing operations per share: Basic................................................................ $ 2.05 $ 2.09 $ 1.53 $ 1.43 Diluted............................................................. $ 2.00 $ 2.03 $ 1.48 $ 1.38
(a) Pro forma adjustments reflect: (i) the inclusion of operating results of CashNetUSA for the period January 1, 2006 through September 15, 2006, the date of acquisition, for the 2006 pro forma and the operating results of CashNetUSA for the 12 month period ended December 31, 2005 for the 2005 pro forma; (ii) the adjustments of depreciable asset bases and lives for property and equipment and amortization of intangible assets
acquired by the Company; (iii) the additional interest incurred in the acquisition of CashNetUSA’s operating assets; and (iv) the tax effect of CashNetUSA’s earnings and net pro forma adjustments at the statutory rate of 35%.

CASH AMERICA INTERNATIONAL, INC. AND SUBSIDIARIES NOTES TO CONSOLIDATED FINANCIAL STATEMENTS (Continued)
88
19. Related Party Transactions In October 2005, the Company acquired three pawnshops that were previously franchise units for a total purchase price of $3.1 million from Ace Pawn, Inc. (“Ace”), whose sole stockholder J.D. Credit, Inc. is controlled by the Chairman of the Board of Directors of the Company. The purchase price was determined by independent appraisal and approved by the Board of Directors of the Company. The Company recorded royalties of $48,000 in 2005 before the completion of the acquisition. Under the Company’s now discontinued officer stock loan program, the Company recorded interest income of $1,000, $36,000 and $149,000, respectively, in 2007, 2006 and 2005. At December 31, 2007 and 2006, the outstanding balance on these notes was $-0- and $18,000, and accrued interest on these notes was $-0- and $5,000, respectively. As of December 31, 2007, all of the stock officer loans had been repaid.
In November 2005, the Company’s Chief Executive Officer adopted a pre-arranged, systematic trading plan to sell company shares pursuant to guidelines specified by Rule 10b5-1 under the Securities and Exchange Act of 1934 and with the Company’s policies with respect to insider sales (the “Plan”). From November 2005 through June 2006, the Company’s Chief Executive Officer exercised stock options and sold Company shares under the Plan. The Chief Executive Officer used proceeds from the sales of shares under the Plan to fully repay his pre-2003 secured loan under the Company’s now discontinued officer stock loan program and accrued interest thereon totaling $2.1 million. In 2006, the Company’s Chief Financial Officer and another executive officer also paid a total of $985,000 (including accrued interest) to fully repay similar officer stock loans.
20. Fair Values of Financial Instruments The carrying amounts and estimated fair values of financial instruments at December 31, 2007 and 2006 were as follows (in thousands):
2007 2006 Carrying Estimated Carrying Estimated Value Fair Value Value Fair Value Financial assets: Cash and cash equivalents ................................... $ 22,725 $ 22,725 $ 25,723 $ 25,723 Pawn loans........................................................... 137,319 137,319 127,384 127,384 Cash advances, net............................................... 88,148 88,148 79,975 79,975 Subordinated notes receivable ............................. 9,760 9,889 Interest rate cap ................................................... 25 7 85 85 Foreign currency forward contracts..................... (2) (2) Financial liabilities: Bank line of credit ............................................... $ 171,777 $ 171,777 $ 81,677 $ 81,677 Senior unsecured notes ........................................ 117,000 120,029 138,072 137,158
Cash and cash equivalents bear interest at market rates and have maturities of less than 90 days. Pawn loans have relatively short maturity periods depending on local regulations, generally 90 days or less. Cash advance loans generally have a loan term of 7 to 45 days. Finance and service charge rates are determined by regulations and bear no valuation relationship to the capital markets’ interest rate movements. Generally, pawn loans may only be resold to a licensed pawnbroker.
The fair value of the subordinated notes receivables was estimated by taking the present value of the expected cash flow over the life of the notes discounted at a rate prevalent to financial instruments with similar credit profiles and like terms.
CASH AMERICA INTERNATIONAL, INC. AND SUBSIDIARIES NOTES TO CONSOLIDATED FINANCIAL STATEMENTS (Continued)
89
The Company’s bank credit facility bears interest at a rate that is frequently adjusted on the basis of market rate changes. The fair values of the remaining long-term debt instruments are estimated based on market values for debt issues with similar characteristics or rates currently available for debt with similar terms. 21. Gain on Sale of Foreign Notes
In August 2007, the Company received gross proceeds in the amount of $16.8 million on the sale of notes receivable that it had received in 2004 as part of the proceeds from its sale of Svensk Pantbelåning, its former Swedish pawn lending subsidiary. In September 2004, the Company sold Svensk Pantbelåning to Rutland Partners LLP for cash and two subordinated notes receivable. One of the notes receivable was convertible into approximately 27.7% of the parent company of Svensk Pantbelåning on a fully-diluted basis. In August 2007, Rutland Partners LLP sold Svensk Pantbelåning to a third-party who also purchased the notes receivable from the Company. The Company’s total proceeds of $16.8 million represent $12.4 million in the repayment of the face value of the principal, including $0.3 million of accrued interest owed on notes receivable and $4.4 million for the value of its conversion rights under the convertible note. For the year ended December 31, 2007, the Company recognized a pre-tax gain of approximately $6.3 million from the sale of the notes and related rights. 22. Quarterly Financial Data (Unaudited) The Company’s operations are subject to seasonal fluctuations. Net income tends to be highest during the first and fourth calendar quarters, when the average amount of pawn loans and cash advance balances are typically the highest and merchandise disposition activities are typically heavier compared to the other two quarters. The following is a summary of the quarterly results of operations for the years ended December 31, 2007 and 2006 (in thousands, except per share data):
First Second Third Fourth
Quarter(1) Quarter Quarter Quarter
2007 Total revenue ......................................................... $ 222,872 $ 213,881 $ 231,512 $ 261,129 Cost of revenue ...................................................... 61,925 52,784 57,693 74,390 Net revenue............................................................. 160,947 161,097 173,819 186,739 Net income (2) .......................................................... 19,234 13,209 20,616 26,287 Diluted net income per share (2) (4) ......................... $ 0.63 $ 0.43 $ 0.68 $ 0.88 Diluted weighted average common shares........... 30,602 30,557 30,235 30,008 2006 Total revenue ........................................................... $ 162,955 $ 149,928 $ 165,917 $ 215,714 Cost of revenue........................................................ 52,742 42,886 46,281 63,020 Net revenue.............................................................. 110,213 107,042 119,636 152,694 Net income(3)............................................................ 15,388 10,913 12,941 21,698 Diluted net income per share(3) (4) ............................. $ 0.51 $ 0.36 $ 0.42 $ 0.71 Diluted weighted average common shares .............. 30,385 30,569 30,548 30,561

CASH AMERICA INTERNATIONAL, INC. AND SUBSIDIARIES NOTES TO CONSOLIDATED FINANCIAL STATEMENTS (Continued)
90
(1) During the second quarter of 2007, $5 was reclassified from administrative expenses to other income. The first quarter amounts included above have been conformed to the current presentation. The original reported amounts for “Total revenue” and “Net revenue” were $222,867 and $160,942, respectively. (2) The third quarter results include a $6,260 ($4,035 net of related taxes), or $0.13 per share, gain from sale of foreign notes receivable and related rights. (3) The second quarter results include a $2,167 ($1,409 net of related taxes), or $0.05 per share, gain from the early
termination of a lease contract. (4) The sum of the quarterly net income per share amounts may not total to each full year amount because these
computations are made independently for each quarter and for the full year and take into account the weighted average number of common shares outstanding for each period, including the effect of dilutive securities for that period.
23. Subsequent Events
During the first two months of 2008, Cash America Holding, Inc., a wholly owned subsidiary of the Company, increased a loan to Primary Business Services, Inc. (“PBSI”) from $200,000 as of December 31, 2007 to $1.5 million and is contemplating additional financing going forward. The increased loan (the “Loan”) is a revolving loan and was made to PBSI and its affiliates, Primary Processing, Inc., Primary Finance, Inc. and Primary Members Insurance Services, Inc. (collectively, the “Borrowers”). As of February 28, 2008, the principal amount outstanding under the Loan was $1.0 million. The Loan is secured by all the current and future assets of the Borrowers, by the personal guaranty of the Borrowers’ principal stockholder and by a pledge of all outstanding shares of each of the Borrowers. The Loan matures on February 28, 2009, and bears interest at 12% per annum. The Borrowers are using the proceeds of the Loan to fund their business operations. The Borrowers are in the early stages of operations and are not related to the Company. Prospects for repayment of the Loan are based on the future success of the Borrowers’ business plan. At this time the Borrowers are not profitable.
On February 29, 2008, the Company exercised the $50 million accordion feature contained in its existing line of credit. As a result, the committed amount under the line of credit increased from $250 million to $300 million. The additional availability will be used to satisfy potential needs for funding additional working capital or capital investments.

91
ITEM 9. CHANGES IN AND DISAGREEMENTS WITH ACCOUNTANTS ON ACCOUNTING AND FINANCIAL DISCLOSURE None. ITEM 9A. CONTROLS AND PROCEDURES Under the supervision and with the participation of the Company’s Chief Executive Officer and Chief Financial Officer, management of the Company has evaluated the effectiveness of the design and operation of the Company’s disclosure controls and procedures (as defined in Rules 13a-15(e) and 15d-15(e) under the Securities Exchange Act of 1934) as of December 31, 2007 (“Evaluation Date”). Based upon that evaluation, the Chief Executive Officer and Chief Financial Officer concluded that, as of the Evaluation Date, the Company’s disclosure controls and procedures are effective (i) to ensure that information required to be disclosed in reports that the Company files or submits under the Exchange Act is recorded, processed, summarized and reported within the time periods specified in the Securities and Exchange Commission rules and forms; and (ii) to ensure that information required to be disclosed in the reports that the Company files or submits under the Exchange Act is accumulated and communicated to management, including the Company’s Chief Executive Officer and Chief Financial Officer, to allow timely decisions regarding required disclosures. The Report of Management on Internal Control Over Financial Reporting is included in Item 8 of this annual report on Form 10-K. There was no change in the Company’s internal control over financial reporting during the quarter ended December 31, 2007, that has materially affected, or is reasonably likely to materially affect, the Company’s internal control over financial reporting. The Company’s management, including its Chief Executive Officer and Chief Financial Officer, does not expect that the Company’s disclosure controls and procedures or internal controls will prevent all possible error and fraud. The Company’s disclosure controls and procedures are, however, designed to provide reasonable assurance of achieving their objectives, and the Company’s Chief Executive Officer and Chief Financial Officer have concluded that the Company’s financial controls and procedures are effective at that reasonable assurance level.
PART III ITEM 10. DIRECTORS, EXECUTIVE OFFICERS AND CORPORATE GOVERNANCE Information required by this Item 10 with respect to directors, the Audit Committee of the Board of Directors and Audit Committee financial experts is incorporated into this report by reference to the Company’s Proxy Statement for the 2008 Annual Meeting of Shareholders (“Proxy Statement”), and in particular to the information in the Proxy Statement under the captions “Election of Directors” and “Meetings and Committees of the Board of Directors.” Information concerning executive officers is contained in Item 1 of this report under the caption “Executive Officers of the Registrant.” Information regarding Section 16(a) compliance is incorporated into this report by reference to the information contained under the caption “Compliance with Section 16(a) of the Securities Exchange Act of 1934” in the Proxy Statement. The Company has adopted a Code of Business Conduct and Ethics that applies to all of its directors, officers, and employees. This Code is publicly available on the Company’s website at www.cashamerica.com. Amendments to this Code and any grant of a waiver from a provision of the Code requiring disclosure under applicable SEC rules will be disclosed on the Company’s website. These materials may also be requested in print and without charge by writing to the Company’s Secretary at Cash America International, Inc., 1600 West 7th Street, Fort Worth, Texas 76102.
92
In 2007, Daniel R. Feehan, Chief Executive Officer of the Company, filed his annual certification with the New York Stock Exchange (“NYSE”) regarding the NYSE’s corporate governance listing standards as required by Section 303A.12 of those listing standards. ITEM 11. EXECUTIVE COMPENSATION Information contained under the caption “Executive Compensation” in the Proxy Statement is incorporated by reference into this report in response to this Item 11. ITEM 12. SECURITY OWNERSHIP OF CERTAIN BENEFICIAL OWNERS AND
MANAGEMENT AND RELATED STOCKHOLDER MATTERS Information contained under the captions “Security Ownership of Certain Beneficial Owners and Management” in the Proxy Statement is incorporated into this report by reference in response to this Item 12. ITEM 13. CERTAIN RELATIONSHIPS AND RELATED TRANSACTIONS, AND DIRECTOR
INDEPENDENCE Information contained under the caption “Board Structure, Corporate Governance Matters and Director Compensation” in the Proxy Statement is incorporated into this report by reference in response to this Item 13. ITEM 14. PRINCIPAL ACCOUNTING FEES AND SERVICES Information contained under the caption “Ratification of Independent Registered Public Accounting Firm” in the Proxy Statement is incorporated into this report by reference in response to this Item 14.
PART IV
ITEM 15. EXHIBITS, FINANCIAL STATEMENT SCHEDULES
(a) (1) Financial Statements: See Item 8, “Financial Statements and Supplementary Data,” on pages 54 through 90 hereof, for a list of the Company’s consolidated financial statements and report of independent registered public accounting firm.
(2) Financial Statement Schedule: The following financial statement schedule of the
Company is included herein on pages 94-95.
Report of Independent Registered Public Accounting Firm on Financial Statement Schedule (page 94) Schedule II – Valuation Accounts (page 95)
All other schedules for which provision is made in the applicable accounting regulation
of the Securities and Exchange Commission are not required under the related instructions, are inapplicable, or the required information is included elsewhere in the consolidated financial statements.
(3) Exhibits required by Item 601 of Regulation S-K: The exhibits filed in response to this
item are listed in the Exhibit Index on pages 96 through 97.
93
SIGNATURES
Pursuant to the requirements of Section 13 or 15(d) of the Securities Exchange Act of 1934, the Registrant has duly caused this report to be signed on its behalf by the undersigned, thereunto duly authorized, on February 29, 2008. CASH AMERICA INTERNATIONAL, INC. By: /s/ DANIEL R. FEEHAN Daniel R. Feehan Chief Executive Officer and President Pursuant to the requirements of the Securities and Exchange Act of 1934, the report has been signed by the following persons on February 29, 2008 on behalf of the registrant and in the capacities and on the dates indicated.
Signature Title Date /s/ JACK R. DAUGHERTY Chairman of the Board February 29, 2008
Jack R. Daugherty of Directors
/s/ DANIEL R. FEEHAN Chief Executive Officer, February 29, 2008 Daniel R. Feehan President and Director
(Principal Executive Officer)
/s/ THOMAS A. BESSANT, JR. Executive Vice President and February 29, 2008 Thomas A. Bessant, Jr. Chief Financial Officer
(Principal Financial and Accounting Officer)
/s/ DANIEL E. BERCE Director February 29, 2008 Daniel E. Berce
/s/ A. R. DIKE Director February 29, 2008 A. R. Dike
/s/ JAMES H. GRAVES Director February 29, 2008 James H. Graves
/s/ B. D. HUNTER Director February 29, 2008 B. D. Hunter
/s/ TIMOTHY J. McKIBBEN Director February 29, 2008 Timothy J. McKibben
/s/ ALFRED M. MICALLEF Director February 29, 2008 Alfred M. Micallef
94
REPORT OF INDEPENDENT REGISTERED PUBLIC ACCOUNTING FIRM
ON FINANCIAL STATEMENT SCHEDULE To the Board of Directors and Stockholders of Cash America International, Inc. Our audits of the consolidated financial statements and of the effectiveness of internal control over financial reporting referred to in our report dated February 20, 2008 appearing in this Annual Report on Form 10-K also included an audit of the financial statement schedule listed in Item 15(a)(2) of this Form 10- K. In our opinion, this financial statement schedule presents fairly, in all material respects, the information set forth therein when read in conjunction with the related consolidated financial statements.
Fort Worth, Texas February 20, 2008
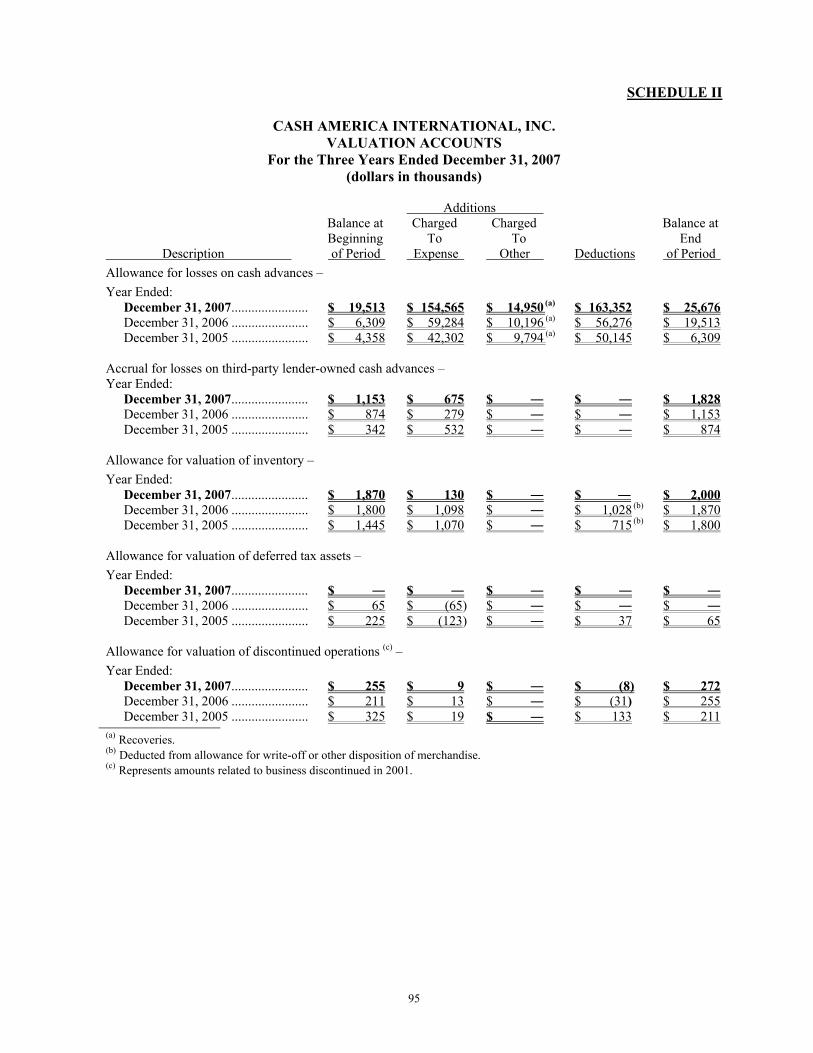
95
SCHEDULE II
CASH AMERICA INTERNATIONAL, INC.
VALUATION ACCOUNTS For the Three Years Ended December 31, 2007
(dollars in thousands) Additions Balance at Charged Charged Balance at Beginning To To End Description of Period Expense Other Deductions of Period Allowance for losses on cash advances – Year Ended: December 31, 2007....................... $ 19,513 $ 154,565 $ 14,950 (a) $ 163,352 $ 25,676 December 31, 2006 ....................... $ 6,309 $ 59,284 $ 10,196 (a) $ 56,276 $ 19,513 December 31, 2005 ....................... $ 4,358 $ 42,302 $ 9,794 (a) $ 50,145 $ 6,309 Accrual for losses on third-party lender-owned cash advances – Year Ended: December 31, 2007....................... $ 1,153 $ 675 $ $ $ 1,828 December 31, 2006 ....................... $ 874 $ 279 $ $ $ 1,153 December 31, 2005 ....................... $ 342 $ 532 $ $ $ 874 Allowance for valuation of inventory – Year Ended: December 31, 2007....................... $ 1,870 $ 130 $ $ $ 2,000 December 31, 2006 ....................... $ 1,800 $ 1,098 $ $ 1,028 (b) $ 1,870 December 31, 2005 ....................... $ 1,445 $ 1,070 $ $ 715 (b) $ 1,800 Allowance for valuation of deferred tax assets – Year Ended: December 31, 2007....................... $ $ $ $ $ December 31, 2006 ....................... $ 65 $ (65) $ $ $ December 31, 2005 ....................... $ 225 $ (123) $ $ 37 $ 65 Allowance for valuation of discontinued operations (c) – Year Ended: December 31, 2007....................... $ 255 $ 9 $ $ (8) $ 272 December 31, 2006 ....................... $ 211 $ 13 $ $ (31) $ 255 December 31, 2005 ....................... $ 325 $ 19 $ $ 133 $ 211 (a) Recoveries. (b) Deducted from allowance for write-off or other disposition of merchandise. (c) Represents amounts related to business discontinued in 2001.
96
EXHIBIT INDEX
The following documents are filed as a part of this report. Those exhibits previously filed and incorporated herein by reference are identified by reference to the list of prior filings after the list of exhibits. Exhibits not required for this report have been omitted. Exhibit Description 3.1 Articles of Incorporation of Cash America Investments, Inc. filed in the office of the Secretary of
State of Texas on October 4, 1984. (a) (Exhibit 3.1) 3.2 Articles of Amendment to the Articles of Incorporation of Cash America Investments, Inc. filed in the
office of the Secretary of State of Texas on October 26, 1984. (a) (Exhibit 3.2) 3.3 Articles of Amendment to the Articles of Incorporation of Cash America Investments, Inc. filed in the
office of the Secretary of State of Texas on September 24, 1986. (a) (Exhibit 3.3) 3.4 Articles of Amendment to the Articles of Incorporation of Cash America Investments, Inc. filed in the
office of the Secretary of State of Texas on September 30, 1987. (b) (Exhibit 3.4) 3.5 Articles of Amendment to the Articles of Incorporation of Cash America Investments, Inc. filed in the
office of the Secretary of State of Texas on April 23, 1992 to change the Company’s name to “Cash America International, Inc.” (c) (Exhibit 3.5)
3.6 Articles of Amendment to the Articles of Incorporation of Cash America International, Inc. filed in Office of the Secretary of State of Texas on May 21, 1993. (d) (Exhibit 3.6)
3.7 Bylaws of Cash America International, Inc. (e) (Exhibit 3.5) 3.8 Amendment to Bylaws of Cash America International, Inc. dated effective September 26, 1990. (f)
(Exhibit 3.6) 3.9 Amendment to Bylaws of Cash America International, Inc. dated effective April 22, 1992. (c)
(Exhibit 3.8) 4.1 Form of Stock Certificate. (c) (Exhibit 4.1) 10.1 Note Agreement dated as of August 12, 2002 among the Company and the Purchasers named therein
for the issuance of the Company’s 7.20% Senior Notes due August 12, 2009 in the aggregate principal amount of $42,500,000. (p) (Exhibit 10.1)
10.2 Amendment No. 1 (September 7, 2004) to Note Agreement dated as of August 12, 2002 among the Company and the purchasers named therein. (o) (Exhibit 10.1)
10.3 Amendment No. 2 (December 31, 2006) to Note Agreement dated as of August 12, 2002, among the Company and the purchasers named therein. (w) (Exhibit 10.39)
10.4 Amendment No. 3 (December 21, 2007) to Note Agreement dated as of August 12, 2002 among the Company and the purchasers named therein
10.5 Supplemental Executive Retirement Plan dated effective January 1, 2003. (q) (Exhibit 10.32) 10.6 Form of Executive Change-in-Control Severance Agreement dated December 22, 2003 between the
Company and each of its Executive Vice Presidents (Thomas A. Bessant, Jr., Robert D. Brockman, Jerry D. Finn, Michael D. Gaston, William R. Horne, James H. Kauffman) (q) (Exhibit 10.31)
10.7 Amended and Restated Executive Employment Agreement between the Company and Mr. Feehan dated as of January 21, 2004. (q) (Exhibit 10.30)
10.8 2004 Long-Term Incentive Plan (r) (Exhibit 10.21) 10.9 Amendment One (January 25, 2006) to the Cash America International, Inc. 2004 Long-Term
Incentive Plan. (t) (Exhibit 10.31) 10.10 Note Agreement dated as of December 28, 2005 among the Company and the Purchasers named
therein for the issuance of the Company’s 6.12% Senior Notes due December 28, 2015 in the aggregate principal amount of $40,000,000. (t) (Exhibit 10.32)
97
10.11 Note Agreement dated as of December 19, 2006 among the Company and the Purchasers named
therein for the issuance of the Company’s 6.09% Series Senior Notes due December 19, 2016 in the aggregate principal amount of $35,000,000 and 6.21% Series B Senior Notes due December 19, 2021 in the aggregate principal amount of $25,000,000. (v) (Exhibit 10.1)
10.12 Letter agreement dated January 25, 2006 extending Amended and Restated Executive Employment Agreement between the Company and Mr. Feehan dated January 21, 2004. (w) (Exhibit 10.36)
10.13 Letter agreement dated April 25, 2007 extending Amended and Restated Executive Employment Agreement between the Company and Mr. Feehan dated January 21, 2004 (x) (Exhibit 10.1).
10.14 Employment Transition Agreement dated September 19, 2007 between the Company and Jerry D. Finn. (y) (Exhibit 10.1)
14 Code of Ethics. The Company’s Code of Business Conduct and Ethics may be accessed via the Company’s website at www.cashamerica.com.
21 Subsidiaries of Cash America International, Inc. 23 Consent of PricewaterhouseCoopers LLP. 31.1 Certification of Chief Executive Officer. 31.2 Certification of Chief Financial Officer. 32.1 Certification of Chief Executive Officer pursuant to 18 U.S.C. Section 1350, as adopted pursuant to
Section 906 of the Sarbanes-Oxley Act of 2002. 32.2 Certification of Chief Financial Officer pursuant to 18 U.S.C. Section 1350, as adopted pursuant to
Section 906 of the Sarbanes-Oxley Act of 2002.
Certain Exhibits are incorporated by reference to the Exhibits shown in parenthesis contained in the Company’s following filings with the Securities and Exchange Commission: (a) Registration Statement Form S-1, File No. 33-10752. (b) Amendment No. 1 to its Registration Statement on Form S-4, File No. 33-17275. (c) Annual Report on Form 10-K for the year ended December 31, 1992. (d) Annual Report on Form 10-K for the year ended December 31, 1993. (e) Post-Effective Amendment No. 1 to its Registration Statement on Form S-4, File No. 33-17275. (f) Annual Report on Form 10-K for the year ended December 31, 1990. (g) Quarterly Report on Form 10-Q for the quarter ended June 30, 1995. (h) Quarterly Report on Form 10-Q for the quarter ended September 30, 1995. (i) Annual Report on Form 10-K for the year ended December 31, 1996. (j) Annual Report on Form 10-K for the year ended December 31, 1997. (k) Annual Report on Form 10-K for the year ended December 31, 1998. (l) Quarterly Report on Form 10-Q for the quarter ended September 30, 1999. (m) Quarterly Report on Form 10-Q for the quarter ended September 30, 2000. (n) Annual Report on Form 10-K for the year ended December 31, 2001. (o) Current Report on Form 8-K dated September 7, 2004. (p) Current Report on Form 8-K dated August 15, 2002. (q) Annual Report on Form 10-K for the year ended December 31, 2003. (r) Annual Report on Form 10-K for the year ended December 31, 2004. (s) Quarterly Report on Form 10-Q for the quarter ended June 30, 2005. (t) Annual Report on Form 10-K for the year ended December 31, 2005. (u) Quarterly Report on Form 10-Q for the quarter ended June 30, 2006. (v) Current Report on Form 8-K dated December 22, 2006. (w) Annual Report on Form 10-K for the year ended December 31, 2006. (x) Current Report on Form 8-K dated April 25, 2007. (y) Current Report on Form 8-K dated September 25, 2007.

1
EXHIBIT 21
SUBSIDIARIES OF CASH AMERICA INTERNATIONAL, INC.
Jurisdiction of
Subsidiaries Incorporation/ Organization
Cash America, Inc. ........................................................................................................ Delaware Cash America Advance, Inc....................................................................................... Delaware Cash America, Inc. of Louisiana................................................................................ Delaware RATI Holding, Inc. .................................................................................................... Texas Cash America, Inc. of Tennessee .................................................................................. Tennessee Cash America, Inc. of Oklahoma .................................................................................. Oklahoma Cash America, Inc. of South Carolina ........................................................................... South Carolina Florida Cash America, Inc............................................................................................. Florida Georgia Cash America, Inc. .......................................................................................... Georgia Cash America, Inc. of North Carolina ........................................................................... North Carolina Cash America Pawn, Inc. of Ohio ................................................................................. Ohio Cash America, Inc. of Alabama..................................................................................... Alabama Cash America, Inc. of Colorado .................................................................................... Colorado Cash America, Inc. of Indiana ....................................................................................... Indiana Cash America Pawn L.P................................................................................................ Delaware Cash America Management L.P. ................................................................................... Delaware Cash America Holding, Inc. .......................................................................................... Delaware Mr. Payroll Corporation............................................................................................. Delaware Express Cash International Corporation........................................................................ Delaware Cash America of Missouri, Inc...................................................................................... Missouri Vincent’s Jewelers and Loan, Inc. ............................................................................. Missouri Cash America, Inc. of Utah ........................................................................................... Utah Cash America Franchising, Inc. .................................................................................... Delaware Cash America Financial Services, Inc. .......................................................................... Delaware Cash America, Inc. of Illinois........................................................................................ Illinois Uptown City Pawners, Inc. ........................................................................................ Illinois Doc Holliday’s Pawnbrokers & Jewellers, Inc. ............................................................. Delaware Longhorn Pawn and Gun, Inc. ................................................................................... Texas Bronco Pawn & Gun, Inc. ...................................................................................... Oklahoma Gamecock Pawn & Gun, Inc. ................................................................................. South Carolina Hornet Pawn & Gun, Inc. ....................................................................................... North Carolina Tiger Pawn & Gun, Inc. ......................................................................................... Tennessee Cashland Financial Services, Inc................................................................................... Delaware Cash America, Inc. of Kentucky ................................................................................... Kentucky Cash America, Inc. of Nevada....................................................................................... Nevada Cash America, Inc. of Virginia...................................................................................... Virginia Cash America, Inc. of Alaska........................................................................................ Alaska Cash America Net Holdings, LLC................................................................................. Delaware Cash America Net of Alabama, LLC......................................................................... Delaware Cash America Net of Alaska, LLC ............................................................................ Delaware Cash America Net of Arizona, LLC.......................................................................... Delaware Cash America Net of California, LLC ....................................................................... Delaware Cash America Net of Colorado, LLC......................................................................... Delaware
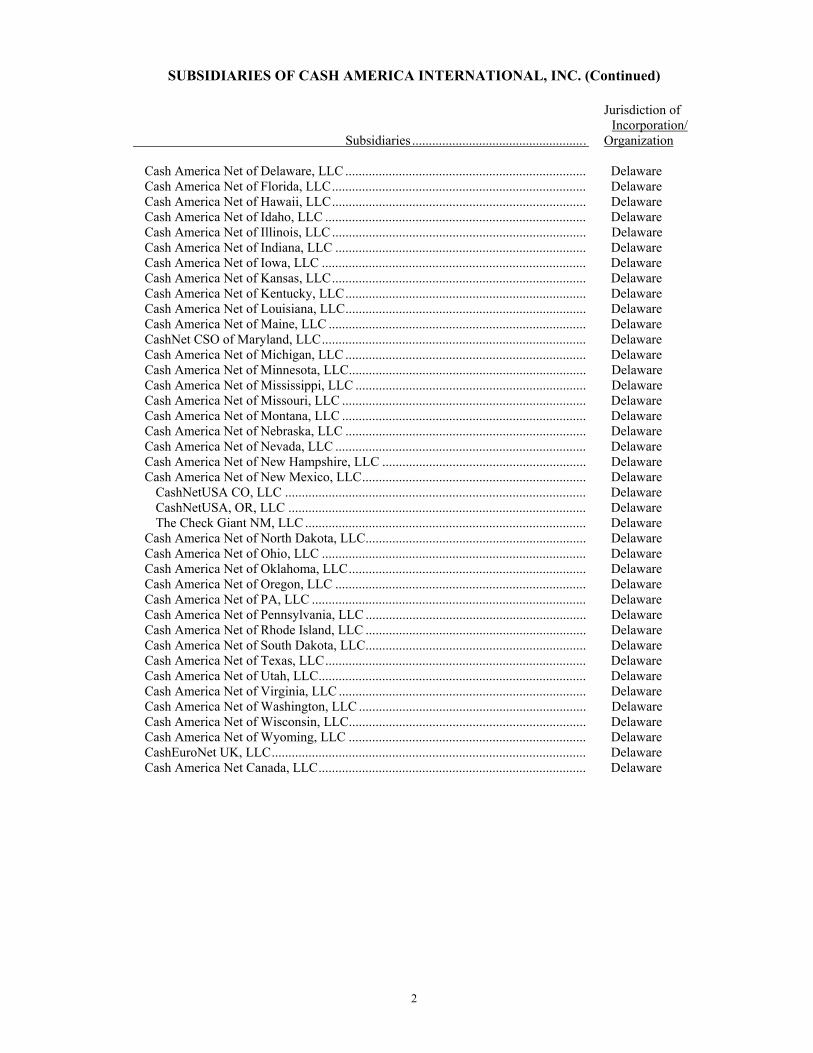
2
SUBSIDIARIES OF CASH AMERICA INTERNATIONAL, INC. (Continued)
Jurisdiction of
Subsidiaries .................................................... Incorporation/
Organization Cash America Net of Delaware, LLC ........................................................................ Delaware Cash America Net of Florida, LLC............................................................................ Delaware Cash America Net of Hawaii, LLC............................................................................ Delaware Cash America Net of Idaho, LLC .............................................................................. Delaware Cash America Net of Illinois, LLC ............................................................................ Delaware Cash America Net of Indiana, LLC ........................................................................... Delaware Cash America Net of Iowa, LLC ............................................................................... Delaware Cash America Net of Kansas, LLC............................................................................ Delaware Cash America Net of Kentucky, LLC........................................................................ Delaware Cash America Net of Louisiana, LLC........................................................................ Delaware Cash America Net of Maine, LLC ............................................................................. Delaware CashNet CSO of Maryland, LLC............................................................................... Delaware Cash America Net of Michigan, LLC ........................................................................ Delaware Cash America Net of Minnesota, LLC....................................................................... Delaware Cash America Net of Mississippi, LLC ..................................................................... Delaware Cash America Net of Missouri, LLC ......................................................................... Delaware Cash America Net of Montana, LLC ......................................................................... Delaware Cash America Net of Nebraska, LLC ........................................................................ Delaware Cash America Net of Nevada, LLC ........................................................................... Delaware Cash America Net of New Hampshire, LLC ............................................................. Delaware Cash America Net of New Mexico, LLC................................................................... Delaware CashNetUSA CO, LLC .......................................................................................... Delaware CashNetUSA, OR, LLC ......................................................................................... Delaware The Check Giant NM, LLC .................................................................................... Delaware Cash America Net of North Dakota, LLC.................................................................. Delaware Cash America Net of Ohio, LLC ............................................................................... Delaware Cash America Net of Oklahoma, LLC....................................................................... Delaware Cash America Net of Oregon, LLC ........................................................................... Delaware Cash America Net of PA, LLC .................................................................................. Delaware Cash America Net of Pennsylvania, LLC .................................................................. Delaware Cash America Net of Rhode Island, LLC .................................................................. Delaware Cash America Net of South Dakota, LLC.................................................................. Delaware Cash America Net of Texas, LLC.............................................................................. Delaware Cash America Net of Utah, LLC................................................................................ Delaware Cash America Net of Virginia, LLC .......................................................................... Delaware Cash America Net of Washington, LLC .................................................................... Delaware Cash America Net of Wisconsin, LLC....................................................................... Delaware Cash America Net of Wyoming, LLC ....................................................................... Delaware CashEuroNet UK, LLC.............................................................................................. Delaware Cash America Net Canada, LLC................................................................................ Delaware

EXHIBIT 23
CONSENT OF INDEPENDENT REGISTERED PUBLIC ACCOUNTING FIRM We hereby consent to the incorporation by reference in the Registration Statements on Form S-8 (Nos. 33-29658, 33-36430, 33-59733, 333-95827 and 333-97273) of Cash America International, Inc. of our report dated February 20, 2008 relating to the financial statements and the effectiveness of internal control over financial reporting, which appears in this Form 10-K. We also consent to the incorporation by reference of our report dated February 20, 2008 relating to the financial statement schedule, which appears in this Form 10-K.
Fort Worth, Texas February 20, 2008

EXHIBIT 31.1
CERTIFICATION
I, Daniel R. Feehan, certify that:
1. I have reviewed this report on Form 10-K of Cash America International, Inc.;
2. Based on my knowledge, this report does not contain any untrue statement of a material fact or omit to state a material fact necessary to make the statements made, in light of the circumstances under which such statements were made, not misleading with respect to the period covered by this report;
3. Based on my knowledge, the financial statements, and other financial information included in this report,
fairly present in all material respects the financial condition, results of operations and cash flows of the registrant as of, and for, the periods presented in this report;
4. The registrant’s other certifying officer and I are responsible for establishing and maintaining disclosure
controls and procedures (as defined in Exchange Act Rules 13a-15(e) and 15d-15(e)) and internal control over financial reporting (as defined in Exchange Act Rules 13a-15(f) and 15d-15(f)) for the registrant and have:
a) designed such disclosure controls and procedures, or caused such disclosure controls and procedures to
be designed under our supervision, to ensure that material information relating to the registrant, including its consolidated subsidiaries, is made known to us by others within those entities, particularly during the period in which this report is being prepared;
b) designed such internal control over financial reporting, or caused such internal control over financial reporting to be designed under our supervision, to provide reasonable assurance regarding the reliability of financial reporting and the preparation of financial statements for external purposes in accordance with generally accepted accounting principles;
c) evaluated the effectiveness of the registrant’s disclosure controls and procedures and presented in this report our conclusions about the effectiveness of the disclosure controls and procedures, as of the end of the period covered by this report based on such evaluation; and
d) disclosed in this report any change in the registrant’s internal control over financial reporting that occurred during the registrant’s most recent fiscal quarter (the registrant’s fourth fiscal quarter in the case of an annual report) that has materially affected, or is reasonably likely to materially affect, the registrant’s internal control over financial reporting; and
5. The registrant’s other certifying officer and I have disclosed, based on our most recent evaluation of internal
control over financial reporting, to the registrant’s auditors and the audit committee of the registrant’s board of directors (or persons performing the equivalent functions): a) all significant deficiencies and material weaknesses in the design or operation of internal control over
financial reporting which are reasonably likely to adversely affect the registrant’s ability to record, process, summarize and report financial information; and
b) any fraud, whether or not material, that involves management or other employees who have a significant role in the registrant’s internal control over financial reporting.
Date: February 29, 2008 /s/ Daniel R. Feehan Daniel R. Feehan Chief Executive Officer and President
EXHIBIT 31.2
CERTIFICATION
I, Thomas A. Bessant, Jr., certify that:
1. I have reviewed this report on Form 10-K of Cash America International, Inc.;
2. Based on my knowledge, this report does not contain any untrue statement of a material fact or omit to state a material fact necessary to make the statements made, in light of the circumstances under which such statements were made, not misleading with respect to the period covered by this report;
3. Based on my knowledge, the financial statements, and other financial information included in this report,
fairly present in all material respects the financial condition, results of operations and cash flows of the registrant as of, and for, the periods presented in this report;
4. The registrant’s other certifying officer and I are responsible for establishing and maintaining disclosure
controls and procedures (as defined in Exchange Act Rules 13a-15(e) and 15d-15(e)) and internal control over financial reporting (as defined in Exchange Act Rules 13a-15(f) and 15d-15(f)) for the registrant and have:
a) designed such disclosure controls and procedures, or caused such disclosure controls and procedures to
be designed under our supervision, to ensure that material information relating to the registrant, including its consolidated subsidiaries, is made known to us by others within those entities, particularly during the period in which this report is being prepared;
b) designed such internal control over financial reporting, or caused such internal control over financial reporting to be designed under our supervision, to provide reasonable assurance regarding the reliability of financial reporting and the preparation of financial statements for external purposes in accordance with generally accepted accounting principles;
c) evaluated the effectiveness of the registrant’s disclosure controls and procedures and presented in this report our conclusions about the effectiveness of the disclosure controls and procedures as of the end of the period covered by this report based on such evaluation; and
d) disclosed in this report any change in the registrant’s internal control over financial reporting that occurred during the registrant’s most recent fiscal quarter (the registrant’s fourth fiscal quarter in the case of an annual report) that has materially affected, or is reasonably likely to materially affect, the registrant’s internal control over financial reporting; and
5. The registrant’s other certifying officer and I have disclosed, based on our most recent evaluation of internal
control over financial reporting, to the registrant’s auditors and the audit committee of the registrant’s board of directors (or persons performing the equivalent functions): a) all significant deficiencies and material weaknesses in the design or operation of internal control over
financial reporting which are reasonably likely to adversely affect the registrant’s ability to record, process, summarize and report financial information; and
b) any fraud, whether or not material, that involves management or other employees who have a significant role in the registrant’s internal control over financial reporting.
Date: February 29, 2008 /s/ Thomas A. Bessant, Jr. Thomas A. Bessant, Jr. Executive Vice President and Chief Financial Officer
EXHIBIT 32.1
CERTIFICATION PURSUANT TO 18 U.S.C. SECTION 1350,
AS ADOPTED PURSUANT TO SECTION 906 OF THE SARBANES-OXLEY ACT OF 2002
In connection with the Annual Report of Cash America International, Inc. (the “Company”) on Form 10-K for the year ended December 31, 2007, as filed with the Securities and Exchange Commission on the date hereof (the “Report”), I, Daniel R. Feehan, Chief Executive Officer and President of the Company, certify, pursuant to 18 U.S.C. Section 1350, as adopted pursuant to Section 906 of the Sarbanes-Oxley Act of 2002, that to my knowledge:
(1) The Report fully complies with the requirements of Section 13(a) or 15(d) of the Securities Exchange Act of 1934, as amended; and
(2) The information contained in the Report fairly presents, in all material
respects, the financial condition and results of operations of the Company.
/s/ Daniel R. Feehan Daniel R. Feehan Chief Executive Officer and President Date: February 29, 2008
EXHIBIT 32.2
CERTIFICATION PURSUANT TO 18 U.S.C. SECTION 1350,
AS ADOPTED PURSUANT TO SECTION 906 OF THE SARBANES-OXLEY ACT OF 2002
In connection with the Annual Report of Cash America International, Inc. (the “Company”) on Form 10-K for the year ended December 31, 2007, as filed with the Securities and Exchange Commission on the date hereof (the “Report”), I, Thomas A. Bessant, Jr., Executive Vice President and Chief Financial Officer of the Company, certify, pursuant to 18 U.S.C. Section 1350, as adopted pursuant to Section 906 of the Sarbanes-Oxley Act of 2002, that to my knowledge:
(1) The Report fully complies with the requirements of Section 13(a) or 15(d) of the Securities Exchange Act of 1934, as amended; and
(2) The information contained in the Report fairly presents, in all material
respects, the financial condition and results of operations of the Company.
/s/ Thomas A. Bessant, Jr. Thomas A. Bessant, Jr. Executive Vice President and Chief Financial Officer Date: February 29, 2008

Jack R. Daugherty Chairman of the BoardCash America international, inc.
Daniel E. Berce (a) (b)
Chief executive officer and PresidentAmeriCredit Corp
A. R. Dike (a)
Chairman of the Board and PresidentThe Dike Co., inc.
Daniel R. FeehanChief executive officer and PresidentCash America international, inc. James H. Graves (a) (b)
managing Director and Partnererwin Graves & Associates, lP
B. D. Hunter (c)
ConsultantService Corporation international
Timothy J. McKibben (b) (c)
Chairman of the Board and PresidentAncor holdings, l.P. Alfred M. Micallef (c)
Chairman of the Board and PresidentJmK international, inc.
(a) Management Development and Compensation Committee Member
(b) Audit Committee Member
(c) Nominating and Corporate Governance Committee Member
Board of Directors
Executive Officers
Corporate AddressCash America international Building1600 West 7th StreetFort Worth, Texas 76102-2599(817) 335-1100www.cashamerica.comwww.cashnetusa.comwww.quickquid.co.ukwww.cashlandloans.com
Investor Relationsinformation requestsshould be forwarded to:l. Dee littrellDirector, investor Relations
Stock Listing Symbol: CSh
Transfer Agent and RegistrarBnY mellon Shareowner Services 480 Washington BoulevardJersey City, nJ 07310-1900(800) 635-9270TDD for hearing impaired: (800) 231-5469 Foreign Shareowners: (201) 680-6578 TDD Foreign Shareowners: (201) 680-6610 www.bnymellon.com/shareowner/isd
Direct Stock Purchase/Dividend Reinvestment PlanFor detailed information regarding this program, call BnY mellon Shareowner Services toll free at 1-800-542-7530 or write to:BnY mellon Shareowner Services P.o. Box 358035Pittsburgh, PA 15252-8035
Independent Public AccountantsPricewaterhouseCoopers llPFort Worth, Texas
Annual Stockholders’ MeetingApril 23, 20089:00 AmCash America international Building1600 West 7th StreetFort Worth, Texas 76102-2599
A copy of the Company’s Annual Report to the Securities and Exchange Commission on Form 10-K can be obtained without charge upon written request to the office of Investor Relations.
Other Information
Daniel R. FeehanChief executive officer and President
Albert GoldsteinPresidentinternet Services Division
John A. McDormanPresident Shared Services Division
Jerry A. WackerhagenPresidentRetail Services Division
Thomas A. Bessant, Jr.executive Vice President Chief Financial officer
Robert D. Brockmanexecutive Vice PresidentAdministration Services
Michael D. Gastonexecutive Vice PresidentCorporate Development
James H. Kauffmanexecutive Vice PresidentCorporate Development
J. Curtis Linscottexecutive Vice PresidentGeneral Counsel and Secretary
Dennis J. Weeseexecutive Vice PresidentChief operating officer - Retail Services Division
Front Row: Dan Feehan, Jim Kauffman, Al Goldstein. Middle Row: Jerry Wackerhagen, Mike Gaston, Tom Bessant, Curtis Linscott. Back Row: Rob Brockman, Dennis Weese, John McDorman.
1600 West 7th StreetFort Worth, Texas 76102-2599
(817) 335-1100www.cashamerica.comwww.cashnetusa.comwww.quickquid.co.uk
www.cashlandloans.com
Cash America International, Inc.
Advances