Embed Size (px)
Citation preview
10/11/2016
1
Advanced Topics in Web SurveysSOWMYA ANAND
SURVEY RESEARCH LABORATORY
Notes
Please hold your questions until the end
Slides available at http://www.srl.uic.edu/SEMINARS/semnotes.htm
Please raise your hand so that I can see that you are able to hear me
10/11/2016
2
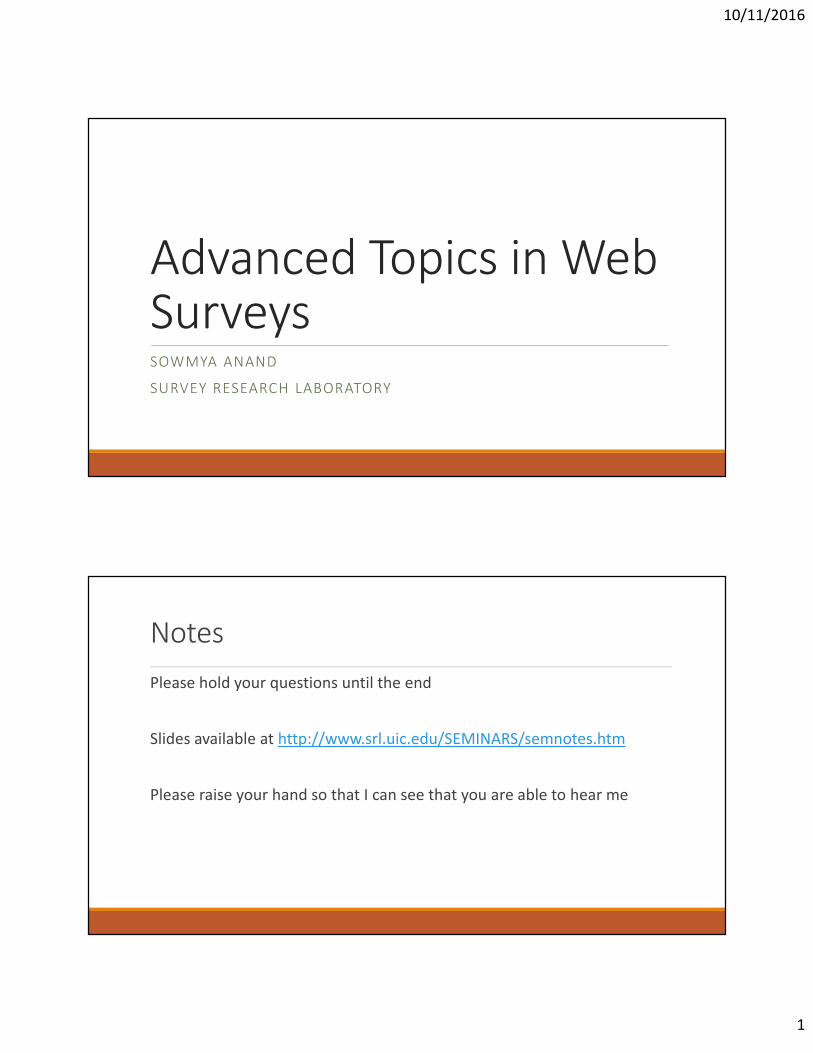
Trends in Survey Data Collection, by Mode, of U.S. Academic Centers
3
0.0%
10.0%
20.0%
30.0%
40.0%
50.0%
60.0%
70.0%
80.0%
90.0%
1995 1997 1999 2001 2003 2005 2007 2009
Survey Mode, by Year: Regression Lines
Web
Phone
In Person
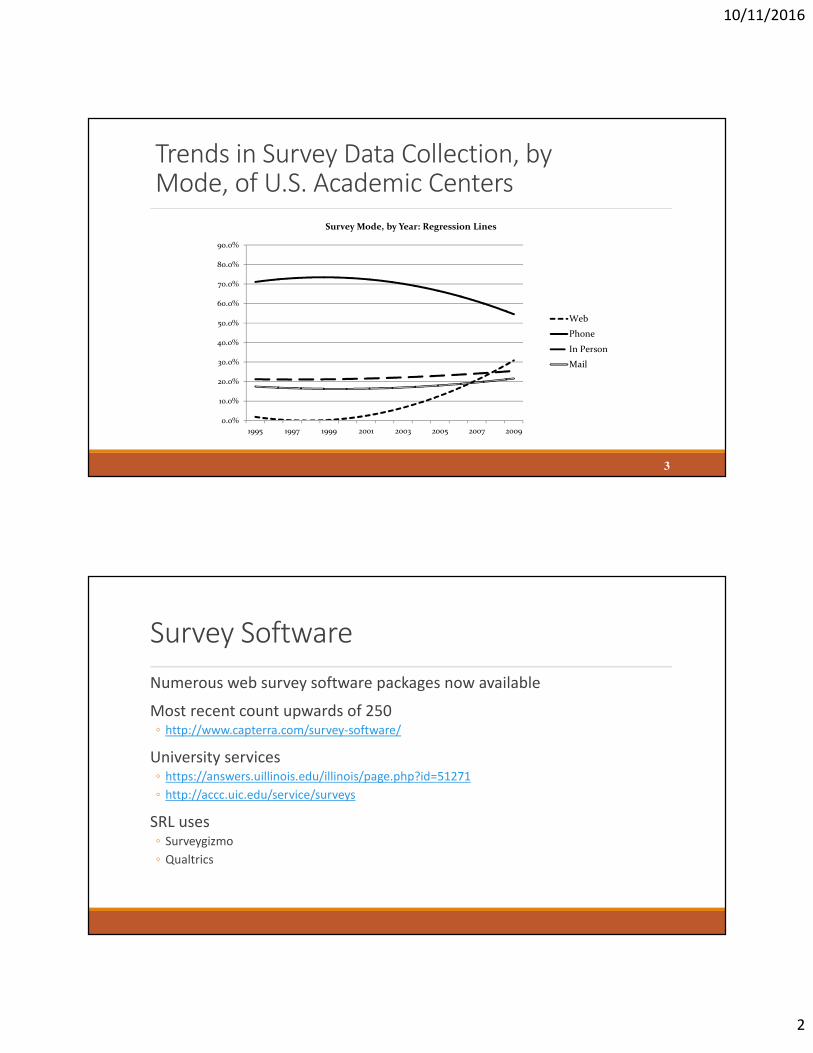
Survey Software
Numerous web survey software packages now available
Most recent count upwards of 250 ◦ http://www.capterra.com/survey-software/
University services◦ https://answers.uillinois.edu/illinois/page.php?id=51271
◦ http://accc.uic.edu/service/surveys
SRL uses◦ Surveygizmo
◦ Qualtrics
10/11/2016
3
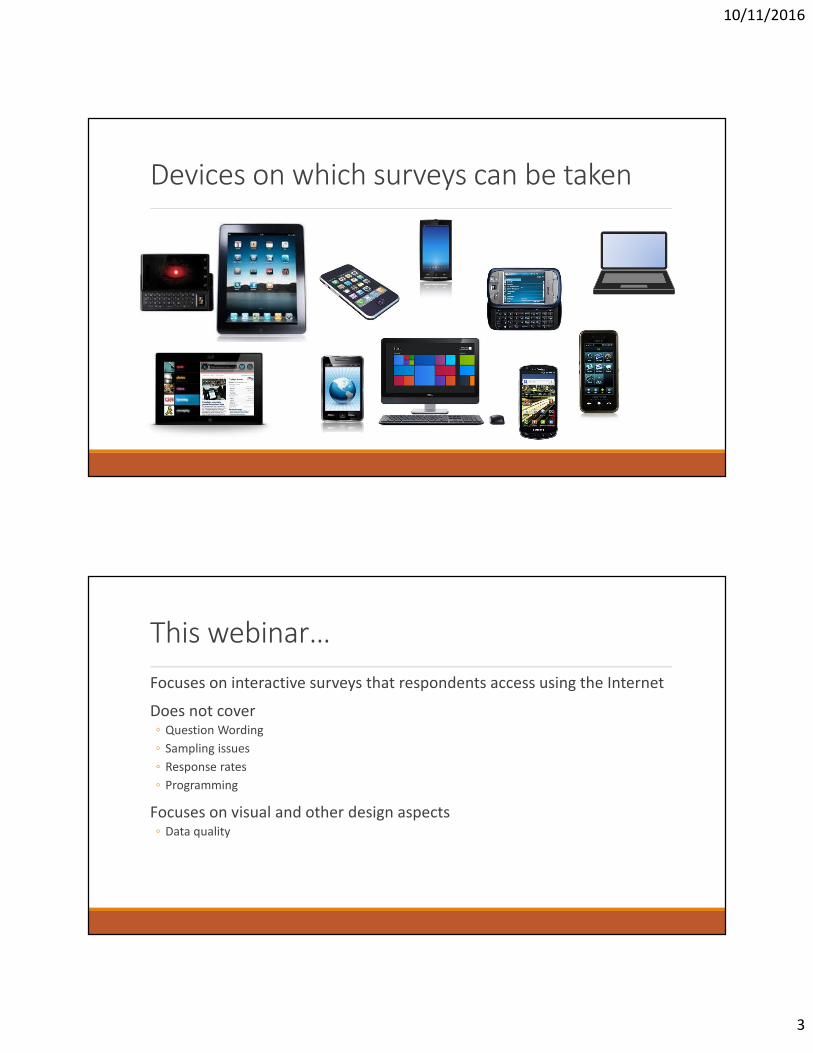
Devices on which surveys can be taken
This webinar…
Focuses on interactive surveys that respondents access using the Internet
Does not cover◦ Question Wording
◦ Sampling issues
◦ Response rates
◦ Programming
Focuses on visual and other design aspects◦ Data quality
10/11/2016
4
List of topics
Email invitations
Scrolling versus paging
Progress indicators
Open ended questions
Single item questions
Multiple item questions
Other issues
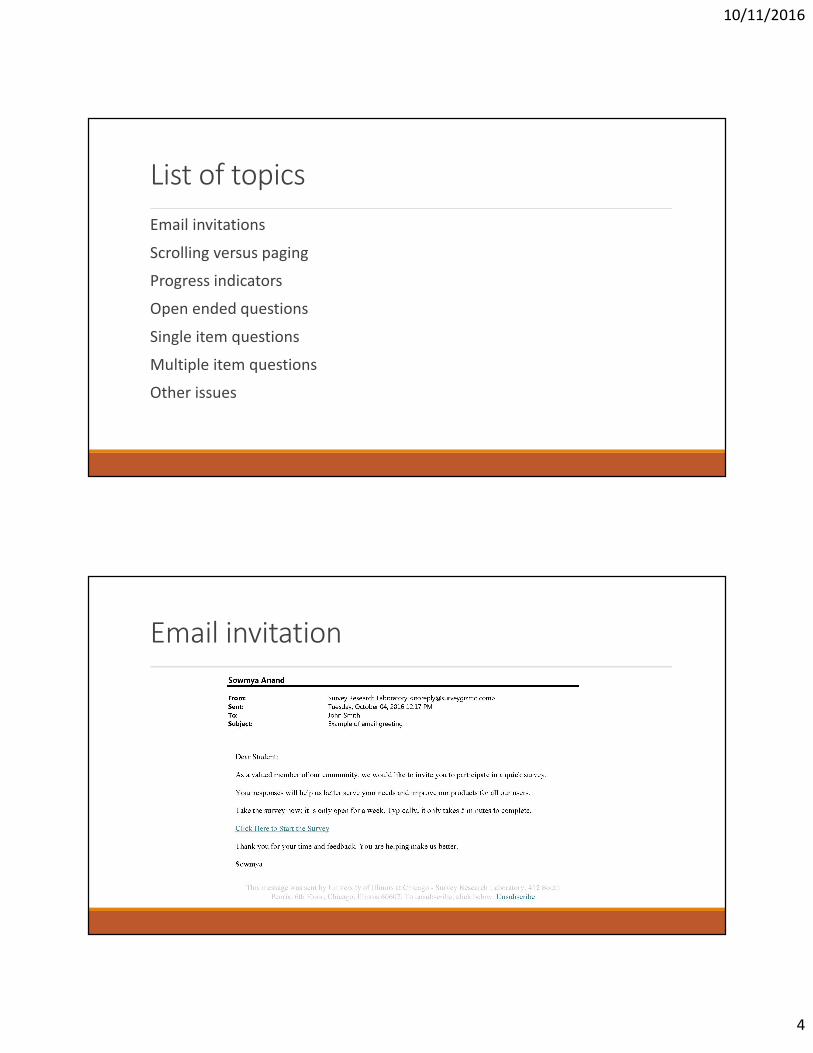
Email invitation
10/11/2016
5
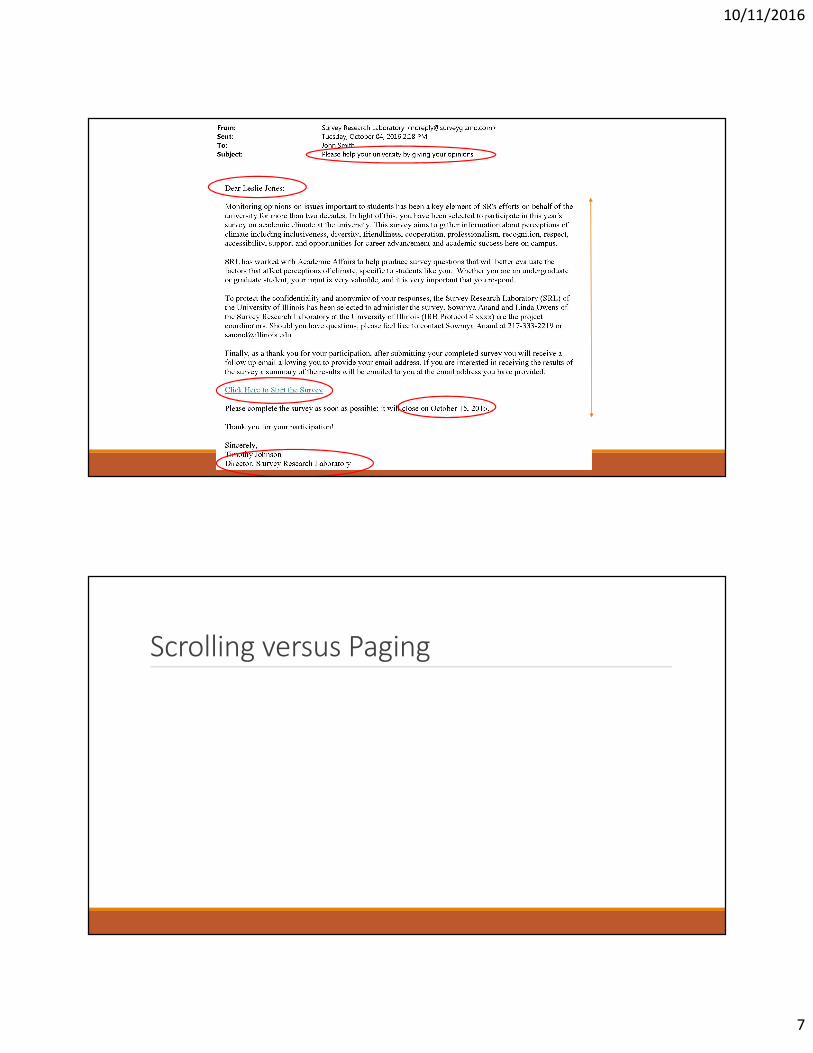
Email invitations: Greeting
Personalization improves response rate (Heerwegh, 2005; Heerwegh & Loosveldt, 2006)
◦ Form not important
Why does it work?◦ Makes respondents feel more important and valued
◦ Norm of reciprocity
◦ Reduces diffusion of responsibility
◦ Email sent to an individual versus a group
◦ Personalization double edged sword
◦ Increases accountability
◦ Could increase socially desirable responding (Heerwegh & Loosveldt, 2006), or
◦ Affect responses to sensitive questions (Joinson, Woodley, & Reips, 2007)
Email invitations: Other aspects
Subject line◦ Plea appeal
◦ “Please help…” (Felix & Burchett, 2011; Troutead, 2004)
◦ Mentioning prizes
◦ “Win a weekend for two” (Kent & Brandel, 2003)
Content of email◦ Scarcity
◦ Selected few
◦ Deadline
◦ Length of email
◦ Shorter is not necessarily better (Kaplowitz, Lupi, Couper, & Thorp, 2012; Klofstad, Boulianne, & Basson, 2008)
◦ Placement of survey link
◦ Earlier is not necessarily better (Kaplowitz et al., 2012)
10/11/2016
6
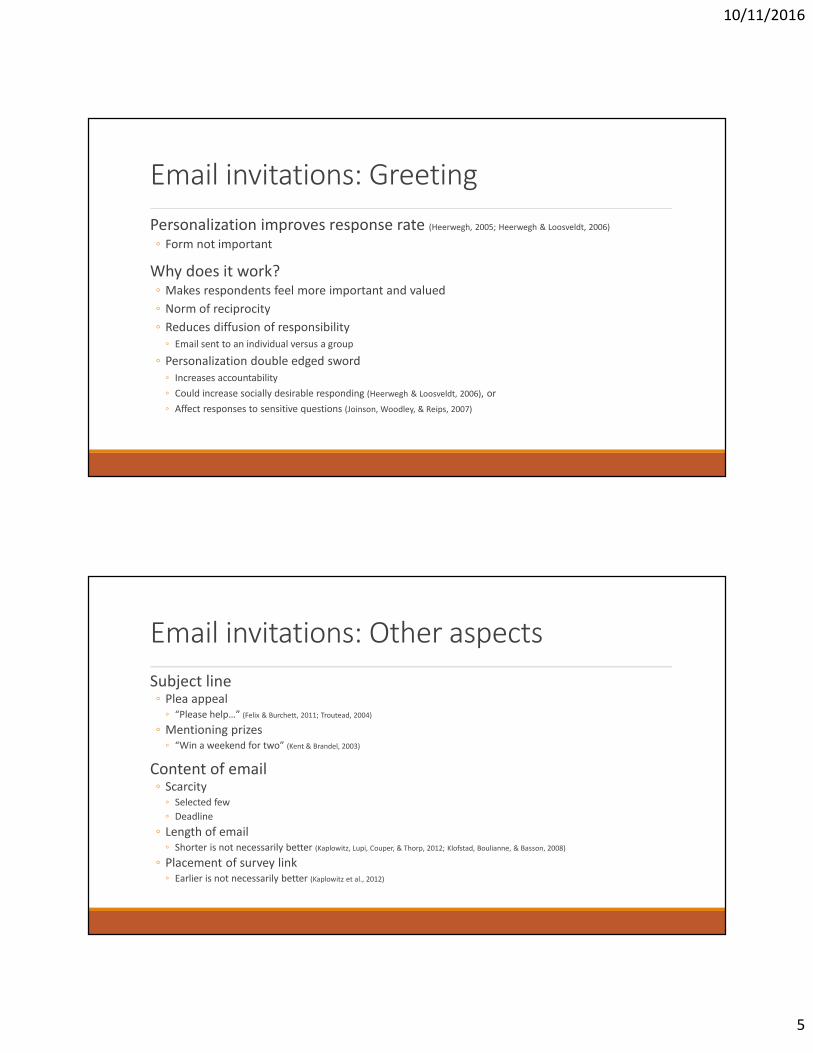
Email invitations: Other aspects
Effects depend on various factors◦ Source of survey
◦ Relationship with respondents
◦ Motivation of respondents
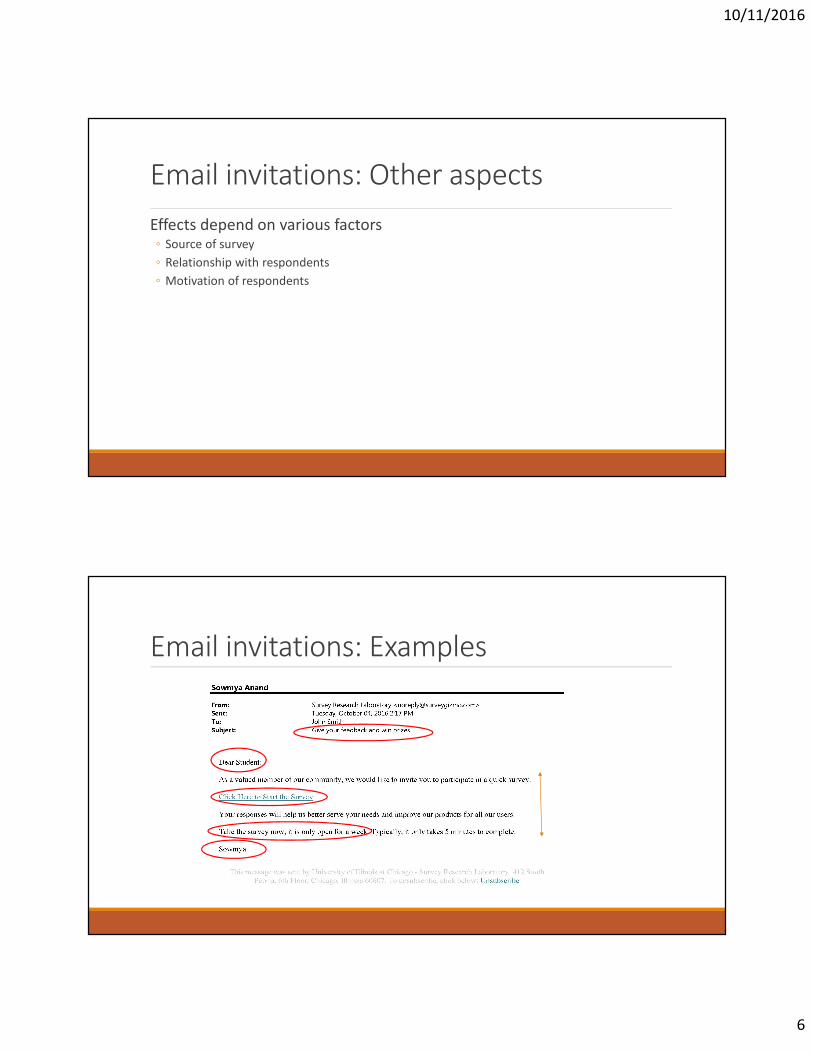
Email invitations: Examples
10/11/2016
7
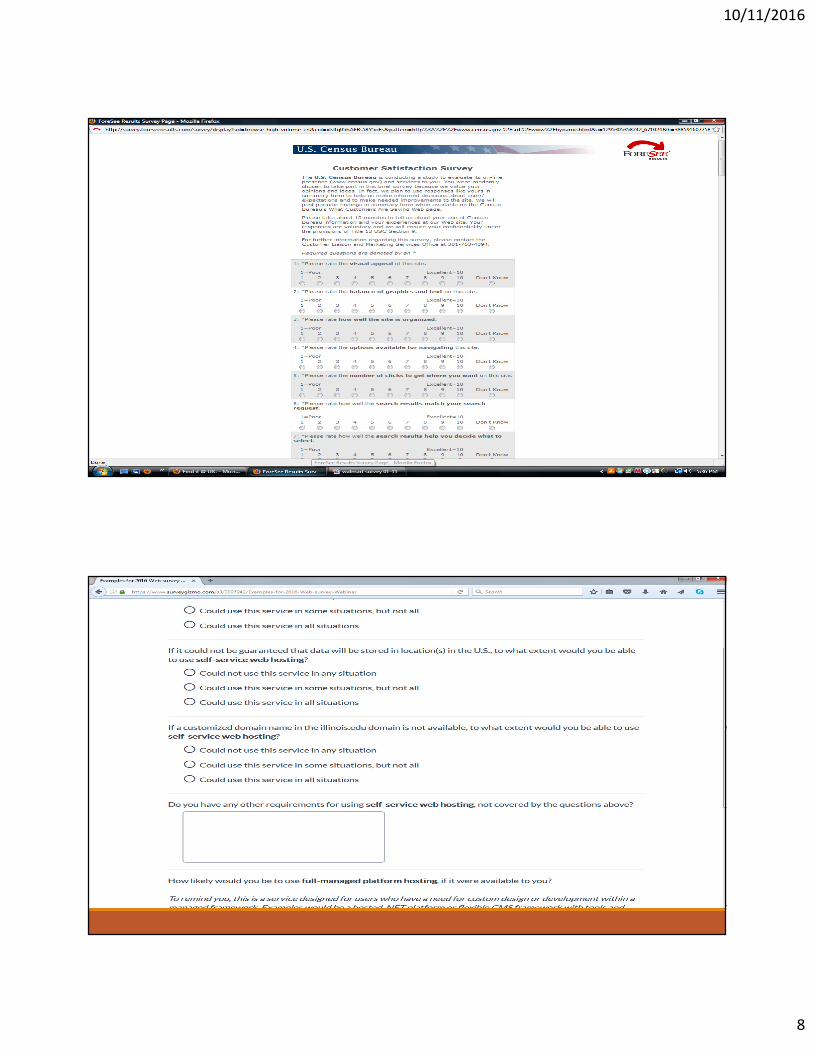
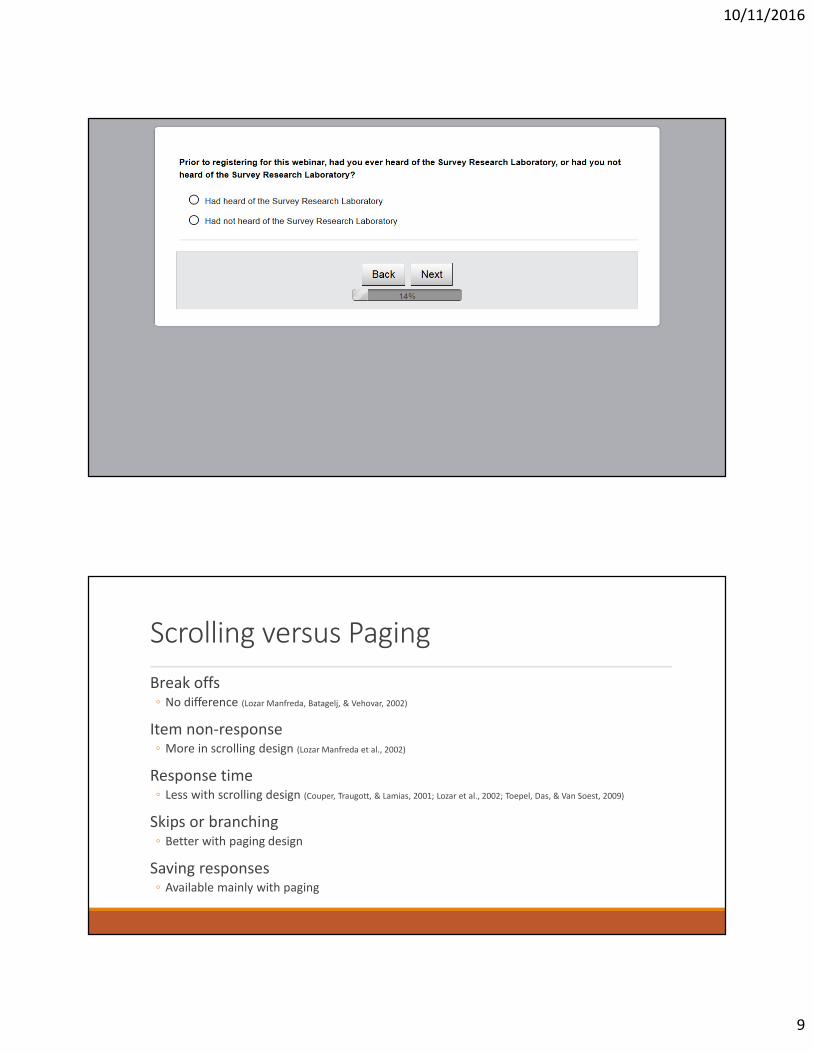
Scrolling versus Paging
10/11/2016
8
10/11/2016
9
Scrolling versus Paging
Break offs◦ No difference (Lozar Manfreda, Batagelj, & Vehovar, 2002)
Item non-response◦ More in scrolling design (Lozar Manfreda et al., 2002)
Response time◦ Less with scrolling design (Couper, Traugott, & Lamias, 2001; Lozar et al., 2002; Toepel, Das, & Van Soest, 2009)
Skips or branching◦ Better with paging design
Saving responses◦ Available mainly with paging
10/11/2016
10
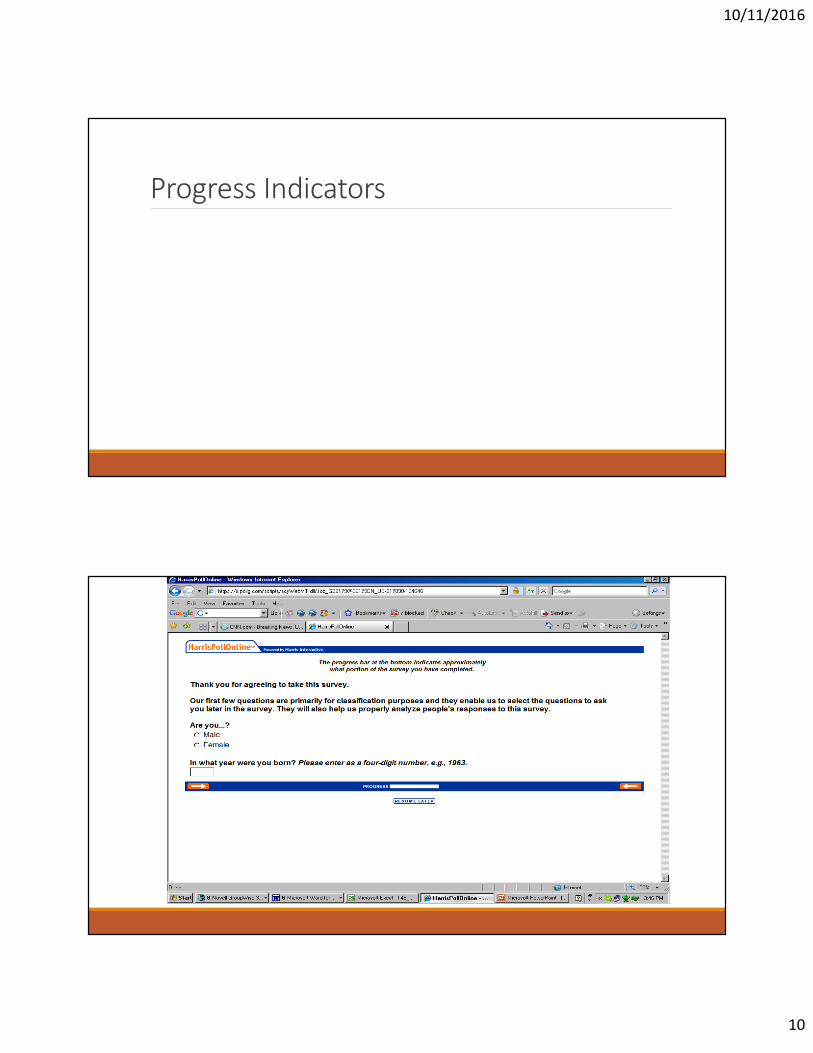
Progress Indicators
10/11/2016
11
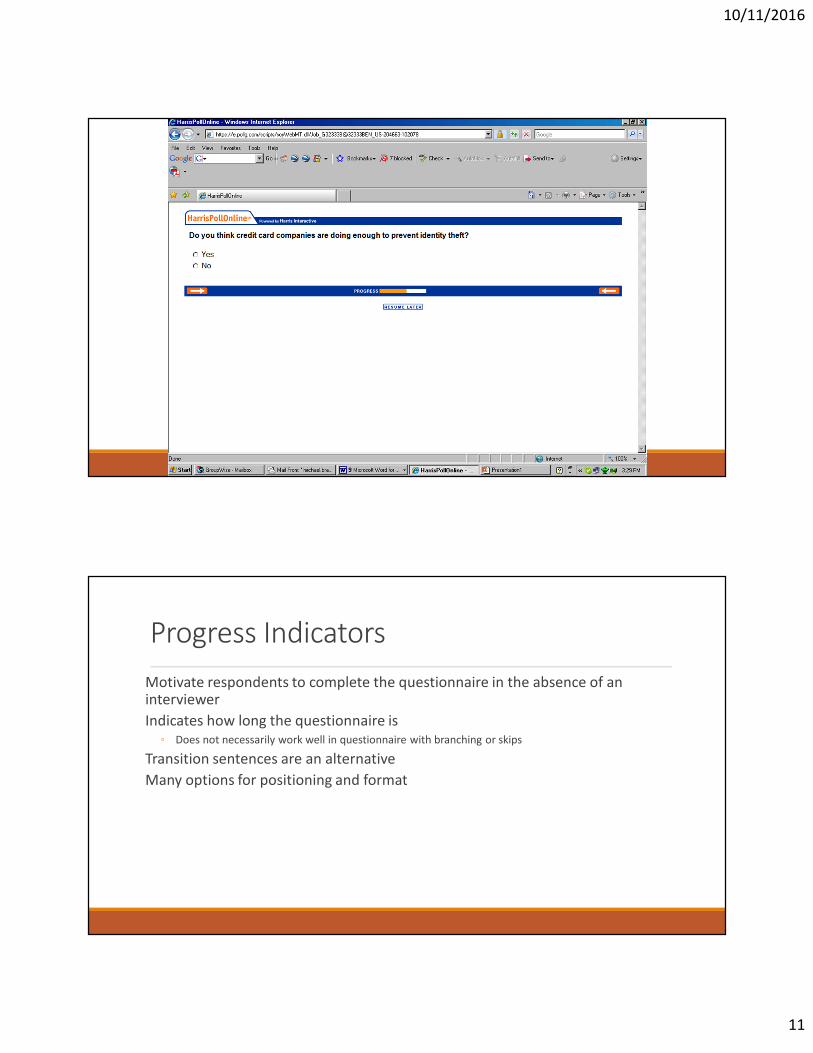
Progress Indicators
Motivate respondents to complete the questionnaire in the absence of an interviewer
Indicates how long the questionnaire is
◦ Does not necessarily work well in questionnaire with branching or skips
Transition sentences are an alternative
Many options for positioning and format
10/11/2016
12
Progress Indicators
Empirical evidence regarding effectiveness not clear• Respondents notice when it is not provided (Lozar Manfreda et al., 2002)
• More completed surveys with progress indicator (89.9%) than without (86.4%) (Couper et al.,
2001)
• No reduction in breakoff
• If anything, slight increase (Villar, Callegaro, & Yang, 2013)
Best used for• Short surveys
• With minimal branching or skips
• That move at a fairly consistent pace
Open ended questions
10/11/2016
13
10/11/2016
14
10/11/2016
15
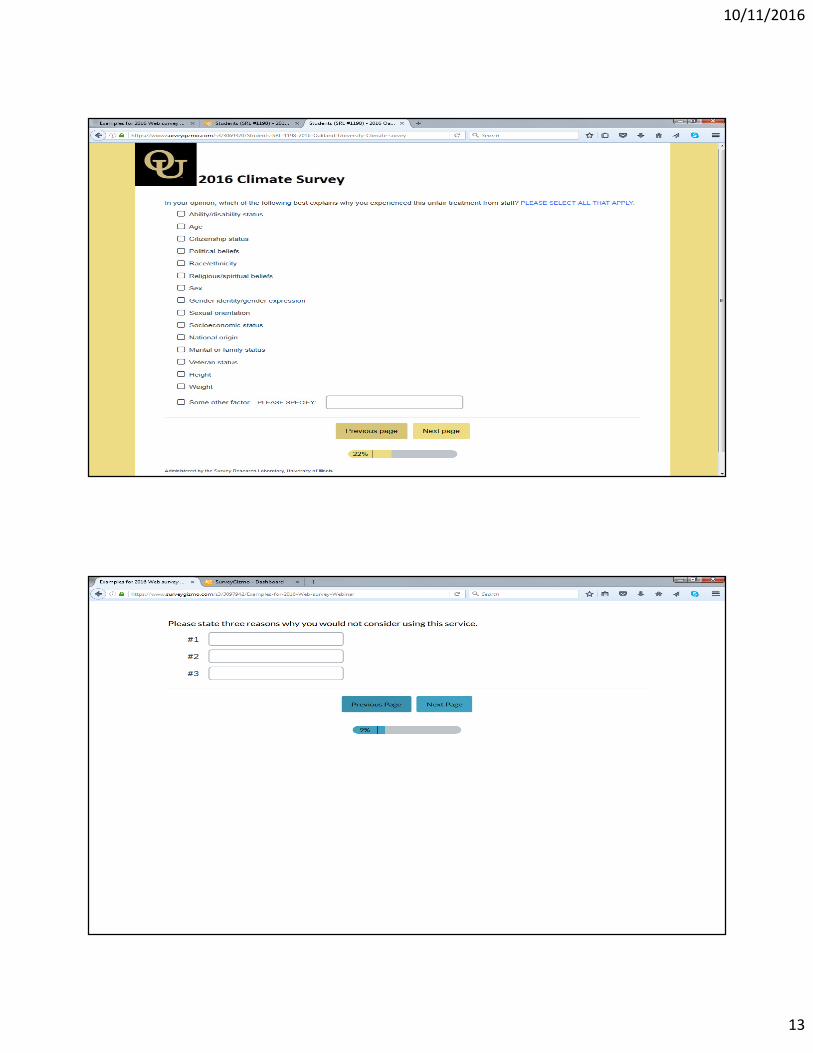
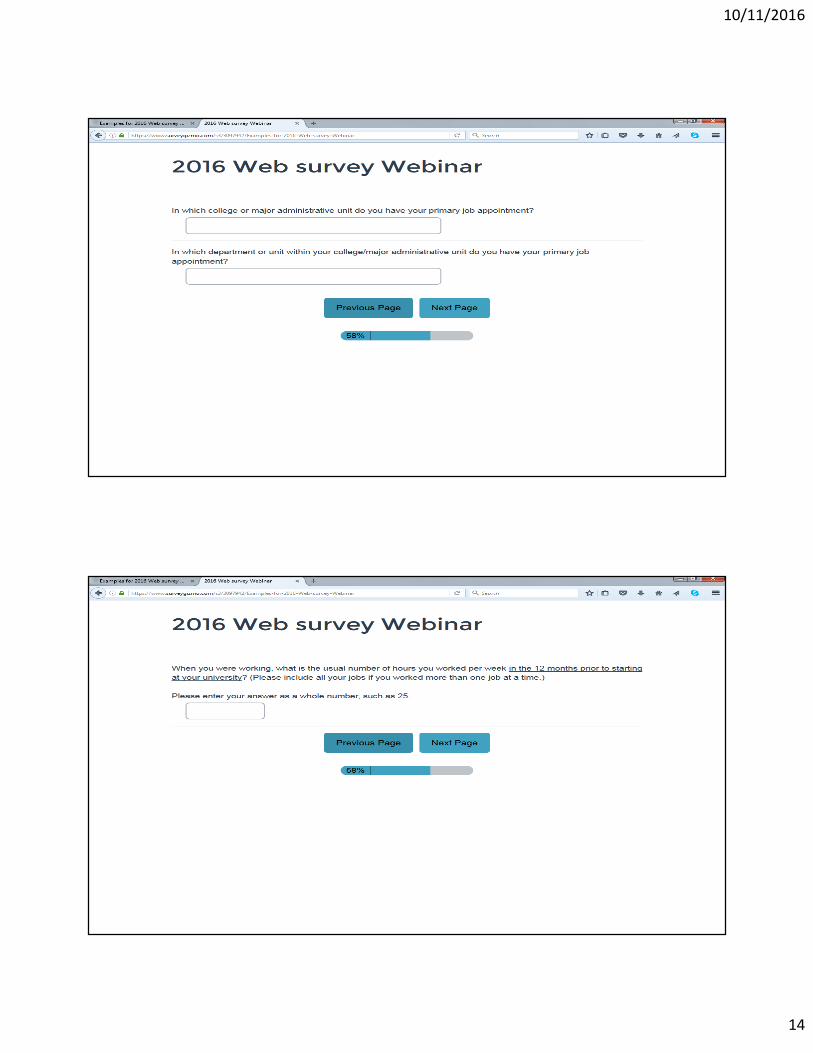
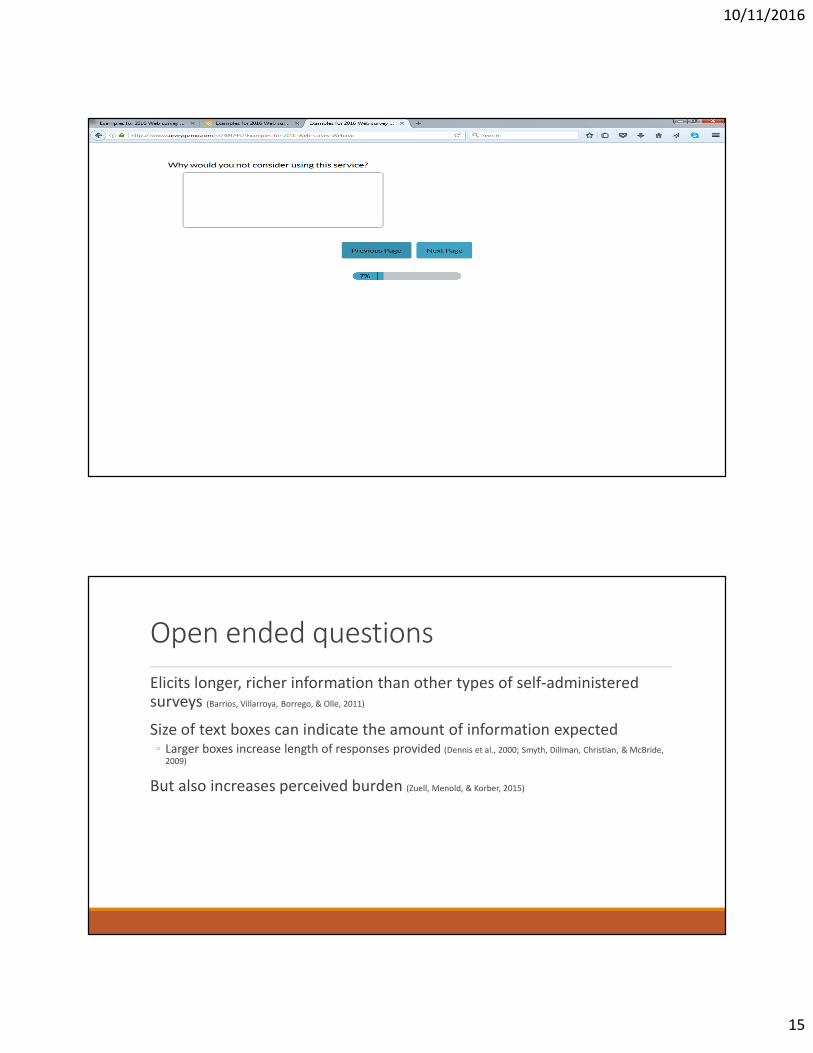
Open ended questions
Elicits longer, richer information than other types of self-administered surveys (Barrios, Villarroya, Borrego, & Olle, 2011)
Size of text boxes can indicate the amount of information expected◦ Larger boxes increase length of responses provided (Dennis et al., 2000; Smyth, Dillman, Christian, & McBride,
2009)
But also increases perceived burden (Zuell, Menold, & Korber, 2015)
10/11/2016
16
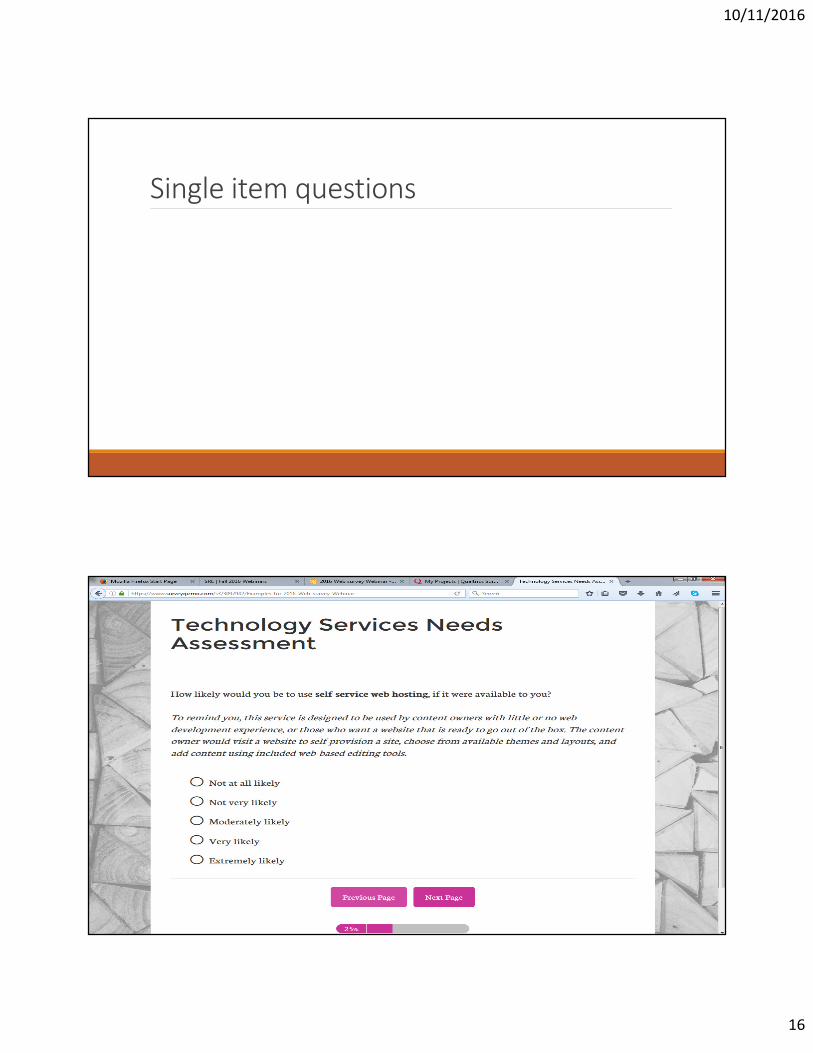
Single item questions
10/11/2016
17
10/11/2016
18
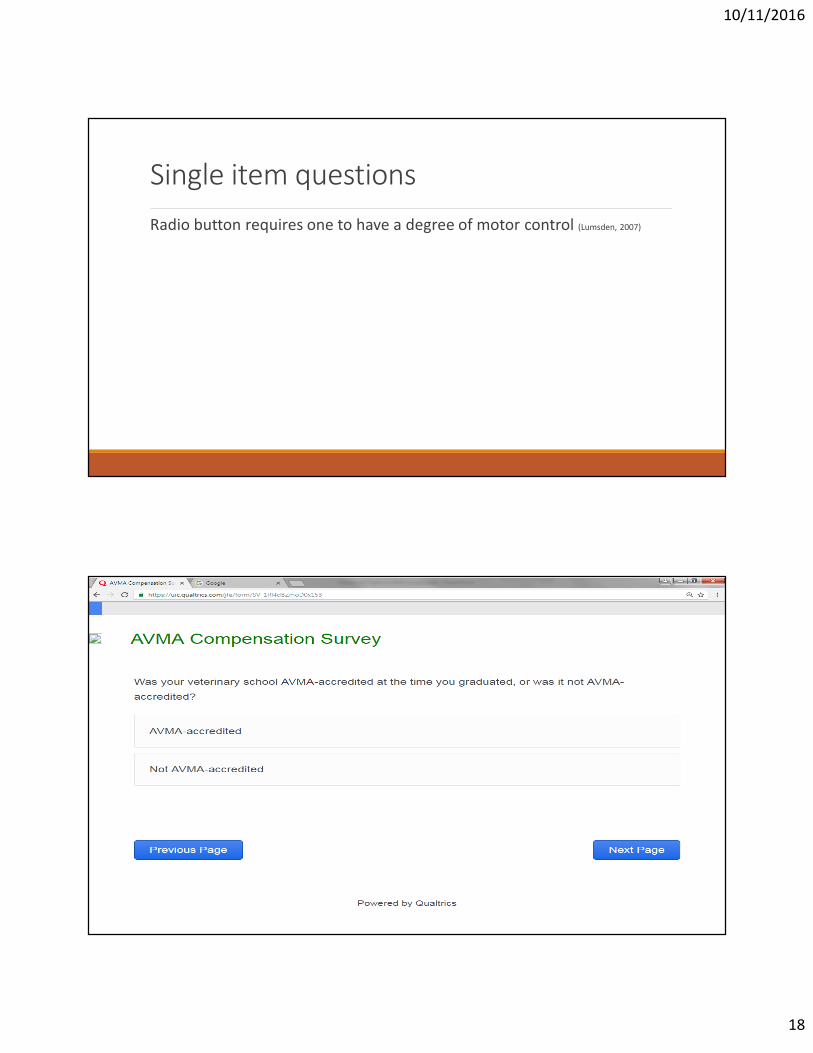
Single item questions
Radio button requires one to have a degree of motor control (Lumsden, 2007)
10/11/2016
19
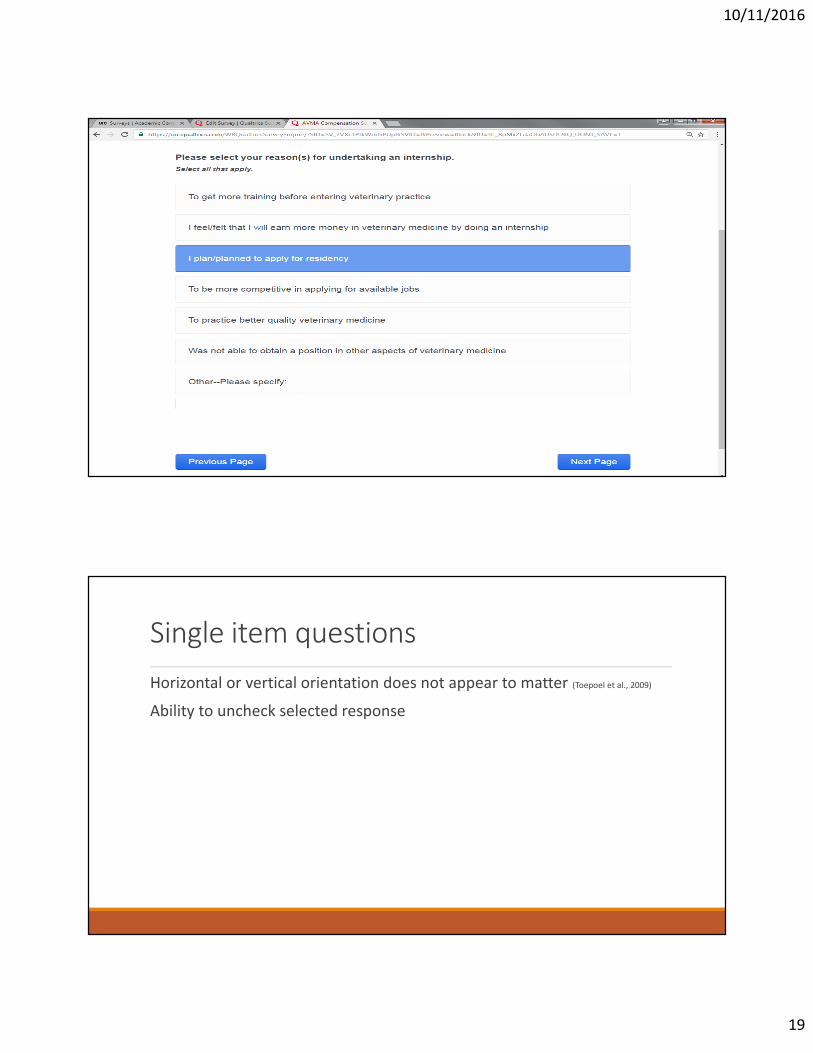
Single item questions
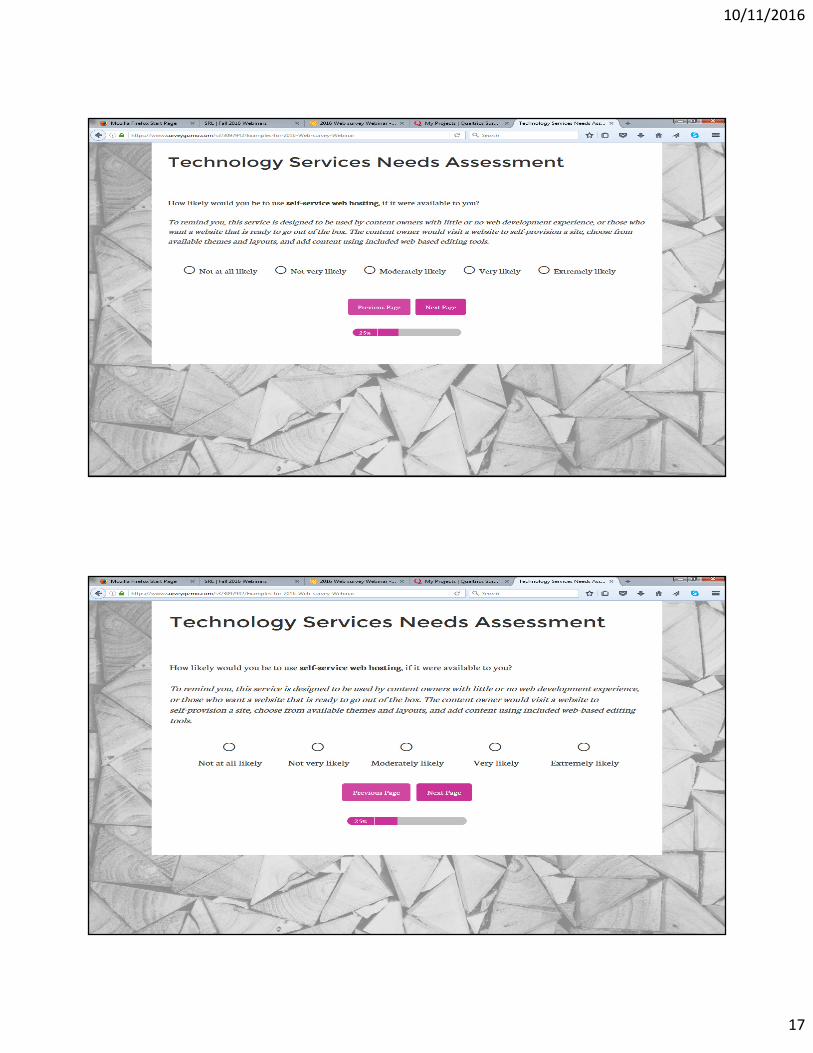
Horizontal or vertical orientation does not appear to matter (Toepoel et al., 2009)
Ability to uncheck selected response
10/11/2016
20
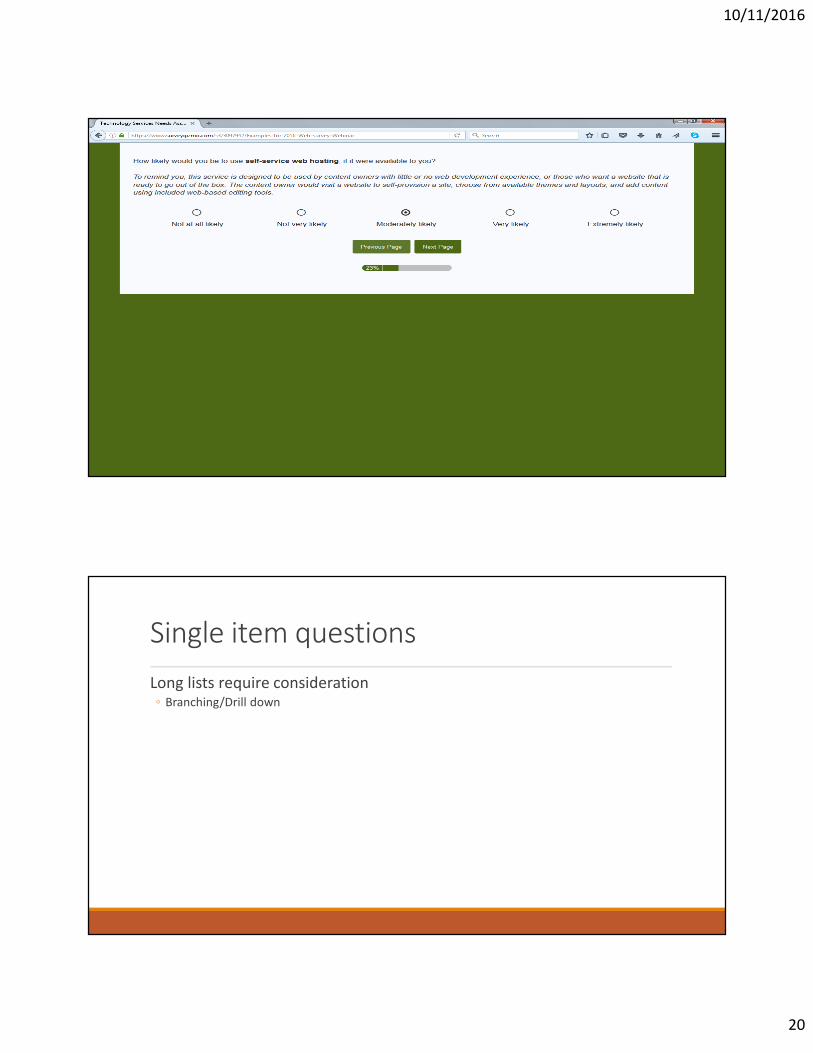
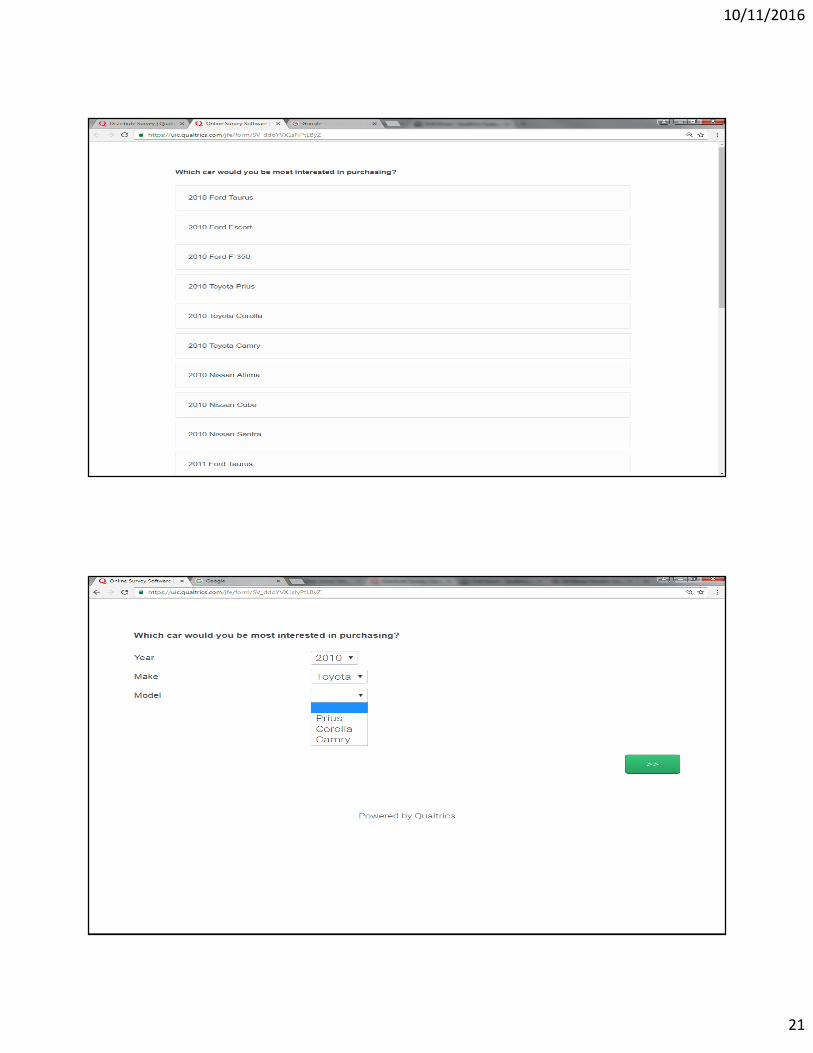
Single item questions
Long lists require consideration◦ Branching/Drill down
10/11/2016
21
10/11/2016
22
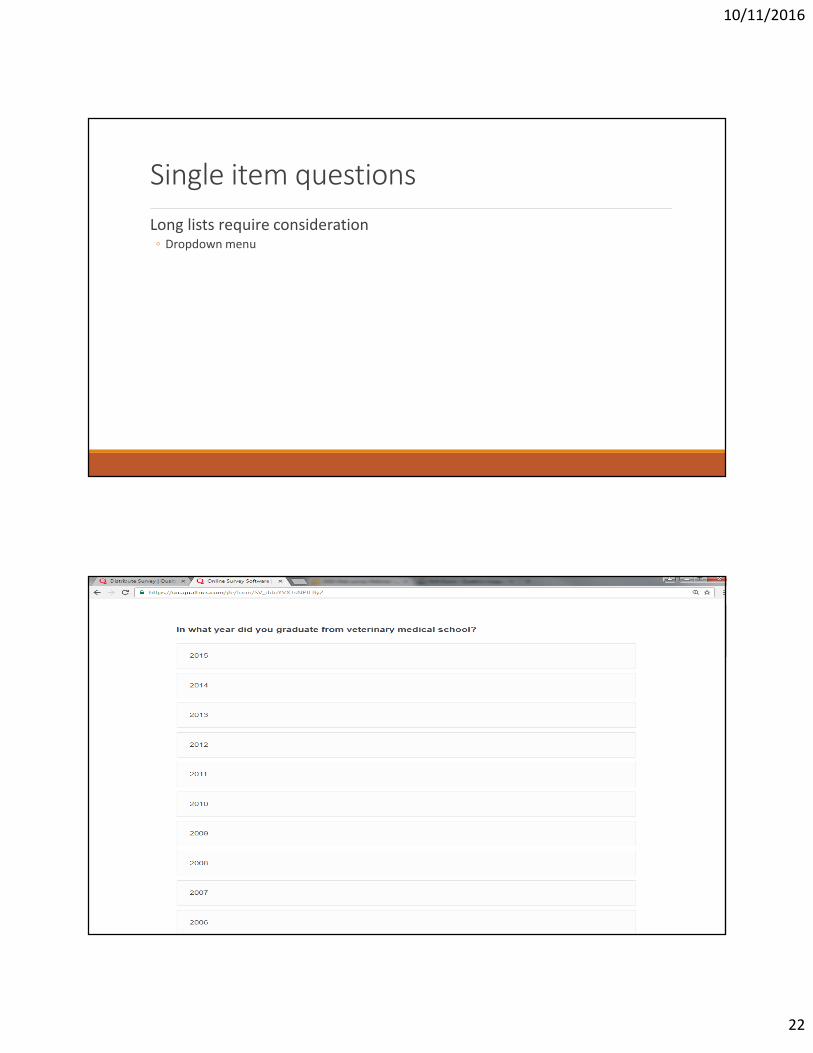
Single item questions
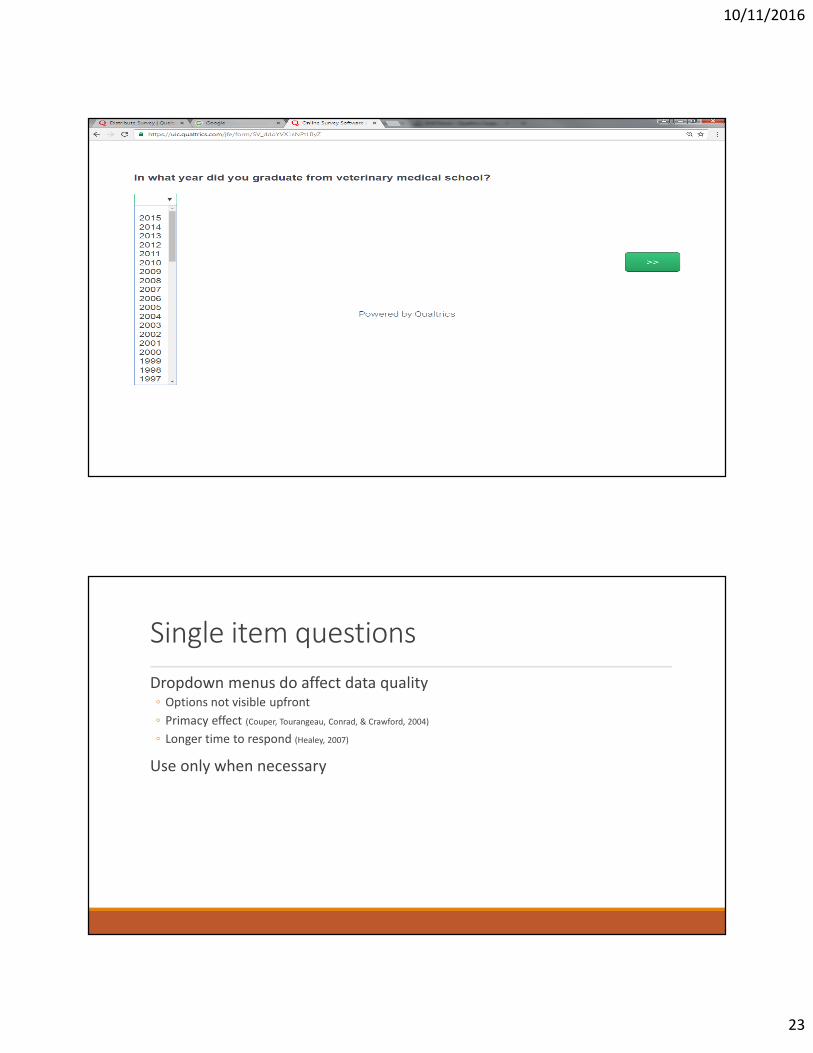
Long lists require consideration◦ Dropdown menu
10/11/2016
23
Single item questions
Dropdown menus do affect data quality◦ Options not visible upfront
◦ Primacy effect (Couper, Tourangeau, Conrad, & Crawford, 2004)
◦ Longer time to respond (Healey, 2007)
Use only when necessary
10/11/2016
24
Single item questions
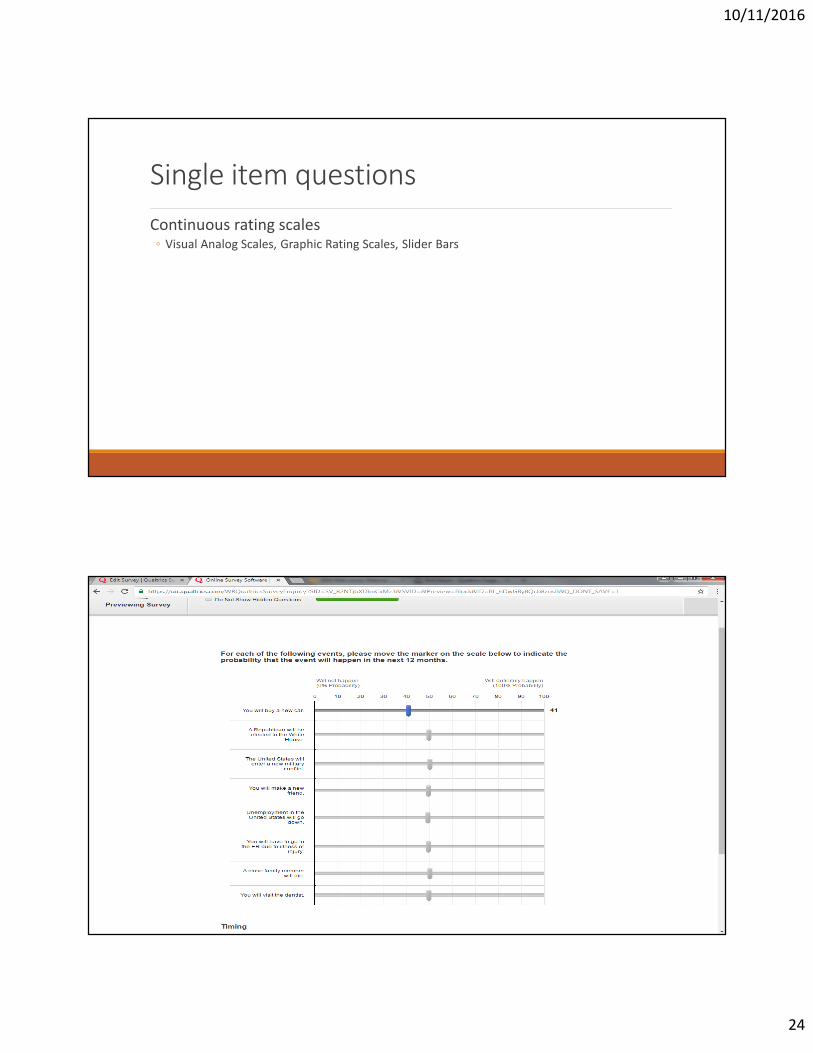
Continuous rating scales◦ Visual Analog Scales, Graphic Rating Scales, Slider Bars
10/11/2016
25
Single item questions
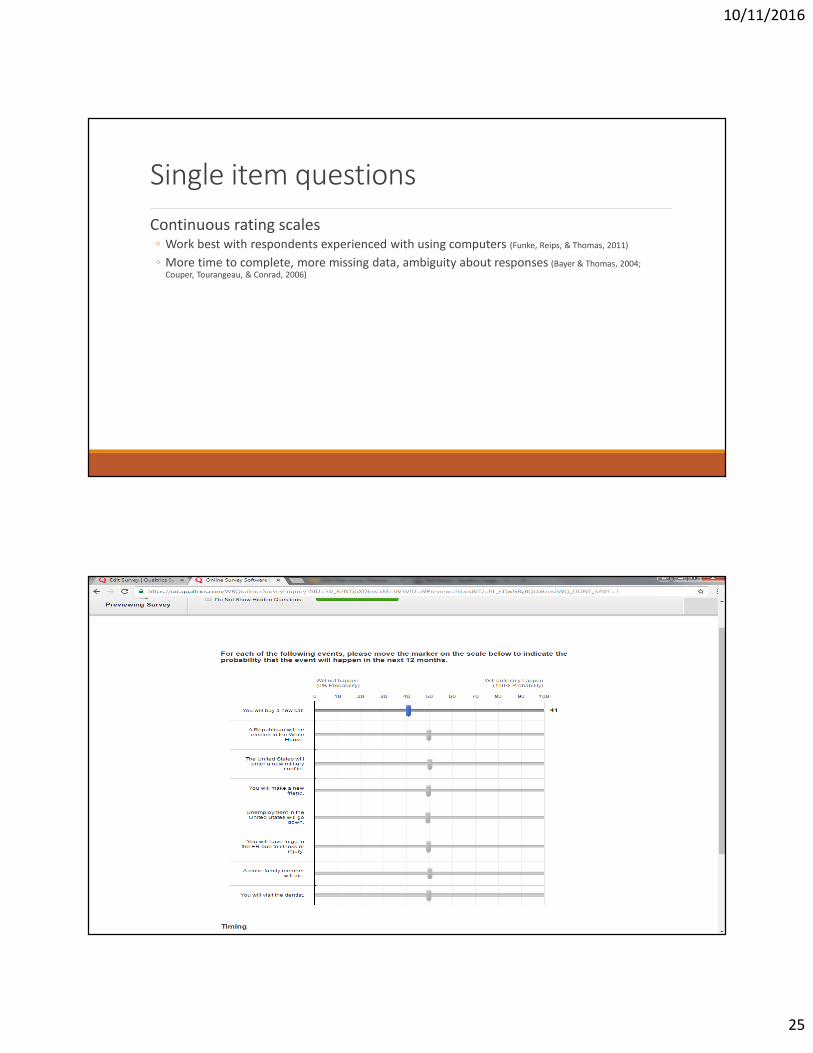
Continuous rating scales◦ Work best with respondents experienced with using computers (Funke, Reips, & Thomas, 2011)
◦ More time to complete, more missing data, ambiguity about responses (Bayer & Thomas, 2004;
Couper, Tourangeau, & Conrad, 2006)
10/11/2016
26
Single item questions
Continuous rating scales◦ More disadvantages than advantages
Multiple item questions
Tables or grids◦ Many items on a single screen
10/11/2016
27
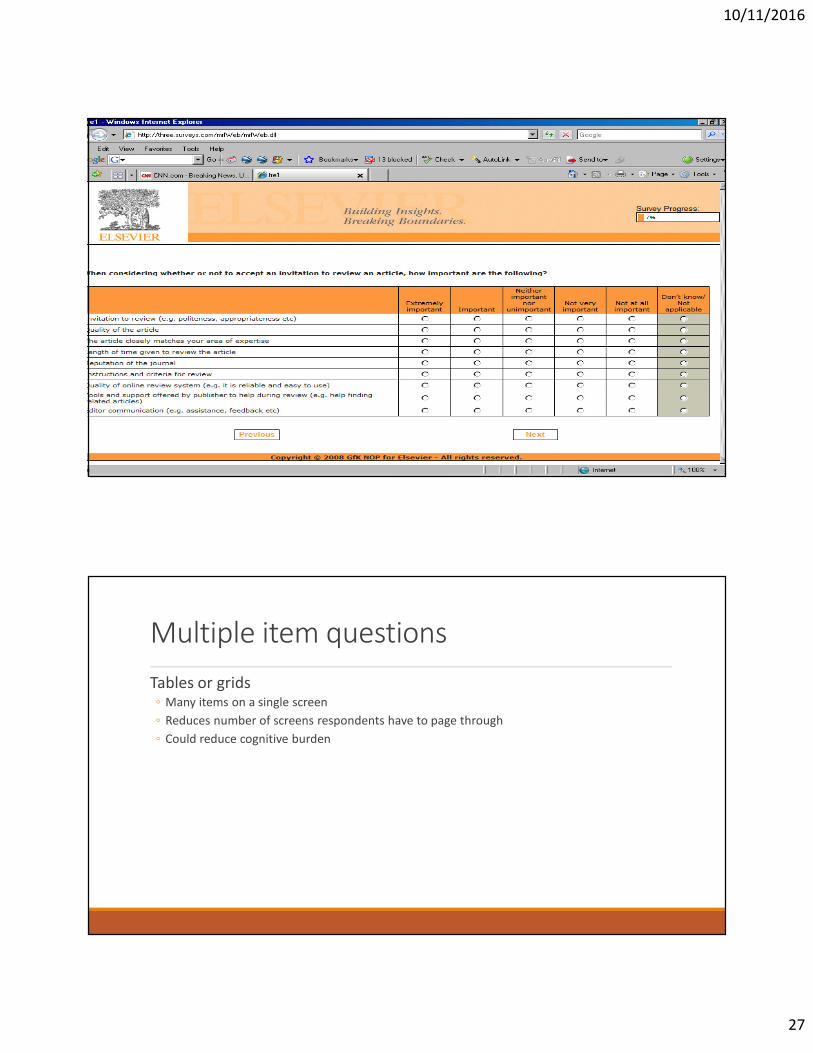
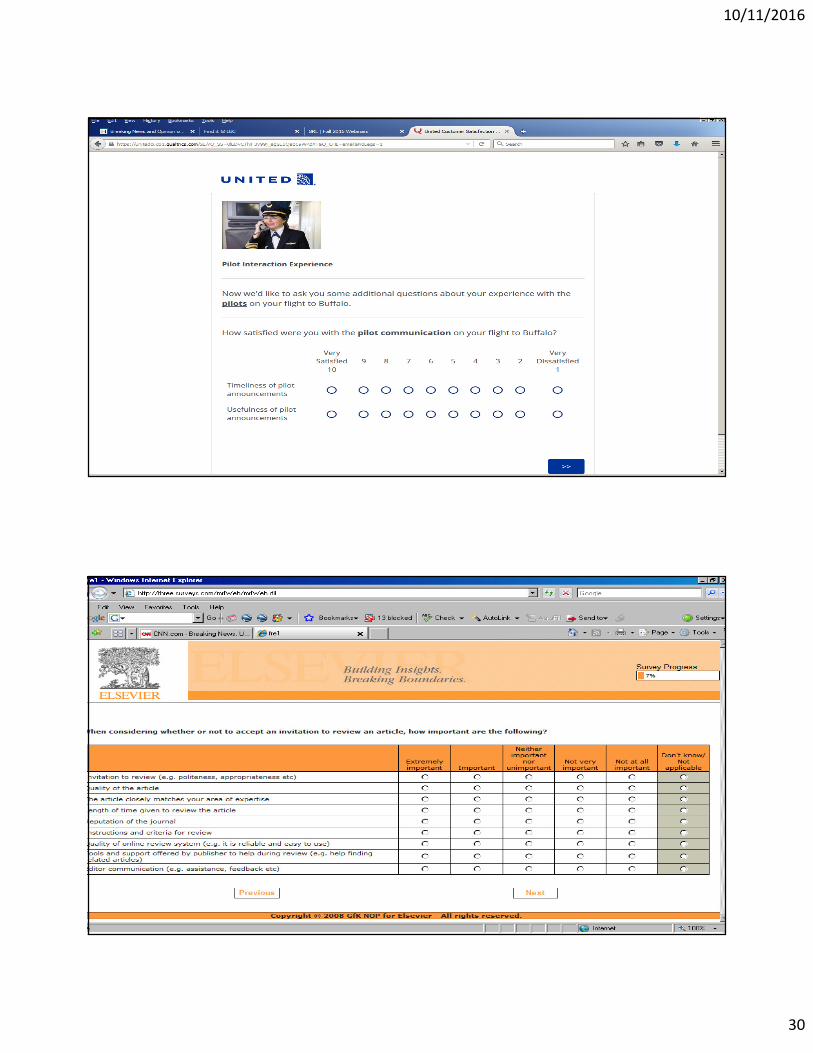
Multiple item questions
Tables or grids◦ Many items on a single screen
◦ Reduces number of screens respondents have to page through
◦ Could reduce cognitive burden
10/11/2016
28
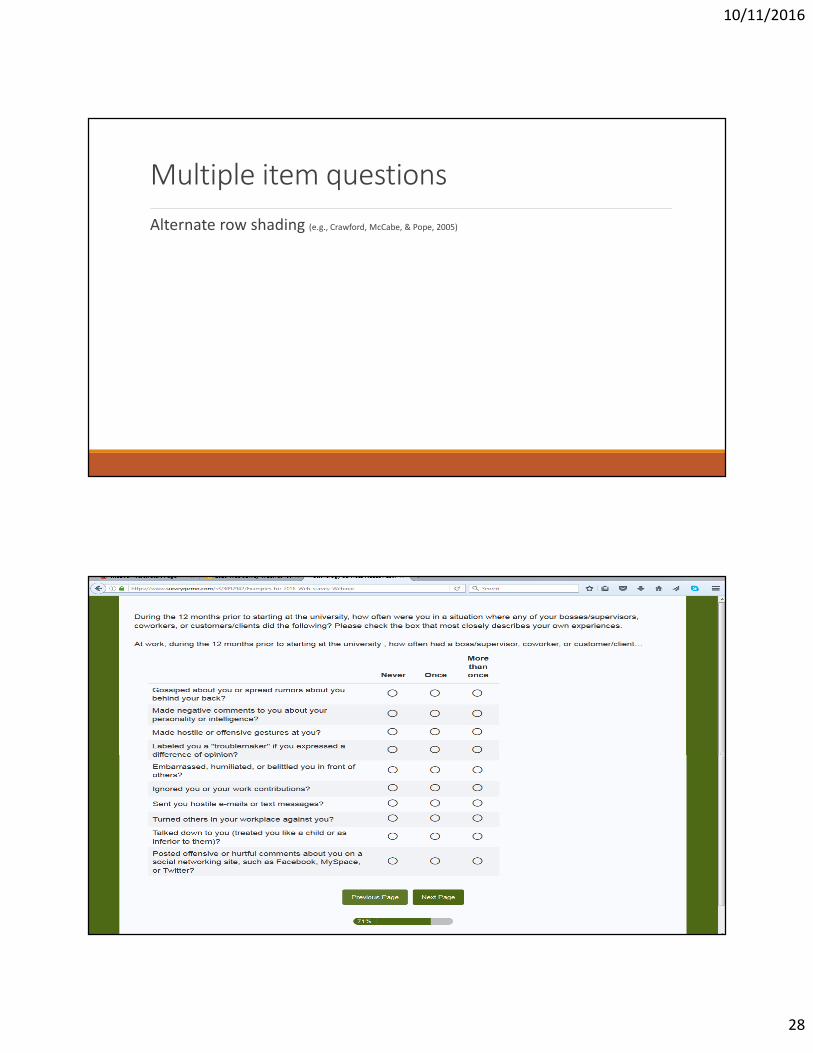
Multiple item questions
Alternate row shading (e.g., Crawford, McCabe, & Pope, 2005)
10/11/2016
29
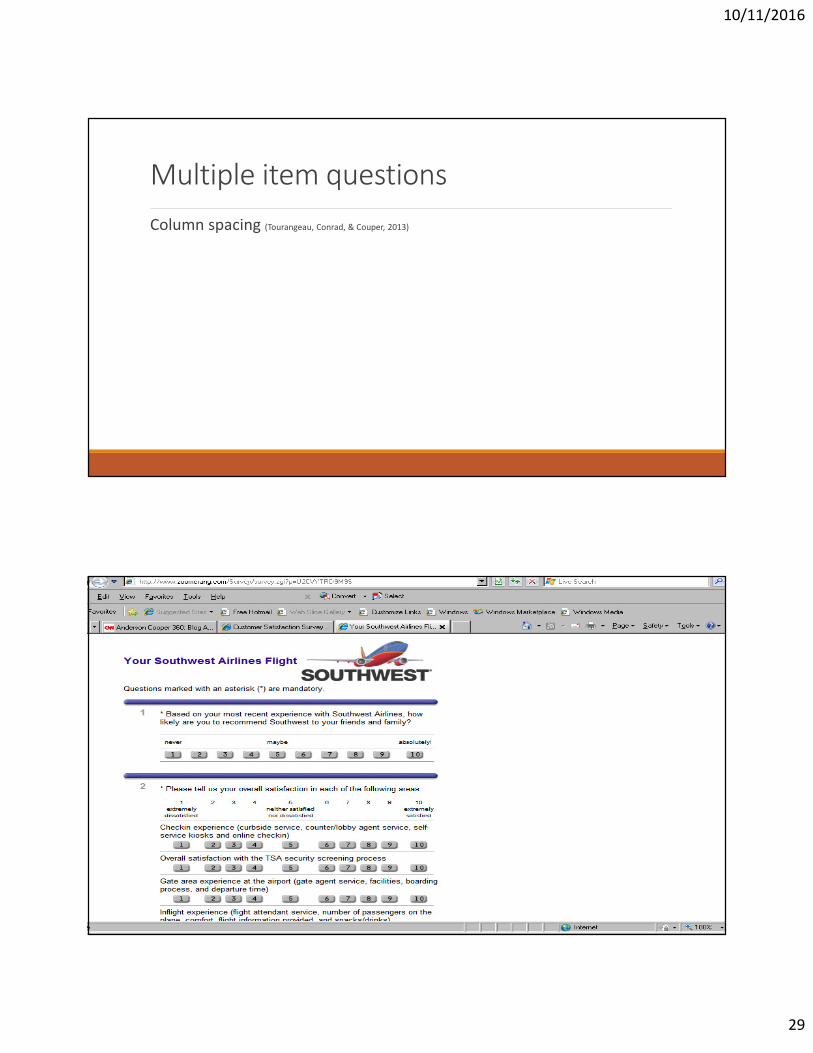
Multiple item questions
Column spacing (Tourangeau, Conrad, & Couper, 2013)
10/11/2016
30
10/11/2016
31
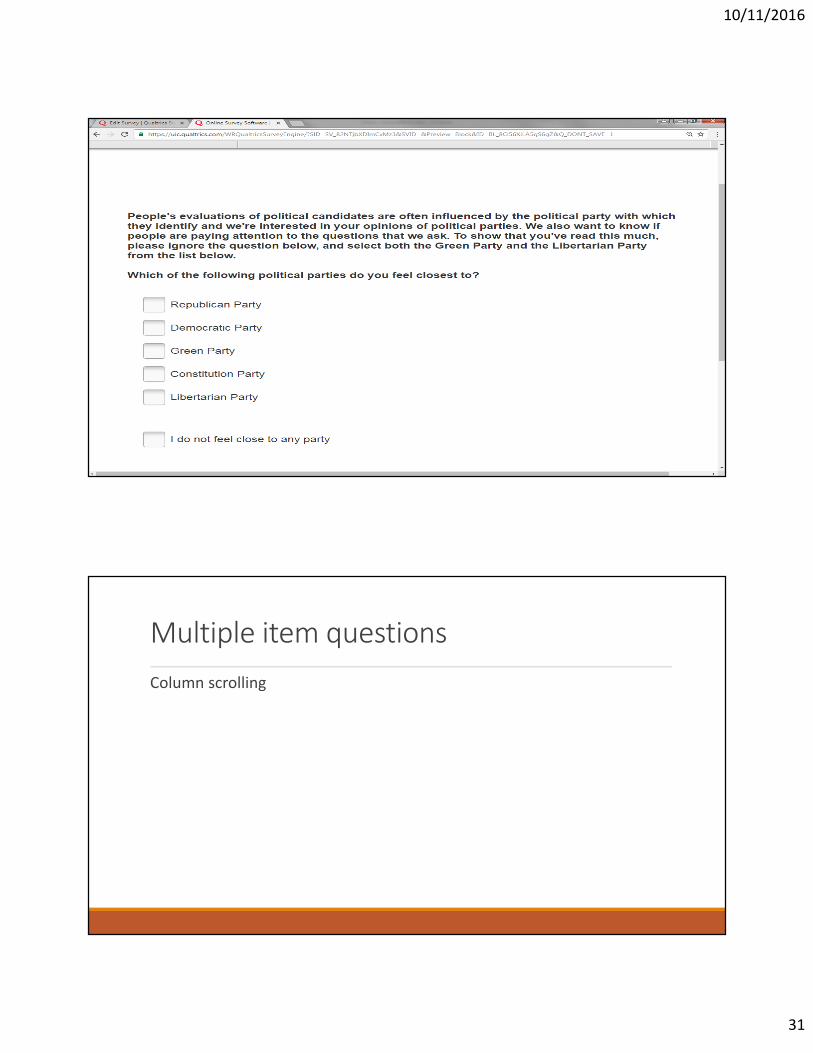
Multiple item questions
Column scrolling
10/11/2016
32
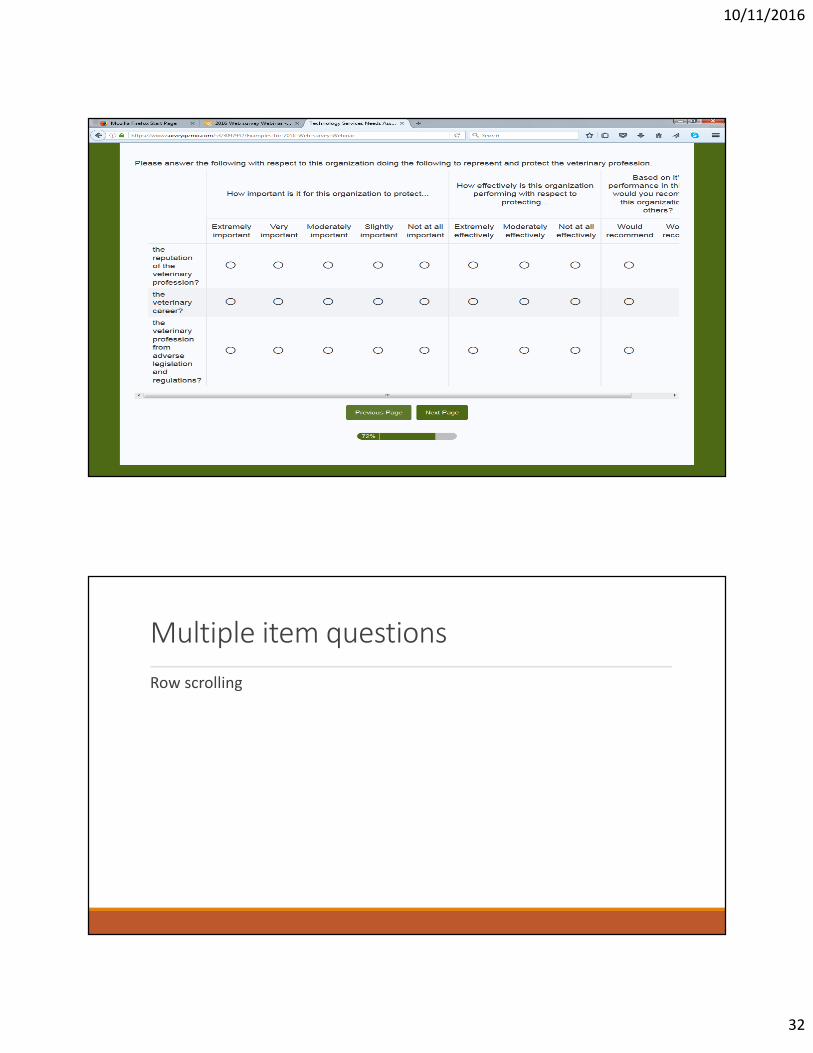
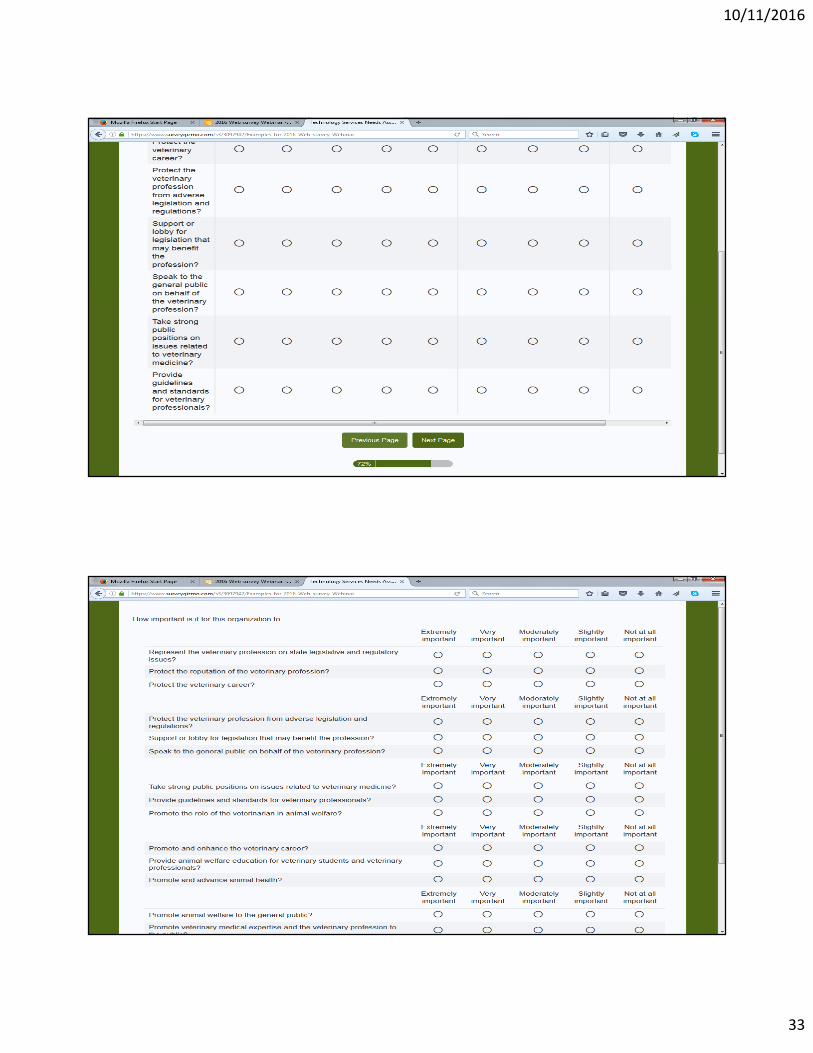
Multiple item questions
Row scrolling
10/11/2016
33
10/11/2016
34
Multiple item questions
Various disadvantages of using grids/matrices◦ More complex matrices increase respondent burden (e.g., Fricker, Galesic, Tourangeau, & Yan, 2005)
◦ Missing responses to items increase (e.g., Lozar Manfreda et al., 2002)
◦ Potential breakoff point (e.g., Henning, 2011)
Minimize use◦ Avoid complex tables
Other issues
•White or off-white backgrounds seem to work best• Background colors can create contrast & reading problems
• Black-on-white web pages seen as being more ‘professional’ than white-on-black web pages
• Couper (2008) prefers light blue backgrounds
•Do not overuse color but use it consistently• Use red only for emergency messages
• Red-green distinctions a problem with persons who are color-blind
• 10% of males are color blind
• 99% of color blind persons cannot distinguish green & red
10/11/2016
35
10/11/2016
36
Other issues
Top and left positions are interpreted as more positive or more frequent◦ Respondents expect rating scale to start at positive end
◦ Items at top of screen evaluated more favorably (Tourangeau, Couper, & Conrad, 2013)
Other issues
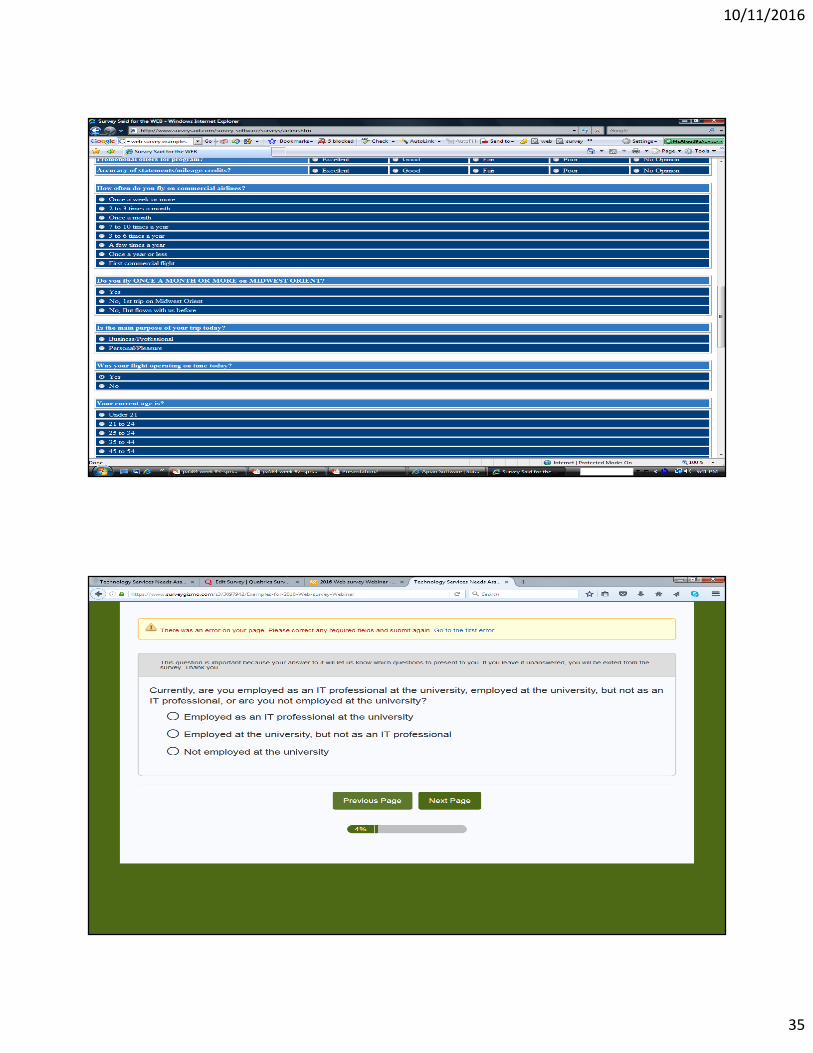
Never force respondents to answer a question◦ Adds to frustration
◦ IRB implications
◦ No other questionnaire formats ‘force’ answers
10/11/2016
37
Some final thoughts
A lot of research conducted about visual design for Web surveys◦ But also tremendous opportunity for research in this area
Keep in mind principles of ◦ Minimizing cognitive burden
◦ Minimizing task difficulty
◦ Using visual design to motivate respondents to keep progressing through questionnaire
References
Callegaro, M., Manfreda, K. l., & Vehovar, V. (2015). Web survey
methodology. Sage.
Tourangeau, R., Conrad, F. G., & Couper, M. P. (2013). The science of web
surveys. Oxford University Press.