Embed Size (px)
Citation preview

ADVANCED SUBSIDIARY GCE UNIT G241/01MEI STATISTICS
Statistics 1 (Z1)
TUESDAY 5 JUNE 2007 Afternoon
Time: 1 hour 30 minutesAdditional Materials:
Answer booklet (8 pages)Graph paperMEI Examination Formulae and Tables (MF2)
INSTRUCTIONS TO CANDIDATES
• Write your name, centre number and candidate number in the spaces provided on the answer booklet.
• Answer all the questions.
• You are permitted to use a graphical calculator in this paper.
• Final answers should be given to a degree of accuracy appropriate to the context.
INFORMATION FOR CANDIDATES
• The number of marks is given in brackets [ ] at the end of each question or part question.
• The total number of marks for this paper is 72.
ADVICE TO CANDIDATES
• Read each question carefully and make sure you know what you have to do before starting your answer.
• You are advised that an answer may receive no marks unless you show sufficient detail of the working toindicate that a correct method is being used.
This document consists of 7 printed pages and 1 blank page.
© OCR 2007 [A/100/3618] OCR is an exempt Charity [Turn over

2
Section A (36 marks)
1 A girl is choosing tracks from an album to play at her birthday party. The album has 8 tracks and sheselects 4 of them.
(i) In how many ways can she select the 4 tracks? [2]
(ii) In how many different orders can she arrange the 4 tracks once she has chosen them? [1]
2 The histogram shows the amount of money, in pounds, spent by the customers at a supermarket on aparticular day.
(i) Express the data in the form of a grouped frequency table. [2]
(ii) Use your table to estimate the total amount of money spent by customers on that day. [2]
3 The marks x scored by a sample of 56 students in an examination are summarised by
n = 56, Σ x = 3026, Σ x2 = 178 890.
(i) Calculate the mean and standard deviation of the marks. [3]
(ii) The highest mark scored by any of the 56 students in the examination was 93. Show that thisresult may be considered to be an outlier. [2]
(iii) The formula y = 1.2x − 10 is used to scale the marks. Find the mean and standard deviation ofthe scaled marks. [3]
© OCR 2007 G241/01 Jun07
3
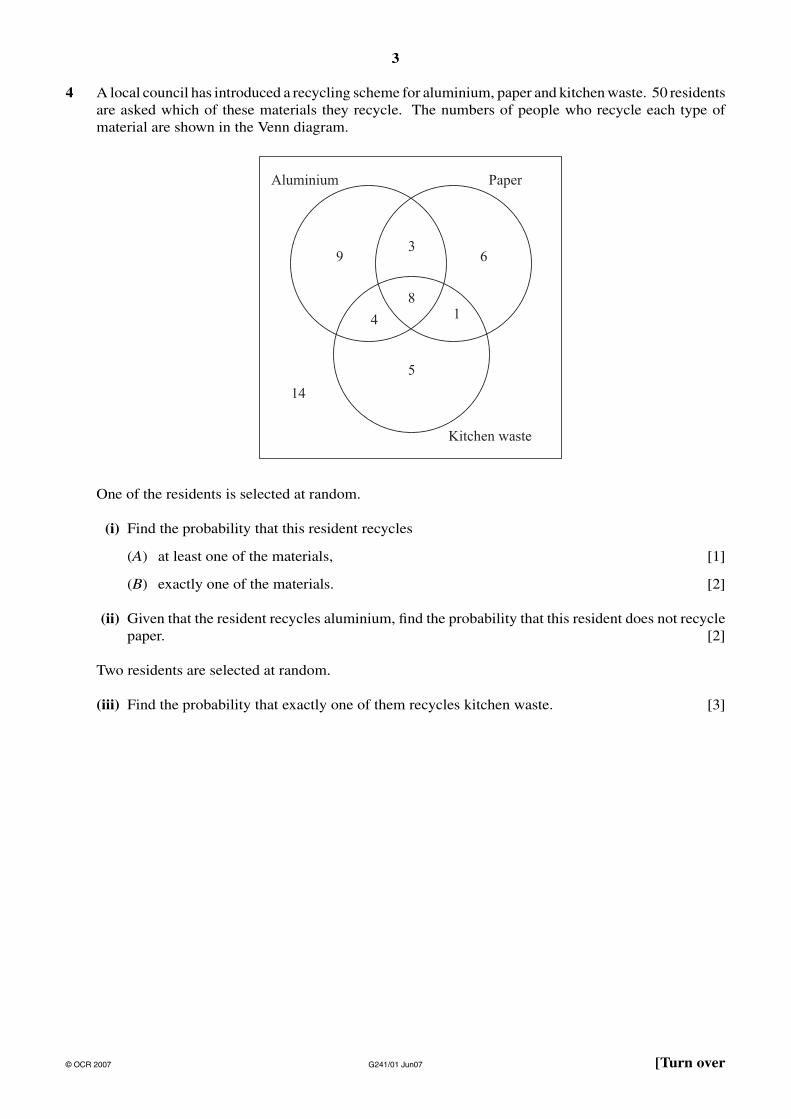
4 A local council has introduced a recycling scheme for aluminium, paper and kitchen waste. 50 residentsare asked which of these materials they recycle. The numbers of people who recycle each type ofmaterial are shown in the Venn diagram.
One of the residents is selected at random.
(i) Find the probability that this resident recycles
(A) at least one of the materials, [1]
(B) exactly one of the materials. [2]
(ii) Given that the resident recycles aluminium, find the probability that this resident does not recyclepaper. [2]
Two residents are selected at random.
(iii) Find the probability that exactly one of them recycles kitchen waste. [3]
© OCR 2007 G241/01 Jun07 [Turn over

4
5 A GCSE geography student is investigating a claim that global warming is causing summers in Britainto have more rainfall. He collects rainfall data from a local weather station for 2001 and 2006. Thevertical line chart shows the number of days per week on which some rainfall was recorded during the22 weeks of summer 2001.
(i) Show that the median of the data is 4, and find the interquartile range. [3]
(ii) For summer 2006 the median is 3 and the interquartile range is also 3. The student concludesthat the data demonstrate that global warming is causing summer rainfall to decrease rather thanincrease. Is this a valid conclusion from the data? Give two brief reasons to justify your answer.
[3]
6 In a phone-in competition run by a local radio station, listeners are given the names of 7 localpersonalities and are told that 4 of them are in the studio. Competitors phone in and guess which 4are in the studio.
(i) Show that the probability that a randomly selected competitor guesses all 4 correctly is 135
. [2]
Let X represent the number of correct guesses made by a randomly selected competitor. The probabilitydistribution of X is shown in the table.
r 0 1 2 3 4
P(X = r) 0 435
1835
1235
135
(ii) Find the expectation and variance of X. [5]
© OCR 2007 G241/01 Jun07

5
Section B (36 marks)
7 A screening test for a particular disease is applied to everyone in a large population. The test classifiespeople into three groups: ‘positive’, ‘doubtful’ and ‘negative’. Of the population, 3% is classified aspositive, 6% as doubtful and the rest negative.
In fact, of the people who test positive, only 95% have the disease. Of the people who test doubtful,10% have the disease. Of the people who test negative, 1% actually have the disease.
People who do not have the disease are described as ‘clear’.
(i) Copy and complete the tree diagram to show this information. [4]
(ii) Find the probability that a randomly selected person tests negative and is clear. [2]
(iii) Find the probability that a randomly selected person has the disease. [3]
(iv) Find the probability that a randomly selected person tests negative given that the person has thedisease. [3]
(v) Comment briefly on what your answer to part (iv) indicates about the effectiveness of the screeningtest. [2]
Once the test has been carried out, those people who test doubtful are given a detailed medicalexamination. If a person has the disease the examination will correctly identify this in 98% of cases.If a person is clear, the examination will always correctly identify this.
(vi) A person is selected at random. Find the probability that this person either tests negative originallyor tests doubtful and is then cleared in the detailed medical examination. [4]
© OCR 2007 G241/01 Jun07 [Turn over

6
8 A multinational accountancy firm receives a large number of job applications from graduates eachyear. On average 20% of applicants are successful.
A researcher in the human resources department of the firm selects a random sample of 17 graduateapplicants.
(i) Find the probability that at least 4 of the 17 applicants are successful. [3]
(ii) Find the expected number of successful applicants in the sample. [2]
(iii) Find the most likely number of successful applicants in the sample, justifying your answer. [3]
It is suggested that mathematics graduates are more likely to be successful than those from other fields.In order to test this suggestion, the researcher decides to select a new random sample of 17 mathematicsgraduate applicants. The researcher then carries out a hypothesis test at the 5% significance level.
(iv) (A) Write down suitable null and alternative hypotheses for the test.
(B) Give a reason for your choice of the alternative hypothesis. [4]
(v) Find the critical region for the test at the 5% level, showing all of your calculations. [4]
(vi) Explain why the critical region found in part (v) would be unaltered if a 10% significance levelwere used. [2]
© OCR 2007 G241/01 Jun07

Q1 (i) 84⎛ ⎞⎜ ⎟⎝ ⎠
ways to select = 70
M1 for 84⎛ ⎞⎜ ⎟⎝ ⎠
A1 CAO
2
(ii) 4! = 24
B1 CAO
1
TOTAL 3
Q2 (i)
Amount 0- <20 20- <50 50- <100 100- <200
Frequency 800 480 400 200
B1 for amounts B1 for frequencies
2
(ii) Total ≈ 10 800 35 480 75 400 150 200 £84800× + × + × + × =
M1 for their midpoints × their frequencies A1 CAO
2
TOTAL 4
Q3 (i) Mean =
302656
= 54.0
Sxx = 23026178890
56− = 15378
s = 15378
55= 16.7
B1 for mean
M1 for attempt at Sxx
A1 CAO
3
(ii) x + 2s = 54.0 + 2×16.7 = 87.4 So 93 is an outlier
M1 for their x +2×their sA1 FT for 87.4 and comment
2
(iii) New mean = 1.2 ×54.0 – 10 = 54.8 New s = 1.2 ×16.7 = 20.1
B1 FT M1A1 FT
3
TOTAL 8 Q4 (i) (A) P(at least one) =
36 1850 25
= = 0.72
(B) P(exactly one) =9 6 5 20 2
50 50 5+ +
= = = 0.4
B1 aef M1 for (9+6+5)/50 A1 aef
3
(ii) P(not paper | aluminium) =
1324
M1 for denominator 24 or 24/50 or 0.48 A1 CAO
2
(iii) P(one kitchen waste) =
18 32 576250 49 1225
× × = = 0.470
M1 for both fractions M1 for 2 × product of both, or sum of 2 pairs A1
3
TOTAL 8

Q5 (i) 11th value is 4,12th value is 4 so median is 4
Interquartile range = 5 – 2 = 3
B1 M1 for either quartile A1 CAO
3 (ii) No, not valid
any two valid reasons such as : • the sample is only for two years, which may not be
representative • the data only refer to the local area, not the whole of
Britain • even if decreasing it may have nothing to do with global
warming • more days with rain does not imply more total rainfall • a five year timescale may not be enough to show a long
term trend
B1 E1 E1
3
TOTAL 6
Q6 (i)
74
4 3 2 1 1Either P(all 4 correct)7 6 5 4 35
1 1or P(all 4 correct)35C
= × × × =
= =
M1 for fractions, or 7C4 seen A1 NB answer given
2
(ii) E(X) =
4 18 12 1 80 21 2 3 4 2 2.35 35 35 35 35 7
× + × + × + × = = = 29
E(X2) = 4 18 12 1 2001 4 9 16 5.71435 35 35 35 35
× + × + × + × = =
Var(X) = 2200 80 24
35 35 49⎛ ⎞− =⎜ ⎟⎝ ⎠
= 0.490 (to 3 s.f.)
M1 for Σrp (at least 3 terms correct)
A1 CAO
M1 for Σ x2p (at least 3 terms correct) M1dep for – their E( X )² A1 FT their E(X) provided Var( X ) > 0
5
TOTAL 7

Section B Q7 (i)
Positive result
Doubtful result
Negative result
0.03
Has the disease
Clear
0.95
Has the disease
Clear
Has the disease
Clear
0.06
0.91
0.05
0.10
0.90
0.01
0.99
G1 probabilities of result G1 probabilities of disease G1 probabilities of clear G1 labels
4
(ii) P(negative and clear) = 0.91 × 0.99
= 0.9009
M1 for their 0.91 × 0.99
A1 CAO
2
(iii) P(has disease) = 0.03 × 0.95 + 0.06 × 0.10 + 0.91 × 0.01
= 0.0285 + 0.006 + 0.0091
= 0.0436
M1 three products M1dep sum of three products A1 FT their tree
3
(iv) P(negative | has disease)
= P(negative has disease) 0.0091 0.2087
P(has disease) 0.0436= =
and
M1 for their 0.01 × 0.91 or 0.0091 on its own or as numerator M1 indep for their 0.0436 as denominator A1 FT their tree
3
(v) Thus the test result is not very reliable. A relatively large proportion of people who have the disease will test negative.
E1 FT for idea of ‘not reliable’ or ‘could be improved’, etc E1 FT
2
(vi)
P(negative or doubtful and declared clear) =0.91 0.06 0.10 0.02 0.06 0.90 1 =0.91 0.00012 0.054 0.96412
+ × × + × ×+ + =
M1 for their 0.91 + M1 for either triplet M1 for second triplet A1 CAO
4 TOTAL 18

Q8 (i)
X ~ B(17, 0.2) P(X ≥ 4) = 1 – P(X ≤ 3)
= 1 – 0.5489 = 0.4511
B1 for 0.5489 M1 for 1 – their 0.5489 A1 CAO
3
(ii) E(X) = np = 17 × 0.2 = 3.4 M1 for product A1 CAO
2
(iii) P(X = 2) = 0.3096 – 0.1182 = 0.1914 P(X = 3) = 0.5489 – 0.3096 = 0.2393 P(X = 4) = 0.7582 – 0. 5489 = 0.2093 So 3 applicants is most likely
B1 for 0.2393 B1 for 0.2093 A1 CAO dep on both B1s
3
(iv) (A) Let p = probability of a randomly selected maths graduate applicant being successful (for population) H0: p = 0.2 H1: p > 0.2 (B) H1 has this form as the suggestion is that mathematics graduates are more likely to be successful.
B1 for definition of p in context B1 for H0B1 for H1E1
4
(v) Let X ~ B(17, 0.2) P(X ≥ 6) = 1 – P(X ≤ 5) = 1 – 0.8943 = 0.1057 > 5% P(X ≥ 7) = 1 – P(X ≤ 6) = 1 – 0.9623 = 0.0377 < 5% So critical region is {7,8,9,10,11,12,13,14,15,16,17}
B1 for 0.1057 B1 for 0.0377 M1 for at least one comparison with 5% A1 CAO for critical region dep on M1 and at least one B1
4
(vi) Because P(X ≥ 6) = 0.1057 > 10% Either: comment that 6 is still outside the critical region Or comparison P(X ≥ 7) = 0.0377 < 10%
E1 E1
2
TOTAL 18