Embed Size (px)
Citation preview

Office: 33-313 Telephone: 880-7221Email: [email protected] hours: by appointment
2020 Spring
Advanced Solidification
Eun Soo Park
06.01.2020
1

Solidification of Pure Metal : Thermal gradient dominant
Solidification of single phase alloy: Solute redistribution dominant
Planar → Cellular growth → cellular dendritic growth → Free dendritic growth
→ “Nucleation of new crystal in liquid”
a) Constitutional Supercooling (C.S.)
b) Segregation: normal segregation, grain boundary segregation, cellular segregation,
dendritic segregation, inverse segregation, coring and intercrystalline segregation, gravity segregation
Thin zone formation by C.S. at the sol. InterfaceDome type tip / (surrounding) hexagonal array
T↓ → Increase of C.S. zonePyramid shape of cell tip / Square array of branches / Growth direction change toward Dendrite growth direction
formed by releasing the latent heat from the growing crystal toward the supercooled liquid Dendrite growth direction/ Branched rod-type dendrite
: undesiable ~ deleterious effects on mechanical properties→ subsequent homogenization heat treatment, but diffusion in the solid far to slow→ good control of the solidification process
which is at a higher temp. than the interface at which growth is taking place.
2

Inverse segregation: As thecolumnar dendrites thicken solute-rich liquid (assuming k<1) mustflow back between the dendritesto compensate for (a) shrinkageand this raises the solute contentof the outer parts of the ingotrelative to the center.
EX) Al-Cu and Cu-Sn alloys with a widefreezing range (relatively low k)
Negative segregation: The solid isusually denser than the liquid andsinks carrying with it less solute(initially solidified one)than the bulkcomposition (assuming k<1). Thiscan, therefore, lead to a region ofnegative segregation near thebottom of the ingot. ((b) Gravityeffects)
* Segregation: undesiable ~ deleterious effects on mechanical properties→ subsequent homogenization heat treatment, but diffusion in the solid far to slow→ good control of the solidification process
Fig. 4.43 Segregation pattern in a large killed steel ingot. + positive, - negative segregation. (After M.C. Flemings, Scandinavian Journal of Metallurgy 5 (1976) 1.)
“positive”
“negative”
3

* Solidification of Ingots and Castings
Ingot Structure
- outer Chill zone
- Columnar zone
- central Equiaxed zone
an object or piece of machinery whichhas been made by pouring a liquidsuch as hot metal into a containerPermitted to regain their shape afterwards, or reshaped by machining
a lump of metal, usuallyshaped like a brick.Later to be worked, e.g. by rolling, extrusion or forging>> blank (small)
: equiaxed crystals
: elongated or column-like grains
Mushy zone (or pasty zone)depends on temp. gradient and non-equil. Freezing range of the alloy
4

Chapter 6 Polyphase solidification6.1. Evolution of a Gas during solidification(a) Gas-metal equilibria
Fig. 6.2. Solubility of hydrogen in aluminum.
A typical solubility diagram
Formation of gas bubble
Formation of compounds by dissolved gases
5

Fig. 6.4. Solid-liquid as nucleant for a gas bubble.
But , a solid-liquid interface should not be an effective nucleant for a bubble;
Equilibrium corresponds to Θ < 180 °,
σSG >> σSL & σSG > σLG
∴ cosθ < -1→ Surface E of the bubble is increased by contact with the solid-liquid interface.
However, gas bubbles are formed at solid-liquid interfaces.This location is in part due to the fact that the gas concentration would be highest there during solidification; but it may also be due to the fact that any re-entrant in the interface, such as a cell wall, grain boundary, or inter-dendritic space, would have an even higher gas content because of lateral segregation, as shown in Fig. 6.5.
6

Fig. 6.6. Effect of speed of growth of a bubble on its shape and size. (a) Slow growth, (b) intermediate speed, (c) fast growth.
* Growth rate of bubble > Advanced speed of interface → increase of bubble diameter
* Growth rate of bubble ~ Advanced speed of interface → Bubble growth progresses in the longitudinal
direction while maintaining bubble diameter
* Growth rate of bubble < Advanced speed of interface → bubble are trapped in the solid.
The diameter of the bubble is maintained in the longitudinal direction
7

Fig. 6.9. Phase diagram for the Al-Si system
6.2 Eutectics: limited solubility, most fusible (가장잘녹는, Greek)
* Most of the discussion of eutectic solidification will be based on binary eutectic.
Fig. 6.10. Phase diagram for the Cu-Mg system8

<3D ternary space model>
* Ternary eutectic system: Minimum point of the liquidus surface
9

• Isothermal section (TA > T > TB)
* THE EUTECTIC EQUILIBRIUM (l = α + β + γ)
(a) TA > T >TB (b) T = e1 (c) e1 > T > e3 (d) T = e3
(g) TA = E(e) T = e2 (f) e2 > T > E (h) E = T 10

11
* Quaternary eutectic l ⇄ α + β + γ + δ
Fig. Sequence of tie-tetrahedron on cooling through the quaternary eutectic temperature
Four tie tetrahedra
11

Polythermal projectin of a quaternary system involving five-phase equilibrium of the type l ⇄ α + β + γ + δ (schematic representation of the Bi-Cd-Pb-Sn quaternary eutectic system).
12
Q: Various different types of eutectic solidification (L→α + β) ?
13

14
1) Microstructure of Eutectics* Many eutectics are lamellar with a very regular structure if the metals used are sufficiently “pure” and that may of the other structures that are observed are degenerate forms of the lamellar structure cause by impurities.
various
14

4.3.2 Eutectic Solidification
Normal eutectic Anomalous eutectic
Fig. 4.29 Al-CuAl2 lamellar eutectic normal to the growth direction (x 680).
The microstructure of the Pb-61.9%Sn (eutectic) alloypresented a coupled growth of the (Pb)/βSn eutectic. There is a remarkable change in morphology increasing the degree of undercooling with transition from regular lamellar to anomalous eutectic.
http://www.matter.org.uk/solidification/eutectic/anomalous_eutectics.htm
Various different types of eutectic solidification → Both phases grow simultaneously.
both phases have low entropies of fusion.One of the solid phases is capable of faceting,i.e., has a high entropy or melting.
15

16
Divorced EutecticEutectic
16

Fig. 6.13. Morphology of a pure eutectic (tin-lead).
2) Pure binary eutectic
(zone-refined) high purity tin-lead→ extremely regular lamellar structure
17

: a relationship not only btw the orientation of the two phases, but also btw the interlamellar surface and the crystal orientations
Lamellae: straight and uniform thickness (ex, Al-Cu eutectic: several centimeters)
except where an “offset” or “termination” occurs
a) Constant orientation → simple crystallographic relationship
Sn-Zn
Sn-Pb
b) Cu-CuAl2 eutectic→ preferred relationship develops during the growth of a eutectic “single crystal”
18

3) Solidification of lamellar eutecticTwo representative opinions:1) Tammann : alternation of layers of the two phases
2) Vogel: two phase grew simultaneously → interlamellar interfaces were approximately normal to the mean solid–liquid interface
Fig. 6.14. Growth, mechanism, and diffusion paths for lamellar eutectic.
Transverse diffusion
19
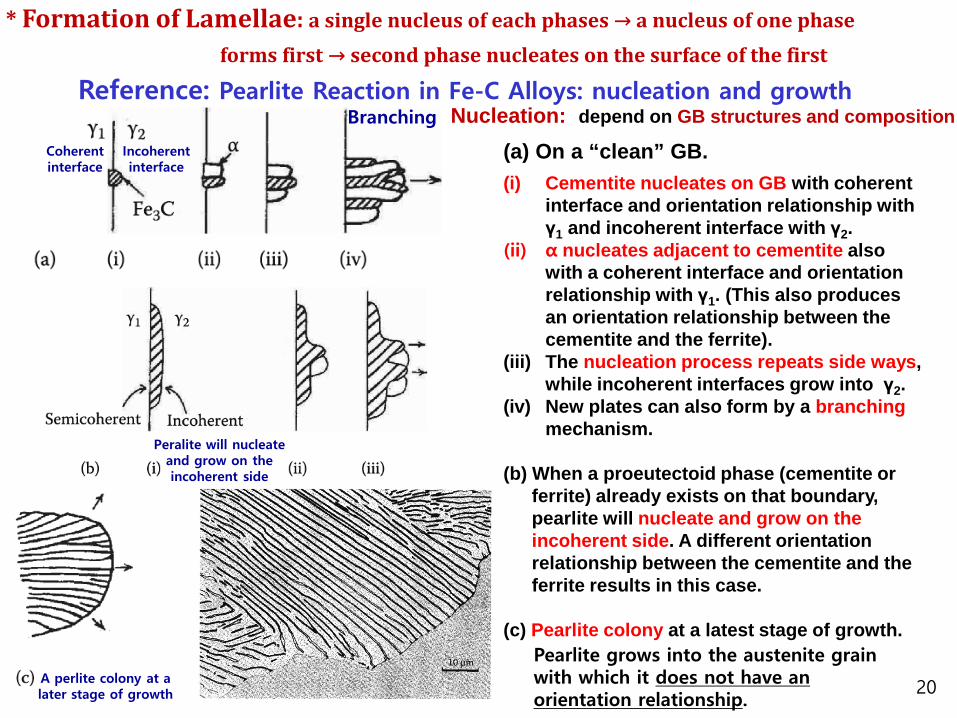
* Formation of Lamellae: a single nucleus of each phases → a nucleus of one phase forms first → second phase nucleates on the surface of the first
Reference: Pearlite Reaction in Fe-C Alloys: nucleation and growth
Coherentinterface
Incoherentinterface
Branching
Peralite will nucleate and grow on the incoherent side
A perlite colony at alater stage of growth
Nucleation: depend on GB structures and composition
(a) On a “clean” GB.(i) Cementite nucleates on GB with coherent
interface and orientation relationship with γ1 and incoherent interface with γ2.
(ii) α nucleates adjacent to cementite also with a coherent interface and orientation relationship with γ1. (This also produces an orientation relationship between the cementite and the ferrite).
(iii) The nucleation process repeats side ways, while incoherent interfaces grow into γ2.
(iv) New plates can also form by a branching mechanism.
(b) When a proeutectoid phase (cementite or ferrite) already exists on that boundary, pearlite will nucleate and grow on the incoherent side. A different orientation relationship between the cementite and the ferrite results in this case.
(c) Pearlite colony at a latest stage of growth.Pearlite grows into the austenite grain with which it does not have an orientation relationship.
20

Fig. 6.15. Possible interface shapes.
4) Shape of the interface
Normally convex Extreme case Concave
- Equilibrium of vector OA, OB, OC (O point → line in the real 3D case)
: the composition of the liquid in contact with the interface is constant over each lamella
: Max. concentration of solute at Lamellae center & Min. concentration of solute atLamellae edge
21

Q: Thermodynamics and Kinetics of eutectic solidification (L→α + β) ?
22

2. Eutectic Solidification (Thermodynamics)
Plot the diagram of Gibbs free energy vs. composition at T3 and T4.
What is the driving force for nucleation of α and β? “ ΔT ”
What is the driving force for the eutectic reaction (L →α + β) at T4 at Ceut?
This section will only be concerned with normal structures, and deal mainly with lamellar morphologies.
23

Eutectic Solidification (Kinetics): ΔT→ formation of interface + solute redistribution
If α is nucleated from liquid and starts to grow, what would bethe composition at the interface of α/L determined?
→ rough interface (diffusion interface) & local equilibrium
How about at β/L? Nature’s choice? Lamellar structure
What would be a role of the curvature at the tip?
→ Gibbs-Thomson Effect
interlamellar spacing → 1) λ ↓→ eutectic growth rate↑
but 2) λ ↓→ α/β interfacial E, γαβ↑→ lower limit of λ
B-rich liquid
A-rich liquid
B-rich liquid
i i SA G minimumγ ∆+ =∑→ G = Gbulk + Ginterface = G0 + γ A Misfit strain energyInterface energy +
Eutectic solidification: diffusion controlled process
→ fastest growth rate at a certain λ
24

2( ) mVG γλ
= −∆ ∞ +
0( )E
H TGT
µ ∆ ∆∆ ∞ = ∆ =
Critical spacing, * *: ( ) 0Gλ λ∆ =
*
0
2 E mT VH T
γλ = −
∆ ∆
What would be the minimum λ?
For an interlamellar spacing, λ, there is a total of (2/ λ) m2
of α/β interface per m3 of eutectic.
( ) ?G λ∆ =
How many α/β interfaces per unit length? 21 ×→ λ
2mG Vγµ
λ→ ∆ = ∆ = ×
2( ) mVG γλ
∆ ∞ =
m
L TGT
µ ∆∆ = ∆ ≅
Driving force for nucleation = Total interfacial E of eutectic phase
λ → ∞ ,
*
Solidification will take place if ΔG is negative (-).
Molar volume
For very large values of λ, interfacial E~ 0 Total undercooling
Interfacial E term
최소 층상 간격
a) All ΔT→ use for interface formation= min. λ
No interface (ideal case)
a) Formation of interface: ΔG
With interface (real case)
Eutectic Solidification (Kinetics): ΔT→ a) formation of interface + b) solute redistribution
25

*
0
2 E mT V identical to critical radiusH T
γλ = − →
∆ ∆
* Growth Mechanism: Gibbs-Thomson effect in a ∆G-composition diagram?
All 3 phases are in equilibrium.
The cause of G increase is the curvature of the α/L and β/L interfaces arising from the need to balance the interfacial tensions at the α/ β/L triple point, therefore the increase will be different for the two phases, but for simple cases it can be shown to be
for both.
*)
:
SL SL m
V V
v
2 2 T 1cf rG L T
L latent heat per unit volume
γ γ = = ∆ ∆
L = ΔH =HL - HS
of dendrite tip in pure metal
1) At λ=λ* (<∞),
Gibbs-Thomson effect
1) If λ=λ*, growth rate will be infinitely slow because the liquid in contact with both phases has the same composition, XE in Figure 4.32.
26

B concentration ahead of the β phase
B concentration ahead of the α phase
<
2) At λ= (∞>) λ (>λ*),
Concentration of B must be higher ahead of the α phase
B rejected from the α phase → the tips of the growing β
If ∞> λ > λ*, Gα and Gβ are correspondingly reduced because less free energy is locked in the interfaces.
)( // βαν LB
LB XX
dldCD −∝∝ 1/effective diffusion distance.. 1/λ
λν XDk ∆
= 1
0
*
,0,XX
X∆=∆∞=
=∆=λ
λλ
00
*
0 )1(
TX
XX
∆∝∆
−∆=∆λλ
)1(*
02 λ
λλ
−∆
=TDkv
Maximum growth rate at a fixed ∆T0*2λλ =→
Fig. 4.33 (a) Molar free energy diagram at (TE - ∆T0) for the case λ* < λ < ∞ , showing the composition difference available to drive diffusion through the liquid (∆X). (b) Model used to calculate the growth rate.
* Eutectic growth rate, v→ if α/L and β/L interfaces are highly mobile
→ proportional to flux of solute through liquid
→ diffusion controlled process
→ XBL/α > XB
L/β
)( // βαν LB
LB XX
dldCD −∝∝
(next page)
(1)
(2)
(3)
(2)+(3) → (1)
Formation ofinterface: ΔG
27

Fig. 4.34 Eutectic phase diagram showing the relationship between ∆X and ∆X0 (exaggerated for clarity)
0
*
,0,XX
X∆=∆∞=
=∆=λ
λλ
00
*
0 )1(
TX
XX
∆∝∆
−∆=∆λλ
00
0 )1(
TX
XX
∆∝∆
−∆=∆λλ
ΔX will it self depend on λ. ~ maximum value, ΔX0If undercooling is small,
Undercooling for curvature, r
Undercooling for Diffusion
28

B concentration ahead of the β phase
B concentration ahead of the α phase
<
2) At λ= (∞>) λ (>λ*),
Concentration of B must be higher ahead of the α phase
B rejected from the α phase → the tips of the growing β
If ∞> λ > λ*, Gα and Gβ are correspondingly reduced because less free energy is locked in the interfaces.
)( // βαν LB
LB XX
dldCD −∝∝ 1/effective diffusion distance.. 1/λ
λν XDk ∆
= 1
0
*
,0,XX
X∆=∆∞=
=∆=λ
λλ
00
*
0 )1(
TX
XX
∆∝∆
−∆=∆λλ
)1(*
02 λ
λλ
−∆
=TDkv
Maximum growth rate at a fixed ∆T0*2λλ =→
Fig. 4.33 (a) Molar free energy diagram at (TE - ∆T0) for the case λ* < λ < ∞ , showing the composition difference available to drive diffusion through the liquid (∆X). (b) Model used to calculate the growth rate.
* Eutectic growth rate, v→ if α/L and β/L interfaces are highly mobile
→ proportional to flux of solute through liquid
→ diffusion controlled process
→ XBL/α > XB
L/β
)( // βαν LB
LB XX
dldCD −∝∝
(next page)
(1)
(2)
(3)
(2)+(3) → (1)
Formation ofinterface: ΔG
29

30
S S L L VK T K T vL′ ′= +From
L L
V
K TvL
′−=
2 mr
V
TTL rγ
∆ =
0,SIf T ′ =
C iT T T∞∆ = −
Gibbs-Thomson effect:melting point depression r
2TTLG r
m
V γ=∆=∆
CL
V
TKL r
∆≅ ⋅
Thermodynamics at the tip?
Closer look at the tip of a growing dendritedifferent from a planar interface because heat can be conductedaway from the tip in three dimensions.
Assume the solid is isothermal ( )ST ′ = 0
A solution to the heat-flow equationfor a hemispherical tip:
' ( ) CL
TT negativer
∆≅
L L
V
K TvL
′−= v
r∝
1 However, ∆T also depends on r.How?
30

* 2 m
v o
TrL T
γ=
∆
r orT Tr
∆ = ∆*
*m0rmin rTTTT:r →−=∆→∆ ∞
( )rcL L L
V V V
T TT TK K K rvL r L r L r r
∆ − ∆ ∆ ∆≅ ⋅ = ⋅ = ⋅ −
*0 0 1
v as r r due to Gibbs-Thomson effectas r due to slower heat condution
→ →→ ∞
*0
Minimum possible radius ( r)?
r oExpress T by r r and T∆ ∆*, .
Maximum velocity? * r 2r→ =
The crit.nucl.radius
2 mr
V
TTL rγ
∆ =
Curvature
Compositiongradient
31

Dr0 TTT ∆+∆=∆total r DG G G∆ = ∆ + ∆
2 mr
VG
free energy dissipatedin forming / interfaces
αγγλ
α β
∆ =
→
DG free energy dissipatedin diffusion
∆ →
Undercooling ΔT0
Fig. 4.34 Eutectic phase diagram showing the relationship between ∆X and ∆X0 (exaggerated for clarity)
Curvature Composition gradient
)1(*
02 λ
λλ
−∆
=TDkv
By varying the interface undercooling (ΔT0) it is possible to vary the growth rate (v) and spacing (λ) independently.
<
Therefore, it is impossible to predict the spacing that will be observed for a given growth rate. However, controlled growth experiments show that a specific value of λ Is always associated with a given growth rate.
32

Dr0 TTT ∆+∆=∆total r DG G G∆ = ∆ + ∆
2 mr
VG
free energy dissipatedin forming / interfaces
αγγλ
α β
∆ =
→
DG free energy dissipatedin diffusion
∆ →
Curvature Composition gradient
)1(*
02 λ
λλ
−∆
=TDkv
By varying the interface undercooling (ΔT0) it is possible to vary the growth rate (v) and spacing (λ) independently.
Therefore, it is impossible to predict the spacing that will be observed for a given growth rate. However, controlled growth experiments show that a specific value of λ Is always associated with a given growth rate.
Maximum growth rate at a fixed ∆T0*
0 2λλ =→
*020 4/ λTDkv ∆=
*
0
2 E mT VH T
γλ = −
∆ ∆
From Eq. 4.39*
0 /1 λ∝∆T
So that the following relationships are predicted:
420
0
3200
)(k
Tv
kv
=∆
=λ
)1(*
02 λ
λλ
−∆
=TDkv
* For example,
(constant) Ex) Lamellar eutectic in the Pb-Sn system
k3~ 33 μm3/s and k4~ 1 μm/s·K2
v = 1 μm/s, λ0 = 5 μm and ΔT0 = 1 K
(5)
(6)
(4)
(5) + (6)
Undercooling ΔT0
33

Dr TTT ∆+∆=∆ 0Undercooling required to overcome the interfacial curvature effects
Undercooling required to give a sufficient composition difference to drive the diffusion
→∆ DT Vary continuously from the middle of the α to the middle of the β lamellae
constT =∆ 0 ← Interface is essentially isothermal.
rT∆
* Total Undercooling
→∆ DT The interface curvature will change across the interface.
but, negligible for high mobility interfaces
Strictly speaking, ΔTi term should be addedDriving force for atom migration across the interfaces
Should be compensated
* A planar eutectic front is not always stable.Binary eutectic alloyscontains impurities orother alloying elements
“Form a cellular morphology”
analogous to single phase solidification
restrict in a sufficiently high temp. gradient.
The solidification direction changes as the cell walls are approached and the lamellar or rod structure fans out and may even change to an irregular structure.
Impurity elements (here, mainly copper) concentrate at the cell walls.
34

Fig. 4.35 Transverse section through the cellular structure of an Al-Al6Fe rod eutectic (x3500).
A planar eutectic front is not always stable.Binary eutectic alloyscontains impurities orother alloying elements
“Form a cellular morphology”
analogous to single phase solidification
restrict in a sufficiently high temp. gradient.
The solidification direction changes as the cell walls are approached and the lamellar or rod structure fans out and may even change to an irregular structure.
Impurity elements (here, mainly copper) concentrate at the cell walls.
Fig. 4.36 Composition profiles across the cells in Fig. 4.35b.


![1 Introduction.ppt [호환 모드] - SNU OPEN COURSEWARE](https://img.pdfslide.us/doc/110x75/61ca1e7d0674b366813dabac/1-snu-open-courseware.jpg)