Embed Size (px)
Citation preview

1155
ADVANCED SIGNAL PROCESSING AND FAULT DIAGNOSIS IN CONDITION MONITORING
Sulo Lahdelma
Mechatronics and Machine Diagnostics Laboratory, Department of Mechanical Engineering P.O.Box 4200, FI-90014 University of Oulu, Finland
email: [email protected]
Esko Juuso Control Engineering Laboratory, Department of Process and Environmental Engineering
P.O.Box 4300, FI-90014 University of Oulu, Finland email: [email protected]
ABSTRACT Advanced signal processing methods combined with automatic fault detection enable reliable condition monitoring even when long periods of continuous operation are required. The parameters x(3) and x(4) are very suitable for the condition monitoring of slowly rotating bearings, as although the acceleration pulses are weak and occur at long intervals, the changes in acceleration are rapid and become emphasised upon differentiation of the signal x(2). Grounds for the need of x(-n) signals, i.e. integration of displacement n times with respect to time, have been indicated. In addition, derivatives where the order is a real number α or a complex number α+βi have been developed. These signals can be utilized in process or machine operation by combining the features obtained from the derivatives. The importance of each derivative is defined by weight factors. Dimensionless indices are obtained by comparing each feature value with the corresponding value in normal operation. These indices provide useful information on different faults, and even more sensitive solutions can be obtained by selecting suitable features. Widely used root-mean-square values are important in many applications, but the importance of the peak values increases in slowly rotating machines. Further details can be introduced by analysing the distributions of the signals. The features are generated directly from the higher order derivatives of the acceleration signals, and the model can be based on data or expertise. The intelligent models extend the idea of dimensionless indices to nonlinear systems. Variation with time can be handled as uncertainty by presenting the indices as time-varying fuzzy numbers. The classification limits can also be considered fuzzy. The reasoning system will produce degrees of membership for different cases. Practical longterm tests have been performed e.g. for fault diagnosis in bearings, cogwheels, gear boxes, electric motors and supporting rolls, and for cavitation in turbines and pumps. KEYWORDS Higher, real and complex order derivatives, vibration analysis, linguistic equations, fuzzy logic and condition monitoring 1 INTRODUCTION Any attempt to detect different types of machine faults reliably at an early stage requires the development of improved signal processing methods. Vibration measurements provide a good basis for condition monitoring. Elevated signal levels are detected in fault cases. Early vibration measurements used displacement x = x(t) as the measurement parameter, which was quite natural, because the measuring instruments employed were mechanical or optical. The next step was the adoption of velocity i.e. x(1) signals, which were obtained either by differentiating
©The 2nd World Congress on Engineering Asset Management (EAM) and The 4th International Conference on Condition Monitoring

1156
displacement or using sensors whose output was directly x(1). The drawback with the signals x and x(1) is that they do not usually allow the detection of impact-like faults at a sufficiently early stage. Examples of these faults are defective bearings and gears. However, e.g. unbalance and misalignment can be detected successfully with x and x(1). Acceleration measurements have been made more frequently upon the introduction of accelerometers. The signals x and x(1) can be obtained from the x(2) signal through analog or numerical integration. It should be noted that before the adoption of accelerometers, the x(2) signal could be generated from the x signal by means of an analog differentiator. In his publication of 1982, Smith used the jerk, i.e. x(3) signal, when examining slowly rotating bearings [1]. The first time derivative of acceleration had already been used earlier for assessing the comfort of travelling in designing lifts, for instance, where there is a need to ensure that acceleration changes do not exceed certain limit values. Higher, real and complex order derivatives bring additional methods to signal processing, and the order of derivation can also be a negative or positive integer, a real value or a complex value. These alternatives have been discussed in [11], and Section 2 is mostly based on that study. Vibration indices based on several higher derivatives in different frequency ranges were already introduced in 1992 [2]. Operating conditions can be detected with a Case-Based Reasoning (CBR) type application with linguistic equation (LE) models and Fuzzy Logic. The basic idea of the LE methodology, which was introduced in 1991, is the nonlinear scaling that was developed to extract the meanings of variables from measurement signals [3]. A large set of previously collected measurements has been analysed with intelligent models based on these new features. This paper deals with higher order and complex derivatives in processing vibration measurements, feature extraction and model based fault detection. Examples are taken from experimental systems and real machines and process equipments. 2 SIGNAL PROCESSING Lahdelma introduced the )4(x signal, which he used for examining the condition of an electric motor, also stating grounds for the use of even higher order derivatives x(n) , where n is a positive integer. Examples of the use of the signals )5(x and )6(x are given in [4]. The publication [2] also indicated grounds for the need of x(-n) signals, i.e. the question is of integrating displacement n times with respect to time. These signals have been employed when examining oil whirl in a sleeve bearing [5], enabling the difficulties that were encountered in the use of velocity root-mean-square values, i.e. )1(
rmsx , to be eliminated. It is a well known fact that in the range (0.42 – 0.48)f, where f is rotation frequency, whirl-induced vibration may increase significantly without this being reflected in the )1(
rmsx values to any appreciable extent even though the changes can be evident in the )3(−
rmsx values, for instance [5]. Here, -3 means that the displacement has been integrated three times with respect to time. The )4(x signals have been in routine use in the Finnish pulp and paper industry since the end of 1995. They have been applied to monitoring the condition of very slowly rotating machines in particular in order to obtain extra sensitivity in the early detection of bearing faults, for example. In addition, they have been used successfully in examining cavitation in water turbines [6, 7]. Other examples of the use of )4(x are given in [5]. In 1995, Lahdelma presented grounds [5] for the adoption of )(αx signals in condition monitoring, where the order of derivative is a real number, i.e. R∈α . If, for instance, the allowable vibration levels on the logarithmic scale form
©The 2nd World Congress on Engineering Asset Management (EAM) and The 4th International Conference on Condition Monitoring

1157
ascending or descending lines on certain frequency ranges, there is a risk of major errors when interpreting root-mean-square values in order to assess fault severity. The errors can be eliminated with )(αx signals. This problem is discussed in more detail in [5, 8, 9]. Signals )(αx have also been used with good results in active vibration control [5], when ∈α [2.5,3.5]. The case where α is negative has also proved successful when applied to examining oil whirl in sleeve bearings [8], in which case root-mean-square values )3( γ−
rmsx were calculated. The order γ3− means that displacement has been integrated γ times with respect to time and
R∈< γ0 . In their publication [10] of 2003, Lahdelma and Kotila examined the condition of a rolling bearing by means of )(αx signals, when [2,6]∈α with a stepsize of 0.25. In the example case the best results with kurtosis and peak value were obtained when α was 4.5 and 4.75, respectively. In 1999, Lahdelma presented grounds for the use of time derivatives of complex order in condition monitoring [9], deriving the necessary expressions that can be used for calculating
)()( iz xx βα +≡ signals, where z is a complex number, R∈βα , and 1−=i . The use of complex-order derivatives increases the number of signals from which a signal with the best sensitivity is selected in order to detect the desired faults. Here, sensitivity means the relation between the features of a faulty and an intact object. The feature can be, for example, a signal’s root-mean-square value, peak value or kurtosis. Let us assume that the periodic signal has the Fourier series expansion
),sin()( 11
0 kk
k tkXXtx ϕω ++= ∑∞
=
(1)
where Xk denotes the amplitude of the kth harmonic, φk is its phase angle, ω1 is the fundamental angular frequency, and .00 ≡X We define the complex derivative x(z) for this signal by
∑∞
=
−+++−
⎜⎜⎝
⎛=
1
)2
ln2
(2
1)( 11
21)(
k
ktki
kz keXektx
πϕωβπαωπβαα ω (2)
.21 )
2ln
2(
21
11
⎟⎟⎠
⎞+
−+−+−+πϕωβπαωπβαα ω kktki
k eXek
The measurement data from the investigations [10] are used to point out the advantages and new aspects that can be obtained when moving over from α to iβα + . The application of the complex-order derivative to the acceleration signal is not a restricting element. It can equally well be applied to other signal types as well, such as pressure signals. The order of derivative can be chosen from the complex plane (Figure 1). The complex derivative has been examined with a spherical double-row roller bearing of type SKF 24124 CC/W33, which is used in felt guide rolls in paper machines, for instance. A summary of the results obtained at rotation frequency 2.0 Hz is shown in Figure 2, where the feature is the peak value, and [ ]8,2∈α and [ ]2,0∈β . This area also includes acceleration and higher derivatives x(3)
and x(4) (Figure 1). The peak value denotes the highest absolute value of a measured signal. In the calculations 0.25 was used as a step of α, while that for β was 0.2. The best sensitivity was obtained when α = 4.5 and β = 1.0 and its value was 7.0240. When β=0, i.e. a purely real-order derivative signal )(αx was concerned, the highest sensitivity was 7.0157, when α = 4.75. When β = 2, the sensitivity curve runs smoothly, and almost throughout a better sensitivity can be reached than in cases where β = 0 or β = 1, though the sensitivity was best when β = 1. It must
©The 2nd World Congress on Engineering Asset Management (EAM) and The 4th International Conference on Condition Monitoring

1158
be noted, however, that in the example case the use of a complex derivative did not give any appreciable extra benefit from the point of view of maximum sensitivity. The results have been discussed in more detail in [11].
Figure 1. Order of derivation represented in the complex plane: each point iz βα += corresponds to a derivative signal )( ix βα + , where z is the order of derivation.
When β = 1, the fault on the inner race manifests itself clearly in the presence of large rings in the )5.4( ix + signal, which correspond to rotation frequency (Figure 3). With the signal )5.4( ix + , the faulty bearing can be detected very reliably, because in the case of an intact bearing the signal’s basic level is smaller and especially as there are no impact-induced rings. An interesting finding here is that although one-channel measurements were made, a three-dimensional signal
)( ix βα+ was obtained from the acceleration signal on account of the nature of the complex derivative. The projection of this three-dimensional signal in the complex plane resembles the orbit obtained in a two-channel measurement. As seen in Figure 4, the faulty bearing can be detected very easily when β = 1, as the impact-like fault is evidently revealed by the fairly circular curves located around the black centre. This centre turned smaller when the bearing was changed. The projections could be utilised in automatic fault detection by applying different types of pattern recognition methods, for instance.
Figure 2. Three-dimensional sensitivity surface obtained using signal peak values, when
[ ]8,2∈α and [ ]2,0∈β , for a spherical double-row roller bearing [11]. An appropriate order can be selected in different applications from the complex plane (Figure 1). The complex derivative produces a two dimensional figure (Figure 4). Also xy plots obtained for two signals )( 1αx and )( 2αx , where α1 and α2 are real numbers, can provide useful information, especially for monitoring with regard to time. Poincaré’s maps are special cases of these plots.
©The 2nd World Congress on Engineering Asset Management (EAM) and The 4th International Conference on Condition Monitoring

1159
Figure 3. Complex derivatives )5.4( ix + : the upper signal was measured from a faulty roller bearing and the lower one from an intact bearing in the frequency range 3-2000 Hz. The fault was on the bearing’s inner race and the rotation frequency was 2 Hz.[11]
Figure 4. Projections of the signals )5.4( ix + in the complex plane, on the left for a faulty roller bearing and on the right for an intact bearing. The measurements were performed in the frequency range 3-2000 Hz. The fault was on the bearing’s inner race and the rotation frequency was 2 Hz.[11] 3 FEATURE EXTRACTION A test rig was used for simulating the following faults: rotor unbalance, coupling misalignment, bent shaft and three different bearing faults [12]. There was a small scratch either on the inner race, the outer race or the rolling element of the bearings,. Two levels of rotor unbalance were introduced on the drive shaft. There were three different coupling misalignments between the motor and input shaft. The driven shaft was bent in one test run. Measurements were made with five rotation speeds, and the same measurements were repeated for normal fault free operation. Other operating conditions except rotation speed remained similar in all cases. The acceleration measurement range was 3-10700 Hz. Two features, root-mean-square acceleration )2(
rmsx and kurtosis, were obtained from the acceleration signals. An additional feature was the mean of the three highest jerk signal values in the measurement range. Root-mean-square velocities )1(
rmsx were calculated in two frequency ranges, 10-1000 Hz and 20-85 Hz.
©The 2nd World Congress on Engineering Asset Management (EAM) and The 4th International Conference on Condition Monitoring

1160
Cavitation in water turbines has often been examined with standard )1(rmsx measurements in the
frequency range 10 – 1000Hz or by selecting 1 Hz as the lower cut-off frequency. However, practical experiences have shown that this analysis does not provide a sufficient picture of cavitation in the case of Kaplan turbines. Higher order time derivatives have been used to improve this analysis [6, 13]. The turbine operates with a constant rotational speed and the power is controlled by changing the water volume flow rate. The acceleration measurements were performed vertically on the supporting bearings at 29 power levels between 1.5 and 59.4 MW. In addition, an analogue vibration meter MITSOL D-94 was used for measuring the peak value of
)4(x . Where the rms velocity signals )1(rmsx detected only one cavitation point, )4(x measurements
identified all the cavitation points, and the results correspond to sound observations. Higher derivatives were used as features together with vibration velocity and power. The high peak values in the low power range were detected with all the features. Averaging some peak values improves robustness. The results for the low power range are fairly similar for all these features, and all of them show two cavitation points. The highest peaks would suggest still one or even two additional cavitation points that are real. The peak values do not show as clear results in the high power range. The feature values for )3(x and )4(x are quite similar and give an indication of two cavitation points. However, the values are smaller than in the low power range. The velocity incorrectly shows a high indication of cavitation in some cases. The power range, which is free of cavitation, was taken as a basis for detecting an increase in the signal levels. The normal signal was defined by the range [-3sk, +3sk] where sk is the standard deviation of the signal x(k), k=1, 3 and 4. These features have low values in the low power range where the spikes are less frequent. The values rise with increasing power as the number of small spikes grows. This can be heard as an increasing noise. The distribution of the signal values is important, which was seen in monitoring the condition of the support rolls of a lime kiln [14]. Fault situations were detected as a high number of strong impacts (Figure 5).
Figure 5. Signals x(1), x(3) and x(4) for a faulty case in the support rolls of a lime kiln, the bins of the histograms are based on the standard deviation σn of the corresponding signal x(n) in the following way: 2σn ≤ x(n) < 3σn, 3σn ≤ x(n) < 4σn, 4σn ≤ x(n) < 5σn, and x(n) ≥ 5σn where n is the order of derivative. [14]
©The 2nd World Congress on Engineering Asset Management (EAM) and The 4th International Conference on Condition Monitoring

1161
Velocity, acceleration and higher derivatives, )3(x and )4(x , were also used for detecting bearing faults and unbalance in fast rotating bearings [15]. Standard deviations were calculated on three frequency ranges: 10-1000 Hz, 10-10000 Hz and 10-50000 Hz. Unbalance was clearly detected on the basis of the standard deviations obtained from the lowest frequency range. Several signals had to be combined for detecting the other faults. In this case the rotation frequency was in the range 65-525 Hz. Very slowly rotating bearings in washers were analysed in [15]. As there are very few peaks, the rms values are very insensitive to the faults in this case (Table 1). The peak values are much better, even better than the crest factor if the frequency range is selected correctly. Table 1. Features analysed in very slowly rotating bearings in a washer with time of rotation 39.36 seconds [15].
Frequenzy range
10-2000Hz
Defective bearing
10-2000Hz
New
bearing Ratio
10-3000Hz
Defective bearing
10-3000Hz
New
bearing Ratio x(1) 2.57 4.51 0.57 2.57 4.50 0.57
x(2) 21.28 4.71 4.52 34.60 4.73 7.32
x(3) 96.59 4.85 19.92 157.69 5.00 31.54 Cre
st
Fact
or
x(4) 121.42 4.40 27.60 188.26 4.61 40.84
x(1) 0.32 mm/s 0.25 mm/s 1.28 0.32 mm/s 0.25 mm/s 1.28
x(2) 0.11 m/s2 0.21 m/s2 0.52 0.11 m/s2 0.21 m/s2 0.52
x(3) 0.19 km/s3 0.51 km/s3 0.37 0.27 km/s3 0.52 km/s3 0.52
rms
x(4) 1.51 Mm/s4 2.90 Mm/s4 0.52 3.65 Mm/s4 3.28 Mm/s4 1.11
x(1) 0.81 mm/s 1.14 mm/s 0.71 0.81 mm/s 1.14 mm/s 0.71
x(2) 2.32 m/s2 0.99 m/s2 2.34 3.80 m/s2 0.99 m/s2 3.84
x(3) 18.34 km/s3 2.47 km/s3 7.43 43.22 km/s3 2.61 km/s3 16.56 Pea
k va
lue
x(4) 183.4 Mm/s4 12.78 Mm/s4 14.35 687.3 Mm/s4 15.13 Mm/s4 45.43
4 CONDITION INDICES 4.1 Vibration indices Vibration signals can be utilized in process or machine operation by combining features obtained from derivatives. Vibration indices based on several higher derivatives in different frequency ranges were already introduced in 1992. Dimensionless vibration indices were represented by
)()1(1
)0(0 ... n
rmsnrmsrmsn xcxcxcVIB +++= (3)
where ic , i=0,1,…n, are weight factors of displacement, velocity, acceleration and the higher derivatives of displacement [2]. The frequency ranges can be specific for each measurement
©The 2nd World Congress on Engineering Asset Management (EAM) and The 4th International Conference on Condition Monitoring
1162
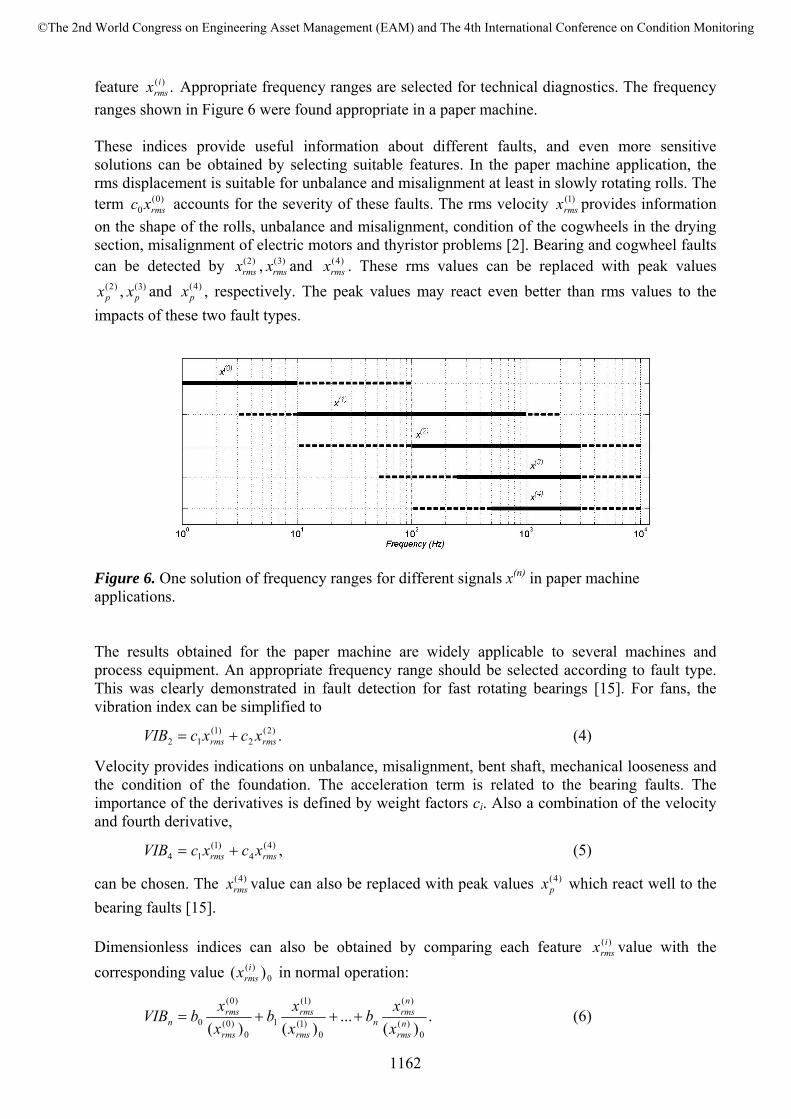
feature .)(irmsx Appropriate frequency ranges are selected for technical diagnostics. The frequency
ranges shown in Figure 6 were found appropriate in a paper machine. These indices provide useful information about different faults, and even more sensitive solutions can be obtained by selecting suitable features. In the paper machine application, the rms displacement is suitable for unbalance and misalignment at least in slowly rotating rolls. The term )0(
0 rmsxc accounts for the severity of these faults. The rms velocity )1(rmsx provides information
on the shape of the rolls, unbalance and misalignment, condition of the cogwheels in the drying section, misalignment of electric motors and thyristor problems [2]. Bearing and cogwheel faults can be detected by )2(
rmsx , )3(rmsx and )4(
rmsx . These rms values can be replaced with peak values )2(
px , )3(px and )4(
px , respectively. The peak values may react even better than rms values to the impacts of these two fault types.
Figure 6. One solution of frequency ranges for different signals x(n) in paper machine applications.
The results obtained for the paper machine are widely applicable to several machines and process equipment. An appropriate frequency range should be selected according to fault type. This was clearly demonstrated in fault detection for fast rotating bearings [15]. For fans, the vibration index can be simplified to
.)2(2
)1(12 rmsrms xcxcVIB += (4)
Velocity provides indications on unbalance, misalignment, bent shaft, mechanical looseness and the condition of the foundation. The acceleration term is related to the bearing faults. The importance of the derivatives is defined by weight factors ci. Also a combination of the velocity and fourth derivative,
,)4(4
)1(14 rmsrms xcxcVIB += (5)
can be chosen. The )4(rmsx value can also be replaced with peak values )4(
px which react well to the bearing faults [15]. Dimensionless indices can also be obtained by comparing each feature )(i
rmsx value with the corresponding value 0
)( )( irmsx in normal operation:
.)(
...)()( 0
)(
)(
0)1(
)1(
10
)0(
)0(
0 nrms
nrms
nrms
rms
rms
rmsn x
xbxxb
xxbVIB +++= (6)
©The 2nd World Congress on Engineering Asset Management (EAM) and The 4th International Conference on Condition Monitoring
1163
Each ratio of the rms values is an indication of a specific fault when the ratio is greater than one, or a very good condition when the ratio is much less than one. The weight factors ib , i=0,1,…n, and the values 0
)( )( irmsx of normal operation are estimated from the measurement data. Then also
the weight factors ic in (3) can be evaluated. The weight factors make the effects of different features comparable to each other. A measurement index
)(1nVIB
NMIT = , (7)
where 1+≤ nN , compensates for the effect of the number of the features with regard to the vibration index VIBn. The inverse of the index MIT provides a direct indication of the condition of the machines: small values indicate poor condition and high values good condition. The condition indices may also include other physical and chemical measurements, e.g. temperature, pressure, and metal concentrations. Vibration indices can contain other types of derivative signals, e.g. signals )( 1αx and )( 2αx , where α1 and α2 are real numbers. Also complex derivatives x(z) can be used in the indices, e.g. by the sum 2)(2)( )Im()Re( zz xx + or by the area of the smallest rectangle which contains all the values of the signal x(z) in a chosen time interval (Figures 3 and 4). 4.2 Nonlinear scaling The vibration indices described above are dimensionless and normalized. However, the analysis can be further improved by taking into account nonlinear effects [3, 12, 13, 14, 15]. Operating conditions can be detected with a Case-Based Reasoning (CBR) type application with linguistic equation (LE) models and Fuzzy Logic. The basic idea of the linguistic equation (LE) methodology is the nonlinear scaling developed to extract the meanings of variables from measurement signals. The scaling function scales the real values of variables to the range of [-2, +2] which combines normal operation [-1, +1] with the handling of warnings and alarms. The scaling function contains two monotonously increasing functions: one for the values between -2 and 0, and one for the values between 0 and 2. Both expertise and data can be used in developing the mapping functions (membership definitions) [16]. The membership definition f consists of two second-order polynomials, i.e. the scaled values, which are called linguistic levels Xj, are obtained by the inverse function f -1:
⎢⎢⎢⎢⎢⎢⎢⎢⎢
⎣
⎡
≤−
≤≤−−−+−
≤≤−−−+−
≥
=−−−
+
+++
)min(2
)min(22
)(4
)max(22
)(4
)max(2
2
2
jj
jjjj
jjjjj
jjjj
jjjjj
jj
j
xxwith
cxxwitha
xcabb
xxcwitha
xcabb
xxwith
X (8)
where −
ja , −jb , +
ja and +jb are coefficients of the corresponding polynomials, jc is a real value
corresponding to the linguistic value 0 and is the actual measured value. Parameters )min( jx and )max( jx are minimum and maximum values corresponding to the linguistic values –2 and 2. [16]
©The 2nd World Congress on Engineering Asset Management (EAM) and The 4th International Conference on Condition Monitoring
1164
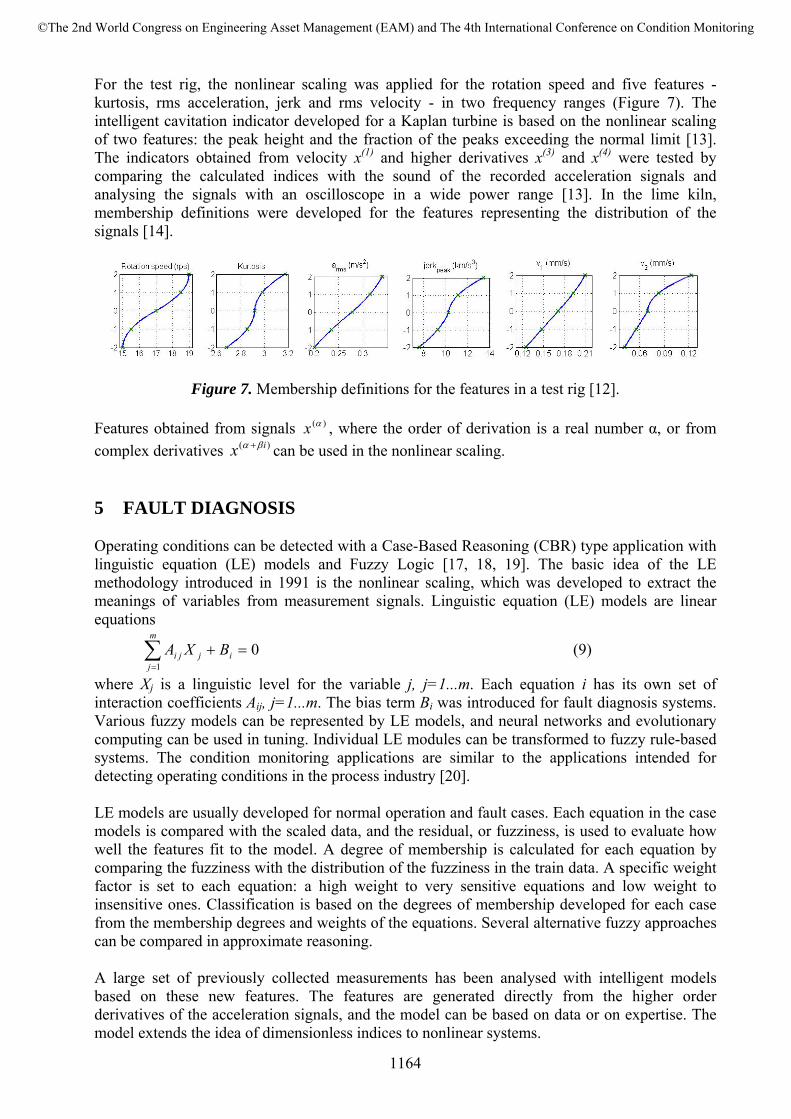
For the test rig, the nonlinear scaling was applied for the rotation speed and five features - kurtosis, rms acceleration, jerk and rms velocity - in two frequency ranges (Figure 7). The intelligent cavitation indicator developed for a Kaplan turbine is based on the nonlinear scaling of two features: the peak height and the fraction of the peaks exceeding the normal limit [13]. The indicators obtained from velocity x(1) and higher derivatives x(3) and x(4) were tested by comparing the calculated indices with the sound of the recorded acceleration signals and analysing the signals with an oscilloscope in a wide power range [13]. In the lime kiln, membership definitions were developed for the features representing the distribution of the signals [14].
Figure 7. Membership definitions for the features in a test rig [12]. Features obtained from signals )(αx , where the order of derivation is a real number α, or from complex derivatives )( ix βα + can be used in the nonlinear scaling. 5 FAULT DIAGNOSIS Operating conditions can be detected with a Case-Based Reasoning (CBR) type application with linguistic equation (LE) models and Fuzzy Logic [17, 18, 19]. The basic idea of the LE methodology introduced in 1991 is the nonlinear scaling, which was developed to extract the meanings of variables from measurement signals. Linguistic equation (LE) models are linear equations
01
=+∑=
ij
m
jji BXA (9)
where Xj is a linguistic level for the variable j, j=1...m. Each equation i has its own set of interaction coefficients Aij, j=1...m. The bias term Bi was introduced for fault diagnosis systems. Various fuzzy models can be represented by LE models, and neural networks and evolutionary computing can be used in tuning. Individual LE modules can be transformed to fuzzy rule-based systems. The condition monitoring applications are similar to the applications intended for detecting operating conditions in the process industry [20]. LE models are usually developed for normal operation and fault cases. Each equation in the case models is compared with the scaled data, and the residual, or fuzziness, is used to evaluate how well the features fit to the model. A degree of membership is calculated for each equation by comparing the fuzziness with the distribution of the fuzziness in the train data. A specific weight factor is set to each equation: a high weight to very sensitive equations and low weight to insensitive ones. Classification is based on the degrees of membership developed for each case from the membership degrees and weights of the equations. Several alternative fuzzy approaches can be compared in approximate reasoning. A large set of previously collected measurements has been analysed with intelligent models based on these new features. The features are generated directly from the higher order derivatives of the acceleration signals, and the model can be based on data or on expertise. The model extends the idea of dimensionless indices to nonlinear systems.
©The 2nd World Congress on Engineering Asset Management (EAM) and The 4th International Conference on Condition Monitoring

1165
5.1 Test rig A CBR type approach was used for the test rig [12]: linguistic equations with 6 variables were developed for each measurement point. The classification results were very good (Figure 8). There are some faulty classified measurements but the mistakes are very logical, e.g. small unbalance and normal state. Misalignment increases when moving from class 5 to class 7. A small misalignment and the normal state are also close to each other. In all the ten cases, mistakes only occur between very similar classes. The system placed practically all the bearing faults into the right classes. However, it is impossible to identify bearing failure type from selected measurements parameters. Correctly classified bearing fault cases are based on the ability of the system to identify the criticalness of the fault. Since the difference between the bearing faults was more prominent than the difference between misalignment cases, there is more confusion in the misalignment classes.
Figure 8. Confusion matrix in percentages for the fault classes: 1 Normal state, 2-3 Unbalance (6.1 and 11g), 4 Bent shaft, 5-7 Misalignment, 8-10 Bearing failures (outer race, rolling element and inner race) [12]. 5.2 Cavitation For cavitation monitoring, cavitation indices are constructed as a sum of the linguistic values of the two features, the peak height and the fraction of the peaks exceeding the normal limit. The cavitation indices provide indication for both clear cavitation and clearly good operation. Values -2 and -1 indicate good operating conditions. Value 1 corresponds to clear signs of cavitation, and value 2 means a very strong indication of cavitation. Operating conditions should be studied more carefully if the values are close to zero. Variation with time can be handled as uncertainty by presenting the indices as time-varying fuzzy numbers. The classification limits can also be considered fuzzy. The reasoning system will produce degrees of membership for different cases. The classification results obtained from the experimental cases involving the water turbine were very good and logical. Different cavitation
©The 2nd World Congress on Engineering Asset Management (EAM) and The 4th International Conference on Condition Monitoring
1166
types, some causing low frequency vibration on structure and some only leading to fast impacts, can be identified. As even very small changes in cavitation are detected by the cavitation index, the results are very promising for the early detection of cavitation. Cavitation monitoring is based on the following steps [13]:
• Calculating the two features: o the peak height, H, as an appropriate mean of the highest peaks, and o the fraction F of the values exceeding the normal range.
• Calculating the corresponding linguistic features f -1 (H) and f -1 (F). • Calculating the cavitation index, Icav. • If Icav ≤ -1, the operating conditions are cavitation-free, • Else if Icav ≥ 1
o If f -1 (H) > f -1 (F), cavitation in the low power range, o Else cavitation in the high power range.
• Else continuing the analysis for detecting possible short periods of cavitation. The indicators detect the normal operating conditions, which are free of cavitation, and also provide a clear indication for cavitation already at an early stage. The index obtained from x(4) is the best alternative but also the index obtained from x(3) provides good results throughout the power range. An automatic monitoring can be based on the following steps: detecting normal conditions, cavitation and the type of cavitation. The cavitation indicator also provides warnings of a possible risk on short periods of cavitation. Uncertainties can be taken into account by extending the feature calculations and classification rules to fuzzy set systems. 5.3 Lime kiln In the lime kiln application, the features were combined with a linguistic equation (9). The interaction coefficients Aij, j=1...6, are based on expertise: large values for the features σ4 and the fractions F4k, k=4 and 5 are related to faulty situations, and large values for the fractions F4k, k=1…3 are obtained in normal conditions. The condition index IC is a number between -2 and 2. The matrix A = [-2 1 1 1 -1 -1 -1] includes the coefficients for the features and the condition index. As the bias term is zero, the index IC corresponds to the bias term in the same way as in [11]. The condition index developed for the supporting rolls of a lime kiln provides an efficient indication of faulty situations. Surface damage is clearly detected and friction increase is indicated at an early stage. The features are generated directly from the higher order derivates of the acceleration signals, and the model is based on expertise. All the supporting rolls can be analysed using the same system. Tuning and testing of the condition index will be continued with measurements available in a large database. [14] 5.4 Fast rotating bearings For fast rotating bearings, the condition index is a sum of the scaled standard deviations of the signal x(4) calculated for three frequency ranges. The faults are correctly detected (Figure 9) with the algorithm:
• Calculating the condition index. • The condition is normal if Ind < -5…-4. • There is an outer race fault in the bearings if Ind < 0. • The condition is unbalance if the index for the low frequency range is very high, • Otherwise the condition is inner race fault in the bearings.
©The 2nd World Congress on Engineering Asset Management (EAM) and The 4th International Conference on Condition Monitoring

1167
Figure 9. Classification results for fast rotating bearings, the rotation frequency was 525 Hz [15]. 6 CONCLUSIONS Vibration measurements provide a good basis for condition monitoring, as elevated signal levels are detected in fault cases. More sensitive signals can be achieved with higher order derivatives, and complex derivatives provide interesting new graphical representations. The order of derivation can be chosen from the complex plane. Feature selection depends very much on the problem. Widely used rms values are important in many applications, but the importance of the peak values increases in slowly rotating machines. Further details can be introduced by analysing signal distributions. Vibration indices combine the effects of several features for detecting faults. There are various alternatives: the same features can be chosen from several derivative signals, or several features of the same signal can be used. Also the frequency ranges can be specific to the signals or the same type of signal can be obtained from different frequency ranges. The analysis can be further improved by taking into account nonlinear effects with linguistic equations. A set of models can be used for detecting operating conditions according to the principles of case based reasoning (CBR). An even more efficient approach is to combine several indices into one condition index which classifies different faults or the severity of a specific fault.
References 1. Smith, J. D. Vibration monitoring of bearings at low speeds, Tribology International 15
(1982) 3, pp. 139-144. 2. Lahdelma, S. New vibration severity evaluation criteria for condition monitoring (in
Finnish), Research report No. 85, 1992, University of Oulu. 3. E. K. Juuso, K. Leiviskä. Adaptive Expert Systems for Metallurgical Processes, in Expert
Systems in Mineral and Metal Processing, Proceedings of the IFAC Workshop, Espoo, Finland, August 26-28, 1991, IFAC Workshop Series, 1992, Number 2, Pergamon, Oxford, UK, pp. 119-124.
4. Lahdelma, S. Experiences in Condition Monitoring on the Use of Derivatives whose Order is Higher than Acceleration (in Finnish), Nippi 13 (1997) 1, pp. 14-16.
5. Lahdelma, S. On the higher order derivatives in the laws of motion and their application to an active force generator and to condition monitoring, D.Sc.Tech. thesis. Research report No. 101, 1995, University of Oulu.
©The 2nd World Congress on Engineering Asset Management (EAM) and The 4th International Conference on Condition Monitoring

1168
6. S. Lahdelma, J. Strackeljan, D. Behr. Combination of Higher Order Derivatives and a Fuzzy Classifier as a New Approach for Monitoring Rotating Machinery, in Proceedings of Comadem´99 – 12th International Congress on Condition Monitoring and Diagnostic Engineering Management, University of Sunderland, 6th - 9th July 1999, pp. 231-241.
7. J. Strackeljan, S. Lahdelma. Erfahrungen mit höheren zeitlichen Ableitungen zur Schadensdiagnose bei realitätsnahen Betriebsbedingungen, VDI Berichte 1554: Proceedings of VDI/VDEh-Forum Instandhaltung & Akida 2000, Aachen, 16th – 17th May 2000, pp. 124-137.
8. Lahdelma, S. On the Derivative of Real Number Order and its Application to Condition Monitoring, Kunnossapito 11 (1997) 4, pp. 25-28.
9. Lahdelma, S. On the Derivative of Complex Number Order and its Application to Condition Monitoring and Active Control, Kunnossapito 13 (1999) 1, pp. 27-34.
10. S. Lahdelma, V. Kotila. Real Order Derivatives – New Signal Processing Method (in Finnish), Kunnossapito 17 (2003) 8, pp. 39-42.
11. S. Lahdelma, V. Kotila. Complex Derivative – A New Signal Processing Method, Kunnossapito 19 (2005) 4, pp. 39-46.
12. E. K. Juuso, M. Kivistö, S. Lahdelma. Intelligent Condition Monitoring Using Vibration Signals, in Proceedings of EUNITE 2004, European Symposium on Intelligent Technologies, Hybrid Systems and their implementation on Smart Adaptive Systems, June 10-12, 2004, Aachen, Germany, 2004, Verlag Mainz, Aachen, pp. 381-390.
13. E. Juuso, S. Lahdelma. Intelligent Cavitation Indicator for Kaplan Water Turbines, in Kumar, U., Parida, A. and Rao, R. B. K. N. (eds.) Proceeding COMADEM 2006, the 19th International Congress on Condition Monitoring and Diagnostic Engineering Management, June 12-15, 2006, Luleå, Sweden, 2006, Luleå University Press, pp. 849-858.
14. S. Lahdelma, E. K. Juuso. Intelligent condition monitoring for lime kilns, in Seeliger, A., P. Burgwinkel (Ed.) Tagungsband zum 6. Aachener Kolloquium fűr instandhaltung, Diagnose und Anlagenűberwachung, AKIDA 2006, November 14-15, 2006, Aachen, Germany, pp. 399-408. Aachener Schriften zur Rohstoff- und Entsorgungstechnik des Instituts für Bergwerks- und Hüttenmaschinenkunde, ASRE, Band 63, 2006, RWTH Aachen.
15. S. Lahdelma, E. Juuso, J. Strackeljan (2006): Neue Entwicklungen auf dem Gebiet der Wälzlagerüberwahung, in Seeliger, A., P. Burgwinkel (Ed.) Tagungsband zum 6. Aachener Kolloquium fűr instandhaltung, Diagnose und Anlagenűberwachung, AKIDA 2006, November 14-15, 2006, Aachen, Germany, pp. 447-460. Aachener Schriften zur Rohstoff- und Entsorgungstechnik des Instituts für Bergwerks- und Hüttenmaschinenkunde, ASRE, Band 63, 2006, RWTH Aachen.
16. Juuso, E. K. Integration of Intelligent Systems in Development of Smart Adaptive Systems, International Journal of Approximate Reasoning 35 (2004) 3, pp. 307-337.
17. Juuso, E. K. Fault Diagnosis based on Linguistic Equation Framework, in Ruokonen, T. (Ed.) Preprints of IFAC Symposium on Fault Detection, Supervision and Safety for Technical Processes SAFEPROCESS'94, June 13 - 16, 1994, Espoo, Finland, 1994, Hakapaino, Helsinki, Finland, pp. 374-379.
18. Juuso, E. K. Intelligent Methods in Diagnostical Process Analysis, in Halttunen, J. (Ed.), Proceedings of the XIV IMEKO World Congress, New measurements – Challenges and Visions, Tampere, June 1-6, 1997, Volume VII, pp. 1-6.
19. Juuso, E. K. Fuzzy Control in Process Industry: The Linguistic Equation Approach, in Verbruggen, H. B., Zimmermann, H.-J. and Babuska, R. (Eds.), Fuzzy Algorithms for Control, International Series in Intelligent Technologies, 1999, Kluwer, Boston, pp. 243-300.
20. E. Juuso, K. Leiviskä. Combining Monitoring and Process Data in Detecting Operation Conditions in Process Industry, in Maintenance, Condition Monitoring and Diagnostics, Proceedings of the 2nd International Seminar, 28-29 September 2005, Oulu, Finland, pp. 145-156.
©The 2nd World Congress on Engineering Asset Management (EAM) and The 4th International Conference on Condition Monitoring


![Who’s the longest? - PBworksstimson.pbworks.com/f/Slowly+Sloth.pdf · For fun activities and more, visit You may photocopy this sheet [Slowly Slowly Slowly Session 1] Hide and seek](https://img.pdfslide.us/doc/110x75/5e9a471ac3325225a87b9c62/whoas-the-longest-slothpdf-for-fun-activities-and-more-visit-you-may-photocopy.jpg)