Embed Size (px)
Citation preview
Advanced PowerPoint
Nirav R. Shah, MD, MPHNYU School of Medicine
J.B. Jones, PhD, MBAGeisinger Center for Health Research

Needs assessment…
“Using PowerPoint is like having a loaded AK-47 on the table: You can do very bad things with it.”
- Peter Norvig

Objectives
• Use PowerPoint’s advanced features:
– task panes, slide masters, action buttons, custom templates
– integrating information from other applications
– Using media (videos, images) in PowerPoint
• Use PowerPoint effectively

Objectives
• Use PowerPoint’s advanced features:
– task panes, slide masters, action buttons, custom templates
– integrating information from other applications
– Using media (videos, images) in PowerPoint
• Use PowerPoint effectively

Demo File
• Go to:– http://www.irielife.net/acp2009
• Click on the file called “sample.ppt”• When the pop-up appears, click
“save”• Save it to the desktop• Go to the desktop and double-click
on “sample.ppt” to open it

Changing Appearance
• Slide Master– Edit appearance of all slides
• Slide Layout– Edit arrangement of elements on
individual slides

Creating a Custom Template
• Open a new presentation• Select:
– View Master Slide Master
• Create:– Add logo, colors, shapes, etc.
• Save as: – Select “design template (*.pot)

Example of a Custom Template

Here is some text for this side
Here is some text for this side

Slide Transitions
• Use sparingly– Can apply to
• All slides• Selected slides
– Task pane Slide Transition

Custom Animations
• Use to:– emphasize key points– control pace of presentation– direct your audience’s attention– be creative…
• Options:– Built-in functions– Shortcut - duplicate slides
Specific Aims
1. Aim one here2. Aim two here3. Aim three here

Specific Aims
1. Aim one here2. Aim two here3. Aim three here
Specific Aims
1. Aim one here

Specific Aims
1. Aim one here2. Aim two here
Specific Aims
1. Aim one here2. Aim two here3. Aim three here

Custom Animations - Text
Goals• Improve sales 30%• Hire 3 salespeople• Recruit director
Achievements
Tables / Charts / Graphs
• Using information / figures / tables from other Microsoft applications

Paste Directly From Excel
Variable
Health Summary
Frequent
Monitoring
Office Visit Review
Office Visi
t Preparatio
n
Intensity of Use
Admini-strative Use
Graphing
Proxy Use
Referrals
Demo-graphic
healthsnapshot 0.91 0.18 0.17 0.12 0.03 0.08 0.12 0.06 0.09 0.08
problemlist 0.90 0.19 0.18 0.12 0.03 0.09 0.14 0.06 0.10 0.08
healthmaintenance 0.84 0.23 0.17 0.15 -0.02 0.21 0.13 0.05 0.14 0.07
medication 0.71 0.20 0.32 0.18 -0.11 0.26 0.10 0.04 0.17 0.11
histories 0.58 0.16 0.12 0.20 0.11 0.24 0.27 -0.01 0.01 0.02
labresults 0.22 0.91 0.10 0.08 0.05 0.01 0.13 0.01 0.04 0.01
labtests 0.25 0.90 0.14 0.08 -0.02 0.01 0.10 0.01 0.05 0.00
carefxn 0.50 0.62 0.41 0.16 -0.08 0.23 0.19 0.06 0.16 0.06
sess 0.18 0.55 0.23 0.26 -0.48 0.30 0.09 0.13 0.27 0.04
hitdays 0.18 0.55 0.23 0.26 -0.49 0.30 0.09 0.12 0.27 0.04
hitmo 0.22 0.46 0.13 0.16 -0.54 0.28 0.08 0.12 0.20 0.04
encounterdetails 0.22 0.13 0.87 0.19 0.03 -0.01 0.19 0.05 0.05 0.05
encounterreview 0.24 0.13 0.86 0.22 0.04 -0.02 0.18 0.06 0.06 0.04
letters 0.19 0.17 0.50 -0.04 -0.06 0.19 0.03 -0.01 0.13 0.03
drivingdirections 0.23 0.12 0.03 0.79 0.00 0.14 0.00 0.00 0.03 0.02
providerdetails 0.25 0.13 0.34 0.73 -0.02 0.05 0.08 -0.01 0.04 0.09
appt_final 0.18 0.34 0.22 0.60 -0.25 0.21 0.12 0.06 0.30 0.06
adminfxn 0.32 0.38 0.26 0.56 -0.17 0.21 0.13 0.23 0.39 0.08
ratioac -0.10 -0.21 -0.15 0.36 -0.09 -0.16 0.06 0.09 0.24 -0.02
avgfxnses 0.30 0.10 0.05 -0.03 0.81 -0.04 0.10 0.01 -0.02 0.03
avg_sess_len_mins 0.03 0.07 0.05 -0.01 0.80 0.16 0.04 0.03 0.07 0.01
avg_intrasess_days -0.18 -0.23 -0.04 -0.03 0.48 -0.16 -0.10 -0.06 -0.09 -0.05
patientnotes 0.05 0.04 0.05 0.19 0.08 0.70 0.15 -0.05 -0.03 -0.04
customerservicerequest 0.02 0.15 0.31 -0.03 -0.13 0.54 0.07 0.01 0.28 0.07
healthmaintenanceschedule 0.22 -0.01 -0.09 0.00 -0.01 0.51 0.04 0.11 0.14 0.00
personlpreferences 0.16 0.07 0.04 0.04 -0.08 0.46 -0.07 0.04 -0.05 0.14
flowsheetreportslist 0.25 0.15 0.17 0.06 -0.01 0.08 0.90 0.08 0.05 0.06
flowsheetreportdetails 0.23 0.16 0.19 0.08 0.01 0.07 0.90 0.06 0.04 0.06
switchcontext -0.02 0.00 0.02 -0.01 -0.03 -0.01 0.03 0.96 -0.01 0.01
proxyaccessview 0.15 0.08 0.05 0.09 -0.02 0.12 0.09 0.92 0.02 0.05
referralrequest 0.08 0.06 0.12 0.10 -0.06 0.15 -0.01 0.01 0.84 0.04
referralreview 0.35 0.21 0.10 0.20 0.00 -0.01 0.10 -0.04 0.68 0.05
addresschangerequest 0.04 0.04 -0.07 0.03 -0.01 0.03 0.02 0.01 0.03 0.90
demographics 0.16 -0.01 0.19 0.07 -0.01 0.11 0.08 0.04 0.05 0.83
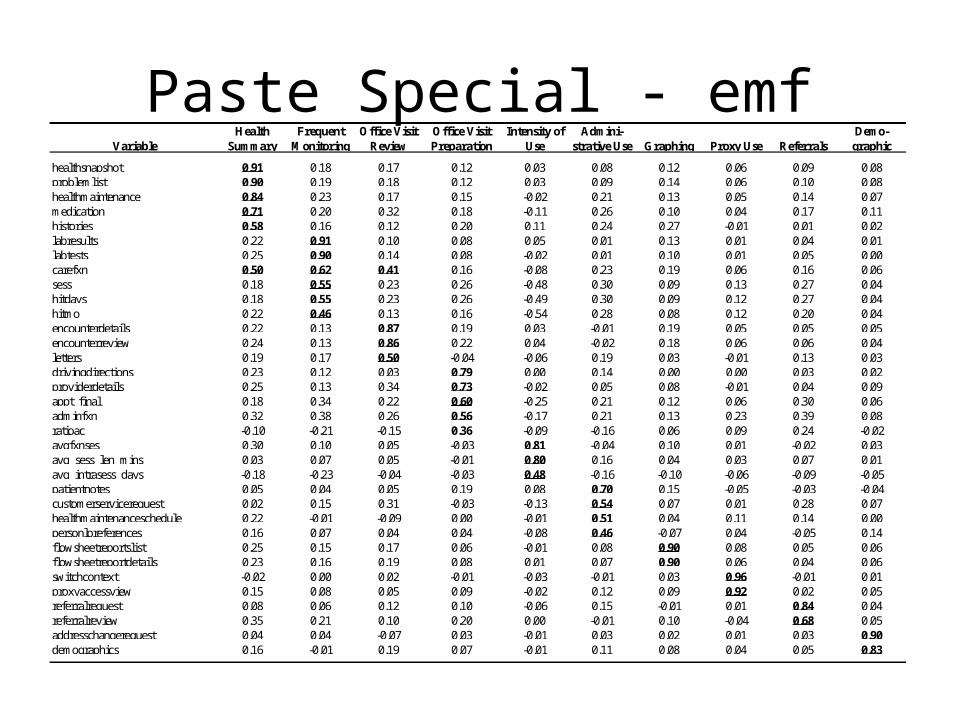
Paste Special - emfVariable
Health Summary
Frequent Monitoring
Office Visit Review
Office Visit Preparation
Intensity of Use
Admini-strative Use Graphing Proxy Use Referrals
Demo-graphic
healthsnapshot 0.91 0.18 0.17 0.12 0.03 0.08 0.12 0.06 0.09 0.08problemlist 0.90 0.19 0.18 0.12 0.03 0.09 0.14 0.06 0.10 0.08healthmaintenance 0.84 0.23 0.17 0.15 -0.02 0.21 0.13 0.05 0.14 0.07medication 0.71 0.20 0.32 0.18 -0.11 0.26 0.10 0.04 0.17 0.11histories 0.58 0.16 0.12 0.20 0.11 0.24 0.27 -0.01 0.01 0.02labresults 0.22 0.91 0.10 0.08 0.05 0.01 0.13 0.01 0.04 0.01labtests 0.25 0.90 0.14 0.08 -0.02 0.01 0.10 0.01 0.05 0.00carefxn 0.50 0.62 0.41 0.16 -0.08 0.23 0.19 0.06 0.16 0.06sess 0.18 0.55 0.23 0.26 -0.48 0.30 0.09 0.13 0.27 0.04hitdays 0.18 0.55 0.23 0.26 -0.49 0.30 0.09 0.12 0.27 0.04hitmo 0.22 0.46 0.13 0.16 -0.54 0.28 0.08 0.12 0.20 0.04encounterdetails 0.22 0.13 0.87 0.19 0.03 -0.01 0.19 0.05 0.05 0.05encounterreview 0.24 0.13 0.86 0.22 0.04 -0.02 0.18 0.06 0.06 0.04letters 0.19 0.17 0.50 -0.04 -0.06 0.19 0.03 -0.01 0.13 0.03drivingdirections 0.23 0.12 0.03 0.79 0.00 0.14 0.00 0.00 0.03 0.02providerdetails 0.25 0.13 0.34 0.73 -0.02 0.05 0.08 -0.01 0.04 0.09appt_final 0.18 0.34 0.22 0.60 -0.25 0.21 0.12 0.06 0.30 0.06adminfxn 0.32 0.38 0.26 0.56 -0.17 0.21 0.13 0.23 0.39 0.08ratioac -0.10 -0.21 -0.15 0.36 -0.09 -0.16 0.06 0.09 0.24 -0.02avgfxnses 0.30 0.10 0.05 -0.03 0.81 -0.04 0.10 0.01 -0.02 0.03avg_sess_len_mins 0.03 0.07 0.05 -0.01 0.80 0.16 0.04 0.03 0.07 0.01avg_intrasess_days -0.18 -0.23 -0.04 -0.03 0.48 -0.16 -0.10 -0.06 -0.09 -0.05patientnotes 0.05 0.04 0.05 0.19 0.08 0.70 0.15 -0.05 -0.03 -0.04customerservicerequest 0.02 0.15 0.31 -0.03 -0.13 0.54 0.07 0.01 0.28 0.07healthmaintenanceschedule 0.22 -0.01 -0.09 0.00 -0.01 0.51 0.04 0.11 0.14 0.00personlpreferences 0.16 0.07 0.04 0.04 -0.08 0.46 -0.07 0.04 -0.05 0.14flowsheetreportslist 0.25 0.15 0.17 0.06 -0.01 0.08 0.90 0.08 0.05 0.06flowsheetreportdetails 0.23 0.16 0.19 0.08 0.01 0.07 0.90 0.06 0.04 0.06switchcontext -0.02 0.00 0.02 -0.01 -0.03 -0.01 0.03 0.96 -0.01 0.01proxyaccessview 0.15 0.08 0.05 0.09 -0.02 0.12 0.09 0.92 0.02 0.05referralrequest 0.08 0.06 0.12 0.10 -0.06 0.15 -0.01 0.01 0.84 0.04referralreview 0.35 0.21 0.10 0.20 0.00 -0.01 0.10 -0.04 0.68 0.05addresschangerequest 0.04 0.04 -0.07 0.03 -0.01 0.03 0.02 0.01 0.03 0.90demographics 0.16 -0.01 0.19 0.07 -0.01 0.11 0.08 0.04 0.05 0.83

Paste vs. Paste Special
D
CB
AE
F
G
0
1
2
3
4
5
6
7
8
0 1 2 3 4 5 6 7
Frequency (Total Number of Sessions)
Inte
ns
ity
(A
vg
era
ge
Fu
nc
tio
ns
/Se
ss
ion
)
Cluster 1
Cluster 2
G
F
EA
BC
D
0
1
2
3
4
5
6
7
8
0 1 2 3 4 5 6 7
Frequency (Total Number of Sessions)
Inte
nsi
ty (
Avg
erag
e F
un
ctio
ns/
Ses
sio
n)
Cluster 1
Cluster 2
Paste Special (not editable, but looks true to original)
Paste (editable but ugly)
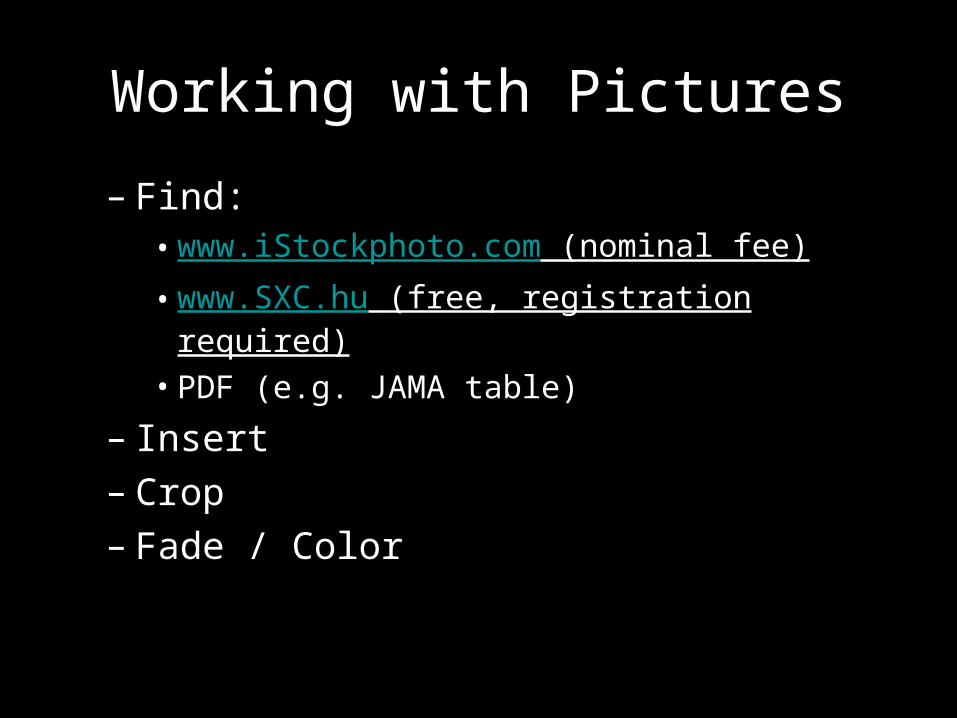
Working with Pictures
– Find:• www.iStockphoto.com (nominal fee)• www.SXC.hu (free, registration required)• PDF (e.g. JAMA table)
– Insert– Crop– Fade / Color


Vacation

Vacation

Vacation

Vacation

Equations in PowerPoint
• Useful for:– presenting
statistical formulas– describing methods
and/or results
• Use “insert object”• Example:
– Present a confidence interval calculation
/96.1 3 (96.1x
1.96 +/- SQRT(sigma/n)
vs
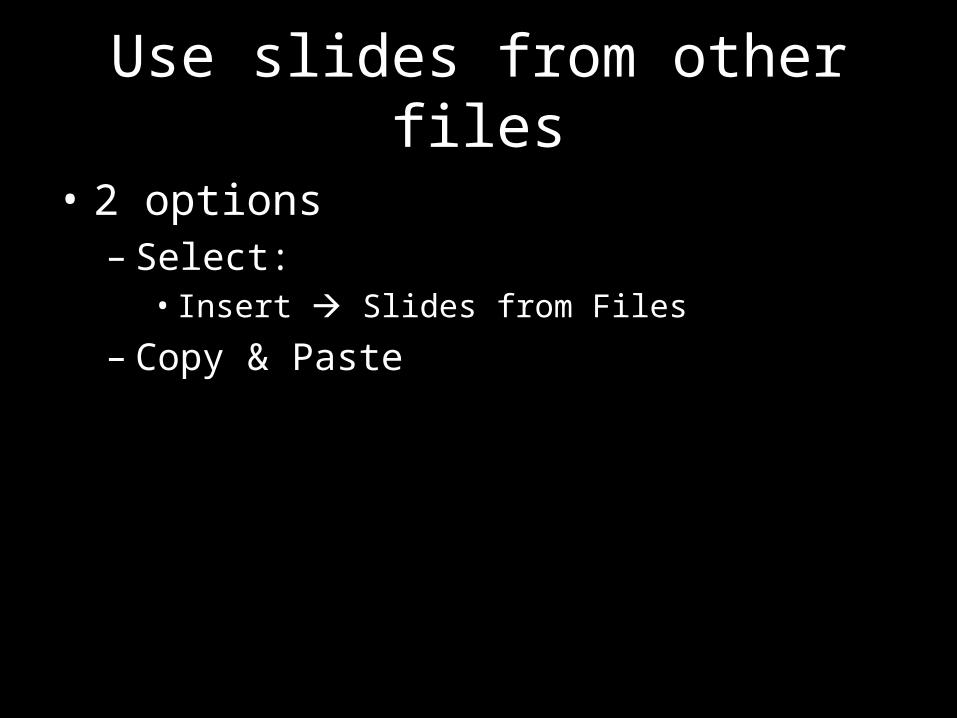
Use slides from other files
• 2 options– Select:
• Insert Slides from Files
– Copy & Paste
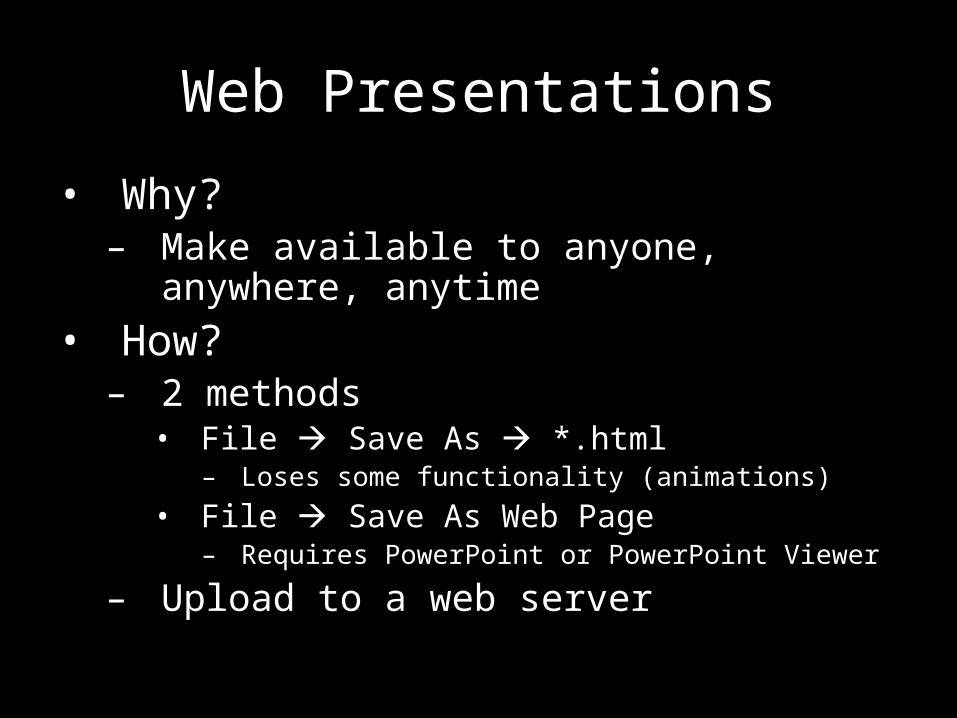
Web Presentations
• Why?– Make available to anyone, anywhere,
anytime• How?
– 2 methods• File Save As *.html
– Loses some functionality (animations)
• File Save As Web Page– Requires PowerPoint or PowerPoint Viewer
– Upload to a web server
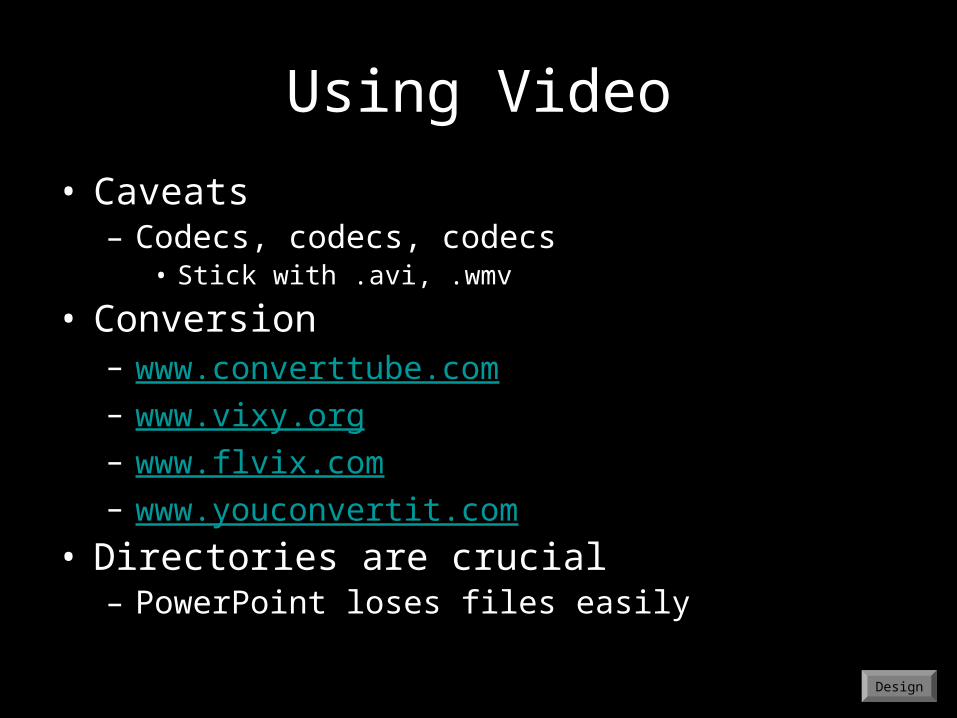
Using Video
• Caveats– Codecs, codecs, codecs
• Stick with .avi, .wmv
• Conversion– www.converttube.com– www.vixy.org– www.flvix.com– www.youconvertit.com
• Directories are crucial– PowerPoint loses files easily
Design
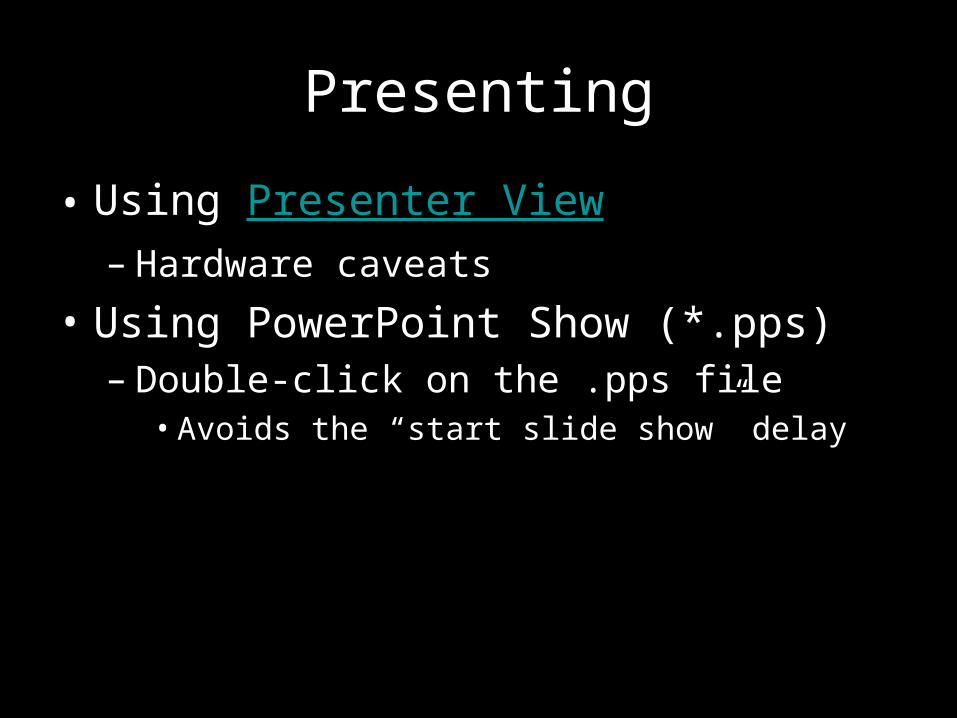
Presenting
• Using Presenter View– Hardware caveats
• Using PowerPoint Show (*.pps)– Double-click on the .pps file
• Avoids the “start slide show” delay
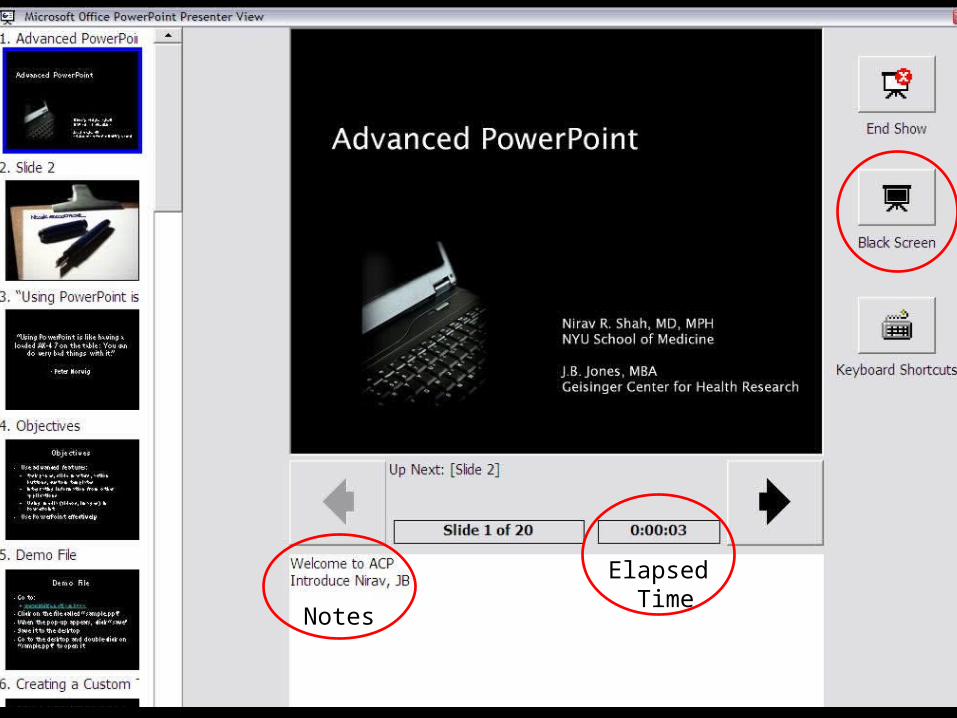
Notes
Elapsed Time

Extra Slides

Action Buttons - I
Geisinger Patients with Geisinger Clinic primary care provider
Portal Usersn = 3,297
Non-Portal Usersn = 29,600
Intervention Groupn = 1,649
Control Groupn = 1,648
Non-Portal Usersn = 1,649
Matched selection
Diagnosisof: CVD, DM,
or CHF?
Randomize
Exclude
Registered MyGeisinger
User?
Yes
No
Yes No
Table 1: Study Design
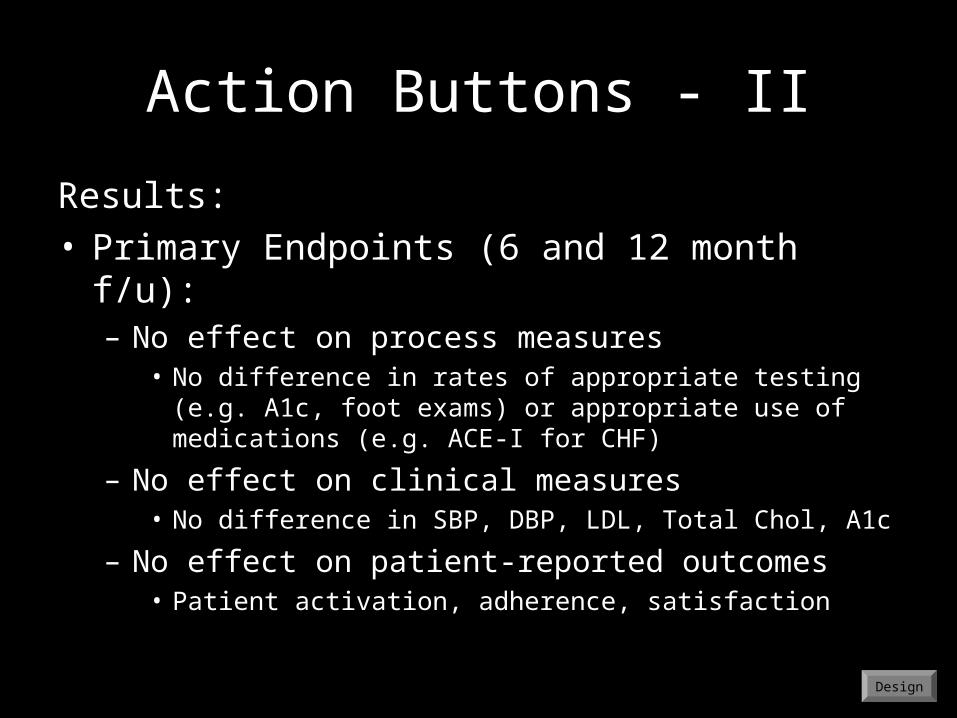
Action Buttons - II
Results:• Primary Endpoints (6 and 12 month f/u):
– No effect on process measures• No difference in rates of appropriate testing (e.g. A1c,
foot exams) or appropriate use of medications (e.g. ACE-I for CHF)
– No effect on clinical measures• No difference in SBP, DBP, LDL, Total Chol, A1c
– No effect on patient-reported outcomes• Patient activation, adherence, satisfaction
Design

Equation Editor
• “Embellishments”

Using Video
Video – with Controls
• Control Toolbox
Video – no controls