Embed Size (px)
Citation preview

Advanced Portfolio Management
Strategies for the Affluent
Stuart Chaussée

ADVANCED PORTFOLIO MANAGEMENT
All rights reserved. No part of this publication may be reproduced, stored in a special system, or transmitted in any form or by any means, electronic, mechanical, photocopying, recording or otherwise without prior permission.
The publication contains the opinions of its author and is designed to provide useful advice in regard to the subject matter covered. However, this publication is offered with the understanding that neither the author nor the publisher is engaged in rendering legal, accounting, investment, tax, estate planning or other professional service. If legal, investment or other advice is required the services of a competent professional should be sought. The author and publisher specifically disclaim any responsibility for liability, loss or risk, personal or otherwise, that is incurred as a consequence, directly or indirectly, of the use and application of any of the contents of this book.
Notwithstanding anything to the contrary set forth herein, Palisade Press (or the author) its officers and employees, affiliates, successors and assigns shall not, directly or indirectly be liable, in any way, to the reader or any other person for any reliance upon the information contained herein, or inaccuracies or errors in or omissions from the book, including but not limited to financial or investment data.
Printed in the United States of America, 2002. Stuart Chaussée, Palisade Press, Inc. All rights reserved.
ISBN: 1-893958-72-8

ADVANCED PORTFOLIO MANAGEMENT
For Linda,
R. Allison, Daisy and Henry
In loving memory of William B. Slottman
Professor of History
University of California at Berkeley
ADVANCED PORTFOLIO MANAGEMENT
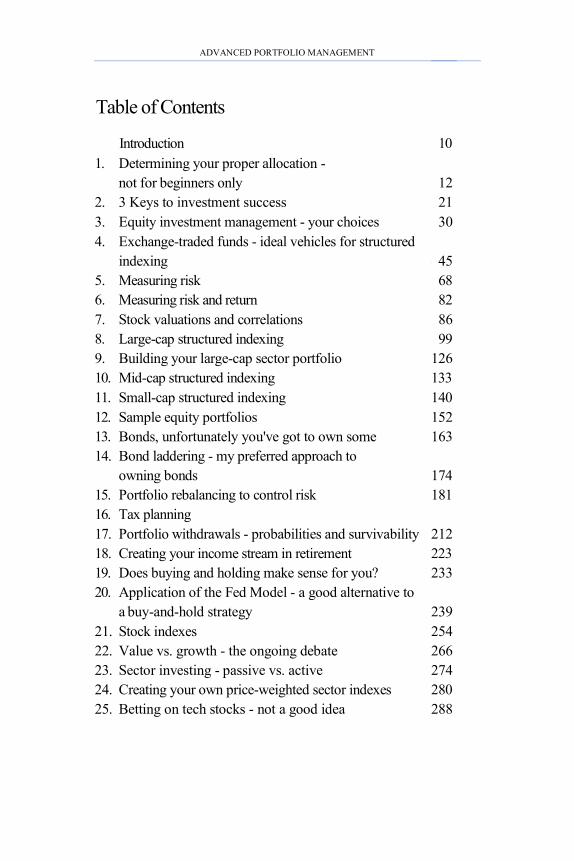
Table of Contents
Introduction 10
1. Determining your proper allocation - not for beginners only 12
2. 3 Keys to investment success 21 3. Equity investment management - your choices 30 4. Exchange-traded funds - ideal vehicles for structured
indexing 45 5. Measuring risk 68 6. Measuring risk and return 82 7. Stock valuations and correlations 86 8. Large-cap structured indexing 99 9. Building your large-cap sector portfolio 126 10. Mid-cap structured indexing 133 11. Small-cap structured indexing 140 12. Sample equity portfolios 152 13. Bonds, unfortunately you've got to own some 163 14. Bond laddering - my preferred approach to
owning bonds 174 15. Portfolio rebalancing to control risk 181 16. Tax planning 17. Portfolio withdrawals - probabilities and survivability 212 18. Creating your income stream in retirement 223 19. Does buying and holding make sense for you? 233 20. Application of the Fed Model - a good alternative to
a buy-and-hold strategy 239 21. Stock indexes 254 22. Value vs. growth - the ongoing debate 266 23. Sector investing - passive vs. active 274 24. Creating your own price-weighted sector indexes 280 25. Betting on tech stocks - not a good idea 288
ADVANCED PORTFOLIO MANAGEMENT
Table of Contents
Introduction 10
1. Determining your proper allocation - not for beginners only 12
2. 3 Keys to investment success 21 3. Equity investment management - your choices 30 4. Exchange-traded funds - ideal vehicles for structured
indexing 45 5. Measuring risk 68 6. Measuring risk and return 82 7. Stock valuations and correlations 86 8. Large-cap structured indexing 99 9. Building your large-cap sector portfolio 126 10. Mid-cap structured indexing 133 11. Small-cap structured indexing 140 12. Sample equity portfolios 152 13. Bonds, unfortunately you've got to own some 163 14. Bond laddering - my preferred approach to
owning bonds 174 15. Portfolio rebalancing to control risk 181 16. Tax planning 17. Portfolio withdrawals - probabilities and survivability 212 18. Creating your income stream in retirement 223 19. Does buying and holding make sense for you? 233 20. Application of the Fed Model - a good alternative to
a buy-and-hold strategy 239 21. Stock indexes 254 22. Value vs. growth - the ongoing debate 266 23. Sector investing - passive vs. active 274 24. Creating your own price-weighted sector indexes 280 25. Betting on tech stocks - not a good idea 288

ADVANCED PORTFOLIO MANAGEMENT
26. Turbocharging your portfolio 294 27. Using correlation coefficients to diversify an
existing portfolio 299 28. The low-basis stock dilemma 304 29. Optimizers, can they help you build the "optimal"
portfolio? 309 30. The case against investing in foreign stocks, and
one reason you may want to 315 31. Annuity blues 322 32. Real estate investment trusts 326
Epilogue 332 Appendix 335 Glossary 397 Bibliography and recommended reading 414 Favorite Web sites 417 Acknowledgments 418 About the Author 419
INTRODUCTION
— 10 —
IT’S BEEN ABOUT TWO YEARS since the Nasdaq crashed fromits highest reading of 5,048 on March 10, 2000. The ensuingcollapse, one of the worst in history for a major stock marketindex, brought the Nasdaq down 72%. It hit a low on September21, 2001. During the same period, the broad stock market, asmeasured by the S&P 500, was off approximately 37% peak-to-valley. The meltdown during the last couple of years has remindedprofessional and private investors of the importance ofdiversification and risk control in a portfolio.
When stocks were recently punishing investors, BarclaysGlobal Investors, the largest institutional asset manager in theworld, along with several other financial institutions, rolled out inexcess of 90 new exchange-traded funds (ETFs). These offeringshave changed the way indexers invest forever. The new ETFs,which track indexes that cover various sectors of the market, andboth style- (value and growth stocks) and size- (small-, mid-, andlarge-cap stocks) specific asset classes, arrived at an opportunetime. Investors have taken advantage of these investments, whichallow participants to control risk and diversification beyond what isavailable from traditional index funds. ETF assets now account forover $80 billion. In short, with over a hundred ETFs available toinvestors, covering every asset class imaginable (real estate andforeign markets included), this is indeed the new age of indexing.
Introduction
We learn geology the morning after the earthquake.—RALPH WALDO EMERSON, writer
INTRODUCTION
— 11 —— 11 —
This book is much more than an updated version of my firstbook entitled Portfolio Management for the Affluent: Guide to atax-efficient, low-cost, growth-oriented portfolio (PalisadeBusiness Press, 2000). I have attempted to show investors(professional and individual) how to take advantage of the newETF offerings to improve on traditional index-based portfoliomanagement. My preferred approach to equity investing is calledstructured, index-based portfolio management. Structuredindexing involves a more detailed, hands-on approach to indexingthan traditional indexing. Rather than simply buying broad-basedindexes, the structured approach allows you to define your ownasset class and sector weightings, and control risk beyond whatwas possible with the “old” indexing approach.
This book is written and formatted in a way that allows you toeasily skip around and read the chapters that interest you. Pleasedo so.
The title of this book is not meant to intimidate. While Iassume you have a certain knowledge of investing, my simplewriting style—if I may be so bold as to call it a “style”—shouldmake somewhat difficult topics less daunting for all investors.This book, is, however, geared towards the affluent investor. And,some of the strategies and topics discussed will be irrelevant forinvestors who are still in the “savings mode” rather than“retirement mode.” Nevertheless, most of the topics covered inthis book should help all investors, regardless of your net worth orage. I hope this book will help you better control risk andimprove your portfolio’s performance.

ADVANCED PORTFOLIO MANAGEMENT
— 12 —
YOUR ANSWERS TO THREE KEY QUESTIONS in thischapter will help you determine which investments you shouldown (stocks, bonds or cash equivalents), and the percentage ofyour portfolio that you should allocate to each asset class. This isthe first and most important step of your investment plan.
Determining your proper allocation—not for beginners only
1
The hallmark of the ‘right’ asset allocation is a portfolio structure that minimizes the likelihood that
the client is going to abandon the strategy.—ROGER GIBSON, writer, financial advisor
Over the past half-century a 60% stock and 40% bondmix (based on S&P 500 stocks and intermediate-termgovernment bonds) returned an average of 10.2% peryear, and rarely lost as much as 5% in any single year.
—STAN LUXENBERG, MUTUAL FUNDS
If you have money you will need in the next five years, it shouldn’t be in stocks.
—JONATHAN CLEMENTS, THE WALL STREET JOURNAL
I can’t find the ideal balance between equity and fixed income for clients, because I can
never truly know when they’ll panic.—ROGER GIBSON, writer, financial advisor
DETERMINING YOUR PROPER ALLOCATION
— 13 —
I have listed three questions in this chapter, in order ofimportance. First, you need to decide how much temporary lossyou are willing to accept in order to decide how much money youwill allocate in equities. If your answer to this question turns outto be inaccurate, then you can forget about the other twoquestions. If your overall portfolio declines by a certainpercentage, and you weren’t expecting it, or you decide, after thefact, that you really can’t handle the loss, then you may decide tocompletely abandon your investment plan—probably at exactlythe wrong time. Your investment time horizon (question 2) andyour financial objectives (question 3) won’t matter much if youabandon your investment plan because of temporary losses, orunexpected volatility in your portfolio. So, you need to knowyourself as an investor (your risk profile), and answer thesequestions as accurately as possible. This section should not beoverlooked, regardless of your level of investment experience.
1) What is your tolerance for risk? How much“temporary” loss can you handle?
I use the word “temporary” because I believe stock marketlosses are temporary. The market has always come back from itslosses in the past, so I assume it will do so in the future—it issimply a matter of time. Sure, temporary may mean a long time.There have been periods of ten years or more when stocks havedeclined or gone sideways. Extended bear markets of more than3 years are rare, but they’ve happened before and they’ll happenagain—we may be in the middle of one right now.
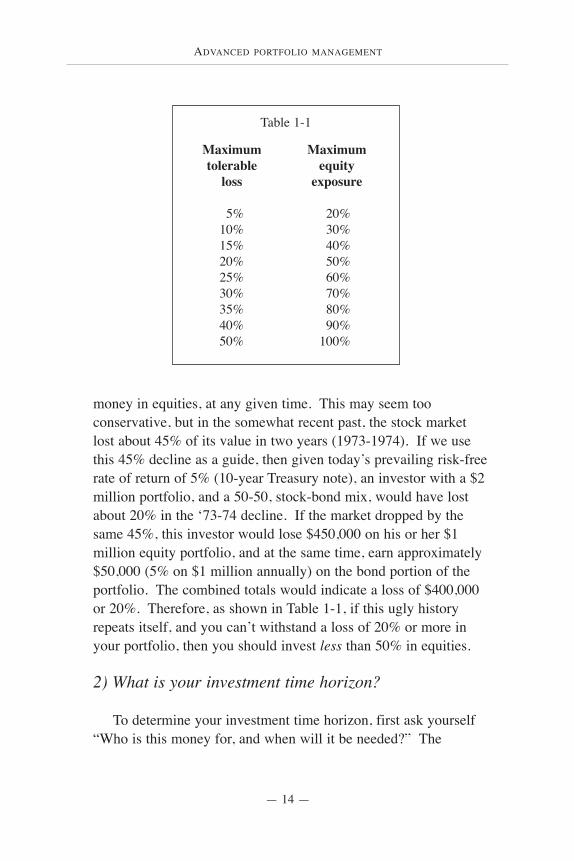
Most investors are risk averse—the hurt they feel from losingmoney, even temporarily, is greater than the joy they experiencefrom making money. Therefore, most of us should err on theconservative side when allocating our assets. If you cannothandle temporary losses in your overall portfolio of more than20%, then you really shouldn’t have more than 50% of your
— 14 —
ADVANCED PORTFOLIO MANAGEMENT
money in equities, at any given time. This may seem tooconservative, but in the somewhat recent past, the stock marketlost about 45% of its value in two years (1973-1974). If we usethis 45% decline as a guide, then given today’s prevailing risk-freerate of return of 5% (10-year Treasury note), an investor with a $2million portfolio, and a 50-50, stock-bond mix, would have lostabout 20% in the ‘73-74 decline. If the market dropped by thesame 45%, this investor would lose $450,000 on his or her $1million equity portfolio, and at the same time, earn approximately$50,000 (5% on $1 million annually) on the bond portion of theportfolio. The combined totals would indicate a loss of $400,000or 20%. Therefore, as shown in Table 1-1, if this ugly historyrepeats itself, and you can’t withstand a loss of 20% or more inyour portfolio, then you should invest less than 50% in equities.
2) What is your investment time horizon?
To determine your investment time horizon, first ask yourself“Who is this money for, and when will it be needed?” The
Table 1-1
Maximumtolerable
loss
5%10%15%20%25%30%35%40%50%
Maximum equity
exposure
20%30%40%50%60%70%80%90%
100%

answers are not always obvious. For most of us, our money is forus. If you are a couple nearing retirement your primary need isprobably to fund your own retirement. You have worked hard foryour money, perhaps put your kids through college and graduateschool, and now you plan to use your savings to provide you withfinancial security and income throughout your retirement. If, onthe other hand, you are well into retirement, you are probablycounting on your money to continue to provide you with a certainlifestyle for the rest of your life. You basically want to make sureyou don’t run out of money.
I have found that there are other, less-obvious circumstanceswhen you may have quite different plans for your money. If youare wealthy enough to comfortably maintain your lifestylethroughout your lifetime, you may decide that some of yourmoney really isn’t for you after all. How so? Well, if you knowyou will never run out of money, you may decide to invest part, or most, of your portfolio, for someone else—perhaps your heirs.For example, if you are an elderly investor with a life expectancyof fifteen years, you may decide to keep enough money in cashequivalents and fixed-income investments (basically assuming norisk) to live comfortably for the rest of your life. And, you maythen decide to invest the remainder of your portfolio according toyour heirs’ investment objectives. Assuming your heirs are ageneration behind you in age, they obviously have a much longertime horizon than you. It would make sense, therefore, toconsider allocating the investments earmarked for your muchyounger heirs, in equities. This example shows that although youmay be ultraconservative, it may still make sense for you to ownequities for the portion of your portfolio that you will not needduring your lifetime.
Your investment time horizon is important because it will helpyou determine what types of investments you should own andultimately what percentage of your assets you should invest in
— 15 —— 15 —
DETERMINING YOUR PROPER ALLOCATION
ADVANCED PORTFOLIO MANAGEMENT
— 16 —
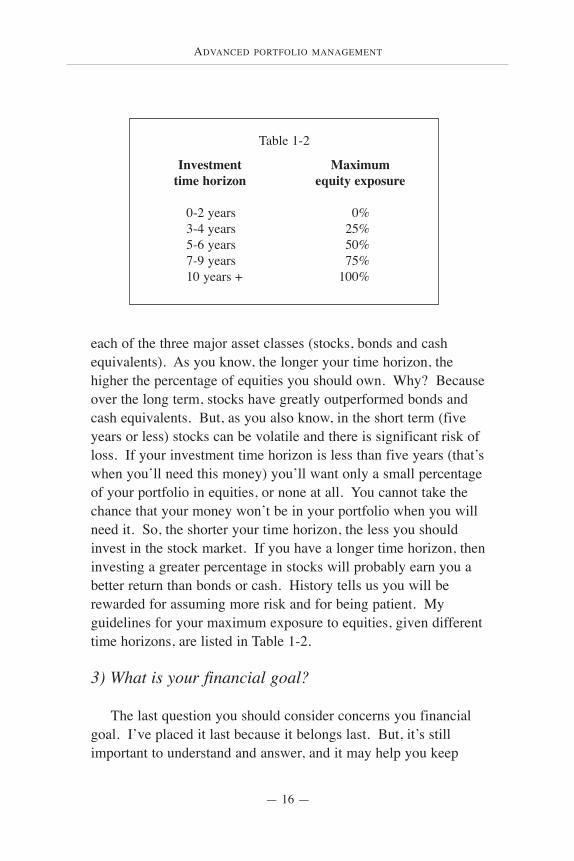
each of the three major asset classes (stocks, bonds and cashequivalents). As you know, the longer your time horizon, thehigher the percentage of equities you should own. Why? Becauseover the long term, stocks have greatly outperformed bonds andcash equivalents. But, as you also know, in the short term (fiveyears or less) stocks can be volatile and there is significant risk ofloss. If your investment time horizon is less than five years (that’swhen you’ll need this money) you’ll want only a small percentageof your portfolio in equities, or none at all. You cannot take thechance that your money won’t be in your portfolio when you willneed it. So, the shorter your time horizon, the less you shouldinvest in the stock market. If you have a longer time horizon, theninvesting a greater percentage in stocks will probably earn you abetter return than bonds or cash. History tells us you will berewarded for assuming more risk and for being patient. Myguidelines for your maximum exposure to equities, given differenttime horizons, are listed in Table 1-2.
3) What is your financial goal?
The last question you should consider concerns you financialgoal. I’ve placed it last because it belongs last. But, it’s stillimportant to understand and answer, and it may help you keep
Table 1-2
Investment time horizon
0-2 years3-4 years5-6 years7-9 years10 years +
Maximumequity exposure
0%25%50%75%
100%
DETERMINING YOUR PROPER ALLOCATION
— 17 —
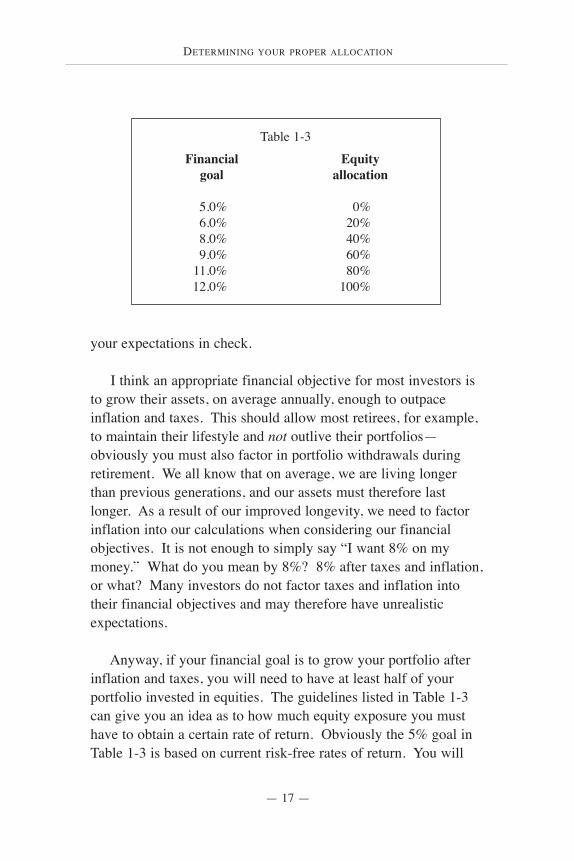
your expectations in check.
I think an appropriate financial objective for most investors isto grow their assets, on average annually, enough to outpaceinflation and taxes. This should allow most retirees, for example,to maintain their lifestyle and not outlive their portfolios—obviously you must also factor in portfolio withdrawals duringretirement. We all know that on average, we are living longerthan previous generations, and our assets must therefore lastlonger. As a result of our improved longevity, we need to factorinflation into our calculations when considering our financialobjectives. It is not enough to simply say “I want 8% on mymoney.” What do you mean by 8%? 8% after taxes and inflation,or what? Many investors do not factor taxes and inflation intotheir financial objectives and may therefore have unrealisticexpectations.
Anyway, if your financial goal is to grow your portfolio afterinflation and taxes, you will need to have at least half of yourportfolio invested in equities. The guidelines listed in Table 1-3can give you an idea as to how much equity exposure you musthave to obtain a certain rate of return. Obviously the 5% goal inTable 1-3 is based on current risk-free rates of return. You will
Table 1-3
Financialgoal
5.0%6.0%8.0%9.0%
11.0%12.0%
Equityallocation
0%20%40%60%80%
100%
ADVANCED PORTFOLIO MANAGEMENT
— 18 —
need to adjust this percentage to reflect prevailing rates. Andremember, these percentages are based on more than 50 years ofdata, but future returns are obviously unpredictable. Nonetheless,I think these guidelines are appropriate for today’s investor.
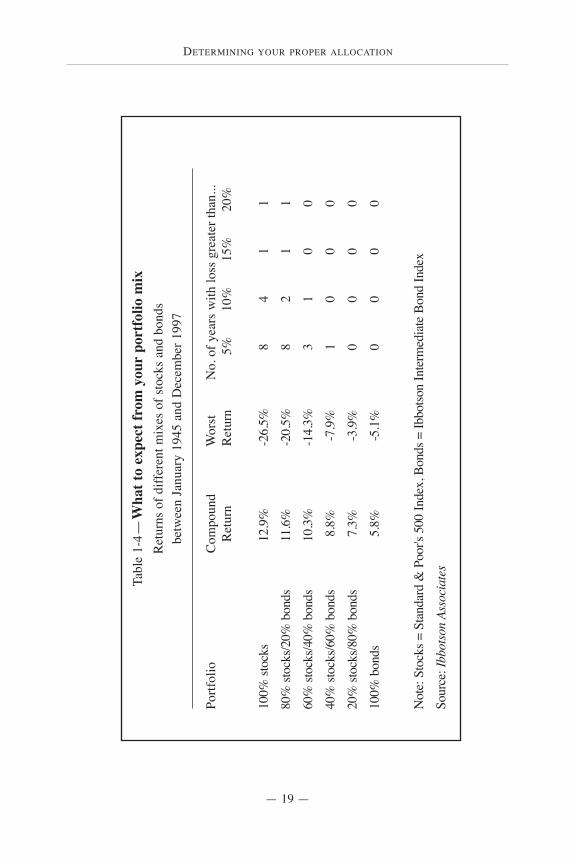
If you choose a specific average annual percentage return asyour financial goal, you need to recognize that it may beunattainable based on your overall allocation. The percentageslisted in Table 1-3 should help keep your expectations in check.For example, you may want a 10% average annual return beforetaxes and inflation, but if you only have 40% of your money inequities, you won’t see this kind of return. You must have realisticexpectations and you also need to understand that these are onlyaverage returns. As I mentioned earlier, equities can performmiserably for a number of years (so can bonds), so yourperformance will vary greatly from the percentages I’ve shown.Recognize that although you may have a certain allocation that hashistorically given investors a certain average annual return, thismight not be the case going forward—we don’t know what thefuture holds.
What to expect from your portfolio
In a recent survey from the Gallup Organization and UBSPaineWebber, investors offered a prediction of the market’s returnover the next 10 years. Approximately 40% of the respondentsthought stocks would deliver 15% or more annually. Given thefact that during the past two decades stocks have performedincredibly well, this response is not unexpected (many investorsdon’t remember the meager returns of the 1960s and 1970s).Going forward, what I do not expect is a repeat of the past twodecades. Of course I have no idea what stocks will return in thefuture (I make my best guess in the epilogue), but I do thinkstocks will return less than their historical average annual return ofapproximately 12%. If you are expecting more, you may be sorely
DETERMINING YOUR PROPER ALLOCATION
— 19 —
Tabl
e 1-
4 —W
hat t
o ex
pect
from
you
rpo
rtfo
lio m
ixR
etur
ns o
f diff
eren
t mix
es o
f sto
cks
and
bond
s be
twee
n Ja
nuar
y 19
45 a
nd D
ecem
ber 1
997
Portf
olio
Com
poun
dW
orst
N
o. o
f yea
rs w
ith lo
ss g
reat
er th
an...
Ret
urn
Ret
urn
5%
10%
15%
20%
100%
stoc
ks12
.9%
-26.
5%8
41
1
80%
stoc
ks/2
0% b
onds
11.6
%-2
0.5%
82
11
60%
stoc
ks/4
0% b
onds
10
.3%
-14.
3%3
10
0
40%
stoc
ks/6
0% b
onds
8.8%
-7.9
%1
00
0
20%
stoc
ks/8
0% b
onds
7.3%
-3.9
%0
00
0
100%
bon
ds5.
8%-5
.1%
00
00
Not
e: S
tock
s = S
tand
ard
& P
oor's
500
Inde
x, B
onds
= Ib
botso
n In
term
edia
te B
ond
Inde
x
Sour
ce: I
bbot
son
Asso
ciat
e s
ADVANCED PORTFOLIO MANAGEMENT
— 20 —
disappointed. If you believe in reversion-to-mean, which statesthat stock outperformance during the past two decades willprobably revert to a mean, or average return, then you’d expectstocks to underperform for some time.
Summary
When reviewing your answers to the questions in this chapter,be sure to err on the conservative side to help determine yourappropriate asset allocation. For example, you may consideryourself an aggressive investor, and you are willing to assume thepossibility of a 30% loss or more in your portfolio, but if your timehorizon is only two years, then you shouldn’t own any stocks atall. As a rule of thumb, if your investment time horizon is lessthan three years, don’t own stocks. And, if you can’t tolerate anyloss (no matter how temporary), then you shouldn’t own stocks,period. For the ultraconservative investor, you should stick withshort-term bonds and cash. This may seem like a poor investmentplan, but if you have a low tolerance for risk and a short timehorizon, then it is an appropriate plan for you.
3 KEYS TO INVESTMENT SUCCESS
— 21 —
I BELIEVE THE KEYS TO SUCCESSFUL INVESTING can beidentified by a few simple concepts. In short, investors should useproper diversification with uncorrelated investments and astructured, index-based approach to build an optimal portfolio.Then, use periodic rebalancing to control risk. I’ll discuss eachcomponent in brief in this chapter, and I’ll get into more details inlater chapters.
3 keys to investment success
2
Assets with low correlation to each other tend tohave contrasting performance from year toyear. Analogously, the pistons of an engine donot all move in the same direction at the sametime, which is highly beneficial to the motorist.Because the pistons fire in sequence, the engineproduces continuous power rather than a seriesof violent surges and stalls—the automotiveequivalent of high volatility. In like manner, thecontrasting performance of different assets fromyear to year can be beneficial to a portfolio.
—CRAIG L. ISRAELSEN, FINANCIAL PLANNING
Lower risk and higher performance arereasons to rebalance an investment portfolio.
—THE WALL STREET JOURNAL
ADVANCED PORTFOLIO MANAGEMENT
— 22 —
Proper diversification with uncorrelated investments
Stock-market diversification gives you the best chance to getlong-term decent returns from your overall portfolio. We’ve allheard the advice “Don’t put all your eggs in the same basket,” butit’s relatively easy to ignore this advice if you don’t have a verydisciplined, unemotional investment plan in place. The market’srecent past has hopefully taught many investors how much it canhurt if you own only “one basket of eggs.” As technology,telecommunication services and Internet stocks got hammered in2000 and 2001, many other investments performed well. Small-and mid-cap stocks have come back in favor. Value stocks havealso performed incredibly well. Furthermore, bonds and cashhave given investors a safety cushion to “soften the blow” duringthis bear market. This proves how important it is to maintain adiversified portfolio.
Diversification is the most important factor in controlling riskand ultimately ensures steady, decent long-run returns. Theconcept of diversification is not new. Harry Markowitz, a pioneerof Modern Portfolio Theory (MPT) and a Nobel laureate, took theconcept of diversification and made it the focus of good investing.He recognized that if you could find different asset classes thatmoved in an uncorrelated fashion (one rises when the other falls),you could provide yourself with some protection in volatilemarkets, and therefore reduce risk. What Markowitz discoveredwas that you could structure a portfolio of stocks (or asset classes)in such a way that there would be less risk in the portfolio as awhole, than in any of the individual pieces.
Markowitz’s analysis looked at correlation coefficients to showhow asset classes relate to one another. Asset classes that movetogether had a larger positive covariance number, while those withdissimilar price movements had negative covariance. Theanalysis can be heavy, but the concept is simple. Burton G.
3 KEYS TO INVESTMENT SUCCESS
— 23 —— 23 —
Malkiel, in his national bestseller entitled, A Random Walk DownWall Street, provides a simple example of how importantcorrelation coefficients are when investing, so that all investorscan easily appreciate the concept. He gives us the example of anisland economy with only two businesses. One business is a largeresort with beaches, golf courses and sporting activities. The otherbusiness is a manufacturer of umbrellas. Obviously in Malkiel’sisland economy, weather is the critical factor—it will affect bothbusinesses. When the sun shines the large resort business doesvery well. During the rainy season the large resort, with itsbeaches and golf courses performs poorly, while at the same time,the umbrella manufacturer thrives.
Consider that there is an equal amount of sunny and rainydays. If, as an investor, you bought stock in the umbrellamanufacturer (according to Malkiel’s example), you would findthat half the time you earned a return of 50% on your money andhalf the time you lost 25%. However, your expected return was12.5%, on average. Malkiel asks us to consider that theinvestment in the resort yields the same average returns as theumbrella manufacturing business. Now, as an investor, instead ofbuying stock in only one of the island’s businesses, you buy equalamounts of each. What happens? During the sunny season yourinvestment in the resort produces a 50% return, but you lose 25%in the umbrella business. However, because you were diversified,you still earned a 12.5% return. During the rainy season the samething happens. The umbrella manufacturing business returns 50%but you lose 25% on the resort. Still, your diversified portfoliohelped smooth out your returns and, in this example, still provideda positive return.
The key to successful investing in Malkiel’s example was notonly diversification, but proper diversification, with uncorrelatedinvestments. This example shows how uncorrelated investmentslessen risk and reduce volatility. The two different island
ADVANCED PORTFOLIO MANAGEMENT
— 24 —— 24 —
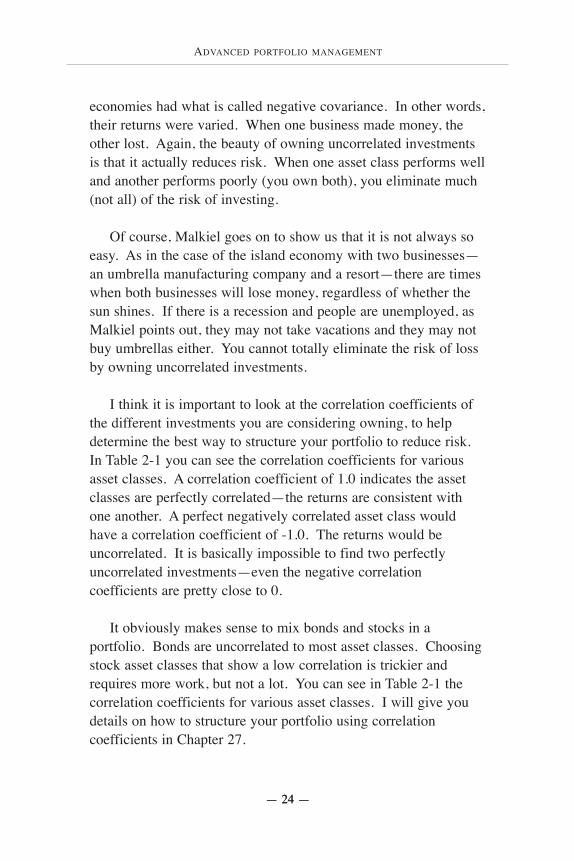
economies had what is called negative covariance. In other words,their returns were varied. When one business made money, theother lost. Again, the beauty of owning uncorrelated investmentsis that it actually reduces risk. When one asset class performs welland another performs poorly (you own both), you eliminate much(not all) of the risk of investing.
Of course, Malkiel goes on to show us that it is not always soeasy. As in the case of the island economy with two businesses—an umbrella manufacturing company and a resort—there are timeswhen both businesses will lose money, regardless of whether thesun shines. If there is a recession and people are unemployed, asMalkiel points out, they may not take vacations and they may notbuy umbrellas either. You cannot totally eliminate the risk of lossby owning uncorrelated investments.
I think it is important to look at the correlation coefficients ofthe different investments you are considering owning, to helpdetermine the best way to structure your portfolio to reduce risk.In Table 2-1 you can see the correlation coefficients for variousasset classes. A correlation coefficient of 1.0 indicates the assetclasses are perfectly correlated—the returns are consistent withone another. A perfect negatively correlated asset class wouldhave a correlation coefficient of -1.0. The returns would beuncorrelated. It is basically impossible to find two perfectlyuncorrelated investments—even the negative correlationcoefficients are pretty close to 0.
It obviously makes sense to mix bonds and stocks in aportfolio. Bonds are uncorrelated to most asset classes. Choosingstock asset classes that show a low correlation is trickier andrequires more work, but not a lot. You can see in Table 2-1 thecorrelation coefficients for various asset classes. I will give youdetails on how to structure your portfolio using correlationcoefficients in Chapter 27.

3 KEYS TO INVESTMENT SUCCESS
— 25 —
Tabl
e 2-
1—A
sset
cla
ss c
orre
latio
n co
effic
ient
s (12
/79-
2/02
)D
escr
iptio
nA
BC
DE
FG
HI
JK
A) 9
0-D
ay T
reas
ury
Bill
s-
-.09
.43
.30
.06
.08
.04
-.08
.09
-.02
.15
B) C
apita
l Int
l. EA
FE-.0
9-
.16
.25
.47
.30
.53
.57
.15
.51
.36
C) C
orp.
Bon
ds H
igh
Qua
lity
.30
.16
-.4
4.2
8.4
1.2
3.4
3.9
1.2
4.5
8D
) REI
Ts/E
quity
.06
.25
.44
-.4
1.8
7.1
6.6
4.3
9.4
4.8
4E)
Rus
sell
2000
Gro
wth
Inde
x.0
9.4
7.2
8.4
1-
.67
.77
.67
.20
.96
.62
F)R
usse
ll 20
00 V
alue
Inde
x.0
4.3
0.4
1.8
7.6
7-
.35
.78
.38
.63
.92
G) S
&P/
Bar
ra G
row
th In
dex
-.08
.53
.23
.16
.76
.35
-.7
0.2
0.7
8.3
9H
) S&
P/B
arra
Val
ue In
dex
-.07
.57
.43
.64
.67
.78
.70
-.4
2.6
7.8
0I)
Sal
omon
Tre
asur
y 10
+ Y
rs.
.09
.15
.91
.39
.20
.38
.20
.42
-.2
0.5
5J)
Wils
hire
Mid
-Cap
Gro
wth
-.02
.51
.24
.44
.96
.63
.78
.67
.20
-.6
1K
) Wils
hire
Mid
-Cap
Val
ue.1
5.3
6.5
8.8
4.6
2.9
2.3
9.8
0.5
5.6
1-
ADVANCED PORTFOLIO MANAGEMENT
— 26 —— 26 —
Structured, index-based portfolio management
The foundation of Modern Portfolio Theory states thatmarkets are efficient. The Efficient Market Theory (EMT) saysthat current market prices for all securities fairly reflect allavailable information and knowledge. Believers in EMT thinkthat since all available information in the marketplace isimmediately priced into securities, it is therefore impossible forany one investment manager or investor to take advantage of anyinconsistencies in pricing. In other words, active managers, thosewho try to search out and buy securities in an attempt to beat themarket, actually can add little, or no value. If they happen to beatthe market it is either done by luck or illegally (insider trading).Larry Swedroe, in his book entitled What Wall Street Doesn’t WantYou To Know, gave an excellent analogy about the efficiency ofmarkets—
If you believe in efficient markets you are probably an indexeror passive manager. You believe that it makes more sense tosimply buy asset classes and sector indexes rather than activelytrade a portfolio of individual securities, in an attempt to beat themarket. You prefer to accept the return of the asset class you ownand you therefore eliminate the high probability ofunderperforming that asset class over the long run. I believe thatmost active managers will do worse than their benchmarks
Imagine an art auction where you are the only expertamong a group of amateurs. In that circumstance, itmight be possible to find a bargain. On the other hand,if you are one of a group of mostly experts, it is far lesslikely that you will find bargain prices. The same is trueof stocks. The competition among all the professionalactive managers insures that the market price is highlylikely to be the correct price.
3 KEYS TO INVESTMENT SUCCESS
— 27 —— 27 —
(indexes) over the long run—especially after trading costs,management fees and taxes are factored into the equation.
Traditional indexers use broad-based indexes to construct aportfolio. The indexes are typically bought in whole pieces (e.g.,S&P 500, Russell 2000, MSCI EAFE). While I believe thisapproach is more attractive than active management, I also believethere is a better alternative.
My preferred approach to investing, and one of the keys tobuilding a successful portfolio, is called structured, index-basedportfolio management. Structured and traditional indexers aresimilar in that they believe it is folly to choose individualsecurities in an attempt to outdo the market—they believe marketsare efficient. But, this is where the similarities end. Thestructured approach involves understanding the risks inherent inthe markets as a whole and in different asset classes and sectors.This approach allows room for an active component. In mypractice, the active component involves sector and asset classvaluations, and to some degree, forecasting. By combining anactive component with an awareness of the various risks in equityinvesting (market, style and size), we can improve on “traditional”indexing. Structured indexing requires you to buy concentrated,index-based investments (value, growth and sector indexes)separately in your portfolio. In this way, you maintain bettercontrol of both size and style risks in your portfolio. Last,structured indexing also gives you much better control of taxesthan traditional indexing. I’ll discuss the details of how tostructure your index-based portfolio in Chapters 8-12.
Periodic Rebalancing
If proper diversification of uncorrelated investments within astructured index-based portfolio gives you the best chance fordecent long-term returns, then periodic rebalancing is your best
ADVANCED PORTFOLIO MANAGEMENT
— 28 —
bet for ongoing risk control. Rebalancing involves periodicallyrestoring your portfolio to its original target allocations. It isusually performed on a quarterly or an annual basis. Or, if themarkets are volatile, you may rebalance at any given time duringthe year, whenever it makes sense.
Risk control is the main reason to rebalance. Here’s how itworks. Rebalancing forces you to periodically take money froman asset class or sector that has performed well, and reallocateyour money to your other investments that have performed poorly(or less well). By reducing your exposure to certain asset classesand sectors in your portfolio, you control risk. With rebalancing,you keep your portfolio’s risks aligned with your own tolerancefor risk. If you don’t rebalance, and you let the markets determineyour allocation for you, you basically lose control.
The other reason to rebalance is to hopefully improve yourperformance. Since rebalancing forces you to take money fromyour winners and invest more in your laggards, you’re basicallybuying low and selling high. This type of rebalancing makessense if you believe in reversion-to-mean. Again, reversion-to-mean states that markets (asset classes and sectors) return to somesort of mean return over time. Investments that have laggedrecently will eventually revert to their mean and outperform yourpresent winners. Likewise, investments that have outperformedwill eventually revert too, and underperform, to get back to theirmean.
Reversion-to-mean applies to stocks and bonds, value versusgrowth, large stocks versus small stocks, etc. This theory explainsthe potential performance advantage for investors whoperiodically rebalance. Reversion-to-mean proponents consider itintelligent to periodically take money from better performinginvestments, and dump the proceeds in the “temporary” losers.Your losers will eventually revert and perform better—after
— 28 —
3 KEYS TO INVESTMENT SUCCESS
— 29 —
you’ve bought more—while your winners will soon give backsome of their strong gains, since they too, will revert to a meanreturn.
5/25 Rule
Rebalancing should be performed using the 5/25 Rule. The5/25 Rule suggests rebalancing only when asset classes movesubstantially away from your target allocations—you don’t wantto reallocate too often since transaction fees and taxes may haveto be paid. I believe it makes sense to rebalance when an assetclass or sector is weighted greater than, or less than, its targetallocation by an absolute 5% move from the original allocation.For example, if your initial target allocation for the consumerstaples sector was 10% of your portfolio, you would rebalance ifits weighting was an absolute 5% or more below, or above, yourtarget (0% or 10% of your portfolio). By applying the 25% rule,you would also rebalance if the consumer staples sector, in thisexample, was 2.5% below, or above, your target (25% of youroriginal target of 10%). For example, if this sector now represents12.5% of your portfolio (or 7.5%, if its weighting declined) itwould now be time to consider reallocating to bring the sectorback to your original target allocation. You should rebalance ifeither the 5% or the 25% rule is triggered.
By periodically rebalancing your structured, index-basedportfolio of uncorrelated investments, you will control risk andmaintain proper diversification at all times.
ADVANCED PORTFOLIO MANAGEMENT
— 30 —
INVESTMENT MANAGERS GENERALLY FALL into twoseparate and distinct categories. These categories are usuallyreferred to as active and passive (index-based). Managerstypically have a strong preference, which usually comes fromtheir beliefs about how capital markets behave. A third category
Equity investment management—your choices
A mutual fund manager looks good by outperforming his or her relevant ‘benchmark’—for instance, the S&P 500.
To compete, a contestant must run with the market wherever it goes, even over a cliff.
—JAMES GRANT, writer, editor
You only need to make one big score infinance to be a hero forever.
—MERTON MILLER, Nobel laureate
If the goal of indexing is to seek high returns with risks you can manage in investments you understand, indexing works.
—DAVID M. BLITZER, writer, chairman S&P 500 Index Committee
Once invincible S&P Funds sink to D rating.—Investor’s Business Daily (AUGUST 6, 2001)
3
EQUITY INVESTMENT MANAGEMENT—YOUR CHOICES
— 31 —
utilizes a structured, index-based approach to investing, whichseeks to add value by combining the advantages of the twotraditional management approaches. In the recent past, this newapproach would have been considered unacceptable—you wereeither passive or active, not a combination of both. Now,professionals and private investors can utilize a combinedapproach that I believe is superior to both of the traditionalmanagement philosophies.
Active management
Active management is generally considered the mostacceptable way to manage a portfolio. The portfolio managerseeks to identify individual securities that will hopefully produceextraordinary gains for investors and outperform the market.Again, active managers, unlike passive, index managers, believethat stock markets contain inefficiencies in pricing. They believethese inefficiencies can be exploited by pouring millions of dollarsinto research and forecasting to carefully seek and find companiesthat will produce exceptional rates of returns—hopefullyjustifying the millions they spend on research and forecasting.Unfortunately for investors, the efforts of active managersgenerally fall short. There are two main reasons for this. 1) Theextra expenses these managers incur on research are usuallypassed on to shareholders in the form of management fees. Thesehigh management fees provide passive, index managers with animmediate advantage. The active manager knows that each yearhe or she will have to overcome these fees with superiorperformance to even match the indexer. 2) Active managerstypically have high turnover in their portfolios (they change theirminds a lot about which securities they like and dislike). Thisportfolio reshuffling leads to extra transaction costs and often totax inefficiencies (excessive taxable capital gains distributions).The net effect of higher management fees, turnover, andtransaction costs leads to inferior relative performance.
ADVANCED PORTFOLIO MANAGEMENT
— 32 —
Passive management (indexing)
Index-based managers do not attempt to forecast the markets—they do not try to time the markets or predict the economy. Theymake no effort whatsoever to uncover hidden value in individualstocks in an attempt to beat the active managers. Instead,traditional passive managers create portfolios that track broad-based U.S. and international stock indexes. This broadlydiversified, index-based approach to investing was, until recently,hard to fault—I will soon do my best to point out itsshortcomings.
Indexing was first discussed in earnest in the mid-1970s when leading academicians like Nobel laureate Paul Samuelsonbegan debating the advantages of passive management versusactive management. Samuelson and others argued that aftertrading and management fees, actively managed funds andportfolios had very little chance of beating the market.
There has never been a study that has proven that activemanagers, as a whole, can add value to a portfolio over the longhaul. On the other hand, there have been many studies that showthat active managers do not add value. Their efforts to outdoefficient markets have failed, year after year. Of course there willalways be a handful of investment managers who outperform themarket in any given year (this is probably luck), but it is likelythat their outperformance will be short-lived. This year’s winnersgenerally turn out to be next year’s losers. But, the fact that themedia continually tries to convince us that great managers are outthere (we just have to look hard) makes it difficult for individualinvestors to give up on active managers.
I read an excellent interview with Merton Miller by authorPeter Tanous in his book entitled Investment Gurus. Miller earneda Nobel Prize in 1990 for his work on the cost of capital in
EQUITY INVESTMENT MANAGEMENT—YOUR CHOICES
— 33 —
economics. He was asked by Tanous how he accounts for the factthat some active managers can outperform the market forextended periods. Miller replied that until proven otherwise, heconsiders it luck, and “the burden of proof is on the activemanagers.” Miller tells the story of a famous bond trader at theBoard of Trade who had made vast sums of money for years inthe markets. This trader thought he had a “foolproof” tradingsystem for making money and he wanted to see if he truly had awinning system, or if it was just dumb luck. He handpicked agroup of students and decided to teach them his system. He feltthat if he could teach his system to a third person, and could makemoney, then this would be the proof that his system worked and itwasn’t simply luck. He set up a school, taught his students andwithin a short period of managing money on their own, his formerstudents were out of business. And, the teacher was out ofbusiness too. So, Miller asks—“Maybe Peter Lynch can do it, butcan he teach it to another person? If he could, we’d have someevidence that it’s more than just luck.”
I would like to share another point from this interview withMerton Miller, about certain active managers who haveoutperformed the markets, but only for a short period of time.Miller says that we need a lot of data (many years) to knowwhether or not this is skill. He cited an example of a 15-handicapgolfer who breaks par, which can happen, but we all know it’sluck. “To be considered a real champ, you have to break par inhundreds of matches.” Miller’s point is that you cannot tell luckfrom skill unless you have a lot of data points (“large samples”)and “we just don’t have them in stock picking.”
Mark Hebner of Index Fund Advisors, Inc. has developed a 12-step program entitled “Active Investors Anonymous” to helpinvestors understand that they can earn better returns by indexing,not by hiring active managers. I think converting from activemanagement to indexing (trusting the markets instead of a
ADVANCED PORTFOLIO MANAGEMENT
— 34 —
portfolio manager) has got to be a lot easier than other 12-stepprograms (i.e., drug or alcohol abuse). The typical patient is notan addict or a dependent—the patient simply doesn’t know that asimple cure exists for his ailment (diagnosed as underperformanceon a pretax and after-tax basis).
The investing public has entrusted more than 90% of its assets to active managers. On the other hand, about half of theinstitutional and pension fund money (“smart money”) out there ispassively managed in index funds. Unfortunately, the publichasn’t yet caught on. The reason is obvious: education. No onehas a vested interest in educating the public about the advantagesof indexing (perhaps with the exception of the Vanguard Group).The big advertising dollars are in the hands of Merrill Lynch,Goldman Sachs et al., and they want you to actively manage yourmoney in their funds or with their advisors—that way they makemore money. The more you move your money around (actively)the more they make, not you. So, Wall Street and the mediawould probably be happy to keep indexing a secret. After all,who would watch CNBC if everyone indexed?
The investing public has only begun to dip its toes in index-based investments—6% to 8% of the public’s money is indexed.However, those who have made the move to indexing are gettingthe following advantages—
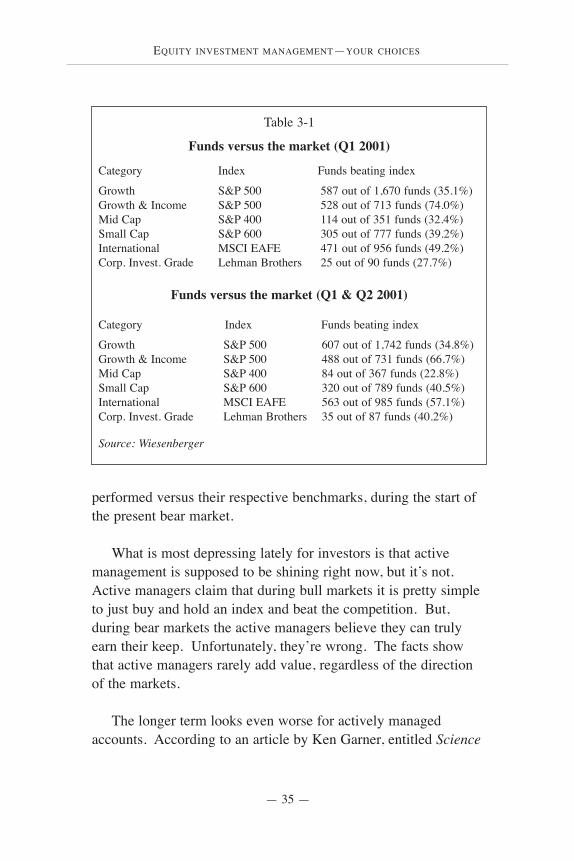
1) Performance—the vast majority of active managers fail tobeat the market. This is not opinion; it is fact. Studies show thatregardless of the asset class chosen or the direction of the stockmarket, the majority of active managers will fare worse than themarket itself. The active managers like to argue that duringdifficult times they tend to outperform the markets—they can benimble and buy or sell quickly and hold cash during marketdrawdowns. Well, it is a nice thought, but it isn’t true. To provemy point, I show in Table 3-1 how actively managed funds have
EQUITY INVESTMENT MANAGEMENT—YOUR CHOICES
— 35 —
performed versus their respective benchmarks, during the start ofthe present bear market.
What is most depressing lately for investors is that activemanagement is supposed to be shining right now, but it’s not.Active managers claim that during bull markets it is pretty simpleto just buy and hold an index and beat the competition. But,during bear markets the active managers believe they can trulyearn their keep. Unfortunately, they’re wrong. The facts showthat active managers rarely add value, regardless of the directionof the markets.
The longer term looks even worse for actively managedaccounts. According to an article by Ken Garner, entitled Science
Table 3-1
Funds versus the market (Q1 2001)
Category Index Funds beating index
Growth S&P 500 587 out of 1,670 funds (35.1%)Growth & Income S&P 500 528 out of 713 funds (74.0%)Mid Cap S&P 400 114 out of 351 funds (32.4%)Small Cap S&P 600 305 out of 777 funds (39.2%)International MSCI EAFE 471 out of 956 funds (49.2%)Corp. Invest. Grade Lehman Brothers 25 out of 90 funds (27.7%)
Funds versus the market (Q1 & Q2 2001)
Category Index Funds beating index
Growth S&P 500 607 out of 1,742 funds (34.8%)Growth & Income S&P 500 488 out of 731 funds (66.7%)Mid Cap S&P 400 84 out of 367 funds (22.8%)Small Cap S&P 600 320 out of 789 funds (40.5%)International MSCI EAFE 563 out of 985 funds (57.1%)Corp. Invest. Grade Lehman Brothers 35 out of 87 funds (40.2%)
Source: Wiesenberger
ADVANCED PORTFOLIO MANAGEMENT
— 36 —
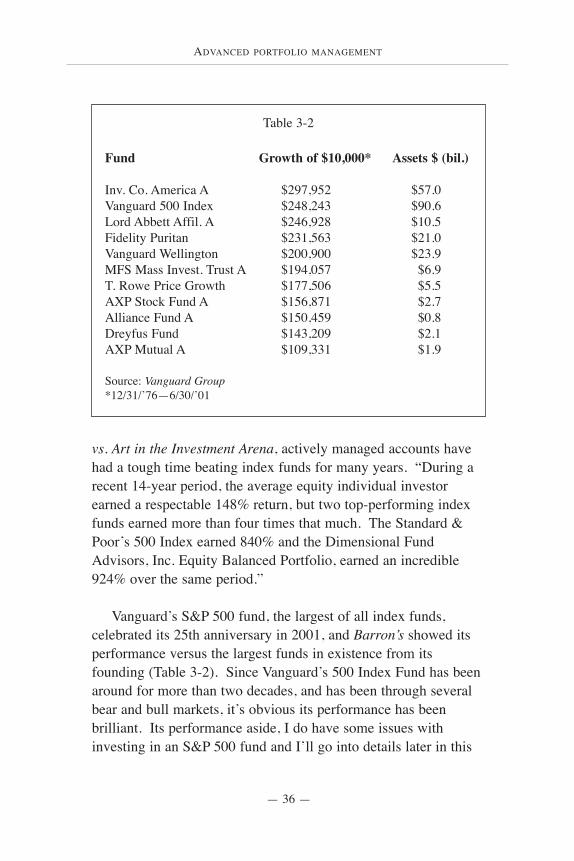
vs. Art in the Investment Arena, actively managed accounts havehad a tough time beating index funds for many years. “During arecent 14-year period, the average equity individual investorearned a respectable 148% return, but two top-performing indexfunds earned more than four times that much. The Standard &Poor’s 500 Index earned 840% and the Dimensional FundAdvisors, Inc. Equity Balanced Portfolio, earned an incredible924% over the same period.”
Vanguard’s S&P 500 fund, the largest of all index funds,celebrated its 25th anniversary in 2001, and Barron’s showed itsperformance versus the largest funds in existence from itsfounding (Table 3-2). Since Vanguard’s 500 Index Fund has beenaround for more than two decades, and has been through severalbear and bull markets, it’s obvious its performance has beenbrilliant. Its performance aside, I do have some issues withinvesting in an S&P 500 fund and I’ll go into details later in this
Table 3-2
Fund Growth of $10,000* Assets $ (bil.)
Inv. Co. America A $297,952 $57.0Vanguard 500 Index $248,243 $90.6Lord Abbett Affil. A $246,928 $10.5Fidelity Puritan $231,563 $21.0Vanguard Wellington $200,900 $23.9MFS Mass Invest. Trust A $194,057 $6.9T. Rowe Price Growth $177,506 $5.5AXP Stock Fund A $156,871 $2.7Alliance Fund A $150,459 $0.8Dreyfus Fund $143,209 $2.1AXP Mutual A $109,331 $1.9
Source: Vanguard Group*12/31/’76—6/30/’01
EQUITY INVESTMENT MANAGEMENT—YOUR CHOICES
— 37 —
chapter. Still, it has been hard to fault the long-term performancerecord of the S&P 500.
2) Costs—the average equity fund charges approximately1.45% annually to manage your money. On top of that,transaction costs eat up about .5% annually. This nearly 2%handicap makes it very difficult for active managers to outperformover the long haul. They basically begin each year at -2% versustheir benchmarks.
Indexing is inexpensive. There are now hundreds of index-based investments in the marketplace with annual fees rangingfrom about .09% to .60%. This represents a huge savings over alifetime of investing. The cost advantage is clear—indexing isabout the least expensive way to participate in the stock market,and lower fees help the bottom line.
3) Tax efficiency. Being a passive investor through index-based investments does not mean there is no trading and nomovement within the portfolio. This is certainly not the case.But, by buying and holding index-based baskets of stocks, you arelikely to have fewer realized capital gains distributions thanactively managed funds. Active managers will typically turn overa portfolio to the tune of 80% each year. Imagine that, the averagemutual fund manager trades 80% of his or her fund’s securitieseach year. This hyperactive trading can lead to hefty distributionsof capital gains—usually an unpleasant tax gift in December—since fund managers must pass on their realized gains toshareholders each year. If the manager is unable to offset hisrealized gains with losses, you will be hit, regardless of whether ornot you actually sold shares during the year. With indexing theseunfriendly distributions are typically not a problem. You simplybuy and hold an asset class or sector and, unlike actively managedfunds, the underlying companies are not traded. Sure, thecompanies that make up the indexes will change, and therefore
ADVANCED PORTFOLIO MANAGEMENT
— 38 —
some of the underlying components of your index funds must alsobe added or deleted. But, in general, there is very little turnoverwithin an index fund. The result is a very tax-efficient portfolioand better after-tax returns.
John Bogle, the chairman of the Vanguard Group, published astudy that shows that the average equity mutual fund losesapproximately 2.7% annually in performance, due to taxinefficiency. Over the long haul, that adds up to a lot of money.His study concluded that after tax inefficiencies and expenses, theaverage equity mutual fund, from 1983-1998, cost investorsapproximately 4.6% annually, in lost performance.
4) No manager risk. Manager risk refers to the risk that anactive manager will make management mistakes (buy or sell at thewrong time) and cost you money. With active management youput your trust in a manager, not the market, since your managermay be out of the market at any given time. With passiveinvesting or indexing, you put your faith in the stock market itself,not in a manager’s abilities to pick stocks or time the market.With indexing you aren’t really trusting an individual, since thereis no manager (in the traditional sense of the word) for index-based investments. In essence, you are removing the humanelement from the equation and putting your trust in the marketitself—you don’t have to worry about someone messing up andmismanaging your portfolio.
I believe indexing is the preferred investment strategy forskeptics and risk-averse investors. When I use the term “skeptic,”I am referring to someone who doubts the skills of a moneymanager or advisor. Can you really trust a money manager? Doesa 5- or 10-year track record really mean anything, since pastperformance doesn’t predict future performance? I don’t like theadded risk of having to trust someone who thinks he or she isbrilliant and can outdo the market. I don’t believe managers add
EQUITY INVESTMENT MANAGEMENT—YOUR CHOICES
— 39 —
value over the long run, and I therefore prefer to trust the marketitself. The risk-averse investor would also be well-advised toindex and remove manager risk from the investment process.Trusting the market is one thing, trusting a money manager isquite another. If you can remove one of these risks—the manager,of course—you’re effectively reducing your overall risk. Again,for me it’s a lot easier to trust the market than a money manager.Eliminate manager risk.
Indexing, the “old” way, what went wrong?
Up until a few years ago, indexing was pretty darn simple; yousimply bought the S&P 500, probably via Vanguard’s S&P 500Index Fund. If you were really cutting-edge, you may havebought a mid- or small-cap index fund. Not too many people didthough, since the S&P 500 was doing just fine. Why fixsomething that isn’t broken? Well, this simple approach toindexing showed some serious flaws beginning in early 2000.
In March of 2000 the technology sector accounted forapproximately 35% of the S&P 500 index. Actually, if youincluded a few tech-related companies that were not consideredpart of the tech sector, and the telecommunication services sector,tech-related companies accounted for over 40% of the index.While there are 10 or 11 sectors in the S&P 500 (depending onwhich firm is classifying the sectors), you actually had hugeexposure to only one of the sectors in 2000-2001. How did thishappen? Well, I don’t need to remind you of the bubble, but Iwill. The investing public and institutional investors becameenamored with technology-related stocks and pushed theirvaluations and capitalizations to extremes. As a result, the 94 orso technology companies in the sector went from a 16% weighting in the S&P in 1998, to over 35% in March 2000. Whatif you were uncomfortable with that weighting but you owned anS&P 500 Index Fund? What if it happens again?
ADVANCED PORTFOLIO MANAGEMENT
— 40 —
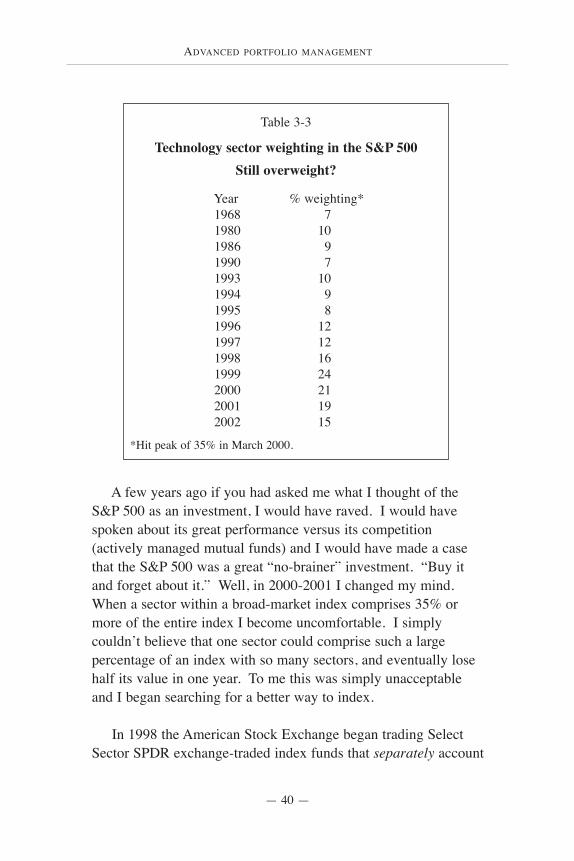
A few years ago if you had asked me what I thought of theS&P 500 as an investment, I would have raved. I would havespoken about its great performance versus its competition(actively managed mutual funds) and I would have made a casethat the S&P 500 was a great “no-brainer” investment. “Buy itand forget about it.” Well, in 2000-2001 I changed my mind.When a sector within a broad-market index comprises 35% ormore of the entire index I become uncomfortable. I simplycouldn’t believe that one sector could comprise such a largepercentage of an index with so many sectors, and eventually losehalf its value in one year. To me this was simply unacceptableand I began searching for a better way to index.
In 1998 the American Stock Exchange began trading SelectSector SPDR exchange-traded index funds that separately account
Table 3-3
Technology sector weighting in the S&P 500Still overweight?
Year % weighting*1968 71980 101986 91990 71993 101994 91995 81996 121997 121998 161999 242000 21 2001 192002 15
*Hit peak of 35% in March 2000.
EQUITY INVESTMENT MANAGEMENT—YOUR CHOICES
— 41 —
for every sector in the S&P 500 index. The Sector SPDRs werelaunched with little fanfare, but the market action of 2000-2001led professionals, including me, to focus more attention on theindividual components of this broad-based index. I will writeabout this at length in a moment, but my point is that for the firsttime, thanks to the new index-based sector ETFs, you were able tocontrol risk and index large-cap stocks without having to ownthem in a broad-based investment like the S&P 500. By dividingup the index by sector and creating your own large-cap index, youno longer had to accept a weighting of 35% in the technologysector if you didn’t want to. You could basically create your ownindex, based on your own risk profile and investment objectives.Obviously I no longer recommend owning the entire market in oneinvestment, like an S&P 500 fund. Not being able to control theoverweighting of technology stocks in the index taught me (andhopefully others) a lesson about traditional indexing. Without the
Table 3-4
S&P 500 sector weightings, now and then
% Weight in % Weight inS&P 500 June 2002 March 2000
Financials 19 13Technology 15 33Health Care 14 9Consumer Cyclicals 13 8Industrials 11 8Consumer Staples 10 8Energy 7 5Communication Services 4 8Utilities 3 2Basic Materials 3 3Transportation 1 1
Source: First Call
ADVANCED PORTFOLIO MANAGEMENT
— 42 —
introduction of the Select Sector SPDRs, I’d still be searching fora better way to index. Now, I’m able to better control risk anddiversification by owning the individual sectors separately.
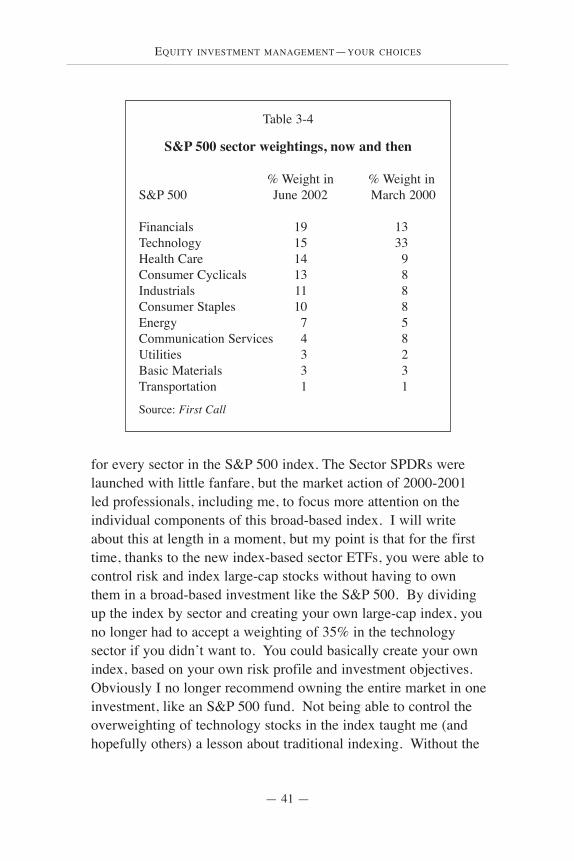
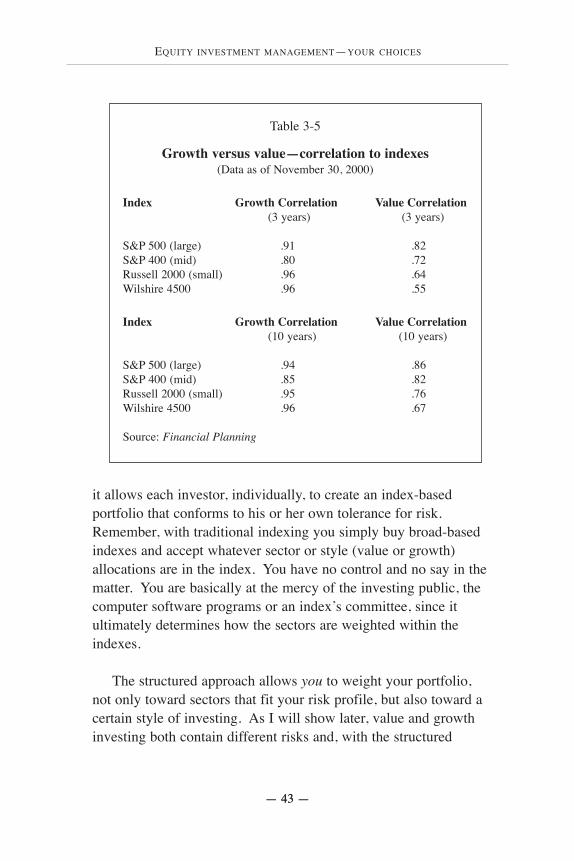
I want to point out one other disturbing fact about the S&P500, before introducing you more intimately to my preferred,structured approach to indexing. During the 1990s, large-cappharmaceutical and technology stocks enjoyed a huge runup—especially technology stocks. Because of the way the S&P 500 iscalculated (cap-weighted index) the better performing stocks in theindex took on a heavier weighting within the index. So, as techand drug stocks took off in the 1990s, their performance greatlyinfluenced the returns of the S&P 500. As a result of the heavyweightings in technology and health care stocks, you can see inTable 3-5, the S&P 500 basically became a growth index, not adiversified, broad-based index. Table 3-5 shows how highlycorrelated the S&P 500 (and broad-based, small- and mid-capindexes) became to growth stocks, as a whole. Look at thecorrelation coefficients of the major stock indexes with growthstocks over the past 3 years. It’s frightening what happened. Youowned the S&P 500, but you basically only had growth stocks inyour portfolio. The same thing happened to broad-based small-and mid-cap indexes.
My point is clear, simply owning broad-based indexes givesyou inadequate diversification and undue risk. It’s a flawedapproach.
Structured, index-based portfolio management
As I briefly mentioned in Chapter 2, structured index-basedportfolio management is one of the keys to successful investing. Itcombines active components (forecasting, valuation measurementsand rebalancing) to relatively passive investments, to give youbetter control of risk. The beauty of the structured approach is that
EQUITY INVESTMENT MANAGEMENT—YOUR CHOICES
— 43 —— 43 —
it allows each investor, individually, to create an index-basedportfolio that conforms to his or her own tolerance for risk.Remember, with traditional indexing you simply buy broad-basedindexes and accept whatever sector or style (value or growth)allocations are in the index. You have no control and no say in thematter. You are basically at the mercy of the investing public, thecomputer software programs or an index’s committee, since itultimately determines how the sectors are weighted within theindexes.
The structured approach allows you to weight your portfolio,not only toward sectors that fit your risk profile, but also toward acertain style of investing. As I will show later, value and growthinvesting both contain different risks and, with the structured
Table 3-5
Growth versus value—correlation to indexes(Data as of November 30, 2000)
Index Growth Correlation Value Correlation(3 years) (3 years)
S&P 500 (large) .91 .82S&P 400 (mid) .80 .72Russell 2000 (small) .96 .64Wilshire 4500 .96 .55
Index Growth Correlation Value Correlation(10 years) (10 years)
S&P 500 (large) .94 .86S&P 400 (mid) .85 .82Russell 2000 (small) .95 .76Wilshire 4500 .96 .67
Source: Financial Planning
ADVANCED PORTFOLIO MANAGEMENT
— 44 —
approach, you can choose to weight your portfolio according toyour style preference. By buying index-based pieces of themarket separately you can control your weightings not only inlarge-, mid- and small-cap stocks, but also in the growth and valuecomponents.
The structured approach does not seek to match theperformance of any particular index (i.e., S&P 500, Russell 2000).It does not care if the technology sector accounts for 35% of theS&P 500. It does not care if most of the Russell 2000 comprisesgrowth companies. These are not benchmarks for structuredportfolios. By building your own index-based portfolio, youcreate your own benchmark, which factors in your personalpreferences and risk tolerance. Most importantly, structuredindexing lets you, the individual, decide how much risk and whattype of risk you are willing to accept in your portfolio. If you’rewilling to do the work and assume a more active role, structuredindexing will take you well beyond the limits of traditionalindexing.
EXCHANGE-TRADED FUNDS—IDEAL VEHICLES FOR STRUCTURED INDEXING
— 45 —
EXCHANGE-TRADED FUNDS (ETFS) ARE very similar totraditional, passively managed index funds, which allow investorsto buy or sell a portfolio of securities in a single transaction. And,like typical mutual funds, ETFs have clearly defined investmentobjectives such as owning mid-cap growth stocks, large-cap valuestocks or certain sectors of the market. Since all ETFs are index-based, they allow you to directly add style-, and size-specificexposure to your portfolio. In other words, you can allocate yourportfolio to an index of purely small-cap value stocks, large-capgrowth stocks, certain sectors, or, even international markets.
Exchange-traded funds—ideal vehiclesfor structured indexing
One change leaves the way open for the introduction of others.—NICCOLO MACHIAVELLI, Italian statesman, writer
There’s a much wider range of ETFs than there are open-end index funds. There are a lot more ways to slice up the market
if you want to, (such as) industry or sector ETFs.—SCOTT COOLEY, editor, Morningstar
4
ADVANCED PORTFOLIO MANAGEMENT
— 46 —
There is no style or size drift, so you can be assured you’regetting the appropriate allocation in the style or size (small-, mid-or large-cap stocks) category that you choose.
How ETFs work
Nathan Most, the principal developer of the original SPDRexchange-traded fund at the AMEX, came up with the idea ofcreating a warehouse receipt-based product to replicate a basket ofstocks. Most’s background is in commodities, and the warehouse-receipt concept essentially comes from the commodity markets.The idea was for institutional investors to deposit a basket ofstocks, replicating an index, in trust—the investor would thenreceive a receipt for the deposit. This portfolio of stocks is thentraded “in-kind” for an ETF that serves as a proxy for theportfolio of stocks. The ETF is locked away with the DepositoryTrust Clearing Corporation, which is regulated by the SEC. (Itsjob is to ensure efficient markets by clearing U.S. securitiestrades.) This exchange of a portfolio of stocks for the ETF, “in-kind,” allows ETFs to sidestep the expensive open-market costs ofbuying and selling stocks like typical mutual funds.
Once the ETF has been created it is freely traded on anexchange (e.g., American Stock Exchange), just like an individualstock. Any investor who wishes to buy or sell the ETF shares cando so, just as if they were individual stocks. There is a bid andask price, 3-day settlement, etc. In addition, investors, if theywish, can use the same strategies with ETFs that are generallyassociated with individual stocks—limit orders, stop orders,margin buying, short selling, etc.
ETF and mutual fund redemption processes
Mutual fund process—1) Investor transfers cash to a mutual fund.
EXCHANGE-TRADED FUNDS—IDEAL VEHICLES FOR STRUCTURED INDEXING
— 47 —
2) The fund manager buys securities with the cash received.3) The investor instructs the mutual fund company to redeemhis or her shares.4) The fund manager sells stocks to “cash out” the investor.
ETF process—1) An institutional investor places an entire portfolio of stocksin trust.2) An ETF share is created and exchanged for the portfolio ofstocks through a custodian bank (bartered exchange). Theportfolio of stocks is delivered to the custodian and the custodianthen delivers the ETF shares to the institutional investor.3) The ETF shares are sold on the open market and traded freely(typically on the AMEX).4) Eventually the ETF is repurchased on the exchange and thenredeemed for the underlying shares, by the institutional investor.This is a reversal of the creation process, whereby the ETF sharesare delivered to the custodian (at the end of the trading day) andthe underlying portfolio of stocks is then delivered to theinstitutional investor.
ETF shares are not purchased or redeemed through a fundcompany, like typical mutual funds. With ETFs, investors findtheir counterparties—other buyers and sellers—through theexchange itself. Again, institutional investors create and redeemETFs, which requires depositing the underlying shares in trust, inexchange for a block of ETF shares. ETF shares can be redeemedfor a portfolio of stocks that approximates the index itself. Thistype of redemption process is called an “in-kind” exchange. “In-kind” redemptions do not create a taxable event, unlike a cash salein a typical mutual fund. This makes ETFs much more taxefficient than actively managed funds and traditional index funds.
ADVANCED PORTFOLIO MANAGEMENT
— 48 —
Arbitrage opportunities
The share price of an ETF closely tracks the underlying basketof stocks. However, there may be times when demand for fundshares can exceed supply, causing a slight premium or discount inthe price of the ETF versus its underlying shares. But, unlikeclosed-end funds, this premium or discount usually quicklydisappears because of arbitrage opportunities. If an ETF tradesabove or below fair value, arbitrageurs will take advantage of theopportunity and buy or sell baskets of stocks that make up theindex, against which the ETF shares are meant to track. They cantherefore lock in quick profits from the price difference in theunderlying shares and the ETF shares. This keeps the premiumsand discounts close to the “true” value of the underlying stocks.
While ETF premiums and discounts are usually fairlyinsignificant, they can sometimes amount to 3% or so for ETFsthat track illiquid stocks (typically in foreign markets). Right now,for example, www.etfconnect.com is indicating there was adiscount at the close on February 13, 2002, on the iShares MSCISpain Index. This means the ETF shares are trading slightlybelow the true value of the underlying securities. At the sametime, as of the close on February 13, 2002, the iShares MSCISouth Korea Index was trading at a premium of approximately 3%versus its underlying shares. Again, its premium or discount isusually accounted for and quickly arbitraged away. Nevertheless,in some of the less liquid foreign markets, ETF discounts andpremiums can be seen. (Premiums and discounts can be found onthe Web site www.etfconnect.com.)
ETF legal structures
ETFs come in three different legal structures.
1) Exchange-traded open-end index mutual funds. This
EXCHANGE-TRADED FUNDS—IDEAL VEHICLES FOR STRUCTURED INDEXING
— 49 —
structure is by far the most popular structure for ETFs. It closelyresembles the structure of typical mutual funds. ETFs with thisstructure are registered under the SEC Investment Company Act of1940. Examples of ETFs under this structure are iShares andSelect Sector SPDRs. These ETFs are managed by a fundmanager and the fund manager has some leeway to determine howthe ETF will track the index it is set up to mirror. For example,with an ETF that tracks an index of hundreds of small stocks, thefund manager may decide to buy a “representative sample” thatapproximates the index as closely as possible. Since buying eachand every stock can be expensive, it may actually be to theadvantage of the fund to not hold every single stock in the index.Anyway, with this structure, the fund manager has this choice. Inaddition to the flexibility awarded the fund manager, this structurealso allows for the reinvestment of dividends, an advantage overother structures.
ETFs that are registered under the SEC Investment CompanyAct of 1940 may be forced to deviate somewhat from the exactholdings of the index they are meant to track. The reason is thatthere are diversification rules within the 1940 Act that state that nocompany within a fund’s holdings can make up more than 25% ofthe assets of the fund. In addition, the Act specifies, fordiversification reasons, that companies that make up more than 5%of the total assets in the fund cannot comprise more than 50% ofthe fund. So, there may be times when the managers of ETFsregulated under the 1940 Act may have to weight their holdingsslightly different from the indexes they are meant to track, in orderto stay within the rules. One example of how an ETF fundmanager is forced to work within the 1940 Act can be seen with aconcentrated ETF like the Dow Jones Energy Sector Fund (IYE).Exxon Mobil makes up about 43% of this sector, but the ETFcannot hold more than 25% of one company. So, the fundmanagers (Barclays in this case) run what they call optimizedportfolios to still track the return of the underlying index.
ADVANCED PORTFOLIO MANAGEMENT
— 50 —
2) Unit investment trusts (UITs). This structure is less flexiblethan the open-end mutual fund ETF structure. UITs also fall underthe 1940 Act. The only ETFs with this structure are Diamonds(DIA), S&P 500 SPDR (SPY), Nasdaq-100 Trust (QQQ) and theMid-Cap SPDR (MDY). There is little management of these UITsand the fees are typically a bit less than other ETFs. Furthermore,the indexes these ETFs track are followed very closely by themanagers, and there is no room for creativity (no “representativesamples” allowed). Dividends cannot be reinvested.
3) Grantor Trusts. Holding Company Depositary Receipts(HOLDRs) are formed as grantor trusts. These trusts allowinvestors to actually own the underlying shares within thebaskets—you can redeem your basket and receive all theunderlying shares of the individual companies, if you wish.Merrill Lynch launched many different HOLDRs under thisstructure. HOLDRs are not regulated under the 1940 Act, so thereis no attempt to keep them diversified. As a result, you may own aHOLDR with very heavy weightings in only a few companies.Unlike the other two ETF structures, the components in thesetrusts are fixed, so your HOLDR that today seems like anattractive investment, may, years from now, contain manycompanies that are has-beens. Remember, the underlyingcomponents are static and will not change. Jim Wiandt and WillMcClatchy, in their informative book on ETFs entitled ExchangeTraded Funds, An Insider’s Guide To Buying The Market, made agood crack about HOLDRs that illustrates the potential pitfalls ofowning HOLDRs—“If an investor had bought a HOLDR at theturn of the nineteenth century (not possible, of course, as theywere introduced in 1999) that represented the largest U.S.companies, he or she would have barely paid any capital gainstaxes, but also would have enormous weightings in railroads,buggy whip manufacturers, and women’s corsets (or moreaccurately, the company that bought the remnants of the datedindustries).”
EXCHANGE-TRADED FUNDS—IDEAL VEHICLES FOR STRUCTURED INDEXING
— 51 —
HOLDRs do have a cost advantage over other ETF structures($2 annually per 100 shares)—there is virtually no managementwhatsoever of the baskets. But, other disadvantages far outweighthe cost advantage, so I would urge caution. (More on HOLDRsat the end of this chapter.)
Brief history of ETFs
The first institutional index fund that tracked the S&P 500 waslaunched in 1971 by Wells Fargo. Vanguard created its VanguardIndex 500 Fund and made it available to the public in 1976. But,it took another 17 years for ETFs to begin trading—the S&P 500SPDR started trading in 1993. In May of 1995 the Mid-CapSPDR began trading, and the following year WEBS (World EquityBenchmark Shares were later renamed iShares) began tracking theforeign markets.
ETFs were initially slow to gain acceptance by bothinstitutional and private investors. However, thanks to a bullmarket, and favorable tax and trading advantages offered by ETFsover mutual funds, ETFs became widely utilized by professionalsby the late 1990s. The launch of Diamonds (track the Dow JonesIndustrial Average), HOLDRs, and Select Sector SPDRs in 1998,allowed investors to begin utilizing ETFs for broad diversification,as well as for concentrated sector investments. In 1999 the QQQ(Nasdaq-100) was launched and is now the most actively tradedsecurity on any exchange.
In 2000, approximately 90 new ETFs were launched (mostlyby Barclays) that offered money managers and private investorsan incredible range of investment alternatives. For the first time,it was possible to structure an index-based equity portfolio entirelywith ETFs. And, it was now possible to structure a portfolio ofETFs based on size (small-, mid- or large-cap stocks) and style(growth or value). Beginning in 2000, proponents of indexing no
ADVANCED PORTFOLIO MANAGEMENT
— 52 —
longer had any reason to purchase traditional index funds—ETFspretty much covered everything.
The launch of the Select Sector SPDRs in 1998 and style- andsize-specific ETFs in 2000, changed passive management forever.In my practice, for the first time, I was able to construct what Icall structured index-based portfolios, entirely with ETFs. I cannow offer clients tax and cost advantages that were previouslyunavailable. In addition, the new ETF offerings allowed me toinvest based on a client’s style and size preference. Being able todivide broad-based indexes into value and growth components forthe three major stock asset classes (small, mid and large stocks)and break up the large-cap marketplace in sector ETFs, allows youto better control taxes and exposure in all areas of the market.These relatively recent additions to the ETF marketplace havemade index-based investing more complicated, but better thanever.
ETF advantages, and a couple of disadvantages
Advantages
1) Cost advantage. Traditional index fund fees averagebetween .20% and .80% annually. (Actively managed fundstypically charge fees ranging from .60% to 2.5%, with the averageabout 1.4% annually.) ETFs carry fees ranging from .09% to.90%. Most ETF fees will charge under .30% annually.
2) Flexibility. ETFs offer investors the flexibility to tradethroughout normal market hours. Traditional index funds andactively managed funds offer purchases and redemptions only oncedaily, after the close. This makes it tough for investors to knowexactly how much money they will receive at the end of the dayfor their shares. Remember, they can only be sold at the end ofthe day, so you basically lose control for the entire day. However,
EXCHANGE-TRADED FUNDS—IDEAL VEHICLES FOR STRUCTURED INDEXING
— 53 —
you can buy or sell ETFs just like stocks, so you pretty muchknow exactly what you will be paying or receiving for yourshares.
In addition to having the ability to trade throughout normalexchange hours, ETF shareholders can enter protective limit andstop orders, just like with individual stocks. Being able to lock inor protect profits with limit and stop orders is a great advantage.And, being able to sell short or utilize margin with ETFs cancreate some excellent hedging opportunities for shareholders.
3) Portfolio structuring. ETFs offer a better way to structureindex-based portfolios than traditional index funds and activelymanaged funds. There are now over a hundred ETFs that trackalmost every imaginable sector and asset class. This makes ETFsthe perfect vehicle for index-based managers and investorswanting pure exposure to certain sectors and asset classes withoutstyle- or size-drift risk.
4) Tax efficiency. The ETF creation and redemption processallows them to be more tax efficient than traditional index fundsand actively managed funds. This means better after-tax returnsfor shareholders.
ETF Tax Advantages
I would like to take a moment to highlight some ETF taxadvantages. ETFs are even more tax efficient than traditionalindex funds (hard to do), and are obviously more tax efficient thanactively managed funds. But, ask an investor why this is the caseand you’ll probably get no response. The ETF tax advantage canbe found in the creation and redemption process. Earlier in thischapter I wrote about the creation process and how it differs fromtypical mutual funds. When an investor buys a mutual fund, he orshe sends cash to the mutual fund company, and the fund
ADVANCED PORTFOLIO MANAGEMENT
— 54 —
company purchases stocks on behalf of the investor. To redeemshares the investor instructs the fund company to sell. Assumingthe fund manager had no cash on hand, he or she would have tosell stocks to meet the redemption request of the investor. Thesubsequent sale of stock, to meet the redemption, is a taxableevent. If I assume this fund did not have much cash on hand—they usually stay close to fully invested—and they had to sellstocks to meet the redemption, the sale of stocks could adverselyaffect the remaining shareholders in the fund (even though theydidn’t sell). The capital gain for the fund—assuming there was arealized gain on the stock sale—is divided up among all the fundshareholders. Actively managed funds typically pay out theircapital distributions at the end of the year. Anyway, it is thenature of the redemption process of mutual funds that makesmany actively managed funds and some traditional index fundstax inefficient.
Unlike most mutual funds, ETF redemptions do not directlyinvolve a fund company. Brad Zigler, former head of iSharesmarketing at Barclays Global Investor Services, compares thisprocess to buying and selling an individual stock. “Just likebuying shares of IBM, you buy ETF shares from another investor(or from the fund’s exchange specialist). Think about it: Whenyou buy IBM shares, it’s not IBM that gets your money. No way.The stock seller is the one who gets your cash.” Zigler suggestsyou think of the sale of an ETF in the same fashion. You cantrade ETFs back and forth on an exchange (like IBM stock) butthe fund’s holdings are unaffected, therefore, the fund is insulatedfrom trading costs and taxes. Again, the key point to recognizeabout an ETF transaction is that there is no redemption with afund, so there is no fund that has to sell shares to pay you cash.Since there is no actual sale of underlying shares, there is notaxable event. I mentioned earlier that this type of transaction iscalled “in-kind”—like a barter. So, unlike the cash-basedtransactions of mutual funds, ETF redemptions are not considered
EXCHANGE-TRADED FUNDS—IDEAL VEHICLES FOR STRUCTURED INDEXING
— 55 —
a taxable transaction to shareholders. Obviously, if you sell yourshares, you pay tax on your own cost basis in the ETF, just likeyou would have with Zigler’s IBM example.
ETFs are not, however, perfectly tax efficient. Like traditionalindex funds, ETFs may be forced to sell their underlying stockswhen the indexes themselves are reconstituted and shuffled. Thiscan and does happen, so ETF shareholders should be aware thatthey may receive taxable distributions.
Disadvantages
1) Commissions. When you buy ETFs you pay normalcommission rates—just like buying individual stocks through abrokerage firm. While commission rates have come downsubstantially during the past 5 years, commissions can still add upto a lot of money—especially if you trade often. However, giventhe fact that ETFs have much lower ongoing management feesthan actively managed funds, and to a lesser degree than indexfunds, I’m happy to pay the commissions if I can get lowerongoing management fees with ETFs.
2) Premium and discount risk. There is a possibility ofpaying a slight premium (or discount) for ETFs. Although, fordomestic ETFs this premium is generally small and insignificant,it should still be considered a disadvantage. Investors should beparticularly aware of premiums and discounts in ETFs that track foreign markets.
To summarize—I obviously feel ETF advantages far outweighany disadvantages.
ADVANCED PORTFOLIO MANAGEMENT
— 56 —
ETFs—your choices
Tables 4-1 through 4-8 show the various ETFs available in themarketplace. I’ve listed ETFs that cover basically everyimaginable asset class and sector, including foreign markets andreal estate. I’ve also shown the operating expense ratio (OE),annual turnover (T%), number of stocks held in each ETF, and themedian market capitalization (MMC) for each ETF.
In the last part of this chapter I list the various HOLDRs,offered by Merrill Lynch, along with some comments on theadvantages and disadvantages of buying these concentrated, staticETFs.
See the appendix for more detailed information on all ETFholdings.
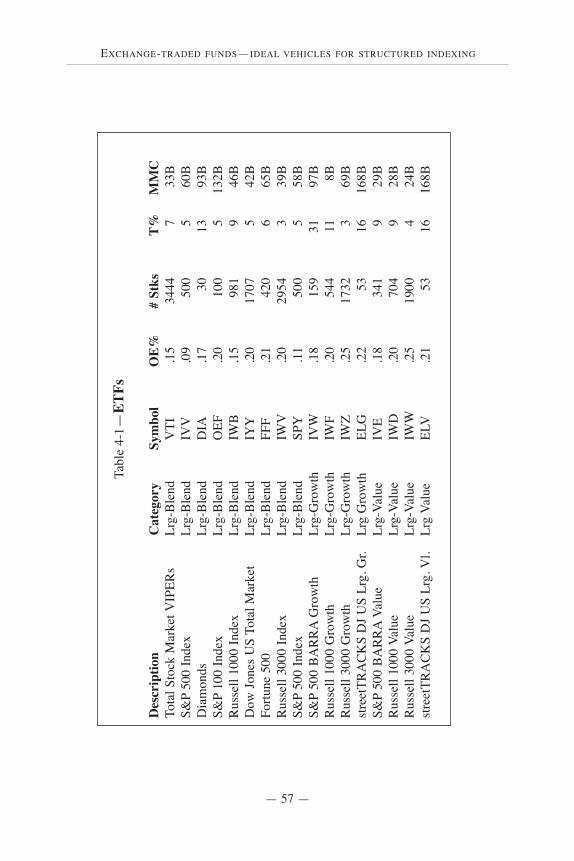
EXCHANGE-TRADED FUNDS—IDEAL VEHICLES FOR STRUCTURED INDEXING
— 57 —
Tabl
e 4-
1—ET
Fs
Des
crip
tion
Cat
egor
y
S
ymbo
l
OE%
# S
tks
T%M
MC
Tota
l Sto
ck M
arke
t VIP
ERs
Lrg-
Ble
ndV
TI.1
534
447
33B
S&P
500
Inde
xLr
g-B
lend
IVV
.09
500
560
BD
iam
onds
Lrg-
Ble
ndD
IA.1
730
1393
BS&
P10
0 In
dex
Lrg-
Ble
ndO
EF.2
010
05
132B
Rus
sell
1000
Inde
xLr
g-B
lend
IWB
.15
981
946
BD
ow J
ones
US
Tota
l Mar
ket
Lrg-
Ble
ndIY
Y.2
017
075
42B
Fortu
ne 5
00Lr
g-B
lend
FFF
.21
420
665
BR
usse
ll 30
00 In
dex
Lrg-
Ble
ndIW
V.2
029
543
39B
S&P
500
Inde
xLr
g-B
lend
SPY
.11
500
558
BS&
P50
0 B
AR
RA
Gro
wth
Lrg-
Gro
wth
IVW
.18
159
3197
BR
usse
ll 10
00 G
row
thLr
g-G
row
thIW
F.2
054
411
8BR
usse
ll 30
00 G
row
thLr
g-G
row
thIW
Z.2
517
323
69B
stre
etTR
AC
KS
DJ
US
Lrg.
Gr.
Lrg
Gro
wth
ELG
.22
5316
168B
S&P
500
BA
RR
AVa
lue
Lrg-
Valu
eIV
E.1
834
19
29B
Rus
sell
1000
Val
ueLr
g-Va
lue
IWD
.20
704
928
BR
usse
ll 30
00 V
alue
Lrg-
Valu
eIW
W.2
519
004
24B
stre
etTR
AC
KS
DJ
US
Lrg.
Vl.
Lrg
Valu
eEL
V.2
153
1616
8B
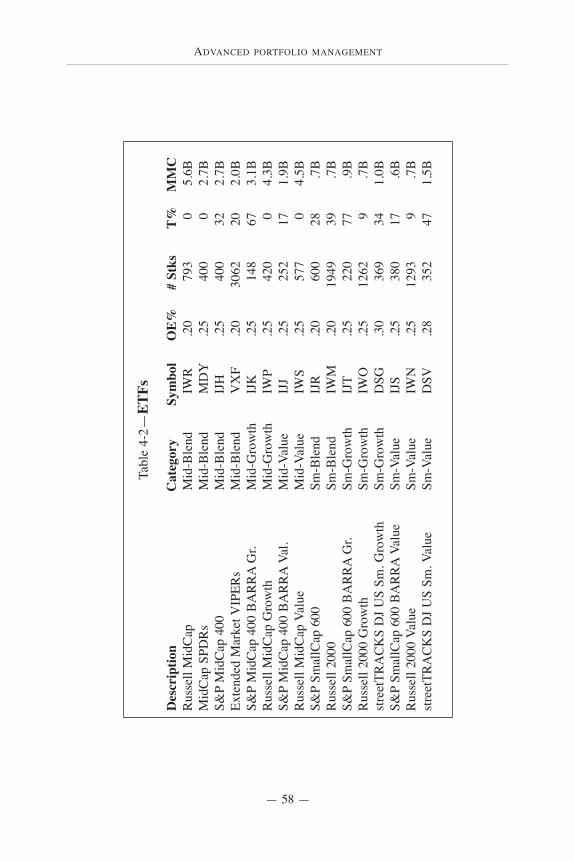
ADVANCED PORTFOLIO MANAGEMENT
— 58 —
Tabl
e 4-
2—ET
Fs
Des
crip
tion
C
ateg
ory
Sym
bol
O
E%
# S
tks
T%
MM
CR
usse
ll M
idC
ap
Mid
-Ble
ndIW
R.2
079
30
5.6B
Mid
Cap
SPD
Rs
Mid
-Ble
ndM
DY
.25
400
02.
7BS&
PM
idC
ap 4
00
Mid
-Ble
ndIJ
H.2
540
032
2.7B
Exte
nded
Mar
ket V
IPER
sM
id-B
lend
VX
F.2
030
6220
2.0B
S&P
Mid
Cap
400
BA
RR
AG
r.M
id-G
row
thIJ
K.2
514
867
3.1B
Rus
sell
Mid
Cap
Gro
wth
Mid
-Gro
wth
IWP
.25
420
04.
3BS&
PM
idC
ap 4
00 B
AR
RA
Val.
Mid
-Val
ueIJ
J.2
525
217
1.9B
Rus
sell
Mid
Cap
Val
ueM
id-V
alue
IWS
.25
577
04.
5BS&
PSm
allC
ap 6
00
Sm-B
lend
IJR
.20
600
28.7
BR
usse
ll 20
00
Sm-B
lend
IWM
.20
1949
39.7
BS&
PSm
allC
ap 6
00 B
AR
RA
Gr.
Sm-G
row
thIJ
T.2
522
077
.9B
Rus
sell
2000
Gro
wth
Sm-G
row
thIW
O.2
512
629
.7B
stre
etTR
AC
KS
DJ
US
Sm. G
row
thSm
-Gro
wth
DSG
.30
369
341.
0BS&
PSm
allC
ap 6
00 B
AR
RA
Valu
e Sm
-Val
ueIJ
S.2
538
017
.6B
Rus
sell
2000
Val
ueSm
-Val
ueIW
N.2
512
939
.7B
stre
etTR
AC
KS
DJ
US
Sm. V
alue
Sm-V
alue
DSV
.28
352
471.
5B
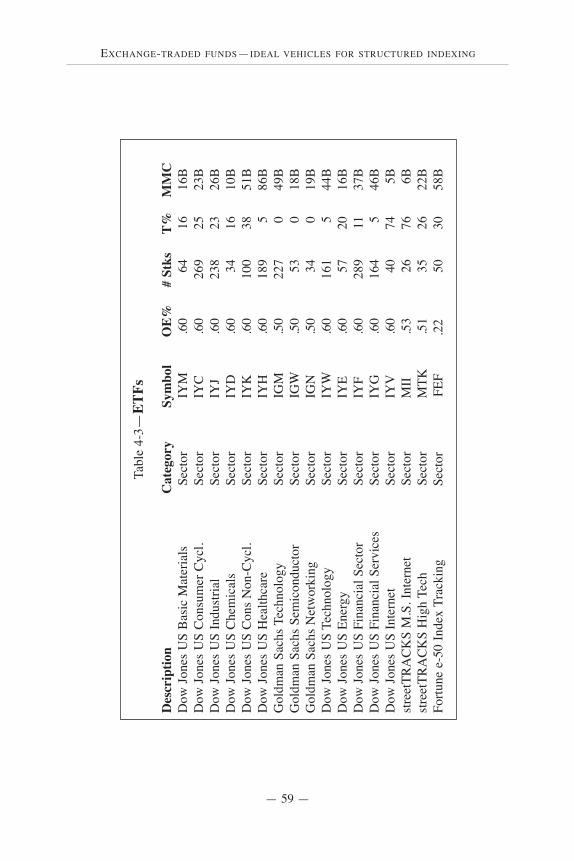
EXCHANGE-TRADED FUNDS—IDEAL VEHICLES FOR STRUCTURED INDEXING
— 59 —
Tabl
e 4-
3—ET
Fs
Des
crip
tion
C
ateg
ory
Sym
bol
OE%
# St
ksT%
M
MC
Dow
Jon
es U
S B
asic
Mat
eria
lsSe
ctor
IYM
.60
6416
16B
Dow
Jon
es U
S C
onsu
mer
Cyc
l.Se
ctor
IYC
.60
269
2523
BD
ow J
ones
US
Indu
stria
lSe
ctor
IYJ
.60
238
2326
BD
ow J
ones
US
Che
mic
als
Sect
orIY
D.6
034
1610
BD
ow J
ones
US
Con
s N
on-C
ycl.
Sect
orIY
K.6
010
038
51B
Dow
Jon
es U
S H
ealth
care
Sect
orIY
H.6
018
95
86B
Gol
dman
Sac
hs T
echn
olog
ySe
ctor
IGM
.50
227
049
BG
oldm
an S
achs
Sem
icon
duct
orSe
ctor
IGW
.50
530
18B
Gol
dman
Sac
hs N
etw
orki
ngSe
ctor
IGN
.50
340
19B
Dow
Jon
es U
S Te
chno
logy
Sect
orIY
W.6
016
15
44B
Dow
Jon
es U
S En
ergy
Sect
orIY
E.6
057
2016
BD
ow J
ones
US
Fina
ncia
l Sec
tor
Sect
orIY
F.6
028
911
37B
Dow
Jon
es U
S Fi
nanc
ial S
ervi
ces
Sect
orIY
G.6
016
45
46B
Dow
Jon
es U
S In
tern
etSe
ctor
IYV
.60
4074
5Bst
reet
TRA
CK
S M
.S. I
nter
net
Sect
orM
II.5
326
766B
stre
etTR
AC
KS
Hig
h Te
chSe
ctor
MTK
.51
3526
22B
Fortu
ne e
-50
Inde
x Tr
acki
ng
Sect
orFE
F.2
250
3058
B
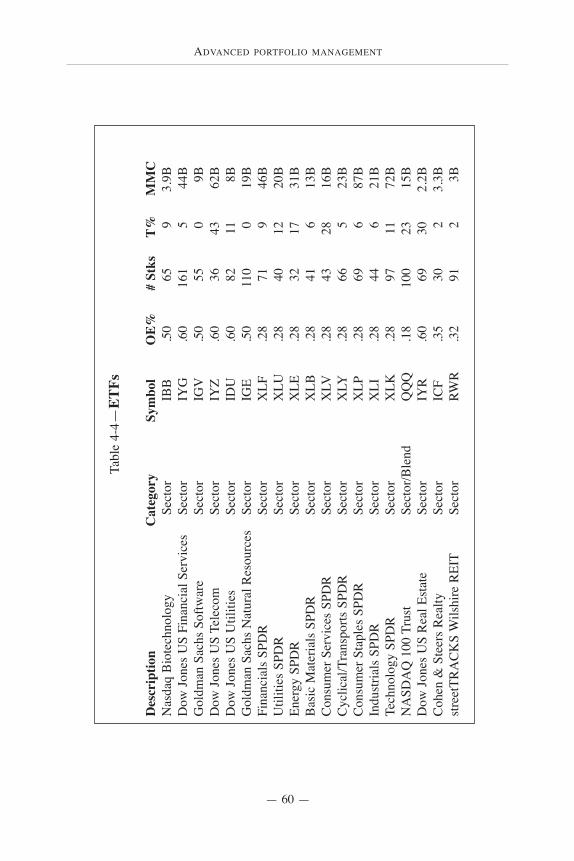
ADVANCED PORTFOLIO MANAGEMENT
— 60 —
Tabl
e 4-
4—ET
Fs
Des
crip
tion
C
ateg
ory
Sym
bol
OE%
# St
ksT%
M
MC
Nas
daq
Bio
tech
nolo
gySe
ctor
IBB
.50
659
3.9B
Dow
Jon
es U
S Fi
nanc
ial S
ervi
ces
Sect
orIY
G.6
016
15
44B
Gol
dman
Sac
hs S
oftw
are
Sect
orIG
V.5
055
09B
Dow
Jon
es U
S Te
leco
mSe
ctor
IYZ
.60
3643
62B
Dow
Jon
es U
S U
tiliti
esSe
ctor
IDU
.60
8211
8BG
oldm
an S
achs
Nat
ural
Res
ourc
esSe
ctor
IGE
.50
110
019
BFi
nanc
ials
SPD
RSe
ctor
XLF
.28
719
46B
Util
ities
SPD
RSe
ctor
XLU
.28
4012
20B
Ener
gy S
PDR
Sect
orX
LE.2
832
1731
BB
asic
Mat
eria
ls S
PDR
Sect
orX
LB.2
841
613
BC
onsu
mer
Ser
vice
s SP
DR
Sect
orX
LV.2
843
2816
BC
yclic
al/T
rans
ports
SPD
RSe
ctor
XLY
.28
665
23B
Con
sum
er S
tapl
es S
PDR
Sect
orX
LP.2
869
687
BIn
dust
rials
SPD
RSe
ctor
XLI
.28
446
21B
Tech
nolo
gy S
PDR
Sect
orX
LK.2
897
1172
BN
ASD
AQ
100
Tru
stSe
ctor
/Ble
ndQ
.18
100
2315
BD
ow J
ones
US
Rea
l Est
ate
Sect
orIY
R.6
069
302.
2BC
ohen
& S
teer
s R
ealty
Sect
orIC
F.3
530
23.
3Bst
reet
TRA
CK
S W
ilshi
re R
EIT
Sect
orRW
R.3
291
23B

EXCHANGE-TRADED FUNDS—IDEAL VEHICLES FOR STRUCTURED INDEXING
— 61 —
Tabl
e 4-
5—ET
Fs
Des
crip
tion
C
ateg
ory
Sym
bol
OE%
#
Stk
s
T%
M
MC
stre
etTR
AC
KS
DJ
Glo
bal T
itans
Glo
bal-L
rg-B
lend
DG
T.5
250
1614
9BM
SCI E
MU
In
tl-Lr
g-B
lend
EZU
.84
262
038
BM
SCI P
acifi
c ex
-Jap
anIn
tl-Lr
g-B
lend
EPP
.50
130
010
BM
SCI E
AFE
Inde
xIn
tl-Lr
g-B
lend
EFA
.35
782
026
BS&
PTO
PIX
/150
Intl-
Lrg-
Ble
ndIT
F.5
015
00
12B
S&P/
TSE
60 In
dex
Intl-
Lrg-
Ble
ndIK
C.5
060
5011
BS&
PG
loba
l 100
Inde
xIn
tl-Lr
g-B
lend
IOO
.40
985
129B
S&P
Euro
pe 3
50 In
dex
Intl-
Lrg-
Ble
ndIE
V.6
033
524
43B
MSC
I Mal
aysi
a (F
ree)
Intl-
Lrg-
Ble
ndEW
M.8
466
182B
MSC
I Sin
gapo
re (F
ree)
Intl-
Lrg-
Ble
ndEW
S.8
435
528B
MSC
I Sou
th K
orea
Intl-
Lrg-
Ble
ndEW
Y.9
979
012
BS&
PG
loba
l Ene
rgy
Sect
orG
loba
l-Sec
tor
IXC
.65
450
83B
S&P
Glo
bal F
inan
cial
s G
loba
l-Sec
tor
IXG
.65
192
038
BS&
PG
loba
l Hea
lthca
reG
loba
l-Sec
tor
IXJ
.65
630
87B
S&P
Glo
bal T
echn
olog
yG
loba
l-Sec
tor
IXN
.65
123
069
BS&
PG
loba
l Tel
ecom
Glo
bal-S
ecto
rIX
P.6
547
073
B
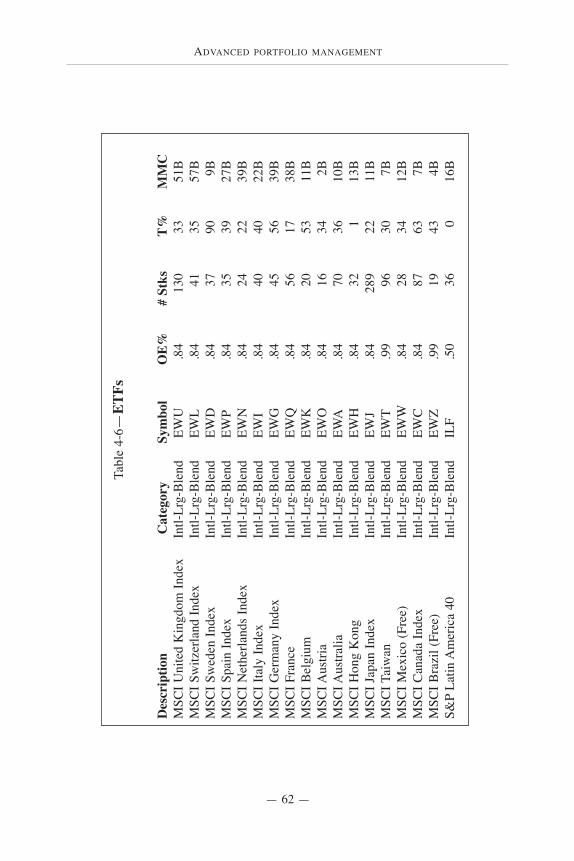
ADVANCED PORTFOLIO MANAGEMENT
— 62 —
Tabl
e 4-
6—ET
Fs
Des
crip
tion
Cat
egor
ySy
mbo
lO
E%#
Stks
T%
M
MC
MSC
I Uni
ted
Kin
gdom
Inde
xIn
tl-Lr
g-B
lend
EWU
.84
130
3351
BM
SCI S
witz
erla
nd In
dex
Intl-
Lrg-
Ble
ndEW
L.8
441
3557
BM
SCI S
wed
en In
dex
Intl-
Lrg-
Ble
ndEW
D.8
437
909B
MSC
I Spa
in In
dex
Intl-
Lrg-
Ble
ndEW
P.8
435
3927
BM
SCI N
ethe
rland
s In
dex
Intl-
Lrg-
Ble
ndEW
N.8
424
2239
BM
SCI I
taly
Inde
xIn
tl-Lr
g-B
lend
EWI
.84
4040
22B
MSC
I Ger
man
y In
dex
Intl-
Lrg-
Ble
ndEW
G.8
445
5639
BM
SCI F
ranc
e In
tl-Lr
g-B
lend
EWQ
.84
5617
38B
MSC
I Bel
gium
Intl-
Lrg-
Ble
ndEW
K.8
420
5311
BM
SCI A
ustri
a In
tl-Lr
g-B
lend
EWO
.84
1634
2BM
SCI A
ustra
liaIn
tl-Lr
g-B
lend
EWA
.84
7036
10B
MSC
I Hon
g K
ong
Intl-
Lrg-
Ble
ndEW
H.8
432
113
BM
SCI J
apan
Inde
xIn
tl-Lr
g-B
lend
EWJ
.84
289
2211
BM
SCI T
aiw
an
Intl-
Lrg-
Ble
ndEW
T.9
996
307B
MSC
I Mex
ico
(Fre
e)In
tl-Lr
g-B
lend
EWW
.84
2834
12B
MSC
I Can
ada
Inde
xIn
tl-Lr
g-B
lend
EWC
.84
8763
7BM
SCI B
razi
l (Fr
ee)
Intl-
Lrg-
Ble
ndEW
Z.9
919
434B
S&P
Latin
Am
eric
a 40
Intl-
Lrg-
Ble
ndIL
F.5
036
016
B
EXCHANGE-TRADED FUNDS—IDEAL VEHICLES FOR STRUCTURED INDEXING
— 63 —
HOLDRs
HOLDRs are basically fixed, concentrated baskets of stocksthat trade like one stock. They are considered ETFs and trade onthe American Stock Exchange, like most ETFs. Most HOLDRsallow investors to have immediate, somewhat diversified exposureto a particular sector, in a single investment. There are now 17HOLDRs in existence, all created by Merrill Lynch. Like otherETFs, they have also caught on fast with the investing public.But, before venturing into these ETFs, please consider theadvantages as well as the disadvantages of ownership.
Advantages
HOLDRs offer the following advantages—
1) Diversification—You get immediate diversification within asector by buying a group of stocks, basically for the price of one.Since you purchase HOLDRs the same way you purchase stocks,you can buy a somewhat diversified basket of stocks, for the priceof one.
2) Control tax gains and losses—HOLDRs have a uniqueadvantage over other ETFs, in that you can actually unbundle theHOLDR and receive your underlying stocks—there are typically20 stocks per HOLDR. Few investors actually do this, but it is apositive for investors wishing to control their tax losses and gains.For example, assume your HOLDR has 20 stocks in it, but only afew of the stocks show gains. You could “redeem” your HOLDRand receive all the underlying shares within the HOLDR, and thensell only your losers to “realize” the loss for tax purposes. Youcould hold your winners, if you wish. Merrill Lynch provides costbasis data (thank goodness) for each individual piece within theHOLDRs from the date of your purchase. Cost basis informationis available on the Web site www.holdrs.com.

ADVANCED PORTFOLIO MANAGEMENT
— 64 —
3) Tax advantages—HOLDRs do not distribute capital gainstaxes like most mutual funds and some ETFs. Since there is notrading of securities within a HOLDR, they are perfectly taxefficient. This is an advantage over other ETFs, which offer taxefficiency, but not perfect tax efficiency. So, with HOLDRs youwill only incur a realized gain or loss when you decide to sell (nodistributions). And, as I stated earlier, you can take control ofeach stock within the HOLDR, if you wish.
4) Liquidity—Unlike typical mutual funds, HOLDRs offerinvestors the ability to buy and sell throughout the trading day(like other ETFs).
5) Low costs—HOLDRs are the cheapest ETFs in themarketplace. They are cheaper than traditional index mutualfunds and index-based ETFs. Aside from the commissions youpay your brokerage firm, the only other cost is a $2 per 100 share,quarterly custody charge. For example, your annual fees forpurchasing the Pharmaceutical HOLDR on a $50,000 investmentequals $40. This amounts to only .08% annually. This custodialfee will be taken against dividends and cash distributions, andwill be waived if no dividends or cash distributions are paid byany of the underlying stocks in the HOLDR.
Disadvantages
1) Lack of diversification—In my opinion, the primarydisadvantage of owning HOLDRs is their lack of diversification.Yes, I know I listed their diversification as an advantage too, butcompared to other ETFs, HOLDRs are poorly diversified. Forexample, if you bought the iShares Healthcare ETF, you wouldbasically own a piece of approximately 186 companies. With thePharmaceutical HOLDR you own only 18 companies. So, I canargue that you don’t have enough broad diversification orrepresentation in the sector.
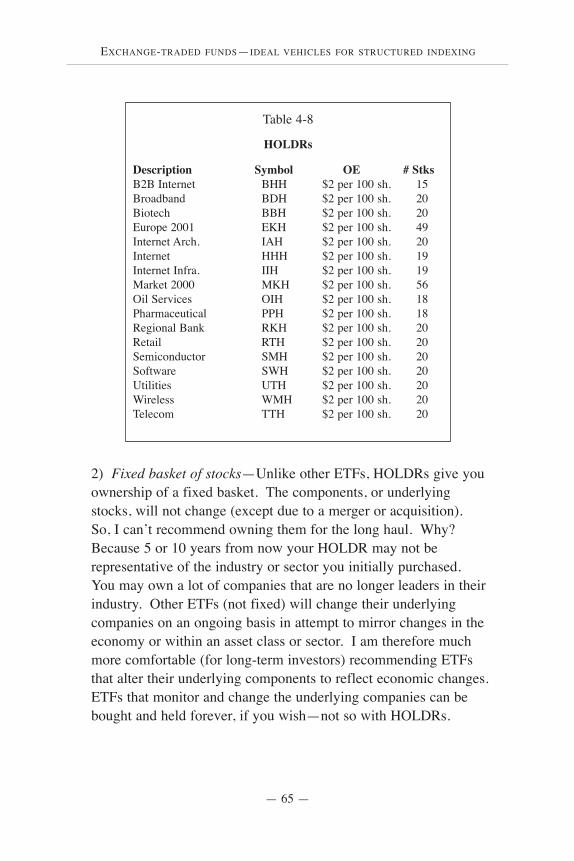
EXCHANGE-TRADED FUNDS—IDEAL VEHICLES FOR STRUCTURED INDEXING
— 65 —
2) Fixed basket of stocks—Unlike other ETFs, HOLDRs give youownership of a fixed basket. The components, or underlyingstocks, will not change (except due to a merger or acquisition).So, I can’t recommend owning them for the long haul. Why?Because 5 or 10 years from now your HOLDR may not berepresentative of the industry or sector you initially purchased.You may own a lot of companies that are no longer leaders in theirindustry. Other ETFs (not fixed) will change their underlyingcompanies on an ongoing basis in attempt to mirror changes in theeconomy or within an asset class or sector. I am therefore muchmore comfortable (for long-term investors) recommending ETFsthat alter their underlying components to reflect economic changes.ETFs that monitor and change the underlying companies can bebought and held forever, if you wish—not so with HOLDRs.
Table 4-8
HOLDRs
Description Symbol OE # StksB2B Internet BHH $2 per 100 sh. 15Broadband BDH $2 per 100 sh. 20Biotech BBH $2 per 100 sh. 20Europe 2001 EKH $2 per 100 sh. 49Internet Arch. IAH $2 per 100 sh. 20Internet HHH $2 per 100 sh. 19Internet Infra. IIH $2 per 100 sh. 19Market 2000 MKH $2 per 100 sh. 56Oil Services OIH $2 per 100 sh. 18Pharmaceutical PPH $2 per 100 sh. 18Regional Bank RKH $2 per 100 sh. 20Retail RTH $2 per 100 sh. 20Semiconductor SMH $2 per 100 sh. 20Software SWH $2 per 100 sh. 20Utilities UTH $2 per 100 sh. 20Wireless WMH $2 per 100 sh. 20Telecom TTH $2 per 100 sh. 20
ADVANCED PORTFOLIO MANAGEMENT
— 66 —
3) More risk—Because HOLDRs are fixed baskets, oncecreated, the underlying companies’ performance will dictate theirweighting within the HOLDR. This can lead not only to poordiversification, but a lot of risk. For example, when the InternetArchitecture HOLDR (IAH) was initially created, it offered muchbetter diversification than at present. Most of the companies inthis HOLDR have performed poorly over the past couple of years,except for a few exceptions. The “exceptions” now have a hugeweighting within this basket of 20 stocks. IBM now representsalmost 40% of the entire basket. This is hardly representative ofthe entire sector. So, you may have initially bought a fairly broad-based portfolio of stocks with diversified weightings, but themarket can change that pretty quickly.
4) Round lots of 100 shares only—HOLDRs are purchasedand sold in round lots of 100 shares only. This is designed toallow the issuance and cancellation of HOLDRs, since odd-lotswould not represent whole share amounts of the underlyingcompanies. So, to invest in a HOLDR that is trading at $100, youhave to come up with $10,000. This is a disadvantage for smallinvestors.
5) Lots of mail—If you own a HOLDR, you basically havedirect ownership of all the underlying companies. Therefore, youwill receive annual reports and proxy material for approximately20 companies per HOLDR. You may have to rent a P.O. box tohandle all the mail. I’ve had complaints from several investors,but there isn’t much you can do about it. However, the HOLDRWeb site mentions that there is now an option to receive proxymaterial by e-mail rather than physical mail. Sounds better to me.
6) Cost to receive underlying shares—If you decide tounbundle your HOLDR, you will have to pay $10 per 100 sharesto do so. This is not a lot of money, but it is an additional fee thatyou normally wouldn’t incur with other ETFs. And, if you then
EXCHANGE-TRADED FUNDS—IDEAL VEHICLES FOR STRUCTURED INDEXING
— 67 —
decide to sell some of the individual pieces within your HOLDR(after unbundling it), you will probably have to pay commissionsto your brokerage firm for liquidating each piece. Thecommissions could add up quickly if you sell a lot of stocks.
7) Cost-basis headaches—When HOLDRs were originallylaunched in 1998, some of these grantor trusts soon afterwardsdistributed shares from mergers and spin-offs outside of theHOLDRs. It was quite difficult to calculate the cost basis for thespun-off pieces outside the original HOLDR, and adjust the costbasis of the HOLDR itself. I was one of several advisors andinvestors who complained out loud about this. HOLDRs wereeventually amended on November 22, 2000, to eliminate most ofthe distributions of the securities. So, this cost-basis headache isnow resolved thanks to the amendment. Still, if you ultimatelydecide to unbundle your HOLDR, you’ll have to know the costbasis for each company that you own in your HOLDR. Go towww.holdrs.com and see the cost-basis calculator for help.
To summarize—I like HOLDRs, but only in rare cases. Letme give you an example. A client of mine recently had anoverweight position in Merck stock (this was the only individualstock remaining in a portfolio that I “inherited.” I wasn’tcomfortable with this overweight position, and I suggesteddiversifying out of the stock to lower risk. The client, however,particularly liked the pharmaceutical sector and wantedrepresentation within the sector. I recommended purchasing thePharmaceutical HOLDR rather than the iShares Healthcare ETF,since this would give the investor more concentrated ownership ofblue-chip pharmaceutical companies. So, the investor bought theHOLDR and got ownership in 18 stocks in the pharmaceuticalsector and better diversification of risk.
HOLDRs are worth considering, but I usually favor otherETFs. Reread the disadvantages before taking the plunge.
ADVANCED PORTFOLIO MANAGEMENT
— 68 —
THERE ARE MANY FACTORS TO CONSIDER before buyingstocks, regardless if you’re purchasing an individual stock, fund orETF. Before any purchase, your first step is to understand therisks you will assume by owning the investment. There are threetypes of risks inherent in owning stocks—market, style, and size
Measuring risk5
There are lots of risks in the marketplace, but if the market doesn’t reward them, then investors will stay away.
—REX SINQUEFIELD, Dimensional Fund Advisors, Inc.
In ‘Determinants of Portfolio Performance II: An Update,’Gary Brinson, Brian Singer and Gilbert Beebower haveagain demonstrated that approximately 93% to 95% of theperformance and risk in any investment portfolio can beattributed to the asset classes chosen, and only around 5%to 7% can be attributed to market timing, the style of themanager, or the individual investments selected. Forexample, if my 12-year-old son were managing a real estateportfolio and a top professional equity manager wasmanaging an equity portfolio in 1987, my son would haveoutperformed the experienced equity manager. Not becausehe knew more about real estate, but simply because he wasin the right asset class at the time.
—www.advisoryworld.com

MEASURING RISK
— 69 —
risk. We will look at each risk in detail in this chapter. Inaddition to risk factors, you need to understand how eachinvestment is presently valued. Is it cheap or expensive rightnow? What are its prospects for growth? The valuationmeasurements I use are popular and widely acceptable. Price-to-earnings ratios (P/Es) , price-to-earnings growth ratios (PEGs),and price-to-book ratios (P/Bs) are three valuation measurementsthat I will also review in this chapter. In addition, I look at avaluation measurement of the stock and bond markets as a whole,by using a simple tool—the so-called Fed Model. This modelgives me a good indication as to how the overall stock market isvalued relative to bonds. The last factor I consider beforerecommending a purchase is how an investment behaves inrelation to other investments. This is learned by studyingcorrelation coefficients, and it can help to assure properdiversification of investments within the total portfolio.
We’ll cover risk measurements in this chapter and then look atvaluations and correlations in Chapter 7.
Measurements of risk
Beta—an incomplete measurement of risk
In the mid-1960s, the Capital Asset Pricing Model (CAPM)was introduced to the investment world. William Sharpe laterwon a Nobel Prize for his work on CAPM during this period. Idon’t want to go into much detail about CAPM, but it is importantto recognize that it was the beginning of a risk measurement toolcalled beta. Beta calculations compare the movements of themarket as a whole (S&P 500) to other investments (e.g., stocks,asset classes, sectors). A beta of 1 is assigned to the broadmarket. Any reading under 1 means the investment is more stablethan the market itself. For example, a reading of .50 would meanthe investment has half the volatility of the market. If the market
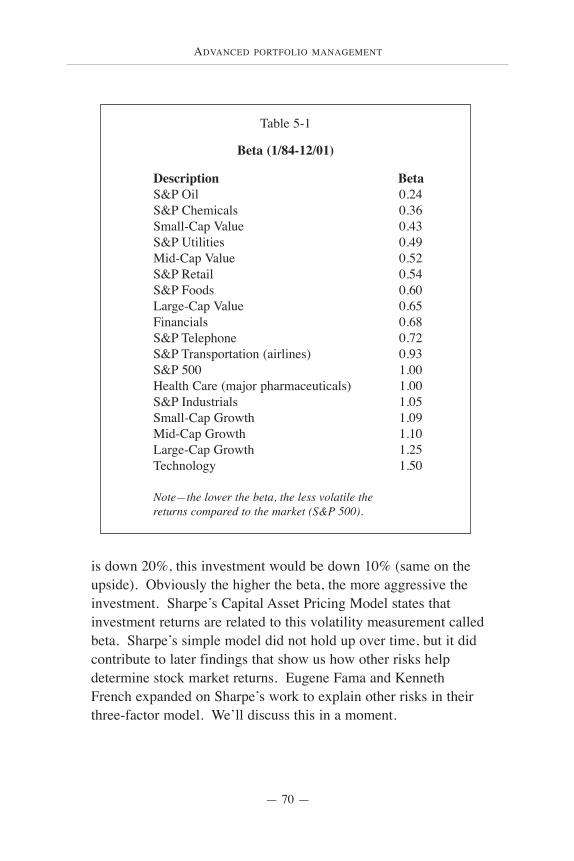
ADVANCED PORTFOLIO MANAGEMENT
— 70 —
is down 20%, this investment would be down 10% (same on theupside). Obviously the higher the beta, the more aggressive theinvestment. Sharpe’s Capital Asset Pricing Model states thatinvestment returns are related to this volatility measurement calledbeta. Sharpe’s simple model did not hold up over time, but it didcontribute to later findings that show us how other risks helpdetermine stock market returns. Eugene Fama and KennethFrench expanded on Sharpe’s work to explain other risks in theirthree-factor model. We’ll discuss this in a moment.
Table 5-1
Beta (1/84-12/01)
Description BetaS&P Oil 0.24S&P Chemicals 0.36Small-Cap Value 0.43S&P Utilities 0.49Mid-Cap Value 0.52S&P Retail 0.54S&P Foods 0.60Large-Cap Value 0.65Financials 0.68S&P Telephone 0.72S&P Transportation (airlines) 0.93S&P 500 1.00Health Care (major pharmaceuticals) 1.00S&P Industrials 1.05Small-Cap Growth 1.09Mid-Cap Growth 1.10Large-Cap Growth 1.25Technology 1.50
Note—the lower the beta, the less volatile the returns compared to the market (S&P 500).
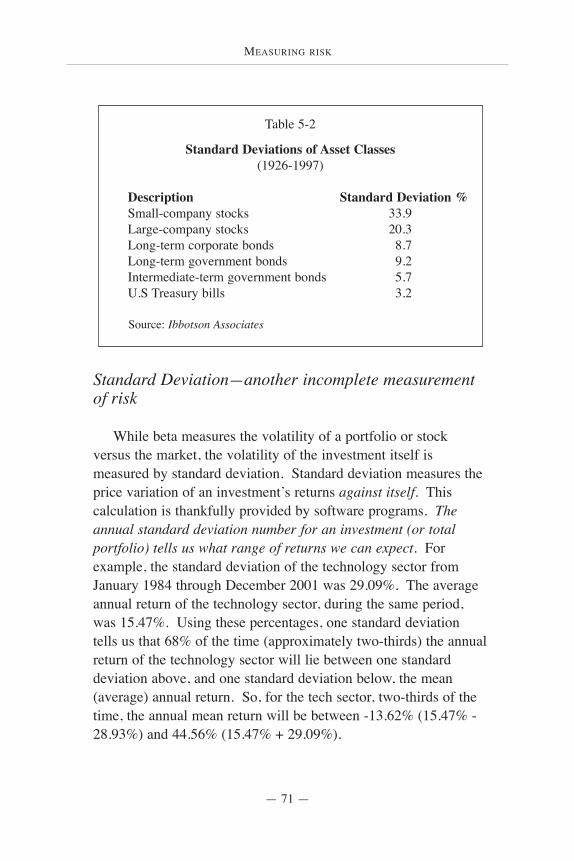
MEASURING RISK
— 71 —
Standard Deviation—another incomplete measurementof risk
While beta measures the volatility of a portfolio or stockversus the market, the volatility of the investment itself ismeasured by standard deviation. Standard deviation measures theprice variation of an investment’s returns against itself. Thiscalculation is thankfully provided by software programs. Theannual standard deviation number for an investment (or totalportfolio) tells us what range of returns we can expect. Forexample, the standard deviation of the technology sector fromJanuary 1984 through December 2001 was 29.09%. The averageannual return of the technology sector, during the same period,was 15.47%. Using these percentages, one standard deviationtells us that 68% of the time (approximately two-thirds) the annualreturn of the technology sector will lie between one standarddeviation above, and one standard deviation below, the mean(average) annual return. So, for the tech sector, two-thirds of thetime, the annual mean return will be between -13.62% (15.47% -28.93%) and 44.56% (15.47% + 29.09%).
Table 5-2
Standard Deviations of Asset Classes (1926-1997)
Description Standard Deviation %Small-company stocks 33.9Large-company stocks 20.3Long-term corporate bonds 8.7Long-term government bonds 9.2Intermediate-term government bonds 5.7U.S Treasury bills 3.2
Source: Ibbotson Associates
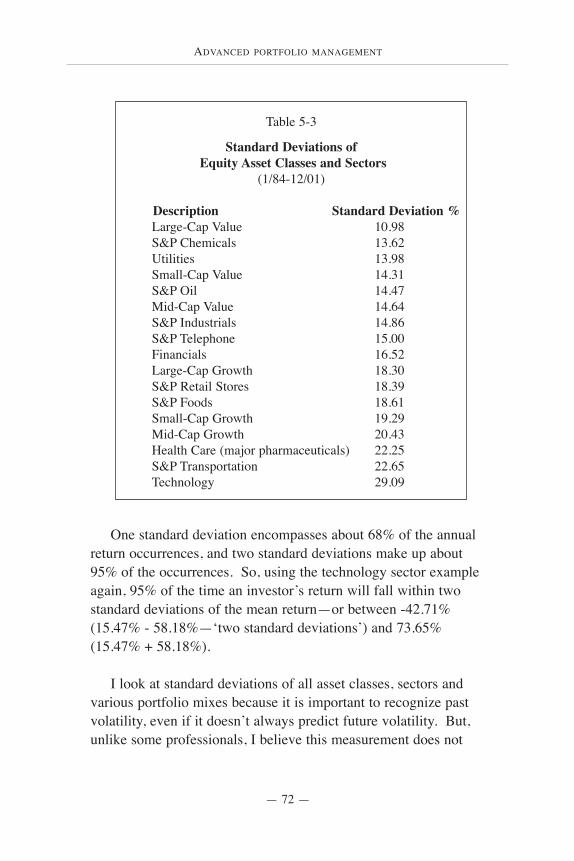
ADVANCED PORTFOLIO MANAGEMENT
— 72 —
One standard deviation encompasses about 68% of the annualreturn occurrences, and two standard deviations make up about95% of the occurrences. So, using the technology sector exampleagain, 95% of the time an investor’s return will fall within twostandard deviations of the mean return—or between -42.71%(15.47% - 58.18%—‘two standard deviations’) and 73.65%(15.47% + 58.18%).
I look at standard deviations of all asset classes, sectors andvarious portfolio mixes because it is important to recognize pastvolatility, even if it doesn’t always predict future volatility. But,unlike some professionals, I believe this measurement does not
Table 5-3
Standard Deviations ofEquity Asset Classes and Sectors
(1/84-12/01)
Description Standard Deviation %Large-Cap Value 10.98S&P Chemicals 13.62Utilities 13.98Small-Cap Value 14.31S&P Oil 14.47Mid-Cap Value 14.64S&P Industrials 14.86S&P Telephone 15.00Financials 16.52Large-Cap Growth 18.30S&P Retail Stores 18.39S&P Foods 18.61Small-Cap Growth 19.29Mid-Cap Growth 20.43Health Care (major pharmaceuticals) 22.25S&P Transportation 22.65Technology 29.09
MEASURING RISK
— 73 —
give a credible indication of expected returns—it’s been proven.What standard deviation does tell us is what range of volatility toexpect from an investment—and that’s why it’s important.
I’ve listed the standard deviations for various asset classes inTables 5-2 and 5-3. Table 5-2 shows the standard deviations formajor asset classes from 1926-1997. Table 5-3 shows standarddeviations for equity asset classes and sectors only, from 1984through 2001. Remember, the lower the standard deviation, the less volatile the investment.
If you were a conservative stock investor and you believed thatstandard deviation was the only acceptable measurement of risk,you would weight your portfolio in favor of investments with thelowest standard deviations that give the highest return (see Table6-2 for Sharpe Ratio measurements). This would makestructuring a portfolio relatively simple—optimizer programs cando this for you. Unfortunately it’s not that simple.
Note—even if standard deviation doesn’t accurately predict theexpected returns for investments, it is still a very important riskmeasurement. Common sense and experience have taught me thatif I own an investment with a high standard deviation, I had betterbe ready for the possibility of losing my shirt in certain periods(e.g., technology sector 2000-2001).
Three-factor model—risks you can count on
Sharpe’s beta model and standard deviations do not factor inall sources of risk in stocks. The works of Eugene Fama of theUniversity of Chicago, and Kenneth French of Yale University,identified two other risk factors (in addition to market risk, whichwas already widely accepted) that contribute to returns. Theirfindings completed the puzzle of how risk and return are related.Fama and French found that two additional risks—style risk, as
ADVANCED PORTFOLIO MANAGEMENT
— 74 —
measured by book-to-market valuations, and size risk, asmeasured by the market capitalization of a company—contributeto returns. Fama and French tested many different variables to tryto explain returns, but the two factors that showed the highestsuccess in explaining expected returns were size- and style-specific risk. To summarize, Fama and French found that stocksof small and distressed companies (commonly mislabeled as“value” stocks) gave the highest returns. They concluded thatthese two factors, in addition to the market-risk factor, explain allthe differences in portfolio returns.
The three-factor model proves that returns are related tovarious types of risk. And, the historical outperformance of small-cap and distressed stocks can be explained by the fact that theyare indeed riskier than other stocks.
1) Equity market risk
Equity market risk refers to the extra risk (beyond risk-freerates of return) inherent in stocks that you are willing to assume,to hopefully get a higher return. Market risk is also known assystematic risk, which states that stock prices generally movetogether. There is no way to avoid this type of risk. If you ownstocks, you have market risk, period. Historically, this added riskhas rewarded stock owners with an average annual return of 6% to7% more than the rate of inflation. Investors can choose to investin a T-bill and get very little premium over inflation, or, if they arewilling to accept market risk to hopefully get a higher return, theycan own stocks. Market risk is considered the same for someonebuying the S&P 500 or any other stock asset class or sector.Everyone can relate to market risk; if you own stocks you assumethis risk.
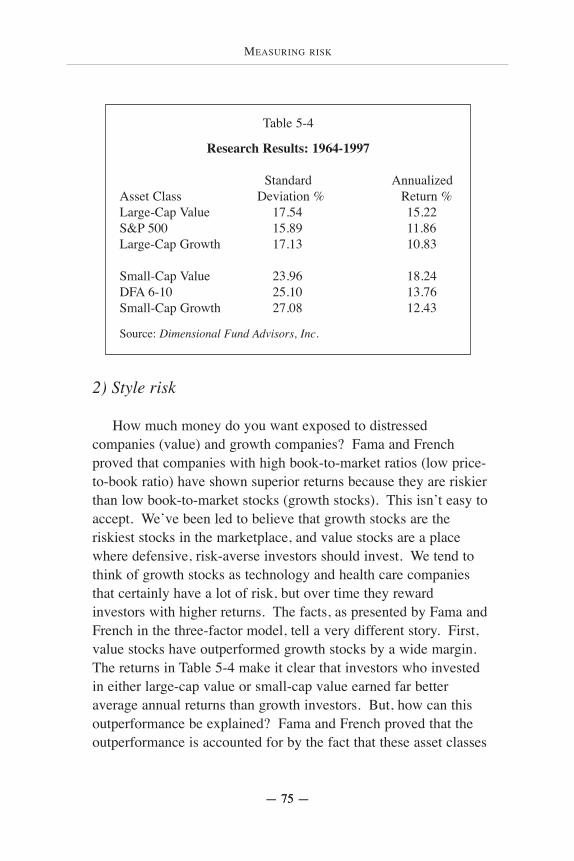
MEASURING RISK
— 75 —— 75 —
2) Style risk
How much money do you want exposed to distressedcompanies (value) and growth companies? Fama and Frenchproved that companies with high book-to-market ratios (low price-to-book ratio) have shown superior returns because they are riskierthan low book-to-market stocks (growth stocks). This isn’t easy toaccept. We’ve been led to believe that growth stocks are theriskiest stocks in the marketplace, and value stocks are a placewhere defensive, risk-averse investors should invest. We tend tothink of growth stocks as technology and health care companiesthat certainly have a lot of risk, but over time they rewardinvestors with higher returns. The facts, as presented by Fama andFrench in the three-factor model, tell a very different story. First,value stocks have outperformed growth stocks by a wide margin.The returns in Table 5-4 make it clear that investors who investedin either large-cap value or small-cap value earned far betteraverage annual returns than growth investors. But, how can thisoutperformance be explained? Fama and French proved that theoutperformance is accounted for by the fact that these asset classes
Table 5-4
Research Results: 1964-1997
Standard Annualized Asset Class Deviation % Return %Large-Cap Value 17.54 15.22S&P 500 15.89 11.86Large-Cap Growth 17.13 10.83
Small-Cap Value 23.96 18.24DFA 6-10 25.10 13.76Small-Cap Growth 27.08 12.43
Source: Dimensional Fund Advisors, Inc.
ADVANCED PORTFOLIO MANAGEMENT
— 76 —— 76 —
contain more risk.
I was baffled by the idea of value stocks being riskier thangrowth stocks until I stopped thinking of them as “value” stocksand instead thought of them as “distressed.” If you think of whatwe normally call a value stock, actually as a struggling company,it may make sense to you that it is indeed riskier to own acompany that is doing poorly (bad earnings). The growthcompany is doing well and has good earnings and good futureprospects. The market knows this. Everyone knows this. So,doesn’t it make sense that when you think of a value company,struggling to make money, that it has more risk than a growthcompany?
Another false public perception is that value stocks are actuallyselling at a discount (low P/E multiple, or low price-to-book ratio).Their stock prices have been punished and they are therefore, now,a bargain. While this may be true, the point that is missed is thatcompanies that are selling at a so-called discount to the rest of themarket are indeed unattractive, have poor earnings, and still carrya lot of risk. A struggling company can either continue struggling,improve, or die. Many of these distressed companies never revive,and it’s this risk that should be recognized by investors.Remember, they’re selling at low prices for the simple reason thatthey are crummy earners and there is still a great chance that thepoor performance will continue.
The work by Merton Miller, for which he earned a Nobel Prizein 1990, also helped me understand why so-called value stocks areriskier than growth stocks. His work on the cost of capital showswhy a value stock carries risk that is directly related to its level ofdistress. Again, a value stock is typically priced low for areason—the company’s hurting. It’s having trouble with earningsand its price has dropped as a result. If this company goes to themarketplace to raise capital (equity or debt), its cost for doing so is
MEASURING RISK
— 77 —
going to be higher than that of a healthy company. It makes sensethat investors who are willing to lend this company money (buyits bonds), will demand a higher reward for assuming the risk thatthey might not get their principal back. They will demand ahigher rate of return from the bonds (higher interest payments).Therefore, the cost of capital is higher to the struggling, distressedcompany (value) than it is to the healthy one (growth).
An excellent example of the cost of capital at work was givenin a paper by Eugene Fama Jr. of Dimensional Fund Advisors,Inc., in Senior Consults magazine. Fama Jr. gave the example ofMicrosoft and Apple Computer going to a bank for a loan. Heasks—“Which company will pay a higher interest rate for theloan?” The answer is Apple, since its future is more uncertain,and the bank will need to be paid extra for loaning it money.Fama Jr. goes on to explain that this similar risk to owning AppleComputer can also be seen in the stock market. If an investorbuys Apple stock he is expecting a higher return. Microsoft is asafer bet, since it has better earnings. So, for an investor to buyApple stock, he or she must believe there is potential for a higherreturn. Makes sense. Why would anyone buy Apple if it weren’tfor the extra return? If the investor wasn’t looking for extrareturn, wouldn’t it make sense to just buy Microsoft, since it’ssafer? The market has priced Apple’s stock at a discount (like avalue stock) because there is more risk, and therefore, theexpected return is higher. (This example can also be used to showthat the cost of capital applies to the size of the company too—it’sgoing to be higher for a relatively small company (AppleComputer, in this example) with uncertain earnings versus a large-cap, proven earner (Microsoft).
Understanding the cost of capital shows why distressedcompanies should have a higher expected return—in the bond andstock markets. Again, no rational investor would take on the extrarisk of lending a distressed company money (buying its bonds),
ADVANCED PORTFOLIO MANAGEMENT
— 78 —
or buying its stock, if they didn’t expect to get a higher return forassuming the added risk. If you look at value stocks versusgrowth stocks, from a cost-of-capital perspective, it is clear wherethere is more risk. This helps explain why the risktakers—investors who buy distressed companies—demand, and over timeget, a higher return. Risk and return are related and the historicalreturns of riskier companies have shown that they rewardshareholders with higher returns.
The data in Table 5-5 show clearly how companies that arestruggling with earnings ultimately reward investors for assumingthe higher risk of owning them. This is apparent when looking atvalue stocks versus growth stocks and also small stocks versuslarge stocks. The poor earners in the two different categoriesshowed better annual rates of returns than the good earners. Thissupports the findings of Fama and French, that value stocks andsmall stocks carry additional risks, but if shareholders assumethese risks, they will, if they wait long enough, be rewarded.
I would like to make a brief comment about what I believe isthe public’s misunderstanding of the risks in growth versus valuestocks. As I mentioned earlier, I believe most investors thinkgrowth stocks are riskier than value stocks. Investors tend toassociate growth stocks with tech stocks and we’ve all seen howtech stocks can get killed. Anyway, I agree with and understandthe concepts outlined by Fama and French, which prove thatdistressed companies with poor earnings are riskier than growthcompanies with healthy earnings. But, I think some commonsense is needed to determine which group carries the most risk atany given time. For example, in hindsight, technology stocks,which are growth stocks, were obviously overvalued and veryrisky in March 2000. Any rational investor, with the benefit ofhindsight, could not have believed that technology stocks were notriskier, at that point, than value stocks. Value stocks had notappreciated like the rest of the market, and still had relatively
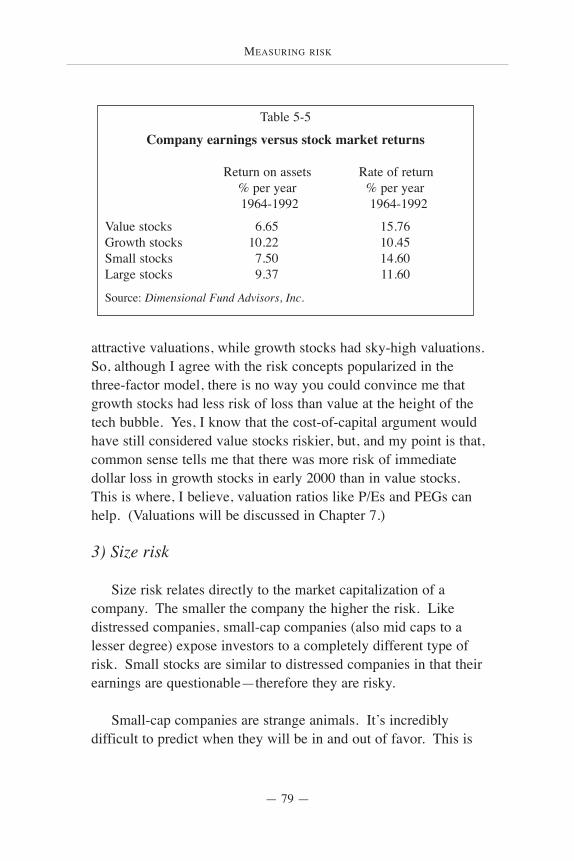
MEASURING RISK
— 79 —
attractive valuations, while growth stocks had sky-high valuations.So, although I agree with the risk concepts popularized in thethree-factor model, there is no way you could convince me thatgrowth stocks had less risk of loss than value at the height of thetech bubble. Yes, I know that the cost-of-capital argument wouldhave still considered value stocks riskier, but, and my point is that,common sense tells me that there was more risk of immediatedollar loss in growth stocks in early 2000 than in value stocks.This is where, I believe, valuation ratios like P/Es and PEGs canhelp. (Valuations will be discussed in Chapter 7.)
3) Size risk
Size risk relates directly to the market capitalization of acompany. The smaller the company the higher the risk. Likedistressed companies, small-cap companies (also mid caps to alesser degree) expose investors to a completely different type ofrisk. Small stocks are similar to distressed companies in that theirearnings are questionable—therefore they are risky.
Small-cap companies are strange animals. It’s incrediblydifficult to predict when they will be in and out of favor. This is
Table 5-5
Company earnings versus stock market returns
Return on assets Rate of return% per year % per year1964-1992 1964-1992
Value stocks 6.65 15.76Growth stocks 10.22 10.45Small stocks 7.50 14.60Large stocks 9.37 11.60
Source: Dimensional Fund Advisors, Inc.
ADVANCED PORTFOLIO MANAGEMENT
— 80 —
also what makes them riskier than large caps. Studies have shownthat from 1936-1975, the average return of small-cap companieswas substantially higher than the average return for large-capcompanies. This nicely supported the three-factor model. Small-cap stocks returned about 1.5% more on average annually thanlarge-cap stocks during this period. But then, just to show youhow fickle they are, small-cap stocks’ earnings did not recover asmuch as large caps’ after the recession of 1980-1981. And, thesmall-firm effect disappeared between 1981-1991. S&P 500 stocksreturned an average of 15.7% during that period, and small stocksreturned an average of 13.3%. This example (decade of the1980s) shows that small-cap stocks are certainly unpredictable(perhaps more so than large-cap stocks) and they do contain adifferent type of risk. Furthermore, it is known that small-capstocks tend to move together as a group. And because they movetogether, they have a risk that cannot be diversified away. Thisadds another element of risk that investors will demand to becompensated for.
Table 5-5 appeared in Investment Gurus, an excellent book byPeter Tanous. His message in the margin of the table stated thefollowing—“Small-cap stocks and value stocks have lower relativeearnings than large-cap stocks and growth stocks. And, theirlower earnings cause them to have higher costs of capital and,therefore, higher expected returns.”
Summary
Because we know there are 3 different types of risks in owningstocks, you must decide how much of each type of risk you arewilling to assume. Fama and French believe that by adding moreof each type of risk, investors will eventually be rewarded. But, assmall-cap investors learned in the 1980s, “eventually” may mean avery long time. Let me summarize again, how these risks work. 1) You decide to buy stocks rather than CDs, and you assume
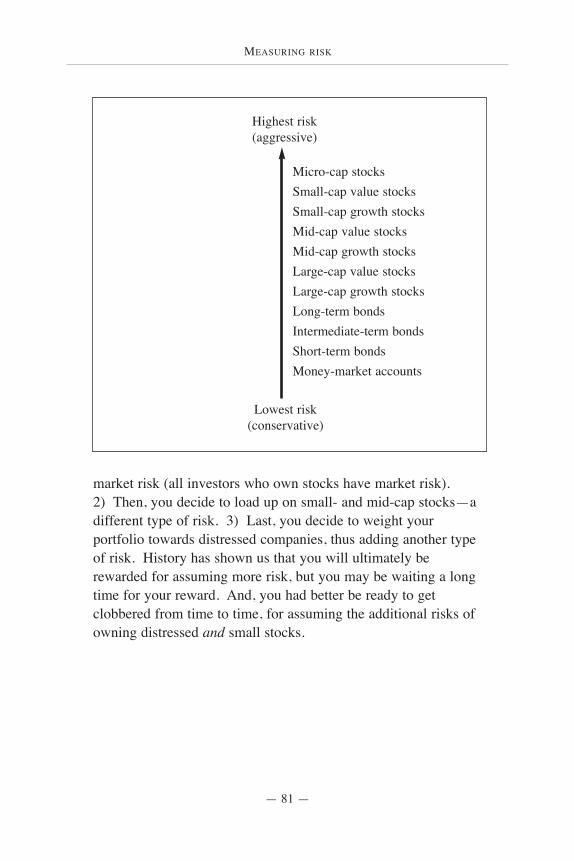
MEASURING RISK
— 81 —
market risk (all investors who own stocks have market risk).2) Then, you decide to load up on small- and mid-cap stocks—adifferent type of risk. 3) Last, you decide to weight yourportfolio towards distressed companies, thus adding another typeof risk. History has shown us that you will ultimately berewarded for assuming more risk, but you may be waiting a longtime for your reward. And, you had better be ready to getclobbered from time to time, for assuming the additional risks ofowning distressed and small stocks.
Highest risk (aggressive)
Lowest risk (conservative)
Micro-cap stocksSmall-cap value stocksSmall-cap growth stocksMid-cap value stocksMid-cap growth stocksLarge-cap value stocksLarge-cap growth stocksLong-term bondsIntermediate-term bondsShort-term bondsMoney-market accounts
ADVANCED PORTFOLIO MANAGEMENT
— 82 —
IN THE SECTION THAT COVERED BETA and standarddeviation measurements, we learned about the importance ofknowing how an investment moves in relation to the market(beta), and how an investment’s returns vary in relation to itself(standard deviation). But, how do we know whether the riskswe’re taking (if you define risk as volatility) are rewarding uswith higher returns? Two measurements, alpha and Sharpe ratios,can tell us if an investment has rewarded investors in the past,with better returns, after factoring in the risks we’ve assumed.
Alpha
Beta measures the volatility of a stock or portfolio versus the
Measuring risk and return6
If you want to define the ideal investment strategy,it is probably to achieve the highest return with thelowest risk. But that’s like going to Heaven: it’ssomething we all want to do, but we’re not realsure how to get there. After all, if I were pretty surethat by taking more risk, I could make more money,then it would be an easy choice. On the otherhand, if the risk wasn’t real, it wouldn’t be risk.
—PETER TANOUS, author of Investment Gurus
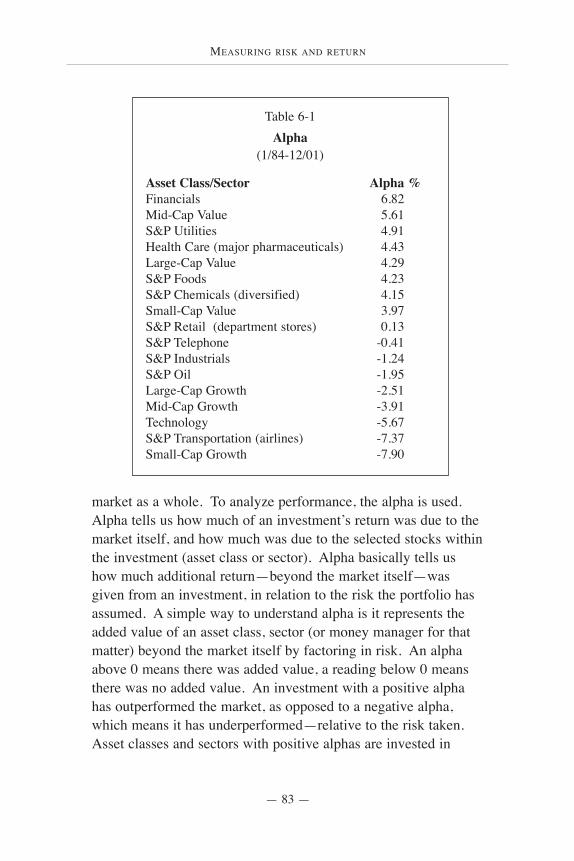
MEASURING RISK AND RETURN
— 83 —
market as a whole. To analyze performance, the alpha is used.Alpha tells us how much of an investment’s return was due to themarket itself, and how much was due to the selected stocks withinthe investment (asset class or sector). Alpha basically tells ushow much additional return—beyond the market itself—wasgiven from an investment, in relation to the risk the portfolio hasassumed. A simple way to understand alpha is it represents theadded value of an asset class, sector (or money manager for thatmatter) beyond the market itself by factoring in risk. An alphaabove 0 means there was added value, a reading below 0 meansthere was no added value. An investment with a positive alphahas outperformed the market, as opposed to a negative alpha,which means it has underperformed—relative to the risk taken.Asset classes and sectors with positive alphas are invested in
Table 6-1Alpha
(1/84-12/01)
Asset Class/Sector Alpha %Financials 6.82Mid-Cap Value 5.61S&P Utilities 4.91Health Care (major pharmaceuticals) 4.43Large-Cap Value 4.29S&P Foods 4.23S&P Chemicals (diversified) 4.15Small-Cap Value 3.97S&P Retail (department stores) 0.13S&P Telephone -0.41S&P Industrials -1.24S&P Oil -1.95Large-Cap Growth -2.51Mid-Cap Growth -3.91Technology -5.67S&P Transportation (airlines) -7.37Small-Cap Growth -7.90
ADVANCED PORTFOLIO MANAGEMENT
— 84 —
stocks that, as a whole, have outperformed the market. Assetclasses and sectors with negative alphas hold groups of stocks thathave underperformed the market.
Here’s how alpha is calculated—
alpha = investment’s return - (S&P return x investment’s beta)
For example, the financial sector had a 12% average annualreturn and its beta was .70. The return for the S&P 500 for thesame period was 10%. The calculation looks like this—
12% - (10% x .70) = 5%
Table 6-1 shows the alpha readings for various asset classesand sectors from the highest to lowest reading. The higher alphareadings tell us that the stocks in these sectors and asset classesoutperformed the market on a risk-adjusted basis.
Sharpe Ratio
The Sharpe ratio tells you whether or not you’re getting the“bang for the buck” from a particular investment. This risk-adjusted measurement is simple to calculate. Take aninvestment’s excess return above the risk-free rate of 6-month T-bills (historical rate of 6.07% from 1984-2001) and divide theresult by the asset’s standard deviation. The Sharpe ratio showsyou the most attractive investments, based on their risk-adjustedreturns.
Table 6-2 shows the Sharpe ratios for various investments. Itmay be a bit surprising for you to see that some of the sectors andasset classes don’t really give you much of a reward for theamount of risk taken. For example, the technology sector, whileshowing a very good average annual return from 1/84-12/01, is
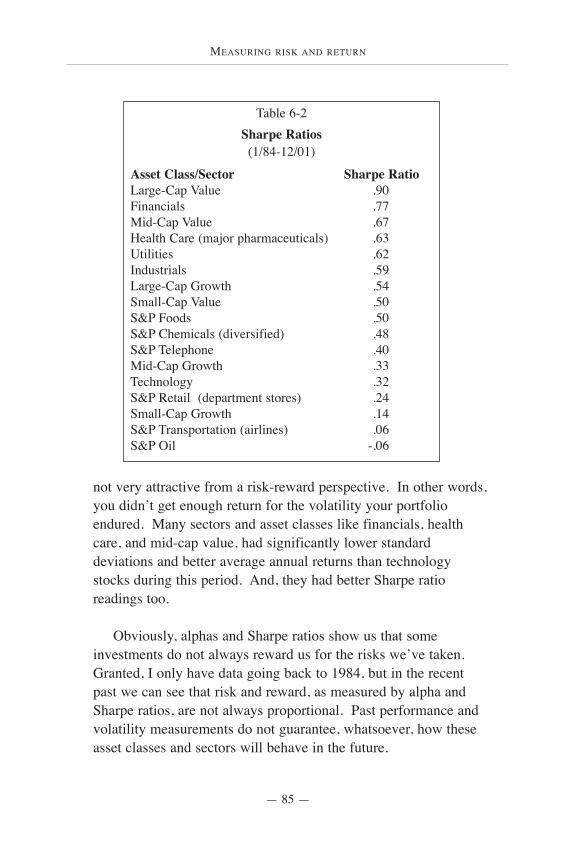
MEASURING RISK AND RETURN
— 85 —
not very attractive from a risk-reward perspective. In other words,you didn’t get enough return for the volatility your portfolioendured. Many sectors and asset classes like financials, healthcare, and mid-cap value, had significantly lower standarddeviations and better average annual returns than technologystocks during this period. And, they had better Sharpe ratioreadings too.
Obviously, alphas and Sharpe ratios show us that someinvestments do not always reward us for the risks we’ve taken.Granted, I only have data going back to 1984, but in the recentpast we can see that risk and reward, as measured by alpha andSharpe ratios, are not always proportional. Past performance andvolatility measurements do not guarantee, whatsoever, how theseasset classes and sectors will behave in the future.
Table 6-2Sharpe Ratios(1/84-12/01)
Asset Class/Sector Sharpe RatioLarge-Cap Value .90Financials .77Mid-Cap Value .67Health Care (major pharmaceuticals) .63Utilities .62Industrials .59Large-Cap Growth .54Small-Cap Value .50S&P Foods .50S&P Chemicals (diversified) .48S&P Telephone .40Mid-Cap Growth .33Technology .32S&P Retail (department stores) .24Small-Cap Growth .14S&P Transportation (airlines) .06S&P Oil -.06
ADVANCED PORTFOLIO MANAGEMENT
— 86 —
STOCK PRICES ARE GENERALLY DRIVEN by corporateearnings. Typically, as earnings improve, so do stock prices.Corporate earnings have averaged about 7% annual growth overthe past 50 years or so. As an investor, you should focus onearnings to give you an idea as to what an investment is worth.Forward earnings are what matter, not past earnings, since we are
Stock valuations and correlations
Don’t forget that the norm for the U.S. stock market overthe past 80 years is a price/earnings ratio of about 15.
The current reading is in the 40s.—FELIX ZULAUF, investment manager
The 25-year average P/E for the S&P 500 is 17.05. The 50-year average is 16.17. The 80-year
average is approximately 15.
When the S&P’s P/E has climbed above 20.2, the market haslost 2.5% in the subsequent three months, 7.3% over the sixmonths and 1.4% over 12 months, according to Ned Davis
Research. After two years stocks historically have eked out areturn of just 0.8%. Conversely, when the market’s P/E has
fallen below 9.3, stocks have returned 5.8% after three months, 13.2% after one year and 27.5% after two years.
But, P/Es can stay high for years. —TIM HAYES, global equity strategist
7
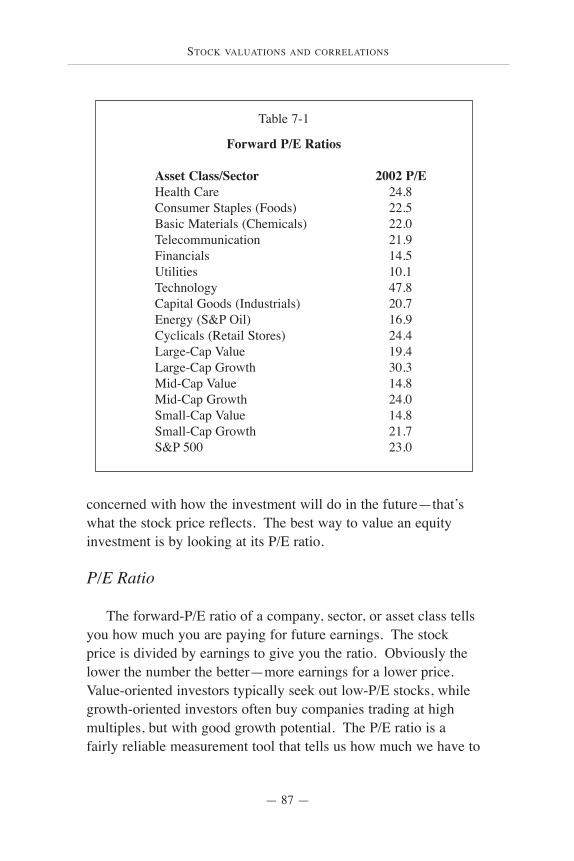
STOCK VALUATIONS AND CORRELATIONS
— 87 —
concerned with how the investment will do in the future—that’swhat the stock price reflects. The best way to value an equityinvestment is by looking at its P/E ratio.
P/E Ratio
The forward-P/E ratio of a company, sector, or asset class tellsyou how much you are paying for future earnings. The stockprice is divided by earnings to give you the ratio. Obviously thelower the number the better—more earnings for a lower price.Value-oriented investors typically seek out low-P/E stocks, whilegrowth-oriented investors often buy companies trading at highmultiples, but with good growth potential. The P/E ratio is afairly reliable measurement tool that tells us how much we have to
Table 7-1
Forward P/E Ratios
Asset Class/Sector 2002 P/EHealth Care 24.8Consumer Staples (Foods) 22.5Basic Materials (Chemicals) 22.0Telecommunication 21.9Financials 14.5Utilities 10.1Technology 47.8Capital Goods (Industrials) 20.7Energy (S&P Oil) 16.9Cyclicals (Retail Stores) 24.4Large-Cap Value 19.4Large-Cap Growth 30.3Mid-Cap Value 14.8Mid-Cap Growth 24.0Small-Cap Value 14.8Small-Cap Growth 21.7S&P 500 23.0
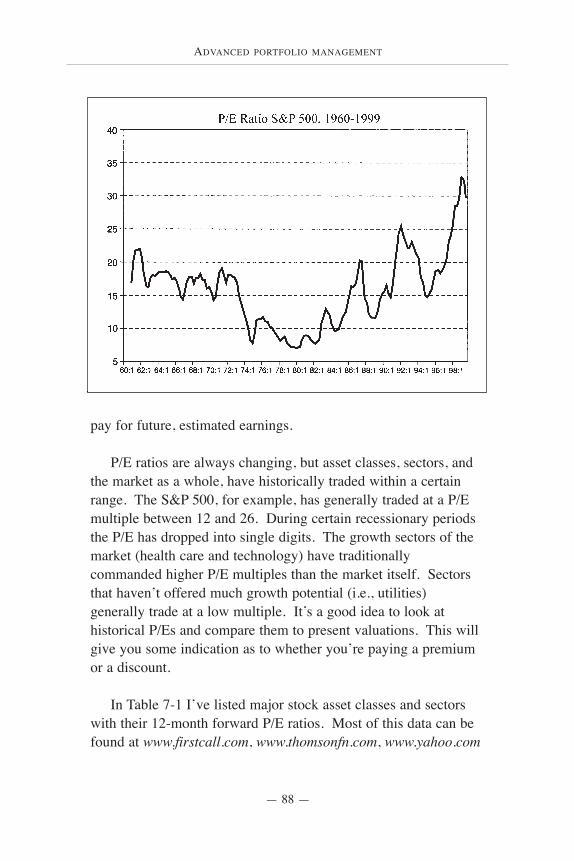
ADVANCED PORTFOLIO MANAGEMENT
— 88 —
pay for future, estimated earnings.
P/E ratios are always changing, but asset classes, sectors, andthe market as a whole, have historically traded within a certainrange. The S&P 500, for example, has generally traded at a P/Emultiple between 12 and 26. During certain recessionary periodsthe P/E has dropped into single digits. The growth sectors of themarket (health care and technology) have traditionallycommanded higher P/E multiples than the market itself. Sectorsthat haven’t offered much growth potential (i.e., utilities)generally trade at a low multiple. It’s a good idea to look athistorical P/Es and compare them to present valuations. This willgive you some indication as to whether you’re paying a premiumor a discount.
In Table 7-1 I’ve listed major stock asset classes and sectorswith their 12-month forward P/E ratios. Most of this data can befound at www.firstcall.com, www.thomsonfn.com, www.yahoo.com
STOCK VALUATIONS AND CORRELATIONS
— 89 —
and www.barra.com. As a rule of thumb it is preferable topurchase low-P/E asset classes and sectors, but you already knowthat. You can see in Table 7-1, that right now the market (S&P500) is trading at a forward P/E multiple of 23, near the upper endof its historical range of 12 to 26.
PEG Ratio
When the stock market took off in the late 1990s, Wall Streetbulls had to try to justify the lofty stock prices. Many decided thattraditional valuation measurements, like P/Es, didn’t tell the wholestory. The optimists argued that the high P/Es were justifiedbecause they were based on great future earnings growth potential.The PEG ratio became popular—it factored in this future growthby dividing the P/E ratio by the 5-year average annual earningsgrowth estimates. The PEG ratio tells you if a company’s P/E is inline with its growth rate.
The mathematical expression of the PEG ratio is given as avariation from 1.0. 1.0 is considered “fair” value. So, a readingover 1.0 is considered a premium, and a reading below 1.0 isconsidered a discount to fair value. Here’s a simple example of aPEG calculation—a company trading at 20 times earnings (P/E of20), with an estimated growth rate of 20% annually, would have aPEG ratio of 1.0 (20/20=1). If this same stock were trading at 40times earnings, the PEG ratio would be 2.0 (40/20=2).
Table 7-2 shows us the stock market is not cheap, based on itshistorical PEG. The present PEG ratio for the market is 1.4, whichis above its historical average of 1.2. And, as you can see, thePEG ratios for many sectors are trading at premiums. Technologystocks, even after their recent collapse, are still trading at morethan twice their historical PEG ratio (2.5 to 1.0).
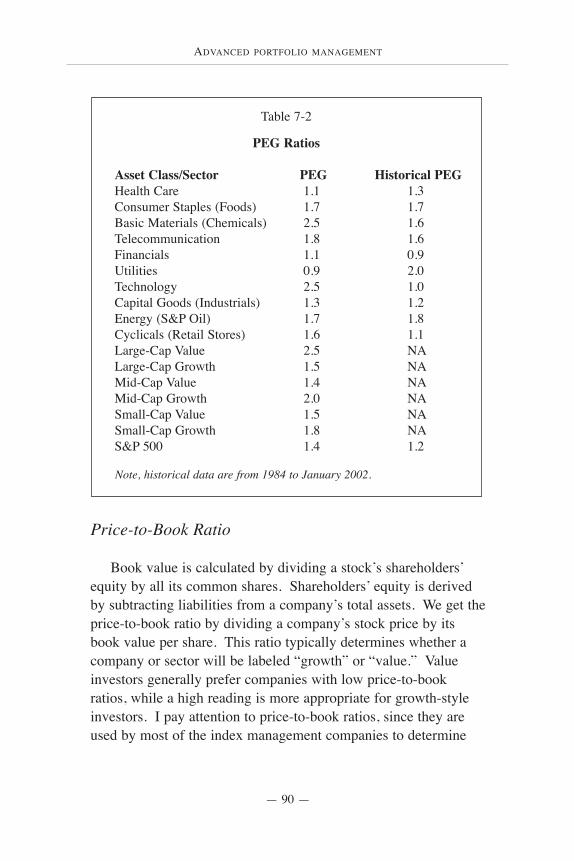
ADVANCED PORTFOLIO MANAGEMENT
— 90 —
Price-to-Book Ratio
Book value is calculated by dividing a stock’s shareholders’equity by all its common shares. Shareholders’ equity is derivedby subtracting liabilities from a company’s total assets. We get theprice-to-book ratio by dividing a company’s stock price by itsbook value per share. This ratio typically determines whether acompany or sector will be labeled “growth” or “value.” Valueinvestors generally prefer companies with low price-to-bookratios, while a high reading is more appropriate for growth-styleinvestors. I pay attention to price-to-book ratios, since they areused by most of the index management companies to determine
Table 7-2
PEG Ratios
Asset Class/Sector PEG Historical PEGHealth Care 1.1 1.3Consumer Staples (Foods) 1.7 1.7Basic Materials (Chemicals) 2.5 1.6Telecommunication 1.8 1.6Financials 1.1 0.9Utilities 0.9 2.0Technology 2.5 1.0Capital Goods (Industrials) 1.3 1.2Energy (S&P Oil) 1.7 1.8Cyclicals (Retail Stores) 1.6 1.1Large-Cap Value 2.5 NALarge-Cap Growth 1.5 NAMid-Cap Value 1.4 NAMid-Cap Growth 2.0 NASmall-Cap Value 1.5 NASmall-Cap Growth 1.8 NAS&P 500 1.4 1.2
Note, historical data are from 1984 to January 2002.
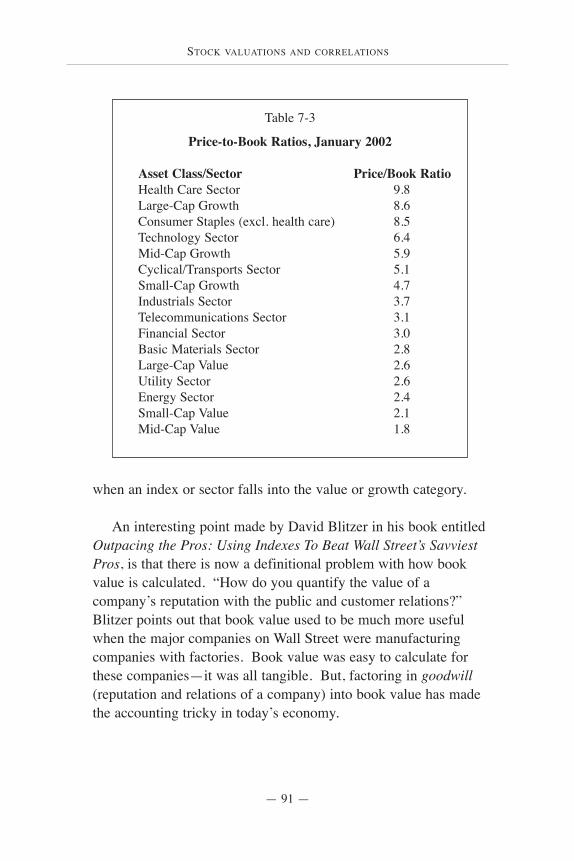
STOCK VALUATIONS AND CORRELATIONS
— 91 —
when an index or sector falls into the value or growth category.
An interesting point made by David Blitzer in his book entitledOutpacing the Pros: Using Indexes To Beat Wall Street’s SavviestPros, is that there is now a definitional problem with how bookvalue is calculated. “How do you quantify the value of acompany’s reputation with the public and customer relations?”Blitzer points out that book value used to be much more usefulwhen the major companies on Wall Street were manufacturingcompanies with factories. Book value was easy to calculate forthese companies—it was all tangible. But, factoring in goodwill(reputation and relations of a company) into book value has madethe accounting tricky in today’s economy.
Table 7-3
Price-to-Book Ratios, January 2002
Asset Class/Sector Price/Book RatioHealth Care Sector 9.8Large-Cap Growth 8.6Consumer Staples (excl. health care) 8.5Technology Sector 6.4Mid-Cap Growth 5.9Cyclical/Transports Sector 5.1Small-Cap Growth 4.7Industrials Sector 3.7Telecommunications Sector 3.1Financial Sector 3.0Basic Materials Sector 2.8Large-Cap Value 2.6Utility Sector 2.6Energy Sector 2.4Small-Cap Value 2.1Mid-Cap Value 1.8
ADVANCED PORTFOLIO MANAGEMENT
— 92 —
Fed Model
Another valuation measurement tool I look at is the so-calledFed Model. Federal Reserve Chairman Alan Greenspansupposedly commissioned his staff to come up with a stockvaluation model, and this is it. I’m not going to go into a detaileddescription of the Fed Model here, because I devote an entirechapter to the subject later in this book. However, let me giveyou a brief description.
The Fed Model, which has also been referred to by Barron’s as“Greenspan’s Model,” has been a fairly reliable tool for gaugingthe fair value of the stock market. The model gauges stock andbond valuations by comparing the yield on the 10-Year Treasurynote to the earnings yield on the S&P 500 (earnings yield is theinverse of the P/E ratio of the S&P 500).
The Fed Model reading is calculated as follows—divide 1 bythe present 10-Year Treasury note yield (1/.0495%) and multiplyyour answer by the 12-month forward, per share, earningsestimates for the S&P 500 (presently the consensus has thisnumber at $52). 20.2 x 52 = 1,050.4. Thus, 1,050.4 is fair valuefor the S&P 500. Right now, the S&P 500 is trading at 1,150, sothe market is presently overvalued by about 9.5% (1150-1050.4 =99.6 divided by 1050.4). The Fed Model tells us that bonds are abetter value than stocks right now. The model basically asks, whywould I buy stocks with an earnings yield of 4.34% (inverse ofthe forward P/E ratio) if I can get a risk-free Treasury note that isyielding almost 5.0%?
The Fed Model’s reading will change based on 3 factors—stock prices, earnings estimates, and bond yields. Just becausestock prices are falling doesn’t mean the model will be movingtoward an undervaluation reading or closer to fair value. Earningsand bond yields are just as important as stock prices, as far as the
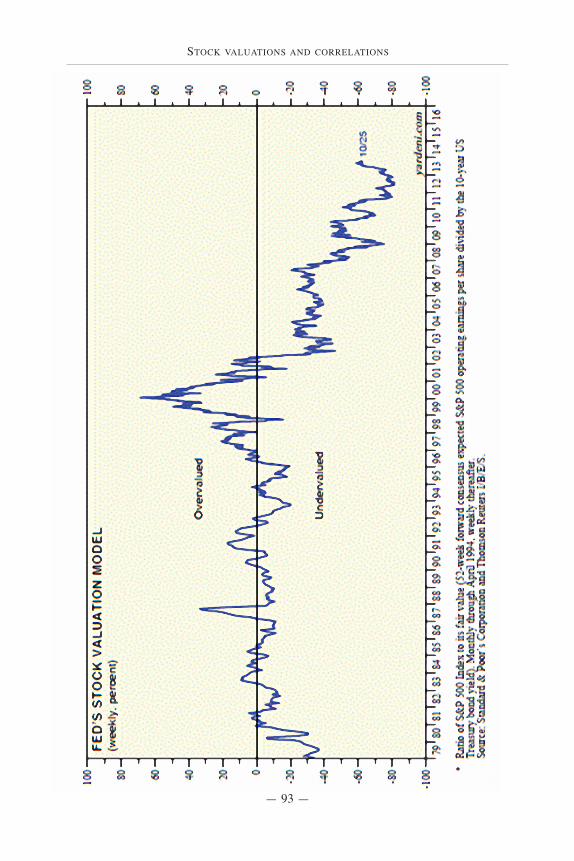
STOCK VALUATIONS AND CORRELATIONS
— 93 —
ADVANCED PORTFOLIO MANAGEMENT
— 94 —
model is concerned.
I’ll give you much more to chew on concerning the Fed Model inChapter 20.
Uncorrelated investments
The last measurements I look at prior to making a purchase orsale are correlation coefficients. They tell me how investmentsbehave relative to one another. Again, correlation refers to theway securities move in relation to one another. For example, twoinvestments that typically rise and fall together (e.g., small-capgrowth and mid-cap growth) have a high, or, positive correlation.A negative, or, low correlation indicates that two investments havevarying returns and will therefore result in less volatility (one mayrise while the other falls). Obviously, prudent investors do notwant all the pieces of their portfolios rising and falling at the sametime. Okay, I take that back. All investors (prudent or not) wantevery piece of their portfolios to rise, and no pieces to fall. Sincethis is an impossibility, it is wise to create a portfolio ofuncorrelated investments to smooth out your overall returnswithout, hopefully, giving up much upside potential. If you focuson controlling risk you must own some uncorrelated investments.
A properly diversified, uncorrelated portfolio will comfort youregardless of what the economy is doing, and regardless of whichpart of the business cycle we are in. When the economy booms,typically your growth-oriented investments will perform well.And, when a recession hits, you’ll be glad you own the consumerstaples and utility sectors—and other value, or defensive sectors.
Many investors like to focus on the few pieces in theirportfolios that show losses. For example, I may hear thefollowing from an investor—“The market’s been doing greatlately, but why haven’t I made money in utilities or consumer
STOCK VALUATIONS AND CORRELATIONS
— 95 —
staples?” My short answer is, “Because I’m doing my jobcorrectly.” The extended version of the answer goes beyond thatresponse, but there is much truth to my statement. Sure, it is easyto focus on investment losses, but over the short to intermediateterm, there will always be pieces of your portfolio that are in andout of favor. This is the beauty of an uncorrelated portfolio. Ingeneral, if you remain invested through an entire business cycle,all the pieces of your equity portfolio should show some gains—assuming an index-based portfolio. The utility sector willultimately show a positive return, and so will consumer staples,small-cap growth, etc. The key is to maintain properdiversification at all times.
Let me mention that I would never add an investment to aportfolio simply because it is uncorrelated. Correlationcoefficients are important, but so are valuation measurements. So,if you’re going to add an investment to your portfolio, you shouldfirst believe it is fairly or undervalued. Then look at how itcorrelates to the rest of your portfolio.
Note, correlation coefficients are not static—they areconstantly changing. Nevertheless, it is important to considerhow investments have behaved in the past, even if it is far from aperfect indicator of future behavior. I list correlation coefficientsfor most asset classes and sectors in Table 27-1.
Summary
Let me sum up the process I use to determine theattractiveness of different equity index-based investments.
1) First, I calculate the valuation reading of the entire stockmarket as indicated by the Fed Model. This reading gives me anidea as to whether stocks represent a good value relative to bonds.
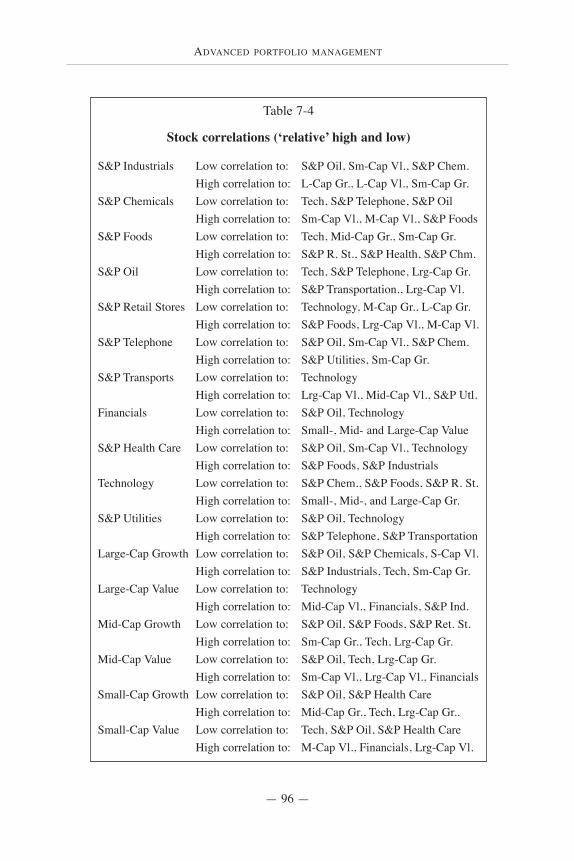
ADVANCED PORTFOLIO MANAGEMENT
— 96 —
Table 7-4
Stock correlations (‘relative’ high and low)
S&P Industrials Low correlation to: S&P Oil, Sm-Cap Vl., S&P Chem.High correlation to: L-Cap Gr., L-Cap Vl., Sm-Cap Gr.
S&P Chemicals Low correlation to: Tech, S&P Telephone, S&P Oil High correlation to: Sm-Cap Vl., M-Cap Vl., S&P Foods
S&P Foods Low correlation to: Tech, Mid-Cap Gr., Sm-Cap Gr.High correlation to: S&P R. St., S&P Health, S&P Chm.
S&P Oil Low correlation to: Tech, S&P Telephone, Lrg-Cap Gr.High correlation to: S&P Transportation., Lrg-Cap Vl.
S&P Retail Stores Low correlation to: Technology, M-Cap Gr., L-Cap Gr.High correlation to: S&P Foods, Lrg-Cap Vl., M-Cap Vl.
S&P Telephone Low correlation to: S&P Oil, Sm-Cap Vl., S&P Chem.High correlation to: S&P Utilities, Sm-Cap Gr.
S&P Transports Low correlation to: TechnologyHigh correlation to: Lrg-Cap Vl., Mid-Cap Vl., S&P Utl.
Financials Low correlation to: S&P Oil, TechnologyHigh correlation to: Small-, Mid- and Large-Cap Value
S&P Health Care Low correlation to: S&P Oil, Sm-Cap Vl., TechnologyHigh correlation to: S&P Foods, S&P Industrials
Technology Low correlation to: S&P Chem., S&P Foods, S&P R. St.High correlation to: Small-, Mid-, and Large-Cap Gr.
S&P Utilities Low correlation to: S&P Oil, TechnologyHigh correlation to: S&P Telephone, S&P Transportation
Large-Cap Growth Low correlation to: S&P Oil, S&P Chemicals, S-Cap Vl.High correlation to: S&P Industrials, Tech, Sm-Cap Gr.
Large-Cap Value Low correlation to: TechnologyHigh correlation to: Mid-Cap Vl., Financials, S&P Ind.
Mid-Cap Growth Low correlation to: S&P Oil, S&P Foods, S&P Ret. St.High correlation to: Sm-Cap Gr., Tech, Lrg-Cap Gr.
Mid-Cap Value Low correlation to: S&P Oil, Tech, Lrg-Cap Gr.High correlation to: Sm-Cap Vl., Lrg-Cap Vl., Financials
Small-Cap Growth Low correlation to: S&P Oil, S&P Health CareHigh correlation to: Mid-Cap Gr., Tech, Lrg-Cap Gr..
Small-Cap Value Low correlation to: Tech, S&P Oil, S&P Health CareHigh correlation to: M-Cap Vl., Financials, Lrg-Cap Vl.
STOCK VALUATIONS AND CORRELATIONS
— 97 —
2) Next, I remind myself that some asset classes carry morerisk than others. Small- and mid-cap stocks carry more risk thanlarge caps. And, distressed stocks (value) are riskier than growthstocks. Then, I look at the 12-month forward P/E ratios for allequity asset classes and sectors to help me determine howexpensive or cheap they are, based on earnings expectations. Ialso check price-to-book ratios. However, I rely more heavily onforward-P/E ratios to help determine my purchases. I also make amental note that growth asset classes have historicallycommanded a 58% premium P/E to value-oriented asset classes.This gives me some basis for determining whether or not growthis cheap or expensive relative to value. In addition, I note thatsmall caps have typically traded at 82% (mid caps at 86%) of thelarge-cap P/E. The differences in large- and small-cap P/Es andvalue vs. growth should not be overlooked.
3) After reviewing price-to-earnings and price-to-book ratios,I look at PEG ratios to see if present stock prices are justified bylong-term earnings growth estimates. I like to compare currentPEGs with historical average PEGs. Right now most sectors andasset classes are trading at relatively high PEGs.
4) After reviewing the valuation measurements for the market(Fed Model, P/Es and PEGs) I look at the standard deviations foreach investment I’m considering. Again, this measurement givesme an idea as to the volatility of returns. If you are veryconservative and you have a weak stomach, you should probablyavoid investments with high standard deviations. And, remember,higher volatility does not necessarily mean a higher return. Idon’t look at standard deviations to give me an idea as to whatreturn I can expect from an investment; I look at them todetermine how much volatility I should expect.
5) Next, I review the risk and return measurements that showme if an asset class or sector has historically rewarded investors
ADVANCED PORTFOLIO MANAGEMENT
— 98 —
for taking on risk. Alpha measurements and Sharpe ratios canhelp determine whether or not it’s worth owning an investment.Over the past couple of decades, both alpha and Sharpe ratiocalculations show financials, mid-cap value, health care, utilitiesand large-cap value to have been the most attractive investmentsfrom a risk-adjusted return standpoint. But, we don’t know if thiswill be repeated in the future. Nevertheless, these risk-adjustedmeasurements are important to consider.
6) Last, I look at how various sectors and asset classes relateto one another by studying their correlation coefficients. Ideally,your investments should be somewhat uncorrelated—the returnsmove in opposite directions, which lessens volatility. The key isto be careful not to have too many investments that are highlycorrelated. You don’t want all your investments gaining or losingground at the same time—it’s too tough on the nerves. At aminimum, even if you discover that your investments are highlycorrelated, at least you’ll be aware of this fact. And, if you wish,you can diversify this risk. Or, you may decide to keep yourhighly correlated investments, knowing you’ll be in for a wildride. (See Chapter 27 for much more on correlations.)
Note—while I believe all of the risk and valuationmeasurements I’ve summarized in this chapter are valuable, theyare obviously not infallible. The Fed Model, for example, canstay under- or overvalued for long periods of time, while stockscontinue to rise (or fall). Small-cap stocks can show awful returnsfor long periods of time, even though they’re supposed to givebetter returns than the rest of the market. The same can be said oflow price-to-book stocks, and low P/E stocks. And, as you know,correlation coefficients, standard deviations, betas, alphas andSharpe ratios are dynamic. Their past behavioral patterns may notnecessarily be an accurate predictor of the future. (Sounds like adisclaimer.) Nevertheless, I wouldn’t ignore any of themeasurements I’ve listed in this chapter.
LARGE-CAP STRUCTURED INDEXING
— 99 —
LARGE-CAP STOCK ASSET CLASSES HAVE a median marketcapitalization of approximately $55 billion. Most large-capcompanies have been around for years and have proven trackrecords. Although in the late 1990s and early 2000-2001,Internet-related companies attracted billions of dollars in aridiculously short time, it generally takes many years for a“normal” company to build a market cap in the billions. This isone of the reasons large caps are generally considered a less riskybet than small- and mid-cap stocks—they have a history ofsuccess.
Large-cap structured indexing
The structured approach takes insights about risk characteristics and designs investment products to isolate and capture them in aprecise way. The resulting strategies may not necessarily match
familiar equity or fixed income indexes, but often represent a more scientific approach to designing the asset class
‘building blocks’ used to develop a total portfolio. —WESTON WELLINGTON, Dimensional Fund Advisors, Inc.
8

ADVANCED PORTFOLIO MANAGEMENT
— 100 —
Table 8-1
(IVE) iShares S&P 500/BARRA Value Index
Median Market Cap: $30.5 billionPrice/Book 2.60P/E ratio (ex. negative P/Es) 19.4Implied growth rate (5-year avg.) 7.72%Average annual return (1/84-12/01) 15.96% Standard deviation 0.98% (low volatility)PEG ratio 2.5Sharpe ratio .90 (excellent rating)Number of stocks 339Yield .52%
Holdings % Sector weightings %Exxon Mobil 5.1 Utilities 5.5Citigroup 5.0 Energy 12.9AIG 3.8 Financials 31.2AOL Time Warner 2.7 Industrials 13.2Verizon 2.6 Durables 2.9SBC Comm. 2.5 Consumer Staples 1.4Tyco 2.0 Consumer Services 8.4Royal Dutch 2.0 Retail 3.3Bank of America 1.9 Health Care 1.9ChevronTexaco 1.8 Technology 9.4
Comments:
These distressed companies may be considered to be trading atattractive price-to-book ratios and low P/E ratios. However, theyare typically companies in industries that are struggling andtherefore carry more risk.
Sources: www.morningstar.com, www.ishares.com, www.amex.com,www.advisoryworld.com, www.spglobal.com, www.barra.com
LARGE-CAP STRUCTURED INDEXING
— 101 —
There are two viable investment strategies for allocating inlarge caps. Your first option is a simple, but sound, approach.You divide the S&P 500 (it’s almost all large caps) into twoseparate investments, growth and value. Then, you weight eachpiece according to your risk tolerance and objectives. The otherstrategy, and my preferred choice, is to break down the S&P 500by sector, and then allocate your money to each sectorindividually. Before I get into the details of my preferredapproach, let me outline how to proceed with the simplerversion—owning both the value and growth componentsseparately.
Large-cap structured indexing—simple approach
Exchange-traded funds are excellent investment vehicles fordividing the S&P 500 into growth and value. You can buy theiShares that track the Barra Value Index (IVE) and the BarraGrowth Index (IVW)—the growth and value portions of the S&P500).
Large-cap value
The value portion of the S&P 500 is made up of securities thatare considered a better “value.” I already discussed at length myviews on value stocks and the risks inherent in owning thesecompanies. Again, I prefer that you think of these companies asdistressed, rather than value plays. These distressed companiesmay be considered to be trading at attractive price-to-book ratiosand low P/E ratios. However, they are typically companies inindustries that are struggling and therefore carry significant risk.Large-cap value stocks have generally paid out some of theirreturn in the form of dividends, rather than reinvesting all theirmoney in research and development like many growth companies.
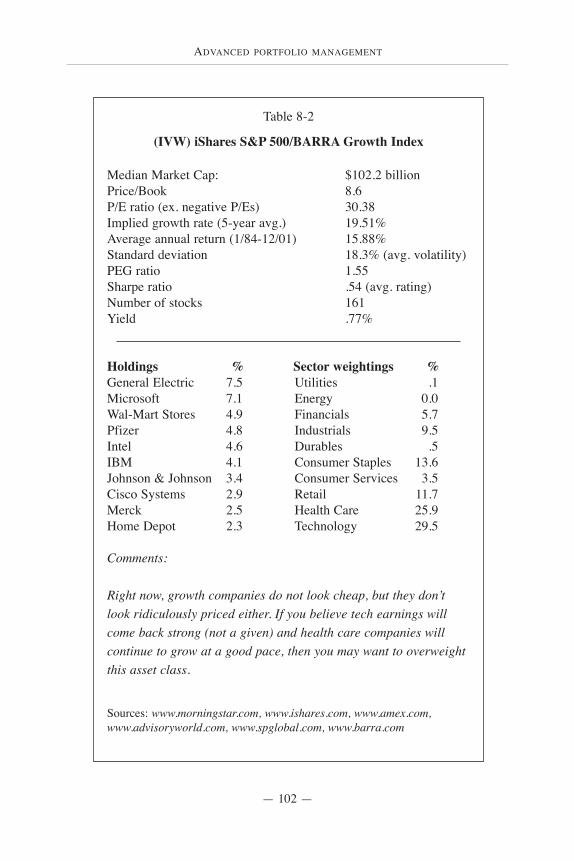
ADVANCED PORTFOLIO MANAGEMENT
— 102 —
Table 8-2
(IVW) iShares S&P 500/BARRA Growth Index
Median Market Cap: $102.2 billionPrice/Book 8.6P/E ratio (ex. negative P/Es) 30.38Implied growth rate (5-year avg.) 19.51%Average annual return (1/84-12/01) 15.88% Standard deviation 18.3% (avg. volatility)PEG ratio 1.55Sharpe ratio .54 (avg. rating)Number of stocks 161Yield .77%
Holdings % Sector weightings %General Electric 7.5 Utilities .1Microsoft 7.1 Energy 0.0Wal-Mart Stores 4.9 Financials 5.7Pfizer 4.8 Industrials 9.5Intel 4.6 Durables .5IBM 4.1 Consumer Staples 13.6Johnson & Johnson 3.4 Consumer Services 3.5Cisco Systems 2.9 Retail 11.7Merck 2.5 Health Care 25.9Home Depot 2.3 Technology 29.5
Comments:
Right now, growth companies do not look cheap, but they don’tlook ridiculously priced either. If you believe tech earnings willcome back strong (not a given) and health care companies willcontinue to grow at a good pace, then you may want to overweightthis asset class.
Sources: www.morningstar.com, www.ishares.com, www.amex.com,www.advisoryworld.com, www.spglobal.com, www.barra.com
LARGE-CAP STRUCTURED INDEXING
— 103 —
Right now, the value portion of the S&P 500 is heavilyweighted toward energy and financial stocks. If you are arelatively conservative investor who doesn’t like a lot of volatilityin your portfolio, you may want to weight this index more heavilythan the growth portion of your large-cap holdings. But I shouldwarn you that large-cap value has only been less volatile recently.If you look at the performance and standard deviations going backto 1964 (Table 5-4), both large value and growth had similarstandard deviations. But, large value had a much better return.Again, this premium return is not a free lunch. There arecharacteristics inherent in these securities that make them riskierthan growth stocks. Nevertheless, a conservative stock investormay be more comfortable owning this half of the S&P 500, sinceit doesn’t have heavy weightings in volatile technology and healthcare companies. You may ultimately decide to allocate 60% to70% of your large-cap assets to the value index (assuming it’sfairly valued when you buy it).
What’s interesting to note right now about large-cap value, isthat it sports a very high PEG ratio. Again, this ratio gives you anidea as to whether or not the present P/E ratio for the asset class isjustified by the potential earnings growth. So, while one maythink a P/E of 19.4 is fairly reasonable, with average annual long-term growth forecasted at only 7.7%, you’re paying a high pricefor slow growth. Therefore, for the time being anyway, largevalue appears to be expensive, and perhaps not such a “value”play after all.
Large-cap growth
The growth portion of the S&P 500 comprises, obviously,growth-oriented companies that typically reinvest their money inresearch and development, rather than pay out a dividend toshareholders. The technology and health care sectors make upmost of the growth portion of the S&P 500. This index has
ADVANCED PORTFOLIO MANAGEMENT
— 104 —
recently shown more volatility than the value component, and hasoffered better upside potential, but more downside risk too. If youlook at the data going back to the 1960s, however, you’ll see thatlarge-growth has not been more volatile than large-value, and itsreturns have been about 4% less, averaged annually, than value.
The stock market in 2000-2001 proved that growth-orientedcompanies—technology in particular— shouldn’t be bought atsimply any price. Valuations do matter, as we’ve all been harshlyreminded. Before choosing your large-cap growth percentageallocation, look at the valuations to see if you’re getting thesecompanies cheap or at fair value. Right now, growth companiesdo not look cheaply, but they don’t look ridiculously priced either.If you believe tech earnings will come back strong (not a given)and health care companies will continue to grow at a good pace,then you may want to overweight this asset class.
An interesting note on the growth index is that given animplied 19.5%, long-term growth rate, the PEG ratio for large-capgrowth stocks looks more attractive than large-cap value’s PEG.Remember, the implied growth is based on earnings estimates,and we can’t be certain they’ll be accurate. Many analysts andadvisors believe health care and technology companies areexpensive, but if the earnings forecasts turn out to be correct, thenwe may look back a few years from now and think thesecompanies were perhaps a pretty good value at today’s prices.Nevertheless, before you buy the growth portion of the S&P 500(or value for that matter), you should have a good idea as to whatyou are buying, why, and what the valuations look like.
Large-cap sector investing—my preferred approach toowning large caps
My preferred approach to owning large caps is to makeseparate allocations in each of the individual sectors that comprise
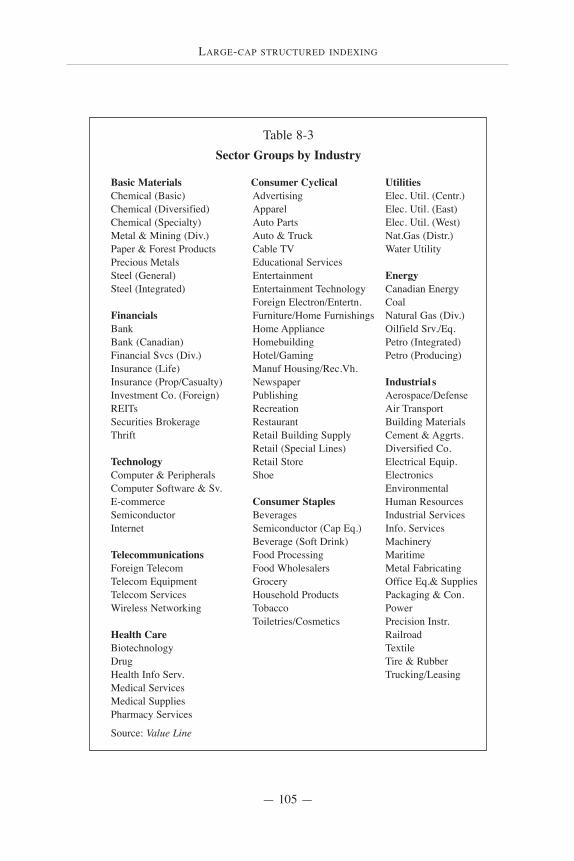
LARGE-CAP STRUCTURED INDEXING
— 105 —
Table 8-3Sector Groups by Industry
Basic Materials Consumer Cyclical UtilitiesChemical (Basic) Advertising Elec. Util. (Centr.)Chemical (Diversified) Apparel Elec. Util. (East)Chemical (Specialty) Auto Parts Elec. Util. (West)Metal & Mining (Div.) Auto & Truck Nat.Gas (Distr.)Paper & Forest Products Cable TV Water UtilityPrecious Metals Educational ServicesSteel (General) Entertainment EnergySteel (Integrated) Entertainment Technology Canadian Energy
Foreign Electron/Entertn. CoalFinancials Furniture/Home Furnishings Natural Gas (Div.)Bank Home Appliance Oilfield Srv./Eq.Bank (Canadian) Homebuilding Petro (Integrated)Financial Svcs (Div.) Hotel/Gaming Petro (Producing)Insurance (Life) Manuf Housing/Rec.Vh.Insurance (Prop/Casualty) Newspaper Industrial sInvestment Co. (Foreign) Publishing Aerospace/DefenseREITs Recreation Air TransportSecurities Brokerage Restaurant Building MaterialsThrift Retail Building Supply Cement & Aggrts.
Retail (Special Lines) Diversified Co.Technology Retail Store Electrical Equip.Computer & Peripherals Shoe ElectronicsComputer Software & Sv. EnvironmentalE-commerce Consumer Staples Human ResourcesSemiconductor Beverages Industrial ServicesInternet Semiconductor (Cap Eq.) Info. Services
Beverage (Soft Drink) MachineryTelecommunications Food Processing MaritimeForeign Telecom Food Wholesalers Metal FabricatingTelecom Equipment Grocery Office Eq.& SuppliesTelecom Services Household Products Packaging & Con.Wireless Networking Tobacco Power
Toiletries/Cosmetics Precision Instr.Health Care RailroadBiotechnology TextileDrug Tire & RubberHealth Info Serv. Trucking/LeasingMedical ServicesMedical SuppliesPharmacy Services
Source: Value Line
ADVANCED PORTFOLIO MANAGEMENT
— 106 —
the S&P 500. I have previously explained why I prefer to slice upthe large-cap asset class into value and growth—rather thanowning the S&P 500 as one holding—but I prefer to divide it upeven more, and own each sector individually. I’ve listed below,the advantages of breaking down the large-cap asset class intoseparate sector holdings.
Advantages
1) Better risk control. If you own broad-based indexes (i.e.,S&P 500, large-cap growth) you cannot control the exposure youhave to a given sector. Therefore, you cannot control risk. Forexample, if the investing public pushes up the prices of techcompanies in the S&P 500 to obscene levels, like it did in 1999,you can’t do anything about it. Your opinion doesn’t matter andyou have no control of the weightings in the index. But, if youpurchase the sectors separately, you can control your ownportfolio’s exposure to the sector. To a certain degree this allowsyou to control risk.
2) Better control of an investment style. Each sector can beconsidered representative of a certain style of investing—growth,value or blend (a combination of both). The style is determinedby the companies within each sector and their profile as definedby different research companies. I’ve used Morningstar’s data toshow the style of each sector. If you want to tilt your portfoliotoward value stocks or growth stocks, but you own the S&P 500in one basket, you cannot control the style weighting of yourportfolio. If the index is more growth oriented, which it is, youhave to accept that. Again, you have no choice. So, I prefer toallocate money in each sector individually, so I can tweak aportfolio toward one style of investing. For example, if I have aclient who is risk-averse and wants little volatility in his or herequity portfolio, I can advise the client to only own the pieces ofthe S&P 500 (we’re only talking about large caps here) that are
LARGE-CAP STRUCTURED INDEXING
— 107 —
the least volatile. The portfolio could be weighted towardutilities, financials and energy to hopefully have a lower standarddeviation. These sectors make up most of the “value” portion ofthe index. Likewise, an investor may decide to own only thegrowth-oriented sectors of the market. This investor could loadup on technology and health care stocks. This approach allowsyou to choose your preferred style of investing.
3) Better control of taxes. When you own broad-based ETFsor index funds, you don’t have much flexibility as far as taxplanning is concerned. Sure, if the fund you own is showing aloss, you can realize the loss and swap into a similar, highlycorrelated investment without triggering a wash sale. But, if youallocate among all the different sectors of the market separately,you can be much more creative from a tax standpoint. If one ofthe sectors—you may own up to 10 sectors in total—is showing aloss, and you need to offset a realized gain in your portfolio, youcan sell the sector ETF and harvest the loss. You are not obligatedto sell the whole piece, as with a broad-based holding. You alsohave the possibility of swapping out of, for example, onetechnology-related basket and into another (iShares Technologybasket ‘IYW’ into the Technology SPDR ‘XLK’). You harvest aloss, but at the same time, you maintain exposure in the sector bypurchasing a different technology ETF. You can perform similarmoves with other sectors of the market. Anyway, by dividingyour large-cap holdings into separate sectors, you can be muchmore flexible and creative from a tax-planning perspective.(Much more on tax planning in Chapter 16.)
4) Better risk control within an existing portfolio. Often whenworking with new clients I find that I am forced to manage assetsaround “inherited” positions. For example, I have a client whohas a substantial percentage of his net worth in technology stocksright now. His cost basis is incredibly low on some of the large-cap technology companies, making it especially painful to sell
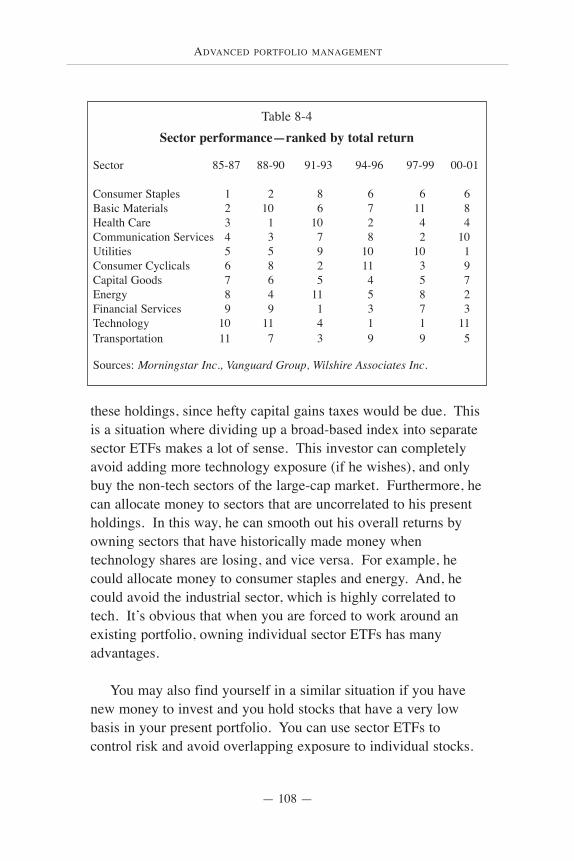
ADVANCED PORTFOLIO MANAGEMENT
— 108 —
these holdings, since hefty capital gains taxes would be due. Thisis a situation where dividing up a broad-based index into separatesector ETFs makes a lot of sense. This investor can completelyavoid adding more technology exposure (if he wishes), and onlybuy the non-tech sectors of the large-cap market. Furthermore, hecan allocate money to sectors that are uncorrelated to his presentholdings. In this way, he can smooth out his overall returns byowning sectors that have historically made money whentechnology shares are losing, and vice versa. For example, hecould allocate money to consumer staples and energy. And, hecould avoid the industrial sector, which is highly correlated totech. It’s obvious that when you are forced to work around anexisting portfolio, owning individual sector ETFs has manyadvantages.
You may also find yourself in a similar situation if you havenew money to invest and you hold stocks that have a very lowbasis in your present portfolio. You can use sector ETFs tocontrol risk and avoid overlapping exposure to individual stocks.
Table 8-4Sector performance—ranked by total return
Sector 85-87 88-90 91-93 94-96 97-99 00-01
Consumer Staples 1 2 8 6 6 6Basic Materials 2 10 6 7 11 8Health Care 3 1 10 2 4 4Communication Services 4 3 7 8 2 10Utilities 5 5 9 10 10 1Consumer Cyclicals 6 8 2 11 3 9Capital Goods 7 6 5 4 5 7Energy 8 4 11 5 8 2Financial Services 9 9 1 3 7 3Technology 10 11 4 1 1 11Transportation 11 7 3 9 9 5
Sources: Morningstar Inc., Vanguard Group, Wilshire Associates Inc.
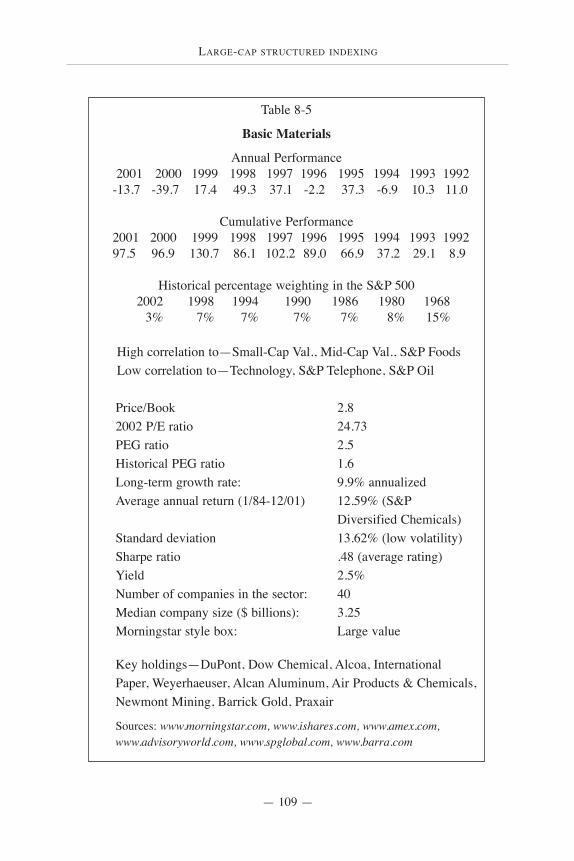
LARGE-CAP STRUCTURED INDEXING
— 109 —
Table 8-5
Basic Materials
Annual Performance2001 2000 1999 1998 1997 1996 1995 1994 1993 1992
-13.7 -39.7 17.4 49.3 37.1 -2.2 37.3 -6.9 10.3 11.0
Cumulative Performance2001 2000 1999 1998 1997 1996 1995 1994 1993 199297.5 96.9 130.7 86.1 102.2 89.0 66.9 37.2 29.1 8.9
Historical percentage weighting in the S&P 5002002 1998 1994 1990 1986 1980 1968
3% 7% 7% 7% 7% 8% 15%
High correlation to—Small-Cap Val., Mid-Cap Val., S&P FoodsLow correlation to—Technology, S&P Telephone, S&P Oil
Price/Book 2.82002 P/E ratio 24.73PEG ratio 2.5Historical PEG ratio 1.6Long-term growth rate: 9.9% annualizedAverage annual return (1/84-12/01) 12.59% (S&P
Diversified Chemicals)Standard deviation 13.62% (low volatility)Sharpe ratio .48 (average rating)Yield 2.5%Number of companies in the sector: 40Median company size ($ billions): 3.25Morningstar style box: Large value
Key holdings—DuPont, Dow Chemical, Alcoa, International Paper, Weyerhaeuser, Alcan Aluminum, Air Products & Chemicals,Newmont Mining, Barrick Gold, Praxair
Sources: www.morningstar.com, www.ishares.com, www.amex.com,www.advisoryworld.com, www.spglobal.com, www.barra.com
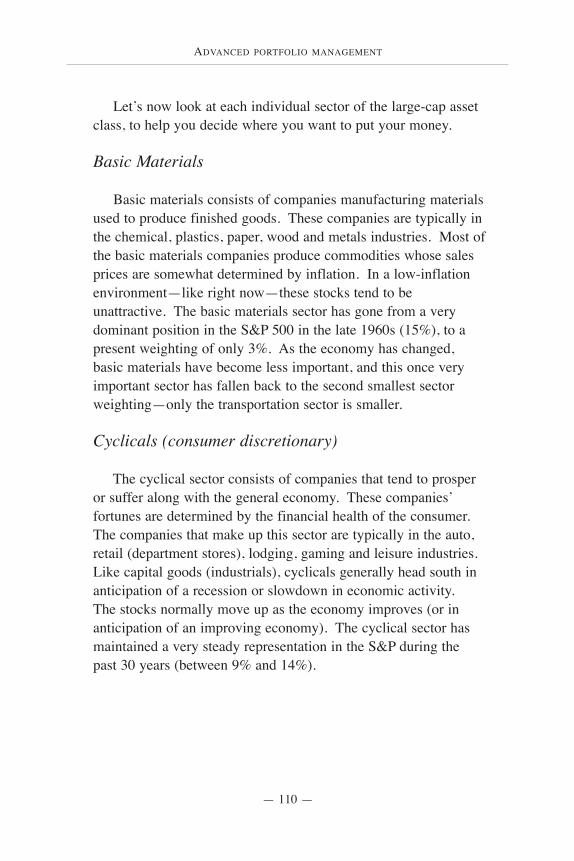
ADVANCED PORTFOLIO MANAGEMENT
— 110 —
Let’s now look at each individual sector of the large-cap assetclass, to help you decide where you want to put your money.
Basic Materials
Basic materials consists of companies manufacturing materialsused to produce finished goods. These companies are typically inthe chemical, plastics, paper, wood and metals industries. Most ofthe basic materials companies produce commodities whose salesprices are somewhat determined by inflation. In a low-inflationenvironment—like right now—these stocks tend to beunattractive. The basic materials sector has gone from a verydominant position in the S&P 500 in the late 1960s (15%), to apresent weighting of only 3%. As the economy has changed,basic materials have become less important, and this once veryimportant sector has fallen back to the second smallest sectorweighting—only the transportation sector is smaller.
Cyclicals (consumer discretionary)
The cyclical sector consists of companies that tend to prosperor suffer along with the general economy. These companies’fortunes are determined by the financial health of the consumer.The companies that make up this sector are typically in the auto,retail (department stores), lodging, gaming and leisure industries.Like capital goods (industrials), cyclicals generally head south inanticipation of a recession or slowdown in economic activity. The stocks normally move up as the economy improves (or inanticipation of an improving economy). The cyclical sector hasmaintained a very steady representation in the S&P during thepast 30 years (between 9% and 14%).
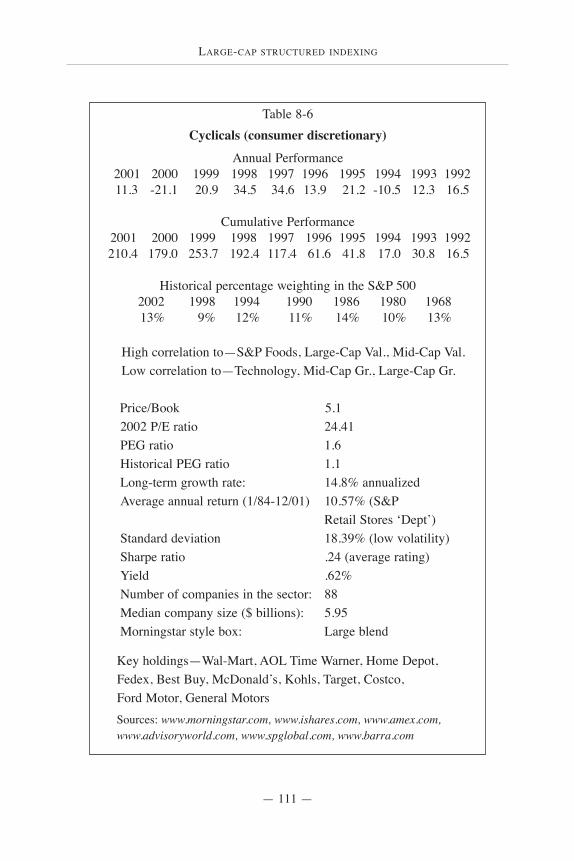
LARGE-CAP STRUCTURED INDEXING
— 111 —
Table 8-6Cyclicals (consumer discretionary)
Annual Performance2001 2000 1999 1998 1997 1996 1995 1994 1993 199211.3 -21.1 20.9 34.5 34.6 13.9 21.2 -10.5 12.3 16.5
Cumulative Performance2001 2000 1999 1998 1997 1996 1995 1994 1993 1992210.4 179.0 253.7 192.4 117.4 61.6 41.8 17.0 30.8 16.5
Historical percentage weighting in the S&P 5002002 1998 1994 1990 1986 1980 196813% 9% 12% 11% 14% 10% 13%
High correlation to—S&P Foods, Large-Cap Val., Mid-Cap Val.Low correlation to—Technology, Mid-Cap Gr., Large-Cap Gr.
Price/Book 5.12002 P/E ratio 24.41PEG ratio 1.6Historical PEG ratio 1.1Long-term growth rate: 14.8% annualizedAverage annual return (1/84-12/01) 10.57% (S&P
Retail Stores ‘Dept’)Standard deviation 18.39% (low volatility)Sharpe ratio .24 (average rating)Yield .62%Number of companies in the sector: 88Median company size ($ billions): 5.95Morningstar style box: Large blend
Key holdings—Wal-Mart, AOL Time Warner, Home Depot, Fedex, Best Buy, McDonald’s, Kohls, Target, Costco, Ford Motor, General MotorsSources: www.morningstar.com, www.ishares.com, www.amex.com,www.advisoryworld.com, www.spglobal.com, www.barra.com
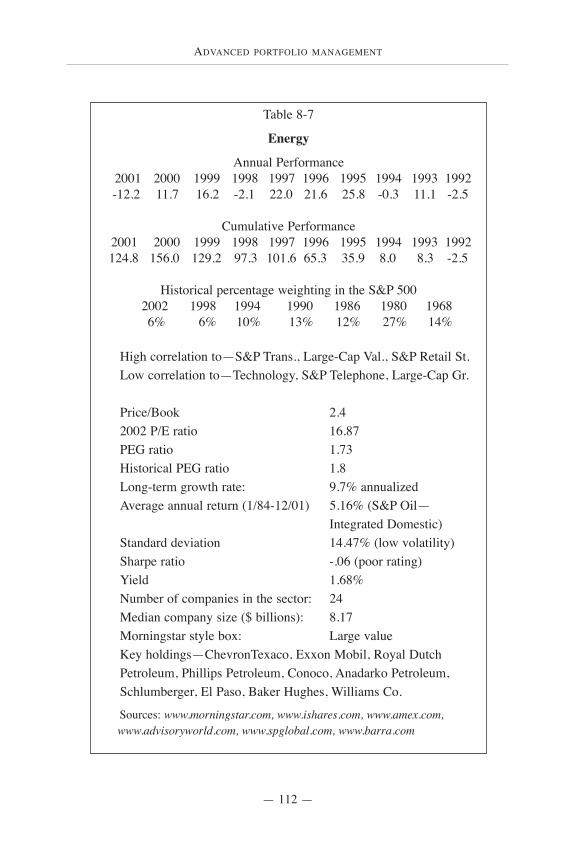
ADVANCED PORTFOLIO MANAGEMENT
— 112 —
Table 8-7
Energy
Annual Performance2001 2000 1999 1998 1997 1996 1995 1994 1993 1992-12.2 11.7 16.2 -2.1 22.0 21.6 25.8 -0.3 11.1 -2.5
Cumulative Performance2001 2000 1999 1998 1997 1996 1995 1994 1993 1992124.8 156.0 129.2 97.3 101.6 65.3 35.9 8.0 8.3 -2.5
Historical percentage weighting in the S&P 5002002 1998 1994 1990 1986 1980 19686% 6% 10% 13% 12% 27% 14%
High correlation to—S&P Trans., Large-Cap Val., S&P Retail St.Low correlation to—Technology, S&P Telephone, Large-Cap Gr.
Price/Book 2.42002 P/E ratio 16.87PEG ratio 1.73Historical PEG ratio 1.8Long-term growth rate: 9.7% annualizedAverage annual return (1/84-12/01) 5.16% (S&P Oil—
Integrated Domestic)Standard deviation 14.47% (low volatility)Sharpe ratio -.06 (poor rating)Yield 1.68%Number of companies in the sector: 24Median company size ($ billions): 8.17Morningstar style box: Large valueKey holdings—ChevronTexaco, Exxon Mobil, Royal Dutch Petroleum, Phillips Petroleum, Conoco, Anadarko Petroleum, Schlumberger, El Paso, Baker Hughes, Williams Co.
Sources: www.morningstar.com, www.ishares.com, www.amex.com,www.advisoryworld.com, www.spglobal.com, www.barra.com
LARGE-CAP STRUCTURED INDEXING
— 113 —
Energy
The energy sector is composed of companies that produceenergy-related products. This sector had dramatic changes duringthe past couple of decades. It went from being the present-daytech darling at approximately 30% of the S&P 500 in 1980, to amere 6% today. Exxon (now Exxon Mobil) actually had thelargest weighting in the S&P back in 1980. In 1979 the Iranianrevolution caused great worry about a possible oil shortage and oilprices took off. The argument was that oil was a diminishingresource and that anyone who was in the oil business was going tobe rich—sound familiar? Well, the oil bubble burst, and thesector underperformed the broad market for more than a decadeafterwards—it has not returned to star status.
Utilities
The utility sector is made up of companies involved in theelectric, gas and water utility businesses. The utility sector hasnever been a very important sector in the S&P, although it didcatch investors’ attention in the mid-1980s and early 1990s. It hita peak of about 8% of the S&P 500 in 1986, but now comprisesonly 3% of the index. The sector has traditionally beenconsidered fairly predictable, offering investors solid dividendsand pretty good protection of principal. But investors who buyutility stocks for either of these reasons are making a gravemistake. The utility sector ride of the past couple of years hasbeen a roller coaster. It soared 54% in 2000, as technology stocksgot hammered (it was uncorrelated to tech), but in 2001 it lost34% (through November). Utilities and technology were the twoworst performing sectors for the year. It has become asunpredictable and undependable as other sectors in the S&P 500.
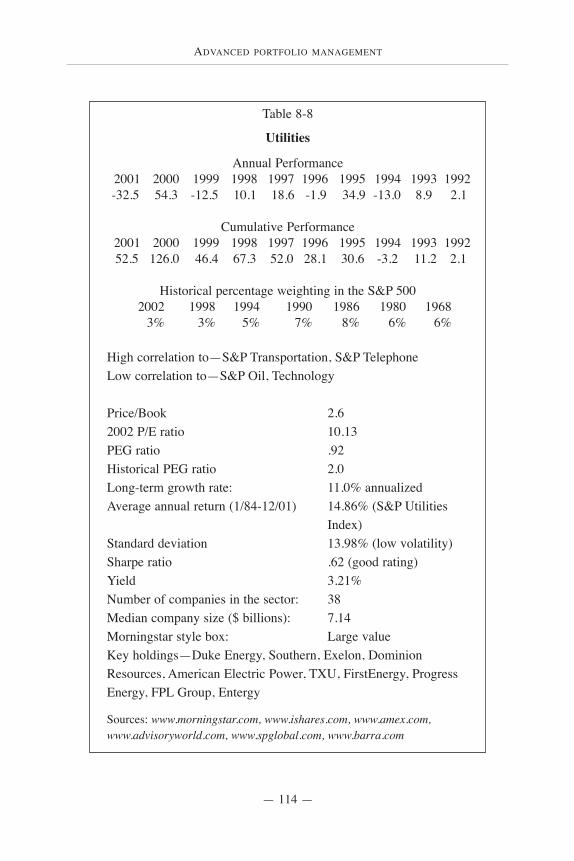
ADVANCED PORTFOLIO MANAGEMENT
— 114 —
Table 8-8
Utilities
Annual Performance2001 2000 1999 1998 1997 1996 1995 1994 1993 1992-32.5 54.3 -12.5 10.1 18.6 -1.9 34.9 -13.0 8.9 2.1
Cumulative Performance2001 2000 1999 1998 1997 1996 1995 1994 1993 199252.5 126.0 46.4 67.3 52.0 28.1 30.6 -3.2 11.2 2.1
Historical percentage weighting in the S&P 5002002 1998 1994 1990 1986 1980 1968
3% 3% 5% 7% 8% 6% 6%
High correlation to—S&P Transportation, S&P TelephoneLow correlation to—S&P Oil, Technology
Price/Book 2.62002 P/E ratio 10.13PEG ratio .92Historical PEG ratio 2.0Long-term growth rate: 11.0% annualizedAverage annual return (1/84-12/01) 14.86% (S&P Utilities
Index)Standard deviation 13.98% (low volatility)Sharpe ratio .62 (good rating)Yield 3.21%Number of companies in the sector: 38Median company size ($ billions): 7.14Morningstar style box: Large valueKey holdings—Duke Energy, Southern, Exelon, Dominion Resources, American Electric Power, TXU, FirstEnergy, Progress Energy, FPL Group, Entergy
Sources: www.morningstar.com, www.ishares.com, www.amex.com,www.advisoryworld.com, www.spglobal.com, www.barra.com
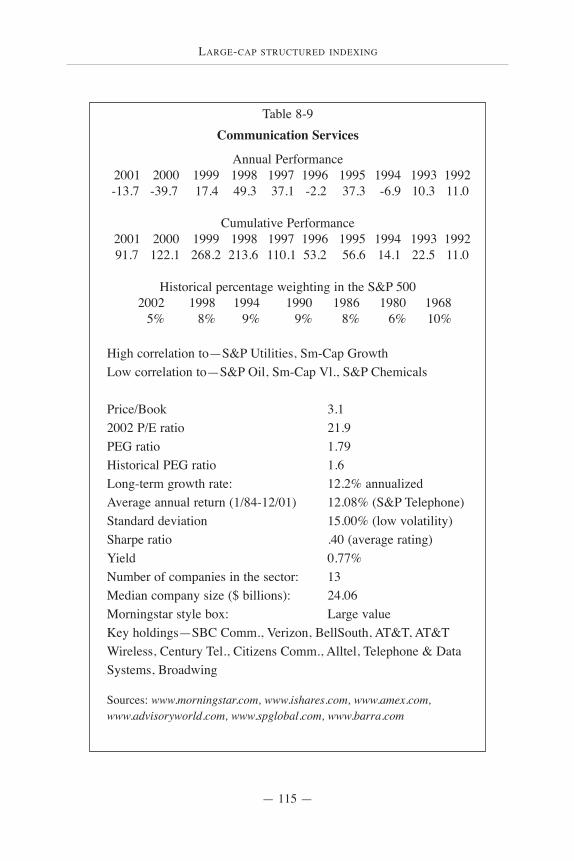
LARGE-CAP STRUCTURED INDEXING
— 115 —
Table 8-9Communication Services
Annual Performance2001 2000 1999 1998 1997 1996 1995 1994 1993 1992-13.7 -39.7 17.4 49.3 37.1 -2.2 37.3 -6.9 10.3 11.0
Cumulative Performance2001 2000 1999 1998 1997 1996 1995 1994 1993 199291.7 122.1 268.2 213.6 110.1 53.2 56.6 14.1 22.5 11.0
Historical percentage weighting in the S&P 5002002 1998 1994 1990 1986 1980 1968
5% 8% 9% 9% 8% 6% 10%
High correlation to—S&P Utilities, Sm-Cap GrowthLow correlation to—S&P Oil, Sm-Cap Vl., S&P Chemicals
Price/Book 3.12002 P/E ratio 21.9PEG ratio 1.79Historical PEG ratio 1.6Long-term growth rate: 12.2% annualizedAverage annual return (1/84-12/01) 12.08% (S&P Telephone)Standard deviation 15.00% (low volatility)Sharpe ratio .40 (average rating)Yield 0.77%Number of companies in the sector: 13Median company size ($ billions): 24.06Morningstar style box: Large valueKey holdings—SBC Comm., Verizon, BellSouth, AT&T, AT&TWireless, Century Tel., Citizens Comm., Alltel, Telephone & Data Systems, Broadwing
Sources: www.morningstar.com, www.ishares.com, www.amex.com,www.advisoryworld.com, www.spglobal.com, www.barra.com
ADVANCED PORTFOLIO MANAGEMENT
— 116 —
Consumer Staples
The consumer staples sector is composed of manufacturers ofconsumer products that are purchased normally at the same levelthrough all economic cycles. These are typically food, beverages,tobacco and cosmetics. I have separated the health care sectorfrom the consumer staples sector, but it is often referred to as aconsumer staple. This sector was the leader of the S&P 500 backin 1990, as it commanded 17% of the index. Now it representsonly 8% of the capitalization of the index.
Telecommunication Services
The telecom sector is made up of wireless telecom providers,carriers and integrated telecommunication services companies.This sector is sometimes grouped within the technology sector.The telecommunication services sector has remained a consistentsector—as far as its weighting is concerned. It has fluctuatedbetween 5% to 10% of the S&P 500 since 1968. In the pastcouple of years it has been highly correlated to the tech sector andhas suffered. Its performance was abysmal in 2000 and again in2001. Companies like AT&T, once considered solid blue chips,have seen their market caps cut in half. This sector is nowconsidered as volatile and risky as the tech sector.
Financials
The financial sector includes banks, insurance brokers, life andhealth insurance companies and financial services firms. Thebanks and finance companies tend to do poorly heading into arecessionary period as bad loans increase and tradingcommissions and fees decrease. Over the past two decades, thefinancial sector has steadily gained importance in the S&P 500. Ithas gone from a 7% weighting in 1968, to a present weighting of18%. It is considered by some to be the next great sector, as more
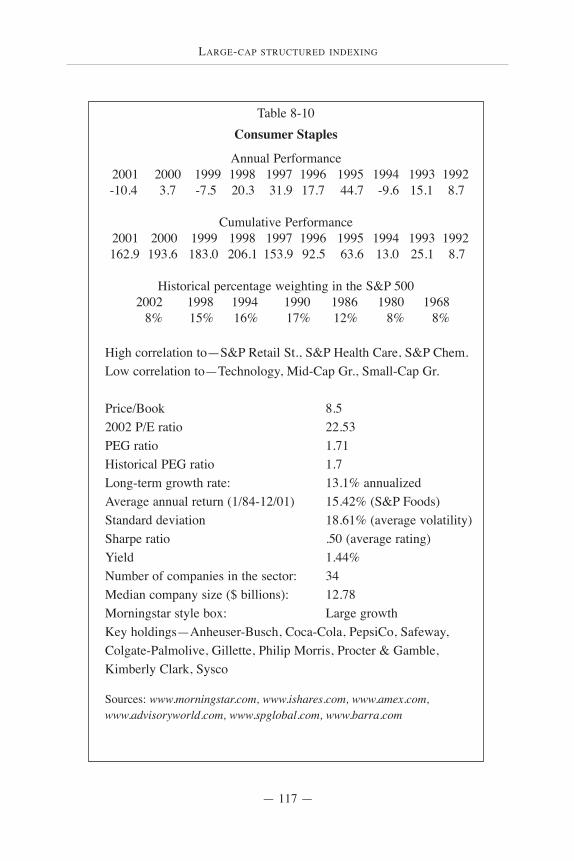
LARGE-CAP STRUCTURED INDEXING
— 117 —
Table 8-10Consumer Staples
Annual Performance2001 2000 1999 1998 1997 1996 1995 1994 1993 1992-10.4 3.7 -7.5 20.3 31.9 17.7 44.7 -9.6 15.1 8.7
Cumulative Performance2001 2000 1999 1998 1997 1996 1995 1994 1993 1992162.9 193.6 183.0 206.1 153.9 92.5 63.6 13.0 25.1 8.7
Historical percentage weighting in the S&P 5002002 1998 1994 1990 1986 1980 1968
8% 15% 16% 17% 12% 8% 8%
High correlation to—S&P Retail St., S&P Health Care, S&P Chem.Low correlation to—Technology, Mid-Cap Gr., Small-Cap Gr.
Price/Book 8.52002 P/E ratio 22.53PEG ratio 1.71Historical PEG ratio 1.7Long-term growth rate: 13.1% annualizedAverage annual return (1/84-12/01) 15.42% (S&P Foods)Standard deviation 18.61% (average volatility)Sharpe ratio .50 (average rating)Yield 1.44%Number of companies in the sector: 34Median company size ($ billions): 12.78Morningstar style box: Large growthKey holdings—Anheuser-Busch, Coca-Cola, PepsiCo, Safeway, Colgate-Palmolive, Gillette, Philip Morris, Procter & Gamble, Kimberly Clark, Sysco
Sources: www.morningstar.com, www.ishares.com, www.amex.com,www.advisoryworld.com, www.spglobal.com, www.barra.com
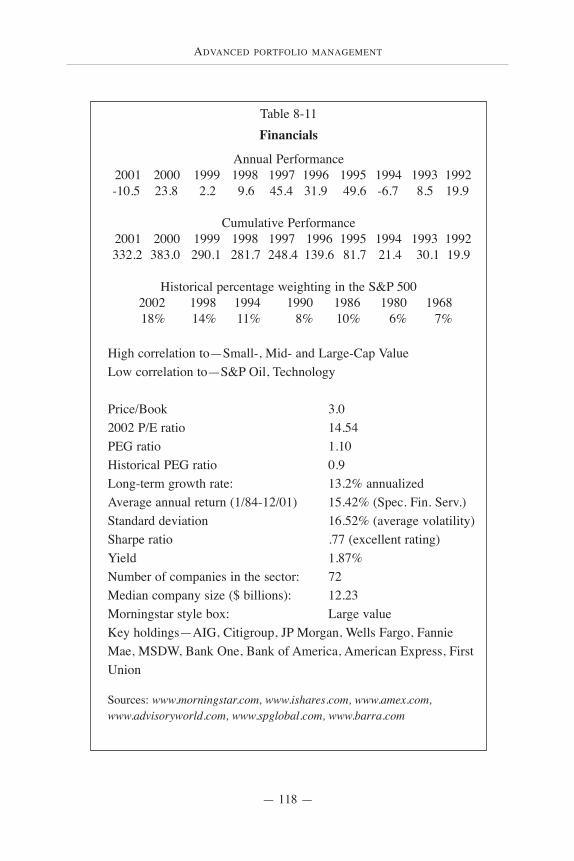
ADVANCED PORTFOLIO MANAGEMENT
— 118 —
Table 8-11Financials
Annual Performance2001 2000 1999 1998 1997 1996 1995 1994 1993 1992-10.5 23.8 2.2 9.6 45.4 31.9 49.6 -6.7 8.5 19.9
Cumulative Performance2001 2000 1999 1998 1997 1996 1995 1994 1993 1992332.2 383.0 290.1 281.7 248.4 139.6 81.7 21.4 30.1 19.9
Historical percentage weighting in the S&P 5002002 1998 1994 1990 1986 1980 196818% 14% 11% 8% 10% 6% 7%
High correlation to—Small-, Mid- and Large-Cap ValueLow correlation to—S&P Oil, Technology
Price/Book 3.02002 P/E ratio 14.54PEG ratio 1.10Historical PEG ratio 0.9Long-term growth rate: 13.2% annualizedAverage annual return (1/84-12/01) 15.42% (Spec. Fin. Serv.)Standard deviation 16.52% (average volatility)Sharpe ratio .77 (excellent rating)Yield 1.87%Number of companies in the sector: 72Median company size ($ billions): 12.23Morningstar style box: Large valueKey holdings—AIG, Citigroup, JP Morgan, Wells Fargo, Fannie Mae, MSDW, Bank One, Bank of America, American Express, First Union
Sources: www.morningstar.com, www.ishares.com, www.amex.com,www.advisoryworld.com, www.spglobal.com, www.barra.com
LARGE-CAP STRUCTURED INDEXING
— 119 —
and more baby boomers will flock to investment companies tohelp them with their finances. Asset managers and banks, theysay, are poised to profit. We’ll see. What is interesting to note isthat while many analysts think the future for financials is sobright, its past hasn’t been too shabby either. Since 1992, it hashad the second-best cumulative performance of all sectors (aftertech), posting a 323% gain. If you believe in reversion-to-mean,you may be somewhat skeptical that this outperformance willcontinue this decade.
Health Care
The health care sector consists of health care equipmentmanufacturers, health care suppliers and companies that run health care facilities and managed care operations. It is heavilyweighted toward pharmaceutical companies. It also offers somelimited exposure to biotechnology companies. The health caresector is another sector that will supposedly continue to prosperthanks to aging baby boomers. Health care companies, whichonce commanded only a 3% weighting in the S&P, now accountfor 14% of the index. The sector is often considered a consumerstaple since you’ve got to buy your drugs and medicationregardless of the economic cycle. But, the S&P committeeseparates health care from the consumer staples sector, and sohave I. Health care and biotechnology companies had a huge runin the early 1990s and again in the late 1990s, as investors boughton the hope that aging baby boomers would eventually spendthree times as much on medical care. The sector is stillconsidered a great long-term play.
Capital Goods (Industrials)
The capital goods sector includes companies involved inaerospace, construction, engineering, and machinery. This sectortends to do well when the economy is expanding. It does poorly
ADVANCED PORTFOLIO MANAGEMENT
— 120 —
at the start of a recession, or in anticipation of a slowdown ineconomic activity. Capital goods (industrials) have maintained aconsistent presence in the S&P 500. In 1968 the sectorrepresented 14% of the index and today it stands at 11%. Whilethe sector, known for its “old economy” stocks, dropped to aweighting of 8% in 1998, as “new economy” stocks werepummeled during the past couple of years, the public hasreconsidered the importance of this sector. It is now back to itshistorical average weighting in the index.
Transportation
The transportation sector is made up of air freight, airlines,road and rail, and transportation infrastructure companies. Thetransports make up the smallest portion of the S&P 500. It isimpossible to buy this sector separately (it’s mixed in with thecyclicals). The sector has never had a high weighting in the S&P(recent history), but on a percentage scale, its drop from a 3%weighting in 1968 to a 2002 weighting of 1%, was verysignificant. Railways and airlines are no longer the growth storiesthey once were, and the market has reflected this fact for the pastcouple of decades.
Technology
The technology sector includes companies that are involvedwith software and services, in addition to technology hardwareand equipment. Growth in this sector is somewhat dictated by theeconomy as a whole—similar to capital goods and cyclicals. Thetech sector has shown more growth over the past three decadesthan any other sector. It went from 7% of the S&P 500 index to ahigh of 35% in March 2000. I could argue that the index waseven more heavily weighted in technology companies if I includesome other tech-related companies in the index. After the techmeltdown, the sector now makes up 19% of the index (not
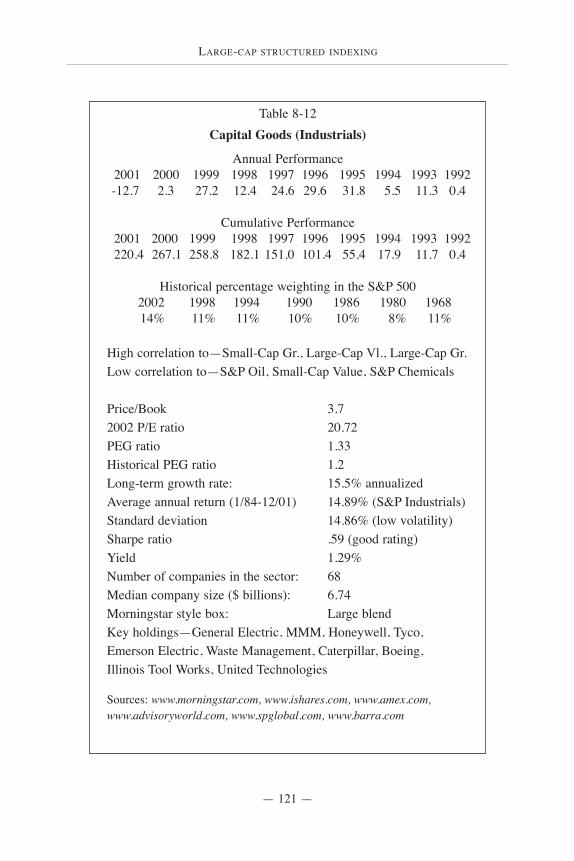
LARGE-CAP STRUCTURED INDEXING
— 121 —
Table 8-12Capital Goods (Industrials)
Annual Performance2001 2000 1999 1998 1997 1996 1995 1994 1993 1992-12.7 2.3 27.2 12.4 24.6 29.6 31.8 5.5 11.3 0.4
Cumulative Performance2001 2000 1999 1998 1997 1996 1995 1994 1993 1992220.4 267.1 258.8 182.1 151.0 101.4 55.4 17.9 11.7 0.4
Historical percentage weighting in the S&P 5002002 1998 1994 1990 1986 1980 196814% 11% 11% 10% 10% 8% 11%
High correlation to—Small-Cap Gr., Large-Cap Vl., Large-Cap Gr.Low correlation to—S&P Oil, Small-Cap Value, S&P Chemicals
Price/Book 3.72002 P/E ratio 20.72PEG ratio 1.33Historical PEG ratio 1.2Long-term growth rate: 15.5% annualizedAverage annual return (1/84-12/01) 14.89% (S&P Industrials)Standard deviation 14.86% (low volatility)Sharpe ratio .59 (good rating)Yield 1.29%Number of companies in the sector: 68Median company size ($ billions): 6.74Morningstar style box: Large blendKey holdings—General Electric, MMM, Honeywell, Tyco, Emerson Electric, Waste Management, Caterpillar, Boeing,Illinois Tool Works, United Technologies
Sources: www.morningstar.com, www.ishares.com, www.amex.com,www.advisoryworld.com, www.spglobal.com, www.barra.com

ADVANCED PORTFOLIO MANAGEMENT
— 122 —
including telecommunications). The technology sector’sperformance in the 1990s was extraordinary, showing acumulative return of almost 1,000% from 1992-1999. You knowwhat happened next. But, thanks to the mid-1990s, and a laterebound in 2001, tech still shows the best cumulative performanceof any sector over the past ten years—about 400%. Analysts arenow wondering whether technology will be a dead-in-the-watersector for many years, or if it’s just “pausing to refresh.” Onething is certain, given present valuations, technology is anythingbut cheap.
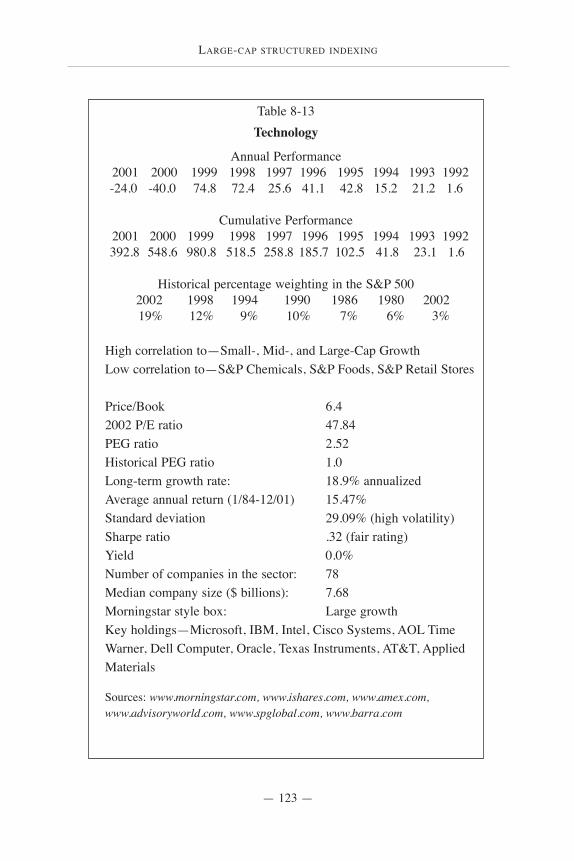
LARGE-CAP STRUCTURED INDEXING
— 123 —
Table 8-13Technology
Annual Performance2001 2000 1999 1998 1997 1996 1995 1994 1993 1992-24.0 -40.0 74.8 72.4 25.6 41.1 42.8 15.2 21.2 1.6
Cumulative Performance2001 2000 1999 1998 1997 1996 1995 1994 1993 1992392.8 548.6 980.8 518.5 258.8 185.7 102.5 41.8 23.1 1.6
Historical percentage weighting in the S&P 5002002 1998 1994 1990 1986 1980 200219% 12% 9% 10% 7% 6% 3%
High correlation to—Small-, Mid-, and Large-Cap GrowthLow correlation to—S&P Chemicals, S&P Foods, S&P Retail Stores
Price/Book 6.42002 P/E ratio 47.84PEG ratio 2.52Historical PEG ratio 1.0Long-term growth rate: 18.9% annualizedAverage annual return (1/84-12/01) 15.47% Standard deviation 29.09% (high volatility)Sharpe ratio .32 (fair rating)Yield 0.0%Number of companies in the sector: 78Median company size ($ billions): 7.68Morningstar style box: Large growthKey holdings—Microsoft, IBM, Intel, Cisco Systems, AOL Time Warner, Dell Computer, Oracle, Texas Instruments, AT&T, Applied Materials
Sources: www.morningstar.com, www.ishares.com, www.amex.com,www.advisoryworld.com, www.spglobal.com, www.barra.com
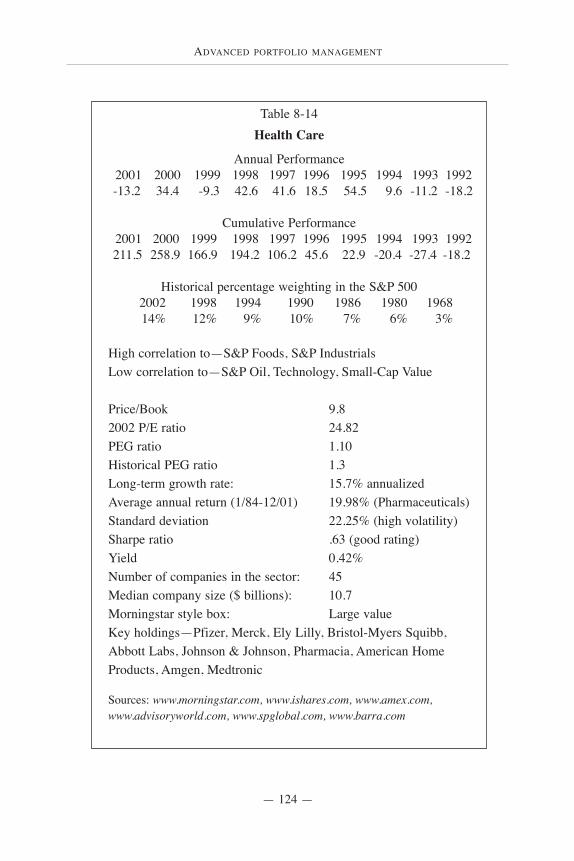
ADVANCED PORTFOLIO MANAGEMENT
— 124 —
Table 8-14Health Care
Annual Performance2001 2000 1999 1998 1997 1996 1995 1994 1993 1992-13.2 34.4 -9.3 42.6 41.6 18.5 54.5 9.6 -11.2 -18.2
Cumulative Performance2001 2000 1999 1998 1997 1996 1995 1994 1993 1992211.5 258.9 166.9 194.2 106.2 45.6 22.9 -20.4 -27.4 -18.2
Historical percentage weighting in the S&P 5002002 1998 1994 1990 1986 1980 196814% 12% 9% 10% 7% 6% 3%
High correlation to—S&P Foods, S&P IndustrialsLow correlation to—S&P Oil, Technology, Small-Cap Value
Price/Book 9.82002 P/E ratio 24.82PEG ratio 1.10Historical PEG ratio 1.3Long-term growth rate: 15.7% annualizedAverage annual return (1/84-12/01) 19.98% (Pharmaceuticals)Standard deviation 22.25% (high volatility)Sharpe ratio .63 (good rating)Yield 0.42%Number of companies in the sector: 45Median company size ($ billions): 10.7Morningstar style box: Large valueKey holdings—Pfizer, Merck, Ely Lilly, Bristol-Myers Squibb, Abbott Labs, Johnson & Johnson, Pharmacia, American Home Products, Amgen, Medtronic
Sources: www.morningstar.com, www.ishares.com, www.amex.com,www.advisoryworld.com, www.spglobal.com, www.barra.com
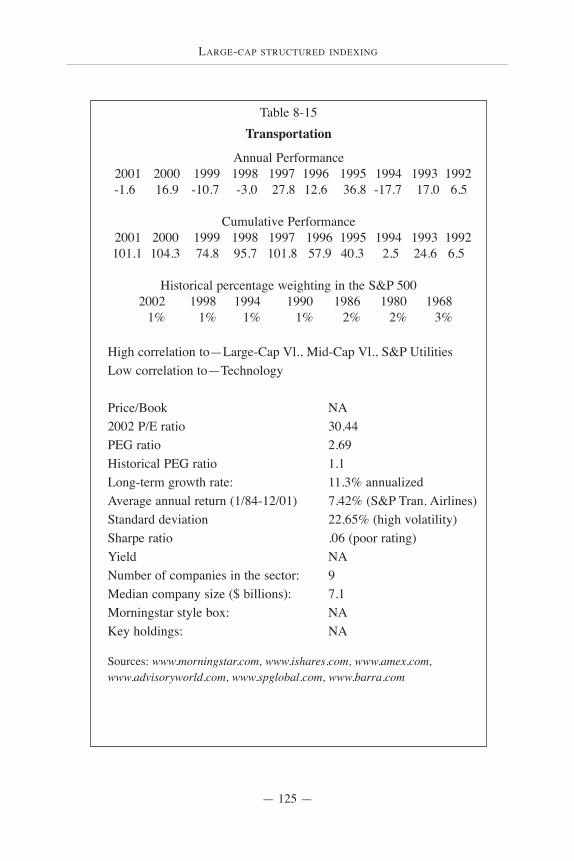
LARGE-CAP STRUCTURED INDEXING
— 125 —
Table 8-15Transportation
Annual Performance2001 2000 1999 1998 1997 1996 1995 1994 1993 1992-1.6 16.9 -10.7 -3.0 27.8 12.6 36.8 -17.7 17.0 6.5
Cumulative Performance2001 2000 1999 1998 1997 1996 1995 1994 1993 1992101.1 104.3 74.8 95.7 101.8 57.9 40.3 2.5 24.6 6.5
Historical percentage weighting in the S&P 5002002 1998 1994 1990 1986 1980 1968
1% 1% 1% 1% 2% 2% 3%
High correlation to—Large-Cap Vl., Mid-Cap Vl., S&P UtilitiesLow correlation to—Technology
Price/Book NA2002 P/E ratio 30.44PEG ratio 2.69Historical PEG ratio 1.1Long-term growth rate: 11.3% annualizedAverage annual return (1/84-12/01) 7.42% (S&P Tran. Airlines)Standard deviation 22.65% (high volatility)Sharpe ratio .06 (poor rating)Yield NANumber of companies in the sector: 9Median company size ($ billions): 7.1Morningstar style box: NAKey holdings: NA
Sources: www.morningstar.com, www.ishares.com, www.amex.com,www.advisoryworld.com, www.spglobal.com, www.barra.com
ADVANCED PORTFOLIO MANAGEMENT
— 126 —
THE FIRST STEP TO BUILDING YOUR large-cap sectorportfolio is to determine what the present weightings are of thesectors that make up the S&P 500. S&P Global’s Web site poststhis information daily on www.spglobal.com. Once you’vedetermined the weightings, you can decide whether or not youwant to simply replicate the index itself, or tweak the index toreflect your own investment objectives and risk profile.
After reviewing the present weightings for each sector, I thinkit is helpful to look at valuations and forward earnings estimates(EPS 5-year growth). (Review the summary beginning on page95 for details.)
As I wrote earlier, I think it’s important to pay attention to the12-month forward P/E ratios and the EPS 5-year growth estimates
Building your large-capsector portfolio
...it’s possible for investors to use a wider range of strategies togain greater expected returns—all within the bounds of indexing.
—EUGENE F. FAMA JR., Dimensional Fund Advisors, Inc.
9

BUILDING YOUR LARGE-CAP SECTOR PORTFOLIO
— 127 —
for all sectors. This can give you an idea as to whether or notthey’re a good value.
Obviously a growth-oriented sector like health care or techdeserves a higher P/E ratio and a higher PEG ratio than adefensive, non-growth sector like utilities. (Historically growthstocks have commanded a 58% premium P/E multiple to valuestocks.)
My present recommendation would be to avoid (orunderweight) the sectors that have high P/E and PEG ratios. Iwould avoid technology—I cannot justify paying 48 times 2002earnings. I would also avoid basic materials—it’s trading at 2times its historical PEG. I would underweight or avoid cyclicalsand telecom for the same reason. Obviously if earnings comeback strong in these sectors, the PEG ratios will come down, aswill the P/E ratios. But, for now, I prefer to be cautious.
Table 9-1Recommended Sector Weightings, April 2002
Large-Cap Portfolio
Large-cap sector % allocation
Health care 15Consumer staples 18Basic Materials 0Telecom 0Financials 22Utilities 15Technology 0Capital goods (industrials) 15Energy 15Cyclicals (consumer discretionary) 0
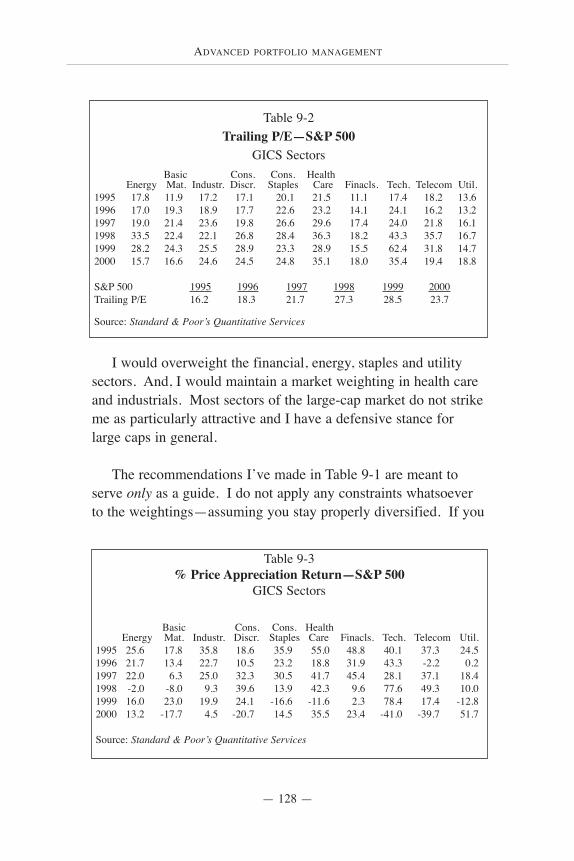
ADVANCED PORTFOLIO MANAGEMENT
— 128 —
I would overweight the financial, energy, staples and utilitysectors. And, I would maintain a market weighting in health careand industrials. Most sectors of the large-cap market do not strikeme as particularly attractive and I have a defensive stance forlarge caps in general.
The recommendations I’ve made in Table 9-1 are meant toserve only as a guide. I do not apply any constraints whatsoeverto the weightings—assuming you stay properly diversified. If you
Table 9-2Trailing P/E—S&P 500
GICS SectorsBasic Cons. Cons. Health
Energy Mat. Industr. Discr. Staples Care Finacls. Tech. Telecom Util.1995 17.8 11.9 17.2 17.1 20.1 21.5 11.1 17.4 18.2 13.61996 17.0 19.3 18.9 17.7 22.6 23.2 14.1 24.1 16.2 13.21997 19.0 21.4 23.6 19.8 26.6 29.6 17.4 24.0 21.8 16.11998 33.5 22.4 22.1 26.8 28.4 36.3 18.2 43.3 35.7 16.71999 28.2 24.3 25.5 28.9 23.3 28.9 15.5 62.4 31.8 14.72000 15.7 16.6 24.6 24.5 24.8 35.1 18.0 35.4 19.4 18.8
S&P 500 1995 1996 1997 1998 1999 2000Trailing P/E 16.2 18.3 21.7 27.3 28.5 23.7
Source: Standard & Poor’s Quantitative Services
Table 9-3% Price Appreciation Return—S&P 500
GICS Sectors
Basic Cons. Cons. HealthEnergy Mat. Industr. Discr. Staples Care Finacls. Tech. Telecom Util.
1995 25.6 17.8 35.8 18.6 35.9 55.0 48.8 40.1 37.3 24.51996 21.7 13.4 22.7 10.5 23.2 18.8 31.9 43.3 -2.2 0.21997 22.0 6.3 25.0 32.3 30.5 41.7 45.4 28.1 37.1 18.41998 -2.0 -8.0 9.3 39.6 13.9 42.3 9.6 77.6 49.3 10.01999 16.0 23.0 19.9 24.1 -16.6 -11.6 2.3 78.4 17.4 -12.82000 13.2 -17.7 4.5 -20.7 14.5 35.5 23.4 -41.0 -39.7 51.7
Source: Standard & Poor’s Quantitative Services

BUILDING YOUR LARGE-CAP SECTOR PORTFOLIO
— 129 —
want to avoid a sector completely because it is too expensive, or ifwant to overweight a sector, do so. After all, that’s the point ofstructuring your own portfolio, to be able to weight your portfolioas you see fit.
Obviously, the risk of not having a market weight in any givensector is that you will underperform. But, your reasons fordetermining your own weightings are not purely performancerelated—you want to be able to control risk and volatility betterthan traditional indexing.
How to buy your large-cap sector holdings:*
I’ve listed below the symbols for the index-based sector ETFs.I’ve also made a brief comparison between the iShares sectorETFs and Select Sector SPDRs, with my recommendation (inbold) as to which one you should purchase.
Health Care—IYH (iShares Health Care). This is the only sectorETF available in the health care sector.
Table 9-4Market Capitalization % Weight—S&P 500
GICS Sectors
Basic Cons. Cons. HealthEnergy Mat. Industr. Discr. Staples Care Finacls. Tech. Tele. Util.
1995 9.1 6.1 12.6 13.0 12.8 10.8 13.1 9.4 8.5 4.51996 9.2 5.7 12.7 11.7 12.7 10.4 15.0 12.4 6.5 3.71997 8.4 4.5 11.7 12.1 12.3 11.3 17.2 12.3 6.9 3.31998 6.3 3.1 10.1 12.5 11.1 12.3 15.4 17.7 8.4 3.01999 5.6 3.0 9.9 12.7 7.2 9.3 13.0 29.2 7.9 2.22000 6.6 2.3 10.6 10.3 8.1 14.4 17.3 21.2 5.5 3.8
Source: Standard & Poor’s Quantitative Services
ADVANCED PORTFOLIO MANAGEMENT
Consumer Staples**—IYK (iShares Consumer, Non-Cyclicalsector). This is the only consumer staples (excluding health care)sector ETF available.
Basic Materials—XLB (Basic Materials SPDR) or IYM (iSharesBasic Materials). XLB has about 31% exposure to the mid-capbasic materials sector. The iShares equivalent (IYM) has about27% mid-cap exposure and about 7% in small caps. This choiceis a wash. But, I would probably recommend buying XLB, sinceits ongoing expense ratio is lower than the iShares equivalent.
Telecommunication Services—IYZ (iShares Telecommunication Services Sector)
Financials—XLF (Financial SPDR) or IYF (iShares FinancialSector). The Financial SPDR is more large-cap oriented than theiShares equivalent. XLF has 7% in mid caps and IYF has about19%. I would recommend purchasing the Financial SPDR overthe iShares Financial Sector holding since it is more representativeof the large-cap financial sector—and the fees are lower too.
Utilities—XLU (Utility SPDR) or IDU (iShares Utility Sector).The Utility SPDR has 27% in mid-cap stocks, but the iSharesequivalent is much more heavily invested in mid caps. TheiShares Utility sector holding has 56% in mid caps and another5% in small caps. Remember, we’re after large-cap exposurehere, not mid caps. We’ll get our mid-cap allocations from otherETFs. However, XLU is too heavily weighted in a fewcompanies. About 47% is in the top 5 holdings. IDU, on theother hand, is somewhat better diversified, with 27% in the top 5holdings. I would recommend purchasing IDU since it’s betterdiversified.
Technology—XLK (Technology SPDR) or IYW (iSharesTechnology Sector). The Technology SPDR is more of a pure
— 130 —
BUILDING YOUR LARGE-CAP SECTOR PORTFOLIO
— 131 —
large-cap play with only 10% exposure in mid-cap tech stocks.The iShares technology ETF has 16% mid-cap and 4% small-captech exposure. So, for a more pure large-cap technologyinvestment I would advise owning the Technology SPDR. And,its expense ratio is lower also. Note, as I will discuss in Chapter23, I would also recommend the North Track PSE Technology100 Index Fund (PPTIX) for your tech exposure to large caps. Itis almost a pure tech investment, and it offers betterdiversification of your dollars than XLK and IYW. Check it out.
Capital Goods—XLI (Industrials SPDR) or IYJ (Industrials)(iShares Industrial Sector). The Industrials SPDR surprisingly hasmore mid-cap exposure than the iShares alternative (32% versus23%). Either choice is fine, but I’d give the nod to XLI for thecost advantage.
Energy—XLE (Energy SPDR) or IYE (iShares Energy Sector).Both energy sector ETFs have about the same exposure to themid-cap market, approx. 24%. So, buy XLE for the cost savings.
Cyclicals—XLY (Cyclical/Transports SPDR) or IYC (ConsumerDiscretionary). These two ETFs have roughly 25% each in midcaps. The iShares also have about 5% in small caps, while XLYhas virtually no small-cap exposure. Either of these holdings isacceptable as a large-cap cyclical investment. XLY would still bemy preference.
* Note, while these are my large-cap recommendations, someof these ETFs have exposure to mid- and small-cap stocks.Remember, the S&P 500 is almost all large caps, but not entirely.So, it is obvious that some of these ETFs will have some mid-capexposure too.
** Note, you could also purchase the Consumer Staples SPDR(XLP), but this holding includes health care—in addition to food,
ADVANCED PORTFOLIO MANAGEMENT
— 132 —
beverage and tobacco companies. So, if you decide to buy theconsumer staples ETF (XLP), it’s best not to overlap yourholdings—don’t buy the health care ETF (IYH) too.
Last note on the sector ETFs—the Select Sector SPDRs arebased on sector indexes that are taken out of the S&P 500.However, they are not standard indexes. The stock allocations aredone by the Merrill Lynch Research Department. I am confidentthat Merrill Lynch can do a good job representing the sectorindexes of the S&P, but I should note that SPDRs are not exactreplicates of the S&P sector indexes. The iShares, on the otherhand, were created to track the Dow Jones sector indexes.
MID-CAP STRUCTURED INDEXING
— 133 —
MID CAPS HAVE A MEDIAN MARKET capitalization ofapproximately $2.5 billion. Investing in mid caps doesn’t give usas much flexibility as with large caps, since sector ETFs do notexist for this asset class. So, we are limited to the growth andvalue portions of the market. Obviously, from a risk control andtax planning perspective, we can be less creative in mid caps.Nevertheless, we can still control risk fairly well, since we canalter the weightings between the value and growth portions of themid-cap index.
Mid-cap structured indexing
What are you long on? Companies with low equity valuations, strong balance sheets and a dividend yield.
One finds these among the mid-cap stocks.—FELIX ZULAUF, president, Zulauf Asset Management AG
International Herald Tribune, March 2002
10
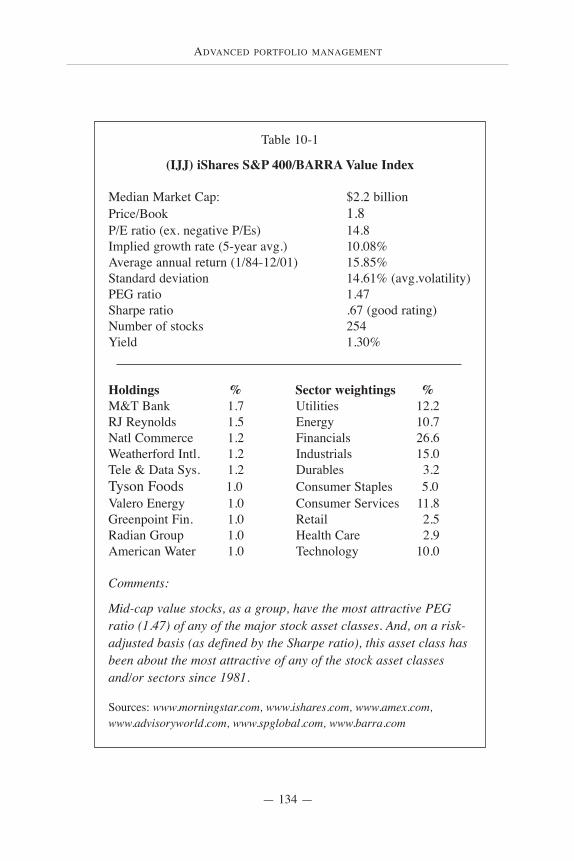
ADVANCED PORTFOLIO MANAGEMENT
— 134 —
Table 10-1
(IJJ) iShares S&P 400/BARRA Value Index
Median Market Cap: $2.2 billionPrice/Book 1.8P/E ratio (ex. negative P/Es) 14.8Implied growth rate (5-year avg.) 10.08%Average annual return (1/84-12/01) 15.85% Standard deviation 14.61% (avg.volatility)PEG ratio 1.47Sharpe ratio .67 (good rating)Number of stocks 254Yield 1.30%
Holdings % Sector weightings %M&T Bank 1.7 Utilities 12.2RJ Reynolds 1.5 Energy 10.7Natl Commerce 1.2 Financials 26.6Weatherford Intl. 1.2 Industrials 15.0Tele & Data Sys. 1.2 Durables 3.2Tyson Foods 1.0 Consumer Staples 5.0Valero Energy 1.0 Consumer Services 11.8Greenpoint Fin. 1.0 Retail 2.5Radian Group 1.0 Health Care 2.9American Water 1.0 Technology 10.0
Comments:
Mid-cap value stocks, as a group, have the most attractive PEGratio (1.47) of any of the major stock asset classes. And, on a risk-adjusted basis (as defined by the Sharpe ratio), this asset class hasbeen about the most attractive of any of the stock asset classesand/or sectors since 1981.
Sources: www.morningstar.com, www.ishares.com, www.amex.com,www.advisoryworld.com, www.spglobal.com, www.barra.com
MID-CAP STRUCTURED INDEXING
— 135 —
Mid-cap value
The value portion of the S&P 400 comprises securities that are considered attractive from a valuation perspective. Like thelarge-cap value asset class, the companies in this index areconsidered relatively cheap based on their price-to-book ratios.And, the companies also tend to pay above-average dividends.
The value portion of the S&P 400 is heavily weighted towardfinancials and utilities. It’s interesting to note that there is alsoabout 14% exposure in technology-related companies. Defensiveinvestors will probably want to weight their portfolios in favor ofthis portion of the index. Like the other value-oriented stock assetclasses, it is somewhat less volatile than the growth component,but we obviously don’t know if this will be the case in the future.Still, you may decide to weight this asset class more heavily thanthe growth portion.
Mid-cap value stocks, as a group, have the most attractivePEG ratio (1.47) of any of the major stock asset classes. And, ona risk-adjusted basis (as defined by the Sharpe ratio), this assetclass has been about the most attractive of any of the stock assetclasses and/or sectors since 1981. It has a relatively low standarddeviation, but still shows excellent performance numbers. Forexample, the average annual return for mid-cap value (WilshireMid-Cap Value) is 15.85% since 1/84 versus 12.83% for mid-capgrowth stocks (Wilshire Mid-Cap Growth). That’s quite adifference. But, more importantly, the standard deviation of thevalue portion was 12.27% versus 20.43% for growth. So, at leastwith this asset class, investors received a high reward without toomuch volatility. These facts may convince you to overweightyour portfolio in favor of mid-cap value. Sure, past performanceand standard deviations do not give us any guarantee, but it’s hardto ignore how well this asset class has done on a risk-adjustedbasis. One word of caution, again, the work of Fama and French
ADVANCED PORTFOLIO MANAGEMENT
— 136 —
taught us about the risks of loading up on value-oriented stocks.The smaller asset classes combined with a value tilt to investingcarry additional risks—don’t ignore this.
One last attractive point on mid-cap value. The index is verydiversified, with no more than 1.6% of its assets in any givencompany. By contrast, in the large-cap value asset class, severalcompanies make up more than 3% of the index. In the large-capgrowth component, General Electric alone makes up more than6% of the index. So, mid-cap value offers a lot of neededdiversification, without any big bets on any one company.
Mid-cap growth
The growth portion of the S&P 400 comprises securities thatgenerally have high price-to-earnings and price-to-book ratios.They typically pay paltry dividends, but have good earnings andgood growth potential. The median market capitalization percompany in the growth index is higher than the median for thevalue index—$3.3 billion versus $2.2 billion.
The mid-cap growth index is heavily weighted toward healthcare and technology companies. About half of your assets in thisindex will be allocated in these two sectors. So, if, for whateverreason, you are not optimistic about the prospects for the healthcare or technology industries, underweight this asset class.
Presently, mid-cap growth is trading at a very high PEG ratio(2.07), but if earnings come back, the PEG will drop substantially.Right now, however, this index is very expensive from a valuationstandpoint.
Mid-cap growth stocks are obviously an important asset class,and they deserve some of your money. Keep in mind, however,that this is a fairly volatile asset class—about the same standard
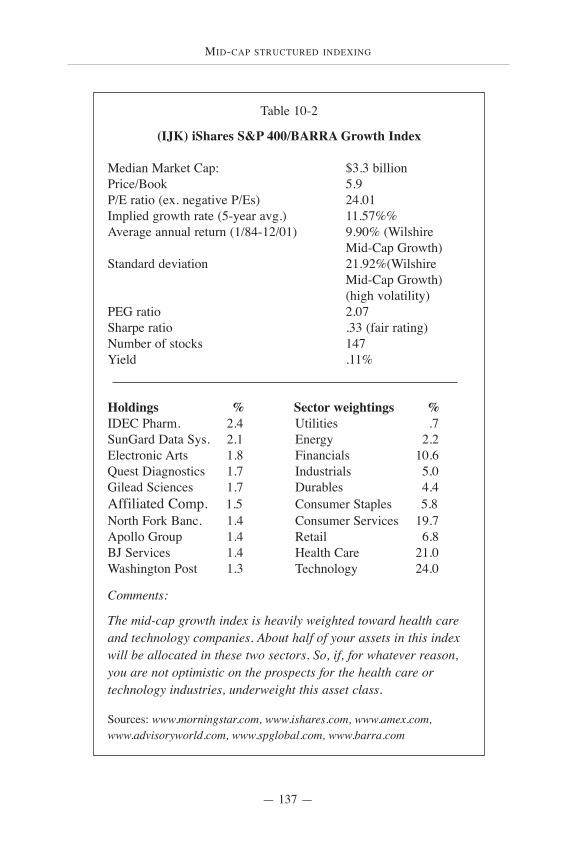
MID-CAP STRUCTURED INDEXING
— 137 —
Table 10-2
(IJK) iShares S&P 400/BARRA Growth Index
Median Market Cap: $3.3 billionPrice/Book 5.9P/E ratio (ex. negative P/Es) 24.01Implied growth rate (5-year avg.) 11.57%%Average annual return (1/84-12/01) 9.90% (Wilshire
Mid-Cap Growth)Standard deviation 21.92%(Wilshire
Mid-Cap Growth) (high volatility)
PEG ratio 2.07Sharpe ratio .33 (fair rating)Number of stocks 147Yield .11%
Holdings % Sector weightings %IDEC Pharm. 2.4 Utilities .7SunGard Data Sys. 2.1 Energy 2.2Electronic Arts 1.8 Financials 10.6Quest Diagnostics 1.7 Industrials 5.0Gilead Sciences 1.7 Durables 4.4Affiliated Comp. 1.5 Consumer Staples 5.8North Fork Banc. 1.4 Consumer Services 19.7Apollo Group 1.4 Retail 6.8BJ Services 1.4 Health Care 21.0Washington Post 1.3 Technology 24.0
Comments:
The mid-cap growth index is heavily weighted toward health careand technology companies. About half of your assets in this indexwill be allocated in these two sectors. So, if, for whatever reason,you are not optimistic on the prospects for the health care ortechnology industries, underweight this asset class.
Sources: www.morningstar.com, www.ishares.com, www.amex.com,www.advisoryworld.com, www.spglobal.com, www.barra.com
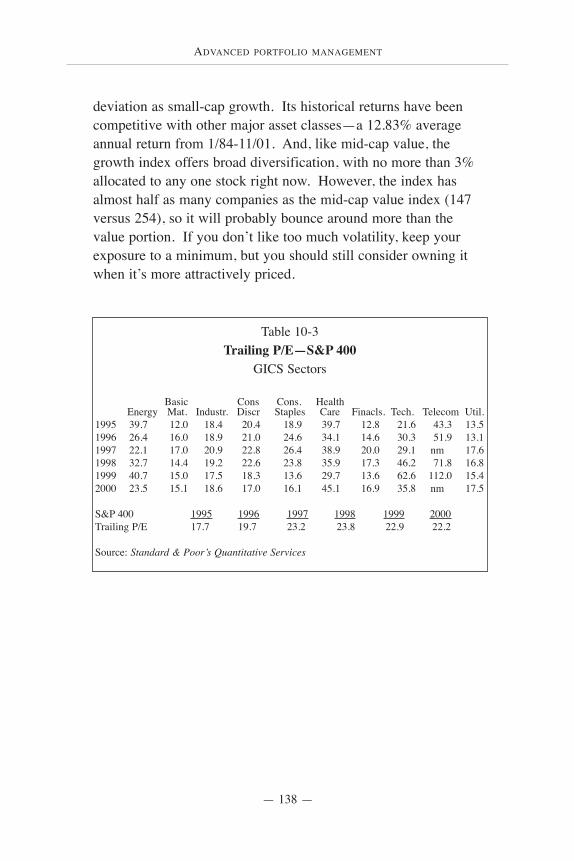
ADVANCED PORTFOLIO MANAGEMENT
— 138 —
deviation as small-cap growth. Its historical returns have beencompetitive with other major asset classes—a 12.83% averageannual return from 1/84-11/01. And, like mid-cap value, thegrowth index offers broad diversification, with no more than 3%allocated to any one stock right now. However, the index hasalmost half as many companies as the mid-cap value index (147versus 254), so it will probably bounce around more than thevalue portion. If you don’t like too much volatility, keep yourexposure to a minimum, but you should still consider owning itwhen it’s more attractively priced.
Table 10-3Trailing P/E—S&P 400
GICS Sectors
Basic Cons Cons. HealthEnergy Mat. Industr. Discr Staples Care Finacls. Tech. Telecom Util.
1995 39.7 12.0 18.4 20.4 18.9 39.7 12.8 21.6 43.3 13.51996 26.4 16.0 18.9 21.0 24.6 34.1 14.6 30.3 51.9 13.11997 22.1 17.0 20.9 22.8 26.4 38.9 20.0 29.1 nm 17.61998 32.7 14.4 19.2 22.6 23.8 35.9 17.3 46.2 71.8 16.81999 40.7 15.0 17.5 18.3 13.6 29.7 13.6 62.6 112.0 15.42000 23.5 15.1 18.6 17.0 16.1 45.1 16.9 35.8 nm 17.5
S&P 400 1995 1996 1997 1998 1999 2000Trailing P/E 17.7 19.7 23.2 23.8 22.9 22.2
Source: Standard & Poor’s Quantitative Services
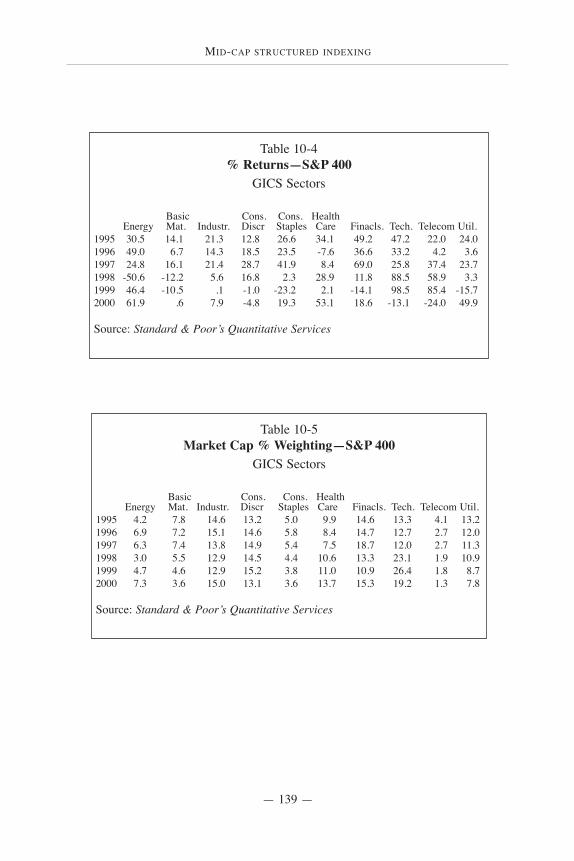
MID-CAP STRUCTURED INDEXING
— 139 —
Table 10-4% Returns—S&P 400
GICS Sectors
Basic Cons. Cons. HealthEnergy Mat. Industr. Discr Staples Care Finacls. Tech. Telecom Util.
1995 30.5 14.1 21.3 12.8 26.6 34.1 49.2 47.2 22.0 24.01996 49.0 6.7 14.3 18.5 23.5 -7.6 36.6 33.2 4.2 3.61997 24.8 16.1 21.4 28.7 41.9 8.4 69.0 25.8 37.4 23.71998 -50.6 -12.2 5.6 16.8 2.3 28.9 11.8 88.5 58.9 3.31999 46.4 -10.5 .1 -1.0 -23.2 2.1 -14.1 98.5 85.4 -15.72000 61.9 .6 7.9 -4.8 19.3 53.1 18.6 -13.1 -24.0 49.9
Source: Standard & Poor’s Quantitative Services
Table 10-5Market Cap % Weighting—S&P 400
GICS Sectors
Basic Cons. Cons. HealthEnergy Mat. Industr. Discr Staples Care Finacls. Tech. Telecom Util.
1995 4.2 7.8 14.6 13.2 5.0 9.9 14.6 13.3 4.1 13.21996 6.9 7.2 15.1 14.6 5.8 8.4 14.7 12.7 2.7 12.01997 6.3 7.4 13.8 14.9 5.4 7.5 18.7 12.0 2.7 11.31998 3.0 5.5 12.9 14.5 4.4 10.6 13.3 23.1 1.9 10.91999 4.7 4.6 12.9 15.2 3.8 11.0 10.9 26.4 1.8 8.72000 7.3 3.6 15.0 13.1 3.6 13.7 15.3 19.2 1.3 7.8
Source: Standard & Poor’s Quantitative Services
ADVANCED PORTFOLIO MANAGEMENT
— 140 —
SMALL-CAP STOCKS HAVE A MEDIAN market capitalizationof approximately $800 million—same for the value and growthindexes. The companies that make up these indexes are relativelyunknown and undiscovered. If you look at the top components ofthe indexes, I’d be surprised if you recognize many of the names.Although small-cap stocks, on the whole, make up a very tinyportion of all publicly traded stocks (only about 4%), manyprofessionals recommended allocating a significant portion ofyour stock portfolio to this asset class. While I agree that theydeserve a portion of your assets, I prefer mid caps and certainlylarge caps to small-cap stocks. The work of Fama and French
Small-cap structured indexing
Because of their greater risk, smaller stockstypically trade at lower earnings multiples.
—JONATHAN CLEMENTS, The Wall Street Journal
The group usually goes through up cycles that tendto last about six years and strategists say right now,
the market is about halfway through.—KAREN TALLEY, The Wall Street Journal, April 2002
11
SMALL-CAP STRUCTURED INDEXING
— 141 —
have proven that small caps are riskier than mid- or large-capstocks. The size effect should result in better long-term returns,but understand that this asset class is a “strange animal” andbehaves in a very unpredictable fashion. For example, small-capgrowth has been particularly volatile over the past 20 years, but ithas not rewarded shareholders with higher returns. If I’m goingto own an asset class that makes my stomach turn I’d like to get abetter reward. Perhaps this underperformance will change in thecoming years and small-cap growth will start outperforming mid-and large-cap growth—it’s supposed to.
Small-cap value stocks look more interesting than smallgrowth right now. While they are considered the riskiest of allstock asset classes—due to their high cost of capital and distresslevels—small value companies have been somewhat uncorrelatedto the rest of the market, and have shown pretty decent returns,with limited volatility. But, don’t let the fairly low standarddeviation fool you. The higher returns from small-cap valuestocks come at a price—they are very dangerous and you can getcreamed at any given time. Don’t think this can’t happen.Nevertheless, for added diversification in the equity markets, I’dallocate a decent percentage of my portfolio to this asset class.And, for the time being, it’s pretty attractive relative to other stockasset classes.
When deciding how much of your money to allocate to valueor growth, I would apply the same guidelines that I use for mid-and large-cap stocks. Look at the valuations (P/E and PEG ratios)and look at the exposure to the individual sectors. If you’re goingto overweight either asset class make sure you’re doing sobecause the valuations warrant it.
Risk-averse investors may want to keep their small-capexposure limited, since it is the riskiest of all stock asset classes.Having said that, I do like the fact that small-cap returns have
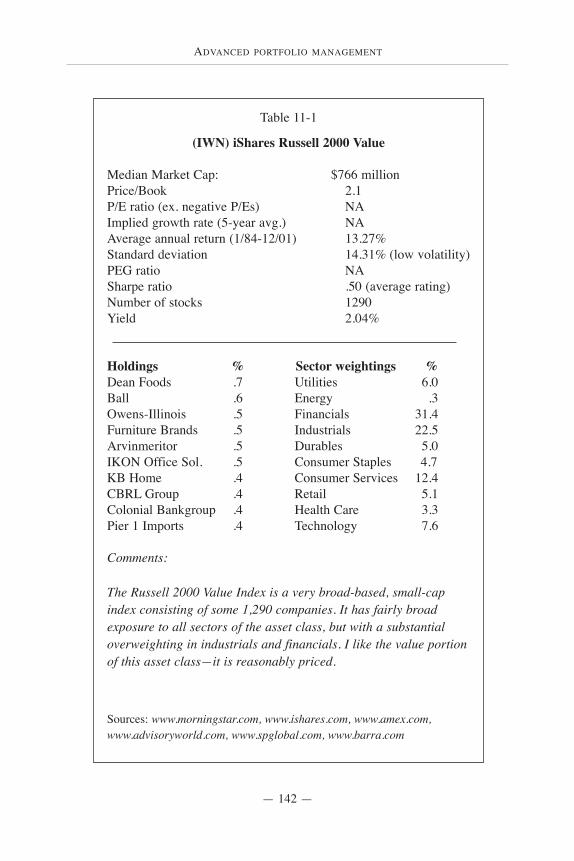
ADVANCED PORTFOLIO MANAGEMENT
— 142 —
Table 11-1
(IWN) iShares Russell 2000 Value
Median Market Cap: $766 millionPrice/Book 2.1P/E ratio (ex. negative P/Es) NAImplied growth rate (5-year avg.) NAAverage annual return (1/84-12/01) 13.27% Standard deviation 14.31% (low volatility)PEG ratio NASharpe ratio .50 (average rating)Number of stocks 1290Yield 2.04%
Holdings % Sector weightings %Dean Foods .7 Utilities 6.0Ball .6 Energy .3Owens-Illinois .5 Financials 31.4Furniture Brands .5 Industrials 22.5Arvinmeritor .5 Durables 5.0IKON Office Sol. .5 Consumer Staples 4.7KB Home .4 Consumer Services 12.4CBRL Group .4 Retail 5.1Colonial Bankgroup .4 Health Care 3.3Pier 1 Imports .4 Technology 7.6
Comments:
The Russell 2000 Value Index is a very broad-based, small-capindex consisting of some 1,290 companies. It has fairly broadexposure to all sectors of the asset class, but with a substantialoverweighting in industrials and financials. I like the value portionof this asset class—it is reasonably priced.
Sources: www.morningstar.com, www.ishares.com, www.amex.com,www.advisoryworld.com, www.spglobal.com, www.barra.com

SMALL-CAP STRUCTURED INDEXING
— 143 —
moved somewhat counter to large caps in the past. So, while theyare definitely riskier than large- and mid-cap stocks, if youbalance out your portfolio with a little of each asset class, you areactually reducing risk. This is obviously the argument in favor ofdiversification of asset classes and uncorrelated investments.
In the small-cap universe of ETFs, you have four choices foryour money. Barclays Global Investors offer two different small-cap indexes for both growth and value. I’ll discuss them briefly,and make a recommendation as to which ones you should own.
iShares Russell 2000 Value
The Russell 2000 Value Index is a very broad-based, small-capindex consisting of approximately 1,290 companies. It has fairlybroad exposure to all sectors of the asset class, but with asubstantial overweighting in industrials and financials. I like thevalue portion of this asset class—it is reasonably priced. And, ithas historically given investors a pretty good bang for the buck.Its somewhat recent standard deviation is 14.31% (1/84-12/01),but the standard deviation for small value stocks jumps to23.96%, if you look at Fama and French data going back to 1964.Small-cap value investors have seen very good returns in the past20 years—13.27% annualized. However, take note that this assetclass is about 30% more volatile than large-cap value stocks, andslightly more volatile than mid-cap value (8%).
iShares S&P 600 Value
The iShares S&P 600 Value Index also gives you exposure tothe small-cap value market, but with far fewer companies than theRussell 2000 Value Index (379 vs. 1,290). This index is alsoheavily weighted toward financials and industrials. The S&P 600Value Index has about 50% more technology exposure than theRussell equivalent index. I do not have data to show the standard
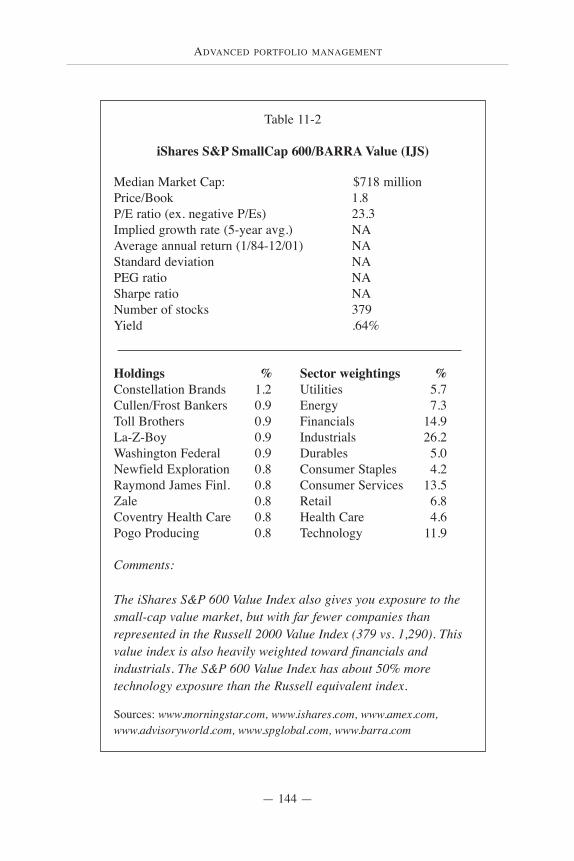
ADVANCED PORTFOLIO MANAGEMENT
— 144 —
Table 11-2
iShares S&P SmallCap 600/BARRA Value (IJS)
Median Market Cap: $718 millionPrice/Book 1.8P/E ratio (ex. negative P/Es) 23.3Implied growth rate (5-year avg.) NAAverage annual return (1/84-12/01) NAStandard deviation NAPEG ratio NASharpe ratio NANumber of stocks 379Yield .64%
Holdings % Sector weightings %Constellation Brands 1.2 Utilities 5.7Cullen/Frost Bankers 0.9 Energy 7.3Toll Brothers 0.9 Financials 14.9La-Z-Boy 0.9 Industrials 26.2Washington Federal 0.9 Durables 5.0Newfield Exploration 0.8 Consumer Staples 4.2Raymond James Finl. 0.8 Consumer Services 13.5Zale 0.8 Retail 6.8Coventry Health Care 0.8 Health Care 4.6Pogo Producing 0.8 Technology 11.9
Comments:
The iShares S&P 600 Value Index also gives you exposure to thesmall-cap value market, but with far fewer companies thanrepresented in the Russell 2000 Value Index (379 vs. 1,290). Thisvalue index is also heavily weighted toward financials andindustrials. The S&P 600 Value Index has about 50% moretechnology exposure than the Russell equivalent index.
Sources: www.morningstar.com, www.ishares.com, www.amex.com,www.advisoryworld.com, www.spglobal.com, www.barra.com
SMALL-CAP STRUCTURED INDEXING
— 145 —
deviation and long-term historical performance numbers for thisindex, but I would assume they are similar to the Wilshire SmallCompany Value Index and the Russell 2000 Value Index, whichtrack the same asset class.
iShares Russell 2000 Growth
The Russell 2000 Growth Index is a very broad-based small-cap index consisting of 1,257 companies. Its assets areconcentrated in health care and technology stocks. The historicalstandard deviation is very high at 19.29%, and its average annualreturn is 8.74% (1/84-12/01). The growth portion of the small-capmarket is not that attractive, in my opinion, from a risk/rewardstandpoint. Sure, most advisors would probably recommend youallocate some of your stock money to this asset class, but for thetime being I would avoid it until the valuation looks moreattractive (the P/E is presently over 30).
iShares S&P 600 Growth
The S&P 600 Growth Index is the other small-cap growth ETFthat offers exposure to this asset class. It is concentrated in farfewer stocks than the Russell 2000 Growth Index (221 stocks vs.1,257 stocks). Does this make it riskier than the Russell 2000Growth Index? I think so, especially since the weightings in thetop 10 holdings are fairly high when compared to the Russell2000 Growth Index (13% versus 4%). Note, this index has quite abit less technology exposure than the Russell 2000 Growth Index,with about the same weighting in health care.
For small-cap ETFs, if you buy them, I would recommend theiShares Russell 2000 (value and growth) rather than the ETFs thattrack the S&P 600. The Russell indexes offer betterdiversification of your money, and in my opinion, less risk.
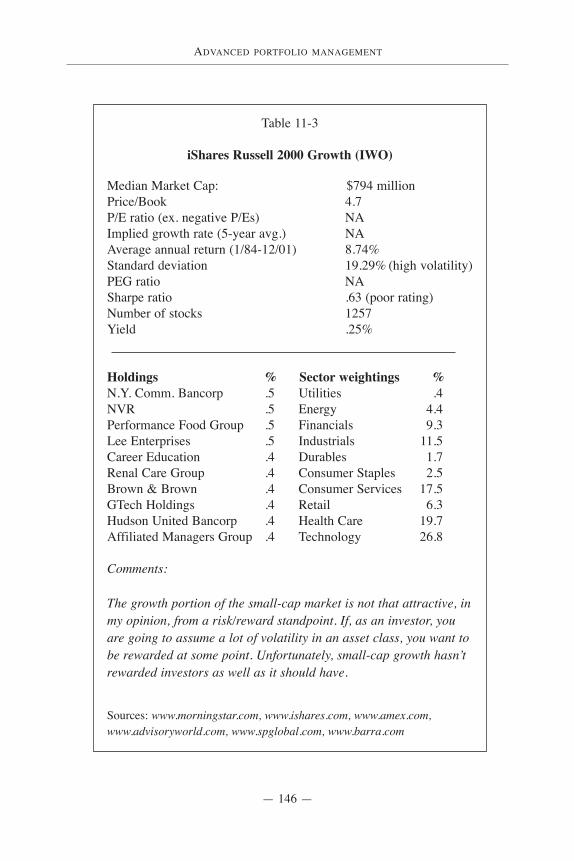
ADVANCED PORTFOLIO MANAGEMENT
— 146 —
Table 11-3
iShares Russell 2000 Growth (IWO)
Median Market Cap: $794 millionPrice/Book 4.7P/E ratio (ex. negative P/Es) NAImplied growth rate (5-year avg.) NAAverage annual return (1/84-12/01) 8.74%Standard deviation 19.29% (high volatility)PEG ratio NASharpe ratio .63 (poor rating)Number of stocks 1257Yield .25%
Holdings % Sector weightings %N.Y. Comm. Bancorp .5 Utilities .4NVR .5 Energy 4.4Performance Food Group .5 Financials 9.3Lee Enterprises .5 Industrials 11.5Career Education .4 Durables 1.7Renal Care Group .4 Consumer Staples 2.5Brown & Brown .4 Consumer Services 17.5GTech Holdings .4 Retail 6.3Hudson United Bancorp .4 Health Care 19.7Affiliated Managers Group .4 Technology 26.8
Comments:
The growth portion of the small-cap market is not that attractive, inmy opinion, from a risk/reward standpoint. If, as an investor, youare going to assume a lot of volatility in an asset class, you want tobe rewarded at some point. Unfortunately, small-cap growth hasn’trewarded investors as well as it should have.
Sources: www.morningstar.com, www.ishares.com, www.amex.com,www.advisoryworld.com, www.spglobal.com, www.barra.com
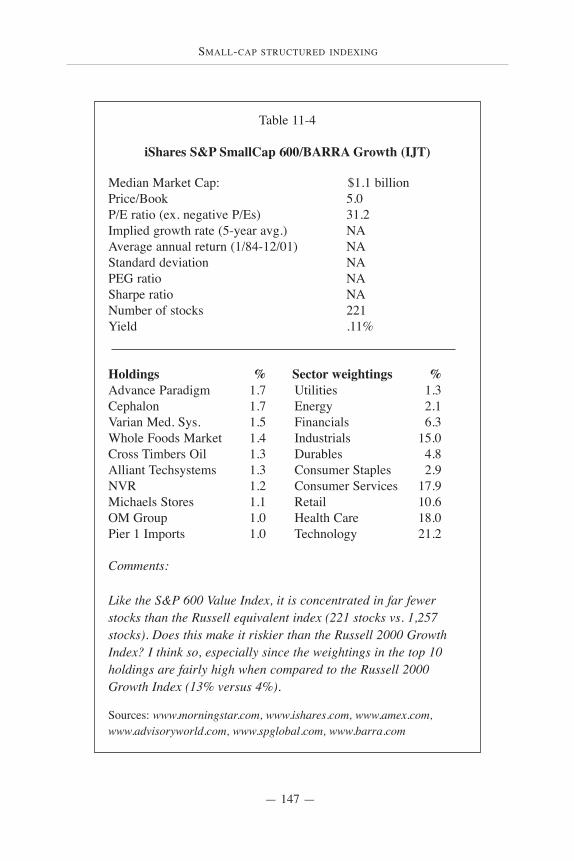
SMALL-CAP STRUCTURED INDEXING
— 147 —
Table 11-4
iShares S&P SmallCap 600/BARRA Growth (IJT)
Median Market Cap: $1.1 billionPrice/Book 5.0P/E ratio (ex. negative P/Es) 31.2Implied growth rate (5-year avg.) NAAverage annual return (1/84-12/01) NAStandard deviation NAPEG ratio NASharpe ratio NANumber of stocks 221Yield .11%
Holdings % Sector weightings %Advance Paradigm 1.7 Utilities 1.3Cephalon 1.7 Energy 2.1Varian Med. Sys. 1.5 Financials 6.3Whole Foods Market 1.4 Industrials 15.0Cross Timbers Oil 1.3 Durables 4.8Alliant Techsystems 1.3 Consumer Staples 2.9NVR 1.2 Consumer Services 17.9Michaels Stores 1.1 Retail 10.6OM Group 1.0 Health Care 18.0Pier 1 Imports 1.0 Technology 21.2
Comments:
Like the S&P 600 Value Index, it is concentrated in far fewerstocks than the Russell equivalent index (221 stocks vs. 1,257stocks). Does this make it riskier than the Russell 2000 GrowthIndex? I think so, especially since the weightings in the top 10holdings are fairly high when compared to the Russell 2000Growth Index (13% versus 4%).
Sources: www.morningstar.com, www.ishares.com, www.amex.com,www.advisoryworld.com, www.spglobal.com, www.barra.com
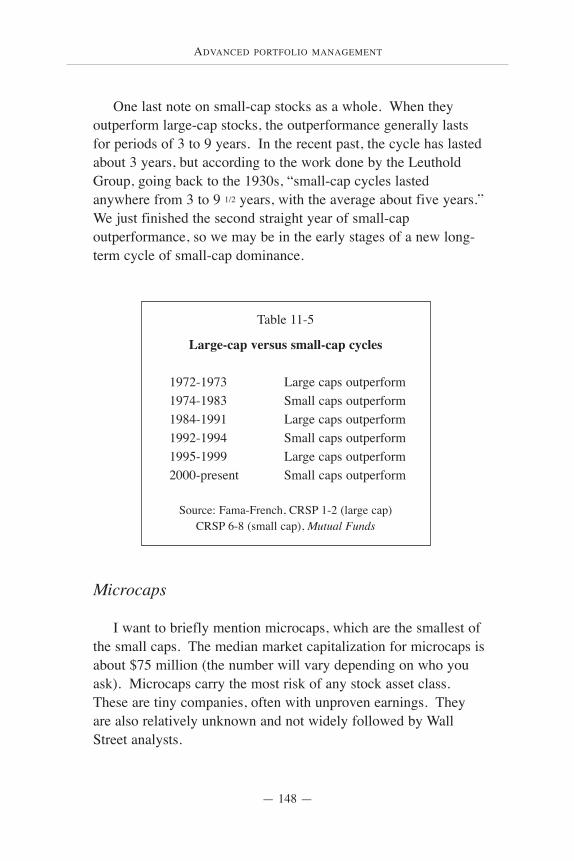
ADVANCED PORTFOLIO MANAGEMENT
— 148 —
One last note on small-cap stocks as a whole. When theyoutperform large-cap stocks, the outperformance generally lastsfor periods of 3 to 9 years. In the recent past, the cycle has lastedabout 3 years, but according to the work done by the LeutholdGroup, going back to the 1930s, “small-cap cycles lastedanywhere from 3 to 9 1/2 years, with the average about five years.”We just finished the second straight year of small-capoutperformance, so we may be in the early stages of a new long-term cycle of small-cap dominance.
Microcaps
I want to briefly mention microcaps, which are the smallest ofthe small caps. The median market capitalization for microcaps isabout $75 million (the number will vary depending on who youask). Microcaps carry the most risk of any stock asset class.These are tiny companies, often with unproven earnings. Theyare also relatively unknown and not widely followed by WallStreet analysts.
Table 11-5
Large-cap versus small-cap cycles
1972-1973 Large caps outperform1974-1983 Small caps outperform1984-1991 Large caps outperform1992-1994 Small caps outperform1995-1999 Large caps outperform2000-present Small caps outperform
Source: Fama-French, CRSP 1-2 (large cap)CRSP 6-8 (small cap), Mutual Funds
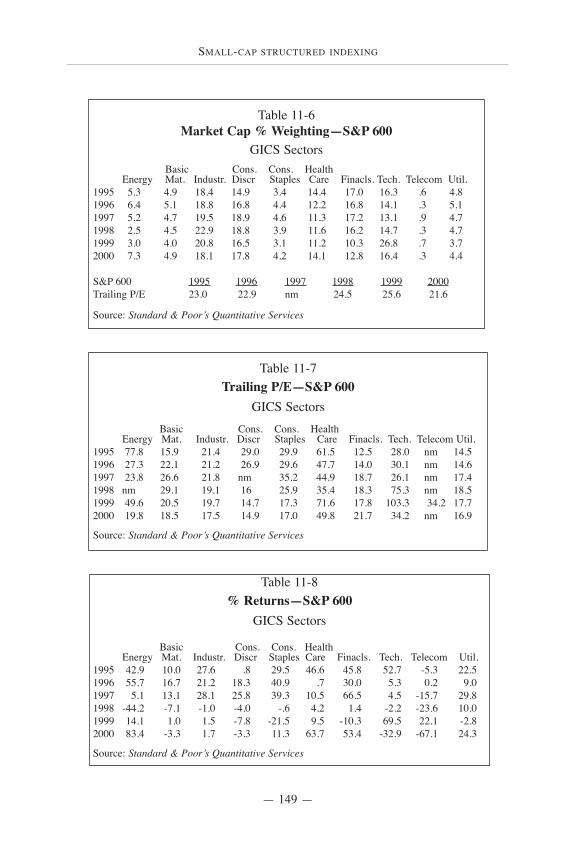
SMALL-CAP STRUCTURED INDEXING
— 149 —
Table 11-8% Returns—S&P 600
GICS Sectors
Basic Cons. Cons. HealthEnergy Mat. Industr. Discr Staples Care Finacls. Tech. Telecom Util.
1995 42.9 10.0 27.6 .8 29.5 46.6 45.8 52.7 -5.3 22.51996 55.7 16.7 21.2 18.3 40.9 .7 30.0 5.3 0.2 9.01997 5.1 13.1 28.1 25.8 39.3 10.5 66.5 4.5 -15.7 29.81998 -44.2 -7.1 -1.0 -4.0 -.6 4.2 1.4 -2.2 -23.6 10.01999 14.1 1.0 1.5 -7.8 -21.5 9.5 -10.3 69.5 22.1 -2.82000 83.4 -3.3 1.7 -3.3 11.3 63.7 53.4 -32.9 -67.1 24.3
Source: Standard & Poor’s Quantitative Services
Table 11-7Trailing P/E—S&P 600
GICS SectorsBasic Cons. Cons. Health
Energy Mat. Industr. Discr Staples Care Finacls. Tech. Telecom Util.1995 77.8 15.9 21.4 29.0 29.9 61.5 12.5 28.0 nm 14.51996 27.3 22.1 21.2 26.9 29.6 47.7 14.0 30.1 nm 14.61997 23.8 26.6 21.8 nm 35.2 44.9 18.7 26.1 nm 17.41998 nm 29.1 19.1 16 25.9 35.4 18.3 75.3 nm 18.51999 49.6 20.5 19.7 14.7 17.3 71.6 17.8 103.3 34.2 17.72000 19.8 18.5 17.5 14.9 17.0 49.8 21.7 34.2 nm 16.9
Source: Standard & Poor’s Quantitative Services
Table 11-6Market Cap % Weighting—S&P 600
GICS SectorsBasic Cons. Cons. Health
Energy Mat. Industr. Discr Staples Care Finacls. Tech. Telecom Util.1995 5.3 4.9 18.4 14.9 3.4 14.4 17.0 16.3 .6 4.81996 6.4 5.1 18.8 16.8 4.4 12.2 16.8 14.1 .3 5.11997 5.2 4.7 19.5 18.9 4.6 11.3 17.2 13.1 .9 4.71998 2.5 4.5 22.9 18.8 3.9 11.6 16.2 14.7 .3 4.71999 3.0 4.0 20.8 16.5 3.1 11.2 10.3 26.8 .7 3.72000 7.3 4.9 18.1 17.8 4.2 14.1 12.8 16.4 .3 4.4
S&P 600 1995 1996 1997 1998 1999 2000Trailing P/E 23.0 22.9 nm 24.5 25.6 21.6
Source: Standard & Poor’s Quantitative Services
ADVANCED PORTFOLIO MANAGEMENT
— 150 —
Microcaps can be considered attractive for many of the samereasons as the small-cap asset class. In particular, they tend tomove counter to large caps, which gives the large-cap investorsome much needed diversification. This correlation benefit hasbeen evident in the past couple of years, when large caps havebeen creamed and mid-, small- and micro-cap stocks have all donerelatively well.
If you’re interested in microcaps, you don’t have much choicefor your money. There are no ETFs that track this asset class, andthere is only one index fund that tracks microcaps, the U.S. MicroCap Portfolio (DFSCX) offered by Dimensional Fund Advisors.If you have access to Dimensional’s funds through your advisor(they are an institutional-only fund family), you should considerthis fund. If you don’t have access to this fund, I would ignoremicrocaps entirely. I wouldn’t want you to invest in microcapswith an active manager.
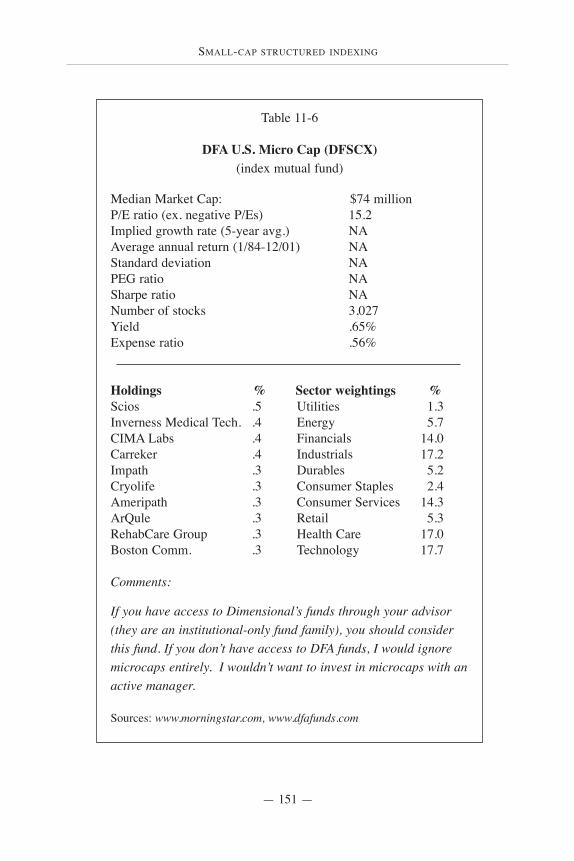
SMALL-CAP STRUCTURED INDEXING
— 151 —
Table 11-6
DFA U.S. Micro Cap (DFSCX) (index mutual fund)
Median Market Cap: $74 millionP/E ratio (ex. negative P/Es) 15.2Implied growth rate (5-year avg.) NAAverage annual return (1/84-12/01) NAStandard deviation NAPEG ratio NASharpe ratio NANumber of stocks 3,027Yield .65%Expense ratio .56%
Holdings % Sector weightings %Scios .5 Utilities 1.3Inverness Medical Tech. .4 Energy 5.7CIMA Labs .4 Financials 14.0Carreker .4 Industrials 17.2Impath .3 Durables 5.2Cryolife .3 Consumer Staples 2.4Ameripath .3 Consumer Services 14.3ArQule .3 Retail 5.3RehabCare Group .3 Health Care 17.0Boston Comm. .3 Technology 17.7
Comments:
If you have access to Dimensional’s funds through your advisor(they are an institutional-only fund family), you should considerthis fund. If you don’t have access to DFA funds, I would ignoremicrocaps entirely. I wouldn’t want to invest in microcaps with anactive manager.
Sources: www.morningstar.com, www.dfafunds.com
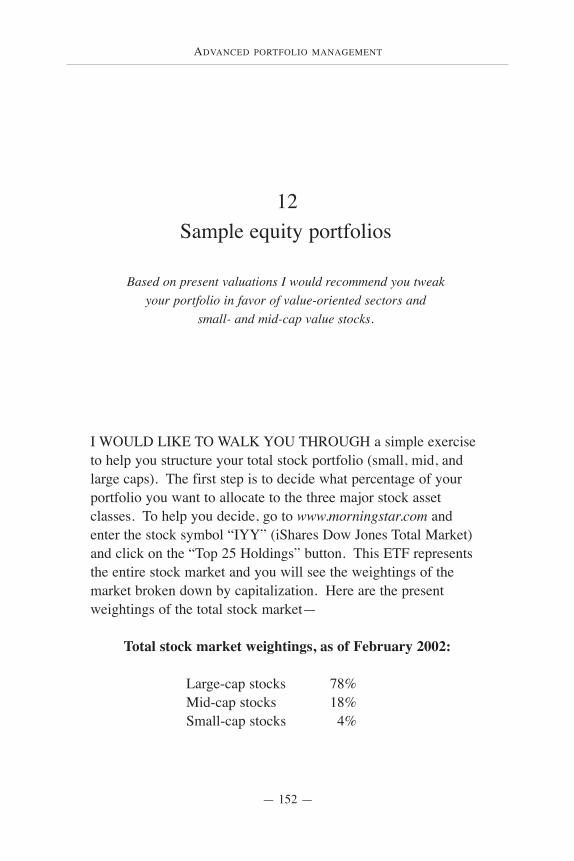
ADVANCED PORTFOLIO MANAGEMENT
— 152 —
I WOULD LIKE TO WALK YOU THROUGH a simple exerciseto help you structure your total stock portfolio (small, mid, andlarge caps). The first step is to decide what percentage of yourportfolio you want to allocate to the three major stock assetclasses. To help you decide, go to www.morningstar.com andenter the stock symbol “IYY” (iShares Dow Jones Total Market)and click on the “Top 25 Holdings” button. This ETF representsthe entire stock market and you will see the weightings of themarket broken down by capitalization. Here are the presentweightings of the total stock market—
Total stock market weightings, as of February 2002:
Large-cap stocks 78%Mid-cap stocks 18%Small-cap stocks 4%
Sample equity portfolios
Based on present valuations I would recommend you tweakyour portfolio in favor of value-oriented sectors and
small- and mid-cap value stocks.
12
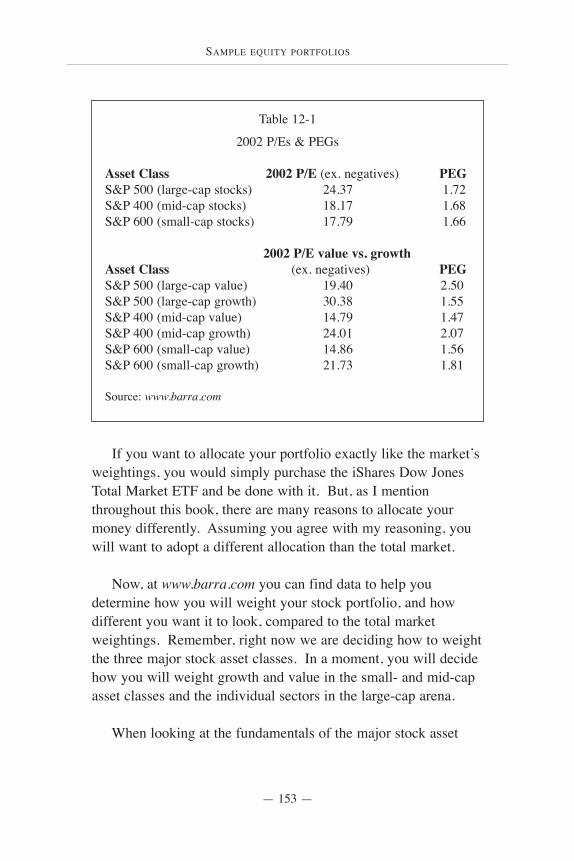
SAMPLE EQUITY PORTFOLIOS
— 153 —
If you want to allocate your portfolio exactly like the market’sweightings, you would simply purchase the iShares Dow JonesTotal Market ETF and be done with it. But, as I mentionthroughout this book, there are many reasons to allocate yourmoney differently. Assuming you agree with my reasoning, youwill want to adopt a different allocation than the total market.
Now, at www.barra.com you can find data to help youdetermine how you will weight your stock portfolio, and howdifferent you want it to look, compared to the total marketweightings. Remember, right now we are deciding how to weightthe three major stock asset classes. In a moment, you will decidehow you will weight growth and value in the small- and mid-capasset classes and the individual sectors in the large-cap arena.
When looking at the fundamentals of the major stock asset
Table 12-1
2002 P/Es & PEGs
Asset Class 2002 P/E (ex. negatives) PEGS&P 500 (large-cap stocks) 24.37 1.72S&P 400 (mid-cap stocks) 18.17 1.68S&P 600 (small-cap stocks) 17.79 1.66
2002 P/E value vs. growth Asset Class (ex. negatives) PEGS&P 500 (large-cap value) 19.40 2.50S&P 500 (large-cap growth) 30.38 1.55S&P 400 (mid-cap value) 14.79 1.47S&P 400 (mid-cap growth) 24.01 2.07S&P 600 (small-cap value) 14.86 1.56S&P 600 (small-cap growth) 21.73 1.81
Source: www.barra.com
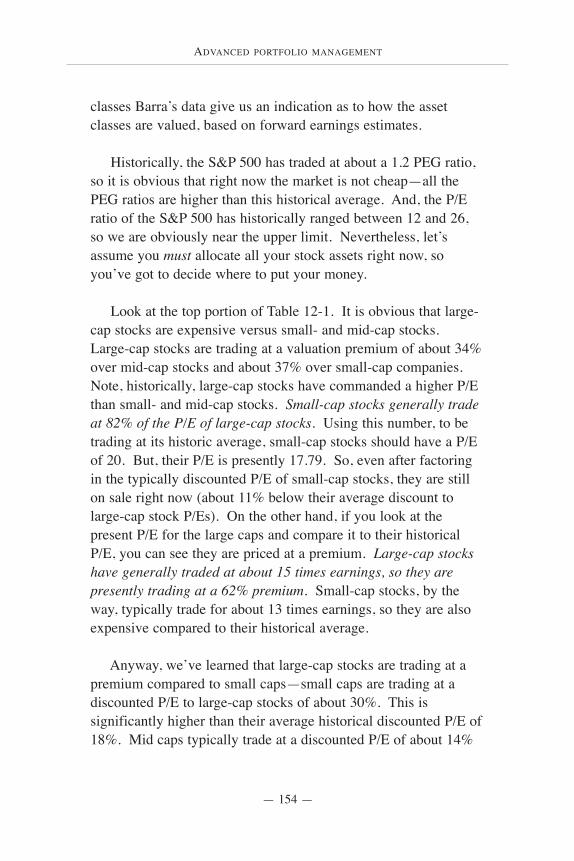
ADVANCED PORTFOLIO MANAGEMENT
— 154 —
classes Barra’s data give us an indication as to how the assetclasses are valued, based on forward earnings estimates.
Historically, the S&P 500 has traded at about a 1.2 PEG ratio,so it is obvious that right now the market is not cheap—all thePEG ratios are higher than this historical average. And, the P/Eratio of the S&P 500 has historically ranged between 12 and 26,so we are obviously near the upper limit. Nevertheless, let’sassume you must allocate all your stock assets right now, soyou’ve got to decide where to put your money.
Look at the top portion of Table 12-1. It is obvious that large-cap stocks are expensive versus small- and mid-cap stocks.Large-cap stocks are trading at a valuation premium of about 34%over mid-cap stocks and about 37% over small-cap companies.Note, historically, large-cap stocks have commanded a higher P/Ethan small- and mid-cap stocks. Small-cap stocks generally tradeat 82% of the P/E of large-cap stocks. Using this number, to betrading at its historic average, small-cap stocks should have a P/Eof 20. But, their P/E is presently 17.79. So, even after factoringin the typically discounted P/E of small-cap stocks, they are stillon sale right now (about 11% below their average discount tolarge-cap stock P/Es). On the other hand, if you look at thepresent P/E for the large caps and compare it to their historicalP/E, you can see they are priced at a premium. Large-cap stockshave generally traded at about 15 times earnings, so they arepresently trading at a 62% premium. Small-cap stocks, by theway, typically trade for about 13 times earnings, so they are alsoexpensive compared to their historical average.
Anyway, we’ve learned that large-cap stocks are trading at apremium compared to small caps—small caps are trading at adiscounted P/E to large-cap stocks of about 30%. This issignificantly higher than their average historical discounted P/E of18%. Mid caps typically trade at a discounted P/E of about 14%
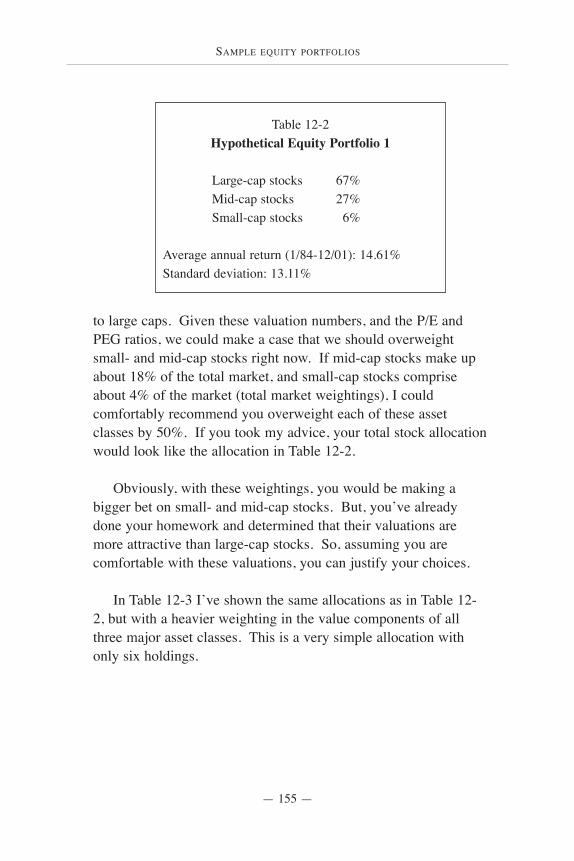
SAMPLE EQUITY PORTFOLIOS
— 155 —
to large caps. Given these valuation numbers, and the P/E andPEG ratios, we could make a case that we should overweightsmall- and mid-cap stocks right now. If mid-cap stocks make upabout 18% of the total market, and small-cap stocks compriseabout 4% of the market (total market weightings), I couldcomfortably recommend you overweight each of these assetclasses by 50%. If you took my advice, your total stock allocationwould look like the allocation in Table 12-2.
Obviously, with these weightings, you would be making abigger bet on small- and mid-cap stocks. But, you’ve alreadydone your homework and determined that their valuations aremore attractive than large-cap stocks. So, assuming you arecomfortable with these valuations, you can justify your choices.
In Table 12-3 I’ve shown the same allocations as in Table 12-2, but with a heavier weighting in the value components of allthree major asset classes. This is a very simple allocation withonly six holdings.
Table 12-2 Hypothetical Equity Portfolio 1
Large-cap stocks 67%Mid-cap stocks 27%Small-cap stocks 6%
Average annual return (1/84-12/01): 14.61%Standard deviation: 13.11%

ADVANCED PORTFOLIO MANAGEMENT
— 156 —
The portfolio shown in Table 12-4 is more diversified amongstyles and asset classes than the total market. It has more moneyallocated to mid- and small-cap stocks and its overweight value.As a result, the standard deviation of the portfolio has beenreduced—11.92% versus 13.84% (total market’s standarddeviation). This more diversified portfolio is about 13% lessvolatile and its average annual return was actually better than thetotal market portfolio. My point is that the structured portfolio(even with a simple 6-ETF portfolio), shows how you can lessenvolatility without giving up returns. By overweighting value andadding more small- and mid-cap exposure, you diversify yourrisks (size and style) better than the total market portfolio.
Let me take this a step further to make another point. If youare willing to go against conventional wisdom and have yourportfolio’s returns and allocations look different from the largeindexes, you can even further diversify your risk. The portfolio inTable 12-5 allocates significantly more money to mid- and small-cap stocks than the total market portfolio. And, it underweights
Table 12-3 Hypothetical Equity Portfolio 2
Large-cap value stocks 47%Large-cap growth stocks 20%Mid-cap value stocks 19%Mid-cap growth stocks 8%Small-cap value stocks 4%Small-cap growth stocks 2%
Average annual return (1/84-12/01): 15.42%Standard deviation: 11.92%
SAMPLE EQUITY PORTFOLIOS
— 157 —
growth, in favor of value. The results are revealing. It shows abetter annual return than the total market—about a 1% annualpremium. And, it shows a lower standard deviation, 12.34% thanthe previous hypothetical portfolios. Once again, you could havelessened the volatility of your overall portfolio and improved yourresults if you had a more balanced allocation than the total marketduring the past two decades.
Let’s look at a few other sample portfolios. In Table 12-5 I’vedivided large caps into separate sectors (my preferred approach).I’ve allocated the small- and mid-cap stocks to the value andgrowth pieces. This portfolio is weighted toward value, with theexception of a pretty significant weighting in health care—healthcare is considered a growth play. I’ve also allocated about 50%more to mid- and small-cap stocks than the present weightings inthe total market (Wilshire 5000).
The results show that a very broadly diversified portfolio inlarge-cap sectors, and mid- and small-cap stocks, would have alsobeen more attractive than the total market portfolio, during the
Table 12-4 Hypothetical Equity Portfolio 3
Large-cap value stocks 26%Large-cap growth stocks 8%Mid-cap value stocks 26%Mid-cap growth stocks 7%Small-cap value stocks 26%Small-cap growth stocks 7%
Average annual return (1/84-12/01): 13.50%Standard deviation: 12.34%
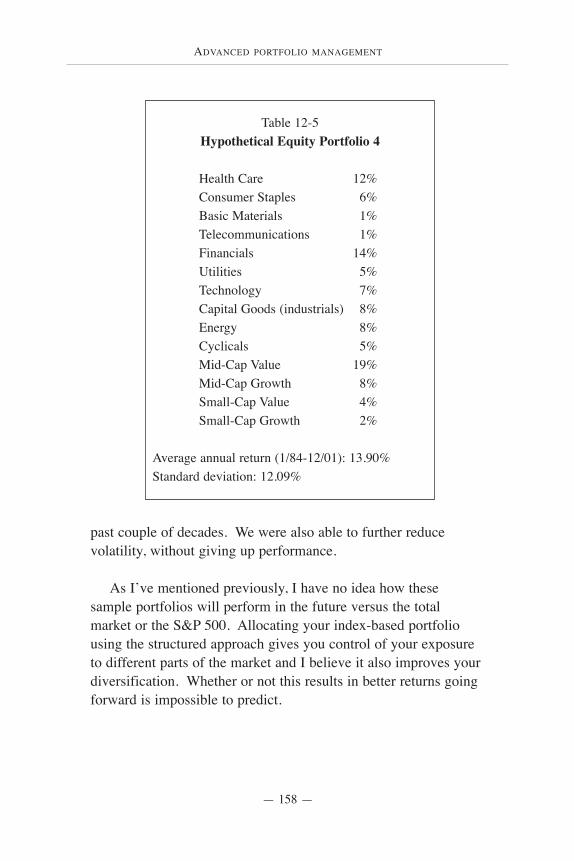
ADVANCED PORTFOLIO MANAGEMENT
— 158 —
past couple of decades. We were also able to further reducevolatility, without giving up performance.
As I’ve mentioned previously, I have no idea how thesesample portfolios will perform in the future versus the totalmarket or the S&P 500. Allocating your index-based portfoliousing the structured approach gives you control of your exposureto different parts of the market and I believe it also improves yourdiversification. Whether or not this results in better returns goingforward is impossible to predict.
Table 12-5 Hypothetical Equity Portfolio 4
Health Care 12%Consumer Staples 6%Basic Materials 1%Telecommunications 1%Financials 14%Utilities 5%Technology 7%Capital Goods (industrials) 8%Energy 8%Cyclicals 5%Mid-Cap Value 19%Mid-Cap Growth 8%Small-Cap Value 4%Small-Cap Growth 2%
Average annual return (1/84-12/01): 13.90%Standard deviation: 12.09%
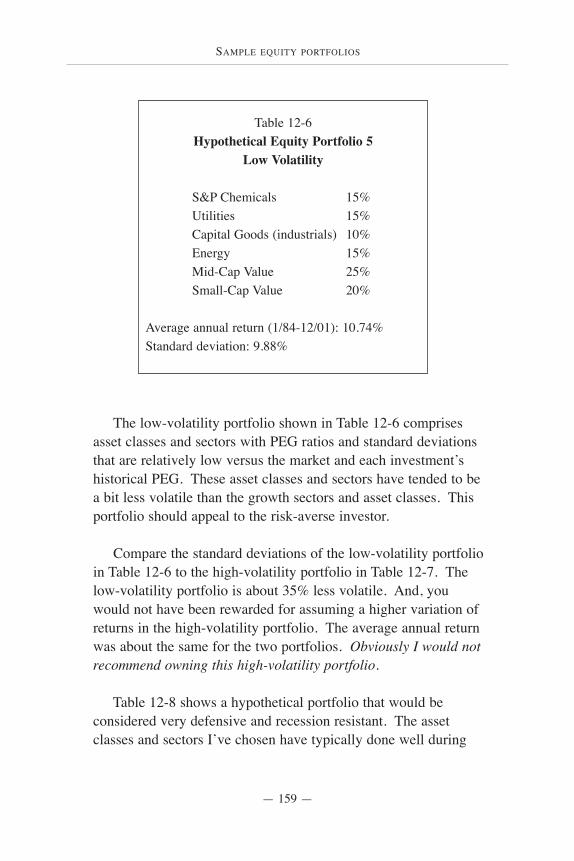
SAMPLE EQUITY PORTFOLIOS
— 159 —
The low-volatility portfolio shown in Table 12-6 comprisesasset classes and sectors with PEG ratios and standard deviationsthat are relatively low versus the market and each investment’shistorical PEG. These asset classes and sectors have tended to bea bit less volatile than the growth sectors and asset classes. Thisportfolio should appeal to the risk-averse investor.
Compare the standard deviations of the low-volatility portfolioin Table 12-6 to the high-volatility portfolio in Table 12-7. Thelow-volatility portfolio is about 35% less volatile. And, youwould not have been rewarded for assuming a higher variation ofreturns in the high-volatility portfolio. The average annual returnwas about the same for the two portfolios. Obviously I would notrecommend owning this high-volatility portfolio.
Table 12-8 shows a hypothetical portfolio that would beconsidered very defensive and recession resistant. The assetclasses and sectors I’ve chosen have typically done well during
Table 12-6 Hypothetical Equity Portfolio 5
Low Volatility
S&P Chemicals 15%Utilities 15%Capital Goods (industrials) 10%Energy 15%Mid-Cap Value 25%Small-Cap Value 20%
Average annual return (1/84-12/01): 10.74%Standard deviation: 9.88%
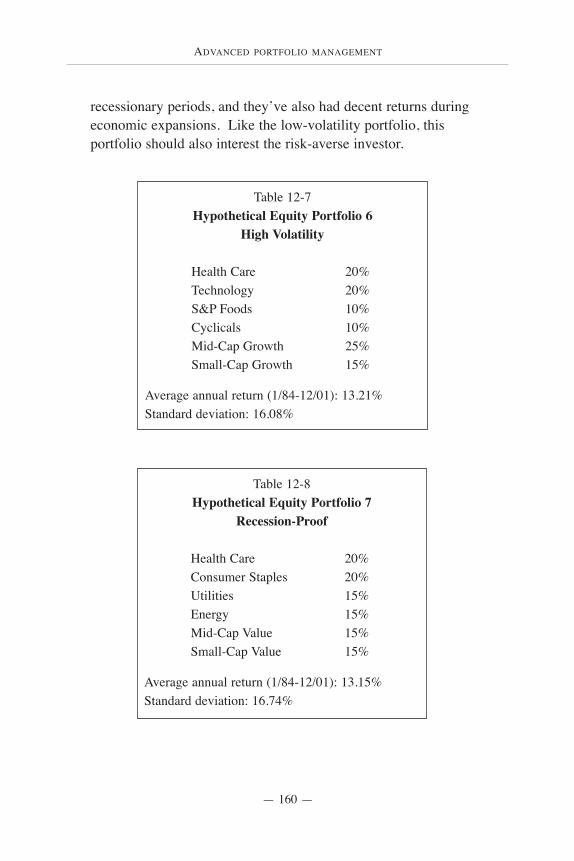
ADVANCED PORTFOLIO MANAGEMENT
— 160 —
recessionary periods, and they’ve also had decent returns duringeconomic expansions. Like the low-volatility portfolio, thisportfolio should also interest the risk-averse investor.
Table 12-7 Hypothetical Equity Portfolio 6
High Volatility
Health Care 20%Technology 20%S&P Foods 10%Cyclicals 10%Mid-Cap Growth 25%Small-Cap Growth 15%
Average annual return (1/84-12/01): 13.21%Standard deviation: 16.08%
Table 12-8 Hypothetical Equity Portfolio 7
Recession-Proof
Health Care 20%Consumer Staples 20%Utilities 15%Energy 15%Mid-Cap Value 15%Small-Cap Value 15%
Average annual return (1/84-12/01): 13.15%Standard deviation: 16.74%
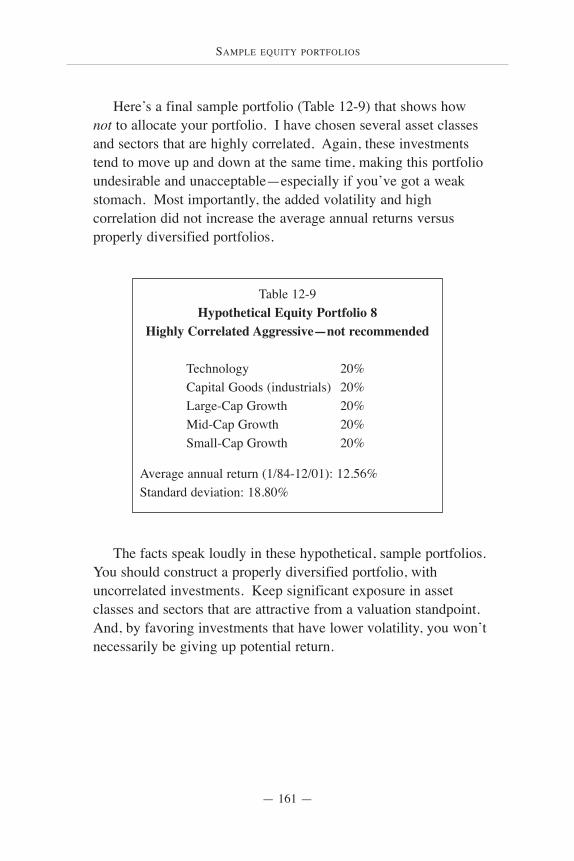
SAMPLE EQUITY PORTFOLIOS
— 161 —
Here’s a final sample portfolio (Table 12-9) that shows hownot to allocate your portfolio. I have chosen several asset classesand sectors that are highly correlated. Again, these investmentstend to move up and down at the same time, making this portfolioundesirable and unacceptable—especially if you’ve got a weakstomach. Most importantly, the added volatility and highcorrelation did not increase the average annual returns versusproperly diversified portfolios.
The facts speak loudly in these hypothetical, sample portfolios.You should construct a properly diversified portfolio, withuncorrelated investments. Keep significant exposure in assetclasses and sectors that are attractive from a valuation standpoint.And, by favoring investments that have lower volatility, you won’tnecessarily be giving up potential return.
Table 12-9 Hypothetical Equity Portfolio 8
Highly Correlated Aggressive—not recommended
Technology 20%Capital Goods (industrials) 20%Large-Cap Growth 20%Mid-Cap Growth 20%Small-Cap Growth 20%
Average annual return (1/84-12/01): 12.56%Standard deviation: 18.80%
ADVANCED PORTFOLIO MANAGEMENT
— 162 —
Disclosure
The hypothetical portfolios in this chapter have been prepared using historicalperformance data. The data was obtained from outside sources and is believed tobe reliable, but there can be no guarantees as to its accuracy or reliability.Estimates presented herein are based on historical performance data and there isno stated or implied guarantee that a rate of return will be realized or that theinvestments presented will perform as indicated in future years. Theperformance displayed herein is hypothetical and was compiled at the end of thetime period 1984-2001. Such results do not represent actual trading.
The exact indexes and sectors in the sample portfolios in this chapter may notbe available for investment and they are not indicative of any particularinvestment.
The time period used in these sample portfolios was limited, due to theunavailability of data prior to 1984. Since the period 1984-2001 represents oneof the best performing stock market periods ever, the hypothetical sampleportfolio returns will more than likely not be indicative of future performance.
BONDS, UNFORTUNATELY YOU’VE GOT TO OWN SOME
— 163 —
I DON’T CARE MUCH FOR BONDS, even though they lookpretty darn attractive these days (when we’re muddling through abear market in stocks). But, bonds deserve a place in almost allportfolios. Let me first address why I don’t like bonds. It’ssimple. After taxes and inflation you can’t build wealth withbonds. The 50-year after-tax, after-inflation average annual returnfor long-term Treasury bonds is 0.8%. For short-term Treasurybills the average annual return is an even more dismal 0.3%. Youcannot grow your assets with a portfolio of bonds, but there aretimes when you should own them, and there is a right way to ownthem.
Bonds, unfortunately you’vegot to own some
The 50-year after-tax, after-inflation averageannual return for long-term Treasury bonds is
0.8%. For short-term Treasury bills the averageannual return is an even more dismal 0.3%.
13
ADVANCED PORTFOLIO MANAGEMENT
— 164 —
When should you own bonds?
1) Your investment time horizon is less than three years. Ifyou don’t have at least 3 years until you need your money, bondsand cash-equivalent investments make sense. We’ve alreadydiscussed the volatility of the stock market and the reasons for notowning stocks if you have less than 3 years to invest. The mainreason for not owning stocks with a short time horizon is that yourmoney may not be in your account when you need it. The stockmarket is too risky with a short-term horizon, so it’s better to parkthis money in short-term bonds and cash equivalents.
2) You are not comfortable owning stocks. Most investors arerisk-averse. They don’t like risk and they don’t like losing money.I believe stock losses within an index-based stock portfolio aretemporary—the stock market has always come back from its lowsto go on to make new highs (it’s just a matter of time). But, someinvestors don’t care what the stock market has done historicallyand they don’t care that over time you will more than likely do farbetter in stocks than you will in bonds or cash. They don’t care,because owning stocks makes them uncomfortable. They maylose sleep thinking about how much their portfolio will droptomorrow and they anguish at the sight of red arrows on CNBC.Owning stocks makes them nauseous. I understand this, and Iwould never recommend stocks to an investor who cannot“stomach” the ups and downs of the market. If you are aninvestor who cannot handle even the slightest loss in any givenmonth on your brokerage statement, you shouldn’t own stocks (orlong-term bonds either). If the thought of losing money (eventemporarily) depresses you and your mood is often determined bywhat the market is doing, please don’t own stocks—it’s not worthit.
Again, if you experience some of the symptoms I’vementioned above, don’t own stocks. If you are retired and you
BONDS, UNFORTUNATELY YOU’VE GOT TO OWN SOME
— 165 —
make the calculation, you may be surprised to learn that you havemore than enough money to not outlive your portfolio—based onyour life expectancy—if you simply invest in bonds. Even afterfactoring in taxes, you may be able to live the rest of your lifecomfortably without any stock ownership. Good for you. Thismeans you have somehow accumulated enough wealth and youcan now choose to live off the income and/or principal from yourfixed-income investments. Would I recommend this strategy formost investors? Of course not. But, you have to invest in a waythat makes you feel comfortable, and if owning only bondsaccomplishes that—so be it.
3) You are impatient. If your investment time horizon is morethan 3 years, I recommend owning stocks—with at least a smallportion of your portfolio. But, even though your time horizon islong enough for you to own a volatile asset class, your investorpersonality may not indicate that you should. Impatient investorshave a very difficult time owning stocks and staying investedduring volatile or declining markets. A get-rich-quick mentalitywill more than likely break you. You need a lot of patience anddiscipline to own stocks and stick with them when they arebeating you up, and you’re losing money. If you’re impatient andseek immediate results—forget about stocks. Short-term bondsmake more sense for the impatient investor.
4) To reduce volatility in your overall portfolio. Bonds aregreat for reducing volatility in a total portfolio. Short-term bondshave a low correlation to stocks. As a result, when your stocksare losing money, your bonds are more than likely performingwell. Thanks to the low correlation and the fact that a portfolio ofshort-term, high-quality bonds will rarely lose money, you willsmooth out the overall volatility of your overall portfolio.
Investors who owned bonds in 2000-2001 probably saw theirbonds far outperform stocks. Stocks got hammered in the last
ADVANCED PORTFOLIO MANAGEMENT
— 166 —
couple of years while bonds did very well, as they appreciatedthanks to lower interest rates. (Bond prices rise when interestrates decline and vice versa). In 2000 alone, yields on 20-yearTreasuries fell from 6.82% to 5.58%, the second lowest year-endlevel since 1967. As interest rates plunged, long-term Treasuryyields came down, and prices shot up. Intermediate-termgovernment bond funds gained 12.5% in 2000 and long-termcorporate bonds gained almost 13%. These were terrific returnsfor bonds, and they were delivered when stocks were droppinglike a stone.
Owning bonds in the past couple of years (or during mostdown years in stocks) looked brilliant. But, those who ownedthem probably did so for safety and security, or because theyneeded their money in the near future—not because theysomehow predicted a fall in interest rates. Regardless, if youcombined some bonds with your stock investments in 2000-2001,it helped reduce the overall volatility of your portfolio. Again,thanks to the low correlation between stocks and bonds, theymake a lot of sense for investors who wish to reduce volatility.
5) You don’t care about your heirs. True, bonds won’t createwealth over the long term. After-tax and after-inflation averageannual returns for bonds are close to nil. But, if you don’t caremuch for your heirs and your life expectancy is relatively short, oryou have enough money to maintain your lifestyle for the rest ofyour life, you may wish to only own bonds. Of course, your heirsmight not be happy with your choice, but maybe you don’t careabout your heirs, or you don’t have any. Anyway, they don’t needto know how you’re invested—it’s your money. So, if you don’tcare about creating more wealth and outpacing inflation for thenext generation, don’t bother with stocks.
6) You want some “safe” money in a reserve fund. Even ifyou believe stocks will outperform bonds over the long run, and

BONDS, UNFORTUNATELY YOU’VE GOT TO OWN SOME
— 167 —
you want most of your money invested in equities, I wouldrecommend you create a reserve fund of short-term, fixed-incomeinvestments and cash equivalents. Your reserve fund will consistof “safe” investments that pay interest and typically preservecapital, regardless of economic conditions. Your reserves shouldbe funded with anywhere from 3 to 5 years of income needs.Very conservative investors may want up to 10 years of incomeneeds in a reserve fund. For example, if you need $100,000 inannual income to maintain your lifestyle, I would advise investingbetween $300,000 and $500,000 in short-term, fixed-incomeinvestments. By having 3 to 5 years of living expenses set aside,this should allow you to get through a pretty horrendous bearmarket (the average bear market lasts 3 years) without having tosell stocks to meet your income needs.
Setting up a reserve fund is a great way for conservativeinvestors to cope with the ups and downs of the stock market, andstill stay invested in stocks for the long haul. By having enoughmoney set aside to cover several years or more of living expenses,these reserves can often keep jittery investors from panicking andselling stocks near the bottom of a bear market cycle. It alsocushions the overall portfolio from more serious declines, when abear market hits. I believe a reserve fund makes sense for almostall retirees and for younger investors who are not comfortablehaving all their money in stocks.
Please note that I did not include “for income” as one of thereasons you should own bonds. Many investors buy only bondsthinking they are being very prudent. They think they are goingto live off the income and not touch their principal, forever. Well,they will be sorry for two main reasons: 1) After-tax bondreturns barely keep pace with inflation. If we average 3% annualinflation, the purchasing power of the income you receive fromyour bonds is cut by 25% after 10 years, and 50% afterapproximately 23 years. So, if you spend all your income and
ADVANCED PORTFOLIO MANAGEMENT
— 168 —
you’re only left with your principal later in life, you will have losta lot of purchasing power. The after-inflation, average annualreturns for long-term bonds is about 2%. For stocks it’sapproximately 7%. 2) Bond income is taxable as ordinaryincome. If you own taxable bonds and you are in the highest taxbracket, this can hurt. You can lose nearly half of your measlyyield to taxes. With long-term capital gains taxes now 20% at thefederal level, and ordinary income tax rates at just under 40%, itmakes more sense to sell some stocks, pay long-term capital gainstaxes, and create income flow that way. At least by owning stocksyou have a chance to outpace inflation and taxes—with bonds yougive up all hope.
How to invest in bonds—two good choices
1) Index your bond portfolio
Active bond managers have a really tough time beating theindexes. The higher fees associated with actively managed bondfunds make it very difficult for bond managers to outperform theirbenchmarks. Michael Santoli of Barron’s brought the fee questioninto better perspective—
“...the average bond fund manager with any pridemight be moved to insist that he and his firm aregrossly overpaid. You see, if investors could beconvinced that the manager’s take is simply toogenerous, they might then believe that’s the onlyreason that actively managed bond funds fare sopoorly compared to bond index portfolios. Otherwise,the highly trained and well-paid fund captain wouldhave to confess to simply not being bright enough todo better than the index trackers.”
BONDS, UNFORTUNATELY YOU’VE GOT TO OWN SOME
— 169 —
It’s unfortunate the investing public knows very little about themerits of indexing bond portfolios. Actively managed bond fundscharge, on average, double what bond index funds charge (.96%annually versus .42%), and you can find bond index funds thatcharge as low as .20%.
My main argument for indexing a bond portfolio is lower fees.Lower fees account for much of the “extra” performance thatVanguard’s bond index funds gave investors during recent years.Their fund expenses stand around .20% annually and the result istop-performing funds. Through June 30, 2001, the four bondindex funds they offer—Vanguard Total Bond Market, VanguardShort Bond Index, Vanguard Intermediate Bond Index andVanguard Long Bond Index—were all in the top 7% of theirrespective categories over the past 5 years, according to Barron’s.Low fees give bond indexers a great advantage.
If you choose to index your bond portfolio, consider fundsfrom these companies—Charles Schwab & Co., Inc., TheVanguard Group and Dimensional Fund Advisors.
2) Ladder individual bonds
Some investors like having more control than a bond indexmutual fund offers. They want to know exactly when their bondsare maturing and they want a predictable income stream—youcan’t do this with bond mutual funds. With high qualityindividual bonds, you can be fairly certain of receiving a givenamount of interest income, and a return of your principal when thebonds mature. Bond funds have no effective maturity date and asomewhat unpredictable income stream. Much more on ladderingin Chapter 14.
ADVANCED PORTFOLIO MANAGEMENT
— 170 —
Ladder or index, which is better?
For investors who have in excess of $100,000 to invest inindividual bonds, laddering is the way to go. It requires morework, but it gives you more control of your portfolio, apredictable income stream and a return of principal schedule.Bond index funds are an excellent alternative for investors whodon’t have enough money, or who don’t want to do the extra workrequired with the laddered approach. Bond index funds are prettydarn inexpensive, and, the work is done for you. You also getexcellent diversification and professional management. Still, Ithink you should take the time to create your own laddered bondportfolio.
Which individual bonds should you own?
Treasury securities
Treasury securities—bills, notes and bonds are issued andbacked by the U.S. government and are therefore extremely safe.Treasuries typically provide the lowest yields available, since theyare backed by the “full faith and credit” of the U.S. government,and are deemed to have no credit risk. The primary advantage ofTreasuries is their safety. Most investors buy them simply topreserve capital. But, they have other advantages. They areavailable with a wide range of maturity dates and they arenoncallable. (The Treasury has not issued “callable” Treasuriessince 1985.) Last, the interest earned on Treasuries is exemptfrom state and local income taxes (but not federal taxes).Investors in high-tax states should take note.
Corporate bonds
Corporate bonds are IOUs or debt obligations issued bycorporations. Companies will use the money you lend them for
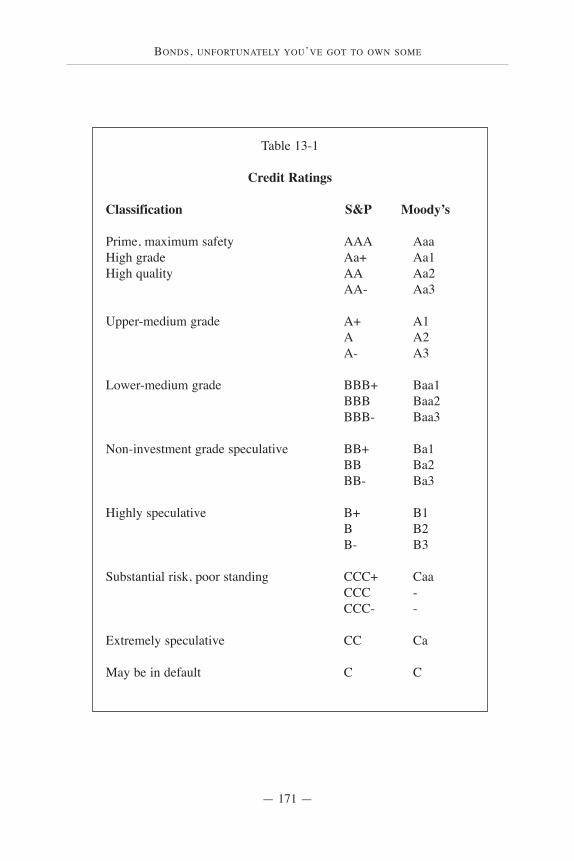
BONDS, UNFORTUNATELY YOU’VE GOT TO OWN SOME
— 171 —
Table 13-1
Credit Ratings
Classification S&P Moody’s
Prime, maximum safety AAA AaaHigh grade Aa+ Aa1High quality AA Aa2
AA- Aa3
Upper-medium grade A+ A1A A2A- A3
Lower-medium grade BBB+ Baa1BBB Baa2BBB- Baa3
Non-investment grade speculative BB+ Ba1BB Ba2BB- Ba3
Highly speculative B+ B1B B2B- B3
Substantial risk, poor standing CCC+ CaaCCC -CCC- -
Extremely speculative CC Ca
May be in default C C
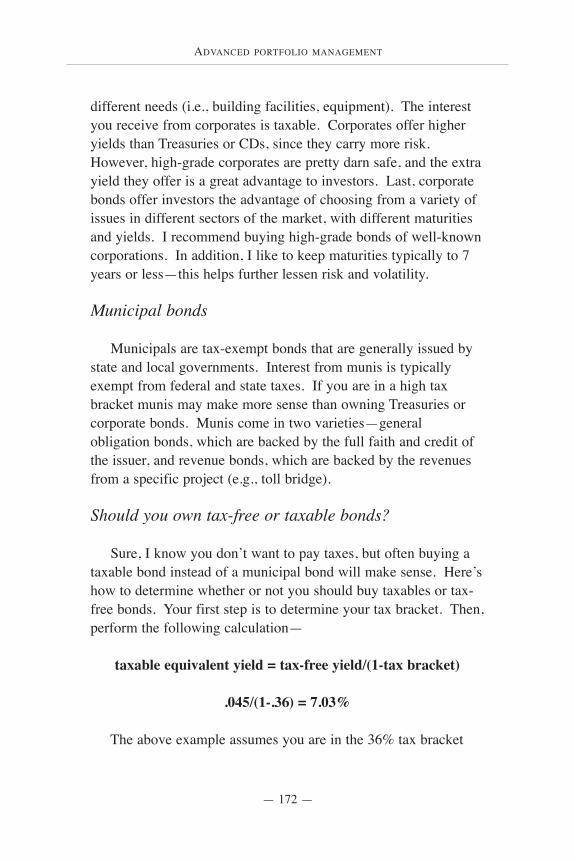
ADVANCED PORTFOLIO MANAGEMENT
— 172 —
different needs (i.e., building facilities, equipment). The interestyou receive from corporates is taxable. Corporates offer higheryields than Treasuries or CDs, since they carry more risk.However, high-grade corporates are pretty darn safe, and the extrayield they offer is a great advantage to investors. Last, corporatebonds offer investors the advantage of choosing from a variety ofissues in different sectors of the market, with different maturitiesand yields. I recommend buying high-grade bonds of well-knowncorporations. In addition, I like to keep maturities typically to 7years or less—this helps further lessen risk and volatility.
Municipal bonds
Municipals are tax-exempt bonds that are generally issued bystate and local governments. Interest from munis is typicallyexempt from federal and state taxes. If you are in a high taxbracket munis may make more sense than owning Treasuries orcorporate bonds. Munis come in two varieties—generalobligation bonds, which are backed by the full faith and credit ofthe issuer, and revenue bonds, which are backed by the revenuesfrom a specific project (e.g., toll bridge).
Should you own tax-free or taxable bonds?
Sure, I know you don’t want to pay taxes, but often buying ataxable bond instead of a municipal bond will make sense. Here’show to determine whether or not you should buy taxables or tax-free bonds. Your first step is to determine your tax bracket. Then,perform the following calculation—
taxable equivalent yield = tax-free yield/(1-tax bracket)
.045/(1-.36) = 7.03%
The above example assumes you are in the 36% tax bracket
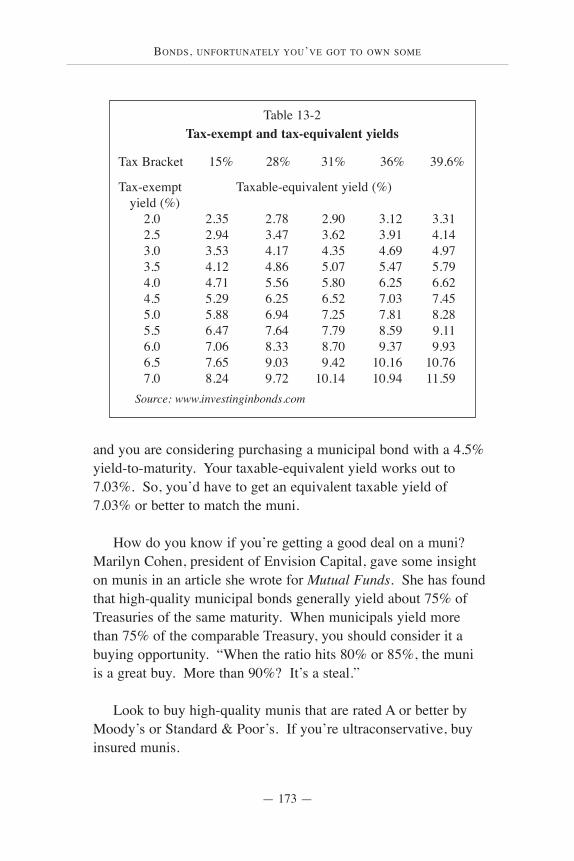
BONDS, UNFORTUNATELY YOU’VE GOT TO OWN SOME
— 173 —
and you are considering purchasing a municipal bond with a 4.5%yield-to-maturity. Your taxable-equivalent yield works out to7.03%. So, you’d have to get an equivalent taxable yield of7.03% or better to match the muni.
How do you know if you’re getting a good deal on a muni? Marilyn Cohen, president of Envision Capital, gave some insighton munis in an article she wrote for Mutual Funds. She has foundthat high-quality municipal bonds generally yield about 75% ofTreasuries of the same maturity. When municipals yield morethan 75% of the comparable Treasury, you should consider it abuying opportunity. “When the ratio hits 80% or 85%, the muniis a great buy. More than 90%? It’s a steal.”
Look to buy high-quality munis that are rated A or better byMoody’s or Standard & Poor’s. If you’re ultraconservative, buyinsured munis.
Table 13-2Tax-exempt and tax-equivalent yields
Tax Bracket 15% 28% 31% 36% 39.6%
Tax-exempt Taxable-equivalent yield (%)yield (%)
2.0 2.35 2.78 2.90 3.12 3.312.5 2.94 3.47 3.62 3.91 4.143.0 3.53 4.17 4.35 4.69 4.973.5 4.12 4.86 5.07 5.47 5.794.0 4.71 5.56 5.80 6.25 6.624.5 5.29 6.25 6.52 7.03 7.455.0 5.88 6.94 7.25 7.81 8.285.5 6.47 7.64 7.79 8.59 9.116.0 7.06 8.33 8.70 9.37 9.936.5 7.65 9.03 9.42 10.16 10.767.0 8.24 9.72 10.14 10.94 11.59
Source: www.investinginbonds.com
ADVANCED PORTFOLIO MANAGEMENT
— 174 —
IF YOU DECIDE TO BUY INDIVIDUAL bonds, I wouldrecommend laddering your portfolio. Laddering involves buildinga portfolio with staggered maturities so that some of your bondsmature every year or two. For the ladder to work, you must buyequal amounts of individual bonds that mature over a definedperiod. When the shortest bond matures it is typically replaced bypurchasing an equal amount of the longest maturity.
Here’s how laddering works. First, you buy a series ofTreasury notes, for example, with different maturities. You buyfive Treasuries with maturities between 1 and 5 years, with a note
Bond laddering—my preferredapproach to owning bonds
Laddering is an excellent way to limit yourexposure to rising rates.
Historically the strategy of laddering bonds in theportfolio has resulted in less volatility over time when
compared with individual securities of comparable maturity.—GEORGE STRICKLAND
Thornburg Investment Management
14

BOND LADDERING—MY PREFERRED APPROACH TO OWNING BONDS
— 175 —
maturing each year. As each note matures, you reinvest theproceeds (or you may decide to spend the money) in another 5-year note to keep the ladder going. It’s a very simple process.
Advantages of a laddered bond portfolio—
1) Control. By structuring your own bond ladder you cancontrol your maturities and income stream. Again, a bond funddoes not have an effective maturity, since you are basically buyinga piece of many, many bonds (more diversification but lesscontrol and no fixed maturities). With individual bonds you knowexactly what you are getting if you hold your bonds to maturity.You’ll get your principal back at maturity—unless the issuerdefaults—and you can decide at that time whether or not toreinvest the proceeds to extend your ladder.
2) Lessen risk. A short-maturity bond ladder will lessen risk.If bond yields are down, you’ll be happy your outstanding bondsare locked in at higher rates. If yields are up, the proceeds fromyour maturing bonds can be reinvested at the higher yields. Bydiversifying a laddered portfolio of short-term bonds, you smoothout the overall volatility of your bond portfolio and thereforelessen risk.
3) Reinvest proceeds at higher rates. You can reinvest theprincipal from maturing short-term bonds (low-yields) withlonger-term bonds (higher yields). In this way, you effectively geta better yield than by owning a portfolio of only very short-termbonds. By reinvesting your maturing bonds each year—depending on the type of ladder you have built—you can lock inhigher yields each year on the longer maturities.
For any of the three different ladders shown in Tables 14-1through 14-3, the strategy is the same. When you initially set upyour bond ladder, you take the total dollar amount to be invested
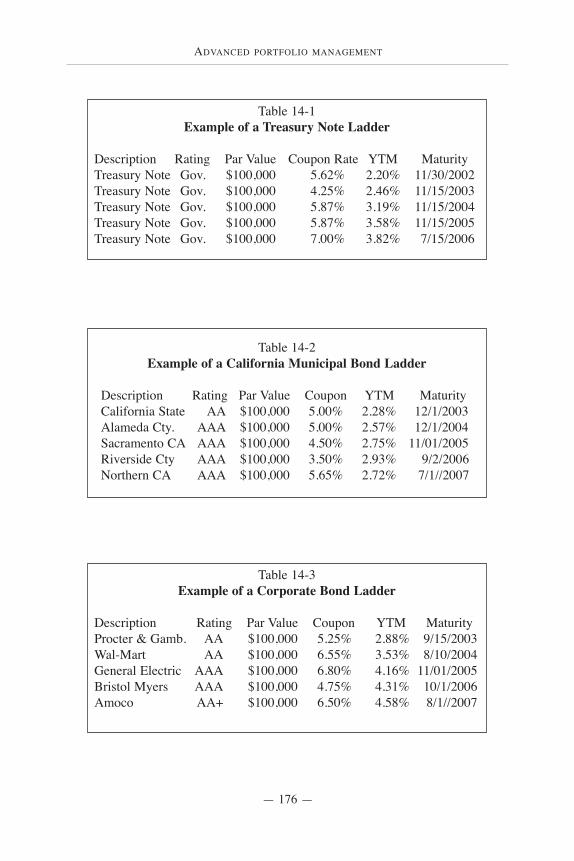
ADVANCED PORTFOLIO MANAGEMENT
— 176 —
Table 14-1Example of a Treasury Note Ladder
Description Rating Par Value Coupon Rate YTM MaturityTreasury Note Gov. $100,000 5.62% 2.20% 11/30/2002Treasury Note Gov. $100,000 4.25% 2.46% 11/15/2003Treasury Note Gov. $100,000 5.87% 3.19% 11/15/2004Treasury Note Gov. $100,000 5.87% 3.58% 11/15/2005Treasury Note Gov. $100,000 7.00% 3.82% 7/15/2006
Table 14-2Example of a California Municipal Bond Ladder
Description Rating Par Value Coupon YTM MaturityCalifornia State AA $100,000 5.00% 2.28% 12/1/2003Alameda Cty. AAA $100,000 5.00% 2.57% 12/1/2004Sacramento CA AAA $100,000 4.50% 2.75% 11/01/2005Riverside Cty AAA $100,000 3.50% 2.93% 9/2/2006Northern CA AAA $100,000 5.65% 2.72% 7/1//2007
Table 14-3Example of a Corporate Bond Ladder
Description Rating Par Value Coupon YTM MaturityProcter & Gamb. AA $100,000 5.25% 2.88% 9/15/2003Wal-Mart AA $100,000 6.55% 3.53% 8/10/2004General Electric AAA $100,000 6.80% 4.16% 11/01/2005Bristol Myers AAA $100,000 4.75% 4.31% 10/1/2006Amoco AA+ $100,000 6.50% 4.58% 8/1//2007
BOND LADDERING—MY PREFERRED APPROACH TO OWNING BONDS
— 177 —
in the ladder, and divide it by the number of years in the ladder, or some variation. The bonds shown in these examples have onebond maturing every year, but your portfolio could differ—onebond maturing every 6 months, two years or whatever incomestream you need.
Once your bond ladder is in place, simply hold your bonds andcollect your interest until your first bond matures. You can theneither spend the money, extend your ladder out again, or invest theproceeds in the stock market—if your stock allocation is belowyour initial target.
For every $100,000 you have to invest, I would recommendowning 4 to 6 different bonds. This will give you decentdiversification. Investors with over $1 million in bonds shouldown 30 to 40 bonds. The key is to stay as diversified as possible.And, diversify your bonds with different issuers and in differentsectors of the market—don’t have your entire bond portfolio inone sector (e.g., banks).
Other considerations
Interest rate risk
If you own a bond that is paying you $500 annually (5%) anda similar bond is now being issued and paying $300 annually(3%), your bond will be worth more to someone. Investors willbe willing to pay you a premium for your higher yielding bond,since bonds at present rates are paying much less. This describesthe inverse relationship between bond prices and interest rates. Inthis example, interest rates have declined and your bond pricewent up—someone will now pay you more for your higheryielding bond.
On the other hand, if you own the same bond (5%) and a
ADVANCED PORTFOLIO MANAGEMENT
— 178 —
similar bond is now paying 8%, your bond will be less attractiveto investors. The price of your bond will fall as interest rates rise.This is what is called interest rate risk. I try to keep interest raterisk to a minimum by buying bonds with short maturities sincethey are less volatile than longer-term maturities. Of course, ifyou simply hold your bonds to maturity, it doesn’t matter howvolatile they are—you’ll eventually get your principal back(assuming no default). But, if you own bonds that have a longmaturity date of perhaps more than 7 years, your bond prices willfluctuate with prevailing interest rates. And, if you may needsome of that money before maturity—you are forced to sell yourbonds—you may lose money, since investors won’t be willing topay you “full price” for your bonds. Keep your maturities short,especially if you may need to liquidate your bonds prior tomaturity.
Yield-to-maturity
The best way to compare bonds with differing coupon ratesand prices is by looking at yield-to-maturity. Yield-to-maturitygives you the total return you will receive by buying and holdinga bond until it matures. Basically, the coupon rate that a bond ispaying isn’t important, because the price of the bond will adjustdepending on the coupon and prevailing rates. The yield tomaturity factors in the price you are paying and all interestpayments until maturity.
Call provisions
Some bonds have redemption, or “call” provisions that allowor require the issuer to repay the investor’s principal at a specifieddate before maturity. Bonds are usually “called” when presentrates have dropped significantly since the bonds were issued. Iprefer not to buy callable bonds, so I can be certain I will lock ina defined yield and maturity date. I don’t want to sit around
BOND LADDERING—MY PREFERRED APPROACH TO OWNING BONDS
— 179 —
wondering if my bonds will be called. Callability is basically abad word. If rates fall and your bonds get “called away,” you’llbe stuck reinvesting at lower rates. And, if your bonds don’t getcalled away, well, then rates are probably better than what you’regetting. If you buy callable bonds, look at the yield-to-callmaturity to determine what rate you’ll be getting if they’re called.At least you’ll know your worst-case-scenario yield. But, you stillwon’t know if your bonds are going to be called or not.
Short durations
As I’ve already mentioned, I think it is a good idea to own aladdered-bond portfolio with short durations (time to maturity).Shorter duration bonds carry less risk (volatility). When interestrates are volatile, bonds with 1- to 2-year maturities will barelybudge. Longer-term bonds are really vulnerable to interest ratespikes. You may get a higher yield with long-term maturities, butyou pay the price with the extra risk of loss—unless you holdthem to maturity.
Ginnie Maes
Ginnie Maes (Government National Mortgage Association) arebacked by pools of mortgages. Principal and interest areguaranteed by the federal government. There is not really anycredit risk in owning Ginnie Maes, but there is interest rate riskand there is a lot of unpredictability. When interest rates drop,generally homeowners refinance their mortgages. As a result,investors in mortgage-backed securities may get a chunk of theirprincipal back. They presumably have to reinvest this money atlower rates. This is why I typically do not recommend GinnieMaes. With mortgage-backed securities you have bothunpredictability of returns and you don’t know when you will getyour principal back.
ADVANCED PORTFOLIO MANAGEMENT
— 180 —
Out-of-state municipals
Many investors completely ignore municipals that are tradingin a state other than their residency. But, you shouldn’t ignoreout-of-state bonds simply because you will be taxed in your state.If the extra yield is there for a similar quality bond with the samematurity, it can make sense.
Suppose, for example, a California resident wants to comparea Texas muni with an in-state muni. The in-state muni yields6.2% (tax free), while the out-of-state muni yields 6.6%. Here’show to determine which bond is more attractive. Subtract theCalifornia state tax from 100% (assume 9% tax in California).Multiply the out-of-state yield by your answer. This is the amountyou would receive, net of paying the California state tax.
100% - 9% = 91% 6.6% x .91 = 6.0%
So, in this example, the net, after-tax yield for the Texasmunicipal bond is 6.0%. The California bond is more attractive,since it yields 6.2%.
Municipal bond insurance
Municipal bond insurance protects investors by insuring thatthey will get timely payment of their interest and principal by theinsurer, if the issuer happens to defaults. Most insurance alsoincludes such risks as earthquakes, floods and other naturaldisasters. Insured municipal bonds automatically receive thehighest rating possible—based on the claims-paying ability of theinsurer.
PORTFOLIO REBALANCING TO CONTROL RISK
— 181 —
REBALANCING INVOLVES RESTORING A PORTFOLIO toits original target allocations. This is typically accomplished bytaking money from the asset classes that have been performing thebest and investing it in the underperformers. Essentially, any formof rebalancing is based on the belief that asset class performancereverts to a mean. Reversion-to-mean states that any asset classthat has underperformed or lagged the other pieces of theportfolio, will eventually “regress to the mean” and perform betterthan the other asset classes.
Portfolio rebalancing to control risk
Rebalancing forces you to buy low and sell high—it’s the only form of market timing that works.
—WILLIAM BERNSTEIN, author The Intelligent Asset Allocator
By setting a pattern of rebalancing every year, clients become accustomed to skimming profits off winners and
depositing them into laggards. From this perspective, it’s possible clients may look at poorly performing assets in a more positive light—specifically as a buying opportunity.CRAIG L. ISRAELSEN, PH.D.—author, The Thrifty Investor
15
ADVANCED PORTFOLIO MANAGEMENT
— 182 —
I rebalance portfolios to help manage risk and volatility in aportfolio. You could argue that rebalancing also increases returns,but that is not my focus, since better performance is not a given.Rebalancing has, however, proven itself as a great strategy toreduce risk in a portfolio, and this is obviously very important, forall investors.
Here’s how rebalancing works. First, you set a predeterminedtarget allocation for each investment in your portfolio. Forexample, let’s say you decide to invest 15% in the large-capfinancial sector—this is your predetermined target allocation.Then, you monitor this position—along with the rest of yourportfolio—to make sure you stay close to your target allocation.Again, the idea is to control risk and volatility, so if the financialsector becomes overweight in your portfolio, you are alerted andcan bring its percentage weighting back to your original target.Again, with this process, money is typically taken from the betterperforming investments and reinvested in the laggards.
Applying the 5/25 Rule
I briefly mentioned the 5/25 Rule earlier in this book. Thisrebalancing rule is one of the cornerstones of successful investing.The rule basically states that as a sector or asset class movesbeyond its target allocation by an absolute 5% amount, or 25% ofthe original target, rebalancing should be considered.
The absolute 5% rule works as follows—suppose you set atarget of 15% for small-cap value. If your small-cap valueholding dropped below 10% of your total portfolio, or increasedto over 20% (15 - 5, or 15 + 5), you would rebalance. This is anexample of an absolute 5% move (5% on either side of your targetallocation). The 25% rule, on the other hand, would be triggered,in this example, if small-cap value had risen or fallen by only3.75% (25% of 15%). So, 25% of 15% on the upside would be
PORTFOLIO REBALANCING TO CONTROL RISK
— 183 —
equal to a maximum target allocation of 18.75% (15% x 1.25 =18.75%) and 11.25% would be our minimum target allocation(15% x .75).
When you employ the 5/25 Rule, you should act if either rule istriggered. In the above example, the 25% rule would come intoplay first, since an absolute 5% move indicates you would onlyrebalance if small-cap value increased to 20%, or decreased to10% of the portfolio. The 25% rule kicked in first, since itindicated that if small-cap value increased beyond 18.75%, ordecreased below 11.25% of the portfolio, you should rebalance.Again, rebalance if either the 5%, or the 25% rule, is triggered.
An absolute 5% move is usually only seen in very broad assetclasses, not individual sectors. For example, if your target forfixed income is 30% of your portfolio, then if your total fixed-income portfolio exceeds 35% (30 + 5) or falls below 25% (30 -5) then you would rebalance. In this example, with the 25% rule,you should only rebalance if your fixed income assets movebeyond 37.5% (30% x 1.25, a 25% move on the upside) or below22.5% (30% x .75, a 25% move on the downside). So, in thiscase, the absolute 5% rule would be hit before the 25% rule.
Again, rebalancing should be performed periodically to lessenthe overall volatility of your portfolio and to control risk. Irecommend reviewing your targets at least quarterly, but if themarkets (stock or bond) have been particularly volatile, it makessense to perform a checkup more often. You don’t want yourportfolio to become too heavily weighted in any given asset classor sector. Rebalancing serves as a way to keep this in check. Bysetting target allocations you are forced to stay disciplined andunemotional about the process. And, it actually forces you to“buy low and sell high” since you take money from betterperforming asset classes and reinvest it in laggards.
ADVANCED PORTFOLIO MANAGEMENT
— 184 —
Rebalancing is not an exact science. There is some “art”involved, and there is certainly room for creativity. Feel free tocome up with your own version of the 5/25 Rule. Who’s to saythe 4/24 Rule isn’t better? Employ whatever guidelines you feelmake sense for you, and use some creativity when determiningexactly how and when you are going to rebalance an asset class.Be sure to factor in all taxes and transaction costs before makingany changes.
No-trade zones and flexibility
I implement “no-trade zones” that indicate the boundaries foracceptable movement of the asset class or sector. Often, if leftalone, the investment will revert back to its original targetallocation. This no-trade zone gives the investment some room tomove. It can also save commissions, since you may have lowerturnover in your portfolio.
Depending on your situation and preferences, you may want toapply some additional creativity when rebalancing. For example,instead of always rebalancing back to your original target, youmay decide to only bring the investment allocation back, or up, toits maximum or minimum target. Here’s an example—let’sassume your original target allocation for small-cap value was10% of your total portfolio. You set your original allocation at10% and, using the 5/25 Rule, your minimum target was 7.5%and your maximum target was 12.5%. Let’s assume small-capvalue moved beyond 12.5% of your portfolio, in a sudden surge.But, let’s also assume that based on valuation measurements youstill thought small-cap value represented a good value. So, in thiscase, you may decide to simply rebalance back to your maximumtarget of 12.5%, not your original 10% target. Remember, this isnot an exact science. No-trade zones are guides. Use somecreativity in your planning.
PORTFOLIO REBALANCING TO CONTROL RISK
— 185 —
Obviously you should not rebalance too often. Taxes andtrading commissions need to be considered before making anychanges. Apart from potential tax implications and transactionfees, if you rebalance too often you may be taking money fromyour winners too quickly. Typically, different asset classes are inand out of favor during different periods of the economic cycle.And, these periods, although somewhat unpredictable, usually runtheir course for several years or more. So, if you’ve rebalancedand put money into the underperforming asset classes—hoping fora reversion-to-mean scenario—give the asset class some time tostart outperforming relative to the other asset classes that you justtrimmed. And, when it starts to recover, allow it some time toappreciate. Again, there is not really a strict rule as to how oftenyou should rebalance, but I would recommend at least annually—perhaps more often if the markets are particularly volatile. Ifyou’re rebalancing a taxable account, I would try to wait at least ayear before you take profits—to drop into the lower long-termcapital gains category. But, if the market has moved considerablybeyond your target, I would probably suggest scaling backsomewhat—even if it means getting hit with a short-term taxablegain. Much will depend on your personal tax and financialsituation and your tolerance for risk.
Rebalancing taxable and tax-deferred accounts
If new money is not available to rebalance a taxable account,tax planning becomes critical. My portfolio management softwareallows me to track cost basis by tax lot (not averaged) for myclients. This allows me and the client to identify the shares to berebalanced that give the best tax results in taxable accounts. Ifyou have purchased an investment at different times over theyears—probably the case if you have been rebalancing into anunderperformer—you’ll have a different cost basis for eachpurchase that you made. By tracking each purchase and cost basisseparately, you can choose to sell the “lot” that shows a loss, or
ADVANCED PORTFOLIO MANAGEMENT
— 186 —
the smallest gain. If you have no losses in the asset class you areselling, be sure to sell the piece that qualifies for a long-term gain.Furthermore, if you have no lots that show long-term gains, butyou are close to the 12-month long-term holding period, you maywish to delay your sale until the lot qualifies as a long-term gain.
Obviously, rebalancing is best suited for assets in a tax-deferred plan like an IRA Rollover or 401(k) account. But, not allinvestors have assets in tax-deferred accounts, and even if they do,the core of their assets may be in taxable accounts. If you haveenough money in a tax-deferred account—perhaps 30% to 40% ofyour total assets—you can conduct all your rebalancing in yourtax deferred account. Your tax advisor will love you for allowingyour unrealized gains to increase in your taxable account, andyou’ll still be controlling risk and volatility in your total portfolioby making most of your changes in your tax-deferred account.
Rebalancing at work
The portfolio management software I use allows me to trackmy portfolios and rebalancing schedules very easily. I haveincluded several examples here for your review. As you can seein Tables 15-1 through 15-3, I have set a target percentageallocation for each asset class in the portfolio. I have alsodetermined a maximum and minimum acceptable range for eachinvestment—here I have employed the 5/25 Rule to determine therange. If one of the investments becomes under- or overweightdue to market volatility, I am alerted by my software program—ithighlights the asset class in bold. The program also tells meexactly what percentage I am under- or overweight in the holding,and the dollar amount to buy and sell. It even tells me the numberof shares I should buy or sell to get the portfolio back “inbalance.”
PORTFOLIO REBALANCING TO CONTROL RISK
— 187 —
If you manage your own money, you should set up your ownrebalancing schedule with a spreadsheet program, and track yourportfolio on a regular basis. Your rebalancing schedule willhopefully keep you disciplined and unemotional about thisprocess. Sure, you can apply some flexibility. But, don’t allowyour portfolio to stay out of balance for long, since you will beassuming more risk than you originally intended.
Hypothetical Portfolio 1
Hypothetical Portfolio 1 shows a total portfolio that wasoriginally allocated at 20% fixed income and 80% in equities.When looking at this rebalancing schedule (Table 15-1), you cansee that, at present, fixed income represents 18.48% of the totalportfolio. While this is below our original target, it is still withinthe no-trade zone that we established. The software program doesmost of the work for us. And it gives us a lot of details. It tells usthat on the fixed-income portfolio, if we wanted to bring ourallocation back to our original target of 20%, we would have topurchase 4,781 additional shares of the long-term bond fund(share difference). It also tells us the dollar variance, whichindicates we need to add $49,241 to this piece.
On the equity portion of this portfolio, you can see that thecyclical/transports sector has increased from its original target of8% of the portfolio to 9.33%. The schedule tells us that thispercentage is still within an acceptable boundary, but if itsweighting moves beyond 10% of the total portfolio, we shouldconsider rebalancing. You can also see that the financial sectorhasn’t performed very well. Its present weighting of 6.91% isbelow the original target of 7.5%. Again, this is still acceptable,so given our no-trade-zone boundaries, we decide to do nothingwith this portfolio.
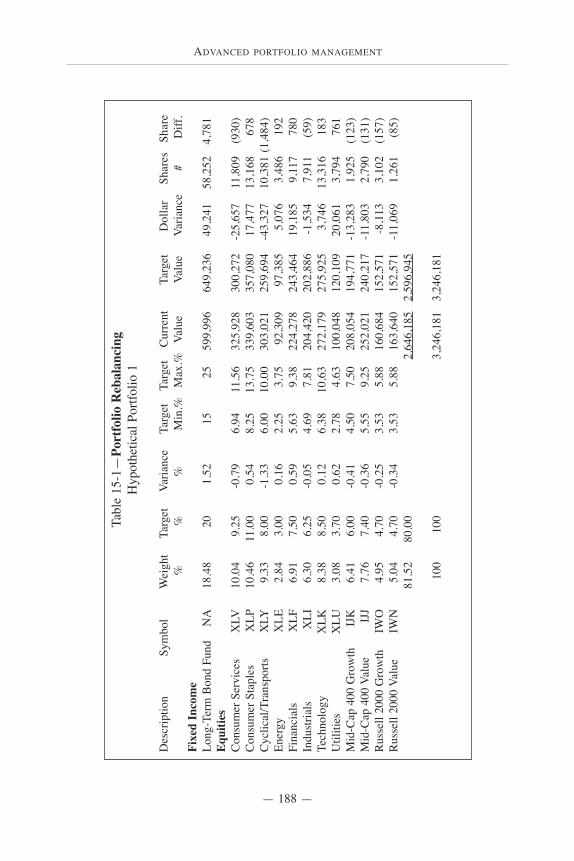
ADVANCED PORTFOLIO MANAGEMENT
— 188 —
Tabl
e 15
-1—
Port
folio
Reb
alan
cing
Hyp
othe
tical
Por
tfolio
1
Des
crip
tion
Sym
bol
Wei
ght
Ta
rget
V
aria
nce
T
arge
t T
arge
t C
urre
nt
T
arge
t
Dol
lar
Sh
ares
Sh
are
%
%
%
Min
.%
Max
.%
Valu
e
Valu
e
Var
ianc
e#
Diff
. Fi
xed
Inco
me
Long
-Ter
m B
ond
Fund
NA
18.4
820
1.52
1525
599,
996
649,
236
49,2
4158
,252
4,78
1Eq
uitie
sC
onsu
mer
Ser
vice
sX
LV10
.04
9.25
-0.7
96.
9411
.56
325,
928
300,
272
-25,
657
11,8
09(9
30)
Con
sum
er S
tapl
esX
LP10
.46
11.0
00.
548.
2513
.75
339,
603
357,
080
17,4
7713
,168
678
Cyc
lical
/Tra
nspo
rtsX
LY9.
338.
00-1
.33
6.00
10.0
030
3,02
125
9,69
4-4
3,32
710
,381
(1,4
84)
Ener
gyX
LE2.
843.
000.
162.
253.
7592
,309
97,3
855,
076
3,48
619
2Fi
nanc
ials
XLF
6.91
7.50
0.59
5.63
9.38
224,
278
243,
464
19,1
859,
117
780
Indu
stria
lsX
LI6.
306.
25-0
.05
4.69
7.81
204,
420
202,
886
-1,5
347,
911
(59)
Tech
nolo
gyX
LK8.
388.
500.
126.
3810
.63
272,
179
275,
925
3,74
613
,316
183
Util
ities
XLU
3.08
3.70
0.62
2.78
4.63
100,
048
120,
109
20,0
613,
794
761
Mid
-Cap
400
Gro
wth
IJK
6.41
6.00
-0.4
14.
507.
5020
8,05
419
4,77
1-1
3,28
31,
925
(123
)M
id-C
ap 4
00 V
alue
IJJ
7.76
7.40
-0.3
65.
559.
2525
2,02
124
0,21
7-1
1,80
32,
790
(131
)R
usse
ll 20
00 G
row
thIW
O4.
954.
70-0
.25
3.53
5.88
160,
684
152,
571
-8,1
133,
102
(157
)R
usse
ll 20
00 V
alue
IWN
5.04
4.70
-0.3
43.
535.
8816
3,64
015
2,57
1-1
1,06
91,
261
(85)
81.5
280
.00
2,64
6,18
52,
596,
945
100
100
3,24
6,18
13,
246,
181
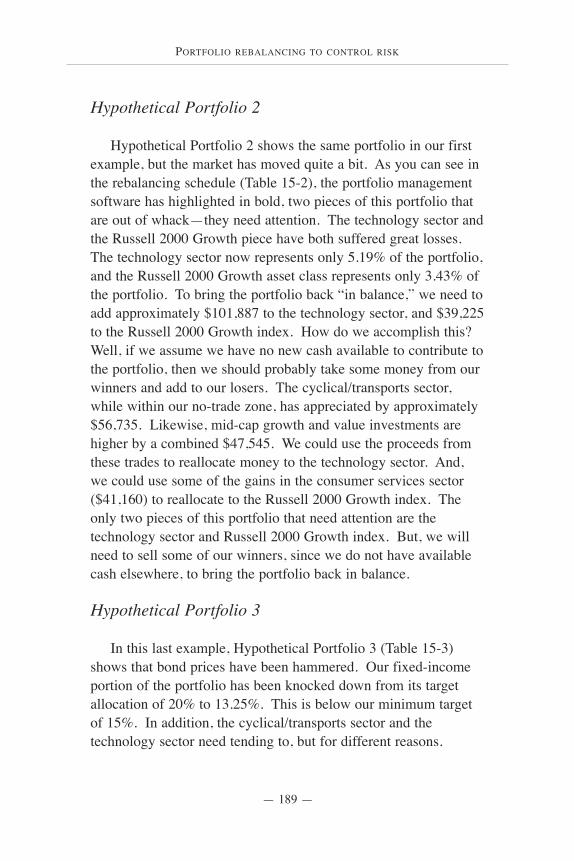
PORTFOLIO REBALANCING TO CONTROL RISK
— 189 —
Hypothetical Portfolio 2
Hypothetical Portfolio 2 shows the same portfolio in our firstexample, but the market has moved quite a bit. As you can see inthe rebalancing schedule (Table 15-2), the portfolio managementsoftware has highlighted in bold, two pieces of this portfolio thatare out of whack—they need attention. The technology sector andthe Russell 2000 Growth piece have both suffered great losses.The technology sector now represents only 5.19% of the portfolio,and the Russell 2000 Growth asset class represents only 3.43% ofthe portfolio. To bring the portfolio back “in balance,” we need toadd approximately $101,887 to the technology sector, and $39,225to the Russell 2000 Growth index. How do we accomplish this?Well, if we assume we have no new cash available to contribute tothe portfolio, then we should probably take some money from ourwinners and add to our losers. The cyclical/transports sector,while within our no-trade zone, has appreciated by approximately$56,735. Likewise, mid-cap growth and value investments arehigher by a combined $47,545. We could use the proceeds fromthese trades to reallocate money to the technology sector. And,we could use some of the gains in the consumer services sector($41,160) to reallocate to the Russell 2000 Growth index. Theonly two pieces of this portfolio that need attention are thetechnology sector and Russell 2000 Growth index. But, we willneed to sell some of our winners, since we do not have availablecash elsewhere, to bring the portfolio back in balance.
Hypothetical Portfolio 3
In this last example, Hypothetical Portfolio 3 (Table 15-3)shows that bond prices have been hammered. Our fixed-incomeportion of the portfolio has been knocked down from its targetallocation of 20% to 13.25%. This is below our minimum targetof 15%. In addition, the cyclical/transports sector and thetechnology sector need tending to, but for different reasons.
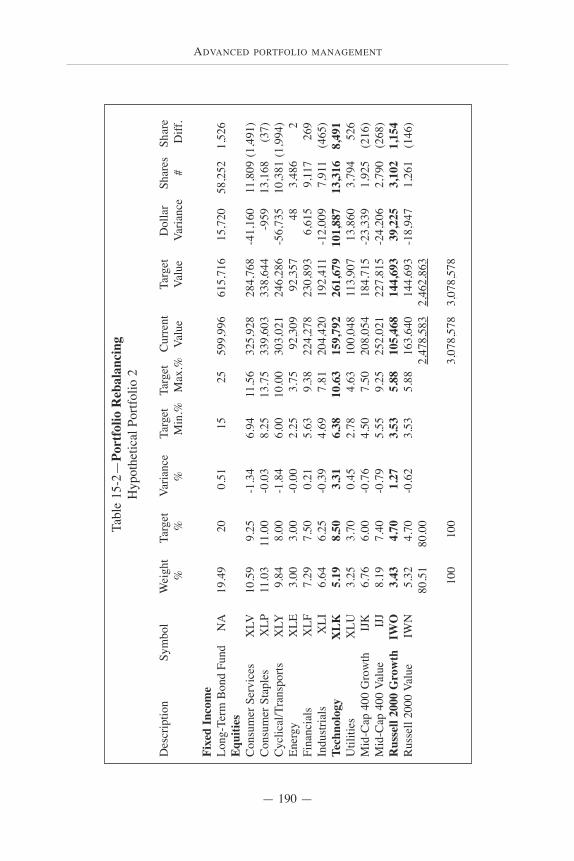
ADVANCED PORTFOLIO MANAGEMENT
— 190 —
Tabl
e 15
-2—
Port
folio
Reb
alan
cing
Hyp
othe
tical
Por
tfolio
2
Des
crip
tion
Sym
bol
Wei
ght
Ta
rget
V
aria
nce
T
arge
t T
arge
t C
urre
nt
T
arge
t
Dol
lar
Sh
ares
Sh
are
%
%
%
Min
.%
Max
.%
Valu
e
Valu
e
Var
ianc
e#
Diff
.
Fixe
d In
com
eLo
ng-T
erm
Bon
d Fu
ndN
A19
.49
200.
5115
2559
9,99
661
5,71
615
,720
58,2
521,
526
Equi
ties
Con
sum
er S
ervi
ces
XLV
10.5
99.
25-1
.34
6.94
11.5
632
5,92
828
4,76
8-4
1,16
011
,809
(1,4
91)
Con
sum
er S
tapl
esX
LP11
.03
11.0
0-0
.03
8.25
13.7
533
9,60
333
8,64
4-9
5913
,168
(37)
Cyc
lical
/Tra
nspo
rtsX
LY9.
848.
00-1
.84
6.00
10.0
030
3,02
124
6,28
6-5
6,73
510
,381
(1,9
94)
Ener
gyX
LE3.
003.
00-0
.00
2.25
3.75
92,3
0992
,357
483,
486
2Fi
nanc
ials
XLF
7.29
7.50
0.21
5.63
9.38
224,
278
230,
893
6,61
59,
117
269
Indu
stria
lsX
LI6.
646.
25-0
.39
4.69
7.81
204,
420
192,
411
-12,
009
7,91
1(4
65)
Tech
nolo
gyX
LK5.
198.
503.
316.
3810
.63
159,
792
261,
679
101,
887
13,3
168,
491
Util
ities
XLU
3.25
3.70
0.45
2.78
4.63
100,
048
113,
907
13,8
603,
794
526
Mid
-Cap
400
Gro
wth
IJK
6.76
6.00
-0.7
64.
507.
5020
8,05
418
4,71
5-2
3,33
91,
925
(216
)M
id-C
ap 4
00 V
alue
IJJ
8.19
7.40
-0.7
95.
559.
2525
2,02
122
7,81
5-2
4,20
62,
790
(268
)R
usse
ll 20
00 G
row
thIW
O3.
434.
701.
273.
535.
8810
5,46
814
4,69
339
,225
3,10
21,
154
Rus
sell
2000
Val
ueIW
N5.
324.
70-0
.62
3.53
5.88
163,
640
144,
693
-18,
947
1,26
1(1
46)
80.5
180
.00
2,47
8,58
32,
462,
863
100
100
3,07
8,57
83,
078,
578
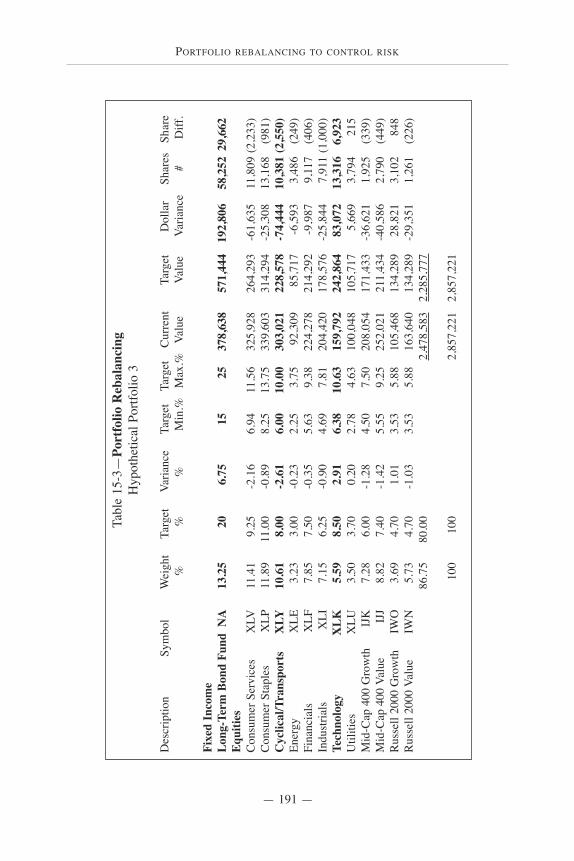
PORTFOLIO REBALANCING TO CONTROL RISK
— 191 —
Tabl
e 15
-3—
Port
folio
Reb
alan
cing
Hyp
othe
tical
Por
tfolio
3
Des
crip
tion
Sym
bol
Wei
ght
Ta
rget
V
aria
nce
T
arge
t T
arge
t C
urre
nt
T
arge
t
Dol
lar
Sh
ares
Sh
are
%
%
%
Min
.%
Max
.%
Valu
e
Valu
e
Var
ianc
e#
Diff
.
Fixe
d In
com
eLo
ng-T
erm
Bon
d Fu
ndN
A13
.25
206.
7515
2537
8,63
857
1,44
419
2,80
658
,252
29,6
62Eq
uitie
sC
onsu
mer
Ser
vice
sX
LV11
.41
9.25
-2.1
66.
9411
.56
325,
928
264,
293
-61,
635
11,8
09(2
,233
)C
onsu
mer
Sta
ples
XLP
11.8
911
.00
-0.8
98.
2513
.75
339,
603
314,
294
-25,
308
13,1
68(9
81)
Cyc
lical
/Tra
nspo
rts
XLY
10.6
18.
00-2
.61
6.00
10.0
030
3,02
122
8,57
8-7
4,44
410
,381
(2,5
50)
Ener
gyX
LE3.
233.
00-0
.23
2.25
3.75
92,3
0985
,717
-6,5
933,
486
(249
)Fi
nanc
ials
XLF
7.85
7.50
-0.3
55.
639.
3822
4,27
821
4,29
2-9
,987
9,11
7(4
06)
Indu
stria
lsX
LI7.
156.
25-0
.90
4.69
7.81
204,
420
178,
576
-25,
844
7,91
1(1
,000
)Te
chno
logy
XLK
5.59
8.50
2.91
6.38
10.6
315
9,79
224
2,86
483
,072
13,3
166,
923
Util
ities
XLU
3.50
3.70
0.20
2.78
4.63
100,
048
105,
717
5,66
93,
794
215
Mid
-Cap
400
Gro
wth
IJK
7.28
6.00
-1.2
84.
507.
5020
8,05
417
1,43
3-3
6,62
11,
925
(339
)M
id-C
ap 4
00 V
alue
IJJ
8.82
7.40
-1.4
25.
559.
2525
2,02
121
1,43
4-4
0,58
62,
790
(449
)R
usse
ll 20
00 G
row
thIW
O3.
694.
701.
013.
535.
8810
5,46
813
4,28
928
,821
3,10
284
8R
usse
ll 20
00 V
alue
IWN
5.73
4.70
-1.0
33.
535.
8816
3,64
013
4,28
9-2
9,35
11,
261
(226
)86
.75
80.0
02,
478,
583
2,28
5,77
7
100
100
2,85
7,22
12,
857,
221
ADVANCED PORTFOLIO MANAGEMENT
— 192 —
Cyclical/transports is now slightly overweight and the technologysector is underweight by almost 3%. So, we know that threepieces of this portfolio need adjustments. We can be flexible indetermining how to reallocate money. It would seem intelligent toreduce our allocation in cyclical/transports. This would free upalmost $75,000. In addition, we could reduce our exposure to theconsumer services sector to liquidate an additional $61,635. Wealso have the option of reducing exposure in the mid-cap assetclasses and the small-cap, Russell 2000 Value index.
Remember, we are not required to rebalance back to ouroriginal target. In this example, depending on what we thinkinterest rates will do, and whether or not we think stocks are moreattractive than bonds, we may decide to reallocate only $100,000to the fixed-income fund. This would at least bring this piecewithin its no-trade-zone boundaries. It would then approximate16.7% of the portfolio, assuming we sold an equity investment tofund the purchase.
I would suggest that you create an investment policy statementthat outlines how and when you will rebalance. While your policystatement only serves as a guide, it will help keep you disciplinedwhen the markets are acting up. There will be times when youwill not want to rebalance a particular asset class that hasappreciated substantially—a good example is the tech sector in thelate 1990s, when investors simply thought it would go straight upforever. By having a written investment policy statement, Ibelieve you are more likely to adhere to your rules when themarket and your neighbors are telling you to ignore them. Referback to your policy statement and your own guidelines forrebalancing. You should also set guidelines as to how often youwill review and rebalance your portfolio. Furthermore, you mustspecify the target minimum and maximum allocations you willemploy (e.g., 5/25 Rule). Whatever you decide, it makes sense toput it in writing—refer to it when in doubt.

PORTFOLIO REBALANCING TO CONTROL RISK
— 193 —
I would like to cite a study that showed how rebalancing cancontrol risk and lessen volatility. It appeared in FinancialPlanning in June of 2001. Craig L. Israelsen, Ph.D., comparedthe performance and volatility of three separate asset classes witha mixed, annually rebalanced portfolio (all three combined at33/33/34) to see if rebalancing would help performance andreduce risk. The study used returns and standard deviations from1970-2000. Large-cap stocks (S&P 500) produced an averageannual return of 12.9%, small-cap U.S. stocks (Ibbotson Index)returned 13.5% and non-U.S. stocks (EAFE Index) yielded anaverage annual return of 12.2%. The mixed portfolio, rebalancedannually, produced an average annual return of 13.4%, whichrepresents a return enhancement over large-cap U.S. stocks andnon-U.S. stocks.
The real beauty shown in this example (Tables 15-4 and 15-5),is the reduction of risk, not the enhancement of returns. In thethree different time periods studied (31-year, 10-year and 5-year),a meaningful reduction in risk was found by rebalancing. Duringthe 31-year period (1970-2000) the volatility of returns droppedby 18.5%. For the 10-year period 1991-2000 volatility decreasedby 23.5% and for the 5-year period (1996-2000), volatility wasreduced by 17.7%. As you can see in Table 15-5, in the shorterperiods, it is obvious that if you happened to have picked thesingle best asset class and put all your money in it, you wouldhave fared better than an annually rebalanced and diversifiedportfolio. But, that’s next to impossible to predict. The mainpoint I’m trying to make (and this study proves), is that over longperiods, by rebalancing, you can significantly reduce volatility—probably without giving up performance.
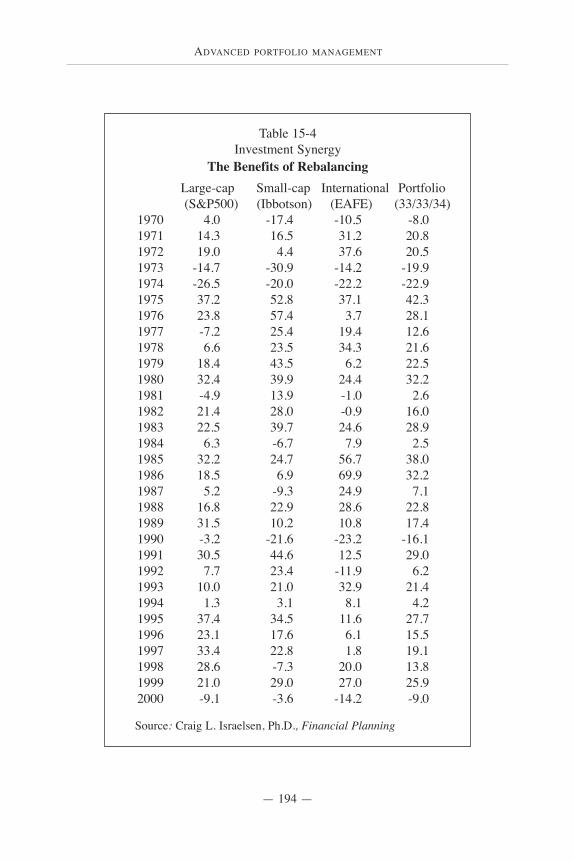
ADVANCED PORTFOLIO MANAGEMENT
— 194 —
Table 15-4Investment Synergy
The Benefits of RebalancingLarge-cap Small-cap International Portfolio(S&P500) (Ibbotson) (EAFE) (33/33/34)
1970 4.0 -17.4 -10.5 -8.01971 14.3 16.5 31.2 20.81972 19.0 4.4 37.6 20.51973 -14.7 -30.9 -14.2 -19.91974 -26.5 -20.0 -22.2 -22.91975 37.2 52.8 37.1 42.31976 23.8 57.4 3.7 28.11977 -7.2 25.4 19.4 12.61978 6.6 23.5 34.3 21.61979 18.4 43.5 6.2 22.51980 32.4 39.9 24.4 32.21981 -4.9 13.9 -1.0 2.61982 21.4 28.0 -0.9 16.01983 22.5 39.7 24.6 28.91984 6.3 -6.7 7.9 2.51985 32.2 24.7 56.7 38.01986 18.5 6.9 69.9 32.21987 5.2 -9.3 24.9 7.11988 16.8 22.9 28.6 22.81989 31.5 10.2 10.8 17.41990 -3.2 -21.6 -23.2 -16.11991 30.5 44.6 12.5 29.01992 7.7 23.4 -11.9 6.21993 10.0 21.0 32.9 21.41994 1.3 3.1 8.1 4.21995 37.4 34.5 11.6 27.71996 23.1 17.6 6.1 15.51997 33.4 22.8 1.8 19.11998 28.6 -7.3 20.0 13.81999 21.0 29.0 27.0 25.92000 -9.1 -3.6 -14.2 -9.0
Source: Craig L. Israelsen, Ph.D., Financial Planning
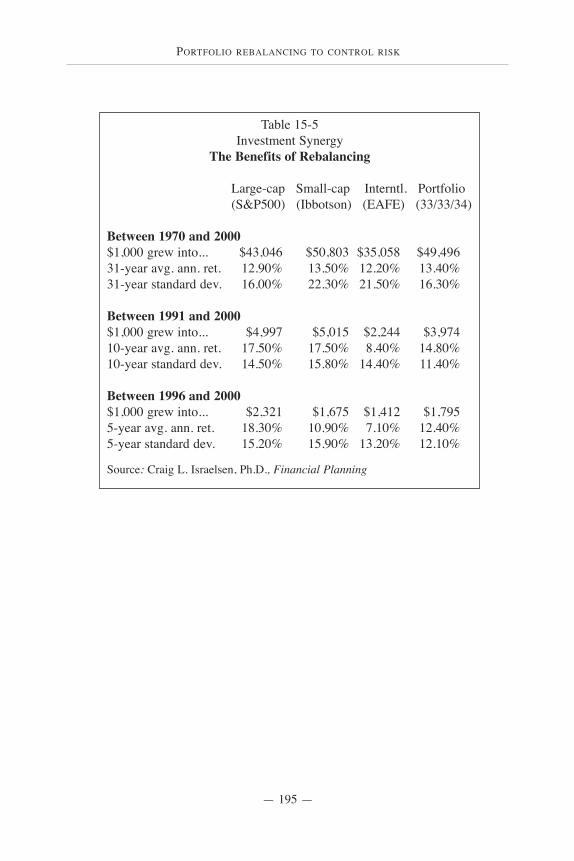
PORTFOLIO REBALANCING TO CONTROL RISK
— 195 —
Table 15-5Investment Synergy
The Benefits of Rebalancing
Large-cap Small-cap Interntl. Portfolio(S&P500) (Ibbotson) (EAFE) (33/33/34)
Between 1970 and 2000$1,000 grew into... $43,046 $50,803 $35,058 $49,49631-year avg. ann. ret. 12.90% 13.50% 12.20% 13.40%31-year standard dev. 16.00% 22.30% 21.50% 16.30%
Between 1991 and 2000$1,000 grew into... $4,997 $5,015 $2,244 $3,97410-year avg. ann. ret. 17.50% 17.50% 8.40% 14.80%10-year standard dev. 14.50% 15.80% 14.40% 11.40%
Between 1996 and 2000$1,000 grew into... $2,321 $1,675 $1,412 $1,7955-year avg. ann. ret. 18.30% 10.90% 7.10% 12.40%5-year standard dev. 15.20% 15.90% 13.20% 12.10%
Source: Craig L. Israelsen, Ph.D., Financial Planning
ADVANCED PORTFOLIO MANAGEMENT
— 196 —
NOT ENOUGH IS WRITTEN ABOUT the importance of tax-efficient investing. Most investors focus on performance. Then,they may give some thought to tax efficiency and costs, if theperformance doesn’t speak loudly enough. This is a mistake.Investors should always focus on tax-efficiency, as well as
Tax Planning
Harvest losses whenever you can—not just inNovember and December.
I can emulate the 500 fund by buying the ETFs with industry and sector weightings equal to the S&P 500. So, I buy these
positions, and at the end of the year I look at this wholeportfolio of, let’s say, 20 ETFs, and I find that they have
exactly the same return as the Vanguard Index 500, but fiveof the industries have losses. So I can sell those ETF positions,
harvest the losses, and put money in my client’s pocket. —JAMES BUDROS, investment advisor
Tax-loss selling can make sense even for the many investorswho have unrealized, or ‘paper’ losses that are far in excess
of the amount they could use to offset realized gains and $3,000of other income on 2001 tax returns. Once realized, those losses
can be carried forward and used in future years.—KAREN DAMATO, The Wall Street Journal
16
TAX PLANNING
— 197 —
performance and costs—you shouldn’t ignore any of theseconsiderations. After all, your net returns, after taxes and fees, are key—gross returns mean nothing. In this chapter we’llexamine a few different tax-planning strategies, and some “no-brainers” that will hopefully improve your net returns.
Where to hold ‘em, in your taxable or tax-deferredaccount?
The first step to having a tax-efficient portfolio is to hold yourinvestments in the proper account. To some this may seem likecommon sense, but I have come across many intelligent typeswho were unaware of some of the pitfalls of owning aninvestment in the wrong account. Anyway, conventional wisdomhas always said that you should keep your bonds in your tax-deferred accounts. The argument was that bonds are not at all taxefficient—I’m not talking about municipals of course—since mostof your return from bonds comes in the form of an interestpayment that is taxable at ordinary income tax rates (up to 39.6%versus the preferable capital gains rate of 20% paid on long-termstock gains). And, since your tax-deferred account is generallyused to fund, or help fund your retirement, then that is also a goodreason to invest conservatively in bonds. Furthermore,conventional wisdom says that since stocks are more likely toappreciate than bonds, they should be held in a taxable accountrather than a tax-deferred account. In a taxable account the stockgains will be taxed at the 20% rate, rather than the higher,ordinary income tax rate, when withdrawn from the tax-deferredaccount. And, if held until death, equities held in a taxableaccount will get a step up in cost basis and avoid capital gainstaxes entirely. The conventional-wisdom approach will probablymake sense for most of you, but not all.
T. Rowe Price conducted a study that can help us decide whereit makes the most sense to hold our various investments. They
ADVANCED PORTFOLIO MANAGEMENT
— 198 —
compared the returns and tax efficiency of holding stock and bondfunds in tax-deferred and taxable accounts. They factored in taxespaid on capital gains distributions and interest and dividends paidat ordinary income tax rates. The study found, that over 10-, 15-and 20-year periods, the investor did better holding the stockfunds in the tax-deferred account, rather than the conventionalapproach of holding bonds in that account. The study found thatthe disadvantage of having the stock fund’s earnings taxed atordinary income tax rates (upon withdrawal from the tax-deferredaccount) was more than offset by the compounding of a highergrowth investment.
The T. Rowe Price study advises investors to take into accounttheir time horizon for investing, as well as their tax bracket, todetermine the appropriate strategy. In general, the shorter yourtime horizon (10 years or less) and the higher your tax bracket,the more sense it makes to hold your stock investments in yourtaxable account, and your bonds in your tax-deferred account.
Incidentally, T. Rowe Price’s study found that if you indexyour stock investments, then you should probably go ahead anduse the conventional approach.
Considerations to help determine whether to use theconventional or unconventional approach
1) Do you have enough cash available in your taxableaccount to meet your income needs for 5 years or more? If not,then you probably wouldn’t want to hold all your stockinvestments in your taxable account, since your time horizon isinsufficient. In other words, if your stock investments go nowherefor 5 years (or you lose money), and you need this money tomaintain your lifestyle, I would rather you keep this moneyaccessible in cash and short-term bonds—not in stocks. If you’relow on cash, you don’t want to have to sell your stocks at a loss to
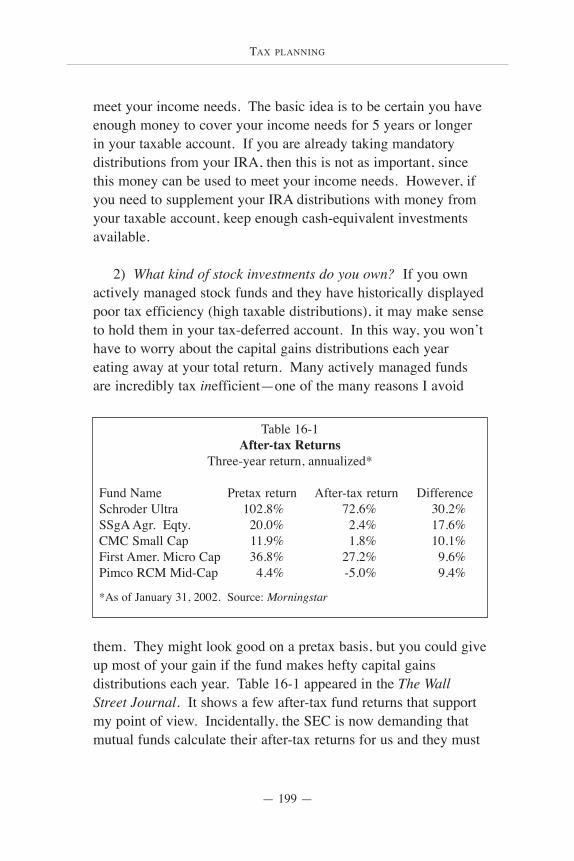
TAX PLANNING
— 199 —
meet your income needs. The basic idea is to be certain you haveenough money to cover your income needs for 5 years or longerin your taxable account. If you are already taking mandatorydistributions from your IRA, then this is not as important, sincethis money can be used to meet your income needs. However, ifyou need to supplement your IRA distributions with money fromyour taxable account, keep enough cash-equivalent investmentsavailable.
2) What kind of stock investments do you own? If you ownactively managed stock funds and they have historically displayedpoor tax efficiency (high taxable distributions), it may make senseto hold them in your tax-deferred account. In this way, you won’thave to worry about the capital gains distributions each yeareating away at your total return. Many actively managed fundsare incredibly tax inefficient—one of the many reasons I avoid
them. They might look good on a pretax basis, but you could giveup most of your gain if the fund makes hefty capital gainsdistributions each year. Table 16-1 appeared in the The WallStreet Journal. It shows a few after-tax fund returns that supportmy point of view. Incidentally, the SEC is now demanding thatmutual funds calculate their after-tax returns for us and they must
Table 16-1After-tax Returns
Three-year return, annualized*
Fund Name Pretax return After-tax return DifferenceSchroder Ultra 102.8% 72.6% 30.2%SSgA Agr. Eqty. 20.0% 2.4% 17.6%CMC Small Cap 11.9% 1.8% 10.1%First Amer. Micro Cap 36.8% 27.2% 9.6%Pimco RCM Mid-Cap 4.4% -5.0% 9.4%
*As of January 31, 2002. Source: Morningstar
ADVANCED PORTFOLIO MANAGEMENT
— 200 —
also include this information in their prospectuses andadvertisements—thank you very much.
One other note while on the topic of actively managed fundsand tax inefficiency. You probably know that you should be verycareful about buying an actively managed fund near the end of theyear, since it may be ready to make a taxable distribution. Checkwith the fund company before making a purchase. Another tip isto look up the fund on www.morningstar.com or www.yahoo.comto see if it has built-in unrealized gains that could indicate futuretaxable distributions. This number gives you the tax exposure thatthe fund would face if it had to sell all of its holdings. Last tip onthis dreary topic—avoid investing in funds that are facing lots ofwithdrawals. The fund manager probably has to do a lot ofselling and this could also lead to capital distributions. This canbe misleading however, since most investors leave a fund becauseit is performing poorly. If this is the case, there may not be muchcapital gains exposure.
3) Are you actively trading or rebalancing your stockinvestments? If you’re an active trader, you’re not going to wantto worry about paying capital gains taxes with every move. So,obviously you will hold most of your stock positions in your tax-deferred account. Or, is it so obvious? What if you don’t tradetoo frequently, but you do enough trading to be concerned? Well,you may want to hold your core stock investments in your taxableaccount (major asset-class holdings) since it is unlikely you willbe trading these pieces as much. You can hold your sectorinvestments—they’re typically more volatile than the major stockasset classes—in your tax-deferred account, since it’s more likelyyou will rebalance these investments more frequently.
For most investors I’ve found that deciding which investmentsto hold in a taxable and tax-deferred account is relatively easy. Inorder for you to have a balanced portfolio you may simply need to
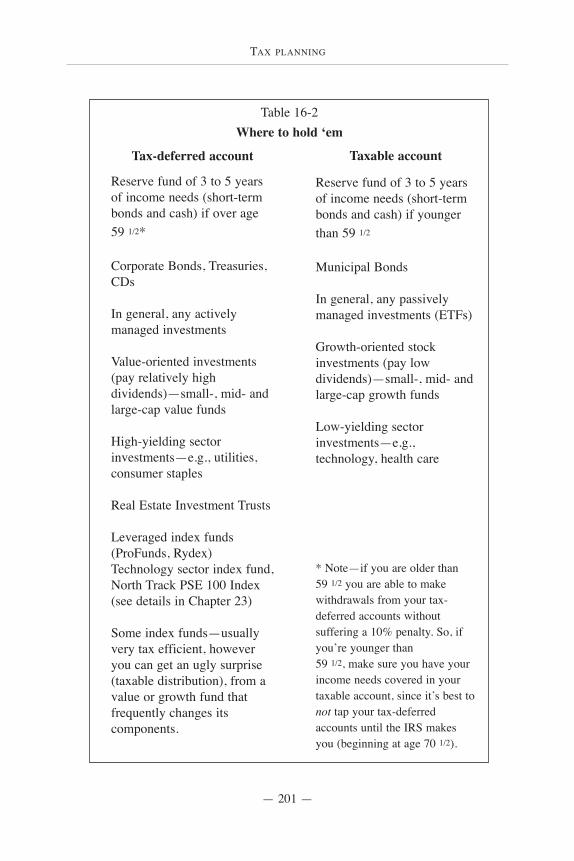
TAX PLANNING
— 201 —
Table 16-2Where to hold ‘em
Tax-deferred account
Reserve fund of 3 to 5 yearsof income needs (short-termbonds and cash) if over age59 1/2*
Corporate Bonds, Treasuries,CDs
In general, any activelymanaged investments
Value-oriented investments(pay relatively highdividends)—small-, mid- andlarge-cap value funds
High-yielding sectorinvestments—e.g., utilities,consumer staples
Real Estate Investment Trusts
Leveraged index funds(ProFunds, Rydex)Technology sector index fund,North Track PSE 100 Index(see details in Chapter 23)
Some index funds—usuallyvery tax efficient, howeveryou can get an ugly surprise(taxable distribution), from avalue or growth fund thatfrequently changes itscomponents.
Taxable account
Reserve fund of 3 to 5 yearsof income needs (short-termbonds and cash) if youngerthan 59 1/2
Municipal Bonds
In general, any passivelymanaged investments (ETFs)
Growth-oriented stockinvestments (pay lowdividends)—small-, mid- andlarge-cap growth funds
Low-yielding sectorinvestments—e.g.,technology, health care
* Note—if you are older than59 1/2 you are able to makewithdrawals from your tax-deferred accounts withoutsuffering a 10% penalty. So, ifyou’re younger than 59 1/2, make sure you have yourincome needs covered in yourtaxable account, since it’s best tonot tap your tax-deferredaccounts until the IRS makesyou (beginning at age 70 1/2).
ADVANCED PORTFOLIO MANAGEMENT
— 202 —
own stocks and bonds in both accounts. This also gives you theadded flexibility of having some stock positions in a tax-deferredaccount so that if you need to rebalance or reduce your equityexposure, you always have the option of doing so in a tax-deferred account, without having to consider taxes.
Asset Location Study
A new study by three finance professors, Robert Dammon andChester S. Spatt of Carnegie Mellon University, and Harold H.Zhang of the University of North Carolina, has revisited the topicof asset location and found that most investors are not properlyallocating their assets in their taxable and tax-deferred accounts.The professors provide substantial evidence that indicates thatinvestors should place equities in taxable accounts and fixed-income investments in tax-deferred accounts, to the greatest extentpossible.
Professors Dammon, Spatt and Zhang argue that equitiesbelong in a taxable account for several reasons—the lowereffective tax rate (versus bond income), the possibility of realizinglosses, and, because capital gains can be deferred and even“stepped up” at the time of death.
What is most striking about the study, entitled “Optimal AssetLocation and Allocation with Taxable and Tax-DeferredInvesting,” is that depending on where an investor’s wealth issituated (taxable or tax-deferred account) this can help determinewhat the overall asset allocation should be. In other words, if youhave most of your wealth in a tax-deferred account, the authorsargue that you should own mostly bonds. Likewise, if most ofyour wealth is in taxable accounts, the professors learned that youare better off holding equities.
The study basically recommends that most investors would be
TAX PLANNING
— 203 —
wise to invest high yielding investments in tax-deferred accounts,and equities (growth investments with low dividends) in taxableaccounts. This is sound advice. What I don’t think you canignore, however, is an investor’s tolerance for risk. ProfessorsDammon, Spatt and Zhang argue that to some extent the locationof your assets should determine your asset allocation strategy, butthis is only one consideration. If you have most of your assets ina taxable account, but have a low tolerance for risk, I obviouslywouldn’t advise loading up on equities (even though the studyfound this to be the optimal strategy). And, investors who onlyhave tax-deferred wealth shouldn’t completely avoid equitieseither.
My recommendation is to first determine your appropriateasset allocation (Chapter 1). Then, as a rule of thumb, locate yourhigh yielding investments in your tax-deferred account and yourequities in your taxable account, to the greatest extent possible.
Tax Swaps
One practice I advise considering is the use of tax swaps withETFs or other broad-based index funds and sector index funds.The term “tax swap” refers to selling one investment and buying asimilar, but different investment, at the same time. You create aloss for yourself—to use this year or in future years to offsetgains—and you reinvest the proceeds of the sale into a similarinvestment that will hopefully appreciate as well as the one yousold, when the market eventually recovers. In this way, youmaintain exposure to the sector or asset class without having to siton the sidelines waiting 31 days to avoid a wash sale.
The key to effectively swapping investments is to steer clear ofwash-sales. The wash-sale rule prohibits investors from deductinglosses from the sale of an investment, if the same investment isrepurchased within 30 days of the sale. Although the IRS has not
ADVANCED PORTFOLIO MANAGEMENT
— 204 —
yet stated an opinion on the subject, many advisors and WallStreet firms are recommending their clients perform tax swapswith ETFs or other index funds. Although I caution my clientsand readers that I am not a tax advisor (check with your own taxspecialist), it is the opinion of the professionals and tax experts Ihave talked to, that by swapping, for example, one technologyETF for another similar technology ETF, an investor will not runafoul of the wash-sale rule.
A report by Morgan Stanley recently stated that “exchange-traded funds are usually not subject to wash-sale rules, offerdiversified equity exposure, offer low expense ratios and tradethroughout the day on major exchanges.” Furthermore, H. JamesBlakeslee, senior vice president and chief tax strategist at Boston’sLiberty Funds, quoted in Investment News, stated that a tax swapfrom the Nasdaq-100 Trust (QQQ) into an ETF that is puretechnology is “not an identical match.” “It’s significantly similar,but it would probably work.” Mr. Blakeslee however, would notencourage investors to swap two funds or ETFs that are designedto track the same index. I would agree.
The Select Sector SPDR Web site recommends investorsperform similar tax swaps to maintain exposure to a sector.“Example—you are currently long Nasdaq-100 (QQQ) tradingbelow your original purchase price. You can sell your lossposition, realize the loss and buy the Technology Sector SPDR(XLK) to maintain similar exposure.” The site also recommendstaking losses on individual stocks within a sector and buying anETF that tracks the sector, to maintain exposure. “Example—youare currently long Cisco, Microsoft and Intel, all trading belowyour original purchase prices. You can sell your loss positions,realize the losses and buy the Technology Sector SPDR (XLK) tomaintain exposure to these stocks and others in the technologysector.”
TAX PLANNING
— 205 —
Again, the beauty of tax swapping with ETFs is that it allowsyou to harvest a tax loss, but keep exposure in the market. Forexample, if you have a loss in the Nasdaq-100 basket (QQQcomprises mostly tech stocks) you could swap it for either theXLK (Technology Sector SPDR) or IYW (iShares Technology).The key, says Paul Mazzilli, Dean Witter’s director of exchange-traded fund research, is that the funds “are not going to have thesame stocks in the same weighting.” Mr. Mazzilli cited theexample of swapping one energy fund for another, but the ideaapplies to all swaps. What Mr. Mazzilli did recommend againstwas swapping out of one S&P 500 fund for another. I wouldagree, since all S&P 500 funds are created to track the sameindex. Mr. Mazzilli did recommend swapping out of a S&P 500fund for a Russell 1000 fund—“a very high correlation, but atleast has some different stocks.”
A Merrill Lynch report issued in 2000, and written up onwww.indexfunds.com, also advised swapping ETF baskets toharvest tax losses. “As long as the fee structure and managementcompanies are different, the wash-sale rule should not apply.” Ifthis is the case, then an investor could swap from iShares toSPDRs and back again constantly—they’re different fundcompanies with different fee structures. Again, common sensetells me that ETF or index fund swaps with investments that aresimilar, but not identical—if they have different fee structures andmanagement companies—should be okay. But, I would not riskswapping one investment for another that tracks the same index.
In June 2001 Money magazine advised fund investors toconsider taking losses on their losers and replacing them withsimilar investments. They noted that investors could swap twoindex funds, say “Vanguard Total Stock Market Index for FidelitySpartan Total Stock Market Index.” While they’ve recommendedthis, I think this move could be challenged. Brad Zigler states thefollowing—“Investors claiming loss deductions always risk
ADVANCED PORTFOLIO MANAGEMENT
— 206 —
challenge from the IRS. Investors should seek competent counselto review the tax consequences of their transactions.”
One last example of tax-loss harvesting of ETFs was suggestedin the September 2001 issue of Bloomberg Wealth Manager. Inthe article, Benjamin Tobias, president of Tobias FinancialAdvisors, discussed the advantages of intraclass tax-lossharvesting by using ETFs. For example, he will sometimes sellthe iShares S&P 500 at a loss and “park half the proceeds in theBARRA Growth iShares and half in BARRA Value iShares. Thisis a nifty way to retain similar exposure to the market whilecreating a tax loss.” He goes on to say that if, for example, “theBARRA growth loses some value, I can exchange it for theRussell 1000 Growth iShares, which is very highly correlated withit.” Again, as Tobias believes, ETFs are a great investment toolthat you can use for creative and smart tax planning.
Tax-loss harvesting
Efficient tax management of a portfolio is an ongoing process.Many investors focus on harvesting losses only at the end of theyear. This isn’t wise. You should harvest losses wheneverpossible. Obviously you should also consider any transaction feesbefore harvesting the loss. It’s smart to create tax carryforwardsfor yourself for later years. If you wait until the end of the year,(December) like most investors, you may not have any losses leftto harvest. Again, bank the losses whenever possible and create acarryforward that you can use indefinitely to offset future gains inyour portfolio and/or to use up to $3,000 annually to offsetordinary income. If the market is under pressure right now, but itrecovers before the end of the year, you will have also participatedin the growth—since you swapped for a similar investment—andyou harvested a loss that you can use this year or in later years tooffset any gains. Pretty smart tax planning.
TAX PLANNING
— 207 —
Tax swapping fixed-income investments
When you swap a bond or bond fund you basically trade onefor another. This is performed the same way as a stock swap orETF swap. Realized losses can be used (like stock losses) tooffset gains anywhere in your taxable portfolio. Investors aremore likely to buy and hold fixed-income investments and tradeor perform swaps with equities. But, you should perform similarsmart tax moves with your fixed-income portfolio. And, do soyear-round. If interest rates are extremely volatile and the price of your bonds or bond funds falls, you have an opportunity toharvest a loss and swap into another similar investment. Ofcourse (as with equity swaps), transaction fees should be takeninto consideration before effecting a swap. And, you’ve got tolook at what alternative bonds are paying if you decide to sellyours to harvest a loss. But, in general, you’ll find that harvestingfixed-income losses makes a lot of sense and it’s easy to do. Ifwe are now entering a period of rising interest rates, thisenvironment would bode well for swapping bonds and bankinglosses. As interest rates rise, the prices of your bonds and bondfunds will decline. So, pay attention to your bond prices in thecoming years, because there may be many opportunities toperform swaps and realize losses.
ADVANCED PORTFOLIO MANAGEMENT
— 208 —
Don’t let the IRS define your gain
When you decide to sell a fund, stock or bond, you havevarious choices as to how to realize the loss or gain. The choiceyou make can either save you or cost you a lot of money. Let’sreview your choices—
FIFO (first-in, first-out)
If you do not make an adequate identification, the IRS willassume you sold the first shares you bought. Those shares arelikely to be among your cheapest, so you’ll end up paying moretaxes. This method is generally the least attractive alternative.
Average-Cost Method
This method is generally more profitable and almost as easy asFIFO. You probably have records from your mutual fundcompany or advisor on the average cost of your purchases overthe years. The disadvantage of using this method, like FIFO, isthat you don’t have much control, and once you’ve chosen theaverage-cost method, you cannot change to another method.Note, for individual stocks you cannot use the average-costmethod—it’s only allowed for mutual fund shares.
Specific Identification
Specific identification of shares requires exact recordkeeping,but it is worth the effort. This method allows you to identifywhichever shares you want, and to sell them. This means you canchoose to sell a certain “lot” that is presently showing a loss,
It’s great, basic, absolutely solid, plain-vanilla type of advice.—ROY WEITZ, a Los Angeles CPA
quoted in the The Wall Street Journal
TAX PLANNING
— 209 —
whereas using average-cost or FIFO, may mean realizing ataxable gain. Again, this technique involves identifying exactlywhich shares are to be sold. The process to identify the sharesyou want sold requires some work, and obviously goodrecordkeeping. For mutual funds held with a mutual fundcompany, you need to give instructions to the fund company,advising them as to which shares purchased on a certain date arethe ones you’re selling. From what I’ve read, you don’t need toworry about which shares they actually sell—what’s important for you is to have written confirmation from the fund companythat they sold the shares according to your instructions. The IRSstates that you need to have confirmation of this sale of “specifiedshares” within a reasonable time. What’s considered a reasonabletime? I don’t know, but you obviously should have some recordfrom your broker or fund company as to which shares you sold on which date.
For earmarking stock sales you can also control the gains andlosses of each lot. The identification process is similar to sellingmutual funds, and if you don’t identify the shares the IRS willassume that you sold using FIFO. There is no averaging of costfor individual securities. If your shares are held with a broker, theIRS considers adequate identification as the following—“if youreceive written confirmation of your instructions from the brokeror transfer agent within a reasonable time.” A mere intention tosell a particular share without informing the broker is withoutsignificance.
Again, I am not a tax advisor, but I’d advise you to have a taxreporting statement each year that clearly shows which lots youhave sold. Consult your own tax advisor about your situation.
One improvement I’ve noticed recently—on the topic ofspecific identification of trades—is that one of the custodians Iuse for clients now allows you to specify the sale of a “specific
ADVANCED PORTFOLIO MANAGEMENT
— 210 —
lot” when trading online. This is very convenient and avoidsrecord-keeping hassles. It will also make the broker’s statementof your realized gains and losses match up with your ownreporting, automatically. I hope this online trading, “specific-lot-identification feature” will soon be available through all majorcustodians.
Use losses to diversify a concentrated portfolio
Another tax strategy I recommend allows you to diversify yourportfolio and offset taxes at the same time. Many investors haveconcentrated portfolios in relatively few stocks. You may hold aposition in IBM or Merck, for example, that has greatlyappreciated since your initial purchase price. This position maynow represent 10% or more of your total portfolio. So, you mayhave inadequate diversification, with a few positions making up aheavy weighting in your overall portfolio. This unfortunate,fortunate situation can be solved with proper tax planning. If youhave losses in other areas of your portfolio, I would advise usingthose losses—or losses you’ve carried forward from previousyears—to diversify out of your overweight individual stockpositions. Although I generally discourage owning individualstocks—I prefer structured indexing—if you do have individualstocks in your portfolio, I would be concerned if any one positionmakes up more than 4% of your total equity portfolio. If this isthe case, and you have losses elsewhere that you can “realize”—do so. Again, this allows you to reduce your exposure to theindividual stocks and offset a gain at the same time. In this case,selling some of your individual stocks with heavy weightings, anddiversifying into index-based investments, would be a smart taxmove and you’d also reduce risk.
TAX PLANNING
— 211 —
Use deductible investment expenses to your advantage
Many investors are unaware of some of the fees that aregenerally tax deductible. If you qualify for “miscellaneous”itemized deductions these expenses will be deductible to theextent that they exceed 2% of your adjusted gross income——Accounting fees for keeping records of investment income.—Fees to set up and administer an IRA if billed and paidseparately from the regular IRA contribution.—Investment management or investment planner’s fees. Note,fees allocated to advice dealing with tax-exempt obligations arenot deductible.—Safe-deposit box rental fee used to hold your securities.—Salary of a secretary, bookkeeper or other employee hired tokeep track of your investment income.—Subscriptions to investment services.
ADVANCED PORTFOLIO MANAGEMENT
— 212 —
A STUDY PUBLISHED IN A RECENT ISSUE of BusinessWeekshowed that 32% of Americans age 65 and over admit to spendingmore than they are making. If this is the case, then manyAmericans will not leave much of a legacy to the next generation.More importantly, many elderly investors risk outliving theirmoney. This chapter will give you some guidelines as to howmuch money you can withdraw from your portfolio duringdifferent stages of retirement, and not outlive your money. Inaddition, I will show you data that support the argument forkeeping the core of your portfolio invested in equities duringretirement.
Portfolio withdrawals—probabilities and survivability
Some 40% of Americans admit they live beyond their means.BusinessWeek
17
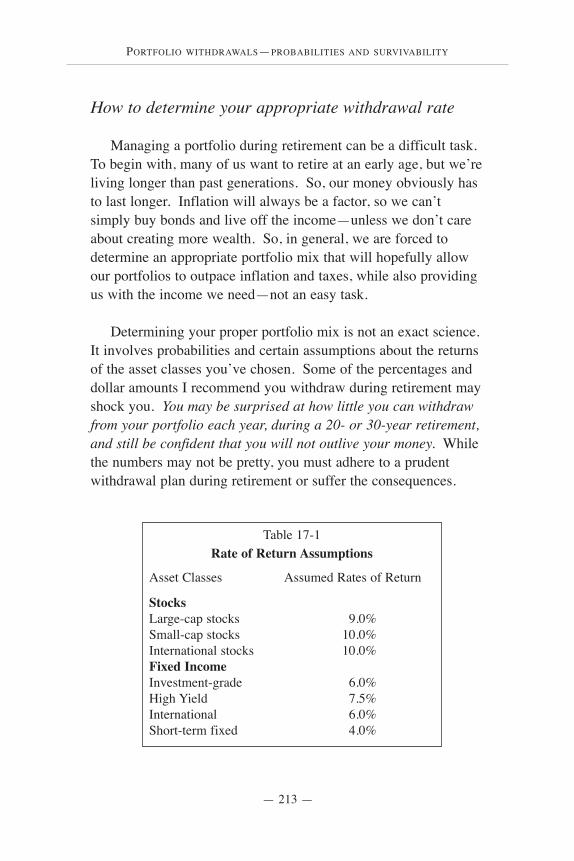
PORTFOLIO WITHDRAWALS—PROBABILITIES AND SURVIVABILITY
— 213 —
How to determine your appropriate withdrawal rate
Managing a portfolio during retirement can be a difficult task.To begin with, many of us want to retire at an early age, but we’reliving longer than past generations. So, our money obviously hasto last longer. Inflation will always be a factor, so we can’tsimply buy bonds and live off the income—unless we don’t careabout creating more wealth. So, in general, we are forced todetermine an appropriate portfolio mix that will hopefully allowour portfolios to outpace inflation and taxes, while also providingus with the income we need—not an easy task.
Determining your proper portfolio mix is not an exact science.It involves probabilities and certain assumptions about the returnsof the asset classes you’ve chosen. Some of the percentages anddollar amounts I recommend you withdraw during retirement mayshock you. You may be surprised at how little you can withdrawfrom your portfolio each year, during a 20- or 30-year retirement,and still be confident that you will not outlive your money. Whilethe numbers may not be pretty, you must adhere to a prudentwithdrawal plan during retirement or suffer the consequences.
Table 17-1Rate of Return Assumptions
Asset Classes Assumed Rates of Return
StocksLarge-cap stocks 9.0%Small-cap stocks 10.0%International stocks 10.0%Fixed IncomeInvestment-grade 6.0%High Yield 7.5%International 6.0%Short-term fixed 4.0%

ADVANCED PORTFOLIO MANAGEMENT
— 214 —
To determine your portfolio mix you have to initially makeassumptions about the returns of your asset classes. The assumedreturns I’ve listed in Table 17-1 come from T. Rowe Price. I willalso use their number-crunching Retirement Income Calculator togive you different scenarios for portfolio withdrawals for a young,middle-aged and older retiree.
Case 1—The Young Retiree, 55 years old
If you are 55 years old and retired, you are definitelyconsidered a young retiree. Since your life expectancy is a fewdecades, you have to come up with a withdrawal plan and assetallocation that will allow your money to last for 30 years, or more.To give you an idea as to how much you can comfortablywithdraw, on an annual basis, during this lengthy retirement, Iinput some data into T. Rowe Price’s Retirement Calculator—seeTable 17-2.
I chose a monthly income goal of $12,000 as a starting point.This would indicate an annual withdrawal rate of 4.8%. Thecalculator, regardless as to how aggressive I made the portfoliomix, wasn’t comfortable with 4.8%.
Table 17-2Case 1—The Young Retiree
55 years old
Summary:Start age: 55 yearsYears of retirement: 35 yearsRetirement assets: $3 millionMonthly income goal: $12,000Portfolio mix: VariousSimulation rate: 90%
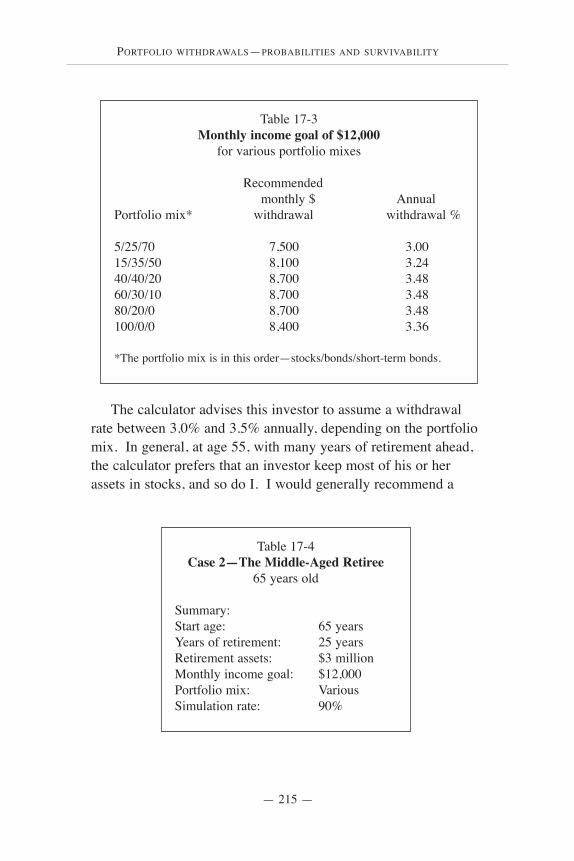
PORTFOLIO WITHDRAWALS—PROBABILITIES AND SURVIVABILITY
— 215 —
The calculator advises this investor to assume a withdrawalrate between 3.0% and 3.5% annually, depending on the portfoliomix. In general, at age 55, with many years of retirement ahead,the calculator prefers that an investor keep most of his or herassets in stocks, and so do I. I would generally recommend a
Table 17-3Monthly income goal of $12,000
for various portfolio mixes
Recommended monthly $ Annual
Portfolio mix* withdrawal withdrawal %
5/25/70 7,500 3.0015/35/50 8,100 3.2440/40/20 8,700 3.4860/30/10 8,700 3.4880/20/0 8,700 3.48100/0/0 8,400 3.36
*The portfolio mix is in this order—stocks/bonds/short-term bonds.
Table 17-4Case 2—The Middle-Aged Retiree
65 years old
Summary:Start age: 65 yearsYears of retirement: 25 yearsRetirement assets: $3 millionMonthly income goal: $12,000Portfolio mix: VariousSimulation rate: 90%
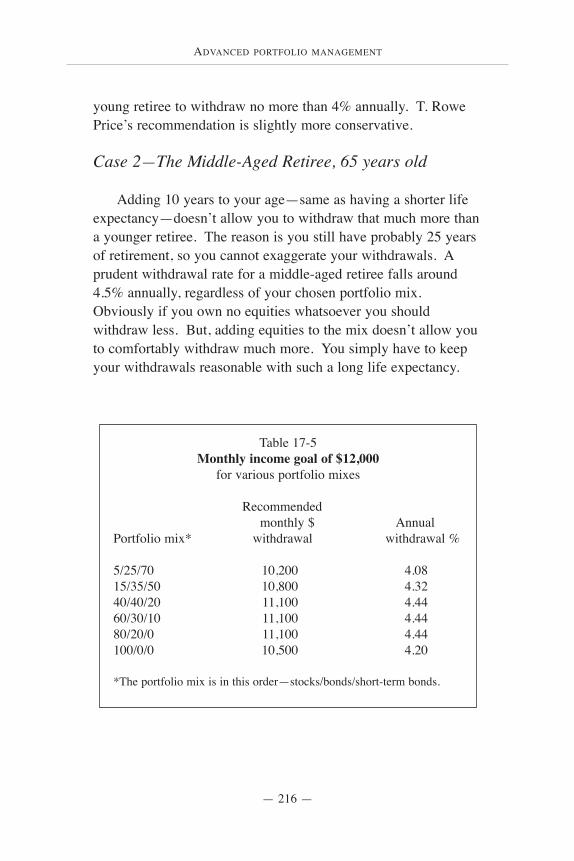
ADVANCED PORTFOLIO MANAGEMENT
— 216 —
young retiree to withdraw no more than 4% annually. T. RowePrice’s recommendation is slightly more conservative.
Case 2—The Middle-Aged Retiree, 65 years old
Adding 10 years to your age—same as having a shorter lifeexpectancy—doesn’t allow you to withdraw that much more thana younger retiree. The reason is you still have probably 25 yearsof retirement, so you cannot exaggerate your withdrawals. Aprudent withdrawal rate for a middle-aged retiree falls around4.5% annually, regardless of your chosen portfolio mix.Obviously if you own no equities whatsoever you shouldwithdraw less. But, adding equities to the mix doesn’t allow youto comfortably withdraw much more. You simply have to keepyour withdrawals reasonable with such a long life expectancy.
Table 17-5Monthly income goal of $12,000
for various portfolio mixes
Recommended monthly $ Annual
Portfolio mix* withdrawal withdrawal %
5/25/70 10,200 4.0815/35/50 10,800 4.3240/40/20 11,100 4.4460/30/10 11,100 4.4480/20/0 11,100 4.44100/0/0 10,500 4.20
*The portfolio mix is in this order—stocks/bonds/short-term bonds.
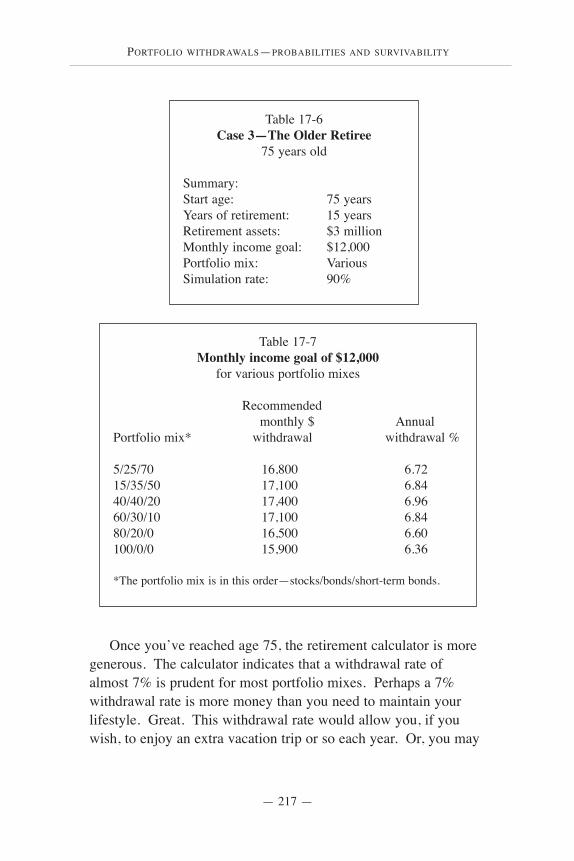
— 217 —
Once you’ve reached age 75, the retirement calculator is moregenerous. The calculator indicates that a withdrawal rate ofalmost 7% is prudent for most portfolio mixes. Perhaps a 7%withdrawal rate is more money than you need to maintain yourlifestyle. Great. This withdrawal rate would allow you, if youwish, to enjoy an extra vacation trip or so each year. Or, you may
PORTFOLIO WITHDRAWALS—PROBABILITIES AND SURVIVABILITY
Table 17-7Monthly income goal of $12,000
for various portfolio mixes
Recommended monthly $ Annual
Portfolio mix* withdrawal withdrawal %
5/25/70 16,800 6.7215/35/50 17,100 6.8440/40/20 17,400 6.9660/30/10 17,100 6.8480/20/0 16,500 6.60100/0/0 15,900 6.36
*The portfolio mix is in this order—stocks/bonds/short-term bonds.
Table 17-6Case 3—The Older Retiree
75 years old
Summary:Start age: 75 yearsYears of retirement: 15 yearsRetirement assets: $3 millionMonthly income goal: $12,000Portfolio mix: VariousSimulation rate: 90%
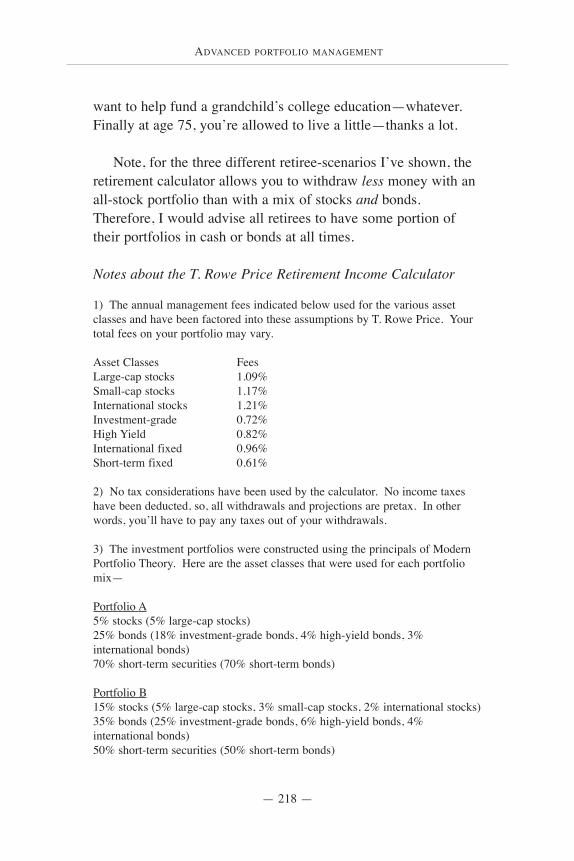
ADVANCED PORTFOLIO MANAGEMENT
— 218 —
want to help fund a grandchild’s college education—whatever.Finally at age 75, you’re allowed to live a little—thanks a lot.
Note, for the three different retiree-scenarios I’ve shown, theretirement calculator allows you to withdraw less money with anall-stock portfolio than with a mix of stocks and bonds.Therefore, I would advise all retirees to have some portion of their portfolios in cash or bonds at all times.
Notes about the T. Rowe Price Retirement Income Calculator
1) The annual management fees indicated below used for the various assetclasses and have been factored into these assumptions by T. Rowe Price. Yourtotal fees on your portfolio may vary.
Asset Classes FeesLarge-cap stocks 1.09%Small-cap stocks 1.17%International stocks 1.21%Investment-grade 0.72%High Yield 0.82%International fixed 0.96%Short-term fixed 0.61%
2) No tax considerations have been used by the calculator. No income taxeshave been deducted, so, all withdrawals and projections are pretax. In otherwords, you’ll have to pay any taxes out of your withdrawals.
3) The investment portfolios were constructed using the principals of ModernPortfolio Theory. Here are the asset classes that were used for each portfoliomix—
Portfolio A5% stocks (5% large-cap stocks)25% bonds (18% investment-grade bonds, 4% high-yield bonds, 3%international bonds)70% short-term securities (70% short-term bonds)
Portfolio B15% stocks (5% large-cap stocks, 3% small-cap stocks, 2% international stocks)35% bonds (25% investment-grade bonds, 6% high-yield bonds, 4%international bonds)50% short-term securities (50% short-term bonds)
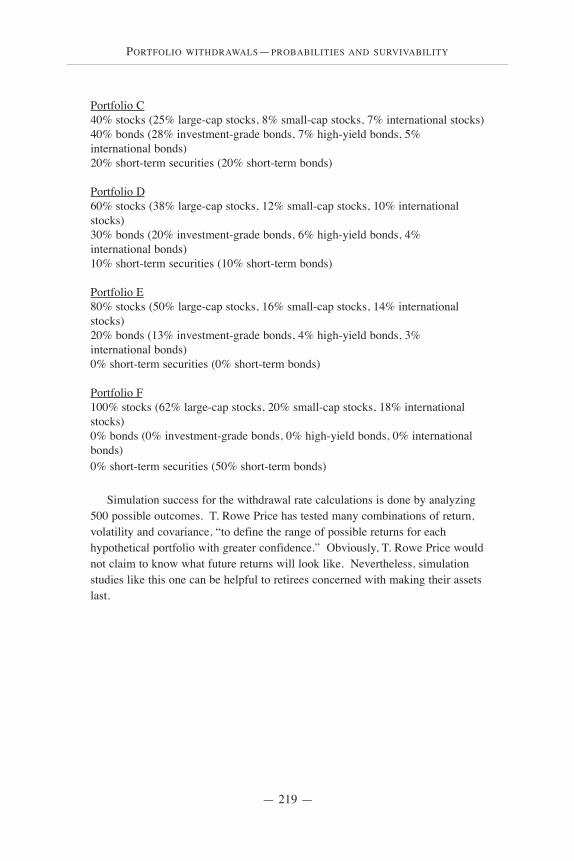
PORTFOLIO WITHDRAWALS—PROBABILITIES AND SURVIVABILITY
— 219 —
Portfolio C40% stocks (25% large-cap stocks, 8% small-cap stocks, 7% international stocks)40% bonds (28% investment-grade bonds, 7% high-yield bonds, 5%international bonds)20% short-term securities (20% short-term bonds)
Portfolio D60% stocks (38% large-cap stocks, 12% small-cap stocks, 10% internationalstocks)30% bonds (20% investment-grade bonds, 6% high-yield bonds, 4%international bonds)10% short-term securities (10% short-term bonds)
Portfolio E80% stocks (50% large-cap stocks, 16% small-cap stocks, 14% internationalstocks)20% bonds (13% investment-grade bonds, 4% high-yield bonds, 3%international bonds)0% short-term securities (0% short-term bonds)
Portfolio F100% stocks (62% large-cap stocks, 20% small-cap stocks, 18% internationalstocks)0% bonds (0% investment-grade bonds, 0% high-yield bonds, 0% internationalbonds)0% short-term securities (50% short-term bonds)
Simulation success for the withdrawal rate calculations is done by analyzing500 possible outcomes. T. Rowe Price has tested many combinations of return,volatility and covariance, “to define the range of possible returns for eachhypothetical portfolio with greater confidence.” Obviously, T. Rowe Price wouldnot claim to know what future returns will look like. Nevertheless, simulationstudies like this one can be helpful to retirees concerned with making their assetslast.
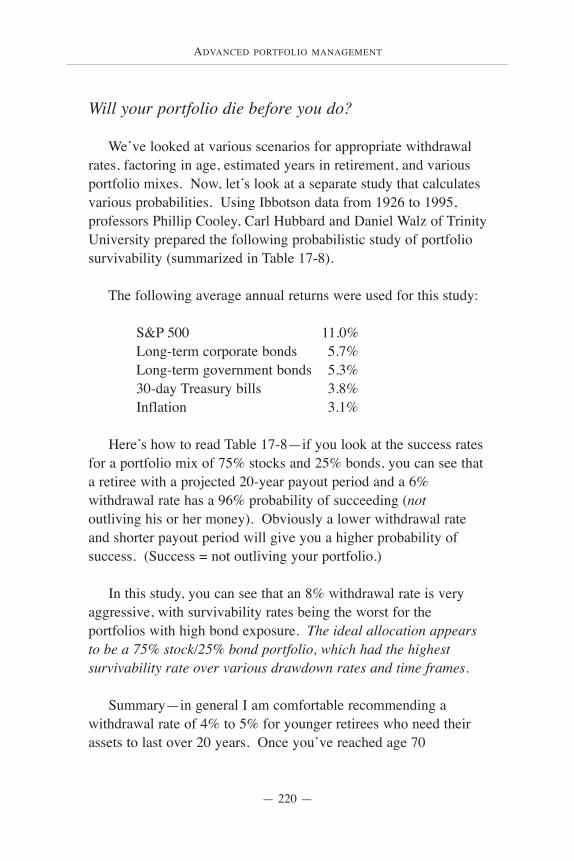
ADVANCED PORTFOLIO MANAGEMENT
— 220 —
Will your portfolio die before you do?
We’ve looked at various scenarios for appropriate withdrawalrates, factoring in age, estimated years in retirement, and various portfolio mixes. Now, let’s look at a separate study that calculatesvarious probabilities. Using Ibbotson data from 1926 to 1995,professors Phillip Cooley, Carl Hubbard and Daniel Walz of TrinityUniversity prepared the following probabilistic study of portfoliosurvivability (summarized in Table 17-8).
The following average annual returns were used for this study:
S&P 500 11.0%Long-term corporate bonds 5.7%Long-term government bonds 5.3%30-day Treasury bills 3.8%Inflation 3.1%
Here’s how to read Table 17-8—if you look at the success ratesfor a portfolio mix of 75% stocks and 25% bonds, you can see thata retiree with a projected 20-year payout period and a 6%withdrawal rate has a 96% probability of succeeding (not outliving his or her money). Obviously a lower withdrawal rateand shorter payout period will give you a higher probability ofsuccess. (Success = not outliving your portfolio.)
In this study, you can see that an 8% withdrawal rate is veryaggressive, with survivability rates being the worst for theportfolios with high bond exposure. The ideal allocation appearsto be a 75% stock/25% bond portfolio, which had the highestsurvivability rate over various drawdown rates and time frames.
Summary—in general I am comfortable recommending awithdrawal rate of 4% to 5% for younger retirees who need theirassets to last over 20 years. Once you’ve reached age 70
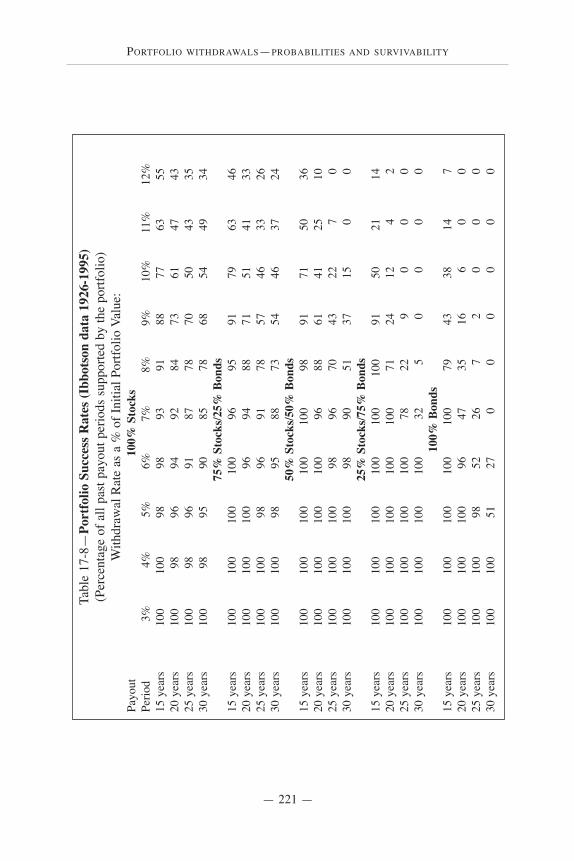
PORTFOLIO WITHDRAWALS—PROBABILITIES AND SURVIVABILITY
— 221 —
Tabl
e 17
-8—
Port
folio
Suc
cess
Rat
es (I
bbot
son
data
192
6-19
95)
(Per
cent
age
of a
ll pa
st p
ayou
t per
iods
sup
porte
d by
the
portf
olio
)W
ithdr
awal
Rat
e as
a %
of I
nitia
l Por
tfolio
Val
ue:
Payo
ut
100%
Sto
cks
Perio
d
3%
4%5%
6%7%
8%9%
10%
11%
12%
15 y
ears
100
100
9898
9391
8877
6355
20 y
ears
100
9896
9492
8473
6147
4325
yea
rs10
098
9691
8778
7050
4335
30 y
ears
100
9895
9085
7868
5449
3475
% S
tock
s/25%
Bon
ds15
yea
rs10
010
010
010
096
9591
7963
4620
yea
rs10
010
010
096
9488
7151
4133
25 y
ears
100
100
9896
9178
5746
3326
30 y
ears
100
100
9895
8873
5446
3724
50%
Sto
cks/5
0% B
onds
15 y
ears
100
100
100
100
100
9891
7150
3620
yea
rs10
010
010
010
096
8861
4125
1025
yea
rs10
010
010
098
9670
4322
70
30 y
ears
100
100
100
9890
5137
150
025
% S
tock
s/75%
Bon
ds15
yea
rs10
010
010
010
010
010
091
5021
1420
yea
rs10
010
010
010
010
071
2412
42
25 y
ears
100
100
100
100
7822
90
00
30 y
ears
100
100
100
100
325
00
00
100%
Bon
ds15
yea
rs10
010
010
010
010
079
4338
147
20 y
ears
100
100
100
9647
3516
60
025
yea
rs10
010
098
5226
72
00
030
yea
rs10
010
051
270
00
00
0

ADVANCED PORTFOLIO MANAGEMENT
— 222 —
(assuming a payout period and life expectancy of 20 years) I ammore comfortable with slightly higher withdrawals, 6% or 7%.
Stay flexible, if you can, with your withdrawal rates. If thestock market is performing poorly and you are able to withdrawslightly less from your portfolio, this may give you fewersleepless nights. When your stock portfolio recovers, you cancontinue with your higher withdrawal rates.

CREATING YOUR INCOME STREAM IN RETIREMENT
— 223 —
ONCE YOU’VE DETERMINED YOUR APPROPRIATE assetmix and annual percentage withdrawal rate for your retirement,you now need to decide how to create the income you’ll need tomaintain your lifestyle. Depending on your expenses, and whatyour fixed-income investments are yielding, you may haveenough income to live off your bond interest—your pension andsocial security may also help give you this luxury. But, maybeyou don’t have this option, and you need to supplement yourincome with additional withdrawals from your portfolio each year.I’ll discuss some withdrawal strategies in this chapter that willhopefully make the withdrawal process easier for you.
Creating your income streamin retirement
Funding your retirement is serious stuff.If you mess up you may never have a chance
to make up for your mistakes.
18
ADVANCED PORTFOLIO MANAGEMENT
— 224 —
The Bucket Approach
Funding your retirement is serious stuff. If you mess up youmay never have a chance to make up for your mistakes. That’swhy I strongly believe in having a systematic, disciplinedapproach to allocating your portfolio to create your income streamwith your retirement assets. My preferred strategy, referred to asthe Bucket Approach, allows you to create an income stream andat the same time, avoid having to sell stocks in the middle of adepressed stock market.
To create your “portfolio of buckets” you divide yourinvestable assets into four different buckets, each assuming adifferent level of risk, and each with a different purpose. At oneextreme you have your stock bucket (the riskiest), and at the otherend you have a bucket full of cash equivalents. In between aretwo buckets that contain bonds with different maturities andrisks—this can be accomplished nicely with a bond ladder. Irecommend that Bucket 2—assuming Bucket 1 holds yourcash/money-market assets—holds very short-term bonds withmaturities of 2 to 3 years. Bucket 3 will hold bonds with slightlylonger maturities, perhaps 4 to 7 years. Again, I typically don’tlike to invest in bonds with maturities greater than 7 years becauseof the added volatility due to interest rate risk. Buckets 2 and 3should help you earn a better return than if you kept all yourmoney in a money market account (or CDs).
Assuming Bucket 1 contains enough money to get you throughone full year of income needs, I would recommend that Bucket 2contain an additional 2 years of equivalent income needs andBucket 3 does the same. So, your total “safe” assets will allowyou to live at least 5 years without having to sell any stocks foryour income needs.
If you are a more conservative investor, you can hold more
CREATING YOUR INCOME STREAM IN RETIREMENT
— 225 —
than 5 years of income needs in Buckets 1, 2 and 3. But, Iwouldn’t recommend having more than 10 years of income needsin these buckets. Bucket 4—full of index-based stockinvestments—should perform much better than your otherbuckets, so I would recommend keeping the core of your portfolioin Bucket 4. (Refer back to Chapter 1 to decide what percentageof your portfolio should be invested in stocks.)
As the bonds in Bucket 2 and 3 mature, use the proceeds toreplenish Bucket 1. For example, I recommend you keep one yearof living expenses in Bucket 1. Once the first year is up, and themoney in Bucket 1 is gone, you can replenish this bucket with oneof the bonds that matured in short-term bond Bucket 2. Theprincipal from these bonds will allow you to live another year. Ifyou don’t need to replenish Bucket 1 with additional cash, use theproceeds from the maturing bonds in Bucket 2 and buy slightlylonger term bonds that will go into Bucket 3. Basically you areextending your ladder, or replenishing your buckets. Dependingon your overall allocation, you may also decide to add to yourstock holdings.
When choosing your bonds I would recommend eitherTreasuries, CDs, high-grade corporate bonds or municipals. Or,you could buy a short-term bond index fund for Bucket 2 and anintermediate-term bond index fund for Bucket 3. I preferindividual bonds for the Bucket Approach, since you can bettercontrol the flow of funds from one bucket to the next, with thematuring bonds.
The Bucket Approach at work
Buckets 1 through 3 contain approximately 5 years of incomeneeds. Bucket 4 contains your long-term stock investments forgrowth. Hopefully, over time, Bucket 4 will provide enoughgrowth in your portfolio to make up for all your withdrawals. As
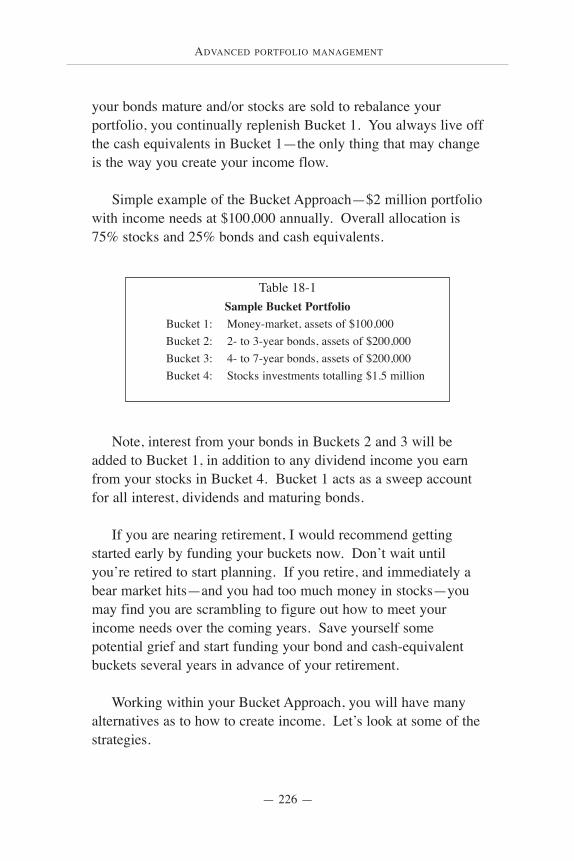
ADVANCED PORTFOLIO MANAGEMENT
— 226 —
your bonds mature and/or stocks are sold to rebalance yourportfolio, you continually replenish Bucket 1. You always live offthe cash equivalents in Bucket 1—the only thing that may changeis the way you create your income flow.
Simple example of the Bucket Approach—$2 million portfoliowith income needs at $100,000 annually. Overall allocation is75% stocks and 25% bonds and cash equivalents.
Note, interest from your bonds in Buckets 2 and 3 will beadded to Bucket 1, in addition to any dividend income you earnfrom your stocks in Bucket 4. Bucket 1 acts as a sweep accountfor all interest, dividends and maturing bonds.
If you are nearing retirement, I would recommend gettingstarted early by funding your buckets now. Don’t wait untilyou’re retired to start planning. If you retire, and immediately abear market hits—and you had too much money in stocks—youmay find you are scrambling to figure out how to meet yourincome needs over the coming years. Save yourself somepotential grief and start funding your bond and cash-equivalentbuckets several years in advance of your retirement.
Working within your Bucket Approach, you will have manyalternatives as to how to create income. Let’s look at some of thestrategies.
Table 18-1Sample Bucket Portfolio
Bucket 1: Money-market, assets of $100,000Bucket 2: 2- to 3-year bonds, assets of $200,000Bucket 3: 4- to 7-year bonds, assets of $200,000Bucket 4: Stocks investments totalling $1.5 million
CREATING YOUR INCOME STREAM IN RETIREMENT
— 227 —
Use distributions from your IRA for your income needs
Most advisors suggest withdrawing as little as possible fromtax-deferred accounts so that you can keep the tax deferral goingfor as long as possible, with more money in the tax-deferral pot.I agree with this reasoning, however, if you have a largepercentage of your total portfolio in your tax-deferred account,you shouldn’t hesitate to use some of it for income needs.Remember, taxes will be due some day on these assets. So, afteryour demise, your estate will pay the tax obligation, and, it will beat ordinary income tax rates. The tax deferral option is great formost investors, but at some point, the growth of your IRA assetsmay push you into a higher tax bracket. And, when this growth iseventually withdrawn, it is heavily taxed.
Because of high ordinary income taxes, I will sometimesadvise withdrawing assets for income needs from an IRA prior toage 70 1/2. (After 59 1/2, you are no longer penalized for makingso-called early withdrawals.) So, by taking withdrawals betweenage 59 1/2 and 70 1/2, you may keep your tax-deferred accounts at alevel where you won’t be pushed into a higher tax bracket withlarge withdrawals later on. And, by chipping away at your IRAassets, you can allow your taxable investments to continuegrowing. Your taxable assets may be subject to estate tax uponyour death (after a step up in basis), but your IRA assets, if largeenough, will be subject to both ordinary income tax and estate tax.
Making withdrawals between age 59 1/2 and 70 1/2 can alsomake sense if you are in a very low tax bracket. For example, ifyou are in the 15% tax bracket, you could take out enough moneyfrom your tax-deferred account, as long as you stay in the sametax bracket. In other words, use up the total bracket, but don’tbump yourself into the higher tax bracket. Again, by takingwithdrawals from your IRA before age 70 1/2, the assets youwithdraw now may be taxed at a lower rate than when you begin

ADVANCED PORTFOLIO MANAGEMENT
— 228 —
your mandatory withdrawals. Your account may be larger in afew years and your mandatory distributions may push you into the28% tax bracket. So, by taking some money out earlier, yourwithdrawals are actually taxed at a lower rate.
Use current income
Current income is the simplest way to create an incomestream. Regardless of how low short-term interest rates are, it islikely you will always have some income from your money-market and short-term bonds. Perhaps this income will allow youto fund a substantial portion of your income needs. And, ratherthan reinvest bond interest or stock dividends, you may simplydecide to use this money to help cover your living expenses. Thisallows you to keep your principal intact and remain invested.
Live off your reserves
If your stock dividends and bond interest are insufficient, youmay need to sell some of your stocks or bonds to supplement yourincome. If you have set up a reserve fund of short-term bondsand cash equivalents—enough to cover at least 3 years of incomeneeds—you have greatly improved your situation. (Your reservefund is essentially part of the Bucket Approach.) One of the greatadvantages is that this allows you to be very creative and flexiblewith your withdrawals. If the stock market is in decline, or in aprolonged bear market, you may not wish to sell any of yourstocks for income needs, until the market recovers. Afterwithdrawing assets from your reserve fund for a couple of years,the stock market will probably have at least partially recovered,and at that time you can sell some stocks to replenish your reservefund.
CREATING YOUR INCOME STREAM IN RETIREMENT
— 229 —
Sell winners
One of your goals when managing your portfolio is tomaintain your target asset allocation throughout retirement. Ifsome of your holdings have grown to the point where they arenow overweight, it may be a good idea to sell some of them tobring your portfolio back to its original mix. I covered this in thechapter on rebalancing.
When deciding what to sell (stocks or bonds), I typicallyrecommend selling the best recent performers in the portfolio. Ifyou don’t need all the proceeds for your income needs, I’drecommend investing some of the proceeds in your laggards. Forexample, if small-cap value stocks have performed very well, andyour equity exposure has moved beyond your comfort-zone, youcould take some of your profits and reinvest the proceeds in yourstock asset classes and sector investments that have done poorly.If small-cap value stocks have been in favor, there is a goodchance that large-cap growth or another uncorrelated asset classhasn’t done well—invest the proceeds in the underperformer.Obviously you wouldn’t like this approach if you think large-capgrowth stocks will never come back. But they will, just like smallcaps and mid caps have in recent years, after underperforming forquite a stretch. Many investors had written off small- and mid-cap stocks in recent years and loaded up on large-cap growthstocks. Well, large-cap growth has tanked and small- and mid-capstocks (value in particular) have done great. Anyway, if you havethe courage to invest some of your proceeds—whatever you don’tneed for your income needs—in the laggards, my guess is youwill be rewarded in later years.
Selling your winners and using the proceeds for income maymean you have to pay taxes. Often, however, it can be a goodmove. Be sure to consider the tax consequences of reducing yourexposure to your winning positions, then make your decision.
ADVANCED PORTFOLIO MANAGEMENT
— 230 —
Sell losers
If your winners are all in a taxable account, you may prefer tosell some of your losers for your income needs. With this strategyyou can tax-loss harvest. Or, you can use the loss to offset a gain,if necessary.
My problem with this strategy is that if you sell your losers,you are taking money from an asset class that has beenperforming poorly. If you sell some of it, you will further reduceyour exposure (it’s already reduced because of the poorperformance) so your portfolio may become too concentrated inyour winners. This defeats the purpose of diversification. And,since stock-style trends can often last several years, if you areselling a certain style for several years—since it is a laggard—your portfolio may become loaded up with one particular style(growth or value). By the time the out-of-favor style makes acomeback, you may not own any, and your performance maysuffer. Furthermore, your heavily weighted, one-style portfolio ofstocks will make your portfolio more volatile—not exactly whatyou want during retirement.
Bottom line, taxes are a huge consideration, but don’t favorselling your losers to avoid paying taxes. If you do, you may endup with a highly concentrated portfolio in one asset class and onestyle of investing (i.e., large-cap growth stocks). This may hurtyour future performance, and it will certainly make your portfolioriskier.
Using growth-oriented stock investments for income
An article that recently appeared in Investor’s Business Dailyis worth reviewing here. The article, written by Nancy Gondo,argued that having an all-stock, growth-oriented portfolio canmake sense—even if you are living off your portfolio in
CREATING YOUR INCOME STREAM IN RETIREMENT
— 231 —
retirement. She argues that you have a much better chance ofoutpacing inflation with an all growth-oriented portfolio and youcan also create your own income stream by periodically sellingyour growth-oriented stock investments.
In her article, entitled Growth Funds Can Meet Your IncomeNeeds, Nancy Gondo showed how an investment in American Century’s Growth Fund would have fared during a brutal bear market (1973-1974) and beyond, with a starting withdrawal rateof 6% annually ($500 monthly) from the fund. Beginning in1972, an investor who put $100,000 in American Century’sGrowth Fund and began withdrawing $500 on a monthly basis,would have seen his portfolio drop to $65,130 during the 1973-1974 bear market. But, Ms. Gondo argues, “if you were patientand let it ride” your portfolio was worth $141,869 in 1976. (And,you still withdrew your annual $6,000.) By the end of 2000,almost 30 years after your starting date, your account balancewould have been $7.3 million.
I cannot imagine recommending a 100% stock allocation to aretiree, and I don’t think Ms. Gondo was suggesting you have anall-stock portfolio. However, the study showed that even for avery aggressive investor with a fairly high withdrawal rate, youstill have a chance to make your assets last throughout yourlifetime—if you are patient and if history repeats itself. Two big“ifs.”
Withdrawals during a bear market
Right now we’re in the middle of the most gruesome bearmarket since 1973-1974. Retirees who loaded up on growthstocks in the late 1990s, could have losses of 30% or more. Ifthey’re also taking distributions from their portfolios annually,they may be down 40% or more in 2000-2001. And, the pain maynot be over yet. It may be many years before these investors

ADVANCED PORTFOLIO MANAGEMENT
— 232 —
recoup their losses. If you are in this situation, but you’ve createda reserve fund of 3 to 5 years of income needs, you’ve given yourstock portfolio some time to recover. If you have 3 to 5 years ofincome needs set aside, it makes it easier to be patient and waituntil your stock portfolio recovers before you sell stocks forincome.
If you have set up a reserve fund and you plan to live off thatincome during a bear market, you may still get nervous if the bearvisits for more than a couple years. What else can you do? Ifyou have been withdrawing 5% from your portfolio annuallyduring retirement, you may want to see if you can trim yourspending until the market recovers. Can you live off 4% or less?Any amount of reduced withdrawals will extend the life of yourportfolio.
DOES BUYING AND HOLDING MAKE SENSE FOR YOU?
— 233 —
I SURE WOULD LIKE TO BELIEVE IN buy-and-hold investing.I used to. I don’t now. The market action during the past fewyears has changed my mind. Beyond the ridiculous valuationsseen in the past few years, the Fed Model—written up in Barron’sand detailed by economist and market strategist, Dr. Ed Yardeni,on www.yardeni.com—has finally given me a credible alternative
Does buying and holdingmake sense for you?
What is important for the investor is that the winning formulaof buying and holding is not working any more.
In fact, it is working against him.—FELIX ZULAUF, president, Zulauf Asset Management, March 2002)
And what of Wall Street strategists? None saw the end of the bullmarket, yet we are to believe them when they all now see the end of
the bear market? None saw the recession coming, yet we are tobelieve them when they all now see a boom ahead?
—ALAN M. NEWMAN, HD Brous & Company
It’s when the music stops and the glasses are suddenly empty, whenthe party’s over, in other words, in the cold, unforgiving light of day,
that the reckoning takes place.—ALAN ABELSON, Barron’s
19
ADVANCED PORTFOLIO MANAGEMENT
— 234 —
to a buy-and-hold strategy.
But, buy and hold may not be dead. It could still work. Letme outline when I think a buy-and-hold approach works, andwhen it doesn’t. Then, you can decide what’s best for you.
When a buy-and-hold strategy works
1) When you periodically rebalance a diversified index-basedportfolio. If you own a properly diversified index-based portfolio,you could argue that a buy-and-hold strategy works. Or, let merephrase that—if you own a properly diversified portfolio amongdifferent styles and stock asset classes, you could argue that youcan always stay fully invested, as long as you periodicallyrebalance to control risk. As I’ve mentioned numerous times inthis book, rebalancing makes you take money from betterperforming investments and reinvest your proceeds in yourlaggards. If you believe in reversion-to-mean, yourunderperformers will eventually shine and outperform your recentstars. This concept isn’t new, and it is a very effective way tocontrol risk.
When the stock market crashed beginning in March 2000,most of the damage was done to large-cap growth stocks.Investors who had periodically rebalanced out of growth duringthe 1990s, and into underperforming investments—small- andmid-cap value stocks—held up very well. I ran numbers onhypothetical portfolios that had equal amounts in growth andvalue stocks in all 3 major asset classes, and the damage wasminimal. Small- and mid-cap value stocks have actually made alot of money for investors while the rest of the market has tanked.My point is that if you maintain a very balanced portfolio in 6different stock asset classes (large-, mid- and small-cap value andgrowth stocks), while periodically rebalancing, buying andholding may still work just fine.
DOES BUYING AND HOLDING MAKE SENSE FOR YOU?
— 235 —
2) When you have 10 years or more before you’ll need thismoney. Older investors, especially those who are no longerworking, have the most to lose when a bear market hits and theyhave a lot of stock exposure. They gripe that they only have somany years to make back the money they’ve lost. They’re rightto gripe. There have been times in the past when stocks havetraded within a certain range for 10 to 15 years, making it verydifficult to make money as a buy-and-hold investor. If you’reretired and you will need your money that is presently invested instocks, before 10 years, I’d make the case that a buy-and-holdstrategy isn’t for you. But, if you want to buy and hold—as longas you are diversified in all the major asset classes—for 10 yearsor more, there is a pretty darn good chance you’ll do well.Obviously, if the market is trading at extreme valuations, you’rebetter off having a lot longer time horizon than 5 years, since itmay take that long for you to get your money back—if the marketcrashes soon after you invest. Nevertheless, if you have at least a10-year time horizon for your stock money, buying and holdingwill probably work well for you.
3) When you’ve got an incredibly strong stomach and nervesof steel. Most investors are risk-averse—much more so than theyrealize. In the beginning of this book I outlined some guidelinesfor your appropriate stock allocation percentage, depending onhow much “temporary” loss you can handle. I suggested that youshould be prepared to lose 50% of your money that is invested instocks, at any given time. This may seem exaggerated, since inmost of our lifetimes we haven’t seen stocks drop this much. But, in 1973-1974, stocks dropped about 43% and they tumbledalmost 40%—from peak-to-valley— in the recent period endingSeptember 2001. Nevertheless, if you have a strong stomach andyou are emotionally and financially prepared to weather a similarpercentage loss, you could still consider a buy-and-hold approach.
ADVANCED PORTFOLIO MANAGEMENT
— 236 —
When a buy-and-hold strategy doesn’t work
1) When you heavily overweight a sector or asset class. Ifyou loaded up on tech stocks in 1999 and 2000 it will now seemobvious why you can’t buy and hold a sector or asset class that isso volatile. Tech stocks were up over 50% in 1999, but lost about40% in 2000 and another 20% or so in 2001. And, they’re downagain in Q1 2002. This is when a buy-and-hold strategy isobviously flawed—if you substantially overweight your portfolioin an asset class or sector. Sure, technology stocks may ultimatelyoutperform the broader market over the next decade or two, butlet’s admit it, you’re making a bet. Whether you are heavilyweighted in one sector in a separate sector ETF (or a broad-market index fund for that matter), you’re assuming a lot of risk.And, since your portfolio is heavily weighted to one asset class orsector, at some point you’ll want to reduce your overweighting toreduce risk. When you choose to sell will be determined by whyyou overweighted it in the first place.
Anyway, if your portfolio is heavily invested in one part of themarket, you can’t simply buy and hold forever. You must, atleast, set target allocations and periodically rebalance. This meansyou’ll be buying and selling occasionally—not buying andholding.
2) When you own individual stocks. Owning a portfolio ofindividual stocks is active management—even if you don’t moveyour money around. If heavily overweighting an asset class orsector is some form of gambling, owning individual stocks isinfinitely more frightening and speculative. Most investors reallyhave no clue what will become of their individual stocks.Companies go bankrupt or out of favor for many reasons.Regardless of your diversification—most active fund managersrecommend owning at least 60 companies for diversification—you must acknowledge you’re making a huge bet by owning a

DOES BUYING AND HOLDING MAKE SENSE FOR YOU?
— 237 —
portfolio of individual stocks. If this is your chosen method ofinvesting, you obviously cannot buy and hold. An earlier mentionin this book is also appropriate here—if you were a buy-and-holdinvestor of individual stocks at the turn of the century, you’d nowhave a portfolio with enormous weightings in railroads, buggywhip manufacturers, and women’s corsets.
So, if you own a portfolio of individual stocks, not only is thisunintelligent, but it makes a long-term, buy-and-hold strategy animpossibility.
3) When you own actively managed mutual funds. I haveadvised against buying and holding a portfolio of your ownindividual stocks. I would also advise you against buying andholding an actively managed mutual fund. Most active managersare not buy-and-hold investors. So, when you own the JanusTwenty fund, or Fidelity Magellan, you aren’t really buying andholding stocks anyway. The average turnover for an equitymutual fund is 80% annually, so there isn’t much buying andholding going on these days by the professionals. My point is, ifyou own actively managed funds you cannot buy and hold, sinceyour fund may underperform—just like your individual stocks—for ages. They say you’ve got to keep an eye on your mutual fundmanager, which to me simply means you’re going to have to firehim at some point, since his performance will inevitably be worsethan the market at some stretch. So, buying and holding anactively managed mutual fund makes about as much sense asbuying and holding individual stocks. Don’t do it.
4) If you believe there are times when stocks trade at extremeovervaluations. I now firmly believe—having lived through themarket crashes of 1987 and 2000-2001—that investors areirrational and will continue to be. Their behavior will push stocksto extreme under- and overvaluations again and again. If youbelieve this, you shouldn’t be a buy-and-hold investor. The

ADVANCED PORTFOLIO MANAGEMENT
— 238 —
difficulty is in picking an exit and eventually an entry point. But,if certain sectors or asset classes are so obviously overvalued(hindsight helps) then only the irrational investor would buy andhold. At some point it has to be common sense, but I don’t knowwhat that point is. My point is that when the market, or parts ofit, trades at extreme overvaluations, you’ve got to make an exit, atleast with some of your money. Therefore, if you believe thatmarkets can trade at extreme overvaluations, you can’t believe inbuying and holding forever.

APPLICATION OF THE FED MODEL
— 239 —
THE SO-CALLED FED MODEL offers investors a crediblealternative to a buy-and-hold strategy. The model, which I brieflydiscussed in Chapter 7, is one of many tools I use to helpdetermine the appropriate stock allocation for my clients. And, itis the only model I use for market-timing purposes.
Based on excerpts from the July 1997 Federal ReserveMonetary Policy Report, it is obvious the Federal Reserve Board
Application of the Fed Model—a good alternative
to a buy-and-hold strategy
The logic behind the indicator holds that investors are unlikely tobid stocks much higher if they are returning less in terms ofearnings than the government is paying on risk-free bonds.
—MICHAEL SANTOLI, Barron’s
Simple or not, it matters because it’s presumably what Greenspanlooks at when he’s calculating how stock market performanceshould be figured into his calculus of monetary adjustments.
Institutional Investor
Over the past 18 years, the Fed’s Model has done a prettygood job of indicating the fair value of the S&P 500.
—ANDREW BARRY, Barron’s Online
20
ADVANCED PORTFOLIO MANAGEMENT
— 240 —
regards the Fed Model as a pretty good indicator of whetherstocks are under- or overvalued. Dr. Ed Yardeni, formerly ofDeutsche Banc AB, discovered the following write-up, buried in aFed Monetary Report. He later popularized the Fed Model on hisWeb site www.yardeni.com.
Excerpt from Fed’s July 1997 Monetary Report:
The run-up in stock prices in the spring wasbolstered by unexpectedly strong corporate profitsfor the first quarter. Still, the ratio of prices in theS&P 500 to consensus estimates of earnings overthe coming 12 months has risen further from levelsthat were already unusually high. Changes in thisratio have often been inversely related to changesin long-term Treasury yields, but this year’s stockprice gains were not matched by a significant netdecline in interest rates. As a result, the yield on10-year Treasury notes now exceeds the ratio of 12-month-ahead earnings to prices by the largestamount since 1991, when earnings were depressedby the economic slowdown. One important factorbehind the increase in stock prices this yearappears to be a further rise in analysts’ reportedexpectations of earnings growth over the next 3 to5 years. The average of these expectations hasrisen fairly steadily since early 1995 and currentlystands at a level not seen since the steep recessionof the early 1980s, when earnings were expected tobounce back from levels that were quite low.
Source: Dr. Ed Yardeni (www.yardeni.com)
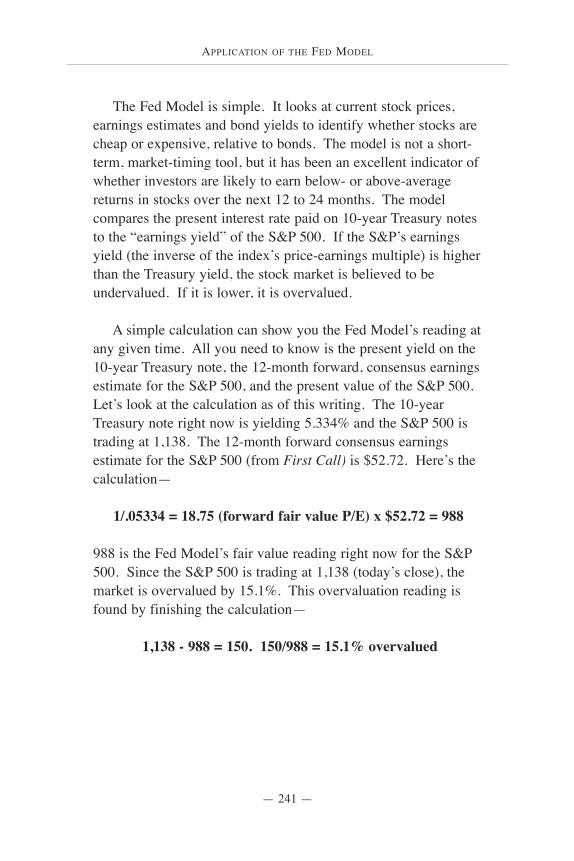
APPLICATION OF THE FED MODEL
— 241 —
The Fed Model is simple. It looks at current stock prices,earnings estimates and bond yields to identify whether stocks arecheap or expensive, relative to bonds. The model is not a short-term, market-timing tool, but it has been an excellent indicator ofwhether investors are likely to earn below- or above-averagereturns in stocks over the next 12 to 24 months. The modelcompares the present interest rate paid on 10-year Treasury notesto the “earnings yield” of the S&P 500. If the S&P’s earningsyield (the inverse of the index’s price-earnings multiple) is higherthan the Treasury yield, the stock market is believed to beundervalued. If it is lower, it is overvalued.
A simple calculation can show you the Fed Model’s reading atany given time. All you need to know is the present yield on the10-year Treasury note, the 12-month forward, consensus earningsestimate for the S&P 500, and the present value of the S&P 500.Let’s look at the calculation as of this writing. The 10-yearTreasury note right now is yielding 5.334% and the S&P 500 istrading at 1,138. The 12-month forward consensus earningsestimate for the S&P 500 (from First Call) is $52.72. Here’s thecalculation—
1/.05334 = 18.75 (forward fair value P/E) x $52.72 = 988
988 is the Fed Model’s fair value reading right now for the S&P500. Since the S&P 500 is trading at 1,138 (today’s close), themarket is overvalued by 15.1%. This overvaluation reading isfound by finishing the calculation—
1,138 - 988 = 150. 150/988 = 15.1% overvalued
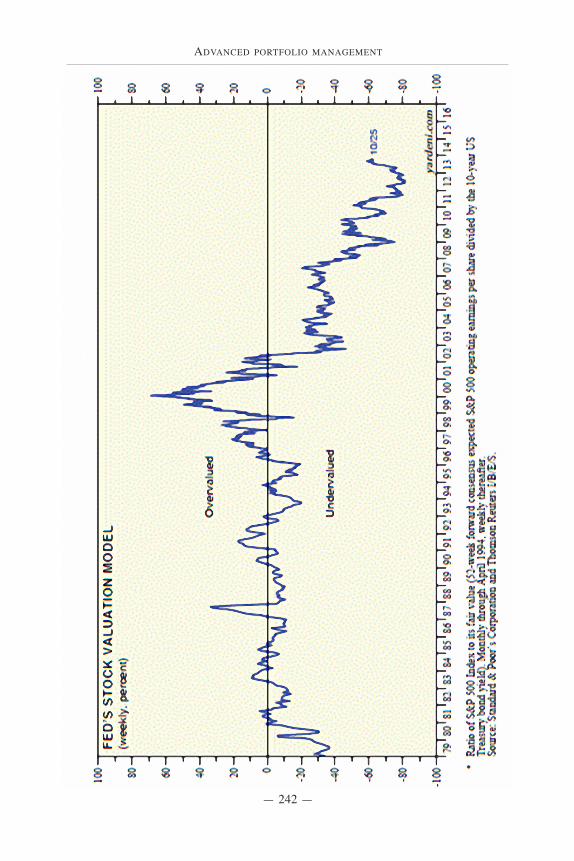
ADVANCED PORTFOLIO MANAGEMENT
— 242 —
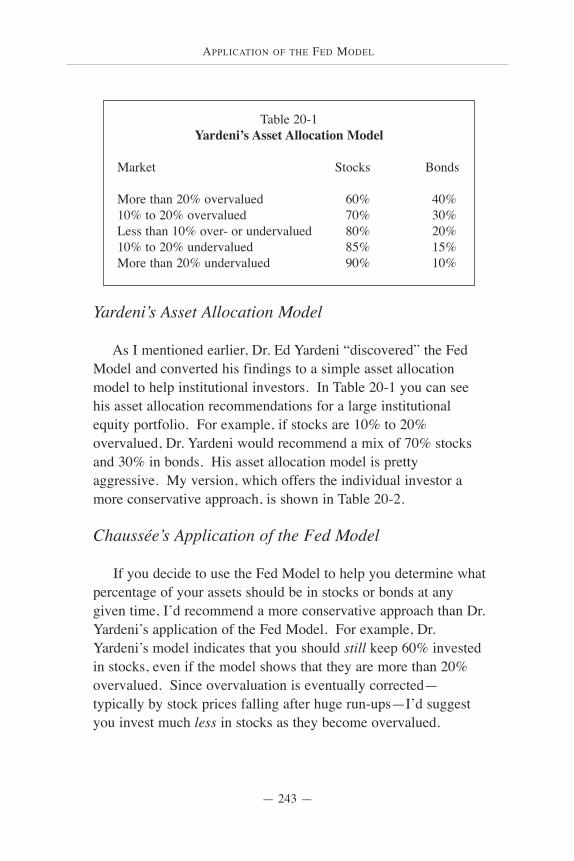
APPLICATION OF THE FED MODEL
— 243 —
Yardeni’s Asset Allocation Model
As I mentioned earlier, Dr. Ed Yardeni “discovered” the FedModel and converted his findings to a simple asset allocationmodel to help institutional investors. In Table 20-1 you can seehis asset allocation recommendations for a large institutionalequity portfolio. For example, if stocks are 10% to 20%overvalued, Dr. Yardeni would recommend a mix of 70% stocksand 30% in bonds. His asset allocation model is prettyaggressive. My version, which offers the individual investor amore conservative approach, is shown in Table 20-2.
Chaussée’s Application of the Fed Model
If you decide to use the Fed Model to help you determine whatpercentage of your assets should be in stocks or bonds at anygiven time, I’d recommend a more conservative approach than Dr.Yardeni’s application of the Fed Model. For example, Dr.Yardeni’s model indicates that you should still keep 60% investedin stocks, even if the model shows that they are more than 20%overvalued. Since overvaluation is eventually corrected—typically by stock prices falling after huge run-ups—I’d suggestyou invest much less in stocks as they become overvalued.
Table 20-1Yardeni’s Asset Allocation Model
Market Stocks Bonds
More than 20% overvalued 60% 40%10% to 20% overvalued 70% 30%Less than 10% over- or undervalued 80% 20%10% to 20% undervalued 85% 15%More than 20% undervalued 90% 10%
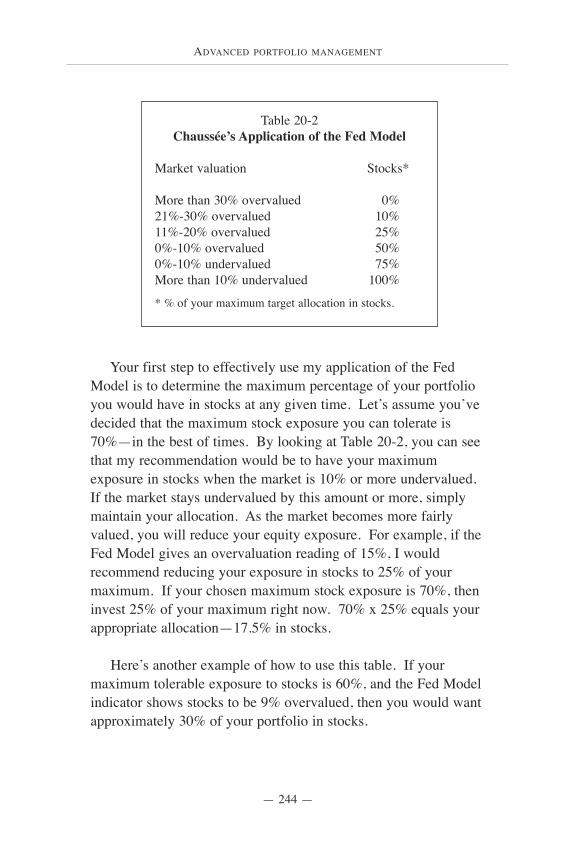
ADVANCED PORTFOLIO MANAGEMENT
— 244 —
Your first step to effectively use my application of the FedModel is to determine the maximum percentage of your portfolioyou would have in stocks at any given time. Let’s assume you’vedecided that the maximum stock exposure you can tolerate is70%—in the best of times. By looking at Table 20-2, you can seethat my recommendation would be to have your maximumexposure in stocks when the market is 10% or more undervalued.If the market stays undervalued by this amount or more, simplymaintain your allocation. As the market becomes more fairlyvalued, you will reduce your equity exposure. For example, if theFed Model gives an overvaluation reading of 15%, I wouldrecommend reducing your exposure in stocks to 25% of yourmaximum. If your chosen maximum stock exposure is 70%, theninvest 25% of your maximum right now. 70% x 25% equals yourappropriate allocation—17.5% in stocks.
Here’s another example of how to use this table. If yourmaximum tolerable exposure to stocks is 60%, and the Fed Modelindicator shows stocks to be 9% overvalued, then you would wantapproximately 30% of your portfolio in stocks.
Table 20-2Chaussée’s Application of the Fed Model
Market valuation Stocks*
More than 30% overvalued 0% 21%-30% overvalued 10%11%-20% overvalued 25%0%-10% overvalued 50%0%-10% undervalued 75%More than 10% undervalued 100%
* % of your maximum target allocation in stocks.
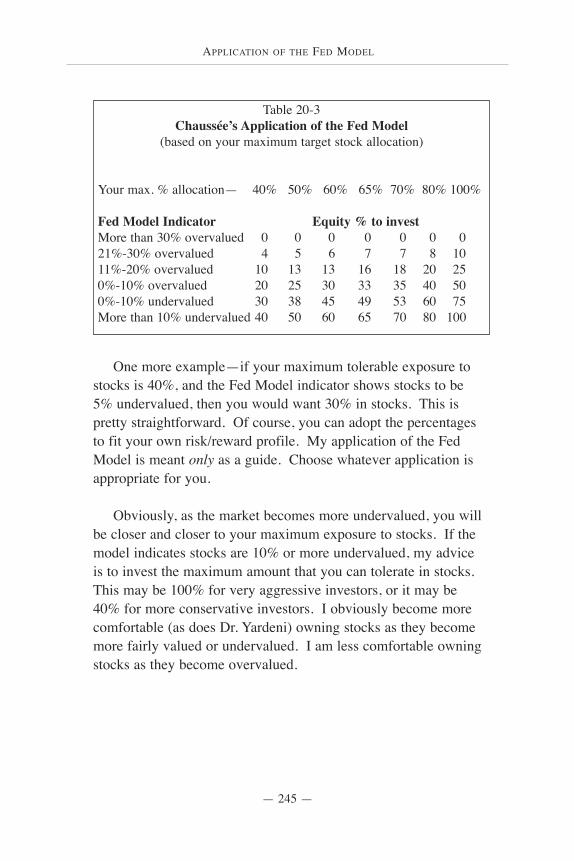
APPLICATION OF THE FED MODEL
— 245 —
One more example—if your maximum tolerable exposure tostocks is 40%, and the Fed Model indicator shows stocks to be5% undervalued, then you would want 30% in stocks. This ispretty straightforward. Of course, you can adopt the percentagesto fit your own risk/reward profile. My application of the FedModel is meant only as a guide. Choose whatever application isappropriate for you.
Obviously, as the market becomes more undervalued, you willbe closer and closer to your maximum exposure to stocks. If themodel indicates stocks are 10% or more undervalued, my adviceis to invest the maximum amount that you can tolerate in stocks.This may be 100% for very aggressive investors, or it may be40% for more conservative investors. I obviously become morecomfortable (as does Dr. Yardeni) owning stocks as they becomemore fairly valued or undervalued. I am less comfortable owningstocks as they become overvalued.
Table 20-3Chaussée’s Application of the Fed Model
(based on your maximum target stock allocation)
Your max. % allocation— 40% 50% 60% 65% 70% 80% 100%
Fed Model Indicator Equity % to investMore than 30% overvalued 0 0 0 0 0 0 021%-30% overvalued 4 5 6 7 7 8 1011%-20% overvalued 10 13 13 16 18 20 250%-10% overvalued 20 25 30 33 35 40 500%-10% undervalued 30 38 45 49 53 60 75More than 10% undervalued 40 50 60 65 70 80 100
ADVANCED PORTFOLIO MANAGEMENT
— 246 —
Your risk profile can help determine your application ofthe Fed Model
Because no stock valuation model is infallible, I would suggestyou choose one of several approaches to using the Fed Model. Iwill label them according to your risk profile.
Aggressive investor
You are a growth-oriented investor who is not concerned withportfolio volatility. You seek maximum returns in the stockmarket by maintaining a high stock allocation at all times. Youtypically have 80% to 100% of your investable assets in stocks,regardless of valuations. Obviously your investment time horizonis long. My advice for the aggressive investor is to basicallyignore the Fed Model. Having said that, I would certainly adviseeven the most aggressive investors to exit stocks if they areovervalued by 30% or more. At a minimum you should rebalanceinto stock asset classes that are “relatively” undervalued at thetime.
Moderately-aggressive investor
Like the aggressive investor, you are also growth-oriented.But, you recognize that you are not comfortable having all of yourmoney invested in stocks, all the time. Your maximum stockallocation is somewhere between 70% and 80%. Your timehorizon is many years—10 years or more—and you have a fairlyhigh tolerance for risk. My advice for the moderately-aggressiveinvestor is to follow the Fed Model and reallocate according tomy recommendations in Table 20-2. You may wish to adopt yourown percentages, using the table as a guide. At a minimum, Iwould act—decrease or increase your stock exposure—at extremevaluations. Historically, an overvaluation of more than 20% wasextreme, and an undervaluation of more than 10% was also
APPLICATION OF THE FED MODEL
— 247 —
extreme. During these “extreme” periods, I would recommendadjusting your allocation. Own your highest percentage of stockswhen the Fed Model reads that stocks are fairly valued orundervalued. As stocks become overvalued, reduce yourexposure.
Moderate-risk investor
You are somewhat growth-oriented, but you are also veryconcerned with protecting principal and controlling risk in yourportfolio. This profile probably fits most retirees. Your maximumstock allocation would probably be about 70%, but you generallykeep between 55% and 65% in stock investments. My advice forthe moderate-risk investor is to follow the Fed Model andreallocate according to my recommendations. Again, own yourhighest percentage of stocks when the Fed Model reads that stocksare fairly valued or undervalued. As stocks become overvalued,reduce your exposure per my recommendations. Also, useperiodic rebalancing to control risk.
Conservative investor
Your primary investment objective is to protect principal. Youare very conservative by nature and your maximum stockallocation is probably somewhere between 40% and 55%. Whileyour time horizon may be more than 10 years, you cannot handlethe volatility of the stock market, and you prefer to maintain ahigh percentage of your portfolio in safe investments—short-termbonds and cash equivalents. You are aware that owning bondswill not allow you to create wealth—after taxes and inflation.But, your conservative allocation allows you to sleep well, evenwhen stocks are getting hammered. My advice to theconservative investor is to follow the Fed Model and reallocateaccording to my recommendations. Like most investors, youshould own your highest percentage of stocks when stocks are
ADVANCED PORTFOLIO MANAGEMENT
— 248 —
fairly valued or undervalued. As stocks become overvalued,decrease your exposure to reduce risk. If stocks becomesignificantly overvalued (20% or more), be certain to substantiallyreduce your equity holdings while continuing to periodicallyrebalance your portfolio.
Skeptical investor—Approach A
Some investors may not want to try to time the market. Theydon’t want to bother with it, don’t believe in it—whatever. If thisfits your profile you may still want to pay attention to the FedModel and act during extreme valuation periods. For example, in1979-1980, the Fed Model indicated that stocks were extremelyundervalued (-30% to -35%). Even the skeptic may have steppedup at this point and allocated more money to stocks. There havebeen four extreme undervalued markets, according to the model,since 1979. At some point in 1979, 1980, 1993 and 1996 stockswere undervalued by 20% or more. I think these extremeswarrant some sort of action, from even the most passive investors.I would choose the 20% target percentage as a pretty good pointfor extremes, on either side of the fair value indicator in themodel. If stocks are 20% or more under- or overvalued, I wouldsuggest adjusting your asset allocation. Perhaps you may onlyreduce or increase your exposure to stocks by a nominal amount(5% to 10%). Still, the fact that you did something may make youfeel better—if the model turns out to be right.
Skeptical investor—Approach B
Since timing the stock market is notoriously difficult, theskeptical investor may be wary of exiting the market simplybecause the Fed Model says its overvalued. I totally understandthis. So, the skeptic may want to keep a maximum stockallocation at all times—like the aggressive investor. But theskeptic could alter his stock allocation by reallocating money into
APPLICATION OF THE FED MODEL
— 249 —
defensive stocks, when the Fed Model indicates an extremeovervaluation. In this way, he will probably lose less than if hehad stayed with aggressive growth investments. The beauty ofthis approach is that you’ll probably make money if the FedModel is “wrong” for an extended period like in 1999-2000—your defensive stocks will more than likely do better than cash orbonds. So, the skeptic may want to stay in stocks, up to his or hermaximum percentage allocation, but rebalance into defensiveissues (health care, utilities, consumer staples, small- and mid-capvalue), if the market is significantly overvalued.
Fed Model—only as good as the earnings estimates
Dr. Yardeni stresses that the Fed Model is only as good as theearnings estimates that are applied to the calculation. And,earnings estimates can vary widely. There is obviously a hugediscrepancy in the anticipated earnings per share for the S&P 500.Look at Table 20-4. Depending on whether you apply the low-end estimate of $36 per share from J.P. Morgan, or the high-endnumber of $61 per share from CIBC World Markets, the FedModel’s reading will change dramatically. For example, as of thiswriting, the S&P 500 is trading at about 1,138. The 10-YearTreasury note is yielding 5.334%. If I use the low-end number of$36 per share, fair value for the S&P 500 is 675. Or, in otherwords, the market is presently overvalued by 68%. If I use thehigh-end number of $61 per share, the market is undervalued by alittle less than 1%. Huge difference.
I’d advise using the consensus earnings estimates compiled byThomson Financial/First Call. This weeds out the extremeestimates and forms a consensus number, that, when applied to theFed Model, has been pretty accurate. First Call also places itsown forward earnings estimates (Q4’02) on the S&P 500. Rightnow, according to First Call’s Web site, it has estimated earningsto be $48 per share versus the consensus of about $52 per share.
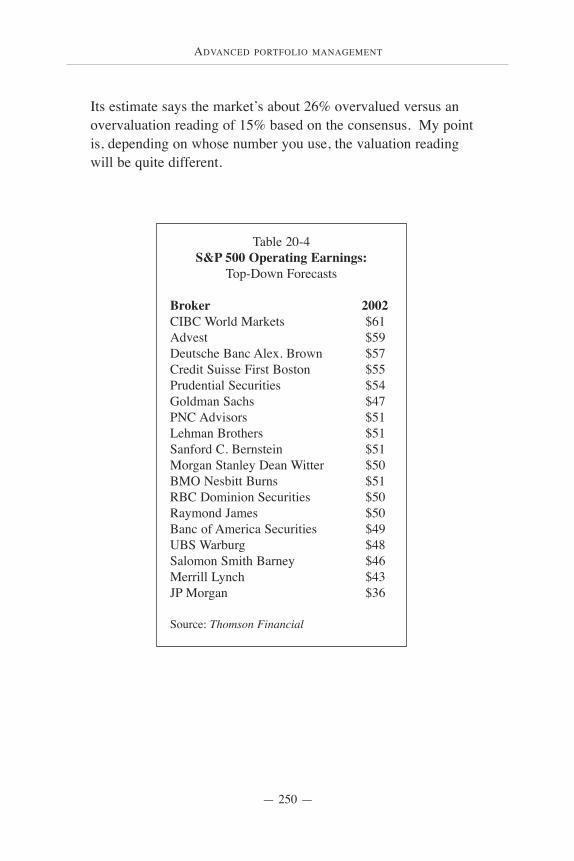
ADVANCED PORTFOLIO MANAGEMENT
— 250 —
Its estimate says the market’s about 26% overvalued versus anovervaluation reading of 15% based on the consensus. My pointis, depending on whose number you use, the valuation readingwill be quite different.
Table 20-4S&P 500 Operating Earnings:
Top-Down Forecasts
Broker 2002CIBC World Markets $61Advest $59Deutsche Banc Alex. Brown $57Credit Suisse First Boston $55Prudential Securities $54Goldman Sachs $47PNC Advisors $51Lehman Brothers $51Sanford C. Bernstein $51Morgan Stanley Dean Witter $50BMO Nesbitt Burns $51RBC Dominion Securities $50Raymond James $50Banc of America Securities $49UBS Warburg $48Salomon Smith Barney $46Merrill Lynch $43JP Morgan $36
Source: Thomson Financial
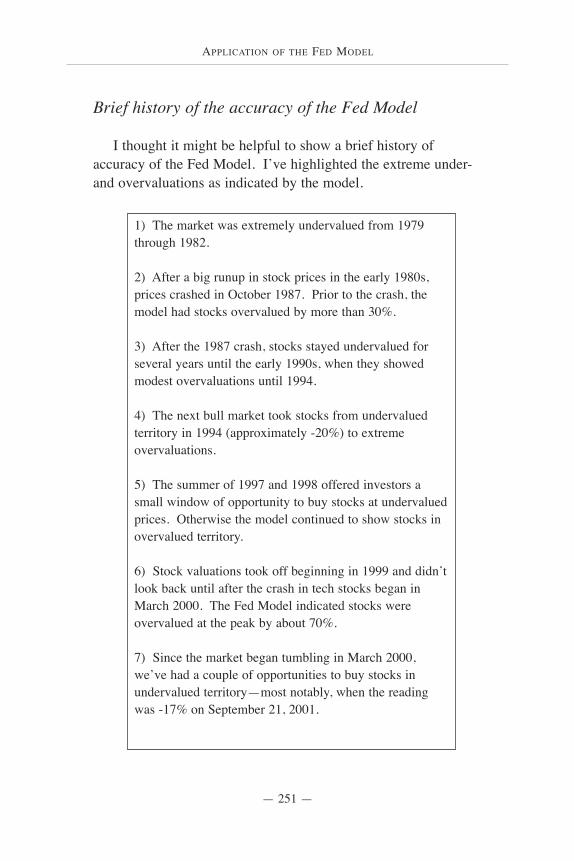
APPLICATION OF THE FED MODEL
— 251 —
Brief history of the accuracy of the Fed Model
I thought it might be helpful to show a brief history ofaccuracy of the Fed Model. I’ve highlighted the extreme under-and overvaluations as indicated by the model.
1) The market was extremely undervalued from 1979through 1982.
2) After a big runup in stock prices in the early 1980s,prices crashed in October 1987. Prior to the crash, themodel had stocks overvalued by more than 30%.
3) After the 1987 crash, stocks stayed undervalued forseveral years until the early 1990s, when they showedmodest overvaluations until 1994.
4) The next bull market took stocks from undervaluedterritory in 1994 (approximately -20%) to extremeovervaluations.
5) The summer of 1997 and 1998 offered investors asmall window of opportunity to buy stocks at undervaluedprices. Otherwise the model continued to show stocks inovervalued territory.
6) Stock valuations took off beginning in 1999 and didn’tlook back until after the crash in tech stocks began inMarch 2000. The Fed Model indicated stocks wereovervalued at the peak by about 70%.
7) Since the market began tumbling in March 2000,we’ve had a couple of opportunities to buy stocks inundervalued territory—most notably, when the readingwas -17% on September 21, 2001.
ADVANCED PORTFOLIO MANAGEMENT
— 252 —
Summary
Many professionals have challenged the accuracy of the overlysimplistic Fed Model. In his informative book entitled Outpacingthe Pros; Using Indexes to beat Wall Street’s Savviest MoneyMangers, author David Blitzer (chairman of Standard & Poor’sIndex Committee), suggested the Fed Model had worked well“until recently.” “Recently” meant until 2000. Well, if his bookhad been published a year later, he would have revised hisstatement—the Fed Model ended up working perfectly. Stockprices reverted from a very overvalued level to undervalued byabout 17% in September 2001. Anyway, Blitzer commented inhis book that the Fed Model had previously worked well, but ithad recently “fallen short of real values.” In May of 2000, theFed Model gave the S&P 500 a fair valuation at 1,000, but it wastrading at 1,400. Blitzer attributed this 40% overvaluation “error”to market psychology—which can push stocks to extreme over- orundervaluations. Although it appeared the Fed Model had failedto account for “psychological factors” and was therefore grosslyinaccurate, with a little patience, the model showed that itsreading—as outrageous as it seemed at the time—was right ontarget.
Final note on the Fed Model—
First Call’s “Market Valuation Commentary” on its Web site(www.firstcall.com) makes an important point about the FedModel that I would like to call to your attention. As interest ratesdrop to unusually low levels, the validity of the Fed Model comesinto question. First Call states that “the relationship of thereciprocal of the interest yield to the P/E ratio is not a linear one.”This relationship, as shown in the historical accuracy of the FedModel, is close to linear “where interest rates normally fall.” But,it is obvious that as interests rates drop to unusually low levels,the formula doesn’t hold up. First Call uses the example of Japan
APPLICATION OF THE FED MODEL
— 253 —
and the 10-year note yield at 1%. This would imply a fair marketP/E for the Japanese stock market of 100 times earnings. Foryour interest, right now the Fed Model, when applied to theJapanese stock market, does shows an undervaluation reading ofabout 50%. This proves First Call’s point. “The conclusionshould be that, because of the non-linear relationship, the impliedlinear relationship of the formula overstates the fair value P/E atlow interest rates.” If our domestic interest rates drop toridiculously low levels, like in Japan, the accuracy of this modelwill be questioned.
One more note on the Fed Model—
Just before this book went to press, Dr. Ed Yardeni’s Web site(www.yardeni.com), which showed the Fed Model changes dailyand historical data for the model, went “off the air.” Dr. Yardenihas recently accepted a position at Prudential Securities, Inc. (hewas formerly with Deutsche Banc Alex Brown), and I have noidea whether or not his Web site will reappear in the future. I nowcalculate the Fed Model’s reading on my own (Yardeni’s sitepreviously did the work for me). Here’s where to find the data tomake your own calculation—
1) Check the consensus earnings estimates for the S&P 500 onwww.firstcall.com “market commentary.”
2) Find the 10-Year Treasury note’s yield on www.yahoo.com‘finance’ or www.bloomberg.com.
3) Find the present value of the S&P 500 (available on the sameWeb sites listed above).
4) Calculate fair value for the market using the formula on page241.
ADVANCED PORTFOLIO MANAGEMENT
— 254 —
AN EASY WAY TO DEFINE AN INDEX is that it is a model ortarget portfolio of securities. It could be an index of bonds,stocks, real estate—whatever. The major indexes are compiled,managed and published by various financial organizations. Themost well-known stock indexes are the Dow Jones Industrials andthe S&P 500. The Dow is published by Dow Jones & Co. and theS&P 500 is published by Standard & Poor’s, a division ofMcGraw Hill Companies. In addition, a number of exchangesalso publish indexes based on the stocks that trade on anexchange—Nasdaq Composite and NYSE Composite are twoexamples. There are also indexes that are published by financialadvisory companies like the Wilshire 5000, published by WilshireAssociates, and the Russell 2000, published by Frank Russell &Company.
Stock indexes
Russell relies not just on a stock’s historicalprice-to-book ratio, but also its forward-looking
ratio based on analysts’ five-year growth estimate.—KEN HOOVER, Investor’s Business Daily
21
STOCK INDEXES
— 255 —
Standard & Poor’s
Standard & Poor’s is the leader in the securities industry, basedon dollars managed against its indexes (roughly $1 trillion). Itsmost widely followed index is the S&P 500. This is thebenchmark for performance comparison purposes for mostprofessional money managers and mutual fund managers. TheS&P 500 consists of 500 companies in the U.S. market. Theindex seeks to represent the economy as a whole (all sectors of theeconomy are represented in the index).
The S&P 500 is managed by a committee of 9 people. Theyare all employees of Standard & Poor’s. These employeesdetermine which stocks will be added or deleted from the indexeach year. The stocks represented in the index are thereforedetermined by a committee, which is different from other indexeswhose underlying components are chosen strictly on marketcapitalization or some computer model.
The S&P committee meets monthly to review corporateactions, mergers, acquisitions and reorganizations involvingcompanies in the index. In addition, they will review candidatesfor the index. The index is rebalanced on an ongoing basisthroughout the year—unlike some indexes that are rebalanced onone given day each year. Standard & Poor’s indexes are market-cap weighted. This means the greater the capitalization of thecompany in an index, the more important its returns. In early2000, the largest 35 companies in the S&P 500 index (remember,there are 500 companies), for example, made up about 50% of thecapitalization of the whole index. So, their stock prices greatlyimpacted the returns of the index itself. There are approximately30 to 50 companies removed and added to this index each year.(See Table 21-6 for turnover stats of the major S&P indexes.)
Standard & Poor’s has also created other well-known indexes.
ADVANCED PORTFOLIO MANAGEMENT
— 256 —
The S&P 400 is a widely followed index of 400 mid-capcompanies. Like the S&P 500, it is also market-cap weighted. Inaddition to the mid-cap index, Standard & Poor’s publishes asmall-cap index, the S&P 600. This is not as widely followed asthe Russell 2000 (the widely-accepted benchmark for small-capstocks).
S&P/Barra Indexes
In 1992, Standard & Poor’s and Barra began a collaboration toproduce the value and growth subsets of the S&P indexes. Thevalue and growth indexes are constructed by dividing stocks in theindex by one attribute—price-to-book ratio. This divides thebroad-based indexes into two components—growth and value.The growth portion of the indexes contains stocks with higherprice-to-book ratios, while the value portion contains stocks withlow price-to-book ratios. Each company is assigned to eithergrowth or value, and there is no overlap.
The value and growth portions of the large, broad-basedindexes can be bought through ETFs for the S&P 400, 500 and600—they cover mid-, large-, and small-cap stocks, respectively.
Dow Jones & Company
Dow Jones is the publisher of the most widely followed indexin the world—the Dow Jones Industrial Average. This index is asimple, price-weighted index of 30 leading companies chosen by acommittee of editors from the The Wall Street Journal (publishedby Dow Jones & Company). The Dow has been around since thelate 1800s. The Dow Jones comprises only 30 companies, but it offers good representation of the entire U.S. economy andmarket—it’s highly correlated to the S&P 500.
One unique aspect about the calculation of the Dow Jones
STOCK INDEXES
— 257 —
Industrial Average is that it is price weighted. The prices of thecomponents in the average are added up and divided by a certaindivisor. The price-weighted index has the drawback of not basingits gain or loss for any given day on percentages—they are basedon changes in price. Therefore, a $100 stock that moves $2 willhave a much greater impact on the average than anothercomponent whose stock is trading at $20 and it moves $2. The $2movement in the $20 stock is a much greater percentage move,but because of the way the Dow is calculated, the $2 move in thehigher priced stock will have a greater impact on the average.
Other indexes compiled by Dow Jones & Company that maybe familiar to you are the Dow Transports and Utilities. These arealso price-weighted indexes whose components are chosen bycommittee.
Frank Russell Company
The Frank Russell Company is responsible for the Russell2000 index, the widely followed benchmark for small-cap stocks.In addition to the Russell 2000, Russell has a number of otherindexes that are used as benchmarks for professional moneymanagers. In total, there are approximately $175 billionbenchmarked to Russell indexes.
The Russell indexes are reconstituted annually based onformulas that are computer generated. Unlike the Dow Jones andS&P indexes, Russell rebalances its 21 different stock indexes ononly one day of the year—May 31. The indexes register thesechanges on July 1, and the changes remain in place until the nextyear.
The larger Russell indexes, which are a blend of growth andvalue stocks, are cap-weighted. The growth and value indexes aredivided by price-to-book ratios and forecasts of earnings growth
ADVANCED PORTFOLIO MANAGEMENT
— 258 —
per share. The methodology for reconstitution of these indexes isproprietary. What is interesting to note is that, unlike the S&Pvalue and growth indexes, the Russell value and growth indexesmay actually contain some of the same stocks. Under Russell’sproprietary methodology, roughly 70% of the Russell 3000, 2000and 1000 indexes are classified as either growth or value stocks.But, the remaining stocks are assigned both a value and a growthpercentage, based on the degree to which they lean toward growthor value. For example, a company that is given a 70% growthweighting will have a 30% value weighting in the other index.
The Russell 3000 contains the 3,000 largest stocks in the U.S.The Russell 1000 is made up of the 1,000 largest stocks of theRussell 3000. The Russell 2000 contains the remaining 2,000stocks from the Russell 3000. Obviously, the Russell 3000 is atotal market index, while the Russell 1000 is mostly large-cap andmid-cap stocks. The Russell 2000 is basically a small-cap index.Since these indexes are cap-weighted, the Russell 3000 and theRussell 1000 are very highly correlated—the large companiesdominate both of these indexes. I ran a chart onwww.bigcharts.com to compare the performance of the S&P 500with the Russell 3000 and 1000 indexes, and the returns werebasically identical. Again, the reason for this is that these indexesare all cap-weighted, and the largest companies in each index areall the same.
Wilshire Associates
Wilshire Associates, like the Frank Russell Company, isanother index provider. Wilshire Associates is particularly wellknown for its Wilshire 5000 index. The Wilshire 5000 isgenerally referred to as the total market index. It represents theentire U.S. stock market, but since it is also cap-weighted, itsreturns are heavily weighted in the largest companies in the index.So, its returns are highly correlate to the Dow Jones Industrial
STOCK INDEXES
— 259 —
Average, S&P 500, Russell 3000 and Russell 1000.
Wilshire Associates has other indexes that are mostly followedby professionals. Most notably, the Wilshire 4500 is an index thatexcludes the top 500 companies of the Wilshire 5000. It tracksthe mid- and small-cap asset classes.
Nasdaq Composite
The Nasdaq Composite tracks companies that trade on theNasdaq Exchange. There are over 8,000 companies represented inthis composite. Like all the other major indexes—excluding theDow Jones Industrial Average—the Nasdaq Composite is a cap-weighted index. Therefore, the large technology companies thattrade on the Nasdaq greatly determine the performance of thisindex.
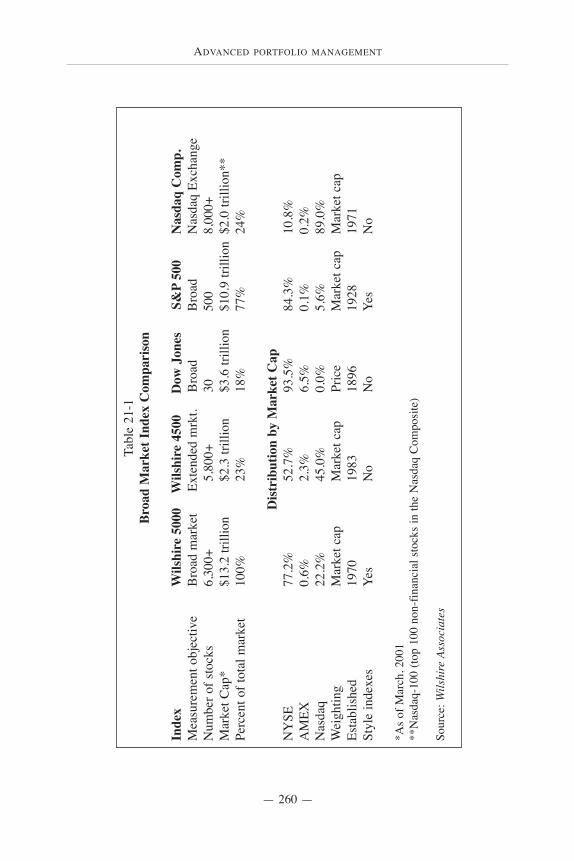
ADVANCED PORTFOLIO MANAGEMENT
— 260 —
Tabl
e 21
-1Br
oad
Mar
ket I
ndex
Com
pari
son
Inde
xW
ilshi
re 5
000
Wils
hire
450
0D
ow J
ones
S&P
500
Nas
daq
Com
p.M
easu
rem
ent o
bjec
tive
Bro
ad m
arke
t
Ext
ende
d m
rkt.
Bro
adB
road
N
asda
q Ex
chan
geN
umbe
r of s
tock
s6,
300+
5,80
0+30
500
8,00
0+M
arke
t Cap
*$1
3.2
trilli
on$2
.3 tr
illio
n$3
.6 tr
illio
n$1
0.9
trilli
on$2
.0 tr
illio
n**
Perc
ent o
f tot
al m
arke
t10
0%23
%18
%77
%24
%
Dist
ribu
tion
by M
arke
t Cap
NY
SE77
.2%
52.7
%93
.5%
84.3
%10
.8%
AM
EX0.
6%2.
3%6.
5%0.
1%0.
2%N
asda
q22
.2%
45.0
%0.
0%5.
6%89
.0%
Wei
ghtin
gM
arke
t cap
Mar
ket c
apPr
ice
Mar
ket c
apM
arke
t cap
Esta
blis
hed
1970
1983
1896
1928
1971
Styl
e in
dexe
s Ye
sN
oN
oYe
sN
o
*As
of M
arch
, 200
1**
Nas
daq-
100
(top
100
non-
finan
cial
sto
cks
in th
e N
asda
q C
ompo
site
)
Sour
ce: W
ilshi
re A
ssoc
iate
s
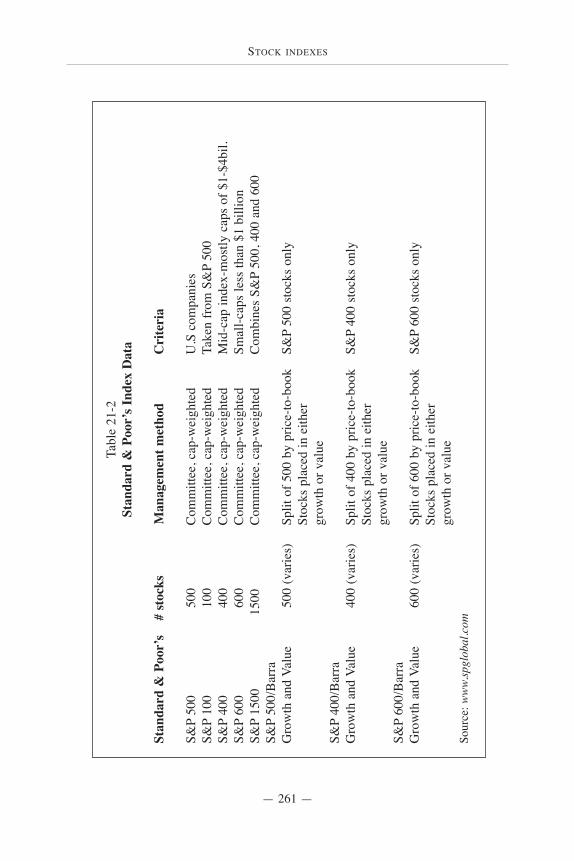
STOCK INDEXES
— 261 —
Tabl
e 21
-2St
anda
rd &
Poo
r’s I
ndex
Dat
a
Stan
dard
& P
oor’
s #
stoc
ks
M
anag
emen
t met
hod
Cri
teri
a
S&P
500
500
Com
mitt
ee, c
ap-w
eigh
ted
U.S
com
pani
esS&
P10
010
0C
omm
ittee
, cap
-wei
ghte
dTa
ken
from
S&
P50
0S&
P40
040
0C
omm
ittee
, cap
-wei
ghte
dM
id-c
ap in
dex-
mos
tly c
aps
of $
1-$4
bil.
S&P
600
600
Com
mitt
ee, c
ap-w
eigh
ted
Smal
l-cap
s le
ss th
an $
1 bi
llion
S&P
1500
150
0C
omm
ittee
, cap
-wei
ghte
dC
ombi
nes
S&P
500,
400
and
600
S&P
500/
Bar
raG
row
th a
nd V
alue
500
(var
ies)
Split
of 5
00 b
y pr
ice-
to-b
ook
S&P
500
stoc
ks o
nly
Stoc
ks p
lace
d in
eith
er
grow
th o
r val
ueS&
P40
0/B
arra
Gro
wth
and
Val
ue40
0 (v
arie
s)Sp
lit o
f 400
by
pric
e-to
-boo
kS&
P40
0 st
ocks
onl
ySt
ocks
pla
ced
in e
ither
gr
owth
or v
alue
S&P
600/
Bar
raG
row
th a
nd V
alue
600
(var
ies)
Split
of 6
00 b
y pr
ice-
to-b
ook
S&P
600
stoc
ks o
nly
Stoc
ks p
lace
d in
eith
er
grow
th o
r val
ueSo
urce
: ww
w.sp
glob
al.c
om

ADVANCED PORTFOLIO MANAGEMENT
— 262 —
Tabl
e 21
-3D
ow J
ones
& C
ompa
ny In
dex
Dat
a
Inde
x#
of st
ocks
Man
agem
ent m
etho
dC
rite
ria
Indu
stria
ls30
Com
mitt
ee, p
rice-
wei
ghte
d30
lead
ing
U.S
. com
pani
esTr
ansp
orts
15C
omm
ittee
, pric
e-w
eigh
ted
Util
ities
20C
omm
ittee
, pric
e-w
eigh
ted
Com
posi
te65
Com
mitt
ee, p
rice-
wei
ghte
dC
ombo
of p
revi
ous
3 in
dexe
s
Sour
ce: w
ww.
dow
jone
s.com

STOCK INDEXES
— 263 —
Tabl
e 21
-4Fr
ank
Rus
sell
Com
pany
Inde
x D
ata
Inde
xes
# of
stoc
ksM
anag
emen
t met
hod
Cri
teri
a
Rus
sell
3000
3000
Ann
ual r
econ
stitu
tion
as o
f 5/3
130
00 la
rges
t fro
m N
YSE
, C
ap-w
eigh
ted,
300
0 la
rges
tN
asda
q, a
nd A
mex
Com
pute
r gen
erat
edR
usse
ll 10
0010
00To
p 10
00 o
f Rus
sell
3000
Rus
sell
2000
2000
Bot
tom
200
0 of
Rus
sell
3000
Mos
t wel
l-kno
wn
smal
l-cap
inde
xG
row
th a
nd V
alue
Inde
xes
Varie
sSp
lit b
ased
on
pric
e-to
-boo
kC
ompu
ter g
ener
ated
ratio
s an
d ea
rnin
gs fo
reca
sts
prop
rieta
ry m
etho
dolo
gyR
usse
ll To
p 20
020
020
0 la
rges
t com
pani
es in
Rus
sell
1000
Rus
sell
Mid
-cap
800
800
smal
lest
com
pani
es in
Rus
sell
1000
Rus
sell
2500
2500
2500
sm
alle
st c
ompa
nies
in R
usse
ll 30
00
Sour
ce: w
ww.
russ
ell.c
om
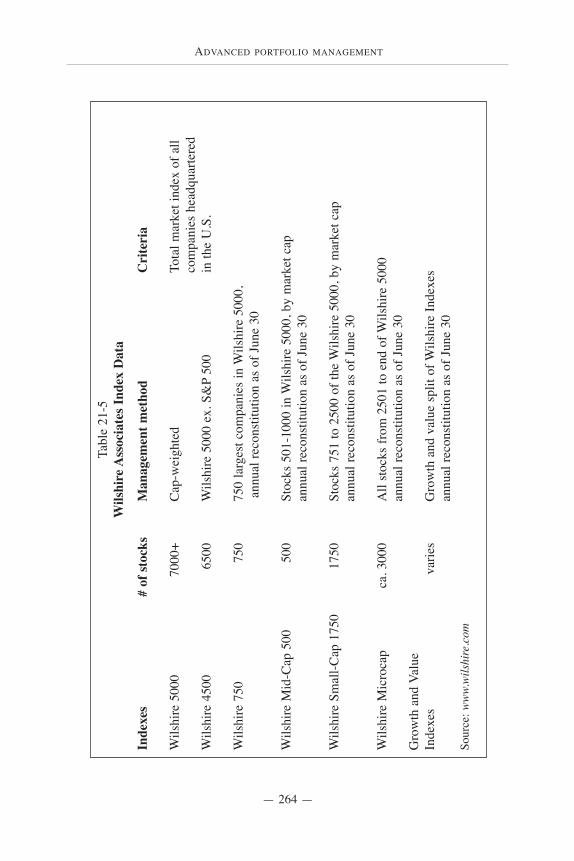
ADVANCED PORTFOLIO MANAGEMENT
— 264 —
Tabl
e 21
-5W
ilshi
re A
ssoc
iate
s Ind
ex D
ata
Inde
xes
#
of s
tock
sM
anag
emen
t met
hod
Cri
teri
a
Wils
hire
500
070
00+
Cap
-wei
ghte
dTo
tal m
arke
t ind
ex o
f all
co
mpa
nies
hea
dqua
rtere
d W
ilshi
re 4
500
6500
Wils
hire
500
0 ex
. S&
P50
0in
the
U.S
.
Wils
hire
750
750
750
larg
est c
ompa
nies
in W
ilshi
re 5
000,
annu
al re
cons
titut
ion
as o
f Jun
e 30
Wils
hire
Mid
-Cap
500
500
Stoc
ks 5
01-1
000
in W
ilshi
re 5
000,
by
mar
ket c
apan
nual
reco
nstit
utio
n as
of J
une
30
Wils
hire
Sm
all-C
ap 1
750
1750
Stoc
ks 7
51 to
250
0 of
the
Wils
hire
500
0, b
y m
arke
t cap
annu
al re
cons
titut
ion
as o
f Jun
e 30
Wils
hire
Mic
roca
pca
. 300
0A
ll st
ocks
from
250
1 to
end
of W
ilshi
re 5
000
annu
al re
cons
titut
ion
as o
f Jun
e 30
Gro
wth
and
Val
ueIn
dexe
sva
ries
Gro
wth
and
val
ue s
plit
of W
ilshi
re In
dexe
san
nual
reco
nstit
utio
n as
of J
une
30So
urce
: ww
w.w
ilshi
re.c
om
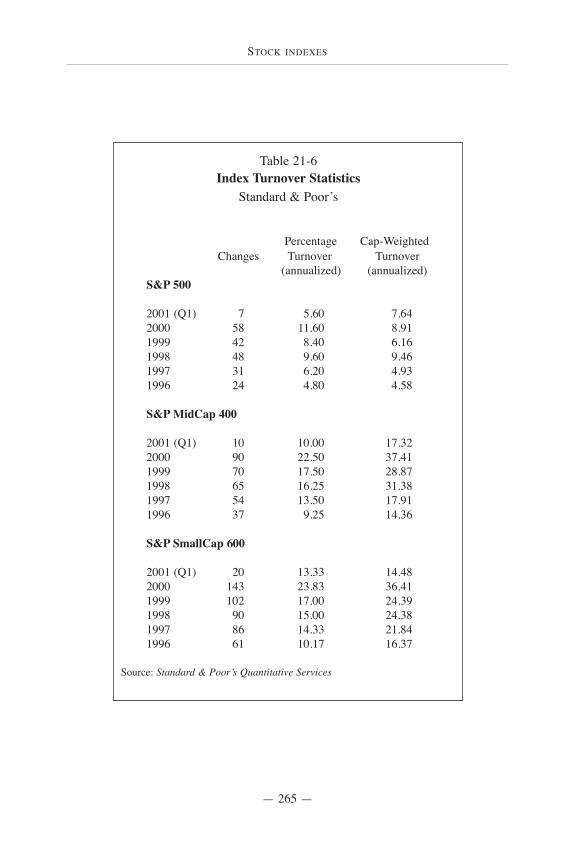
STOCK INDEXES
— 265 —
Table 21-6Index Turnover Statistics
Standard & Poor’s
Percentage Cap-WeightedChanges Turnover Turnover
(annualized) (annualized)S&P 500
2001 (Q1) 7 5.60 7.642000 58 11.60 8.911999 42 8.40 6.161998 48 9.60 9.461997 31 6.20 4.931996 24 4.80 4.58
S&P MidCap 400
2001 (Q1) 10 10.00 17.322000 90 22.50 37.411999 70 17.50 28.871998 65 16.25 31.381997 54 13.50 17.911996 37 9.25 14.36
S&P SmallCap 600
2001 (Q1) 20 13.33 14.482000 143 23.83 36.411999 102 17.00 24.391998 90 15.00 24.381997 86 14.33 21.841996 61 10.17 16.37
Source: Standard & Poor’s Quantitative Services
ADVANCED PORTFOLIO MANAGEMENT
— 266 —
FOR YEARS THERE HAS BEEN AN ONGOING debate abouttwo different styles of investing—value and growth. To refreshyour memory, value investors typically invest in turnaroundstories and other depressed stocks that tend to plod alongunremarkably for years until, hopefully, their true “value” isdiscovered by other investors. Value investors prefer companieswith low price-to-book ratios and low price-to-earnings ratios, thatare hopefully only “temporarily” out of favor.
Growth stocks are typically much more exciting, high-profilecompanies that have a great “growth” story behind them. Theyoften sport high price-to-earnings ratios and high price-to-bookratios. Not coincidentally, growth stocks tend to be technology
Value vs. growth—the ongoing debate
Historically stocks with below-average price/earningsratios (a common definition of value) have outperformed
other stocks by four percentage points per year.—STAN LUXENBERG, Mutual Funds
The ratio of growth-to-value P/Es is closeto its historical average of 1.58, meaning
growth-stock P/Es are usually 58% higher.—JIM WEISS, State Street Research (April 2002)
22
VALUE VS. GROWTH—THE ONGOING DEBATE
— 267 —
and pharmaceutical companies that pour most of their earningsinto research and development (not dividends, like many value-oriented stocks). These companies are often “shooting the lightsout” on their earnings and investors anticipate they will continueto do so.
You could certainly argue that these two styles of investing aremisnamed. After all, who wants to buy a stock that has no value,and why would anyone want to buy a stock that has no growthpotential? Investors who buy growth stocks do so with the hopethat their earnings will grow rapidly to justify a high P/E ratio anda high stock price. Investors who prefer value stocks, which arereally “distressed” stocks with poor earnings, look for bargains inthe marketplace. They believe some stocks that get depressed bynews, or earnings disappointments, will ultimately rebound. Theyscoop up shares at depressed levels and hope that their patiencewill be rewarded when the hidden value (earnings turnaround) isrecognized by other investors. But, both growth and valueinvestors will tell you that they are investing in stocks withgrowth potential at reasonable prices.
Performance
Money flows into value and growth stocks at different times.They are somewhat uncorrelated in that one style usually doeswell while the other does poorly. The cycles may last severalyears or longer. Typically when the economy is good, growthstocks tend to outperform value stocks. For example, from Q31994 to the end of Q1 2000, growth stocks walloped value byalmost a 2 to 1 margin, returning 29.5% on average annually. In2000, when Internet, tech and telecom stocks blew up, and itbecame evident the economy was slowing, investors startedbuying value stocks again. Money flowed into more defensiveplays like energy, consumer staples and small- and mid-cap valuestocks.
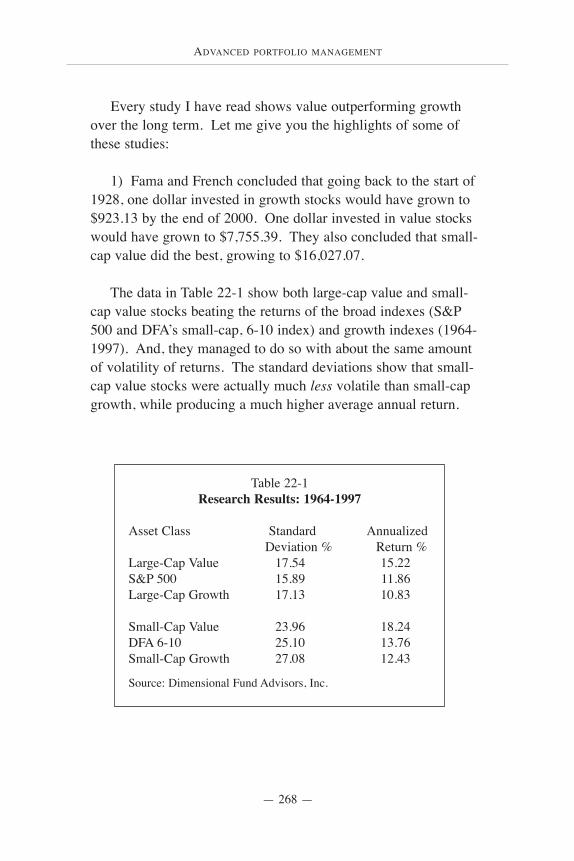
ADVANCED PORTFOLIO MANAGEMENT
— 268 —
Every study I have read shows value outperforming growthover the long term. Let me give you the highlights of some ofthese studies:
1) Fama and French concluded that going back to the start of1928, one dollar invested in growth stocks would have grown to$923.13 by the end of 2000. One dollar invested in value stockswould have grown to $7,755.39. They also concluded that small-cap value did the best, growing to $16,027.07.
The data in Table 22-1 show both large-cap value and small-cap value stocks beating the returns of the broad indexes (S&P500 and DFA’s small-cap, 6-10 index) and growth indexes (1964-1997). And, they managed to do so with about the same amountof volatility of returns. The standard deviations show that small-cap value stocks were actually much less volatile than small-capgrowth, while producing a much higher average annual return.
Table 22-1Research Results: 1964-1997
Asset Class Standard AnnualizedDeviation % Return %
Large-Cap Value 17.54 15.22S&P 500 15.89 11.86Large-Cap Growth 17.13 10.83
Small-Cap Value 23.96 18.24DFA 6-10 25.10 13.76Small-Cap Growth 27.08 12.43
Source: Dimensional Fund Advisors, Inc.
VALUE VS. GROWTH—THE ONGOING DEBATE
— 269 —
3) Tim Loughran, a finance professor at the University ofNotre Dame, studied large-cap growth and value by looking at thereturns of the S&P 500 beginning in 1975. The S&P 500 wasdivided into two components, growth and value, by looking atprice-to-book ratios. Those companies with high ratios wereconsidered growth stocks. Those with low ratios were consideredvalue stocks. Loughran concluded that growth yielded an averagemonthly return of 1.29% while value returned 1.39%—an amounthe deemed insignificant. Nevertheless, the nod still went to valueduring this period.
4) Another study entitled Contrarian Investment,Extrapolation and Risk, and written up in Larry Swedroe’s bookentitled What Wall Street Doesn’t Want You To Know, concludedthat, overall, the value strategy appears to do somewhat betterthan the glamour strategy. The study found that during the period1968-1990, value stocks outperformed growth stocks over every5-year period. Value also outperformed growth in 90% of the 3-year periods. And, during the market’s worst 25 months, valuefell about 10% versus 11% for growth. During the market’s best25 months, the study concluded that value stocks outperformedgrowth by 14% to about 11%.
5) An additional study, noted in Swedroe’s book, showed thatfor the period 1964-1999, value prevailed for both large- andsmall-cap stocks. Small value stocks outperformed small growthstocks by 17.6% to 12.9%. And, during the same period, largevalue stocks outperformed large growth stocks by 14.8% to 11.9%per annum.
Performance during market declines
In addition to outperforming during the good years, valuestocks typically hold up better during market declines. In a studythat covered all bear markets during the period 1978-1997, value
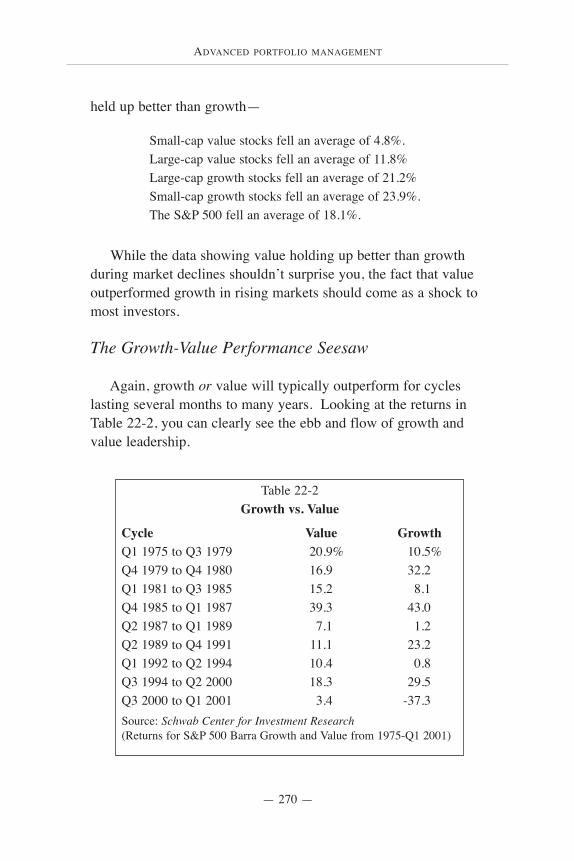
ADVANCED PORTFOLIO MANAGEMENT
— 270 —
held up better than growth—
While the data showing value holding up better than growthduring market declines shouldn’t surprise you, the fact that valueoutperformed growth in rising markets should come as a shock tomost investors.
The Growth-Value Performance Seesaw
Again, growth or value will typically outperform for cycleslasting several months to many years. Looking at the returns inTable 22-2, you can clearly see the ebb and flow of growth andvalue leadership.
Small-cap value stocks fell an average of 4.8%.Large-cap value stocks fell an average of 11.8%Large-cap growth stocks fell an average of 21.2%Small-cap growth stocks fell an average of 23.9%.The S&P 500 fell an average of 18.1%.
Table 22-2Growth vs. Value
Cycle Value GrowthQ1 1975 to Q3 1979 20.9% 10.5%Q4 1979 to Q4 1980 16.9 32.2Q1 1981 to Q3 1985 15.2 8.1Q4 1985 to Q1 1987 39.3 43.0Q2 1987 to Q1 1989 7.1 1.2Q2 1989 to Q4 1991 11.1 23.2Q1 1992 to Q2 1994 10.4 0.8Q3 1994 to Q2 2000 18.3 29.5Q3 2000 to Q1 2001 3.4 -37.3Source: Schwab Center for Investment Research(Returns for S&P 500 Barra Growth and Value from 1975-Q1 2001)
VALUE VS. GROWTH—THE ONGOING DEBATE
— 271 —
The difficulty is in predicting when each style will be in or outof favor, and for how long. The fact that the trend is so difficultto predict makes a strong case for owing both styles most of thetime.
Which style is riskier, value or growth?
If the evidence shows that value has outperformed growth overlong periods of time, is value therefore riskier? If you assumethat in order to earn greater returns, you must take on added risk,then you would obviously assume that value is indeed riskier.
Earlier in this book I wrote (and I will repeat myself here,because it is worth repeating) about the works of Merton Miller,for which he earned a Nobel Prize. His work on the cost ofcapital shows clearly why a value stock carries risk that is directlyrelated to its level of distress. A value stock is typically pricedlow for a reason—the company’s hurting. It’s having trouble withearnings and its price has dropped as a result. If this companygoes to the marketplace to raise capital (through equity or debt),its cost for doing so is going to be higher than that of a healthycompany. It makes sense that investors who are willing to lendthis company money (buy its bonds), will demand a higher rewardfor assuming the risk that they might not get their principal back.They will demand a higher rate of return from the bonds (higherinterest payment). Therefore, the cost of capital is higher to thestruggling, distressed company than it is to one that’s notstruggling.
Understanding the cost of capital explanation shows why so-called value stocks (distressed) have a higher expected return (inthe bond and stock markets). Again, no rational investor wouldtake on the extra risk of lending a distressed company money, orbuying its stock, if he didn’t expect to get a higher return forassuming the added risk. If you look at value versus growth
ADVANCED PORTFOLIO MANAGEMENT
— 272 —
stocks from a cost-of-capital perspective, it is clear where there ismore risk. This helps explain why the risktakers—investors whobuy distressed companies—demand, and over time get, a higherreturn. Risk and return are related, and the historicaloutperformance of value stocks proves this point. If this weren’tthe case, no one would ever buy distressed companies, or lendthem money.
As I mentioned in an earlier chapter (again, it’s worthrepeating here), while I believe the evidence speaks loudly, I’dencourage you to use some common sense when consideringwhich style of investing is riskier at any given time. In early2000, when growth stocks were trading at astronomical P/E- andprice-to-book ratios, the argument that they were riskier thanvalue stocks at that point would have been valid. Yes, the work ofFama and French still applied, but isn’t there a point where agrowth stock is priced so ridiculously high that you can say it isactually riskier than a value stock? I would think so, if you definerisk as “potentially losing money.” So, a common-sense approachcombined with traditional valuation measurements should helpyou determine whether growth or value stocks carry more risk ofloss at any given time.
Should you play favorites?
I know some investment professionals who overweight valuestocks for clients who are risk-averse, and they overweight growthstocks for aggressive clients. This is a flawed strategy and Iwouldn't recommend it. After studying the data, I now find ithard to advise ever overweighting growth. Of course, if growthstocks come down to ridiculously low P/E and PEG ratios, I’llreconsider. But, although the work of Fama and French shows usthat growth stocks carry less risk, we also know we are rewardedless for owning them. And, it appears from the standard deviationdata, that they bounce all over the place—perhaps not too
VALUE VS. GROWTH—THE ONGOING DEBATE
— 273 —
comforting to many risk-averse retirees. While value stocks seemto warrant an overweighting—since they have provided higherreturns with generally less volatility—I would urge caution. Wehave no idea what future returns for value stocks will look like.Will value continue to outperform? Will value continue to be lessvolatile? And, don’t forget, if you load up on value stocks (inparticular, small-value stocks), be prepared to get clobbered fromtime to time. This hasn’t happened in recent history, but if youbelieve that both size and style are additional risks, there will be atime when value stocks crush investors—just as growth stocks didin 2000-2001.
One thing seems clear—you should probably always ownsome value and growth components. Okay, maybe not always,but almost always. The studies I’ve looked at about correlationcoefficients show that growth and value often move counter toone another—value will zig, while growth zags. So, by owningboth, you may not necessarily get a better return, but over anextended period of time, you will certainly lower the overallvolatility of your portfolio. If you decide to overweight one styleof investing, I would review the chapter on rebalancing, and payattention to recent performance statistics. If you believe inreversion-to-mean, and you want to control volatility in yourportfolio, a strong case can be made for overweighting whicheverstyle has recently been out of favor. Having said that, I woulddefinitely look at the valuations of each style first, then set yourtarget allocations, and periodically rebalance to control risk.
ADVANCED PORTFOLIO MANAGEMENT
— 274 —
I’M OBVIOUSLY A PROPONENT of index-based investing.I prefer a structured index-management approach to traditionalindexing. And, I’d rather index sectors via Select Sector SPDRsand iShares ETFs than own actively managed sector funds. But,is my preference backed by better performance?
A recent article in Mutual Funds magazine compared activemanagers of sector funds to their benchmark sectors to see whofared better. The results were not surprising to me. In five of theseven sectors, the actively managed sector funds trailed the S&P500 sector indexes over a recent 5-year period. In the two cases where the actively managed funds won, utilities andcommunications, the data showed that “43% and 35% of fundassets, respectively, were not in the sectors—not an apples-to-apples comparison.”
Sector investing—passive vs. active
Who would have thought?The best technology fund is an index fund,
North Track PSE Technology 100.—STAN LUXENBERG, Bloomberg Wealth Manager
23
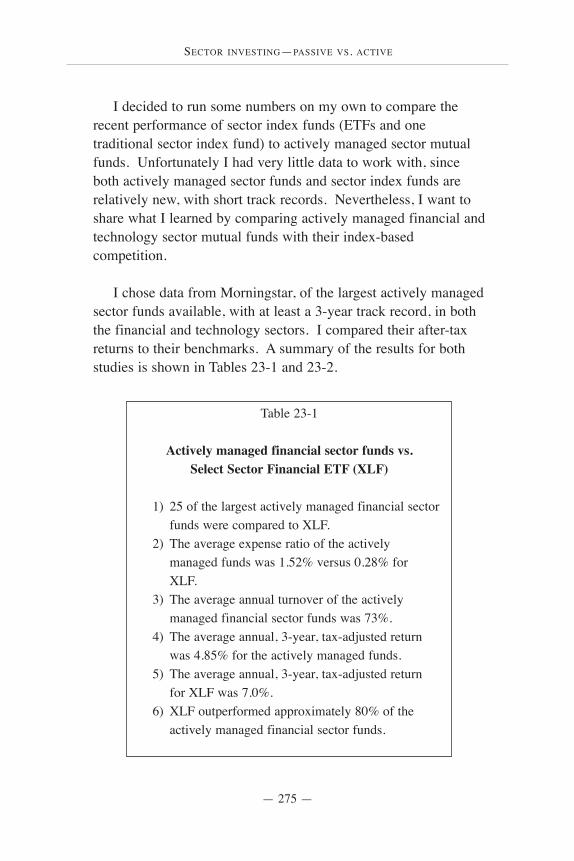
SECTOR INVESTING—PASSIVE VS. ACTIVE
— 275 —
I decided to run some numbers on my own to compare therecent performance of sector index funds (ETFs and onetraditional sector index fund) to actively managed sector mutualfunds. Unfortunately I had very little data to work with, sinceboth actively managed sector funds and sector index funds arerelatively new, with short track records. Nevertheless, I want toshare what I learned by comparing actively managed financial andtechnology sector mutual funds with their index-basedcompetition.
I chose data from Morningstar, of the largest actively managedsector funds available, with at least a 3-year track record, in boththe financial and technology sectors. I compared their after-taxreturns to their benchmarks. A summary of the results for bothstudies is shown in Tables 23-1 and 23-2.
Table 23-1
Actively managed financial sector funds vs.Select Sector Financial ETF (XLF)
1) 25 of the largest actively managed financial sector funds were compared to XLF.
2) The average expense ratio of the actively managed funds was 1.52% versus 0.28% for XLF.
3) The average annual turnover of the actively managed financial sector funds was 73%.
4) The average annual, 3-year, tax-adjusted return was 4.85% for the actively managed funds.
5) The average annual, 3-year, tax-adjusted return for XLF was 7.0%.
6) XLF outperformed approximately 80% of the actively managed financial sector funds.
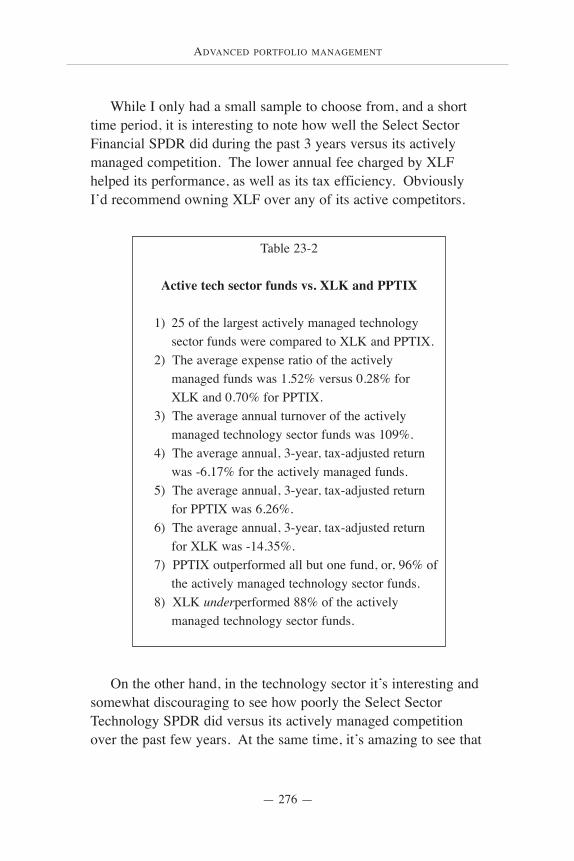
ADVANCED PORTFOLIO MANAGEMENT
— 276 —
While I only had a small sample to choose from, and a shorttime period, it is interesting to note how well the Select SectorFinancial SPDR did during the past 3 years versus its activelymanaged competition. The lower annual fee charged by XLFhelped its performance, as well as its tax efficiency. ObviouslyI’d recommend owning XLF over any of its active competitors.
On the other hand, in the technology sector it’s interesting andsomewhat discouraging to see how poorly the Select SectorTechnology SPDR did versus its actively managed competitionover the past few years. At the same time, it’s amazing to see that
Table 23-2
Active tech sector funds vs. XLK and PPTIX
1) 25 of the largest actively managed technology sector funds were compared to XLK and PPTIX.
2) The average expense ratio of the actively managed funds was 1.52% versus 0.28% for XLK and 0.70% for PPTIX.
3) The average annual turnover of the actively managed technology sector funds was 109%.
4) The average annual, 3-year, tax-adjusted return was -6.17% for the actively managed funds.
5) The average annual, 3-year, tax-adjusted return for PPTIX was 6.26%.
6) The average annual, 3-year, tax-adjusted return for XLK was -14.35%.
7) PPTIX outperformed all but one fund, or, 96% ofthe actively managed technology sector funds.
8) XLK underperformed 88% of the actively managed technology sector funds.
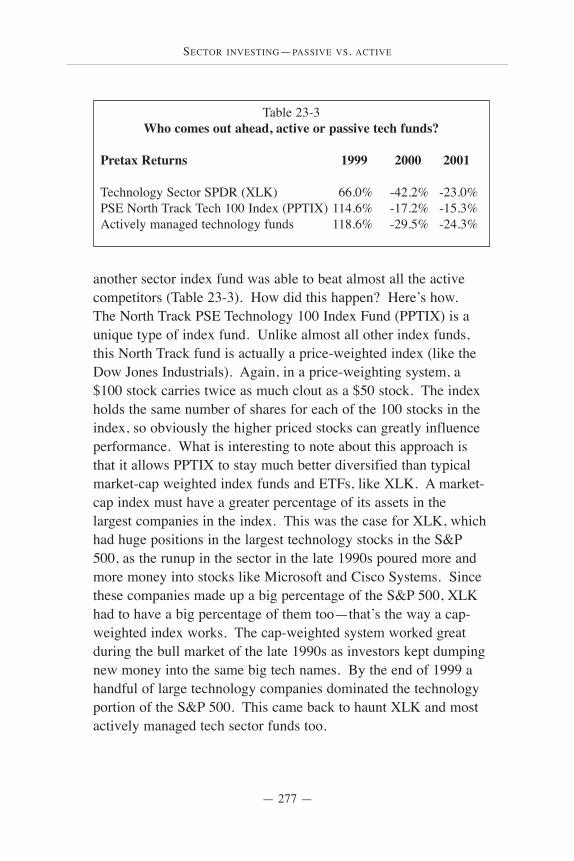
SECTOR INVESTING—PASSIVE VS. ACTIVE
— 277 —
another sector index fund was able to beat almost all the activecompetitors (Table 23-3). How did this happen? Here’s how.The North Track PSE Technology 100 Index Fund (PPTIX) is aunique type of index fund. Unlike almost all other index funds,this North Track fund is actually a price-weighted index (like theDow Jones Industrials). Again, in a price-weighting system, a$100 stock carries twice as much clout as a $50 stock. The indexholds the same number of shares for each of the 100 stocks in theindex, so obviously the higher priced stocks can greatly influenceperformance. What is interesting to note about this approach isthat it allows PPTIX to stay much better diversified than typicalmarket-cap weighted index funds and ETFs, like XLK. A market-cap index must have a greater percentage of its assets in thelargest companies in the index. This was the case for XLK, whichhad huge positions in the largest technology stocks in the S&P500, as the runup in the sector in the late 1990s poured more andmore money into stocks like Microsoft and Cisco Systems. Sincethese companies made up a big percentage of the S&P 500, XLKhad to have a big percentage of them too—that’s the way a cap-weighted index works. The cap-weighted system worked greatduring the bull market of the late 1990s as investors kept dumpingnew money into the same big tech names. By the end of 1999 ahandful of large technology companies dominated the technologyportion of the S&P 500. This came back to haunt XLK and mostactively managed tech sector funds too.
Table 23-3Who comes out ahead, active or passive tech funds?
Pretax Returns 1999 2000 2001
Technology Sector SPDR (XLK) 66.0% -42.2% -23.0%PSE North Track Tech 100 Index (PPTIX) 114.6% -17.2% -15.3%Actively managed technology funds 118.6% -29.5% -24.3%
ADVANCED PORTFOLIO MANAGEMENT
— 278 —
Unlike XLK, and most actively managed tech sector funds,PPTIX was actually reducing its exposure to heavily-capitalizedtechnology companies during the runup. How so? Well, sincePPTIX has to hold an equal amount of shares for all 100 stocks itowns, when a company would split its shares—usually the resultof appreciation in the price of the stock—PPTIX was forced tosell half its shares and reallocate the proceeds evenly among allthe stocks in the index. It was basically reducing its winners anddiversifying the proceeds during the great bull market intechnology stocks, and the result was that this index fund endedup having a relatively small percentage of its money concentratedin the largest tech companies. (At present, the heaviest weightingin PPTIX is 4% in IBM versus 15% in Microsoft in XLK.) Theresult of better diversification of dollars was that PPTIX neverbecame top-heavy in only a handful of companies—this greatlylimited the downside risk. It lost significantly less than othertechnology funds (including XLK) in 2000-2001.
I should note that in addition to the advantages of using aprice-weighted system to track the Pacific Stock Exchangetechnology index, PPTIX had the advantage of having about 17%of its money in health care and biotechnology stocks. This addedobvious diversification benefits, but it also makes this fund not apure tech play. You could argue that this is an advantage, not adisadvantage, in this very volatile sector. Last, the Pacific StockExchange Technology Index (PPTIX tracks this index) comprisescompanies that have at least a two-year operating history. Thisallowed the fund to avoid having to buy some of the youngInternet stocks that were owned by other actively managed techfunds—PPTIX never owned them since they were too green.
After studying the performance numbers I would advise you toconsider owning PPTIX instead of XLK. Obviously PPTIX hassome drawbacks (same as traditional index funds) versus ETFs,but its price-weighted index makes it very attractive when you
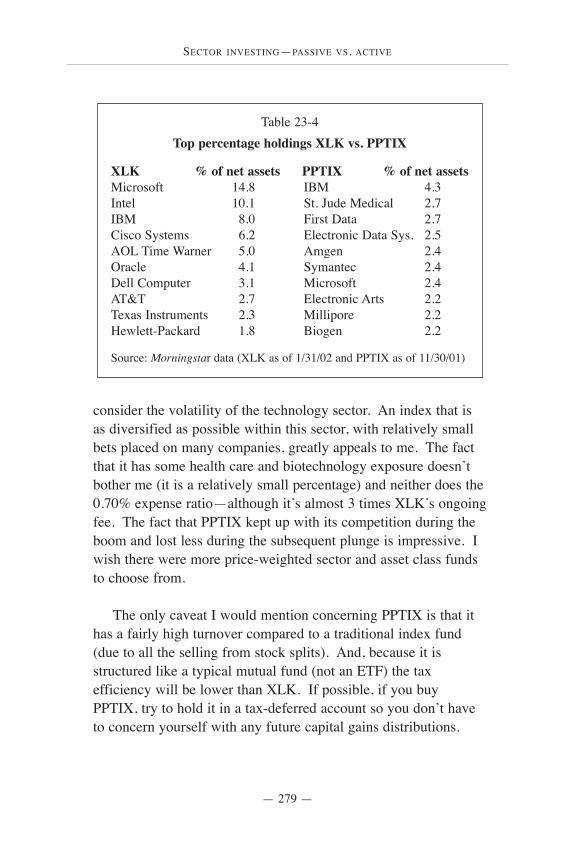
SECTOR INVESTING—PASSIVE VS. ACTIVE
— 279 —
consider the volatility of the technology sector. An index that isas diversified as possible within this sector, with relatively smallbets placed on many companies, greatly appeals to me. The factthat it has some health care and biotechnology exposure doesn’tbother me (it is a relatively small percentage) and neither does the0.70% expense ratio—although it’s almost 3 times XLK’s ongoingfee. The fact that PPTIX kept up with its competition during theboom and lost less during the subsequent plunge is impressive. Iwish there were more price-weighted sector and asset class fundsto choose from.
The only caveat I would mention concerning PPTIX is that ithas a fairly high turnover compared to a traditional index fund(due to all the selling from stock splits). And, because it isstructured like a typical mutual fund (not an ETF) the taxefficiency will be lower than XLK. If possible, if you buyPPTIX, try to hold it in a tax-deferred account so you don’t haveto concern yourself with any future capital gains distributions.
Table 23-4Top percentage holdings XLK vs. PPTIX
XLK % of net assets PPTIX % of net assetsMicrosoft 14.8 IBM 4.3Intel 10.1 St. Jude Medical 2.7IBM 8.0 First Data 2.7Cisco Systems 6.2 Electronic Data Sys. 2.5AOL Time Warner 5.0 Amgen 2.4Oracle 4.1 Symantec 2.4Dell Computer 3.1 Microsoft 2.4AT&T 2.7 Electronic Arts 2.2Texas Instruments 2.3 Millipore 2.2Hewlett-Packard 1.8 Biogen 2.2
Source: Morningstar data (XLK as of 1/31/02 and PPTIX as of 11/30/01)
ADVANCED PORTFOLIO MANAGEMENT
— 280 —
I HAVE ALREADY WRITTEN ABOUT my concerns withmarket-cap weighted indexes like the S&P 500. I outlined in thelast chapter, the diversification benefits of using price-weightedindexes—especially in very volatile, top-heavy sector indexes.For this reason, and others, I’d advise some of you to create yourown price-weighted sector indexes of individual stocks.
Let me briefly mention again the main difference between aprice- and cap-weighted index. A price-weighted index, like theDow Jones Industrials, owns the same number of shares for eachcompany in the index. Therefore, a $100 stock carries twice asmuch clout as a $50 stock. Because the index owns the samenumber of shares per company, the higher priced stocks can
Creating your ownprice-weighted sector indexes
My main concern with the market-cap weighted approach isthat it concentrates too many of your dollars in too few
companies. The price-weighted approach spreads out yourinvestment dollars more evenly across the companies in the
index, therefore giving you better diversification.
24
CREATING YOUR OWN PRICE-WEIGHTED SECTOR INDEXES
— 281 —
greatly influence performance. But, what makes this approachappealing is that it allows investors to have more diversification of their dollars—more so than the cap-weighted approach. And,since diversification is the key to reducing risk, this is anadvantage over market-cap indexes—especially in down markets.Market-cap weighted indexes (i.e., S&P 500, Select SectorSPDRs) are heavily weighted toward companies with the largestcapitalization. So, as a company enjoys great success and growsits market cap, its performance has a greater influence on thereturns of the index.
My main concern with the market-cap weighted approach isthat it concentrates too many of your dollars in too fewcompanies. The price-weighted approach spreads out yourinvestment dollars more evenly across the companies in the index,therefore giving you better diversification. You may still own thesame number of companies, but you won’t be loaded up on only afew of the largest companies, like in a cap-weighted index.
Let me show you an example of how a price-weighted sectorindex would compare to a cap-weighted sector index. I’ve chosenthe iShares Healthcare ETF (IYH) to make a comparison. (SeeTable 24-1.)
This sector price-weighted index is calculated in the followingmanner. First, you add up the current prices of all the companiesin your price-weighted index. In this example, this equaled$1,111.96. This is the dollar amount you would have to pay forone share of this entire basket of stocks. Then, divide $1,111.96by 20 (the number of stocks in your index) = $55.60. This is theaverage share price for the 20 companies. Divide $55.60 into thetotal dollar amount to be invested, $500,000 in this case. Youranswer, 8,993, is the total number of shares you need to purchasefor the entire basket. Finally, divide 8,993 by 20 to give you thenumber of shares you need to purchase per company. This equals
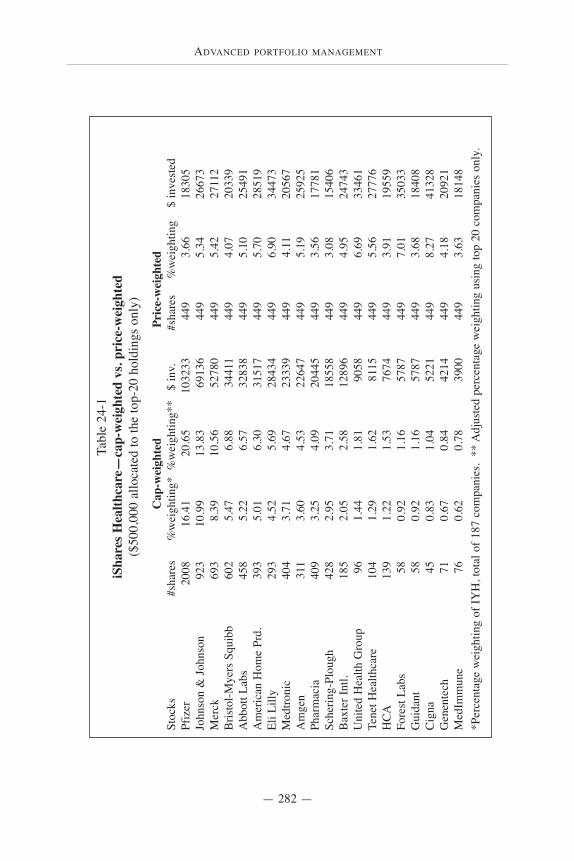
ADVANCED PORTFOLIO MANAGEMENT
— 282 —
Tabl
e 24
-1iS
hare
s Hea
lthca
re—
cap-
wei
ghte
d vs
. pri
ce-w
eigh
ted
($50
0,00
0 al
loca
ted
to th
e to
p-20
hol
ding
s on
ly)
Cap
-wei
ghte
dPr
ice-
wei
ghte
dSt
ocks
#sha
res
%w
eigh
ting*
%w
eigh
ting*
* $
inv.
#sha
res
%
wei
ghtin
g
$ in
vest
edPf
izer
2008
16.4
120
.65
1032
3344
93.
6618
305
John
son
& J
ohns
on92
310
.99
13.8
369
136
449
5.34
2667
3M
erck
693
8.39
10.5
652
780
449
5.42
2711
2B
risto
l-Mye
rs S
quib
b60
25.
476.
8834
411
449
4.07
2033
9A
bbot
t Lab
s45
85.
226.
5732
838
449
5.10
2549
1A
mer
ican
Hom
e Pr
d.39
35.
016.
3031
517
449
5.70
2851
9El
i Lill
y29
34.
525.
6928
434
449
6.90
3447
3M
edtro
nic
404
3.71
4.67
2333
944
94.
1120
567
Am
gen
311
3.60
4.53
2264
744
95.
1925
925
Phar
mac
ia40
93.
254.
0920
445
449
3.56
1778
1Sc
herin
g-Pl
ough
428
2.95
3.71
1855
844
93.
0815
406
Bax
ter I
ntl.
185
2.05
2.58
1289
644
94.
9524
743
Uni
ted
Hea
lth G
roup
961.
441.
8190
5844
96.
6933
461
Tene
t Hea
lthca
re10
41.
291.
6281
1544
95.
5627
776
HC
A13
91.
221.
5376
7444
93.
9119
559
Fore
st L
abs
580.
921.
1657
8744
97.
0135
033
Gui
dant
580.
921.
1657
8744
93.
6818
408
Cig
na45
0.83
1.04
5221
449
8.27
4132
8G
enen
tech
710.
670.
8442
1444
94.
1820
921
Med
Imm
une
760.
620.
7839
0044
93.
6318
148
*Per
cent
age
wei
ghtin
g of
IYH
, tot
al o
f 187
com
pani
es.
** A
djus
ted
perc
enta
ge w
eigh
ting
usin
g to
p 20
com
pani
es o
nly.
CREATING YOUR OWN PRICE-WEIGHTED SECTOR INDEXES
— 283 —
approximately 449 shares. Remember, you need to allocate anequal number of shares per company.
My concerns are made apparent in the cap-weighted examplein Table 24-1. The price-weighted healthcare ETF shows muchbetter diversification of dollars. The top holding in the market-cap ETF (unadjusted weightings) accounted for 16.4%, or $82,050of the index, whereas the largest holding in the price-weightedbasket accounted for 8.2%, or $41,328 of its index. The top-5companies in the cap-weighted index (unadjusted weightings)accounted for 46.48% of the total basket. And, in the price-weighted index the top-5 companies made up 34.57% of theindex.
This example shows that better diversification of dollars is thekey, not diversification of companies. Look at MedImmune—itmakes up only 0.62% of the cap-weighted healthcare index. Doesthat represent any true diversification benefit? Should it evencount? Almost all of the money is allocated to the biggies, sothey totally influence the index’s returns. Therefore, I wouldargue that the cap-weighted approach does not offer properdiversification.
When you create your own price-weighted indexes, you arebasically trying to create a representative sample of the underlyingindex without having to buy every company in the index. Itwould obviously be prohibitively expensive to purchase all 187companies in the iShares Healthcare ETF, and do the same witheach sector. I believe that by buying the top-20 companies ofeach sector ETF you’ll get adequate representation of the sectorindex. And, you’ll reduce your costs too. For some of the moreconcentrated sector ETFs (e.g. energy) you could probably getaway with buying fewer companies and still get a goodrepresentative sample.
ADVANCED PORTFOLIO MANAGEMENT
— 284 —
One interesting aspect of the price-weighted approach is howto deal with stock splits. If a stock splits you need to reallocatethe dollars from selling the “extra” shares evenly among all thecompanies in the index. So, in a price-weighted index, you areactually reducing the importance of the company that is splittingits shares. Share splits within a price-weighted index force you totrim your winning positions, since these are usually the companiesthat end up splitting their shares. Again, this is one of the reasonsthe North Track PSE 100 Technology Fund Index (reviewed in the last chapter) performed so well versus its peers. The price-weighted approach helps you maintain proper diversification andavoids loading up on only a few great performers, thereforereducing risk.
I’d advise some of you to consider creating your own price-weighted indexes, probably for the large-cap portion of yourportfolios only. The small- and mid-cap ETFs (value and growth)have adequate diversification and are not heavily weighted in ahandful of companies. So, most investors should stick withbuying the ETFs that track these indexes, as long as they areproperly diversified, which they are right now.
Is the price-weighted approach for you?
1) The brokerage commissions you pay will be less than theongoing management fees for ETFs. Your brokerage commissionrate will greatly influence your decision to create your own price-weighted sector indexes. Depending on how much you pay for atrade, the price-weighted approach may be prohibitive. Let’s lookat an example. If you pay 3 cents a share to your brokerage firm,to create your own representative-sample, price-weighted indexwith the health care ETF (shown in Table 24-1) would cost about$270. Compare this dollar amount to the cost of ongoingownership of a sector ETF (.28% to .60%, depending on whetheryou buy SPDRs or iShares). Assuming the alternative to your
CREATING YOUR OWN PRICE-WEIGHTED SECTOR INDEXES
— 285 —
price-weighted index is one of the Select Sector SPDRs (.28%),let’s say your ongoing fee is $1,400 annually on a $500,000investment. Remember, you won’t be paying this fee if you ownthe individual stocks separately, in your own representativeportfolio. And, don’t forget, you had to pay brokeragecommissions to buy the ETF Select Sector SPDR too. Anyway,the commission question is important. Does it make sense tocreate your own index and avoid the ongoing costs of the ETFs?In this example, it obviously saves money to create your ownprice-weighted index. You can do your own calculation, factoringin how much you pay per share to your brokerage firm. Then,compare the total brokerage commissions versus the ongoingmanagement fee charged by the ETF you’re looking to buy.
Don’t forget, you may need to replicate up to 10 differentsector ETFs with your own price-weighting system—so multiplyyour commission costs by 10. Unless, of course, you decide toavoid certain large-cap sectors, for whatever reason. At any rate,you can make a relatively simple calculation to see if you willsave money by creating your own price-weighted large-cap sectorportfolio.
2) You don’t mind the extra work involved in monitoring yourown indexes. Obviously creating your own price-weightedindexes is somewhat labor intensive. You not only have to buy allthe top individual companies of your chosen sectors—to haveadequate representation in the sectors—but you have to monitorthe individual companies as well. I’m not trying to frighten you,but there will be a lot more work involved than simply buyingsector ETFs. You’ll have to monitor your own price-weightedcomponents on a regular basis, and make any necessary changesto your own indexes—at least on an annual basis, or when theindex components change. You’ll need to regularly check the topholdings of the ETF sector indexes on www.amex.com,www.morningstar.com or www.ishares.com, to make sure your
ADVANCED PORTFOLIO MANAGEMENT
— 286 —
holdings are still representative of the sector ETF. You may findthat you will only change a few companies annually for eachprice-weighted index you create. To me this is not a big deal, butyou may not want to do it.
3) You don’t mind the extra bookkeeping. Since you will bebuying many companies for each price-weighted index you create,you will need excellent portfolio management software to trackyour cost basis for tax purposes. Perhaps your custodian takescare of this for you. If you don’t have automated recordkeeping,then I wouldn’t even consider creating your own indexes—itwould be an accounting nightmare to do this by hand.
4) You don’t mind buckets of mail. You may own in excess of150 companies in your portfolio and you’ll occasionally beflooded with mail. Annual reports and proxies will be sent fromthe different companies you own. If you don’t want more mail,stick with sector ETFs.
5) You have a lot of money to invest in large-cap stocks—atleast $1.2 million. What I’ve found is that it will only make senseto create and buy your own price-weighted sector indexes if youhave quite a bit of money to allocate to the large-cap asset class.Let’s assume you will invest approximately 60% of your equityinvestments in the large-cap market. (You’ll get your exposure tosmall- and mid-cap stocks with broad-based ETFs.) If you haveto divide 9 or 10 sectors into approximately 20 companies each—for adequate representation of the sector—this means you’regoing to be buying a lot of companies. And, you’ll need a lot ofmoney to do so. If you’re going to own over 150 companies,you’ll probably only want to consider the price-weightedapproach if you have a total of $2 million or more to allocate toequities. Assuming you will allocate roughly 60% or your equityportfolio to large caps, this means you will need at least $1.2million to create your sector indexes.

CREATING YOUR OWN PRICE-WEIGHTED SECTOR INDEXES
— 287 —
Summary
If you have enough money to properly diversify among manysectors, I’d definitely advise you to create your own price-weighted, large-cap sector indexes. It involves some extra work,but, given the diversification benefits of the price-weightedapproach, it’s a smart move.
ADVANCED PORTFOLIO MANAGEMENT
— 288 —
IF WE CAN AGREE THAT WAGERING your entire portfolioon only a handful of stocks is irrational, then making the same beton one sector is only slightly less dumb. You’ve read this far, soyou know I’m in favor of proper diversification in a portfolio, andloading up an entire portfolio in one sector of the market isobviously something I’d advise against. There are certain risksyou assume when you overweight your portfolio to a particularsector or asset class, but these risks are usually mitigated bymixing uncorrelated asset classes and sectors. If you decide to gobeyond a slight overweighting and allocate most of your portfolioin one sector, you’re taking on a lot of risk. And, in my opinion,you could be making a grave mistake.
Betting on tech stocks—not a good idea
There’s never been a sector that for extended periodsof time outperformed the economy as a whole.
—FRANK ARMSTRONG, Financial Planner
25

BETTING ON TECH STOCKS—NOT A GOOD IDEA
— 289 —
Let me show you a simple example to get you to thinkseriously about the risks associated with concentrating yourportfolio in a certain sector. I’ll use the technology sector in myexample, since we’re all familiar with the recent meteoric rise ofthis sector and its subsequent (more recent) meltdown.
For much of the 1990s, and certainly the last five years of thatdecade, the sector to own was technology. If you owned onlytechnology stocks during the late 1990s, you greatly outperformedthe broad market. This outperformance was eventually followedby 2 years of underperformance, and who knows how muchlonger it will continue. I personally could have never imagined asector blowing up the way technology did—losing approximately70% of its value (peak-to-valley). But, a look at the history ofsome of the past bubbles proves to me, and hopefully to you too,that the meltdown wasn’t completely unpredictable.
“Technology is the place to be. It’s the ‘new’ economy. TheInternet is the place to get rich.” I don’t need to remind you whatinvestors (professional and private) were saying about the futureof technology and Internet companies a few years ago. When Ithink about the aftermath, and Wall Street’s baseless enthusiasmduring the runup, other bubbles come to mind. I remember quitewell the real estate market in Southern California in the late1980s, when every other real estate agent was saying that the onlything better than owning a home was owning two homes. Well,real estate prices peaked around 1990 and it has taken about adecade to get back to the previous highs.
I’m also reminded of the Japanese stock market in the late1980s. The Nikkei was up almost 500% during that decade, andhad surpassed 39,000. The Japanese economy was going to bethe new model for the world. It was obvious to so manyinvestors, at that time, that the Japanese were apparently globallydominant, and their stocks deserved such lofty valuations. (Sound
ADVANCED PORTFOLIO MANAGEMENT
— 290 —
familiar?) Japanese investors bought up key real estate propertiesaround the world with their wealth and leveraged their stockmarket gains. Many Wall Street firms launched mutual fundsspecializing in the Asian markets because it was so obviously a“sure thing.” (Wall Street firms have a knack for coming out withtheir “funds du jour” at about the time the bubbles are beginningto pop.) We all know what happened next—the Nikkei begandeclining, and suffered horrendous losses during the 1990s. Adecade later it is still off its highs by more than 70%. And, itsreal estate market isn’t close to recovering either.
Many of you will remember this last example of “irrationalexuberance.” In the late 1960s the highflying Nifty-Fifty stockswere the ones to own. While their P/E ratios were out of whackwith the rest of the market—well over 60 in many cases, theinvesting public and professionals believed these companiesshould be owned at any price. Like Internet and technologystocks of the late 1990s, it was acceptable to pay ridiculousmultiples for these companies. Some of the Nifty-Fifty stocksnever recovered, and those that did took a decade or more to reach their old highs.
The few bubbles I’ve cited have all taken place during myrelatively young lifetime. Bubbles go back many centuries, butit’s quite different to actually live through them as an investor.Hopefully we learn something by experiencing one firsthand. Mymain reason for advising against owning only one asset class orsector is obvious in the examples I’ve cited—if it blows up inyour face, you may never get your money back during yourlifetime. Or, you may underperform the market for many years tocome. At present, more than two years after the Internet andtechnology bubbles began deflating, there are still many diehardinvestors who are loaded up on the “must-own” stocks of the late1990s. Many investors are still living in denial. The sad truth isthat nobody knows if and when these companies will ever return
BETTING ON TECH STOCKS—NOT A GOOD IDEA
— 291 —
to favor. Cisco moving back to $80 and Yahoo! to $240 a share?My guess is it won’t happen in our lifetimes, but there are manywho disagree with me.
If you’re still loaded up on tech stocks, here’s how toplay the game
1) Know your risk tolerance. I think the most important thingto realize, if you choose heavy exposure in one part of the market(like tech), is that you are assuming increased risk of loss. Ofcourse you also have greater upside potential, but I’d rather firstfocus on the worst-case scenario, and understand the risksinherent in a concentrated approach to investing. If the entirestock market has the potential to drop by more than 40% frompeak-to-valley at any given time, then it is obvious a concentratedbet can do much worse. Recognize that technology stocks havedropped almost 70% from their highs, and many of the individualcompanies did worse—they’re in the graveyard.
Technology stocks returned more than 30%, averagedannually, from 1989-1999. But, they were incredibly volatile.The standard deviation for the group was 33%. A broadly,diversified portfolio of asset classes (small- and large-cap stocks,value and growth, U.S. and international) would have had astandard deviation of about 16%, with average annual returns ofabout 16% during the same period. So, with the added risk camereward in the 1990s, but it was a wild ride.
So, accept the fact that tech stocks are at least twice as risky asa diversified stock portfolio. The rewards have been there in thepast, but will you continue to be rewarded for assuming the extrarisk? I doubt it—I think the party is over for a long time.
2) Have a very long-term outlook and a lot of patience. If thebroad stock market can have periods of 5 years or longer of
ADVANCED PORTFOLIO MANAGEMENT
— 292 —
negative returns, individual sectors or asset classes (moreconcentrated investments) could be losers for many, many years.If a sector like technology can outperform the broad market for adecade, it is only logical to assume that it could underperform forthe same number of years, or more. We simply don’t know howlong it will take for the sector to come back. One example of asector crashing and not recovering is energy stocks in the early1980s. Energy stocks made up about 35% of the S&P 500, andoil and oil service companies had increased about 400% in thetwo years prior to the meltdown. When the bubble burst, thesector ended up underperforming for a decade. The energy sectornow comprises about 6% of the S&P 500. Could the same happento tech? Yep.
And, in the example of the Nifty-Fifty stocks, it also took themabout 10 years to get back to their old highs after crashing—andthey underperformed the broad market during their comeback.So, can you afford to wait a decade for a sector to maybe comeback—assuming you bought it at the highs? Only you know. Mypoint is, you may have to be very patient.
3) Consider the facts—it’s not all gloomy. If you are stillloaded up on technology stocks and you have a very long-termtime horizon, you could make a bundle. Look at Table 25-1. ThePacific Stock Exchange Technology Index’s declines during thepast 15 years have been severe, but they were always followed byincredible annualized performance for investors who had thepatience to weather the storm. The tech sector is presently nearthe bottom of an extreme sell-off period. It is still off more than60% from its highs (4/’02), so if history repeats itself one moretime, it would be wise to hold tight. Consider this fact, however,a 15-year track record for a sector isn’t very long, and certainlynot reliable. Nevertheless, if tech repeats its familiar pattern ofthe past, investors would once again be rewarded for assuming theextra volatility for holding these stocks.
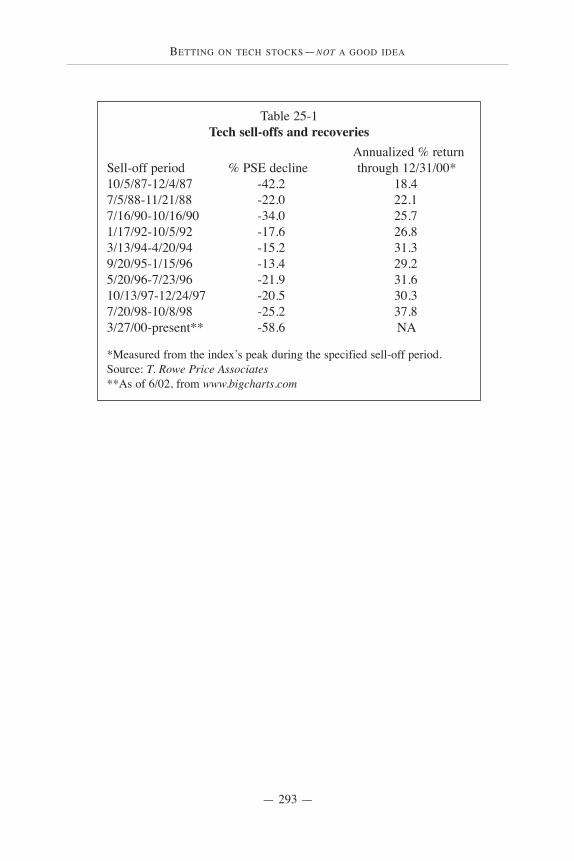
BETTING ON TECH STOCKS—NOT A GOOD IDEA
— 293 —
Table 25-1Tech sell-offs and recoveries
Annualized % returnSell-off period % PSE decline through 12/31/00*10/5/87-12/4/87 -42.2 18.47/5/88-11/21/88 -22.0 22.17/16/90-10/16/90 -34.0 25.71/17/92-10/5/92 -17.6 26.83/13/94-4/20/94 -15.2 31.39/20/95-1/15/96 -13.4 29.25/20/96-7/23/96 -21.9 31.610/13/97-12/24/97 -20.5 30.37/20/98-10/8/98 -25.2 37.83/27/00-present** -58.6 NA
*Measured from the index’s peak during the specified sell-off period.Source: T. Rowe Price Associates**As of 6/02, from www.bigcharts.com
ADVANCED PORTFOLIO MANAGEMENT
— 294 —
THIS CHAPTER IS FOR AGGRESSIVE INVESTORS only.The topic is leveraged index funds—funds that seek to replicate aparticular index or sector, and add leverage at the same time. Thisworks somewhat similar to a margin account, although you willnever get a margin call on one of these funds. Here’s how theywork. Take a leveraged S&P 500 fund from ProFunds, forexample. The fund, appropriately named ProFunds UltraBullFund, uses index futures contracts and options to mirror thereturns of the S&P 500 by 200%. In other words, this fund isleveraged at 2 times your investment. If you invest $500,000 inthis fund, you’ll actually be trading at about $1,000,000. So, a1% drop on any given day in the S&P 500 will be doubled in thisfund—you’d lose about 2% (same leverage on the upside).
Turbocharging your portfolio
Most people don’t know how to use futures or options,so this allows individual investors to do somethingthey know how to do—buy a mutual fund, to offset
the risk of their traditional stock funds. —MICHAEL L. SAPIR, chairman, ProFund Advisors
26
TURBOCHARGING YOUR PORTFOLIO
— 295 —
The creators of leveraged funds argue that they are great toolsfor traders and they are cheaper than margin accounts. If youopen a margin account right now, and you borrow money from abrokerage firm, you may have to pay them about 6% to borrowthe money (the rate varies depending on prevailing interest rates).A leveraged mutual fund will not incur the same charges, since itisn’t using margin to get its leverage—it’s using options andfutures. There is a cost, however, for using this type of leverage,but it’s significantly less than 6% annually.
In addition to cheaper borrowing costs, leveraged index fundsallow aggressive investors to leverage an IRA or other tax-deferred account, when it is otherwise impossible to do so. Youcannot borrow money in an IRA, so you don’t have the option ofhaving a margin account. But, with leveraged index funds, youget around this problem since the fund creates leverage for you.If you are inclined to use leveraged index funds, I would try tohold the funds in your tax-deferred account. The funds have highturnover and may be somewhat unpredictable as far as their taxefficiency is concerned.
If you decide to use leverage, I would also pay particularattention to the Fed Model to give you an indication as to whenthe market is trading at extremes. Although the model is notsupposed to be used as a day-trading, market-timing tool, it doesgive you a good idea as to whether the market is under- orovervalued. Obviously I would not buy a bullish leveraged indexfund if the Fed Model shows an overvaluation reading. On theother hand, if you are aggressive and you know you can assumethe risk of substantial loss, it could pay handsomely to leverage ifthe Fed Model is showing the market to be undervalued by 10%or more. Or, if you’ve got the guts, you could buy a “short”leveraged fund if the market is extremely overvalued. ReviewChapter 20 for more on the Fed Model.
ADVANCED PORTFOLIO MANAGEMENT
— 296 —
ProFunds and Rydex also have some leveraged, short fundsthat appreciate in a declining stock market. This is similar toselling short. These funds also utilize futures and optionscontracts to create leverage. I typically will not advise shortingstocks or buying a leverage short fund, unless you are doing so fortax reasons to hedge an existing position in a taxable portfolio—hedging an unrealized gain. These funds can successfully hedgerisks in existing portfolios.
My reason for typically not recommending short funds—exceptas a hedge—is that it is very tough to make money over the longhaul shorting stocks. The market has basically been in a long-termuptrend for more than a century, so it’s pretty tough to predict areversal. And, I am not one to bet against corporate America overthe long term—I firmly believe the stock market will continue itslong-term upward trend, eventually.
I’ll give you a brief example of how difficult it can be to makemoney on the short side of the market. If you employ the FedModel to help you determine stock market valuations, the modelwould have indicated an overvalued stock market in the beginningof 1999, by 25%. The market rarely gets overvalued by this much.If you had bought a short fund in early 1999, you would have beenpretty miserable, and poorer, as stocks soared and the marketbecame more and more overvalued. Valuations didn’t seem tomatter anymore as investors pushed stocks to extremes. Yes, youwere ultimately proven right by buying your short fund, but youwould have had to wait almost 3 years to make money. And, Idoubt you would have been able to maintain your losing positionas the market soared higher, and your short fund showed a hugeunrealized loss. Anyway, my point is that it is very tough to makemoney on the short side of the market.
Summary—a leveraged fund will rarely work well as anoutright bet, so tread lightly.

TURBOCHARGING YOUR PORTFOLIO
— 297 —
Tabl
e 26
-1Le
vera
ged
fund
s fro
m P
roFu
nds a
nd R
ydex
Nam
e an
d Sy
mbo
l
Des
crip
tion
Expe
nse
Rat
ioPr
oFun
ds U
ltraB
ull (
ULP
IX)
2x th
e re
turn
of t
he S
&P
500
1.44
%Ry
dex
Tita
n 50
0 (R
YTN
X)
2x th
e re
turn
of t
he S
&P
500
1.75
%Ry
dex
Nov
a (R
YN
VX
)1.
5x th
e re
turn
of t
he S
&P
500
1.33
%Pr
oFun
ds U
ltra
Mid
-Cap
(UM
PIX
)2x
the
retu
rn o
f the
S&
P40
0
N
APr
oFun
ds U
ltra
Smal
l-Cap
(UA
PIX
)2x
the
retu
rn o
f the
Rus
sell
2000
NA
ProF
unds
Ultr
a O
TC (U
OPI
X)
2x th
e re
turn
of t
he N
asda
q-10
01.
33%
Ryde
x Ve
loci
ty 1
00 (R
YV
YX
)2x
the
retu
rn o
f the
Nas
daq-
100
1.75
%Pr
oFun
ds U
ltra
Japa
n (U
JPIX
)2x
the
retu
rn o
f the
Nik
kei 2
25
NA
Leve
rage
d “s
hort
” br
oad-
base
d in
dex
fund
sN
ame
Des
crip
tion
Expe
nse
Rat
ioPr
oFun
ds U
ltraS
hort
OTC
(USP
IX)
2x th
e in
vers
e re
turn
of t
he N
asda
q-10
01.
48%
ProF
unds
Ultr
aBea
r (U
RPI
X)
2x th
e in
vers
e re
turn
of t
he S
&P
500
1.56
%Ry
dex
Tem
pest
500
(RY
TPX
)2x
the
inve
rse
retu
rn o
f the
S&
P50
01.
75%
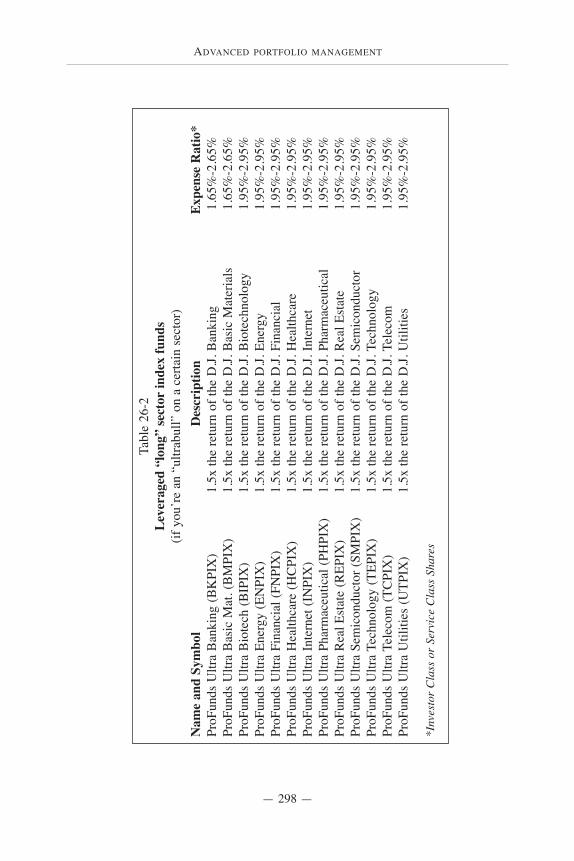
ADVANCED PORTFOLIO MANAGEMENT
— 298 —
Tabl
e 26
-2Le
vera
ged
“lon
g” se
ctor
inde
x fu
nds
(if y
ou’r
e an
“ul
trabu
ll” o
n a
certa
in s
ecto
r)N
ame
and
Sym
bol
Des
crip
tion
Ex
pens
e R
atio
*Pr
oFun
ds U
ltra
Ban
king
(BK
PIX
)1.
5x th
e re
turn
of t
he D
.J. B
anki
ng
1.65
%-2
.65%
ProF
unds
Ultr
a B
asic
Mat
. (B
MPI
X)
1.5x
the
retu
rn o
f the
D.J.
Bas
ic M
ater
ials
1.
65%
-2.6
5%Pr
oFun
ds U
ltra
Bio
tech
(BIP
IX)
1.5x
the
retu
rn o
f the
D.J.
Bio
tech
nolo
gy
1.95
%-2
.95%
ProF
unds
Ultr
a En
ergy
(EN
PIX
)1.
5x th
e re
turn
of t
he D
.J. E
nerg
y 1.
95%
-2.9
5%Pr
oFun
ds U
ltra
Fina
ncia
l (FN
PIX
)1.
5x th
e re
turn
of t
he D
.J. F
inan
cial
1.
95%
-2.9
5%Pr
oFun
ds U
ltra
Hea
lthca
re (H
CPI
X)
1.5x
the
retu
rn o
f the
D.J.
Hea
lthca
re
1.95
%-2
.95%
ProF
unds
Ultr
a In
tern
et (I
NPI
X)
1.5x
the
retu
rn o
f the
D.J.
Inte
rnet
1.
95%
-2.9
5%Pr
oFun
ds U
ltra
Phar
mac
eutic
al (P
HPI
X)
1.5x
the
retu
rn o
f the
D.J.
Pha
rmac
eutic
al
1.95
%-2
.95%
ProF
unds
Ultr
a R
ealE
stat
e (R
EPIX
)1.
5x th
e re
turn
of t
he D
.J. R
eal E
stat
e
1.95
%-2
.95%
ProF
unds
Ultr
a Se
mic
ondu
ctor
(SM
PIX
)1.
5x th
e re
turn
of t
he D
.J. S
emic
ondu
ctor
1.
95%
-2.9
5%Pr
oFun
ds U
ltra
Tech
nolo
gy (T
EPIX
)1.
5x th
e re
turn
of t
he D
.J. T
echn
olog
y 1.
95%
-2.9
5%Pr
oFun
ds U
ltra
Tele
com
(TC
PIX
)1.
5x th
e re
turn
of t
he D
.J. T
elec
om
1.95
%-2
.95%
ProF
unds
Ultr
a U
tiliti
es (U
TPIX
)1.
5x th
e re
turn
of t
he D
.J. U
tiliti
es
1.95
%-2
.95%
*Inv
esto
r C
lass
or
Serv
ice
Cla
ss S
hare
s

USING CORRELATION COEFFICIENTS TO DIVERSIFY AN EXISTING PORTFOLIO
— 299 —
LET’S ASSUME YOU OWN A VERY TECH-HEAVY portfoliothat comprises the big tech names—Microsoft, IBM, Intel etc.You have very high unrealized gains in these stocks in a taxableaccount. Obviously you don’t want to sell these stocks and paytaxes. But, you are worried about your downside risk and youhave new money available to add to your stock portfolio. You caneffectively use correlation coefficients to help you decide whichsectors and asset classes to add to your portfolio to get properdiversification.
The key is to add asset classes and sectors that have shown alow correlation to your tech stocks. Again, you’re trying to createmore balance within your portfolio to reduce volatility and risk.
Using correlation coefficientsto diversify an existing portfolio
The key is to add asset classes and sectors that have shown a low correlation to your
existing portfolio. The idea is to create morebalance within your portfolio to reduce
volatility and risk.
27
ADVANCED PORTFOLIO MANAGEMENT
— 300 —
Looking at the correlation coefficients in Table 27-1 it’s obviouswhich asset classes and sectors you would want to add to yourportfolio. Financial services, foods, mid-cap value and small-capvalue have all been relatively uncorrelated to tech since 1984.These holdings should move counter to your technology stocks. Iftechnology continues to underperform, as it has recently, there is adecent chance that your “new” uncorrelated investments will holdup fairly well. Yes, there will be times when these investmentsmay be correlated to tech—they all lose at the same time. But,over time, you will more than likely see the benefits of this properdiversification. Caveat—the correlation relationship between thevarious investments will continue to change over time, so youshould get in the habit of monitoring the behavior of the variousinvestments you own.
Let me give you an example of how I use correlationcoefficients to work within an existing portfolio. Let’s assumethat I’ve “inherited” a portfolio of stocks from another advisor—an investor is transferring an already existing portfolio under mymanagement. There may be some individual stock positions in theexisting portfolio that this client cannot part with. Perhaps he orshe has an emotional attachment to these stocks, or perhaps thereare large unrealized gains and making changes would result in atax hit. Whatever the reasons, I’ve got to do something todiversify the risk in the present concentrated portfolio. Thehypothetical portfolio is shown in Table 27-2. What can I do tohelp?
It’s pretty obvious this portfolio is improperly diversified. It’sall large cap and with a growth-style tilt. My focus should be ondiversifying risk by adding asset classes and sectors that areuncorrelated to large-cap growth, and to a lesser degree,uncorrelated to the large-cap health care and tech sectors—theseare already represented in this existing portfolio. So, looking atthe correlation coefficients, I make a decision to add small- and

USING CORRELATION COEFFICIENTS TO DIVERSIFY AN EXISTING PORTFOLIO
— 301 —
Tabl
e 27
-1—
Stoc
k as
set c
lass
and
sect
orco
rrel
atio
ns (1
/84-
12/0
1)D
escr
iptio
nA
BC
DE
FG
HI
JK
LM
NO
PQ
A) S
&P
Indu
stria
ls-
.33
.43
.19
.36
.64
.51
.46
.65
.73
.43
.97
.76
.71
.38
.75
.32
B) S
&P
Che
mic
als
.33
-.6
6.1
9.6
1.1
8.4
8.5
4.5
0(.0
1).3
9.2
0.5
9.3
5.6
8.3
2.6
5C
) S&
PFo
ods
.43
.66
-.2
2.7
4.4
5.5
6.5
7.7
0(.1
7).5
2.3
0.6
3.1
3.6
4.3
0.6
3D
) S&
PO
il.1
9.1
9.2
2-
.32
.09
.40
.13
.12
.06
.15
.10
.45
.12
.19
.29
.14
E) S
&P
Ret
ail S
tore
s.3
6.6
1.7
4.3
2-
.42
.59
.55
.37
(.11)
.47
.22
.66
.21
.63
.31
.62
F) S
&P
Tele
phon
e.6
4.1
8.4
5.0
9.4
2-
.47
.46
.46
.28
.66
.60
.64
.26
.41
.33
.22
G) S
&P
Tran
spor
tatio
n.5
1.4
8.5
6.4
0.5
9.4
7-
.64
.52
.22
.67
.40
.76
.42
.64
.46
.59
H) F
inan
cial
s.4
6.5
4.5
7.1
3.5
5.4
6.6
4-
.35
.18
.60
.39
.79
.48
.91
.51
.85
I) S
&P
Hea
lth C
are
.65
.50
.70
.12
.37
.46
.52
.35
-.1
9.4
3.5
9.5
4.2
5.3
0.2
8.1
6J)
Tec
hnol
ogy
.73
(.01)
(.17)
.06
(.11)
.29
.22
.18
.19
-.1
4.8
0.3
8.8
4.1
0.8
3.1
0K
) S&
PU
tiliti
es.4
3.3
9.5
2.1
5.4
7.6
6.6
7.6
0.4
3.1
4-
.32
.63
.30
.60
.30
.40
L) L
arge
-Cap
Gro
wth
.97
.20
.30
.10
.22
.60
.40
.39
.59
.80
.32
-.6
3.7
3.2
8.7
6.2
0M
) Lar
ge-C
ap V
alue
.75
.59
.63
.45
.66
.64
.76
.79
.54
.34
.63
.63
-.5
7.7
8.6
3.7
5N
) Mid
-Cap
Gro
wth
.71
.35
.13
.12
.21
.26
.42
.48
.25
.84
.30
.73
.57
-.5
1.9
7.5
0O
) Mid
-Cap
Val
ue.3
8.6
8.6
4.1
9.6
4.4
1.6
4.9
1.3
0.1
0.6
0.2
8.7
8.5
1-
.51
.91
P) S
mal
l-Cap
Gro
wth
.75
.32
.16
.14
.31
.83
.46
.51
.28
.83
.30
.76
.63
.97
.51
-.5
3Q
) Sm
all-C
ap V
alue
.32
.65
.49
.29
.62
.22
.59
.85
.16
.10
.40
.20
.75
.50
.91
.53
-
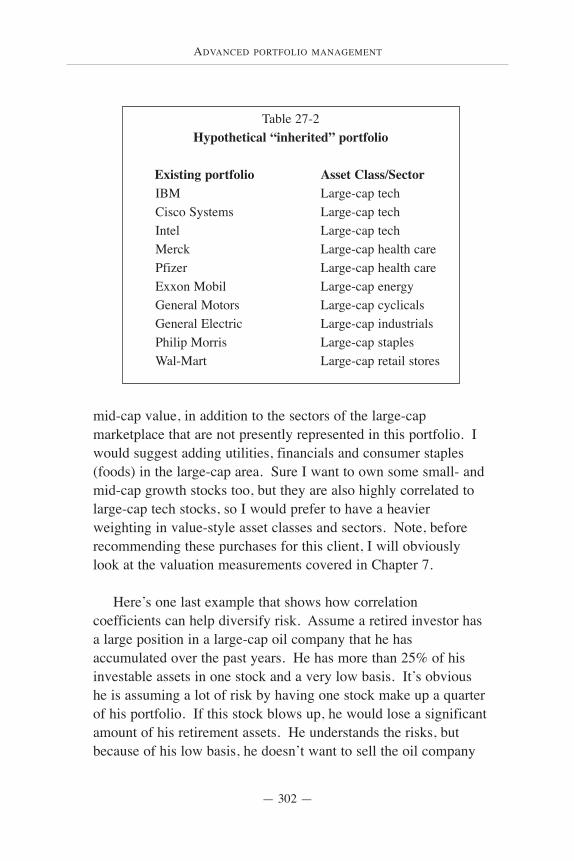
ADVANCED PORTFOLIO MANAGEMENT
— 302 —
mid-cap value, in addition to the sectors of the large-capmarketplace that are not presently represented in this portfolio. Iwould suggest adding utilities, financials and consumer staples(foods) in the large-cap area. Sure I want to own some small- andmid-cap growth stocks too, but they are also highly correlated tolarge-cap tech stocks, so I would prefer to have a heavierweighting in value-style asset classes and sectors. Note, beforerecommending these purchases for this client, I will obviouslylook at the valuation measurements covered in Chapter 7.
Here’s one last example that shows how correlationcoefficients can help diversify risk. Assume a retired investor hasa large position in a large-cap oil company that he hasaccumulated over the past years. He has more than 25% of hisinvestable assets in one stock and a very low basis. It’s obvioushe is assuming a lot of risk by having one stock make up a quarterof his portfolio. If this stock blows up, he would lose a significantamount of his retirement assets. He understands the risks, butbecause of his low basis, he doesn’t want to sell the oil company
Table 27-2Hypothetical “inherited” portfolio
Existing portfolio Asset Class/SectorIBM Large-cap techCisco Systems Large-cap tech Intel Large-cap tech Merck Large-cap health carePfizer Large-cap health careExxon Mobil Large-cap energyGeneral Motors Large-cap cyclicalsGeneral Electric Large-cap industrialsPhilip Morris Large-cap staples Wal-Mart Large-cap retail stores
USING CORRELATION COEFFICIENTS TO DIVERSIFY AN EXISTING PORTFOLIO
— 303 —
stock and pay hefty capital gains taxes. Furthermore, let’s assumehe still likes the prospects for the company’s earnings.
So, what should this investor do to diversify risk in his equityportfolio? The obvious answer is to overweight the rest of thestock portfolio in asset classes and sectors that are uncorrelated tothe energy sector. Why? Because this should substantially reducethe overall volatility of the portfolio—if the low correlationcontinues. You could argue that technology andtelecommunication services stocks have moved somewhatopposite the energy sector for more than a decade. This lowcorrelation, if the trend continues, could give reason to addtechnology and telecom stocks to the mix. Again, this shouldhelp smooth out the volatility of the total portfolio. I could alsomake a strong case for this investor to avoid certain sectors thatare highly correlated to the energy sector. Utilities, industrials,and basic materials all have above-average correlation coefficientsto the energy sector. So, they should have an underweighting inthis portfolio, or be avoided.
The risks of owning a poorly diversified portfolio of stocks areobvious, and the recent Enron debacle has highlighted these risks.If your portfolio is heavily weighted to a certain sector or only ahandful of companies, I’d urge you to use correlation coefficientsto properly diversify your portfolio.
ADVANCED PORTFOLIO MANAGEMENT
— 304 —
AS A RULE, I WOULD NOT RECOMMEND having more than4% of your stock portfolio in any given company—I don’t wantany company to make up more than 4% of a total equity portfolio.So, how do you deal with a situation where you have a significantportion of your portfolio in one company with a low basis? In thelast chapter we looked at diversifying your risk by addinguncorrelated investments to your portfolio. Now we’ll look athedging your risk.
Here’s what you need to consider to decide whether or not toput on a hedge— 1) The relative volatility of your stock versus adiversified portfolio; 2) The relative returns of your singleposition versus a diversified portfolio; and, 3) how long the stockwill be held if it is not sold. The results from a study by Sanford
The low-basis stock dilemma
Obviously the relative volatility of one stock versus a diversifiedportfolio makes holding a one-stock portfolio unattractive.
And, the chances of outperformance of any given stockversus a diversified stock portfolio are poor.
28
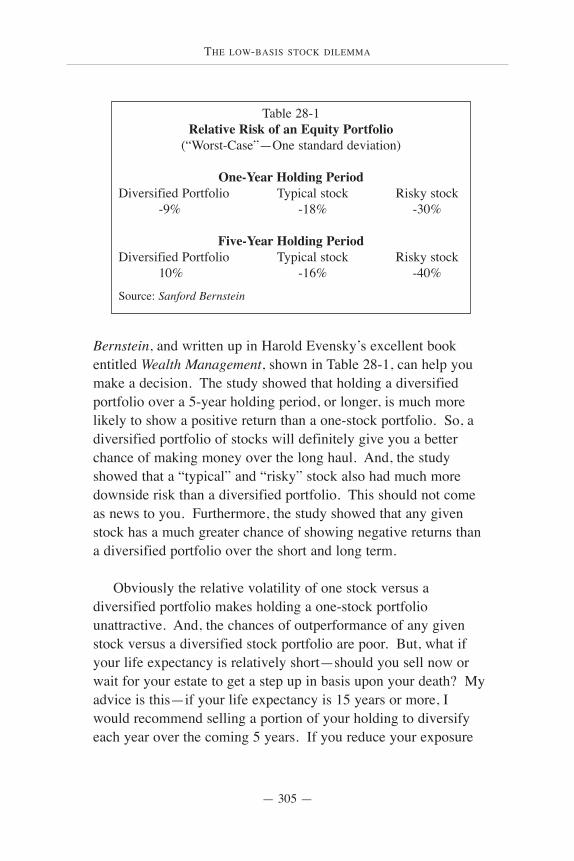
THE LOW-BASIS STOCK DILEMMA
— 305 —
Bernstein, and written up in Harold Evensky’s excellent bookentitled Wealth Management, shown in Table 28-1, can help youmake a decision. The study showed that holding a diversifiedportfolio over a 5-year holding period, or longer, is much morelikely to show a positive return than a one-stock portfolio. So, adiversified portfolio of stocks will definitely give you a betterchance of making money over the long haul. And, the studyshowed that a “typical” and “risky” stock also had much moredownside risk than a diversified portfolio. This should not comeas news to you. Furthermore, the study showed that any givenstock has a much greater chance of showing negative returns thana diversified portfolio over the short and long term.
Obviously the relative volatility of one stock versus adiversified portfolio makes holding a one-stock portfoliounattractive. And, the chances of outperformance of any givenstock versus a diversified stock portfolio are poor. But, what ifyour life expectancy is relatively short—should you sell now orwait for your estate to get a step up in basis upon your death? Myadvice is this—if your life expectancy is 15 years or more, Iwould recommend selling a portion of your holding to diversifyeach year over the coming 5 years. If you reduce your exposure
Table 28-1Relative Risk of an Equity Portfolio
(“Worst-Case”—One standard deviation)
One-Year Holding PeriodDiversified Portfolio Typical stock Risky stock
-9% -18% -30%
Five-Year Holding PeriodDiversified Portfolio Typical stock Risky stock
10% -16% -40%
Source: Sanford Bernstein
ADVANCED PORTFOLIO MANAGEMENT
— 306 —
to your one stock by approximately 20% a year you will haveentirely diversified your risk at the end of the period. And, youwill have spread out the capital gains due over many years.
If your life expectancy is less than 15 years, you may decideto diversify only part of your position. Perhaps you decide todiversify half the position over the coming 5 years and assume therisk and added volatility of holding the remainder of the positionuntil your death. Common sense tells you that the shorter yourlife expectancy, the more comfortable you are with continuing tohold an overweighted position in one stock. A decent rule-of-thumb is if you have a life expectancy beyond 15 years, you’redefinitely better off selling a percentage of your stock each yearand paying your capital gains tax. Since you still have manyyears left to live (hopefully) you should more than make up forthe money you paid in taxes, with better performance of yourdiversified portfolio in the coming years.
Obviously, if a significant loss in your overweighted, one-stock portfolio will force you to change your lifestyle, you reallyshould make a change (start diversifying) immediately. Wouldn’tyou rather pay some capital gains taxes than risk a comfortableretirement?
Hedging a low-basis portfolio
If you have a low-basis stock portfolio in a taxable accountand you decide you can’t part with your stocks, for whateverreasons, you may want to consider hedging. Or, depending onwhether or not you are interested in following the valuations ofthe stock market by using the Fed Model, you may decide tohedge your portfolio to protect against losses during extremeovervaluation periods. Let’s look at an example. If you werefortunate enough to buy a handful of large-cap technology andhealth care stocks in the late 1980s, and you didn’t get scared out
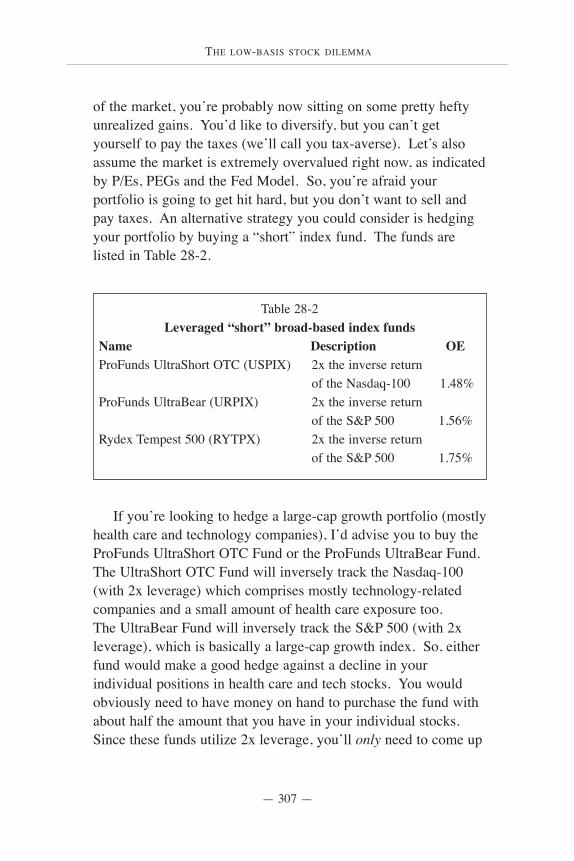
THE LOW-BASIS STOCK DILEMMA
— 307 —
of the market, you’re probably now sitting on some pretty heftyunrealized gains. You’d like to diversify, but you can’t getyourself to pay the taxes (we’ll call you tax-averse). Let’s alsoassume the market is extremely overvalued right now, as indicatedby P/Es, PEGs and the Fed Model. So, you’re afraid yourportfolio is going to get hit hard, but you don’t want to sell andpay taxes. An alternative strategy you could consider is hedgingyour portfolio by buying a “short” index fund. The funds arelisted in Table 28-2.
If you’re looking to hedge a large-cap growth portfolio (mostlyhealth care and technology companies), I’d advise you to buy theProFunds UltraShort OTC Fund or the ProFunds UltraBear Fund.The UltraShort OTC Fund will inversely track the Nasdaq-100(with 2x leverage) which comprises mostly technology-relatedcompanies and a small amount of health care exposure too. The UltraBear Fund will inversely track the S&P 500 (with 2xleverage), which is basically a large-cap growth index. So, eitherfund would make a good hedge against a decline in yourindividual positions in health care and tech stocks. You wouldobviously need to have money on hand to purchase the fund withabout half the amount that you have in your individual stocks.Since these funds utilize 2x leverage, you’ll only need to come up
Table 28-2Leveraged “short” broad-based index funds
Name Description OEProFunds UltraShort OTC (USPIX) 2x the inverse return
of the Nasdaq-100 1.48%ProFunds UltraBear (URPIX) 2x the inverse return
of the S&P 500 1.56%Rydex Tempest 500 (RYTPX) 2x the inverse return
of the S&P 500 1.75%
ADVANCED PORTFOLIO MANAGEMENT
— 308 —
with half the money to hedge 100% of your individual stockpositions. For example, if you have $1 million in your stockportfolio, purchase the ProFunds UltraShort OTC Fund for$500,000, since it will trade at $1 million (remember, it’sleveraged). If your strategy works and the stock market drops,you should make up (hopefully) for the losses in your individualstock positions, with gains in your UltraShort OTC Fund.
Note—once again, if you decide to hedge your portfolio usingthe ProFunds (or Rydex), try to hold these funds in a tax-deferredaccount. The turnover on these funds is extremely high and maymake them tax inefficient—you may receive a taxable distributionunexpectedly. And, if you hold them in your IRA or other tax-deferred account, and you happen to be right about the market’svaluation (and it declines) the gain you post in your short fundwill not be subject to taxes.
The short funds offered by ProFunds and Rydex can be avaluable tool to hedge an existing portfolio. If you can’t getyourself to sell some of your existing low-basis stocks todiversify, you may want to hedge your portfolio at some time inthe future to control risk. These funds can help you do that, andbypass some of the expenses associated with margin accounts.
OPTIMIZERS, CAN THEY HELP YOU BUILD THE “OPTIMAL” PORTFOLIO?
— 309 —
ASSET ALLOCATION IS NOT AN EXACT science. However,there are some who think it is. Some investment professionals usewhat is called an optimization process to help find the “optimal”asset allocation mix for their clients. Optimizers are basicallynumber-crunching software programs that attempt to construct aportfolio in the most efficient way across the entire “spectrum ofrisk.” In simple english, an optimizer will try to put together aportfolio that has the greatest return for a stated amount of risk.
Optimizers, can they help youbuild the “optimal” portfolio?
Optimizers aren’t all bad. They can teach you how to effectively
mix and match asset classes and sectors.
29
ADVANCED PORTFOLIO MANAGEMENT
— 310 —
Most optimizers utilize what are called efficient frontiermodels to determine your ideal portfolio based on your statedtolerance for risk. An optimizer will allocate “optimal”percentages into each chosen asset class or sector by looking atcorrelations, standard deviations and expected returns. Theproblem with this approach to structuring a portfolio is that nocomputer program can predict future correlations, standarddeviations or returns. And, optimizers do not factor in all therisks inherent in investing in stocks. They will typically only usestandard deviation measurements to define risk. But, as weexplored earlier in the book, there are other types of risk instock investing—notably size and style. If standard deviationwas the only type of risk, then optimizers would be a perfectlylegitimate approach to investing.
I’d like to show you a couple of examples to highlight thepotential pitfalls of owning an “optimized” portfolio. In theMay 2001 issue of Financial Planning, a table showing 6“Optimal Domestic Equity Portfolios” appeared in an articleby C. Michael Carty on ETFs. The optimized portfolios(Table 29-1), show various allocations the optimizer came upwith, depending on a stated level of risk. Note, look how theoptimizer changed the allocation if the stated level of risk waschanged from conservative to aggressive.
If you are an aggressive investor, and can handle a lot ofrisk (high standard deviations or variation of returns), thisoptimizer recommends you allocate 39.8% of your portfolio totechnology stocks, and much of the remainder of your moneyin the cyclical/transports, energy and utility sectors. So, youwould basically be investing your entire portfolio in only 4sectors. The optimizer has decided that the industrials, basicindustries and consumer services don’t warrant your money.Obviously by owning only 4 sectors—40% in one sector—youwould be assuming a lot of risk.

OPTIMIZERS, CAN THEY HELP YOU BUILD THE “OPTIMAL” PORTFOLIO?
— 311 —
Tabl
e 29
-1—
ETF
Ass
et A
lloca
tions
for
6 O
ptim
al D
omes
tic E
quity
Por
tfolio
sR
esam
pled
Por
tfolio
sR
isk
cons
erva
tive
aggr
essi
veA
sset
cla
sses
1
1
1
2
1
31
41
51T-
bills
99.7
%75
.6%
51.1
%27
.3%
9
.6%
2.
6%B
asic
Indu
strie
s0.
00.
10.
20.
20.
30.
2C
onsu
mer
Ser
vice
s0.
00.
71.
52.
12.
00.
2C
onsu
mer
Sta
ples
0.0
3.0
6.1
8.9
9.8
6.4
Cyc
lical
/Tra
nspo
rts0.
13.
97.
711
.615
.012
.8En
ergy
0.0
3.9
7.8
11.7
14.4
14.0
Fina
ncia
ls0.
00.
81.
72.
54.
38.
6In
dust
rials
0.0
0.2
0.3
0.5
0.8
0.4
Tech
nolo
gy0.
24.
89.
414
.321
.539
.8U
tiliti
es0.
07.
114
.220
.822
.215
.0S&
P50
00.
00.
00.
10.
10.
10.
0To
tal
100.
010
0.0
100.
010
0.0
100.
010
0.0
Ann
ual R
etur
n (%
)5.
36.
57.
89.
010
.111
.0St
d. D
evia
tion
(%)
0.2
3.6
7.1
10.7
14.1
19.1
Sour
ce: N
ew F
ront
ier A
dvis
ors
LLC
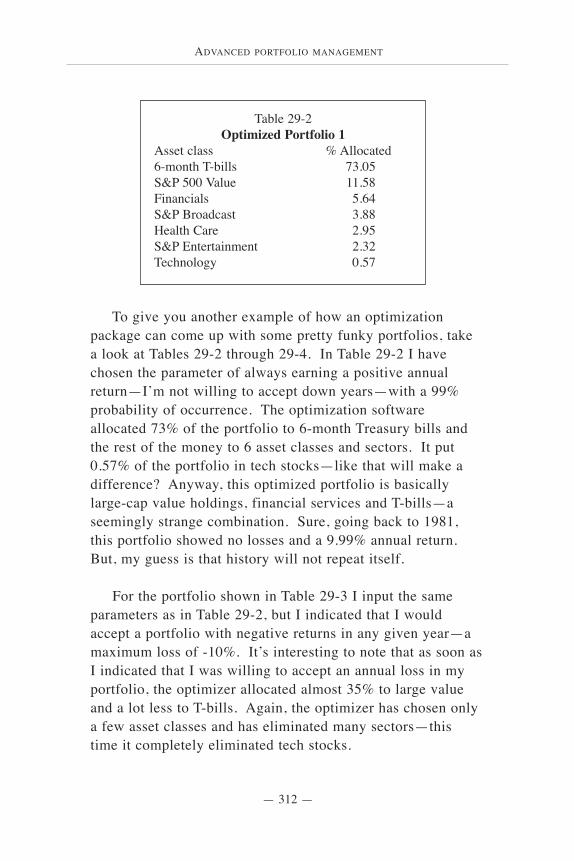
ADVANCED PORTFOLIO MANAGEMENT
— 312 —
To give you another example of how an optimizationpackage can come up with some pretty funky portfolios, takea look at Tables 29-2 through 29-4. In Table 29-2 I havechosen the parameter of always earning a positive annualreturn—I’m not willing to accept down years—with a 99%probability of occurrence. The optimization softwareallocated 73% of the portfolio to 6-month Treasury bills andthe rest of the money to 6 asset classes and sectors. It put0.57% of the portfolio in tech stocks—like that will make adifference? Anyway, this optimized portfolio is basicallylarge-cap value holdings, financial services and T-bills—aseemingly strange combination. Sure, going back to 1981,this portfolio showed no losses and a 9.99% annual return.But, my guess is that history will not repeat itself.
For the portfolio shown in Table 29-3 I input the sameparameters as in Table 29-2, but I indicated that I wouldaccept a portfolio with negative returns in any given year—amaximum loss of -10%. It’s interesting to note that as soon asI indicated that I was willing to accept an annual loss in myportfolio, the optimizer allocated almost 35% to large valueand a lot less to T-bills. Again, the optimizer has chosen onlya few asset classes and has eliminated many sectors—thistime it completely eliminated tech stocks.
Table 29-2Optimized Portfolio 1
Asset class % Allocated6-month T-bills 73.05S&P 500 Value 11.58Financials 5.64S&P Broadcast 3.88Health Care 2.95S&P Entertainment 2.32Technology 0.57
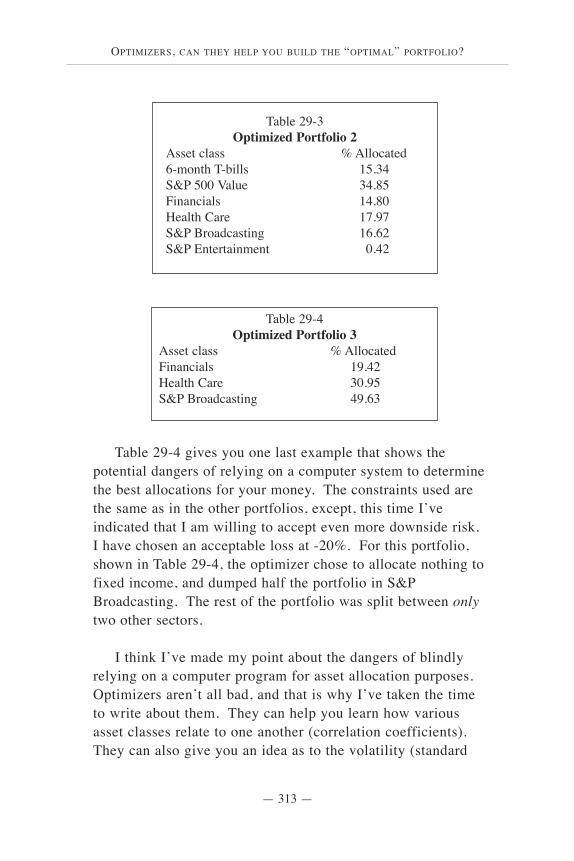
OPTIMIZERS, CAN THEY HELP YOU BUILD THE “OPTIMAL” PORTFOLIO?
— 313 —
Table 29-4 gives you one last example that shows thepotential dangers of relying on a computer system to determinethe best allocations for your money. The constraints used arethe same as in the other portfolios, except, this time I’veindicated that I am willing to accept even more downside risk.I have chosen an acceptable loss at -20%. For this portfolio,shown in Table 29-4, the optimizer chose to allocate nothing tofixed income, and dumped half the portfolio in S&PBroadcasting. The rest of the portfolio was split between onlytwo other sectors.
I think I’ve made my point about the dangers of blindlyrelying on a computer program for asset allocation purposes.Optimizers aren’t all bad, and that is why I’ve taken the timeto write about them. They can help you learn how variousasset classes relate to one another (correlation coefficients).They can also give you an idea as to the volatility (standard
Table 29-3Optimized Portfolio 2
Asset class % Allocated6-month T-bills 15.34S&P 500 Value 34.85Financials 14.80Health Care 17.97S&P Broadcasting 16.62S&P Entertainment 0.42
Table 29-4Optimized Portfolio 3
Asset class % AllocatedFinancials 19.42Health Care 30.95S&P Broadcasting 49.63

ADVANCED PORTFOLIO MANAGEMENT
— 314 —
deviation) of different sectors and asset classes. And, theycan show you hypothetical results of how certain portfoliomixes would have performed in the past. Obviouslyoptimizers cannot predict the future behavior of asset classesand sectors. But, we can still learn a fair amount fromstudying past relationships with the help of optimizers.
THE CASE AGAINST INVESTING IN FOREIGN STOCKS
— 315 —
I’M NOT PARTICULARLY FOND OF investing in foreign stockmarkets. Many advisors and professionals disagree with me, but Idon’t feel that owning the markets in Europe or Asia offer manyadvantages. Proponents of international stock investing will oftenpoint out that foreign markets are uncorrelated to our domesticmarkets, and this helps lessen risk. Furthermore, “pure” indexersbelieve it is a must to own the foreign markets. They approachthe topic as if you are some sort of heretic if you don’t have someof your portfolio invested abroad—you’re not a true indexer orbeliever in efficient markets.
The case against investing in foreignstocks, and one reason you may want to
Though most ETFs have paid out little in capital gains,many of them have short histories. And already there havebeen notable exceptions: Barclays’ Canada and Sweden
ETFs paid out massive capital gains last year,for instance—just as many as traditional mutual funds did.
—JOSH FRIEDMAN, Los Angeles Times
30
ADVANCED PORTFOLIO MANAGEMENT
— 316 —
Jonathan Clements, of the The Wall Street Journal, is aproponent of indexing. He recommends investing up to 25% ofyour money abroad. I respect Mr. Clements, but I question hisadvice for the following reasons:
1) Approximately 25% of the earnings for companies thatmake up the S&P 500 come from abroad. So, if you owncompanies in the S&P 500 index—most investors do—you havesufficient international exposure simply by the fact that a quarterof the earnings come from abroad.
2) Costs. Indexing a portfolio of foreign stocks can beexpensive. The costs associated with domestic indexing isanywhere from .095% to .60%. My guess is the averagestructured index portfolio—diversified among small-, mid- andlarge-cap stock indexes—has ongoing management fees ofapproximately .30%. The management fees for the iShares thattrack international markets are generally .84% annually—payingalmost 3 times more to index foreign markets is notinconsequential.
3) Currency risk. When you buy an ETF that tracks theEuropean markets, the fund management company exchangesyour dollars for Euros, to purchase the local stocks. Yourinvestment is quoted in U.S. dollars, however, on a U.S.-basedexchange. The result is that you have currency exposure thatcould hurt, or help, your performance. If the Euro appreciatesversus the U.S. dollar, and you own the iShares S&P Europe 350,you will make money on the currency appreciation. In addition, ifthe European stock markets appreciate, you will also make moneyon the underlying stocks in your ETFs. You could effectively getan extra boost from the currency appreciation, in addition to therising value of the underlying stocks. Unfortunately the reversecan happen too. And, that has been the case for the past 5 yearsor so. The U.S. dollar has been rising against most foreign

THE CASE AGAINST INVESTING IN FOREIGN STOCKS
— 317 —
currencies, and foreign stock markets have been falling insympathy with the U.S market. (We’ll leave the Japanese marketout of this, since it has been falling for more than a decade.)Anyway, as the U.S. dollar has appreciated against most majorcurrencies, the losses in mutual funds that track foreign stockmarkets have been exacerbated by the falling local currencies.When the fund management companies exchange their holdingsback into U.S. dollars, the losses are ugly. So, U.S.-basedinvestors, with the dollar as their currency of reference, have beenhurt by a strong dollar and weak foreign stock markets—a doublewhammy.
4) Foreign stock markets continue to become more correlatedto the U.S. markets, therefore the diversification argument is lost.As the world’s economies have become more reliant on oneanother, the global stock markets have become more highlycorrelated. If this high correlation persists, there will be virtuallyno diversification benefit from investing abroad. As shown inTable 30-1, this has been the case recently, especially during thepast 5 years. This correlation trend should be a cause for concernfor asset allocators. Owning the foreign stock markets has notreduced risk in equity portfolios.
5) More volatility in the foreign markets. We’ve already seenthat the foreign markets don’t offer much diversification of returns
Table 30-1Correlations of EAFE* and major U.S. indexes
Asset Class 1981-1986 1986-1991 1991-1996 1996-2001EAFE to S&P 500 0.43 0.47 0.40 0.79EAFE to S&P 400 0.43 0.42 0.38 0.73EAFE to Russell 2000 0.35 0.41 0.34 0.67
*MSCI Europe Index.
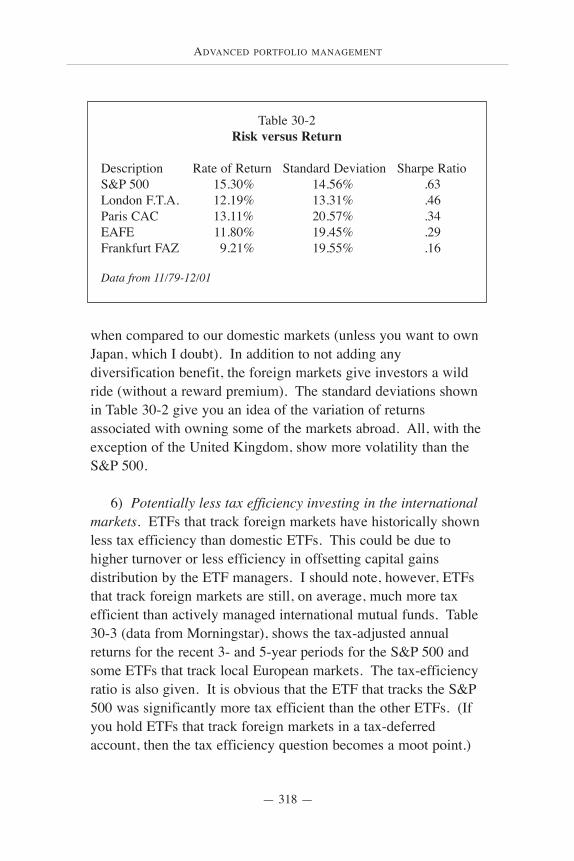
ADVANCED PORTFOLIO MANAGEMENT
— 318 —
when compared to our domestic markets (unless you want to ownJapan, which I doubt). In addition to not adding anydiversification benefit, the foreign markets give investors a wildride (without a reward premium). The standard deviations shownin Table 30-2 give you an idea of the variation of returnsassociated with owning some of the markets abroad. All, with theexception of the United Kingdom, show more volatility than theS&P 500.
6) Potentially less tax efficiency investing in the internationalmarkets. ETFs that track foreign markets have historically shownless tax efficiency than domestic ETFs. This could be due tohigher turnover or less efficiency in offsetting capital gainsdistribution by the ETF managers. I should note, however, ETFsthat track foreign markets are still, on average, much more taxefficient than actively managed international mutual funds. Table30-3 (data from Morningstar), shows the tax-adjusted annualreturns for the recent 3- and 5-year periods for the S&P 500 andsome ETFs that track local European markets. The tax-efficiencyratio is also given. It is obvious that the ETF that tracks the S&P500 was significantly more tax efficient than the other ETFs. (Ifyou hold ETFs that track foreign markets in a tax-deferredaccount, then the tax efficiency question becomes a moot point.)
Table 30-2Risk versus Return
Description Rate of Return Standard Deviation Sharpe RatioS&P 500 15.30% 14.56% .63London F.T.A. 12.19% 13.31% .46Paris CAC 13.11% 20.57% .34EAFE 11.80% 19.45% .29Frankfurt FAZ 9.21% 19.55% .16
Data from 11/79-12/01
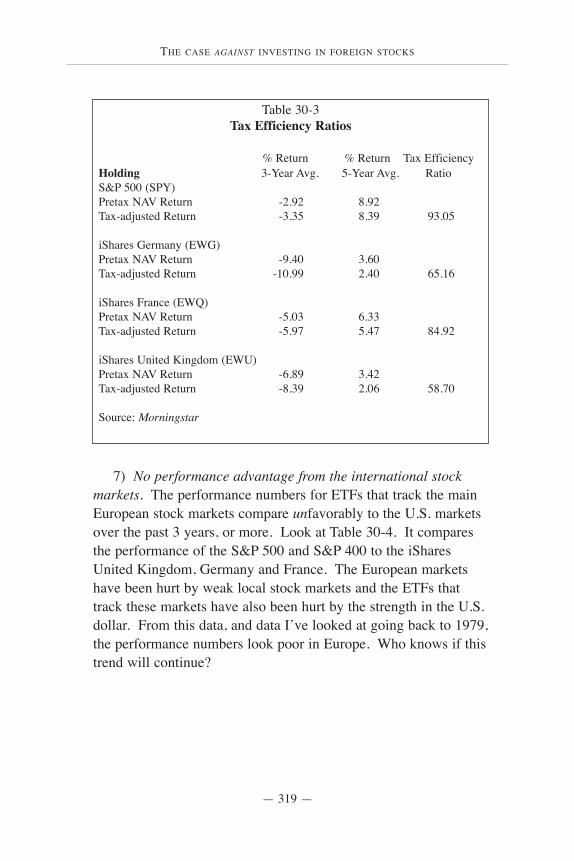
THE CASE AGAINST INVESTING IN FOREIGN STOCKS
— 319 —
7) No performance advantage from the international stockmarkets. The performance numbers for ETFs that track the mainEuropean stock markets compare unfavorably to the U.S. marketsover the past 3 years, or more. Look at Table 30-4. It comparesthe performance of the S&P 500 and S&P 400 to the iSharesUnited Kingdom, Germany and France. The European marketshave been hurt by weak local stock markets and the ETFs thattrack these markets have also been hurt by the strength in the U.S.dollar. From this data, and data I’ve looked at going back to 1979,the performance numbers look poor in Europe. Who knows if thistrend will continue?
Table 30-3Tax Efficiency Ratios
% Return % Return Tax EfficiencyHolding 3-Year Avg. 5-Year Avg. RatioS&P 500 (SPY)Pretax NAV Return -2.92 8.92Tax-adjusted Return -3.35 8.39 93.05
iShares Germany (EWG)Pretax NAV Return -9.40 3.60Tax-adjusted Return -10.99 2.40 65.16
iShares France (EWQ)Pretax NAV Return -5.03 6.33Tax-adjusted Return -5.97 5.47 84.92
iShares United Kingdom (EWU)Pretax NAV Return -6.89 3.42Tax-adjusted Return -8.39 2.06 58.70
Source: Morningstar

ADVANCED PORTFOLIO MANAGEMENT
— 320 —
One good reason you should consider buying theforeign stock markets now
I’ll admit it. I’m seriously considering investing in foreignstock markets through ETFs, right now, in spite of theirshortcomings. Here’s why. As I’ve mentioned, most of theforeign markets have performed miserably over the past fewyears—worse than our domestic markets. Their currencies andstock markets have been creamed. But, a reversion-to-meanscenario would indicate that this will change in the coming years.If the U.S. dollar has plateaued, which appears as if it may be thecase, and foreign stock markets recover, owning internationalETFs would be pretty appealing. Dollar-based investors couldpotentially benefit from a falling U.S. dollar and risinginternational stock markets.
If you recognize the risks and the potential negatives that I’veoutlined in this chapter, but you believe in reversion-to-mean, youmay ultimately decide to buy some ETFs that track foreign stockmarkets. If you do, own them in a tax-deferred account, ifpossible, and keep your allocation to no more than 30% of yourtotal portfolio.
Table 30-4Recent, 3-Year ETF performance comparison
(Approximate, 2/99-2/02)Index 3-Year Total PerformanceS&P 500 (SPY) -12%S&P 400 (MDY) +30%iShares United Kingdom (EWU) -30%iShares Germany (EWG) -38%iShares France (EWQ) -22%
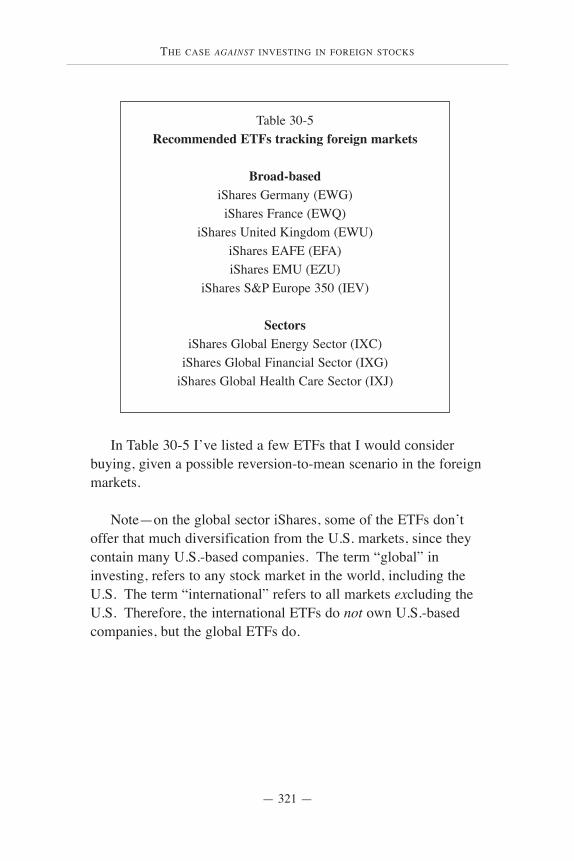
THE CASE AGAINST INVESTING IN FOREIGN STOCKS
— 321 —
In Table 30-5 I’ve listed a few ETFs that I would considerbuying, given a possible reversion-to-mean scenario in the foreignmarkets.
Note—on the global sector iShares, some of the ETFs don’toffer that much diversification from the U.S. markets, since theycontain many U.S.-based companies. The term “global” ininvesting, refers to any stock market in the world, including theU.S. The term “international” refers to all markets excluding theU.S. Therefore, the international ETFs do not own U.S.-basedcompanies, but the global ETFs do.
Table 30-5Recommended ETFs tracking foreign markets
Broad-based iShares Germany (EWG)iShares France (EWQ)
iShares United Kingdom (EWU)iShares EAFE (EFA)iShares EMU (EZU)
iShares S&P Europe 350 (IEV)
SectorsiShares Global Energy Sector (IXC)
iShares Global Financial Sector (IXG)iShares Global Health Care Sector (IXJ)
ADVANCED PORTFOLIO MANAGEMENT
— 322 —
I AM NOT A LICENSED INSURANCE AGENT. I don’t sell lifeinsurance products and I don’t sell variable annuities. But, I dohave a strong opinion. I’ll put the facts down on paper, and youcan decide for yourself. First of all, a variable annuity can bedefined as basically a mutual-fund account that is wrapped insidean insurance product. The insurance portion of the annuityguarantees the return of your principal (the original dollar amountyou contributed to your account), if the value of your account isbelow your initial contribution when you die.
Annuity blues
No other investment product gives sales agents a fattercommission. A broker usually pockets a fee of 5% to 8%
when selling an annuity contract.—DAVID FRANECKI, Barron’s
31
ANNUITY BLUES
— 323 —
Advantages
Yes, there are a few advantages—read them and then jump tothe section that discusses their disadvantages to see how I reallyfeel about them.
1) Tax-deferred growth. You can contribute an unlimitedamount of money to a variable annuity (unlike an IRA or 401k)and all taxes will be deferred until you take your money out.
2) Guaranteed death benefit. When you die the beneficiaryof your variable annuity will receive at least all of your originalcontributions back. This can be a great feature if you happen todie near a bear-market bottom.
3) Tax-free changes. Unlike in a taxable investment account,you can switch your money among various mutual funds withinyour annuity, without any tax consequences.
4) Costs. The ongoing management fees of the mutual fundsfound within variable annuities are generally less expensive thanmost mutual funds outside of annuities (about .80% versus1.40%).
Disadvantages
1) High cost of the insurance portion of the variable annuity.The insurance wrapper that you have purchased will probablycost you about 1%. And, you are very unlikely to receive anybenefit from the insurance wrapper since you will probably notdie at exactly the time your account value is below your originalcontributions. Over time, it is much more likely your accountwill appreciate, and these Mortality and Expense (M&E) fees willhave been for naught.
ADVANCED PORTFOLIO MANAGEMENT
— 324 —
2) Early withdrawal penalties. Most variable annuities comewith surrender fees that start at 7%. If you need your money andwant to make a withdrawal before 7 years is up, you will paypenalties. There is usually a sliding scale—each year, until theseventh year, the penalty drops by 1%. And, if you need to cashout your annuity before age 59 1/2, you will also have to pay a 10%tax penalty (except in certain circumstances).
3) High total operating costs. If you calculate the total fees(M&E plus mutual fund fees) the average expense ratio forvariable annuities amounts to approximately 2.17%. You can saveyourself a lot of money by simply investing in a tax-efficient,index-based investment without an annuity, where fees range from.095% to .60% annually.
4) Limited investment choices. Annuities have a limitedselection of funds available to investors. And, there is generally avery poor selection of index-based investments. So, you may notbe able to invest the way you want within the annuity.
5) Loss of capital gains. When you make your withdrawalsfrom your annuity, any appreciation is taxed at ordinary incometax rates. Even if you owned stock mutual funds within yourannuity, and your gains are capital gains (not ordinary income),the proceeds are still taxed as ordinary income. This is a greatdisadvantage since capital gains tax rates are 20% at the federallevel, while ordinary income rates can go up to almost 40%.
6) Loss of a step up in basis. This disadvantage is unknownto many annuity holders. When you die, and your assets arewithin an annuity, your estate will not receive a step up in basisfor these assets. Unlike a taxable account, where upon your death,your estate receives a step up to the fair-market value on the dateof your death, your heirs will not receive this stepped-up basis.Gains on your annuity will be subject to ordinary income tax rates.
ANNUITY BLUES
— 325 —
Here’s an example of the loss of a stepped-up basis—youinvest $100,000 in a variable annuity and the account grows to $1million. Unfortunately, the tax basis for your beneficiaries wouldbe $100,000, leaving $900,000 to be taxed. If the investment hadbeen made in a taxable account, however, the tax basis for thebeneficiaries would have been $1 million, thanks to the stepped-up basis at death.
Summary
The disadvantages of owning variable annuities far outweighthe advantages. Tax-deferred growth can basically beaccomplished by owning index-based investments within ataxable account. So, the so-called tax-deferral advantage offeredby variable annuities is not a great selling point. Index funds andETFs are tax efficient, so why lock up your money in an annuityand pay the extra M&E costs? Annuities are usually sold byagents looking to make a hefty up-front commission after the sale.Before you purchase an annuity, consult an advisor you trust—one who is not commission-based.

ADVANCED PORTFOLIO MANAGEMENT
— 326 —
MANY INVESTMENT ADVISORS BELIEVE in adding a realestate component to a traditional asset-class portfolio. I havemixed emotions on Real Estate Investment Trusts (REITs). Ibelieve they may make sense for some investors, so I want to takesome time to cover the advantages and disadvantages of owningindex-based REITs.
REITs can be defined as similar to a typical mutual fund,however, rather than owning shares in a diversified portfolio of
Real Estate Investment Trusts
Real-estate funds can be an important part of asset allocation,but it’s not something that is a core holding.
—MICHAEL CHASNOFF, ACS Financial Advisors
A constant 5% to 10% allocation of real estate canboost income while simultaneously providing additional
planning advantages: diversification, risk reduction,capital preservation, and tax efficiency.—LEO F. WELLS III, Financial Planning
32
REAL ESTATE INVESTMENT TRUSTS
— 327 —
stocks or bonds, you own shares in a portfolio of real estateinvestments. REIT investors can share ownership in apartmentbuildings, office properties, malls and shopping centers.
Here are the advantages and disadvantages of owning REITs—
Advantages
1) Instant diversification. Index-based REITs give youindirect ownership in various real estate investments—apartmentbuildings, office properties, warehouses, malls, shopping centers,hotels, health care and storage facilities. This is greatdiversification across an entire asset class.
2) High-yield investment. REITs “pass through” their incometo the investor. Presently REITs are yielding approximately 6%,while money-market rates are hovering around 1.6% So, from ayield-perspective only, REITs look very attractive.
3) Low costs. REIT index funds can be bought throughtraditional index funds or ETFs (e.g. Vanguard REIT Index Fund,DFA Real Estate Portfolio, iShares Dow Jones U.S. Real EstateIndex Fund). The ongoing management fees for all of these fundsare very reasonable. The iShares charge 0.60% annually,Vanguard’s fund charges 0.33% and DFA’s charges 0.47%. Likeindex-based stock and bond funds, these passively managed REITfunds offer great savings compared to actively managed funds.
4) Convenient way to own income-producing real estate.Many of us don’t want to deal with tenants, upkeep and collecting rent. Furthermore, not many retirees are comfortableowning an illiquid investment in a real estate property—it’s prettytough to locate a buyer quickly if you need your money. REITsallow you to bypass these disadvantages. You simply buy sharesin the open market—like buying a stock or mutual fund—and sell
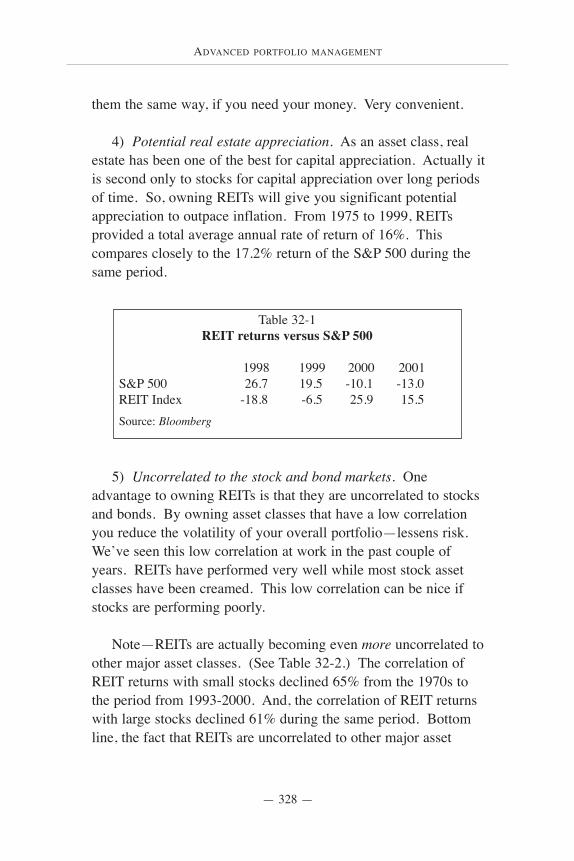
ADVANCED PORTFOLIO MANAGEMENT
— 328 —
them the same way, if you need your money. Very convenient.
4) Potential real estate appreciation. As an asset class, realestate has been one of the best for capital appreciation. Actually itis second only to stocks for capital appreciation over long periodsof time. So, owning REITs will give you significant potentialappreciation to outpace inflation. From 1975 to 1999, REITsprovided a total average annual rate of return of 16%. Thiscompares closely to the 17.2% return of the S&P 500 during thesame period.
5) Uncorrelated to the stock and bond markets. Oneadvantage to owning REITs is that they are uncorrelated to stocksand bonds. By owning asset classes that have a low correlationyou reduce the volatility of your overall portfolio—lessens risk.We’ve seen this low correlation at work in the past couple ofyears. REITs have performed very well while most stock assetclasses have been creamed. This low correlation can be nice ifstocks are performing poorly.
Note—REITs are actually becoming even more uncorrelated toother major asset classes. (See Table 32-2.) The correlation ofREIT returns with small stocks declined 65% from the 1970s tothe period from 1993-2000. And, the correlation of REIT returnswith large stocks declined 61% during the same period. Bottomline, the fact that REITs are uncorrelated to other major asset
Table 32-1REIT returns versus S&P 500
1998 1999 2000 2001 S&P 500 26.7 19.5 -10.1 -13.0REIT Index -18.8 -6.5 25.9 15.5Source: Bloomberg

REAL ESTATE INVESTMENT TRUSTS
— 329 —
classes is a great argument for adding them to a traditionalportfolio of stocks and bonds. By doing so you will definitelysmooth out your overall returns and therefore lessen risk.
Disadvantages
1) High taxable income. Yes, the long-term returns of REITshave been excellent, but much of the return is a taxable dividend.The taxable dividend of approximately 6% reduces the total returnof REITs by at least a couple of percentage points on average,annually. So, stocks have probably outperformed REITs by morethan 2 or 3 percentage points, averaged annually, on an after-taxbasis for many years. So, if you are already in a high tax bracketyou may not need the extra income. However, if you can ownREITs in a tax-deferred account, then this tax issue is irrelevant.
2) Your home may already be your greatest asset. Does itmake sense to concentrate more money in this asset class?If you calculate how much equity you have in your home, youmay feel that you already have enough exposure to real estate.For most investors, the equity in their homes represents theirlargest concentrated investment—more than their stocks or bonds.Real estate can have periods of very poor returns, as we’vewitnessed in California in the early to mid-1990s. So, you must
Table 32-2Declining Equity REIT Correlation
Correlation of REIT Total Returns to other investments
Asset Class 1972-2000 1970s* 1980s 1990s 1993-2000Small Stocks 0.63 0.74 0.74 0.58 0.26Large Stocks 0.55 0.64 0.65 0.45 0.25Bonds 0.20 0.27 0.17 0.26 0.16*1972-1979
Source: Ibbotson Associates
ADVANCED PORTFOLIO MANAGEMENT
— 330 —
consider whether or not you want to concentrate even more ofyour money in this asset class.
3) REIT returns seem very unpredictable, and do not trackresidential real estate. This may not necessarily be adisadvantage, but it makes REIT returns difficult to grasp. Theappreciation or depreciation of your home may not necessarilycorrelate to the types of real estate that REITs own. This can besomewhat annoying when your home is appreciating, but yourREIT fund is going down. This happened in 1998 and 1999 inSouthern California. So, in this sense, it is a bit difficult for someresidential homeowners to understand how REITs work and whythey make or lose money when they do. They are a bit of astrange animal.
Summary
I think REITs probably deserve some of your money, but notright now. After plunging about 25% during 1998-1999, REITshave been in an uptrend. They have attracted more and moremoney from investors as stocks have fallen along with bondyields. So, the yield offered by REITs has attracted bondinvestors, and the capital appreciation potential has attracted stockinvestors. I believe this is simply a case of naive investors“chasing performance” and I am wary of the lofty prices.
A recent article in the The Wall Street Journal mentioned thework of Ian Morris, an economist at HSBC Securities. Mr. Morrishas a simple, common-sense approach to valuing real estate. Heapplies a ratio to real estate that he believes is akin to P/E ratiosfor stocks. His ratio compares real estate prices with whatAmericans are earning. In other words, how homes are pricedrelative to our salaries. His recent findings showed this ratio to beat 1.6, which means homes, right now, are very expensive byhistorical standards. This ratio hovered around 1.2 during the
REAL ESTATE INVESTMENT TRUSTS
— 331 —
1960s and 1970s. The recent reading is at the same level it was atthe peak in 1989, just before real estate prices plunged. Mr.Morris sees more expensive homes “higher end,” particularlyvulnerable.
Again, while it may make sense to add REITs to a traditionalportfolio of stocks and bonds, I don’t believe it’s the right time todo so. Real estate valuations are extreme, and if a reversion-to-mean scenario happens, we’re probably going to soon be enteringa period of real estate underperformance. Be patient and you’llprobably find a better time to add REITs to your portfolio.
If you eventually decide to own REITs, I would recommendnot allocating more than 20% of your total portfolio to this assetclass. And, again, hold your REITs in a tax-deferred account ifpossible, so you won’t give up much of that fat dividend check toUncle Sam.
EPILOGUE
— 332 —
WHAT CAN WE EXPECT FROM STOCKS going forward? Thestock market’s average annual returns of 27.5% from 1996-1999,in hindsight, appear ridiculously generous. Actually, we’ve beenspoiled going back to the early 1980s. Average annualcompounded returns were about 16% for the S&P 500 from 1982-2000. Even after the recent bloodbath, stock valuations are stillhigh by historical standards. So, what’s a reasonable assumptionfor stock returns in this decade?
Epilogue
I think we are in a structural bear market that will lastfor five to ten years. It is not a nice picture. But it will not
go straight down. From time to time there will be monetarystimulus. Markets will get oversold and will rise for awhile.
Markets will zigzag downward. It will not be over untilstocks trade at attractive valuation levels.
—FELIX ZULAUF, president, Zulauf Asset Management AG
There is one way to succeed on Wall Street. It is the wayWarren Buffett got rich. Pay low prices for the shares
of good businesses. Buy them when the rest of theworld wants to sell them. Keep your wits about you.
Have the courage of your convictions.—JAMES GRANT, writer, editor, Grant’s Interest Rate Observer

EPILOGUE
— 333 —
If we analyze how we got to where we are today, maybe wecan have an idea about what to expect in the future. With the helpof the table shown above, from The Credit Bank Analyst, it’silluminating to see the differences in what accounted for the stockmarket’s returns during the period 1950-1995, and from 1996-2000. In the earlier period, corporate earnings growth was about7.3%. Add the dividend during the period of 4.3% and P/Eimprovement—the premium that investors were willing to pay forstocks—of another 1.5%, and you get an average annual stockmarket return of 13.1%.
In the period 1996-1999 stock prices climbed dramatically, butnot because of earnings improvements. Earnings growth wasabout the same as it had been in the past half century, butinvestors were all of a sudden willing to pay a huge premium forstocks—P/E improvement of 18.1%. With reinvested dividendsequaling 2.1%, the total average annual return from 1996-1999was a nose-bleeding 27.5%.
How do we estimate future earnings growth? Martin Barnes,the managing editor of The Bank Credit Analyst, explained in anarticle in Mutual Funds, that “one of the more durable economictrends is that earnings grow in line with nominal gross domestic
Where Returns Come From
1950-19951 1996-19991 2000-20101,2
Corporate Earnings Growth 7.3% 7.3% 6.0%P/E Improvement +1.5% +18.1% +NoneReinvested Dividends +4.3% +2.1% +1.5%Total Stock Market Returns = 13.1% = 27.5% = 7.5%
Notes: 1Numbers are annual. 2Estimates. Source: The Bank Credit Analyst
— 334 —
EPILOGUE
product (real growth plus inflation). So, if real GDP grows at itshistorical average pace of 3.5% a year, and inflation stays low, thisimplies that earnings will at best rise by maybe 6% a year.”
Okay, if we’re likely to get 6% annual earnings growth in thecoming years, as Barnes suggests, what about P/E improvement?P/Es have historically ranged between 12 and 26 for the S&P 500(average of about 15). If you buy stocks near the upper range, theP/Es are unlikely to rise much further, so your profits will bereliant on earnings growth—entirely. With a forward P/E of 23right now for the S&P 500, it would appear unlikely that P/Eimprovement will help stock prices in the near future. Ifdividends stay where they are, at 1.5%, and we can expect no P/Eimprovement, and about 6% in corporate earnings growth, ourtotal annual return will be about 7.5% for stocks. Not tooexciting, but still likely to be more attractive than bonds and cash.
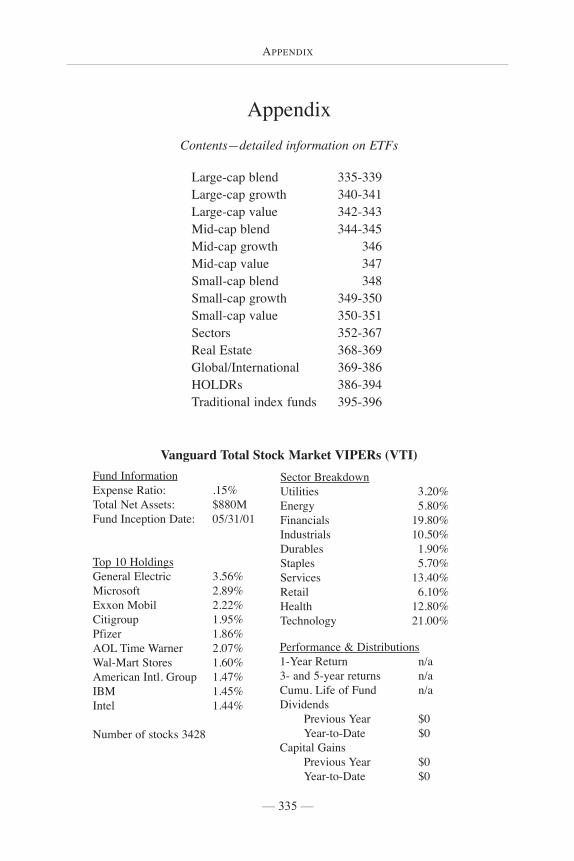
— 335 —
APPENDIX
Vanguard Total Stock Market VIPERs (VTI)Fund InformationExpense Ratio: .15%Total Net Assets: $880MFund Inception Date: 05/31/01
Top 10 HoldingsGeneral Electric 3.56%Microsoft 2.89%Exxon Mobil 2.22%Citigroup 1.95%Pfizer 1.86%AOL Time Warner 2.07%Wal-Mart Stores 1.60%American Intl. Group 1.47%IBM 1.45%Intel 1.44%
Number of stocks 3428
Sector BreakdownUtilities 3.20%Energy 5.80%Financials 19.80%Industrials 10.50%Durables 1.90%Staples 5.70%Services 13.40%Retail 6.10%Health 12.80%Technology 21.00%
Performance & Distributions1-Year Return n/a3- and 5-year returns n/aCumu. Life of Fund n/aDividends
Previous Year $0Year-to-Date $0
Capital GainsPrevious Year $0Year-to-Date $0
AppendixContents—detailed information on ETFs
Large-cap blend 335-339Large-cap growth 340-341Large-cap value 342-343Mid-cap blend 344-345Mid-cap growth 346Mid-cap value 347Small-cap blend 348Small-cap growth 349-350Small-cap value 350-351Sectors 352-367Real Estate 368-369Global/International 369-386HOLDRs 386-394Traditional index funds 395-396
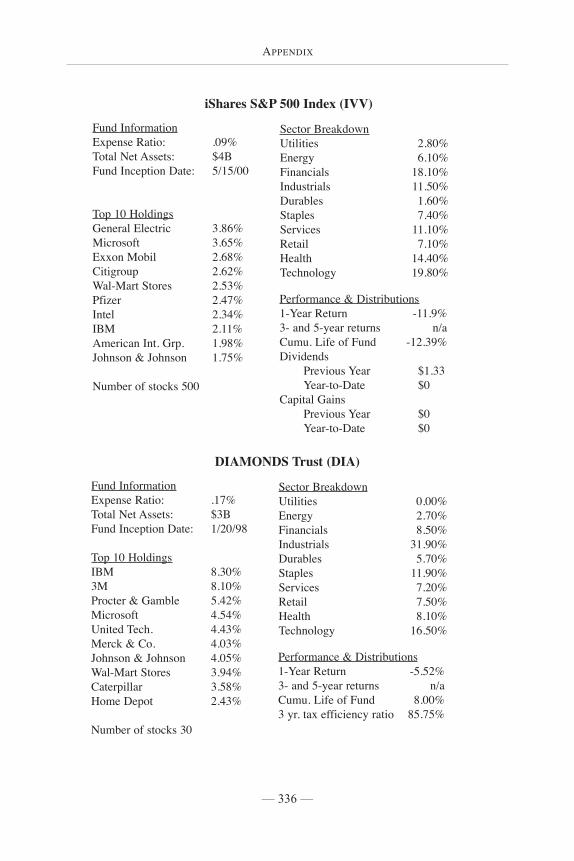
— 336 —
APPENDIX
iShares S&P 500 Index (IVV)
Fund InformationExpense Ratio: .09%Total Net Assets: $4BFund Inception Date: 5/15/00
Top 10 HoldingsGeneral Electric 3.86%Microsoft 3.65%Exxon Mobil 2.68%Citigroup 2.62%Wal-Mart Stores 2.53%Pfizer 2.47%Intel 2.34%IBM 2.11%American Int. Grp. 1.98%Johnson & Johnson 1.75%
Number of stocks 500
Sector BreakdownUtilities 2.80%Energy 6.10%Financials 18.10%Industrials 11.50%Durables 1.60%Staples 7.40%Services 11.10%Retail 7.10%Health 14.40%Technology 19.80%
Performance & Distributions1-Year Return -11.9%3- and 5-year returns n/aCumu. Life of Fund -12.39%Dividends
Previous Year $1.33Year-to-Date $0
Capital GainsPrevious Year $0Year-to-Date $0
DIAMONDS Trust (DIA)
Fund InformationExpense Ratio: .17%Total Net Assets: $3BFund Inception Date: 1/20/98
Top 10 HoldingsIBM 8.30%3M 8.10%Procter & Gamble 5.42%Microsoft 4.54%United Tech. 4.43%Merck & Co. 4.03%Johnson & Johnson 4.05%Wal-Mart Stores 3.94%Caterpillar 3.58%Home Depot 2.43%
Number of stocks 30
Sector BreakdownUtilities 0.00%Energy 2.70%Financials 8.50%Industrials 31.90%Durables 5.70%Staples 11.90%Services 7.20%Retail 7.50%Health 8.10%Technology 16.50%
Performance & Distributions1-Year Return -5.52%3- and 5-year returns n/aCumu. Life of Fund 8.00%3 yr. tax efficiency ratio 85.75%
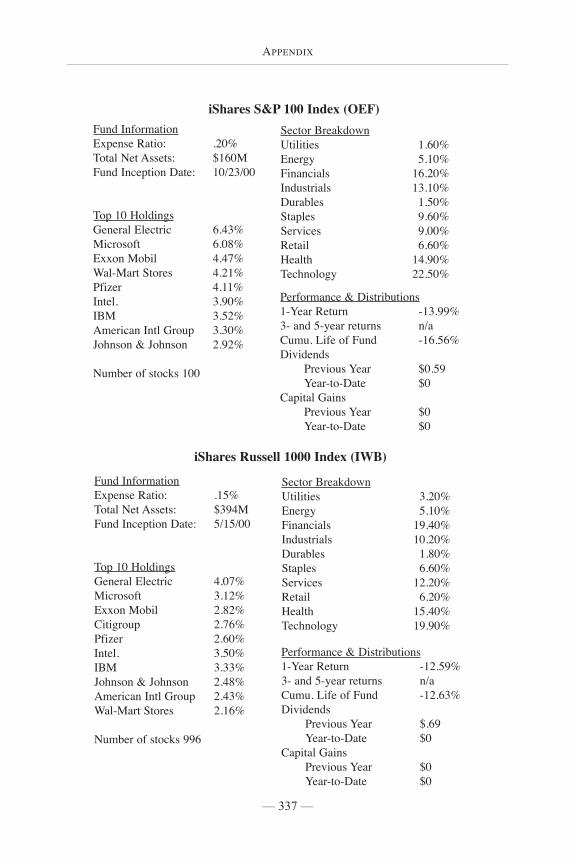
— 337 —
APPENDIX
iShares S&P 100 Index (OEF)Fund InformationExpense Ratio: .20%Total Net Assets: $160MFund Inception Date: 10/23/00
Top 10 HoldingsGeneral Electric 6.43%Microsoft 6.08%Exxon Mobil 4.47%Wal-Mart Stores 4.21%Pfizer 4.11%Intel. 3.90%IBM 3.52%American Intl Group 3.30%Johnson & Johnson 2.92%
Number of stocks 100
Sector BreakdownUtilities 1.60%Energy 5.10%Financials 16.20%Industrials 13.10%Durables 1.50%Staples 9.60%Services 9.00%Retail 6.60%Health 14.90%Technology 22.50%
Performance & Distributions1-Year Return -13.99%3- and 5-year returns n/aCumu. Life of Fund -16.56%Dividends
Previous Year $0.59Year-to-Date $0
Capital GainsPrevious Year $0Year-to-Date $0
iShares Russell 1000 Index (IWB)
Fund InformationExpense Ratio: .15%Total Net Assets: $394MFund Inception Date: 5/15/00
Top 10 HoldingsGeneral Electric 4.07%Microsoft 3.12%Exxon Mobil 2.82%Citigroup 2.76%Pfizer 2.60%Intel. 3.50%IBM 3.33%Johnson & Johnson 2.48%American Intl Group 2.43%Wal-Mart Stores 2.16%
Number of stocks 996
Sector BreakdownUtilities 3.20%Energy 5.10%Financials 19.40%Industrials 10.20%Durables 1.80%Staples 6.60%Services 12.20%Retail 6.20%Health 15.40%Technology 19.90%
Performance & Distributions1-Year Return -12.59%3- and 5-year returns n/aCumu. Life of Fund -12.63%Dividends
Previous Year $.69Year-to-Date $0
Capital GainsPrevious Year $0Year-to-Date $0
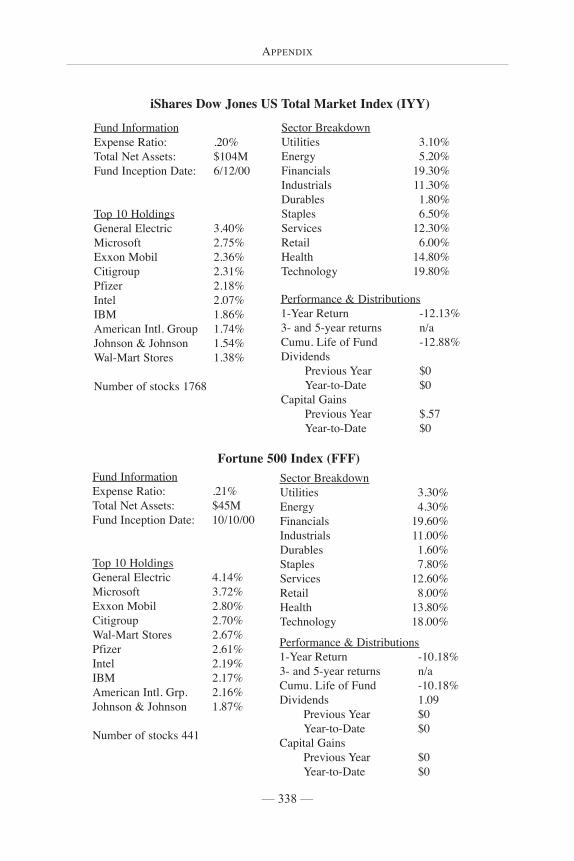
— 338 —
APPENDIX
Fortune 500 Index (FFF)Fund InformationExpense Ratio: .21%Total Net Assets: $45MFund Inception Date: 10/10/00
Top 10 HoldingsGeneral Electric 4.14%Microsoft 3.72%Exxon Mobil 2.80%Citigroup 2.70%Wal-Mart Stores 2.67%Pfizer 2.61%Intel 2.19%IBM 2.17%American Intl. Grp. 2.16%Johnson & Johnson 1.87%
Number of stocks 441
Sector BreakdownUtilities 3.30%Energy 4.30%Financials 19.60%Industrials 11.00%Durables 1.60%Staples 7.80%Services 12.60%Retail 8.00%Health 13.80%Technology 18.00%
Performance & Distributions1-Year Return -10.18%3- and 5-year returns n/aCumu. Life of Fund -10.18%Dividends 1.09
Previous Year $0Year-to-Date $0
Capital GainsPrevious Year $0Year-to-Date $0
iShares Dow Jones US Total Market Index (IYY)
Fund InformationExpense Ratio: .20%Total Net Assets: $104MFund Inception Date: 6/12/00
Top 10 HoldingsGeneral Electric 3.40%Microsoft 2.75%Exxon Mobil 2.36%Citigroup 2.31%Pfizer 2.18%Intel 2.07%IBM 1.86%American Intl. Group 1.74%Johnson & Johnson 1.54%Wal-Mart Stores 1.38%
Number of stocks 1768
Sector BreakdownUtilities 3.10%Energy 5.20%Financials 19.30%Industrials 11.30%Durables 1.80%Staples 6.50%Services 12.30%Retail 6.00%Health 14.80%Technology 19.80%
Performance & Distributions1-Year Return -12.13%3- and 5-year returns n/aCumu. Life of Fund -12.88%Dividends
Previous Year $0Year-to-Date $0
Capital GainsPrevious Year $.57Year-to-Date $0
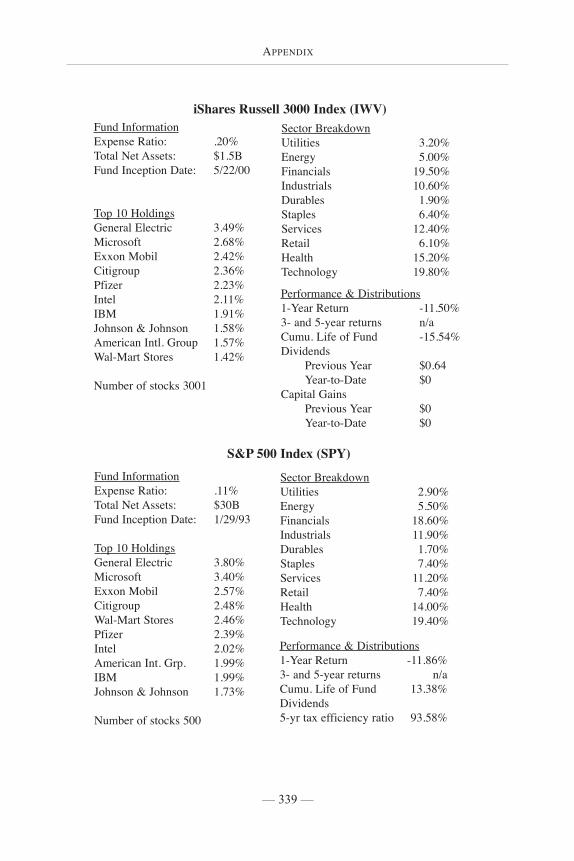
— 339 —
APPENDIX
iShares Russell 3000 Index (IWV)Fund InformationExpense Ratio: .20%Total Net Assets: $1.5BFund Inception Date: 5/22/00
Top 10 HoldingsGeneral Electric 3.49%Microsoft 2.68%Exxon Mobil 2.42%Citigroup 2.36%Pfizer 2.23%Intel 2.11%IBM 1.91%Johnson & Johnson 1.58%American Intl. Group 1.57%Wal-Mart Stores 1.42%
Number of stocks 3001
Sector BreakdownUtilities 3.20%Energy 5.00%Financials 19.50%Industrials 10.60%Durables 1.90%Staples 6.40%Services 12.40%Retail 6.10%Health 15.20%Technology 19.80%
Performance & Distributions1-Year Return -11.50%3- and 5-year returns n/aCumu. Life of Fund -15.54%Dividends
Previous Year $0.64Year-to-Date $0
Capital GainsPrevious Year $0Year-to-Date $0
S&P 500 Index (SPY)Fund InformationExpense Ratio: .11%Total Net Assets: $30BFund Inception Date: 1/29/93
Top 10 HoldingsGeneral Electric 3.80%Microsoft 3.40%Exxon Mobil 2.57%Citigroup 2.48%Wal-Mart Stores 2.46%Pfizer 2.39%Intel 2.02%American Int. Grp. 1.99%IBM 1.99%Johnson & Johnson 1.73%
Number of stocks 500
Sector BreakdownUtilities 2.90%Energy 5.50%Financials 18.60%Industrials 11.90%Durables 1.70%Staples 7.40%Services 11.20%Retail 7.40%Health 14.00%Technology 19.40%
Performance & Distributions1-Year Return -11.86%3- and 5-year returns n/aCumu. Life of Fund 13.38%Dividends5-yr tax efficiency ratio 93.58%
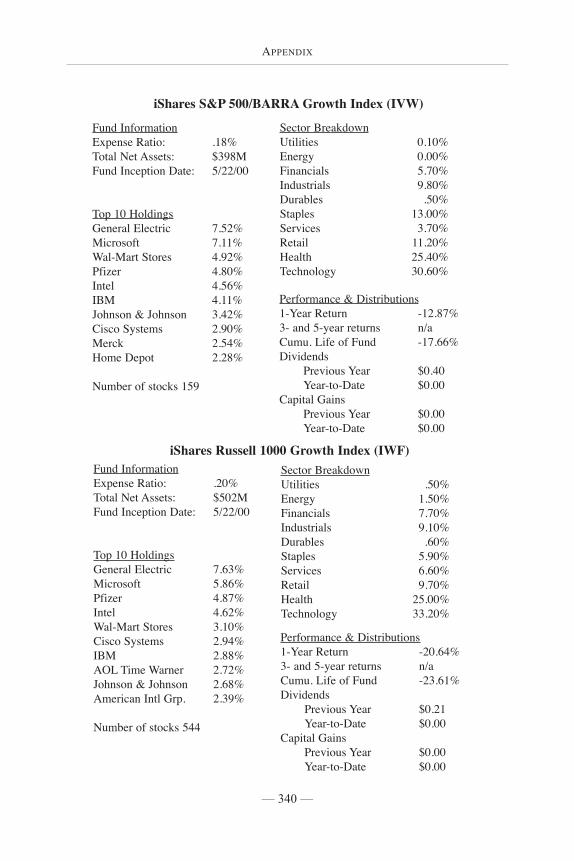
— 340 —
APPENDIX
iShares S&P 500/BARRA Growth Index (IVW)
Fund InformationExpense Ratio: .18%Total Net Assets: $398MFund Inception Date: 5/22/00
Top 10 HoldingsGeneral Electric 7.52%Microsoft 7.11%Wal-Mart Stores 4.92%Pfizer 4.80%Intel 4.56%IBM 4.11%Johnson & Johnson 3.42%Cisco Systems 2.90%Merck 2.54%Home Depot 2.28%
Number of stocks 159
Sector BreakdownUtilities 0.10%Energy 0.00%Financials 5.70%Industrials 9.80%Durables .50%Staples 13.00%Services 3.70%Retail 11.20%Health 25.40%Technology 30.60%
Performance & Distributions1-Year Return -12.87%3- and 5-year returns n/aCumu. Life of Fund -17.66%Dividends
Previous Year $0.40Year-to-Date $0.00
Capital GainsPrevious Year $0.00Year-to-Date $0.00
iShares Russell 1000 Growth Index (IWF)Fund InformationExpense Ratio: .20%Total Net Assets: $502MFund Inception Date: 5/22/00
Top 10 HoldingsGeneral Electric 7.63%Microsoft 5.86%Pfizer 4.87%Intel 4.62%Wal-Mart Stores 3.10%Cisco Systems 2.94%IBM 2.88%AOL Time Warner 2.72%Johnson & Johnson 2.68%American Intl Grp. 2.39%
Number of stocks 544
Sector BreakdownUtilities .50%Energy 1.50%Financials 7.70%Industrials 9.10%Durables .60%Staples 5.90%Services 6.60%Retail 9.70%Health 25.00%Technology 33.20%
Performance & Distributions1-Year Return -20.64%3- and 5-year returns n/aCumu. Life of Fund -23.61%Dividends
Previous Year $0.21Year-to-Date $0.00
Capital GainsPrevious Year $0.00Year-to-Date $0.00
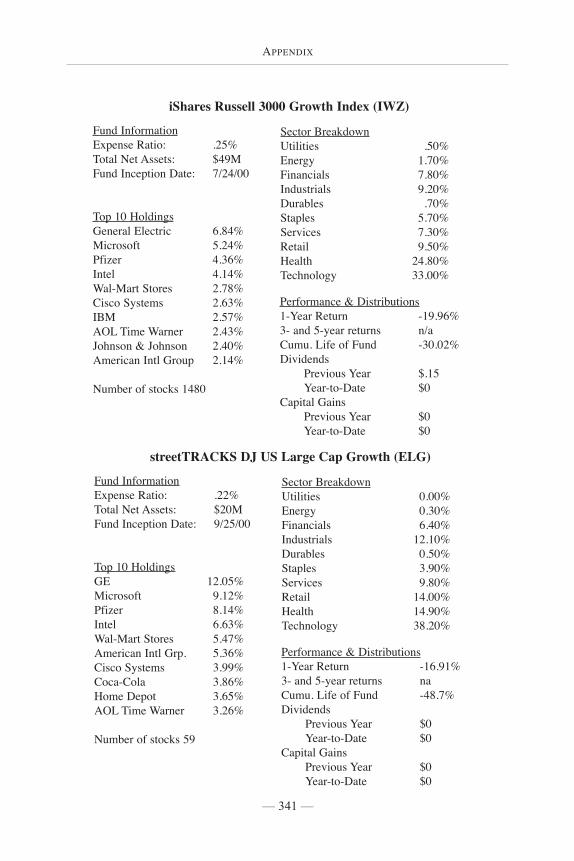
— 341 —
APPENDIX
iShares Russell 3000 Growth Index (IWZ)
Fund InformationExpense Ratio: .25%Total Net Assets: $49MFund Inception Date: 7/24/00
Top 10 HoldingsGeneral Electric 6.84%Microsoft 5.24%Pfizer 4.36%Intel 4.14%Wal-Mart Stores 2.78%Cisco Systems 2.63%IBM 2.57%AOL Time Warner 2.43%Johnson & Johnson 2.40%American Intl Group 2.14%
Number of stocks 1480
Sector BreakdownUtilities .50%Energy 1.70%Financials 7.80%Industrials 9.20%Durables .70%Staples 5.70%Services 7.30%Retail 9.50%Health 24.80%Technology 33.00%
Performance & Distributions1-Year Return -19.96%3- and 5-year returns n/aCumu. Life of Fund -30.02%Dividends
Previous Year $.15Year-to-Date $0
Capital GainsPrevious Year $0Year-to-Date $0
streetTRACKS DJ US Large Cap Growth (ELG)
Fund InformationExpense Ratio: .22%Total Net Assets: $20MFund Inception Date: 9/25/00
Top 10 HoldingsGE 12.05%Microsoft 9.12%Pfizer 8.14%Intel 6.63%Wal-Mart Stores 5.47%American Intl Grp. 5.36%Cisco Systems 3.99%Coca-Cola 3.86%Home Depot 3.65%AOL Time Warner 3.26%
Number of stocks 59
Sector BreakdownUtilities 0.00%Energy 0.30%Financials 6.40%Industrials 12.10%Durables 0.50%Staples 3.90%Services 9.80%Retail 14.00%Health 14.90%Technology 38.20%
Performance & Distributions1-Year Return -16.91%3- and 5-year returns naCumu. Life of Fund -48.7%Dividends
Previous Year $0Year-to-Date $0
Capital GainsPrevious Year $0Year-to-Date $0
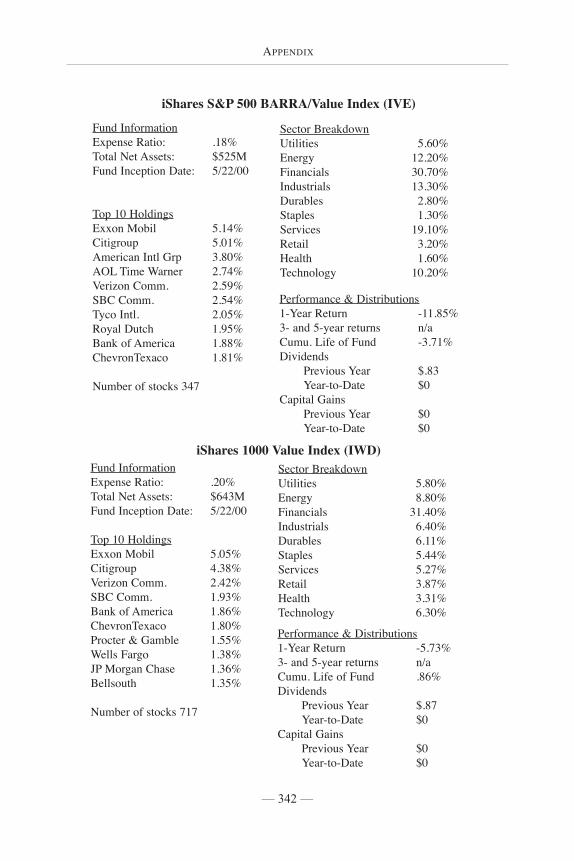
— 342 —
APPENDIX
iShares S&P 500 BARRA/Value Index (IVE)
Fund InformationExpense Ratio: .18%Total Net Assets: $525MFund Inception Date: 5/22/00
Top 10 HoldingsExxon Mobil 5.14%Citigroup 5.01%American Intl Grp 3.80%AOL Time Warner 2.74%Verizon Comm. 2.59%SBC Comm. 2.54%Tyco Intl. 2.05%Royal Dutch 1.95%Bank of America 1.88%ChevronTexaco 1.81%
Number of stocks 347
Sector BreakdownUtilities 5.60%Energy 12.20%Financials 30.70%Industrials 13.30%Durables 2.80%Staples 1.30%Services 19.10%Retail 3.20%Health 1.60%Technology 10.20%
Performance & Distributions1-Year Return -11.85%3- and 5-year returns n/aCumu. Life of Fund -3.71%Dividends
Previous Year $.83Year-to-Date $0
Capital GainsPrevious Year $0Year-to-Date $0
iShares 1000 Value Index (IWD)Fund InformationExpense Ratio: .20%Total Net Assets: $643MFund Inception Date: 5/22/00
Top 10 HoldingsExxon Mobil 5.05%Citigroup 4.38%Verizon Comm. 2.42%SBC Comm. 1.93%Bank of America 1.86%ChevronTexaco 1.80%Procter & Gamble 1.55%Wells Fargo 1.38%JP Morgan Chase 1.36%Bellsouth 1.35%
Number of stocks 717
Sector BreakdownUtilities 5.80%Energy 8.80%Financials 31.40%Industrials 6.40%Durables 6.11%Staples 5.44%Services 5.27%Retail 3.87%Health 3.31%Technology 6.30%
Performance & Distributions1-Year Return -5.73%3- and 5-year returns n/aCumu. Life of Fund .86%Dividends
Previous Year $.87Year-to-Date $0
Capital GainsPrevious Year $0Year-to-Date $0
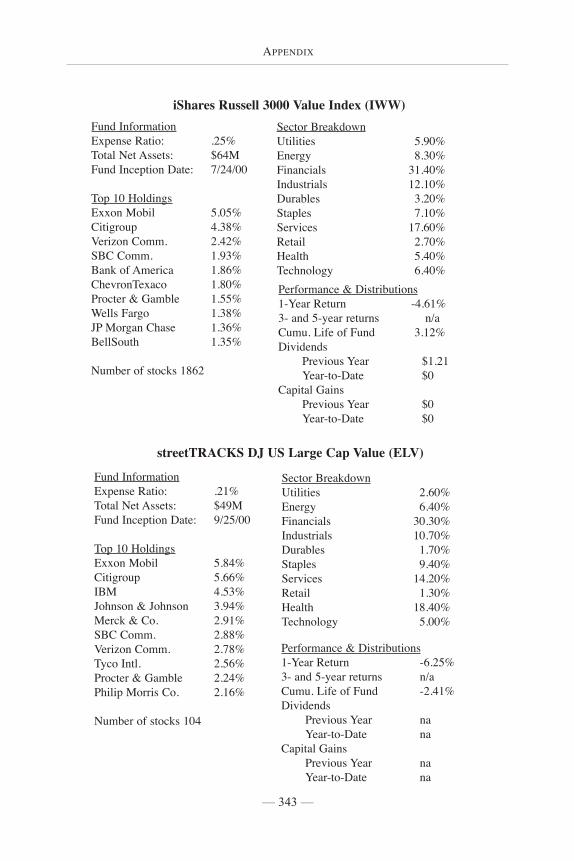
— 343 —
APPENDIX
iShares Russell 3000 Value Index (IWW)Fund InformationExpense Ratio: .25%Total Net Assets: $64MFund Inception Date: 7/24/00
Top 10 HoldingsExxon Mobil 5.05%Citigroup 4.38%Verizon Comm. 2.42%SBC Comm. 1.93%Bank of America 1.86%ChevronTexaco 1.80%Procter & Gamble 1.55%Wells Fargo 1.38%JP Morgan Chase 1.36%BellSouth 1.35%
Number of stocks 1862
Performance & Distributions1-Year Return -4.61%3- and 5-year returns n/aCumu. Life of Fund 3.12%Dividends
Previous Year $1.21Year-to-Date $0
Capital GainsPrevious Year $0Year-to-Date $0
Sector BreakdownUtilities 5.90%Energy 8.30%Financials 31.40%Industrials 12.10%Durables 3.20%Staples 7.10%Services 17.60%Retail 2.70%Health 5.40%Technology 6.40%
streetTRACKS DJ US Large Cap Value (ELV)
Fund InformationExpense Ratio: .21%Total Net Assets: $49MFund Inception Date: 9/25/00
Top 10 HoldingsExxon Mobil 5.84%Citigroup 5.66%IBM 4.53%Johnson & Johnson 3.94%Merck & Co. 2.91%SBC Comm. 2.88%Verizon Comm. 2.78%Tyco Intl. 2.56%Procter & Gamble 2.24%Philip Morris Co. 2.16%
Number of stocks 104
Sector BreakdownUtilities 2.60%Energy 6.40%Financials 30.30%Industrials 10.70%Durables 1.70%Staples 9.40%Services 14.20%Retail 1.30%Health 18.40%Technology 5.00%
Performance & Distributions1-Year Return -6.25%3- and 5-year returns n/aCumu. Life of Fund -2.41%Dividends
Previous Year naYear-to-Date na
Capital GainsPrevious Year naYear-to-Date na
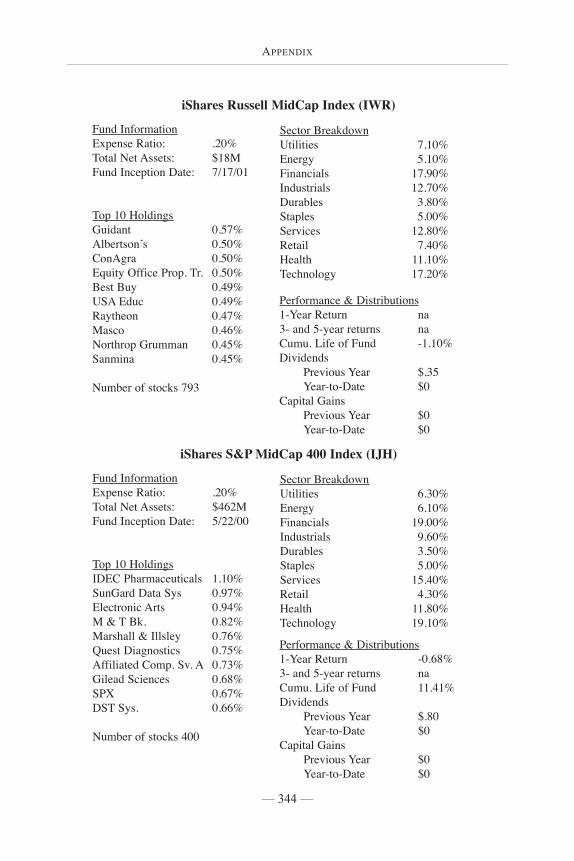
— 344 —
APPENDIX
iShares S&P MidCap 400 Index (IJH)
Fund InformationExpense Ratio: .20%Total Net Assets: $462MFund Inception Date: 5/22/00
Top 10 HoldingsIDEC Pharmaceuticals 1.10%SunGard Data Sys 0.97%Electronic Arts 0.94%M & T Bk. 0.82%Marshall & Illsley 0.76%Quest Diagnostics 0.75%Affiliated Comp. Sv. A 0.73%Gilead Sciences 0.68%SPX 0.67%DST Sys. 0.66%
Number of stocks 400
Sector BreakdownUtilities 6.30%Energy 6.10%Financials 19.00%Industrials 9.60%Durables 3.50%Staples 5.00%Services 15.40%Retail 4.30%Health 11.80%Technology 19.10%
Performance & Distributions1-Year Return -0.68%3- and 5-year returns naCumu. Life of Fund 11.41%Dividends
Previous Year $.80Year-to-Date $0
Capital GainsPrevious Year $0Year-to-Date $0
iShares Russell MidCap Index (IWR)
Fund InformationExpense Ratio: .20%Total Net Assets: $18MFund Inception Date: 7/17/01
Top 10 HoldingsGuidant 0.57%Albertson’s 0.50%ConAgra 0.50%Equity Office Prop. Tr. 0.50%Best Buy 0.49%USA Educ 0.49%Raytheon 0.47%Masco 0.46%Northrop Grumman 0.45%Sanmina 0.45%
Number of stocks 793
Sector BreakdownUtilities 7.10%Energy 5.10%Financials 17.90%Industrials 12.70%Durables 3.80%Staples 5.00%Services 12.80%Retail 7.40%Health 11.10%Technology 17.20%
Performance & Distributions1-Year Return na3- and 5-year returns naCumu. Life of Fund -1.10%Dividends
Previous Year $.35Year-to-Date $0
Capital GainsPrevious Year $0Year-to-Date $0

— 345 —
APPENDIX
Vanguard Extended Market VIPERs (VXF)
Fund InformationExpense Ratio: .20%Total Net Assets: $4.8BFund Inception Date: 7/17/01
Top 10 HoldingsBerkshire Hathaway 1.51%Liberty Media Corp. 1.31%Cox Comm. 1.29%UPS 1.16%Goldman Sachs. 1.13%Prudential 1.09%eBay 1.05%GM 1.04%Genentech 1.02%USA Networks 0.97%
Number of stocks 3061
Sector BreakdownUtilities 2.90%Energy 4.10%Financials 25.20%Industrials 8.70%Durables 2.50%Staples 3.20%Services 19.40%Retail 4.40%Health 11.80%Technology 17.90%
Performance & Distributions1-Year Return na3- and 5-year returns naCumu. Life of Fund 1.82%Tax Efficiency na
MidCap SPDR (MDY)
Fund InformationExpense Ratio: .25%Total Net Assets: $6.4BFund Inception Date: 5/4/95
Top 10 HoldingsIDEC Pharm. 1.24%Electronic Arts 0.97%SunGard Data Sys 0.96%M & T Bk 0.81%Quest Diagnostics 0.81%Marshall & Ilsley 0.79%Affiliated Comp. Svc. 0.76%Gilead Sciences 0.75%DST Sys 0.71%SPX 0.65%
Number of stocks 400
Sector BreakdownUtilities 6.60%Energy 6.20%Financials 19.00%Industrials 9.50%Durables 3.50%Staples 5.00%Services 15.10%Retail 4.20%Health 12.50%Technology 18.60%
Performance & Distributions1-Year Return 14.83%3- and 5-year returns 13.27%,17.44%Cumu. Life of Fund 137%Tax Efficiency 95.08%
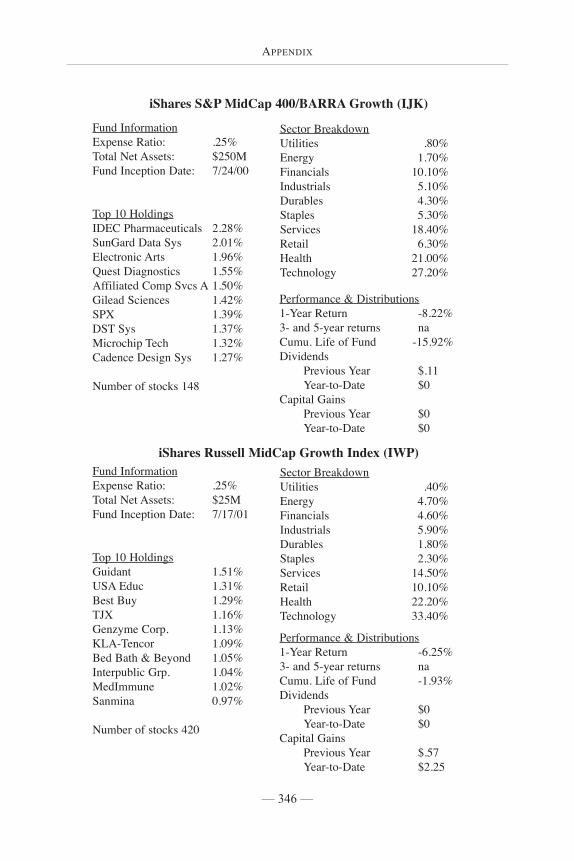
— 346 —
APPENDIX
iShares S&P MidCap 400/BARRA Growth (IJK)
Fund InformationExpense Ratio: .25%Total Net Assets: $250MFund Inception Date: 7/24/00
Top 10 HoldingsIDEC Pharmaceuticals 2.28%SunGard Data Sys 2.01%Electronic Arts 1.96%Quest Diagnostics 1.55%Affiliated Comp Svcs A 1.50%Gilead Sciences 1.42%SPX 1.39%DST Sys 1.37%Microchip Tech 1.32%Cadence Design Sys 1.27%
Number of stocks 148
Sector BreakdownUtilities .80%Energy 1.70%Financials 10.10%Industrials 5.10%Durables 4.30%Staples 5.30%Services 18.40%Retail 6.30%Health 21.00%Technology 27.20%
Performance & Distributions1-Year Return -8.22%3- and 5-year returns naCumu. Life of Fund -15.92%Dividends
Previous Year $.11Year-to-Date $0
Capital GainsPrevious Year $0Year-to-Date $0
iShares Russell MidCap Growth Index (IWP)Fund InformationExpense Ratio: .25%Total Net Assets: $25MFund Inception Date: 7/17/01
Top 10 HoldingsGuidant 1.51%USA Educ 1.31%Best Buy 1.29%TJX 1.16%Genzyme Corp. 1.13%KLA-Tencor 1.09%Bed Bath & Beyond 1.05%Interpublic Grp. 1.04%MedImmune 1.02%Sanmina 0.97%
Number of stocks 420
Sector BreakdownUtilities .40%Energy 4.70%Financials 4.60%Industrials 5.90%Durables 1.80%Staples 2.30%Services 14.50%Retail 10.10%Health 22.20%Technology 33.40%
Performance & Distributions1-Year Return -6.25%3- and 5-year returns naCumu. Life of Fund -1.93%Dividends
Previous Year $0Year-to-Date $0
Capital GainsPrevious Year $.57Year-to-Date $2.25
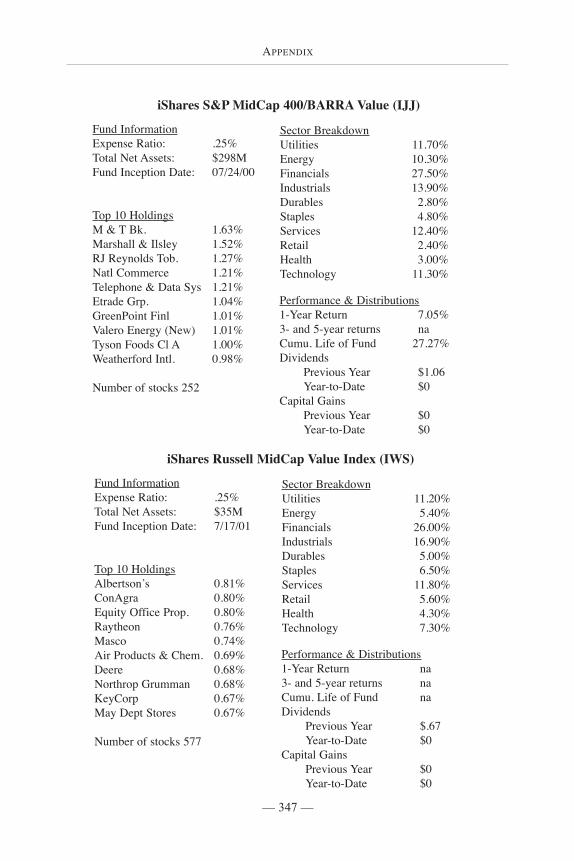
— 347 —
APPENDIX
iShares S&P MidCap 400/BARRA Value (IJJ)
Fund InformationExpense Ratio: .25%Total Net Assets: $298MFund Inception Date: 07/24/00
Top 10 HoldingsM & T Bk. 1.63%Marshall & Ilsley 1.52%RJ Reynolds Tob. 1.27%Natl Commerce 1.21%Telephone & Data Sys 1.21%Etrade Grp. 1.04%GreenPoint Finl 1.01%Valero Energy (New) 1.01%Tyson Foods Cl A 1.00%Weatherford Intl. 0.98%
Number of stocks 252
Sector BreakdownUtilities 11.70%Energy 10.30%Financials 27.50%Industrials 13.90%Durables 2.80%Staples 4.80%Services 12.40%Retail 2.40%Health 3.00%Technology 11.30%
Performance & Distributions1-Year Return 7.05%3- and 5-year returns naCumu. Life of Fund 27.27%Dividends
Previous Year $1.06Year-to-Date $0
Capital GainsPrevious Year $0Year-to-Date $0
iShares Russell MidCap Value Index (IWS)
Fund InformationExpense Ratio: .25%Total Net Assets: $35MFund Inception Date: 7/17/01
Top 10 HoldingsAlbertson’s 0.81%ConAgra 0.80%Equity Office Prop. 0.80%Raytheon 0.76%Masco 0.74%Air Products & Chem. 0.69%Deere 0.68%Northrop Grumman 0.68%KeyCorp 0.67%May Dept Stores 0.67%
Number of stocks 577
Sector BreakdownUtilities 11.20%Energy 5.40%Financials 26.00%Industrials 16.90%Durables 5.00%Staples 6.50%Services 11.80%Retail 5.60%Health 4.30%Technology 7.30%
Performance & Distributions1-Year Return na3- and 5-year returns naCumu. Life of Fund naDividends
Previous Year $.67Year-to-Date $0
Capital GainsPrevious Year $0Year-to-Date $0
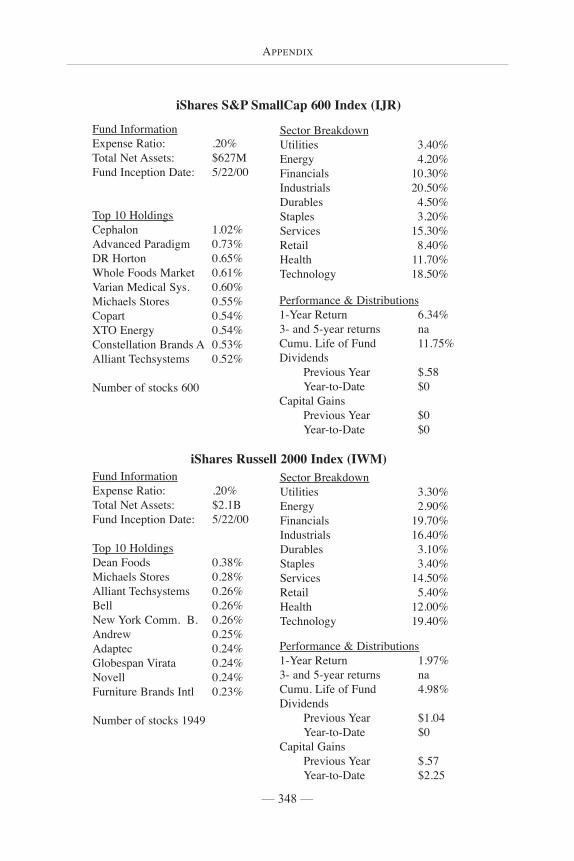
— 348 —
APPENDIX
iShares S&P SmallCap 600 Index (IJR)
Fund InformationExpense Ratio: .20%Total Net Assets: $627MFund Inception Date: 5/22/00
Top 10 HoldingsCephalon 1.02%Advanced Paradigm 0.73%DR Horton 0.65%Whole Foods Market 0.61%Varian Medical Sys. 0.60%Michaels Stores 0.55%Copart 0.54%XTO Energy 0.54%Constellation Brands A 0.53%Alliant Techsystems 0.52%
Number of stocks 600
Sector BreakdownUtilities 3.40%Energy 4.20%Financials 10.30%Industrials 20.50%Durables 4.50%Staples 3.20%Services 15.30%Retail 8.40%Health 11.70%Technology 18.50%
Performance & Distributions1-Year Return 6.34%3- and 5-year returns naCumu. Life of Fund 11.75%Dividends
Previous Year $.58Year-to-Date $0
Capital GainsPrevious Year $0Year-to-Date $0
iShares Russell 2000 Index (IWM)Fund InformationExpense Ratio: .20%Total Net Assets: $2.1BFund Inception Date: 5/22/00
Top 10 HoldingsDean Foods 0.38%Michaels Stores 0.28%Alliant Techsystems 0.26%Bell 0.26%New York Comm. B. 0.26%Andrew 0.25%Adaptec 0.24%Globespan Virata 0.24%Novell 0.24%Furniture Brands Intl 0.23%
Number of stocks 1949
Sector BreakdownUtilities 3.30%Energy 2.90%Financials 19.70%Industrials 16.40%Durables 3.10%Staples 3.40%Services 14.50%Retail 5.40%Health 12.00%Technology 19.40%
Performance & Distributions1-Year Return 1.97%3- and 5-year returns naCumu. Life of Fund 4.98%Dividends
Previous Year $1.04Year-to-Date $0
Capital GainsPrevious Year $.57Year-to-Date $2.25
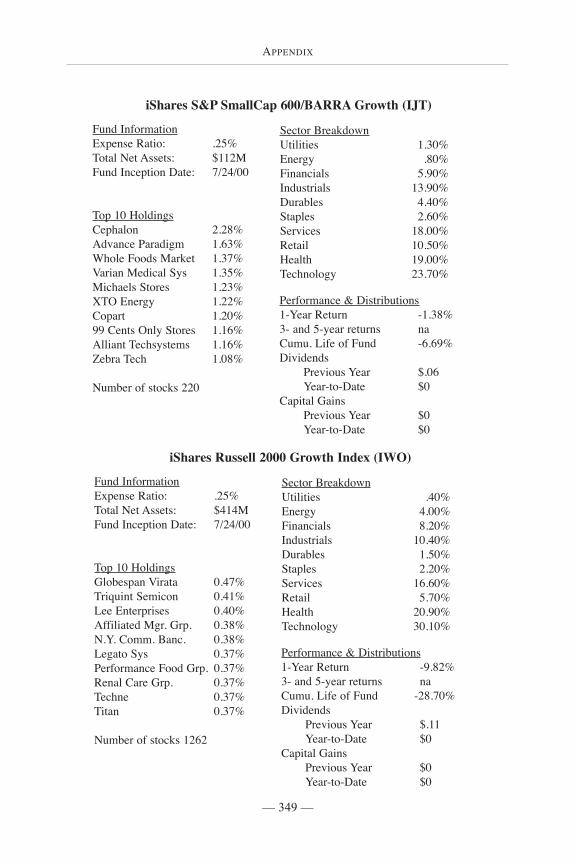
— 349 —
APPENDIX
iShares S&P SmallCap 600/BARRA Growth (IJT)
Fund InformationExpense Ratio: .25%Total Net Assets: $112MFund Inception Date: 7/24/00
Top 10 HoldingsCephalon 2.28%Advance Paradigm 1.63%Whole Foods Market 1.37%Varian Medical Sys 1.35%Michaels Stores 1.23%XTO Energy 1.22%Copart 1.20%99 Cents Only Stores 1.16%Alliant Techsystems 1.16%Zebra Tech 1.08%
Number of stocks 220
Sector BreakdownUtilities 1.30%Energy .80%Financials 5.90%Industrials 13.90%Durables 4.40%Staples 2.60%Services 18.00%Retail 10.50%Health 19.00%Technology 23.70%
Performance & Distributions1-Year Return -1.38%3- and 5-year returns naCumu. Life of Fund -6.69%Dividends
Previous Year $.06Year-to-Date $0
Capital GainsPrevious Year $0Year-to-Date $0
iShares Russell 2000 Growth Index (IWO)
Fund InformationExpense Ratio: .25%Total Net Assets: $414MFund Inception Date: 7/24/00
Top 10 HoldingsGlobespan Virata 0.47%Triquint Semicon 0.41%Lee Enterprises 0.40%Affiliated Mgr. Grp. 0.38%N.Y. Comm. Banc. 0.38%Legato Sys 0.37%Performance Food Grp. 0.37%Renal Care Grp. 0.37%Techne 0.37%Titan 0.37%
Number of stocks 1262
Sector BreakdownUtilities .40%Energy 4.00%Financials 8.20%Industrials 10.40%Durables 1.50%Staples 2.20%Services 16.60%Retail 5.70%Health 20.90%Technology 30.10%
Performance & Distributions1-Year Return -9.82%3- and 5-year returns naCumu. Life of Fund -28.70%Dividends
Previous Year $.11Year-to-Date $0
Capital GainsPrevious Year $0Year-to-Date $0
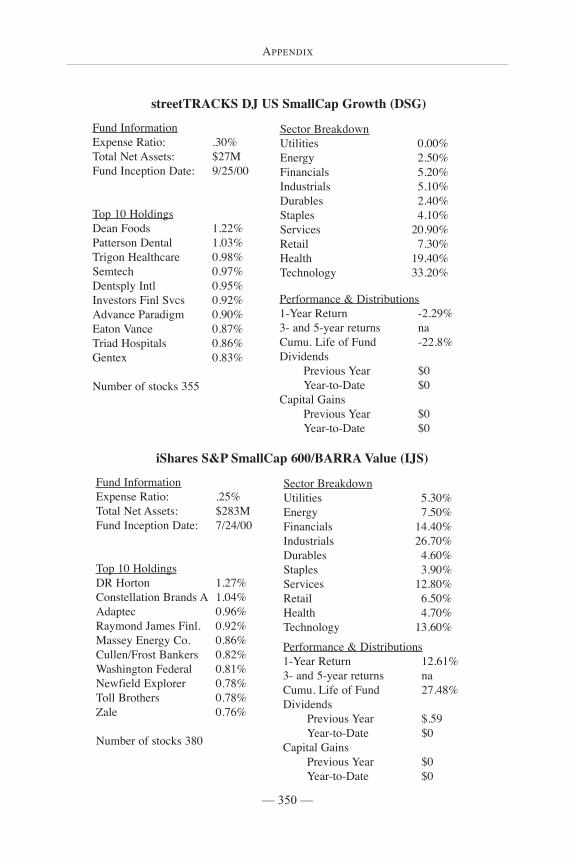
— 350 —
APPENDIX
streetTRACKS DJ US SmallCap Growth (DSG)
Fund InformationExpense Ratio: .30%Total Net Assets: $27MFund Inception Date: 9/25/00
Top 10 HoldingsDean Foods 1.22%Patterson Dental 1.03%Trigon Healthcare 0.98%Semtech 0.97%Dentsply Intl 0.95%Investors Finl Svcs 0.92%Advance Paradigm 0.90%Eaton Vance 0.87%Triad Hospitals 0.86%Gentex 0.83%
Number of stocks 355
Sector BreakdownUtilities 0.00%Energy 2.50%Financials 5.20%Industrials 5.10%Durables 2.40%Staples 4.10%Services 20.90%Retail 7.30%Health 19.40%Technology 33.20%
Performance & Distributions1-Year Return -2.29%3- and 5-year returns naCumu. Life of Fund -22.8%Dividends
Previous Year $0Year-to-Date $0
Capital GainsPrevious Year $0Year-to-Date $0
iShares S&P SmallCap 600/BARRA Value (IJS)
Fund InformationExpense Ratio: .25%Total Net Assets: $283MFund Inception Date: 7/24/00
Top 10 HoldingsDR Horton 1.27%Constellation Brands A 1.04%Adaptec 0.96%Raymond James Finl. 0.92%Massey Energy Co. 0.86%Cullen/Frost Bankers 0.82%Washington Federal 0.81%Newfield Explorer 0.78%Toll Brothers 0.78%Zale 0.76%
Number of stocks 380
Sector BreakdownUtilities 5.30%Energy 7.50%Financials 14.40%Industrials 26.70%Durables 4.60%Staples 3.90%Services 12.80%Retail 6.50%Health 4.70%Technology 13.60%Performance & Distributions1-Year Return 12.61%3- and 5-year returns naCumu. Life of Fund 27.48%Dividends
Previous Year $.59Year-to-Date $0
Capital GainsPrevious Year $0Year-to-Date $0
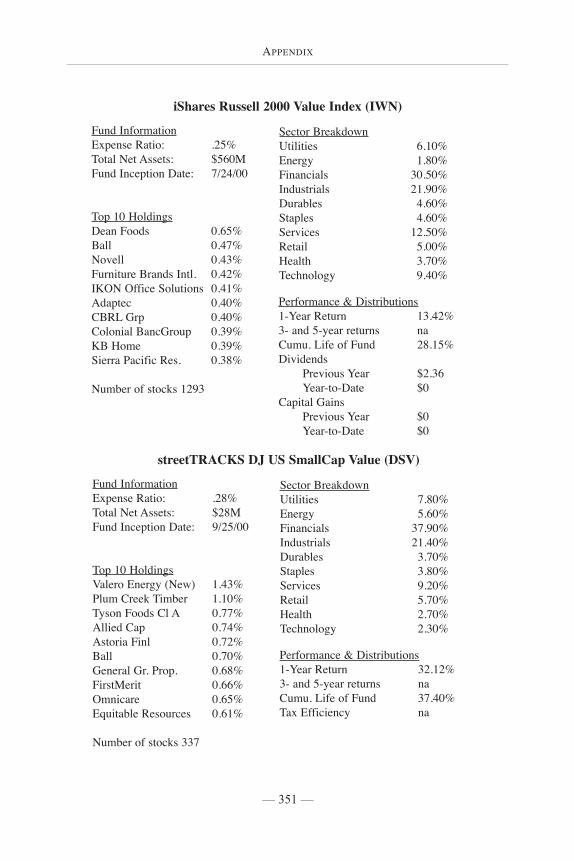
— 351 —
APPENDIX
iShares Russell 2000 Value Index (IWN)
Fund InformationExpense Ratio: .25%Total Net Assets: $560MFund Inception Date: 7/24/00
Top 10 HoldingsDean Foods 0.65%Ball 0.47%Novell 0.43%Furniture Brands Intl. 0.42%IKON Office Solutions 0.41%Adaptec 0.40%CBRL Grp 0.40%Colonial BancGroup 0.39%KB Home 0.39%Sierra Pacific Res. 0.38%
Number of stocks 1293
Sector BreakdownUtilities 6.10%Energy 1.80%Financials 30.50%Industrials 21.90%Durables 4.60%Staples 4.60%Services 12.50%Retail 5.00%Health 3.70%Technology 9.40%
Performance & Distributions1-Year Return 13.42%3- and 5-year returns naCumu. Life of Fund 28.15%Dividends
Previous Year $2.36Year-to-Date $0
Capital GainsPrevious Year $0Year-to-Date $0
streetTRACKS DJ US SmallCap Value (DSV)
Fund InformationExpense Ratio: .28%Total Net Assets: $28MFund Inception Date: 9/25/00
Top 10 HoldingsValero Energy (New) 1.43%Plum Creek Timber 1.10%Tyson Foods Cl A 0.77%Allied Cap 0.74%Astoria Finl 0.72%Ball 0.70%General Gr. Prop. 0.68%FirstMerit 0.66%Omnicare 0.65%Equitable Resources 0.61%
Number of stocks 337
Sector BreakdownUtilities 7.80%Energy 5.60%Financials 37.90%Industrials 21.40%Durables 3.70%Staples 3.80%Services 9.20%Retail 5.70%Health 2.70%Technology 2.30%
Performance & Distributions1-Year Return 32.12%3- and 5-year returns naCumu. Life of Fund 37.40%Tax Efficiency na
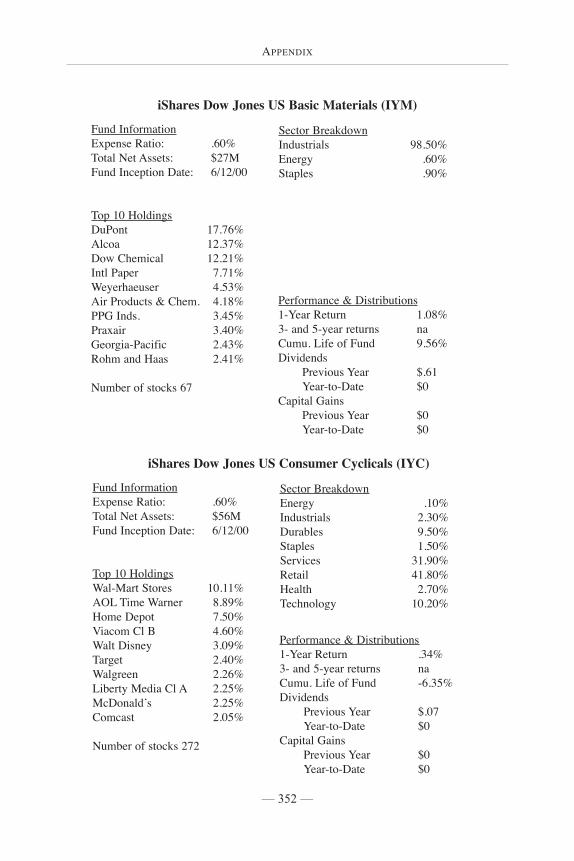
— 352 —
APPENDIX
iShares Dow Jones US Basic Materials (IYM)
Fund InformationExpense Ratio: .60%Total Net Assets: $27MFund Inception Date: 6/12/00
Top 10 HoldingsDuPont 17.76%Alcoa 12.37%Dow Chemical 12.21%Intl Paper 7.71%Weyerhaeuser 4.53%Air Products & Chem. 4.18%PPG Inds. 3.45%Praxair 3.40%Georgia-Pacific 2.43%Rohm and Haas 2.41%
Number of stocks 67
Sector BreakdownIndustrials 98.50%Energy .60%Staples .90%
Performance & Distributions1-Year Return 1.08%3- and 5-year returns naCumu. Life of Fund 9.56%Dividends
Previous Year $.61Year-to-Date $0
Capital GainsPrevious Year $0Year-to-Date $0
iShares Dow Jones US Consumer Cyclicals (IYC)
Fund InformationExpense Ratio: .60%Total Net Assets: $56MFund Inception Date: 6/12/00
Top 10 HoldingsWal-Mart Stores 10.11%AOL Time Warner 8.89%Home Depot 7.50%Viacom Cl B 4.60%Walt Disney 3.09%Target 2.40%Walgreen 2.26%Liberty Media Cl A 2.25%McDonald’s 2.25%Comcast 2.05%
Number of stocks 272
Sector BreakdownEnergy .10%Industrials 2.30%Durables 9.50%Staples 1.50%Services 31.90%Retail 41.80%Health 2.70%Technology 10.20%
Performance & Distributions1-Year Return .34%3- and 5-year returns naCumu. Life of Fund -6.35%Dividends
Previous Year $.07Year-to-Date $0
Capital GainsPrevious Year $0Year-to-Date $0
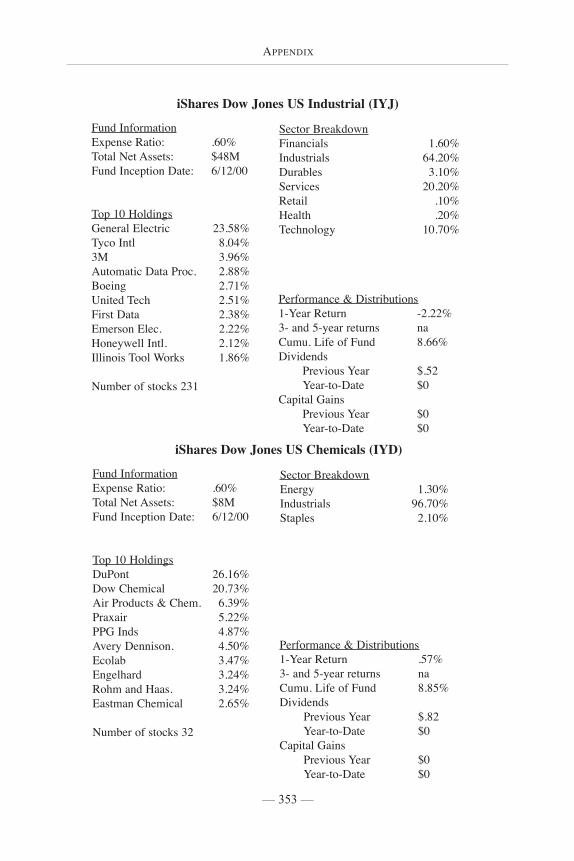
— 353 —
APPENDIX
iShares Dow Jones US Industrial (IYJ)
Fund InformationExpense Ratio: .60%Total Net Assets: $48MFund Inception Date: 6/12/00
Top 10 HoldingsGeneral Electric 23.58%Tyco Intl 8.04%3M 3.96%Automatic Data Proc. 2.88%Boeing 2.71%United Tech 2.51%First Data 2.38%Emerson Elec. 2.22%Honeywell Intl. 2.12%Illinois Tool Works 1.86%
Number of stocks 231
Sector BreakdownFinancials 1.60%Industrials 64.20%Durables 3.10%Services 20.20%Retail .10%Health .20%Technology 10.70%
Performance & Distributions1-Year Return -2.22%3- and 5-year returns naCumu. Life of Fund 8.66%Dividends
Previous Year $.52Year-to-Date $0
Capital GainsPrevious Year $0Year-to-Date $0
iShares Dow Jones US Chemicals (IYD)
Fund InformationExpense Ratio: .60%Total Net Assets: $8MFund Inception Date: 6/12/00
Top 10 HoldingsDuPont 26.16%Dow Chemical 20.73%Air Products & Chem. 6.39%Praxair 5.22%PPG Inds 4.87%Avery Dennison. 4.50%Ecolab 3.47%Engelhard 3.24%Rohm and Haas. 3.24%Eastman Chemical 2.65%
Number of stocks 32
Sector BreakdownEnergy 1.30%Industrials 96.70%Staples 2.10%
Performance & Distributions1-Year Return .57%3- and 5-year returns naCumu. Life of Fund 8.85%Dividends
Previous Year $.82Year-to-Date $0
Capital GainsPrevious Year $0Year-to-Date $0
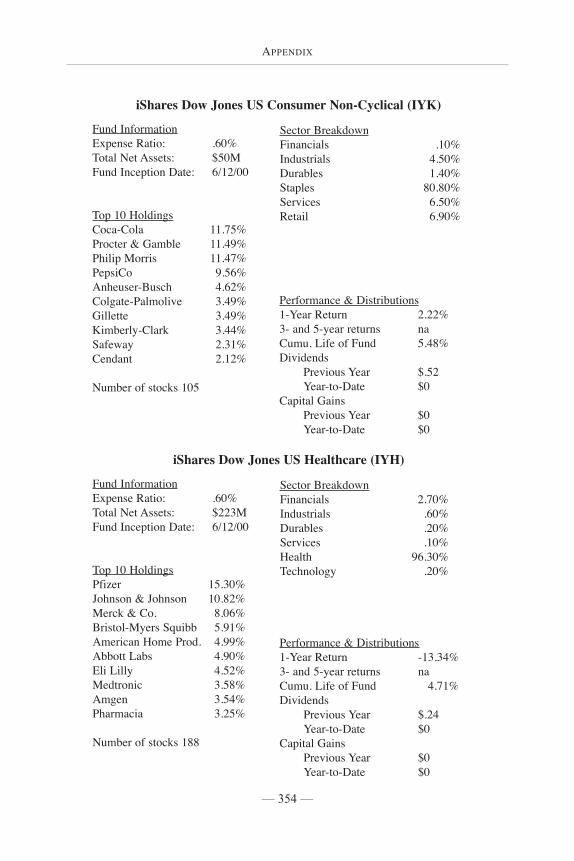
— 354 —
APPENDIX
iShares Dow Jones US Consumer Non-Cyclical (IYK)
Fund InformationExpense Ratio: .60%Total Net Assets: $50MFund Inception Date: 6/12/00
Top 10 HoldingsCoca-Cola 11.75%Procter & Gamble 11.49%Philip Morris 11.47%PepsiCo 9.56%Anheuser-Busch 4.62%Colgate-Palmolive 3.49%Gillette 3.49%Kimberly-Clark 3.44%Safeway 2.31%Cendant 2.12%
Number of stocks 105
Sector BreakdownFinancials .10%Industrials 4.50%Durables 1.40%Staples 80.80%Services 6.50%Retail 6.90%
Performance & Distributions1-Year Return 2.22%3- and 5-year returns naCumu. Life of Fund 5.48%Dividends
Previous Year $.52Year-to-Date $0
Capital GainsPrevious Year $0Year-to-Date $0
iShares Dow Jones US Healthcare (IYH)
Fund InformationExpense Ratio: .60%Total Net Assets: $223MFund Inception Date: 6/12/00
Top 10 HoldingsPfizer 15.30%Johnson & Johnson 10.82%Merck & Co. 8.06%Bristol-Myers Squibb 5.91%American Home Prod. 4.99%Abbott Labs 4.90%Eli Lilly 4.52%Medtronic 3.58%Amgen 3.54%Pharmacia 3.25%
Number of stocks 188
Sector BreakdownFinancials 2.70%Industrials .60%Durables .20%Services .10%Health 96.30%Technology .20%
Performance & Distributions1-Year Return -13.34%3- and 5-year returns naCumu. Life of Fund 4.71%Dividends
Previous Year $.24Year-to-Date $0
Capital GainsPrevious Year $0Year-to-Date $0
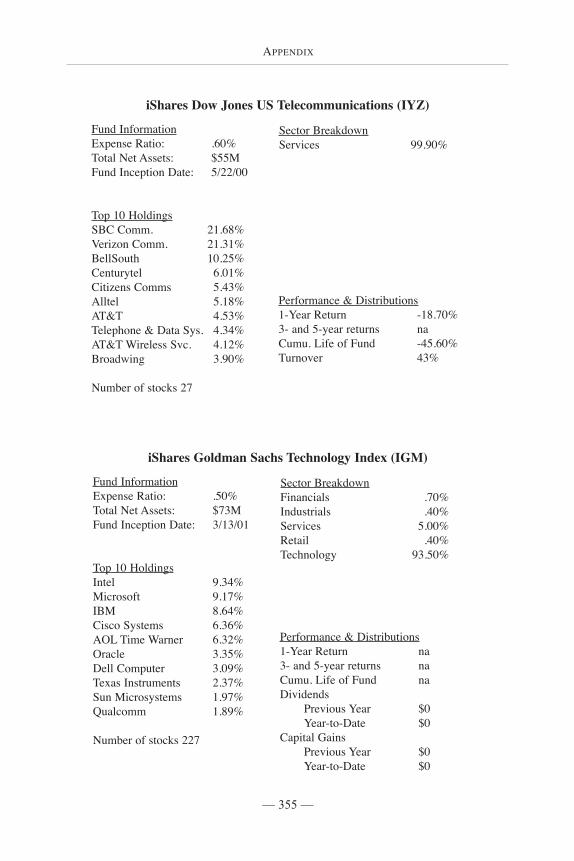
— 355 —
APPENDIX
iShares Goldman Sachs Technology Index (IGM)
Fund InformationExpense Ratio: .50%Total Net Assets: $73MFund Inception Date: 3/13/01
Top 10 HoldingsIntel 9.34%Microsoft 9.17%IBM 8.64%Cisco Systems 6.36%AOL Time Warner 6.32%Oracle 3.35%Dell Computer 3.09%Texas Instruments 2.37%Sun Microsystems 1.97%Qualcomm 1.89%
Number of stocks 227
Sector BreakdownFinancials .70%Industrials .40%Services 5.00%Retail .40%Technology 93.50%
Performance & Distributions1-Year Return na3- and 5-year returns naCumu. Life of Fund naDividends
Previous Year $0Year-to-Date $0
Capital GainsPrevious Year $0Year-to-Date $0
iShares Dow Jones US Telecommunications (IYZ)
Fund InformationExpense Ratio: .60%Total Net Assets: $55MFund Inception Date: 5/22/00
Top 10 HoldingsSBC Comm. 21.68%Verizon Comm. 21.31%BellSouth 10.25%Centurytel 6.01%Citizens Comms 5.43%Alltel 5.18%AT&T 4.53%Telephone & Data Sys. 4.34%AT&T Wireless Svc. 4.12%Broadwing 3.90%
Number of stocks 27
Sector BreakdownServices 99.90%
Performance & Distributions1-Year Return -18.70%3- and 5-year returns naCumu. Life of Fund -45.60%Turnover 43%
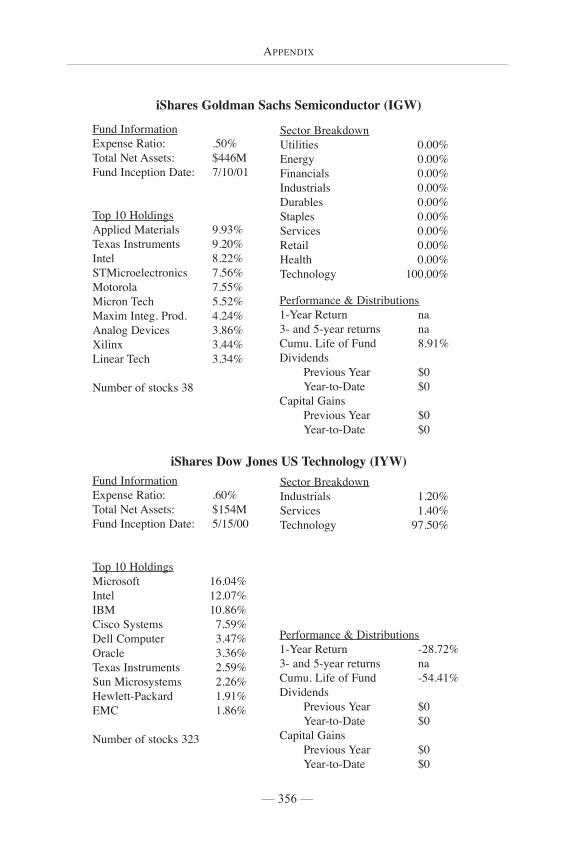
— 356 —
APPENDIX
iShares Goldman Sachs Semiconductor (IGW)
Fund InformationExpense Ratio: .50%Total Net Assets: $446MFund Inception Date: 7/10/01
Top 10 HoldingsApplied Materials 9.93%Texas Instruments 9.20%Intel 8.22%STMicroelectronics 7.56%Motorola 7.55%Micron Tech 5.52%Maxim Integ. Prod. 4.24%Analog Devices 3.86%Xilinx 3.44%Linear Tech 3.34%
Number of stocks 38
Sector BreakdownUtilities 0.00%Energy 0.00%Financials 0.00%Industrials 0.00%Durables 0.00%Staples 0.00%Services 0.00%Retail 0.00%Health 0.00%Technology 100.00%
Performance & Distributions1-Year Return na3- and 5-year returns naCumu. Life of Fund 8.91%Dividends
Previous Year $0Year-to-Date $0
Capital GainsPrevious Year $0Year-to-Date $0
iShares Dow Jones US Technology (IYW)Fund InformationExpense Ratio: .60%Total Net Assets: $154MFund Inception Date: 5/15/00
Top 10 HoldingsMicrosoft 16.04%Intel 12.07%IBM 10.86%Cisco Systems 7.59%Dell Computer 3.47%Oracle 3.36%Texas Instruments 2.59%Sun Microsystems 2.26%Hewlett-Packard 1.91%EMC 1.86%
Number of stocks 323
Sector BreakdownIndustrials 1.20%Services 1.40%Technology 97.50%
Performance & Distributions1-Year Return -28.72%3- and 5-year returns naCumu. Life of Fund -54.41%Dividends
Previous Year $0Year-to-Date $0
Capital GainsPrevious Year $0Year-to-Date $0
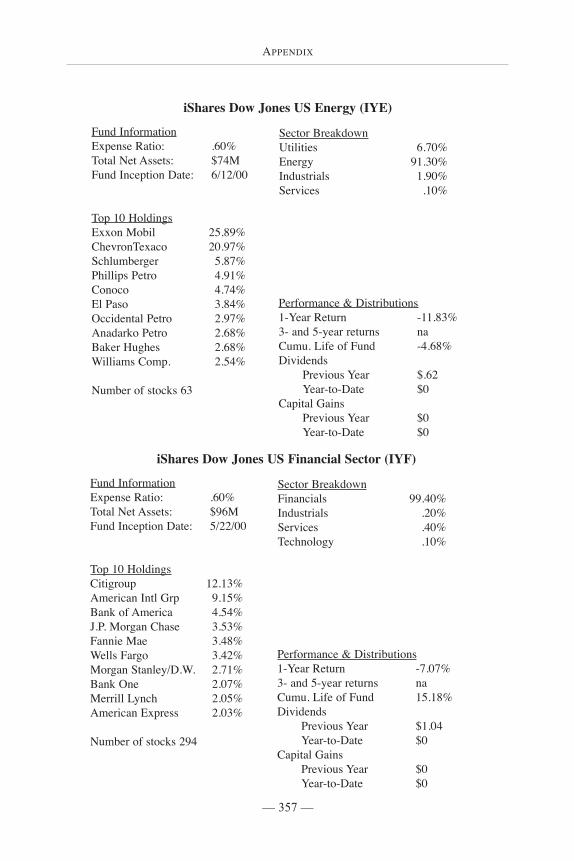
— 357 —
APPENDIX
iShares Dow Jones US Energy (IYE)
Fund InformationExpense Ratio: .60%Total Net Assets: $74MFund Inception Date: 6/12/00
Top 10 HoldingsExxon Mobil 25.89%ChevronTexaco 20.97%Schlumberger 5.87%Phillips Petro 4.91%Conoco 4.74%El Paso 3.84%Occidental Petro 2.97%Anadarko Petro 2.68%Baker Hughes 2.68%Williams Comp. 2.54%
Number of stocks 63
Sector BreakdownUtilities 6.70%Energy 91.30%Industrials 1.90%Services .10%
Performance & Distributions1-Year Return -11.83%3- and 5-year returns naCumu. Life of Fund -4.68%Dividends
Previous Year $.62Year-to-Date $0
Capital GainsPrevious Year $0Year-to-Date $0
iShares Dow Jones US Financial Sector (IYF)
Fund InformationExpense Ratio: .60%Total Net Assets: $96MFund Inception Date: 5/22/00
Top 10 HoldingsCitigroup 12.13%American Intl Grp 9.15%Bank of America 4.54%J.P. Morgan Chase 3.53%Fannie Mae 3.48%Wells Fargo 3.42%Morgan Stanley/D.W. 2.71%Bank One 2.07%Merrill Lynch 2.05%American Express 2.03%
Number of stocks 294
Sector BreakdownFinancials 99.40%Industrials .20%Services .40%Technology .10%
Performance & Distributions1-Year Return -7.07%3- and 5-year returns naCumu. Life of Fund 15.18%Dividends
Previous Year $1.04Year-to-Date $0
Capital GainsPrevious Year $0Year-to-Date $0
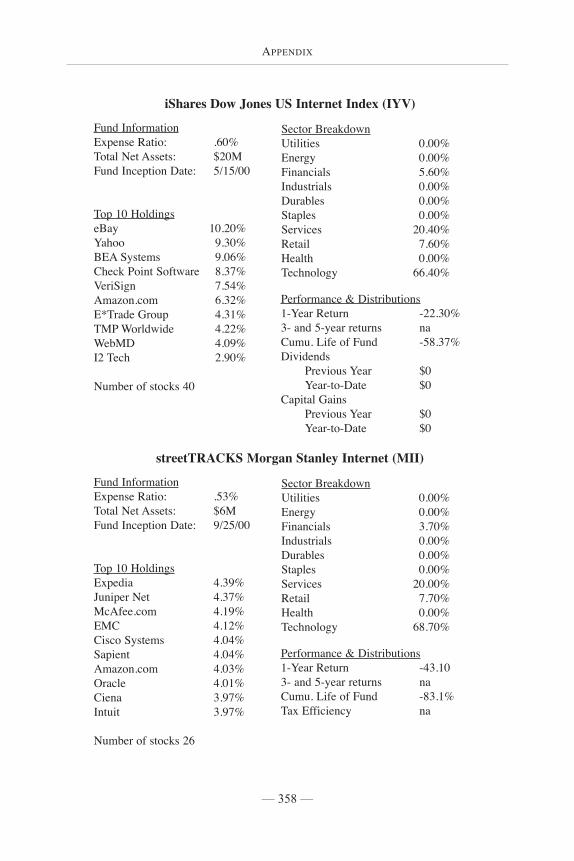
APPENDIX
— 358 —
iShares Dow Jones US Internet Index (IYV)
Fund InformationExpense Ratio: .60%Total Net Assets: $20MFund Inception Date: 5/15/00
Top 10 HoldingseBay 10.20%Yahoo 9.30%BEA Systems 9.06%Check Point Software 8.37%VeriSign 7.54%Amazon.com 6.32%E*Trade Group 4.31%TMP Worldwide 4.22%WebMD 4.09%I2 Tech 2.90%
Number of stocks 40
Sector BreakdownUtilities 0.00%Energy 0.00%Financials 5.60%Industrials 0.00%Durables 0.00%Staples 0.00%Services 20.40%Retail 7.60%Health 0.00%Technology 66.40%
Performance & Distributions1-Year Return -22.30%3- and 5-year returns naCumu. Life of Fund -58.37%Dividends
Previous Year $0Year-to-Date $0
Capital GainsPrevious Year $0Year-to-Date $0
streetTRACKS Morgan Stanley Internet (MII)
Fund InformationExpense Ratio: .53%Total Net Assets: $6MFund Inception Date: 9/25/00
Top 10 HoldingsExpedia 4.39%Juniper Net 4.37%McAfee.com 4.19%EMC 4.12%Cisco Systems 4.04%Sapient 4.04%Amazon.com 4.03%Oracle 4.01%Ciena 3.97%Intuit 3.97%
Number of stocks 26
Sector BreakdownUtilities 0.00%Energy 0.00%Financials 3.70%Industrials 0.00%Durables 0.00%Staples 0.00%Services 20.00%Retail 7.70%Health 0.00%Technology 68.70%
Performance & Distributions1-Year Return -43.103- and 5-year returns naCumu. Life of Fund -83.1%Tax Efficiency na
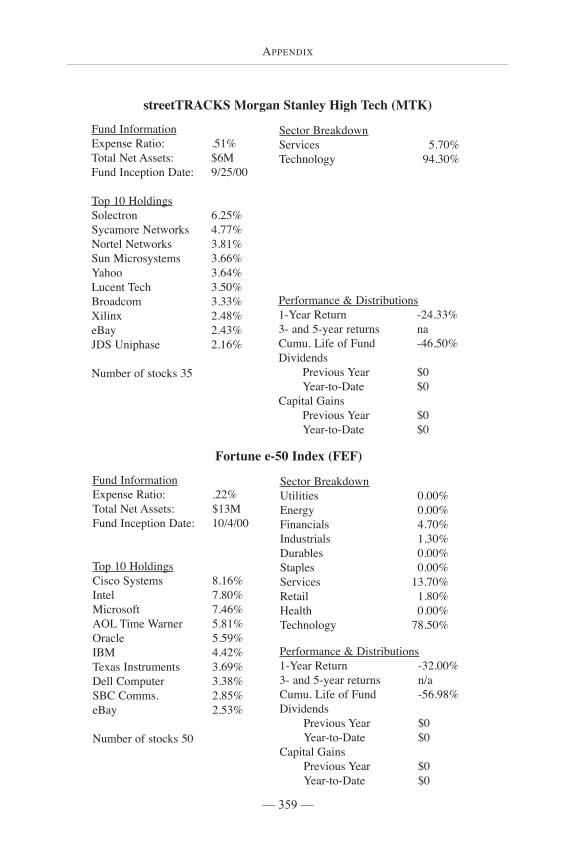
— 359 —
APPENDIX
streetTRACKS Morgan Stanley High Tech (MTK)
Fund InformationExpense Ratio: .51%Total Net Assets: $6MFund Inception Date: 9/25/00
Top 10 HoldingsSolectron 6.25%Sycamore Networks 4.77%Nortel Networks 3.81%Sun Microsystems 3.66%Yahoo 3.64%Lucent Tech 3.50%Broadcom 3.33%Xilinx 2.48%eBay 2.43%JDS Uniphase 2.16%
Number of stocks 35
Sector BreakdownServices 5.70%Technology 94.30%
Performance & Distributions1-Year Return -24.33%3- and 5-year returns naCumu. Life of Fund -46.50%Dividends
Previous Year $0Year-to-Date $0
Capital GainsPrevious Year $0Year-to-Date $0
Fortune e-50 Index (FEF)
Fund InformationExpense Ratio: .22%Total Net Assets: $13MFund Inception Date: 10/4/00
Top 10 HoldingsCisco Systems 8.16%Intel 7.80%Microsoft 7.46%AOL Time Warner 5.81%Oracle 5.59%IBM 4.42%Texas Instruments 3.69%Dell Computer 3.38%SBC Comms. 2.85%eBay 2.53%
Number of stocks 50
Sector BreakdownUtilities 0.00%Energy 0.00%Financials 4.70%Industrials 1.30%Durables 0.00%Staples 0.00%Services 13.70%Retail 1.80%Health 0.00%Technology 78.50%
Performance & Distributions1-Year Return -32.00%3- and 5-year returns n/aCumu. Life of Fund -56.98%Dividends
Previous Year $0Year-to-Date $0
Capital GainsPrevious Year $0Year-to-Date $0

— 360 —
APPENDIX
iShares Nasdaq Biotechnology (IBB)
Fund InformationExpense Ratio: .50%Total Net Assets: $25MFund Inception Date: 2/5/01
Top 10 HoldingsAmgen 17.71%Immunex 5.20%MedImmune 3.81%Genzyme Corp 3.56%IDEC Pharm. 3.55%Gilead Sciences 3.50%Chiron 3.04%Biogen 2.81%Intermune 1.96%Cephalon 1.95%
Number of stocks 70
Sector BreakdownHealth 98.90%Technology 1.10%
Performance & Distributions1-Year Return -11.69%3- and 5-year returns naCumu. Life of Fund -19.83%Dividends
Previous Year $0Year-to-Date $0
Capital GainsPrevious Year $0Year-to-Date $0
iShares Dow Jones US Financial Services (IYG)
Fund InformationExpense Ratio: .60%Total Net Assets: $59MFund Inception Date: 6/12/00
Top 10 HoldingsCitigroup 16.56%Bank of America 6.19%J.P. Morgan Chase 4.82%Fannie Mae 4.75%Wells Fargo 4.67%MSDW 3.69%Bank One 2.83%Merrill Lynch 2.80%American Express 2.76%Freddie Mac 2.16%
Number of stocks 164
Sector BreakdownFinancials 99.40%Services .50%Technology .10%
Performance & Distributions1-Year Return -6.38%3- and 5-year returns naCumu. Life of Fund 8.98%Dividends
Previous Year $1.14Year-to-Date $0
Capital GainsPrevious Year $0Year-to-Date $0
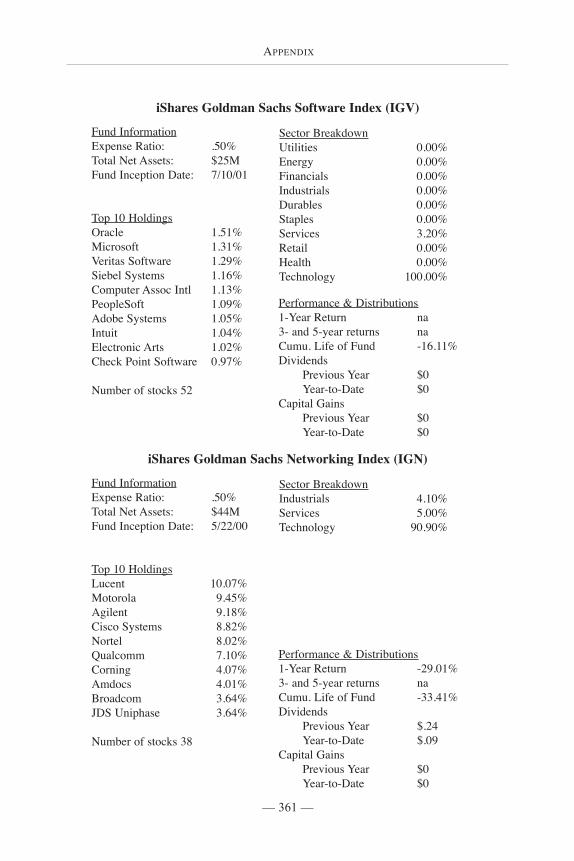
— 361 —
APPENDIX
iShares Goldman Sachs Software Index (IGV)
Fund InformationExpense Ratio: .50%Total Net Assets: $25MFund Inception Date: 7/10/01
Top 10 HoldingsOracle 1.51%Microsoft 1.31%Veritas Software 1.29%Siebel Systems 1.16%Computer Assoc Intl 1.13%PeopleSoft 1.09%Adobe Systems 1.05%Intuit 1.04%Electronic Arts 1.02%Check Point Software 0.97%
Number of stocks 52
Sector BreakdownUtilities 0.00%Energy 0.00%Financials 0.00%Industrials 0.00%Durables 0.00%Staples 0.00%Services 3.20%Retail 0.00%Health 0.00%Technology 100.00%
Performance & Distributions1-Year Return na3- and 5-year returns naCumu. Life of Fund -16.11%Dividends
Previous Year $0Year-to-Date $0
Capital GainsPrevious Year $0Year-to-Date $0
iShares Goldman Sachs Networking Index (IGN)
Fund InformationExpense Ratio: .50%Total Net Assets: $44MFund Inception Date: 5/22/00
Top 10 HoldingsLucent 10.07%Motorola 9.45%Agilent 9.18%Cisco Systems 8.82%Nortel 8.02%Qualcomm 7.10%Corning 4.07%Amdocs 4.01%Broadcom 3.64%JDS Uniphase 3.64%
Number of stocks 38
Sector BreakdownIndustrials 4.10%Services 5.00%Technology 90.90%
Performance & Distributions1-Year Return -29.01%3- and 5-year returns naCumu. Life of Fund -33.41%Dividends
Previous Year $.24Year-to-Date $.09
Capital GainsPrevious Year $0Year-to-Date $0
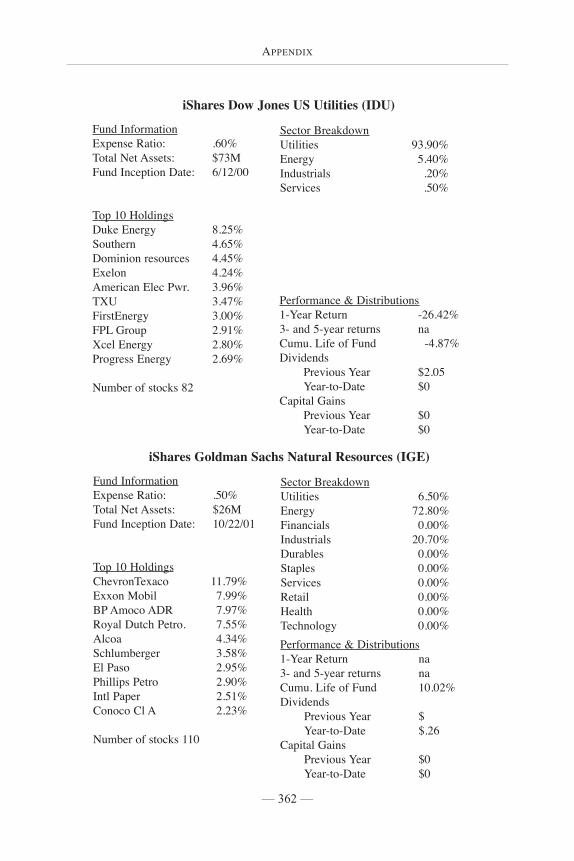
— 362 —
APPENDIX
iShares Dow Jones US Utilities (IDU)
Fund InformationExpense Ratio: .60%Total Net Assets: $73MFund Inception Date: 6/12/00
Top 10 HoldingsDuke Energy 8.25%Southern 4.65%Dominion resources 4.45%Exelon 4.24%American Elec Pwr. 3.96%TXU 3.47%FirstEnergy 3.00%FPL Group 2.91%Xcel Energy 2.80%Progress Energy 2.69%
Number of stocks 82
Sector BreakdownUtilities 93.90%Energy 5.40%Industrials .20%Services .50%
Performance & Distributions1-Year Return -26.42%3- and 5-year returns naCumu. Life of Fund -4.87%Dividends
Previous Year $2.05Year-to-Date $0
Capital GainsPrevious Year $0Year-to-Date $0
iShares Goldman Sachs Natural Resources (IGE)
Fund InformationExpense Ratio: .50%Total Net Assets: $26MFund Inception Date: 10/22/01
Top 10 HoldingsChevronTexaco 11.79%Exxon Mobil 7.99%BP Amoco ADR 7.97%Royal Dutch Petro. 7.55%Alcoa 4.34%Schlumberger 3.58%El Paso 2.95%Phillips Petro 2.90%Intl Paper 2.51%Conoco Cl A 2.23%
Number of stocks 110
Sector BreakdownUtilities 6.50%Energy 72.80%Financials 0.00%Industrials 20.70%Durables 0.00%Staples 0.00%Services 0.00%Retail 0.00%Health 0.00%Technology 0.00%Performance & Distributions1-Year Return na3- and 5-year returns naCumu. Life of Fund 10.02%Dividends
Previous Year $Year-to-Date $.26
Capital GainsPrevious Year $0Year-to-Date $0

— 363 —
APPENDIX
Financial Select Sector SPDR (XLF)
Fund InformationExpense Ratio: .28%Total Net Assets: $580MFund Inception Date: 12/22/98
Top 10 HoldingsCitigroup 13.15%American Intl Grp. 9.73%Bank of America 5.52%Wells Fargo 4.32%Fannie Mae 4.12%J.P. Morgan Chase 3.63%Morgan Stanley/DW 3.25%American Express 2.82%First Union 2.61%Bank One 2.52%
Number of stocks 74
Sector BreakdownUtilities 0.00%Energy 0.00%Financials 99.70%Industrials 0.00%Durables 0.00%Staples 0.00%Services 0.30%Retail 0.00%Health 0.00%Technology 0.00%
Performance & Distributions1-Year Return 3.52%3- and 5-year returns 2.55%Cumu. Life of Fund 17.40%Tax Efficiency 87.02%
Utilities Select Sector SPDR (XLU)
Fund InformationExpense Ratio: .28%Total Net Assets: $113MFund Inception Date: 12/22/98
Top 10 HoldingsSBC Comms 18.52%Verizon Comm. 18.13%Duke Energy 4.95%BellSouth 3.50%Alltel 3.09%Exelon 3.06%American Elec. Pwr. 2.96%Southern 2.96%Dominion resources 2.94%Xcel Energy 2.65%
Number of stocks 40
Sector BreakdownUtilities 54.30%Energy 1.90%Services 43.80%
Performance & Distributions1-Year Return -13.05%3- and 5-year returns naCumu. Life of Fund 4.11%Dividends
Previous Year $.91Year-to-Date $.88
Capital GainsPrevious Year $.25Year-to-Date $0
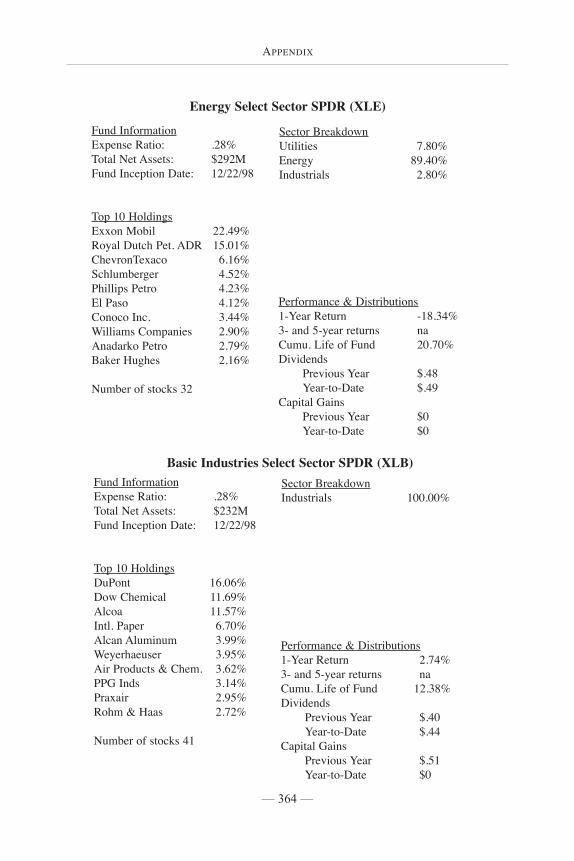
— 364 —
APPENDIX
Energy Select Sector SPDR (XLE)
Fund InformationExpense Ratio: .28%Total Net Assets: $292MFund Inception Date: 12/22/98
Top 10 HoldingsExxon Mobil 22.49%Royal Dutch Pet. ADR 15.01%ChevronTexaco 6.16%Schlumberger 4.52%Phillips Petro 4.23%El Paso 4.12%Conoco Inc. 3.44%Williams Companies 2.90%Anadarko Petro 2.79%Baker Hughes 2.16%
Number of stocks 32
Sector BreakdownUtilities 7.80%Energy 89.40%Industrials 2.80%
Performance & Distributions1-Year Return -18.34%3- and 5-year returns naCumu. Life of Fund 20.70%Dividends
Previous Year $.48Year-to-Date $.49
Capital GainsPrevious Year $0Year-to-Date $0
Basic Industries Select Sector SPDR (XLB)Fund InformationExpense Ratio: .28%Total Net Assets: $232MFund Inception Date: 12/22/98
Top 10 HoldingsDuPont 16.06%Dow Chemical 11.69%Alcoa 11.57%Intl. Paper 6.70%Alcan Aluminum 3.99%Weyerhaeuser 3.95%Air Products & Chem. 3.62%PPG Inds 3.14%Praxair 2.95%Rohm & Haas 2.72%
Number of stocks 41
Sector BreakdownIndustrials 100.00%
Performance & Distributions1-Year Return 2.74%3- and 5-year returns naCumu. Life of Fund 12.38%Dividends
Previous Year $.40Year-to-Date $.44
Capital GainsPrevious Year $.51Year-to-Date $0

— 365 —
APPENDIX
Consumer Services Select Sector SPDR (XLV)
Fund InformationExpense Ratio: .28%Total Net Assets: $173MFund Inception Date: 12/22/98
Top 10 HoldingsViacom Cl B 14.14%Walt Disney 7.63%Clear Channel Comms. 5.63%Comcast 5.08%UnitedHealth Grp. 4.17%McDonald’s 4.04%HCA-The Healthcare 3.72%Cendant 3.70%Tenet Healthcare 3.69%Gannett 3.34%
Number of stocks 43
Sector BreakdownFinancials 8.00%Industrials .70%Durables 1.10%Services 75.30%Retail 1.40%Health 12.30%Technology 1.20%
Performance & Distributions1-Year Return -.2%3- and 5-year returns naCumu. Life of Fund 9.90%Dividends
Previous Year $.05Year-to-Date $.07
Capital GainsPrevious Year $.01Year-to-Date $0
Cyclical/Transportation Select SPDR (XLY)
Fund InformationExpense Ratio: .28%Total Net Assets: $262MFund Inception Date: 12/22/98
Top 10 HoldingsWal-Mart Stores 6.25%Home Depot 4.77%Target 3.81%Lowe’s 3.66%Ford Motor 3.64%General Motors 3.50%Kohl’s 3.33%Costco Wholesale 2.48%Best Buy 2.43%Fedex 2.16%
Number of stocks 66
Sector BreakdownIndustrials 5.20%Durables 14.80%Staples 3.30%Services 9.50%Retail 67.10%
Performance & Distributions1-Year Return 13.44%3- and 5-year returns naCumu. Life of Fund 16.10%Dividends
Previous Year $.23Year-to-Date $.22
Capital GainsPrevious Year $0Year-to-Date $0
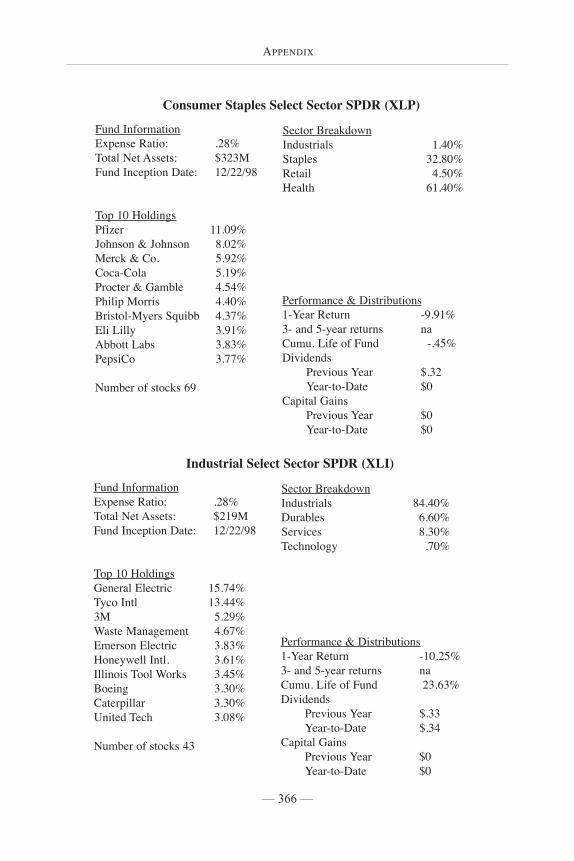
— 366 —
APPENDIX
Consumer Staples Select Sector SPDR (XLP)
Fund InformationExpense Ratio: .28%Total Net Assets: $323MFund Inception Date: 12/22/98
Top 10 HoldingsPfizer 11.09%Johnson & Johnson 8.02%Merck & Co. 5.92%Coca-Cola 5.19%Procter & Gamble 4.54%Philip Morris 4.40%Bristol-Myers Squibb 4.37%Eli Lilly 3.91%Abbott Labs 3.83%PepsiCo 3.77%
Number of stocks 69
Sector BreakdownIndustrials 1.40%Staples 32.80%Retail 4.50%Health 61.40%
Performance & Distributions1-Year Return -9.91%3- and 5-year returns naCumu. Life of Fund -.45%Dividends
Previous Year $.32Year-to-Date $0
Capital GainsPrevious Year $0Year-to-Date $0
Industrial Select Sector SPDR (XLI)
Fund InformationExpense Ratio: .28%Total Net Assets: $219MFund Inception Date: 12/22/98
Top 10 HoldingsGeneral Electric 15.74%Tyco Intl 13.44%3M 5.29%Waste Management 4.67%Emerson Electric 3.83%Honeywell Intl. 3.61%Illinois Tool Works 3.45%Boeing 3.30%Caterpillar 3.30%United Tech 3.08%
Number of stocks 43
Sector BreakdownIndustrials 84.40%Durables 6.60%Services 8.30%Technology .70%
Performance & Distributions1-Year Return -10.25%3- and 5-year returns naCumu. Life of Fund 23.63%Dividends
Previous Year $.33Year-to-Date $.34
Capital GainsPrevious Year $0Year-to-Date $0
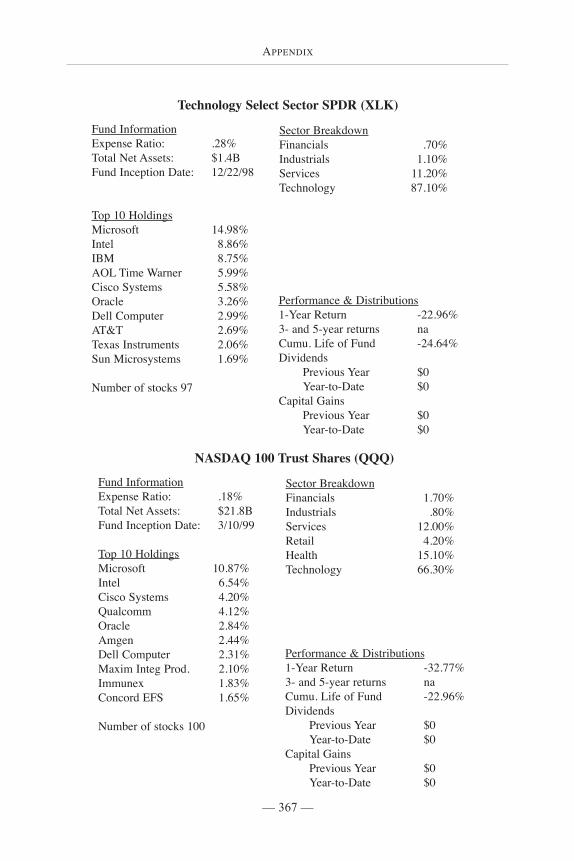
— 367 —
APPENDIX
NASDAQ 100 Trust Shares (QQQ)
Fund InformationExpense Ratio: .18%Total Net Assets: $21.8BFund Inception Date: 3/10/99
Top 10 HoldingsMicrosoft 10.87%Intel 6.54%Cisco Systems 4.20%Qualcomm 4.12%Oracle 2.84%Amgen 2.44%Dell Computer 2.31%Maxim Integ Prod. 2.10%Immunex 1.83%Concord EFS 1.65%
Number of stocks 100
Sector BreakdownFinancials 1.70%Industrials .80%Services 12.00%Retail 4.20%Health 15.10%Technology 66.30%
Performance & Distributions1-Year Return -32.77%3- and 5-year returns naCumu. Life of Fund -22.96%Dividends
Previous Year $0Year-to-Date $0
Capital GainsPrevious Year $0Year-to-Date $0
Technology Select Sector SPDR (XLK)
Fund InformationExpense Ratio: .28%Total Net Assets: $1.4BFund Inception Date: 12/22/98
Top 10 HoldingsMicrosoft 14.98%Intel 8.86%IBM 8.75%AOL Time Warner 5.99%Cisco Systems 5.58%Oracle 3.26%Dell Computer 2.99%AT&T 2.69%Texas Instruments 2.06%Sun Microsystems 1.69%
Number of stocks 97
Sector BreakdownFinancials .70%Industrials 1.10%Services 11.20%Technology 87.10%
Performance & Distributions1-Year Return -22.96%3- and 5-year returns naCumu. Life of Fund -24.64%Dividends
Previous Year $0Year-to-Date $0
Capital GainsPrevious Year $0Year-to-Date $0
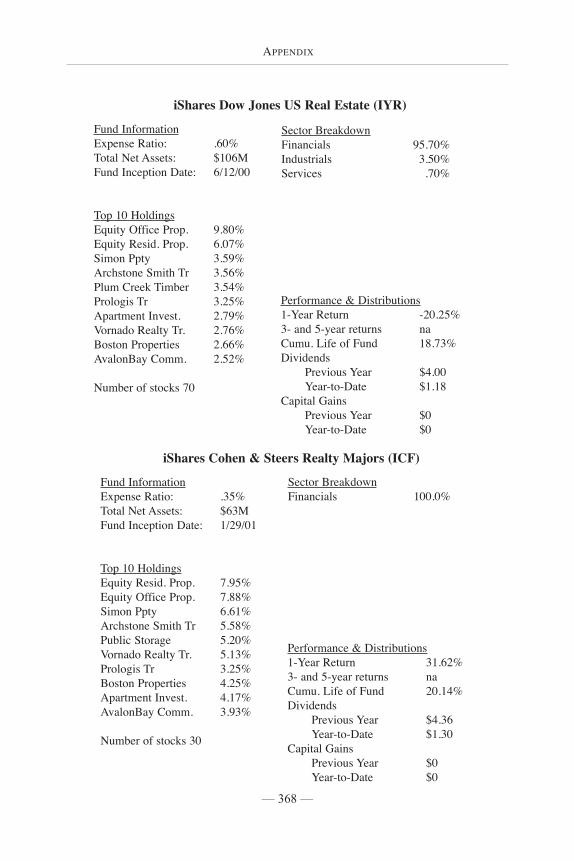
— 368 —
APPENDIX
iShares Dow Jones US Real Estate (IYR)
Fund InformationExpense Ratio: .60%Total Net Assets: $106MFund Inception Date: 6/12/00
Top 10 HoldingsEquity Office Prop. 9.80%Equity Resid. Prop. 6.07%Simon Ppty 3.59%Archstone Smith Tr 3.56%Plum Creek Timber 3.54%Prologis Tr 3.25%Apartment Invest. 2.79%Vornado Realty Tr. 2.76%Boston Properties 2.66%AvalonBay Comm. 2.52%
Number of stocks 70
Sector BreakdownFinancials 95.70%Industrials 3.50%Services .70%
Performance & Distributions1-Year Return -20.25%3- and 5-year returns naCumu. Life of Fund 18.73%Dividends
Previous Year $4.00Year-to-Date $1.18
Capital GainsPrevious Year $0Year-to-Date $0
iShares Cohen & Steers Realty Majors (ICF)
Fund InformationExpense Ratio: .35%Total Net Assets: $63MFund Inception Date: 1/29/01
Top 10 HoldingsEquity Resid. Prop. 7.95%Equity Office Prop. 7.88%Simon Ppty 6.61%Archstone Smith Tr 5.58%Public Storage 5.20%Vornado Realty Tr. 5.13%Prologis Tr 3.25%Boston Properties 4.25%Apartment Invest. 4.17%AvalonBay Comm. 3.93%
Number of stocks 30
Sector BreakdownFinancials 100.0%
Performance & Distributions1-Year Return 31.62%3- and 5-year returns naCumu. Life of Fund 20.14%Dividends
Previous Year $4.36Year-to-Date $1.30
Capital GainsPrevious Year $0Year-to-Date $0
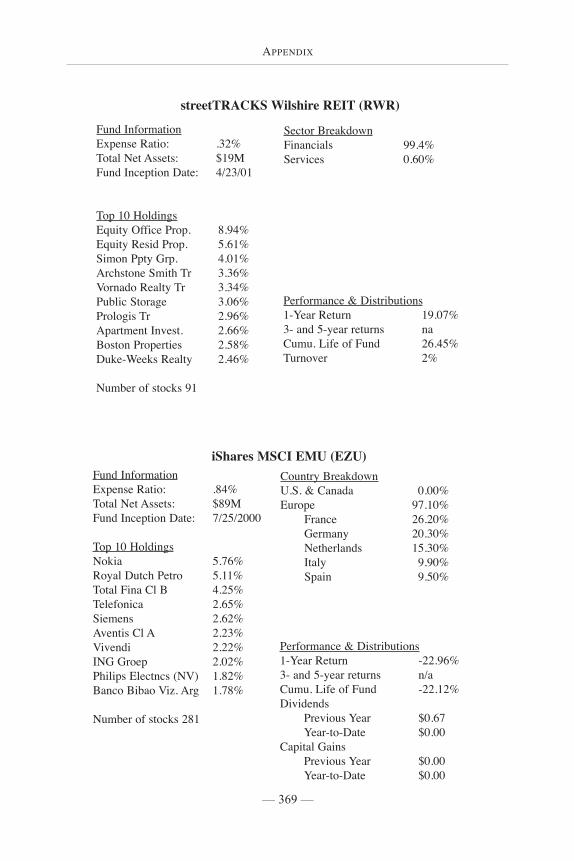
— 369 —
APPENDIX
iShares MSCI EMU (EZU)Fund InformationExpense Ratio: .84%Total Net Assets: $89MFund Inception Date: 7/25/2000
Top 10 HoldingsNokia 5.76%Royal Dutch Petro 5.11%Total Fina Cl B 4.25%Telefonica 2.65%Siemens 2.62%Aventis Cl A 2.23%Vivendi 2.22%ING Groep 2.02%Philips Electncs (NV) 1.82%Banco Bibao Viz. Arg 1.78%
Number of stocks 281
Country BreakdownU.S. & Canada 0.00%Europe 97.10%
France 26.20%Germany 20.30%Netherlands 15.30%Italy 9.90%Spain 9.50%
Performance & Distributions1-Year Return -22.96%3- and 5-year returns n/aCumu. Life of Fund -22.12%Dividends
Previous Year $0.67Year-to-Date $0.00
Capital GainsPrevious Year $0.00Year-to-Date $0.00
streetTRACKS Wilshire REIT (RWR)
Fund InformationExpense Ratio: .32%Total Net Assets: $19MFund Inception Date: 4/23/01
Top 10 HoldingsEquity Office Prop. 8.94%Equity Resid Prop. 5.61%Simon Ppty Grp. 4.01%Archstone Smith Tr 3.36%Vornado Realty Tr 3.34%Public Storage 3.06%Prologis Tr 2.96%Apartment Invest. 2.66%Boston Properties 2.58%Duke-Weeks Realty 2.46%
Number of stocks 91
Sector BreakdownFinancials 99.4%Services 0.60%
Performance & Distributions1-Year Return 19.07%3- and 5-year returns naCumu. Life of Fund 26.45%Turnover 2%
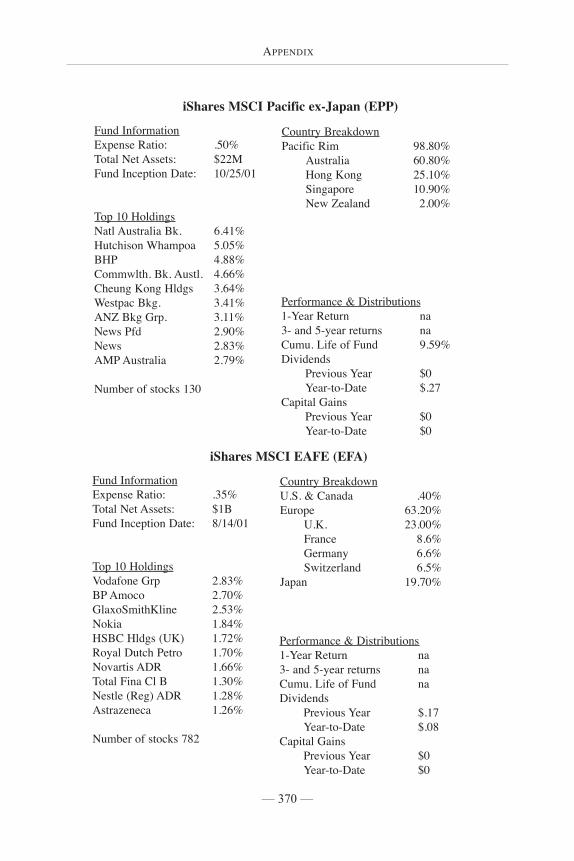
— 370 —
APPENDIX
iShares MSCI Pacific ex-Japan (EPP)
Fund InformationExpense Ratio: .50%Total Net Assets: $22MFund Inception Date: 10/25/01
Top 10 HoldingsNatl Australia Bk. 6.41%Hutchison Whampoa 5.05%BHP 4.88%Commwlth. Bk. Austl. 4.66%Cheung Kong Hldgs 3.64%Westpac Bkg. 3.41%ANZ Bkg Grp. 3.11%News Pfd 2.90%News 2.83%AMP Australia 2.79%
Number of stocks 130
Country BreakdownPacific Rim 98.80%
Australia 60.80%Hong Kong 25.10%Singapore 10.90%New Zealand 2.00%
Performance & Distributions1-Year Return na3- and 5-year returns naCumu. Life of Fund 9.59%Dividends
Previous Year $0Year-to-Date $.27
Capital GainsPrevious Year $0Year-to-Date $0
iShares MSCI EAFE (EFA)
Fund InformationExpense Ratio: .35%Total Net Assets: $1BFund Inception Date: 8/14/01
Top 10 HoldingsVodafone Grp 2.83%BP Amoco 2.70%GlaxoSmithKline 2.53%Nokia 1.84%HSBC Hldgs (UK) 1.72%Royal Dutch Petro 1.70%Novartis ADR 1.66%Total Fina Cl B 1.30%Nestle (Reg) ADR 1.28%Astrazeneca 1.26%
Number of stocks 782
Country BreakdownU.S. & Canada .40%Europe 63.20%
U.K. 23.00%France 8.6%Germany 6.6%Switzerland 6.5%
Japan 19.70%
Performance & Distributions1-Year Return na3- and 5-year returns naCumu. Life of Fund naDividends
Previous Year $.17Year-to-Date $.08
Capital GainsPrevious Year $0Year-to-Date $0
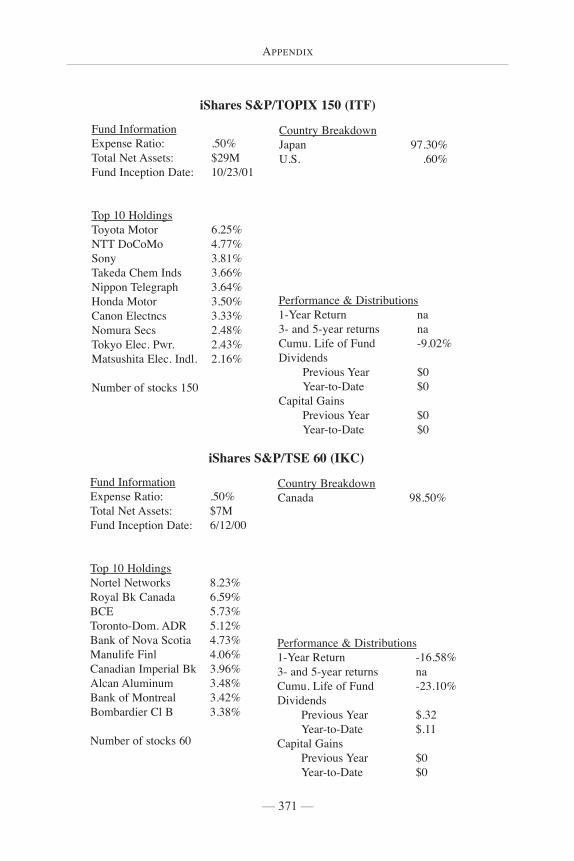
— 371 —
APPENDIX
iShares S&P/TOPIX 150 (ITF)
Fund InformationExpense Ratio: .50%Total Net Assets: $29MFund Inception Date: 10/23/01
Top 10 HoldingsToyota Motor 6.25%NTT DoCoMo 4.77%Sony 3.81%Takeda Chem Inds 3.66%Nippon Telegraph 3.64%Honda Motor 3.50%Canon Electncs 3.33%Nomura Secs 2.48%Tokyo Elec. Pwr. 2.43%Matsushita Elec. Indl. 2.16%
Number of stocks 150
Country BreakdownJapan 97.30%U.S. .60%
Performance & Distributions1-Year Return na3- and 5-year returns naCumu. Life of Fund -9.02%Dividends
Previous Year $0Year-to-Date $0
Capital GainsPrevious Year $0Year-to-Date $0
iShares S&P/TSE 60 (IKC)
Fund InformationExpense Ratio: .50%Total Net Assets: $7MFund Inception Date: 6/12/00
Top 10 HoldingsNortel Networks 8.23%Royal Bk Canada 6.59%BCE 5.73%Toronto-Dom. ADR 5.12%Bank of Nova Scotia 4.73%Manulife Finl 4.06%Canadian Imperial Bk 3.96%Alcan Aluminum 3.48%Bank of Montreal 3.42%Bombardier Cl B 3.38%
Number of stocks 60
Country BreakdownCanada 98.50%
Performance & Distributions1-Year Return -16.58%3- and 5-year returns naCumu. Life of Fund -23.10%Dividends
Previous Year $.32Year-to-Date $.11
Capital GainsPrevious Year $0Year-to-Date $0
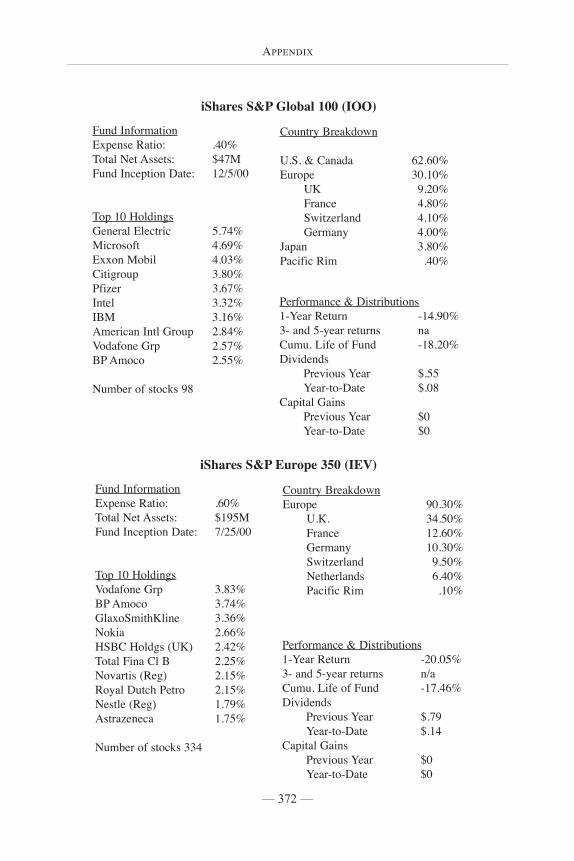
— 372 —
APPENDIX
iShares S&P Global 100 (IOO)
Fund InformationExpense Ratio: .40%Total Net Assets: $47MFund Inception Date: 12/5/00
Top 10 HoldingsGeneral Electric 5.74%Microsoft 4.69%Exxon Mobil 4.03%Citigroup 3.80%Pfizer 3.67%Intel 3.32%IBM 3.16%American Intl Group 2.84%Vodafone Grp 2.57%BP Amoco 2.55%
Number of stocks 98
Country Breakdown
U.S. & Canada 62.60%Europe 30.10%
UK 9.20%France 4.80%Switzerland 4.10%Germany 4.00%
Japan 3.80%Pacific Rim .40%
Performance & Distributions1-Year Return -14.90%3- and 5-year returns naCumu. Life of Fund -18.20%Dividends
Previous Year $.55Year-to-Date $.08
Capital GainsPrevious Year $0Year-to-Date $0
iShares S&P Europe 350 (IEV)
Fund InformationExpense Ratio: .60%Total Net Assets: $195MFund Inception Date: 7/25/00
Top 10 HoldingsVodafone Grp 3.83%BP Amoco 3.74%GlaxoSmithKline 3.36%Nokia 2.66%HSBC Holdgs (UK) 2.42%Total Fina Cl B 2.25%Novartis (Reg) 2.15%Royal Dutch Petro 2.15%Nestle (Reg) 1.79%Astrazeneca 1.75%
Number of stocks 334
Country BreakdownEurope 90.30%
U.K. 34.50%France 12.60%Germany 10.30%Switzerland 9.50%Netherlands 6.40%Pacific Rim .10%
Performance & Distributions1-Year Return -20.05%3- and 5-year returns n/aCumu. Life of Fund -17.46%Dividends
Previous Year $.79Year-to-Date $.14
Capital GainsPrevious Year $0Year-to-Date $0
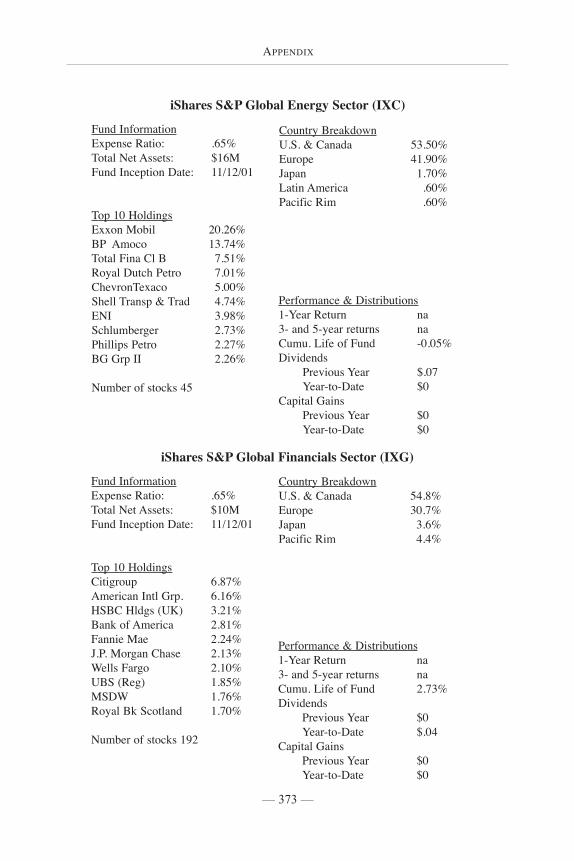
— 373 —
APPENDIX
iShares S&P Global Energy Sector (IXC)
Fund InformationExpense Ratio: .65%Total Net Assets: $16MFund Inception Date: 11/12/01
Top 10 HoldingsExxon Mobil 20.26%BP Amoco 13.74%Total Fina Cl B 7.51%Royal Dutch Petro 7.01%ChevronTexaco 5.00%Shell Transp & Trad 4.74%ENI 3.98%Schlumberger 2.73%Phillips Petro 2.27%BG Grp II 2.26%
Number of stocks 45
Country BreakdownU.S. & Canada 53.50%Europe 41.90%Japan 1.70%Latin America .60%Pacific Rim .60%
Performance & Distributions1-Year Return na3- and 5-year returns naCumu. Life of Fund -0.05%Dividends
Previous Year $.07Year-to-Date $0
Capital GainsPrevious Year $0Year-to-Date $0
iShares S&P Global Financials Sector (IXG)
Fund InformationExpense Ratio: .65%Total Net Assets: $10MFund Inception Date: 11/12/01
Top 10 HoldingsCitigroup 6.87%American Intl Grp. 6.16%HSBC Hldgs (UK) 3.21%Bank of America 2.81%Fannie Mae 2.24%J.P. Morgan Chase 2.13%Wells Fargo 2.10%UBS (Reg) 1.85%MSDW 1.76%Royal Bk Scotland 1.70%
Number of stocks 192
Country BreakdownU.S. & Canada 54.8%Europe 30.7%Japan 3.6%Pacific Rim 4.4%
Performance & Distributions1-Year Return na3- and 5-year returns naCumu. Life of Fund 2.73%Dividends
Previous Year $0Year-to-Date $.04
Capital GainsPrevious Year $0Year-to-Date $0
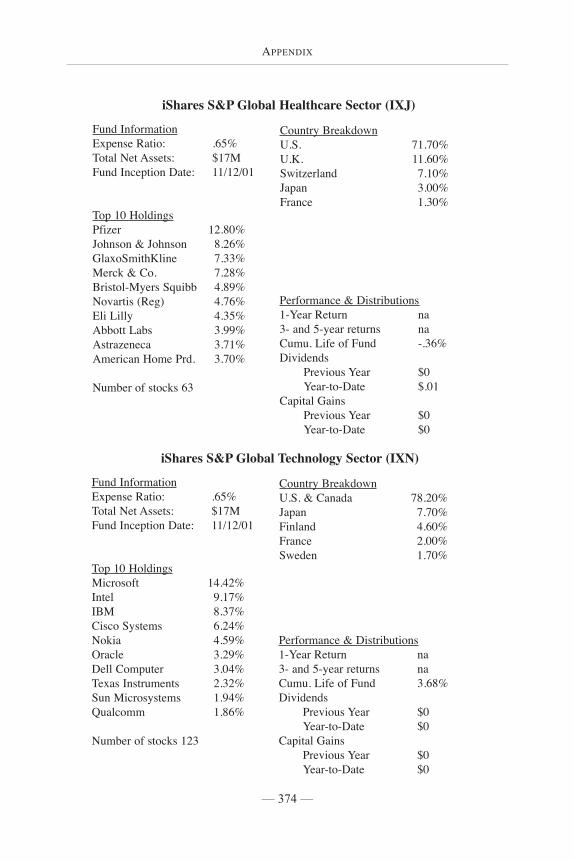
— 374 —
APPENDIX
iShares S&P Global Healthcare Sector (IXJ)
Fund InformationExpense Ratio: .65%Total Net Assets: $17MFund Inception Date: 11/12/01
Top 10 HoldingsPfizer 12.80%Johnson & Johnson 8.26%GlaxoSmithKline 7.33%Merck & Co. 7.28%Bristol-Myers Squibb 4.89%Novartis (Reg) 4.76%Eli Lilly 4.35%Abbott Labs 3.99%Astrazeneca 3.71%American Home Prd. 3.70%
Number of stocks 63
Country BreakdownU.S. 71.70%U.K. 11.60%Switzerland 7.10%Japan 3.00%France 1.30%
Performance & Distributions1-Year Return na3- and 5-year returns naCumu. Life of Fund -.36%Dividends
Previous Year $0Year-to-Date $.01
Capital GainsPrevious Year $0Year-to-Date $0
iShares S&P Global Technology Sector (IXN)
Fund InformationExpense Ratio: .65%Total Net Assets: $17MFund Inception Date: 11/12/01
Top 10 HoldingsMicrosoft 14.42%Intel 9.17%IBM 8.37%Cisco Systems 6.24%Nokia 4.59%Oracle 3.29%Dell Computer 3.04%Texas Instruments 2.32%Sun Microsystems 1.94%Qualcomm 1.86%
Number of stocks 123
Country BreakdownU.S. & Canada 78.20%Japan 7.70%Finland 4.60%France 2.00%Sweden 1.70%
Performance & Distributions1-Year Return na3- and 5-year returns naCumu. Life of Fund 3.68%Dividends
Previous Year $0Year-to-Date $0
Capital GainsPrevious Year $0Year-to-Date $0
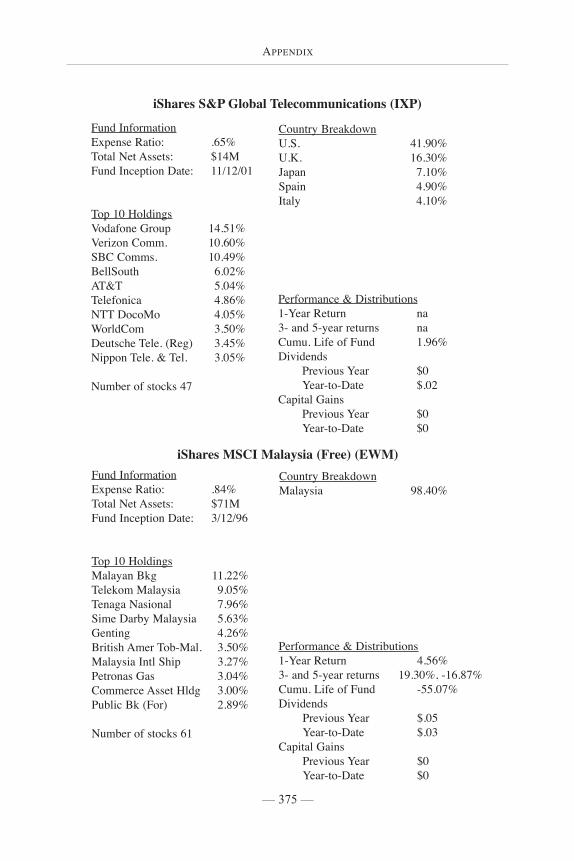
— 375 —
APPENDIX
iShares MSCI Malaysia (Free) (EWM)Fund InformationExpense Ratio: .84%Total Net Assets: $71MFund Inception Date: 3/12/96
Top 10 HoldingsMalayan Bkg 11.22%Telekom Malaysia 9.05%Tenaga Nasional 7.96%Sime Darby Malaysia 5.63%Genting 4.26%British Amer Tob-Mal. 3.50%Malaysia Intl Ship 3.27%Petronas Gas 3.04%Commerce Asset Hldg 3.00%Public Bk (For) 2.89%
Number of stocks 61
Country BreakdownMalaysia 98.40%
Performance & Distributions1-Year Return 4.56%3- and 5-year returns 19.30%, -16.87%Cumu. Life of Fund -55.07%Dividends
Previous Year $.05Year-to-Date $.03
Capital GainsPrevious Year $0Year-to-Date $0
iShares S&P Global Telecommunications (IXP)
Fund InformationExpense Ratio: .65%Total Net Assets: $14MFund Inception Date: 11/12/01
Top 10 HoldingsVodafone Group 14.51%Verizon Comm. 10.60%SBC Comms. 10.49%BellSouth 6.02%AT&T 5.04%Telefonica 4.86%NTT DocoMo 4.05%WorldCom 3.50%Deutsche Tele. (Reg) 3.45%Nippon Tele. & Tel. 3.05%
Number of stocks 47
Country BreakdownU.S. 41.90%U.K. 16.30%Japan 7.10%Spain 4.90%Italy 4.10%
Performance & Distributions1-Year Return na3- and 5-year returns naCumu. Life of Fund 1.96%Dividends
Previous Year $0Year-to-Date $.02
Capital GainsPrevious Year $0Year-to-Date $0
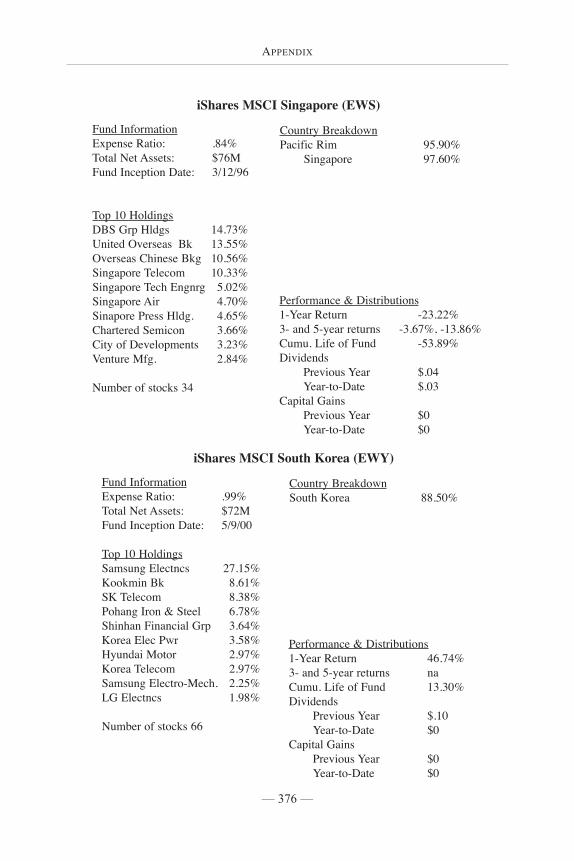
— 376 —
APPENDIX
iShares MSCI Singapore (EWS)
Fund InformationExpense Ratio: .84%Total Net Assets: $76MFund Inception Date: 3/12/96
Top 10 HoldingsDBS Grp Hldgs 14.73%United Overseas Bk 13.55%Overseas Chinese Bkg 10.56%Singapore Telecom 10.33%Singapore Tech Engnrg 5.02%Singapore Air 4.70%Sinapore Press Hldg. 4.65%Chartered Semicon 3.66%City of Developments 3.23%Venture Mfg. 2.84%
Number of stocks 34
Country BreakdownPacific Rim 95.90%
Singapore 97.60%
Performance & Distributions1-Year Return -23.22%3- and 5-year returns -3.67%, -13.86%Cumu. Life of Fund -53.89%Dividends
Previous Year $.04Year-to-Date $.03
Capital GainsPrevious Year $0Year-to-Date $0
iShares MSCI South Korea (EWY)
Fund InformationExpense Ratio: .99%Total Net Assets: $72MFund Inception Date: 5/9/00
Top 10 HoldingsSamsung Electncs 27.15%Kookmin Bk 8.61%SK Telecom 8.38%Pohang Iron & Steel 6.78%Shinhan Financial Grp 3.64%Korea Elec Pwr 3.58%Hyundai Motor 2.97%Korea Telecom 2.97%Samsung Electro-Mech. 2.25%LG Electncs 1.98%
Number of stocks 66
Country BreakdownSouth Korea 88.50%
Performance & Distributions1-Year Return 46.74%3- and 5-year returns naCumu. Life of Fund 13.30%Dividends
Previous Year $.10Year-to-Date $0
Capital GainsPrevious Year $0Year-to-Date $0

APPENDIX
— 377 —
iShares MSCI United Kingdom (EWU)
Fund InformationExpense Ratio: .84%Total Net Assets: $123MFund Inception Date: 3/12/96
Top 10 HoldingsVodafone Group 9.75%BP Amoco 7.28%GlaxoSmithKline 6.81%Astrazeneca 4.73%HSBC Hldgs (UK) 4.63%Shell Transp & Trad 4.47%LLoyds TSB Grp 3.75%Royal Bk of Scotland 3.73%Barclays 3.29%HBOS 2.43%
Number of stocks 124
Country BreakdownEurope 94.20%
U.K. 96.80%Pacific Rim .30%
Australia .30%
Performance & Distributions1-Year Return -15.94%3- and 5-year returns -5.92%, 3.57%Cumu. Life of Fund 52.84%Dividends
Previous Year $.26Year-to-Date $.22
Capital GainsPrevious Year $0Year-to-Date $.01
iShares MSCI Switzerland (EWL)Fund InformationExpense Ratio: .84%Total Net Assets: $31MFund Inception Date: 3/12/96
Top 10 HoldingsNovartis 19.91%Nestle 12.21%UBS AG REG 9.92%Roche Holding 7.35%Credit Suisse Grp 5.11%Schweizerische 4.91%Zuarich Financial 4.40%Holcim 2.88%ABB 2.82%Richemont A 2.36%
Number of stocks 40
Country BreakdownSwitzerland 90.00%
Performance & Distributions1-Year Return -24.93%3- and 5-year returns -8.39%, 3.84%Cumu. Life of Fund 20.13%Dividends
Previous Year $.09Year-to-Date $.01
Capital GainsPrevious Year $.04Year-to-Date $0
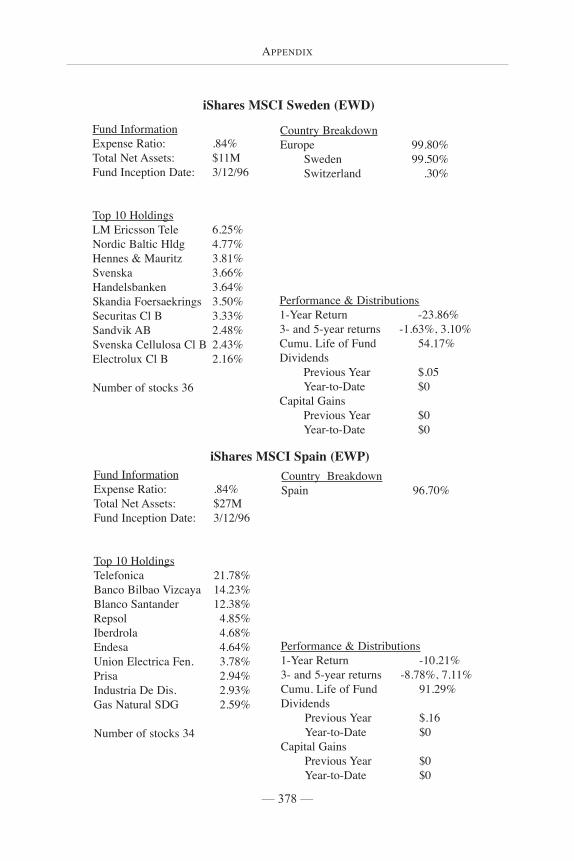
APPENDIX
— 378 —
iShares MSCI Sweden (EWD)
Fund InformationExpense Ratio: .84%Total Net Assets: $11MFund Inception Date: 3/12/96
Top 10 HoldingsLM Ericsson Tele 6.25%Nordic Baltic Hldg 4.77%Hennes & Mauritz 3.81%Svenska 3.66%Handelsbanken 3.64%Skandia Foersaekrings 3.50%Securitas Cl B 3.33%Sandvik AB 2.48%Svenska Cellulosa Cl B 2.43%Electrolux Cl B 2.16%
Number of stocks 36
Country BreakdownEurope 99.80%
Sweden 99.50%Switzerland .30%
Performance & Distributions1-Year Return -23.86%3- and 5-year returns -1.63%, 3.10%Cumu. Life of Fund 54.17%Dividends
Previous Year $.05Year-to-Date $0
Capital GainsPrevious Year $0Year-to-Date $0
iShares MSCI Spain (EWP)Fund InformationExpense Ratio: .84%Total Net Assets: $27MFund Inception Date: 3/12/96
Top 10 HoldingsTelefonica 21.78%Banco Bilbao Vizcaya 14.23%Blanco Santander 12.38%Repsol 4.85%Iberdrola 4.68%Endesa 4.64%Union Electrica Fen. 3.78%Prisa 2.94%Industria De Dis. 2.93%Gas Natural SDG 2.59%
Number of stocks 34
Country BreakdownSpain 96.70%
Performance & Distributions1-Year Return -10.21%3- and 5-year returns -8.78%, 7.11%Cumu. Life of Fund 91.29%Dividends
Previous Year $.16Year-to-Date $0
Capital GainsPrevious Year $0Year-to-Date $0
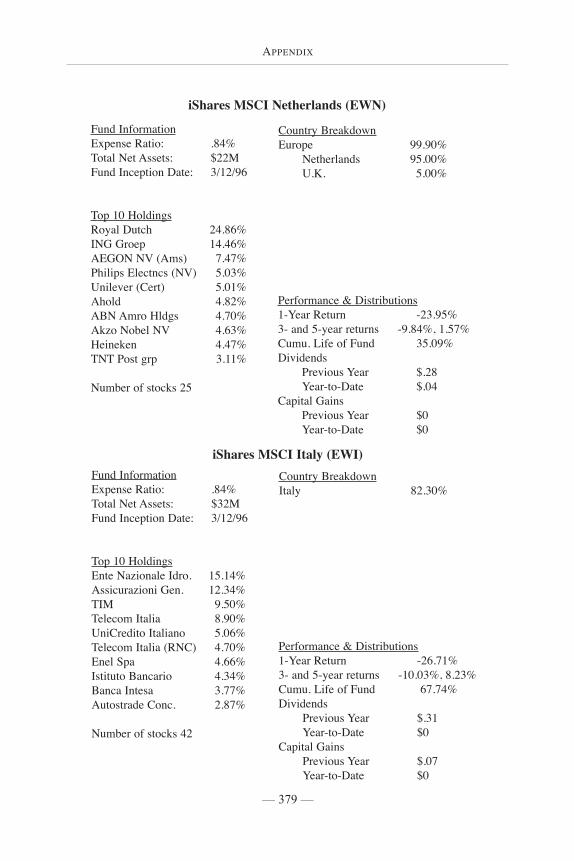
APPENDIX
— 379 —
iShares MSCI Netherlands (EWN)
Fund InformationExpense Ratio: .84%Total Net Assets: $22MFund Inception Date: 3/12/96
Top 10 HoldingsRoyal Dutch 24.86%ING Groep 14.46%AEGON NV (Ams) 7.47%Philips Electncs (NV) 5.03%Unilever (Cert) 5.01%Ahold 4.82%ABN Amro Hldgs 4.70%Akzo Nobel NV 4.63%Heineken 4.47%TNT Post grp 3.11%
Number of stocks 25
Country BreakdownEurope 99.90%
Netherlands 95.00%U.K. 5.00%
Performance & Distributions1-Year Return -23.95%3- and 5-year returns -9.84%, 1.57%Cumu. Life of Fund 35.09%Dividends
Previous Year $.28Year-to-Date $.04
Capital GainsPrevious Year $0Year-to-Date $0
iShares MSCI Italy (EWI)Fund InformationExpense Ratio: .84%Total Net Assets: $32MFund Inception Date: 3/12/96
Top 10 HoldingsEnte Nazionale Idro. 15.14%Assicurazioni Gen. 12.34%TIM 9.50%Telecom Italia 8.90%UniCredito Italiano 5.06%Telecom Italia (RNC) 4.70%Enel Spa 4.66%Istituto Bancario 4.34%Banca Intesa 3.77%Autostrade Conc. 2.87%
Number of stocks 42
Country BreakdownItaly 82.30%
Performance & Distributions1-Year Return -26.71%3- and 5-year returns -10.03%, 8.23%Cumu. Life of Fund 67.74%Dividends
Previous Year $.31Year-to-Date $0
Capital GainsPrevious Year $.07Year-to-Date $0
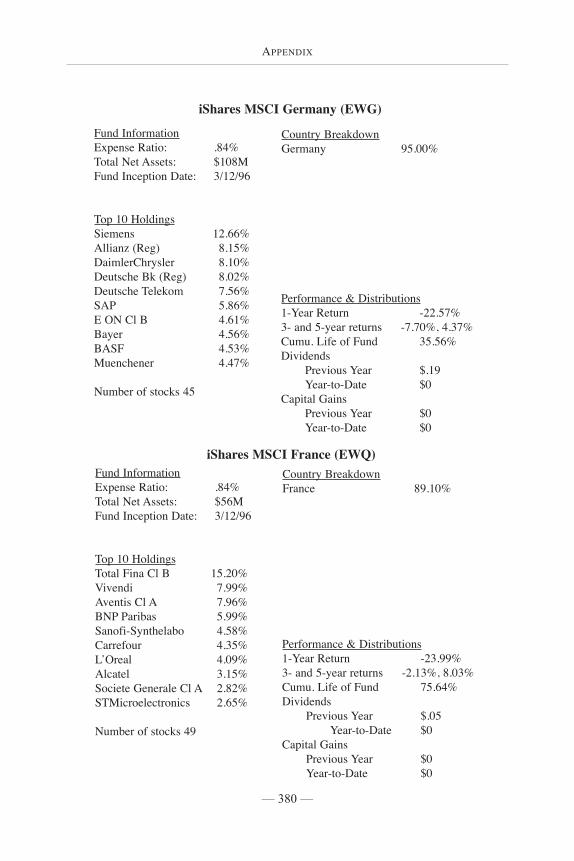
APPENDIX
— 380 —
iShares MSCI Germany (EWG)
Fund InformationExpense Ratio: .84%Total Net Assets: $108MFund Inception Date: 3/12/96
Top 10 HoldingsSiemens 12.66%Allianz (Reg) 8.15%DaimlerChrysler 8.10%Deutsche Bk (Reg) 8.02%Deutsche Telekom 7.56%SAP 5.86%E ON Cl B 4.61%Bayer 4.56%BASF 4.53%Muenchener 4.47%
Number of stocks 45
Country BreakdownGermany 95.00%
Performance & Distributions1-Year Return -22.57%3- and 5-year returns -7.70%, 4.37%Cumu. Life of Fund 35.56%Dividends
Previous Year $.19Year-to-Date $0
Capital GainsPrevious Year $0Year-to-Date $0
iShares MSCI France (EWQ)Fund InformationExpense Ratio: .84%Total Net Assets: $56MFund Inception Date: 3/12/96
Top 10 HoldingsTotal Fina Cl B 15.20%Vivendi 7.99%Aventis Cl A 7.96%BNP Paribas 5.99%Sanofi-Synthelabo 4.58%Carrefour 4.35%L’Oreal 4.09%Alcatel 3.15%Societe Generale Cl A 2.82%STMicroelectronics 2.65%
Number of stocks 49
Country BreakdownFrance 89.10%
Performance & Distributions1-Year Return -23.99%3- and 5-year returns -2.13%, 8.03%Cumu. Life of Fund 75.64%Dividends
Previous Year $.05Year-to-Date $0
Capital GainsPrevious Year $0Year-to-Date $0
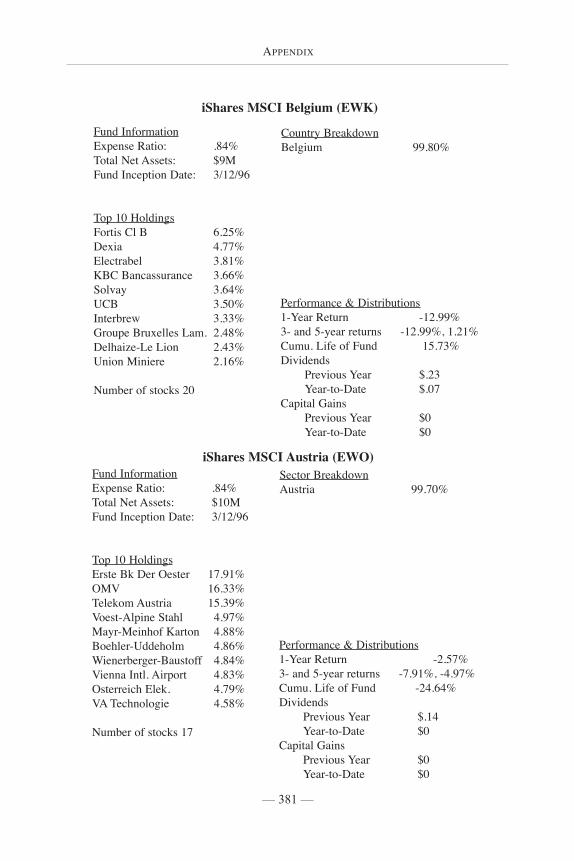
APPENDIX
— 381 —
iShares MSCI Belgium (EWK)
Fund InformationExpense Ratio: .84%Total Net Assets: $9MFund Inception Date: 3/12/96
Top 10 HoldingsFortis Cl B 6.25%Dexia 4.77%Electrabel 3.81%KBC Bancassurance 3.66%Solvay 3.64%UCB 3.50%Interbrew 3.33%Groupe Bruxelles Lam. 2.48%Delhaize-Le Lion 2.43%Union Miniere 2.16%
Number of stocks 20
Country BreakdownBelgium 99.80%
Performance & Distributions1-Year Return -12.99%3- and 5-year returns -12.99%, 1.21%Cumu. Life of Fund 15.73%Dividends
Previous Year $.23Year-to-Date $.07
Capital GainsPrevious Year $0Year-to-Date $0
iShares MSCI Austria (EWO)Fund InformationExpense Ratio: .84%Total Net Assets: $10MFund Inception Date: 3/12/96
Top 10 HoldingsErste Bk Der Oester 17.91%OMV 16.33%Telekom Austria 15.39%Voest-Alpine Stahl 4.97%Mayr-Meinhof Karton 4.88%Boehler-Uddeholm 4.86%Wienerberger-Baustoff 4.84%Vienna Intl. Airport 4.83%Osterreich Elek. 4.79%VA Technologie 4.58%
Number of stocks 17
Sector BreakdownAustria 99.70%
Performance & Distributions1-Year Return -2.57%3- and 5-year returns -7.91%, -4.97%Cumu. Life of Fund -24.64%Dividends
Previous Year $.14Year-to-Date $0
Capital GainsPrevious Year $0Year-to-Date $0
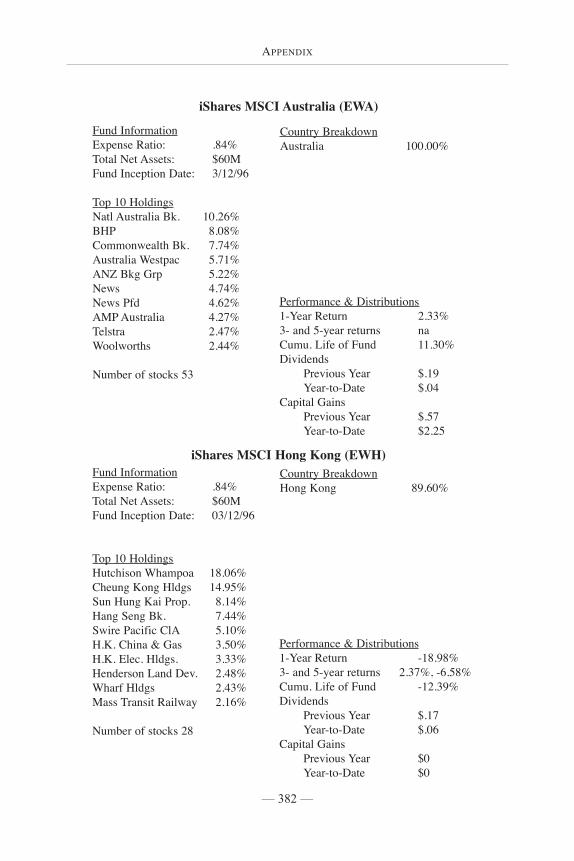
APPENDIX
— 382 —
iShares MSCI Australia (EWA)
Fund InformationExpense Ratio: .84%Total Net Assets: $60MFund Inception Date: 3/12/96
Top 10 HoldingsNatl Australia Bk. 10.26%BHP 8.08%Commonwealth Bk. 7.74%Australia Westpac 5.71%ANZ Bkg Grp 5.22%News 4.74%News Pfd 4.62%AMP Australia 4.27%Telstra 2.47%Woolworths 2.44%
Number of stocks 53
Country BreakdownAustralia 100.00%
Performance & Distributions1-Year Return 2.33%3- and 5-year returns naCumu. Life of Fund 11.30%Dividends
Previous Year $.19Year-to-Date $.04
Capital GainsPrevious Year $.57Year-to-Date $2.25
iShares MSCI Hong Kong (EWH)Fund InformationExpense Ratio: .84%Total Net Assets: $60MFund Inception Date: 03/12/96
Top 10 HoldingsHutchison Whampoa 18.06%Cheung Kong Hldgs 14.95%Sun Hung Kai Prop. 8.14%Hang Seng Bk. 7.44%Swire Pacific ClA 5.10%H.K. China & Gas 3.50%H.K. Elec. Hldgs. 3.33%Henderson Land Dev. 2.48%Wharf Hldgs 2.43%Mass Transit Railway 2.16%
Number of stocks 28
Country BreakdownHong Kong 89.60%
Performance & Distributions1-Year Return -18.98%3- and 5-year returns 2.37%, -6.58%Cumu. Life of Fund -12.39%Dividends
Previous Year $.17Year-to-Date $.06
Capital GainsPrevious Year $0Year-to-Date $0
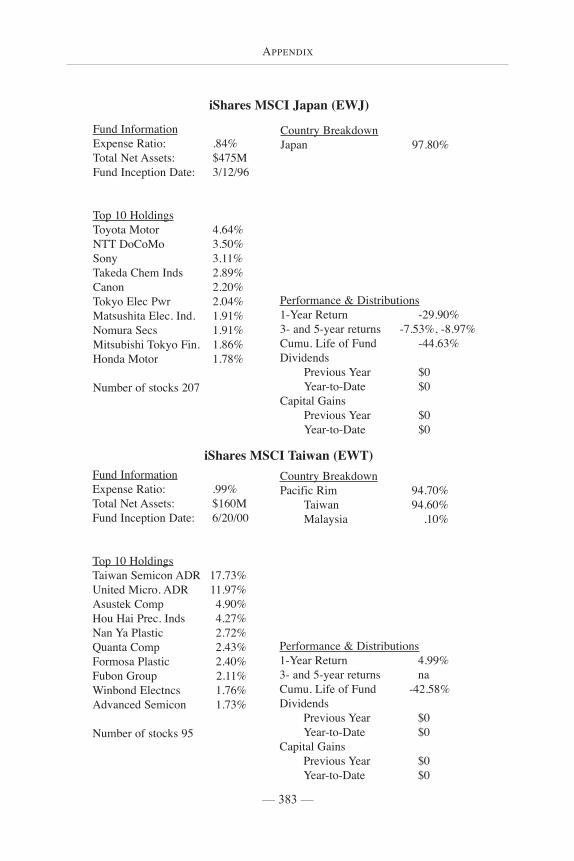
— 383 —
APPENDIX
iShares MSCI Japan (EWJ)
Fund InformationExpense Ratio: .84%Total Net Assets: $475MFund Inception Date: 3/12/96
Top 10 HoldingsToyota Motor 4.64%NTT DoCoMo 3.50%Sony 3.11%Takeda Chem Inds 2.89%Canon 2.20%Tokyo Elec Pwr 2.04%Matsushita Elec. Ind. 1.91%Nomura Secs 1.91%Mitsubishi Tokyo Fin. 1.86%Honda Motor 1.78%
Number of stocks 207
Country BreakdownJapan 97.80%
Performance & Distributions1-Year Return -29.90%3- and 5-year returns -7.53%, -8.97%Cumu. Life of Fund -44.63%Dividends
Previous Year $0Year-to-Date $0
Capital GainsPrevious Year $0Year-to-Date $0
iShares MSCI Taiwan (EWT)Fund InformationExpense Ratio: .99%Total Net Assets: $160MFund Inception Date: 6/20/00
Top 10 HoldingsTaiwan Semicon ADR 17.73%United Micro. ADR 11.97%Asustek Comp 4.90%Hou Hai Prec. Inds 4.27%Nan Ya Plastic 2.72%Quanta Comp 2.43%Formosa Plastic 2.40%Fubon Group 2.11%Winbond Electncs 1.76%Advanced Semicon 1.73%
Number of stocks 95
Country BreakdownPacific Rim 94.70%
Taiwan 94.60%Malaysia .10%
Performance & Distributions1-Year Return 4.99%3- and 5-year returns naCumu. Life of Fund -42.58%Dividends
Previous Year $0Year-to-Date $0
Capital GainsPrevious Year $0Year-to-Date $0
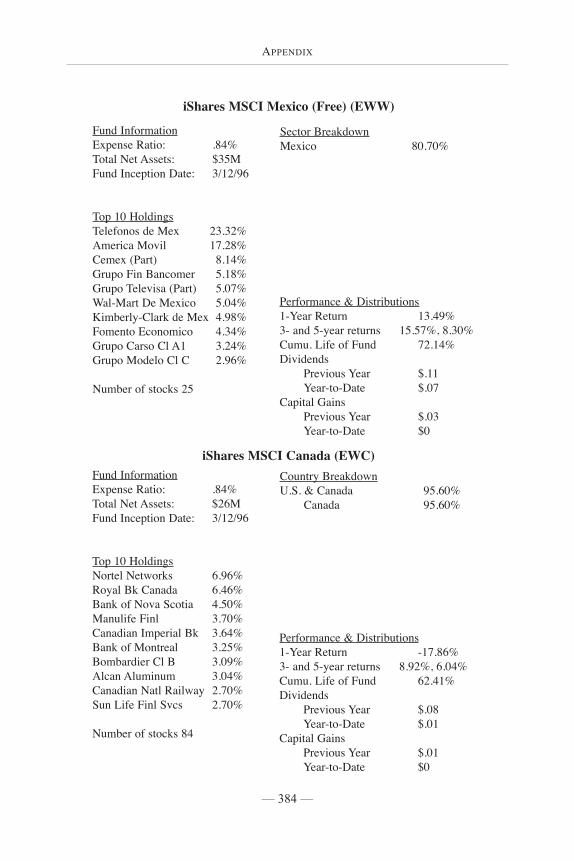
— 384 —
APPENDIX
iShares MSCI Mexico (Free) (EWW)
Fund InformationExpense Ratio: .84%Total Net Assets: $35MFund Inception Date: 3/12/96
Top 10 HoldingsTelefonos de Mex 23.32%America Movil 17.28%Cemex (Part) 8.14%Grupo Fin Bancomer 5.18%Grupo Televisa (Part) 5.07%Wal-Mart De Mexico 5.04%Kimberly-Clark de Mex 4.98%Fomento Economico 4.34%Grupo Carso Cl A1 3.24%Grupo Modelo Cl C 2.96%
Number of stocks 25
Sector BreakdownMexico 80.70%
Performance & Distributions1-Year Return 13.49%3- and 5-year returns 15.57%, 8.30%Cumu. Life of Fund 72.14%Dividends
Previous Year $.11Year-to-Date $.07
Capital GainsPrevious Year $.03Year-to-Date $0
iShares MSCI Canada (EWC)Fund InformationExpense Ratio: .84%Total Net Assets: $26MFund Inception Date: 3/12/96
Top 10 HoldingsNortel Networks 6.96%Royal Bk Canada 6.46%Bank of Nova Scotia 4.50%Manulife Finl 3.70%Canadian Imperial Bk 3.64%Bank of Montreal 3.25%Bombardier Cl B 3.09%Alcan Aluminum 3.04%Canadian Natl Railway 2.70%Sun Life Finl Svcs 2.70%
Number of stocks 84
Country BreakdownU.S. & Canada 95.60%
Canada 95.60%
Performance & Distributions1-Year Return -17.86%3- and 5-year returns 8.92%, 6.04%Cumu. Life of Fund 62.41%Dividends
Previous Year $.08Year-to-Date $.01
Capital GainsPrevious Year $.01Year-to-Date $0
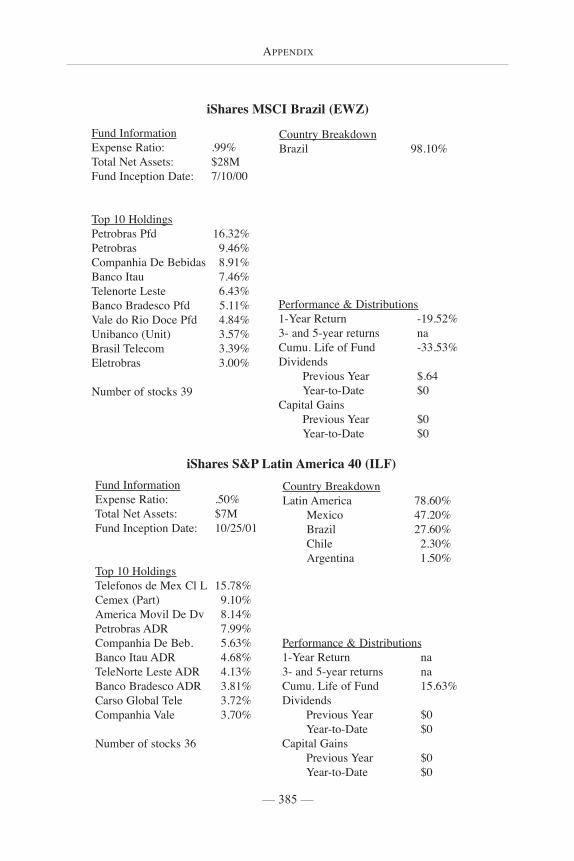
APPENDIX
— 385 —
iShares MSCI Brazil (EWZ)
Fund InformationExpense Ratio: .99%Total Net Assets: $28MFund Inception Date: 7/10/00
Top 10 HoldingsPetrobras Pfd 16.32%Petrobras 9.46%Companhia De Bebidas 8.91%Banco Itau 7.46%Telenorte Leste 6.43%Banco Bradesco Pfd 5.11%Vale do Rio Doce Pfd 4.84%Unibanco (Unit) 3.57%Brasil Telecom 3.39%Eletrobras 3.00%
Number of stocks 39
Country BreakdownBrazil 98.10%
Performance & Distributions1-Year Return -19.52%3- and 5-year returns naCumu. Life of Fund -33.53%Dividends
Previous Year $.64Year-to-Date $0
Capital GainsPrevious Year $0Year-to-Date $0
iShares S&P Latin America 40 (ILF)Fund InformationExpense Ratio: .50%Total Net Assets: $7MFund Inception Date: 10/25/01
Top 10 HoldingsTelefonos de Mex Cl L 15.78%Cemex (Part) 9.10%America Movil De Dv 8.14%Petrobras ADR 7.99%Companhia De Beb. 5.63%Banco Itau ADR 4.68%TeleNorte Leste ADR 4.13%Banco Bradesco ADR 3.81%Carso Global Tele 3.72%Companhia Vale 3.70%
Number of stocks 36
Country BreakdownLatin America 78.60%
Mexico 47.20%Brazil 27.60%Chile 2.30%Argentina 1.50%
Performance & Distributions1-Year Return na3- and 5-year returns naCumu. Life of Fund 15.63%Dividends
Previous Year $0Year-to-Date $0
Capital GainsPrevious Year $0Year-to-Date $0
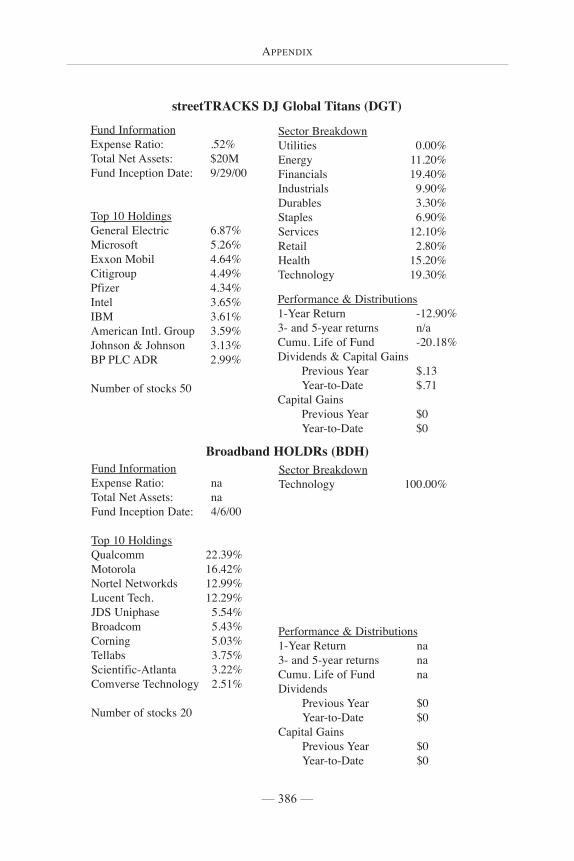
APPENDIX
— 386 —
Broadband HOLDRs (BDH)Fund InformationExpense Ratio: naTotal Net Assets: naFund Inception Date: 4/6/00
Top 10 HoldingsQualcomm 22.39%Motorola 16.42%Nortel Networkds 12.99%Lucent Tech. 12.29%JDS Uniphase 5.54%Broadcom 5.43%Corning 5.03%Tellabs 3.75%Scientific-Atlanta 3.22%Comverse Technology 2.51%
Number of stocks 20
Sector BreakdownTechnology 100.00%
Performance & Distributions1-Year Return na3- and 5-year returns naCumu. Life of Fund naDividends
Previous Year $0Year-to-Date $0
Capital GainsPrevious Year $0Year-to-Date $0
streetTRACKS DJ Global Titans (DGT)
Fund InformationExpense Ratio: .52%Total Net Assets: $20MFund Inception Date: 9/29/00
Top 10 HoldingsGeneral Electric 6.87%Microsoft 5.26%Exxon Mobil 4.64%Citigroup 4.49%Pfizer 4.34%Intel 3.65%IBM 3.61%American Intl. Group 3.59%Johnson & Johnson 3.13%BP PLC ADR 2.99%
Number of stocks 50
Sector BreakdownUtilities 0.00%Energy 11.20%Financials 19.40%Industrials 9.90%Durables 3.30%Staples 6.90%Services 12.10%Retail 2.80%Health 15.20%Technology 19.30%
Performance & Distributions1-Year Return -12.90%3- and 5-year returns n/aCumu. Life of Fund -20.18%Dividends & Capital Gains
Previous Year $.13Year-to-Date $.71
Capital GainsPrevious Year $0Year-to-Date $0
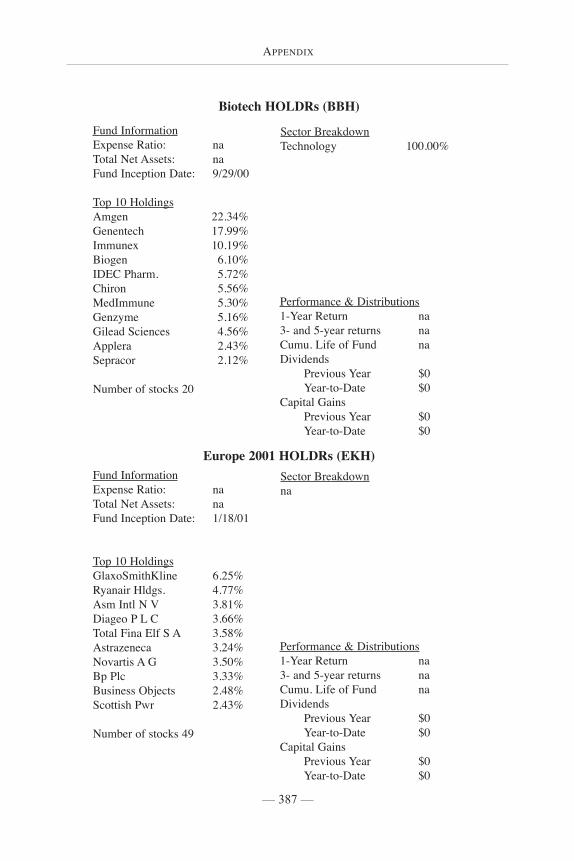
APPENDIX
— 387 —
Biotech HOLDRs (BBH)
Fund InformationExpense Ratio: naTotal Net Assets: naFund Inception Date: 9/29/00
Top 10 HoldingsAmgen 22.34%Genentech 17.99%Immunex 10.19%Biogen 6.10%IDEC Pharm. 5.72%Chiron 5.56%MedImmune 5.30%Genzyme 5.16%Gilead Sciences 4.56%Applera 2.43%Sepracor 2.12%
Number of stocks 20
Sector BreakdownTechnology 100.00%
Performance & Distributions1-Year Return na3- and 5-year returns naCumu. Life of Fund naDividends
Previous Year $0Year-to-Date $0
Capital GainsPrevious Year $0Year-to-Date $0
Europe 2001 HOLDRs (EKH)Fund InformationExpense Ratio: naTotal Net Assets: naFund Inception Date: 1/18/01
Top 10 HoldingsGlaxoSmithKline 6.25%Ryanair Hldgs. 4.77%Asm Intl N V 3.81%Diageo P L C 3.66%Total Fina Elf S A 3.58%Astrazeneca 3.24%Novartis A G 3.50%Bp Plc 3.33%Business Objects 2.48%Scottish Pwr 2.43%
Number of stocks 49
Sector Breakdownna
Performance & Distributions1-Year Return na3- and 5-year returns naCumu. Life of Fund naDividends
Previous Year $0Year-to-Date $0
Capital GainsPrevious Year $0Year-to-Date $0
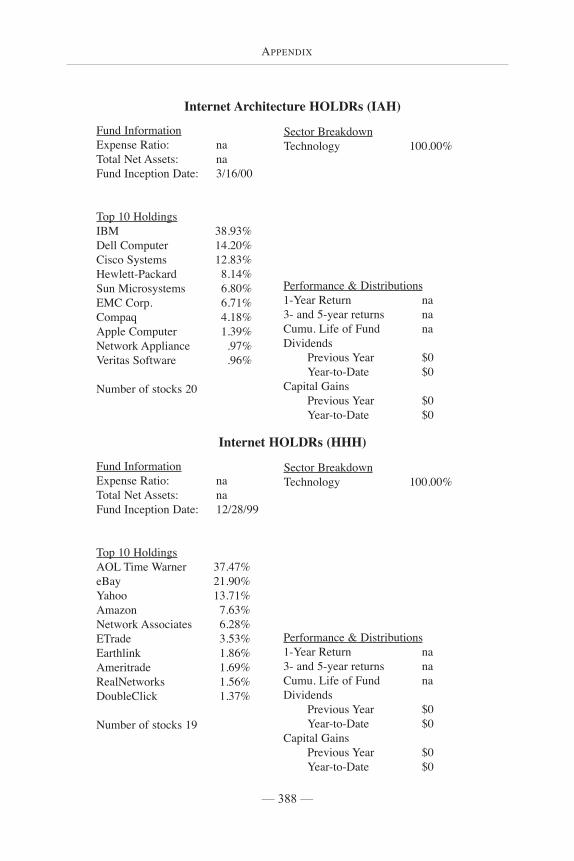
APPENDIX
— 388 —
Internet Architecture HOLDRs (IAH)
Fund InformationExpense Ratio: naTotal Net Assets: naFund Inception Date: 3/16/00
Top 10 HoldingsIBM 38.93%Dell Computer 14.20%Cisco Systems 12.83%Hewlett-Packard 8.14%Sun Microsystems 6.80%EMC Corp. 6.71%Compaq 4.18%Apple Computer 1.39%Network Appliance .97%Veritas Software .96%
Number of stocks 20
Sector BreakdownTechnology 100.00%
Performance & Distributions1-Year Return na3- and 5-year returns naCumu. Life of Fund naDividends
Previous Year $0Year-to-Date $0
Capital GainsPrevious Year $0Year-to-Date $0
Internet HOLDRs (HHH)
Fund InformationExpense Ratio: naTotal Net Assets: naFund Inception Date: 12/28/99
Top 10 HoldingsAOL Time Warner 37.47%eBay 21.90%Yahoo 13.71%Amazon 7.63%Network Associates 6.28%ETrade 3.53%Earthlink 1.86%Ameritrade 1.69%RealNetworks 1.56%DoubleClick 1.37%
Number of stocks 19
Sector BreakdownTechnology 100.00%
Performance & Distributions1-Year Return na3- and 5-year returns naCumu. Life of Fund naDividends
Previous Year $0Year-to-Date $0
Capital GainsPrevious Year $0Year-to-Date $0
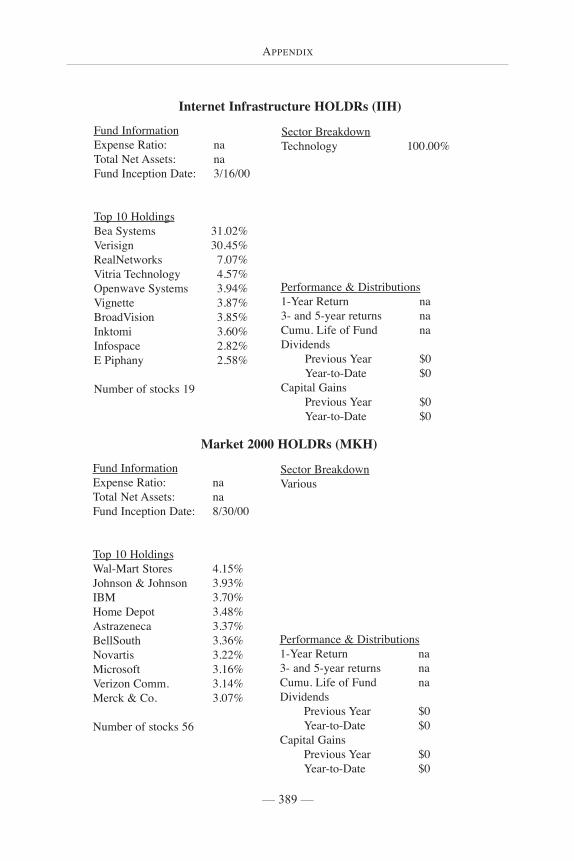
APPENDIX
— 389 —
Internet Infrastructure HOLDRs (IIH)
Fund InformationExpense Ratio: naTotal Net Assets: naFund Inception Date: 3/16/00
Top 10 HoldingsBea Systems 31.02%Verisign 30.45%RealNetworks 7.07%Vitria Technology 4.57%Openwave Systems 3.94%Vignette 3.87%BroadVision 3.85%Inktomi 3.60%Infospace 2.82%E Piphany 2.58%
Number of stocks 19
Sector BreakdownTechnology 100.00%
Performance & Distributions1-Year Return na3- and 5-year returns naCumu. Life of Fund naDividends
Previous Year $0Year-to-Date $0
Capital GainsPrevious Year $0Year-to-Date $0
Market 2000 HOLDRs (MKH)
Fund InformationExpense Ratio: naTotal Net Assets: naFund Inception Date: 8/30/00
Top 10 HoldingsWal-Mart Stores 4.15%Johnson & Johnson 3.93%IBM 3.70%Home Depot 3.48%Astrazeneca 3.37%BellSouth 3.36%Novartis 3.22%Microsoft 3.16%Verizon Comm. 3.14%Merck & Co. 3.07%
Number of stocks 56
Sector BreakdownVarious
Performance & Distributions1-Year Return na3- and 5-year returns naCumu. Life of Fund naDividends
Previous Year $0Year-to-Date $0
Capital GainsPrevious Year $0Year-to-Date $0
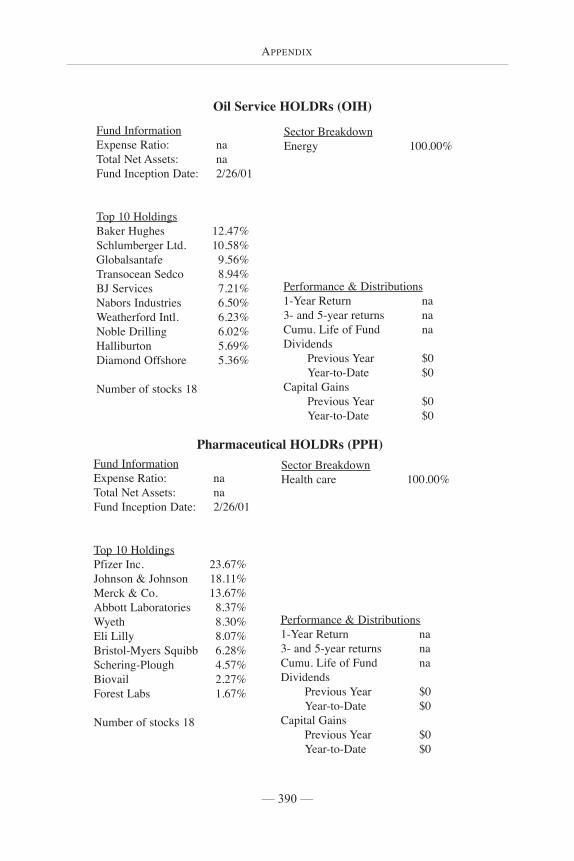
APPENDIX
— 390 —
Oil Service HOLDRs (OIH)
Fund InformationExpense Ratio: naTotal Net Assets: naFund Inception Date: 2/26/01
Top 10 HoldingsBaker Hughes 12.47%Schlumberger Ltd. 10.58%Globalsantafe 9.56%Transocean Sedco 8.94%BJ Services 7.21%Nabors Industries 6.50%Weatherford Intl. 6.23%Noble Drilling 6.02%Halliburton 5.69%Diamond Offshore 5.36%
Number of stocks 18
Sector BreakdownEnergy 100.00%
Performance & Distributions1-Year Return na3- and 5-year returns naCumu. Life of Fund naDividends
Previous Year $0Year-to-Date $0
Capital GainsPrevious Year $0Year-to-Date $0
Pharmaceutical HOLDRs (PPH)Fund InformationExpense Ratio: naTotal Net Assets: naFund Inception Date: 2/26/01
Top 10 HoldingsPfizer Inc. 23.67%Johnson & Johnson 18.11%Merck & Co. 13.67%Abbott Laboratories 8.37%Wyeth 8.30%Eli Lilly 8.07%Bristol-Myers Squibb 6.28%Schering-Plough 4.57%Biovail 2.27%Forest Labs 1.67%
Number of stocks 18
Sector BreakdownHealth care 100.00%
Performance & Distributions1-Year Return na3- and 5-year returns naCumu. Life of Fund naDividends
Previous Year $0Year-to-Date $0
Capital GainsPrevious Year $0Year-to-Date $0
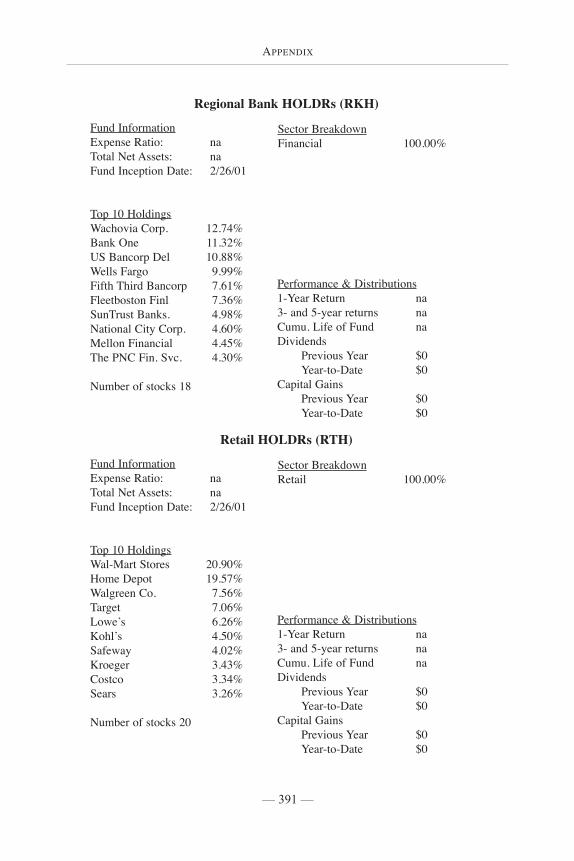
APPENDIX
— 391 —
Regional Bank HOLDRs (RKH)
Fund InformationExpense Ratio: naTotal Net Assets: naFund Inception Date: 2/26/01
Top 10 HoldingsWachovia Corp. 12.74%Bank One 11.32%US Bancorp Del 10.88%Wells Fargo 9.99%Fifth Third Bancorp 7.61%Fleetboston Finl 7.36%SunTrust Banks. 4.98%National City Corp. 4.60%Mellon Financial 4.45%The PNC Fin. Svc. 4.30%
Number of stocks 18
Sector BreakdownFinancial 100.00%
Performance & Distributions1-Year Return na3- and 5-year returns naCumu. Life of Fund naDividends
Previous Year $0Year-to-Date $0
Capital GainsPrevious Year $0Year-to-Date $0
Retail HOLDRs (RTH)
Fund InformationExpense Ratio: naTotal Net Assets: naFund Inception Date: 2/26/01
Top 10 HoldingsWal-Mart Stores 20.90%Home Depot 19.57%Walgreen Co. 7.56%Target 7.06%Lowe’s 6.26%Kohl’s 4.50%Safeway 4.02%Kroeger 3.43%Costco 3.34%Sears 3.26%
Number of stocks 20
Sector BreakdownRetail 100.00%
Performance & Distributions1-Year Return na3- and 5-year returns naCumu. Life of Fund naDividends
Previous Year $0Year-to-Date $0
Capital GainsPrevious Year $0Year-to-Date $0
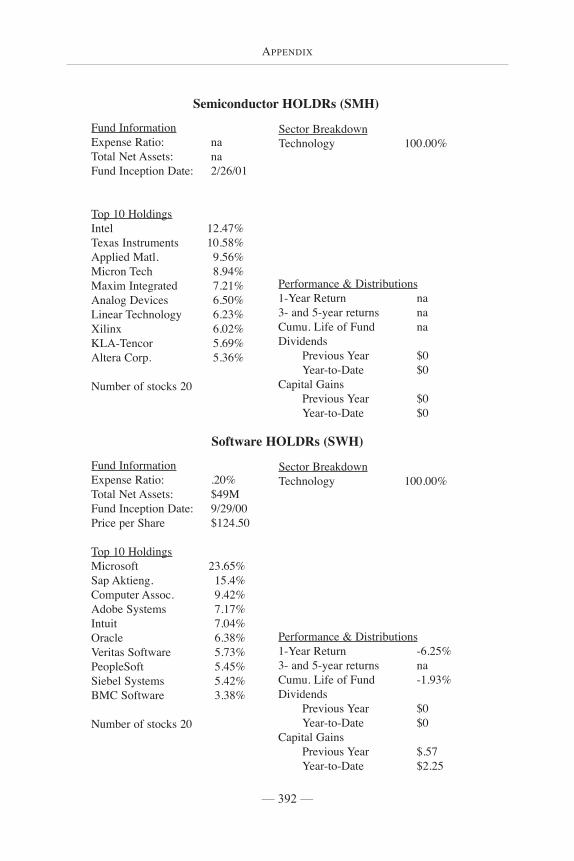
APPENDIX
— 392 —
Semiconductor HOLDRs (SMH)
Fund InformationExpense Ratio: naTotal Net Assets: naFund Inception Date: 2/26/01
Top 10 HoldingsIntel 12.47%Texas Instruments 10.58%Applied Matl. 9.56%Micron Tech 8.94%Maxim Integrated 7.21%Analog Devices 6.50%Linear Technology 6.23%Xilinx 6.02%KLA-Tencor 5.69%Altera Corp. 5.36%
Number of stocks 20
Sector BreakdownTechnology 100.00%
Performance & Distributions1-Year Return na3- and 5-year returns naCumu. Life of Fund naDividends
Previous Year $0Year-to-Date $0
Capital GainsPrevious Year $0Year-to-Date $0
Software HOLDRs (SWH)
Fund InformationExpense Ratio: .20%Total Net Assets: $49MFund Inception Date: 9/29/00Price per Share $124.50
Top 10 HoldingsMicrosoft 23.65%Sap Aktieng. 15.4%Computer Assoc. 9.42%Adobe Systems 7.17%Intuit 7.04%Oracle 6.38%Veritas Software 5.73%PeopleSoft 5.45%Siebel Systems 5.42%BMC Software 3.38%
Number of stocks 20
Sector BreakdownTechnology 100.00%
Performance & Distributions1-Year Return -6.25%3- and 5-year returns naCumu. Life of Fund -1.93%Dividends
Previous Year $0Year-to-Date $0
Capital GainsPrevious Year $.57Year-to-Date $2.25
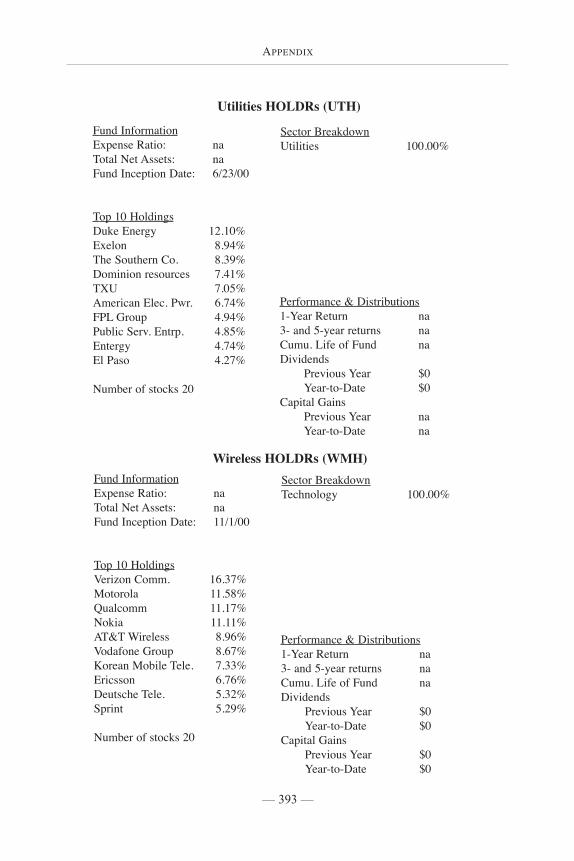
APPENDIX
— 393 —
Utilities HOLDRs (UTH)
Fund InformationExpense Ratio: naTotal Net Assets: naFund Inception Date: 6/23/00
Top 10 HoldingsDuke Energy 12.10%Exelon 8.94%The Southern Co. 8.39%Dominion resources 7.41%TXU 7.05%American Elec. Pwr. 6.74%FPL Group 4.94%Public Serv. Entrp. 4.85%Entergy 4.74%El Paso 4.27%
Number of stocks 20
Sector BreakdownUtilities 100.00%
Performance & Distributions1-Year Return na3- and 5-year returns naCumu. Life of Fund naDividends
Previous Year $0Year-to-Date $0
Capital GainsPrevious Year naYear-to-Date na
Wireless HOLDRs (WMH)Fund InformationExpense Ratio: naTotal Net Assets: naFund Inception Date: 11/1/00
Top 10 HoldingsVerizon Comm. 16.37%Motorola 11.58%Qualcomm 11.17%Nokia 11.11%AT&T Wireless 8.96%Vodafone Group 8.67%Korean Mobile Tele. 7.33%Ericsson 6.76%Deutsche Tele. 5.32%Sprint 5.29%
Number of stocks 20
Sector BreakdownTechnology 100.00%
Performance & Distributions1-Year Return na3- and 5-year returns naCumu. Life of Fund naDividends
Previous Year $0Year-to-Date $0
Capital GainsPrevious Year $0Year-to-Date $0
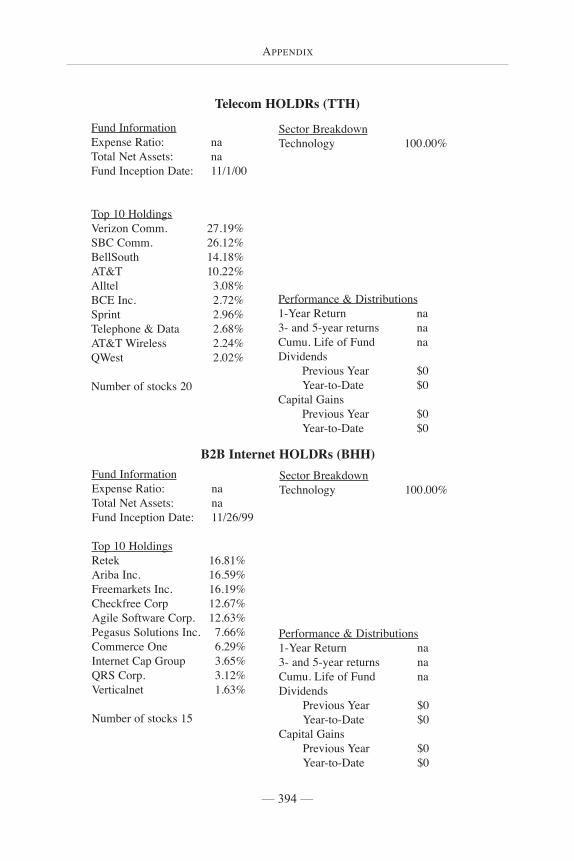
APPENDIX
— 394 —
Telecom HOLDRs (TTH)
Fund InformationExpense Ratio: naTotal Net Assets: naFund Inception Date: 11/1/00
Top 10 HoldingsVerizon Comm. 27.19%SBC Comm. 26.12%BellSouth 14.18%AT&T 10.22%Alltel 3.08%BCE Inc. 2.72%Sprint 2.96%Telephone & Data 2.68%AT&T Wireless 2.24%QWest 2.02%
Number of stocks 20
Sector BreakdownTechnology 100.00%
Performance & Distributions1-Year Return na3- and 5-year returns naCumu. Life of Fund naDividends
Previous Year $0Year-to-Date $0
Capital GainsPrevious Year $0Year-to-Date $0
B2B Internet HOLDRs (BHH)Fund InformationExpense Ratio: naTotal Net Assets: naFund Inception Date: 11/26/99
Top 10 HoldingsRetek 16.81%Ariba Inc. 16.59%Freemarkets Inc. 16.19%Checkfree Corp 12.67%Agile Software Corp. 12.63%Pegasus Solutions Inc. 7.66%Commerce One 6.29%Internet Cap Group 3.65%QRS Corp. 3.12%Verticalnet 1.63%
Number of stocks 15
Sector BreakdownTechnology 100.00%
Performance & Distributions1-Year Return na3- and 5-year returns naCumu. Life of Fund naDividends
Previous Year $0Year-to-Date $0
Capital GainsPrevious Year $0Year-to-Date $0
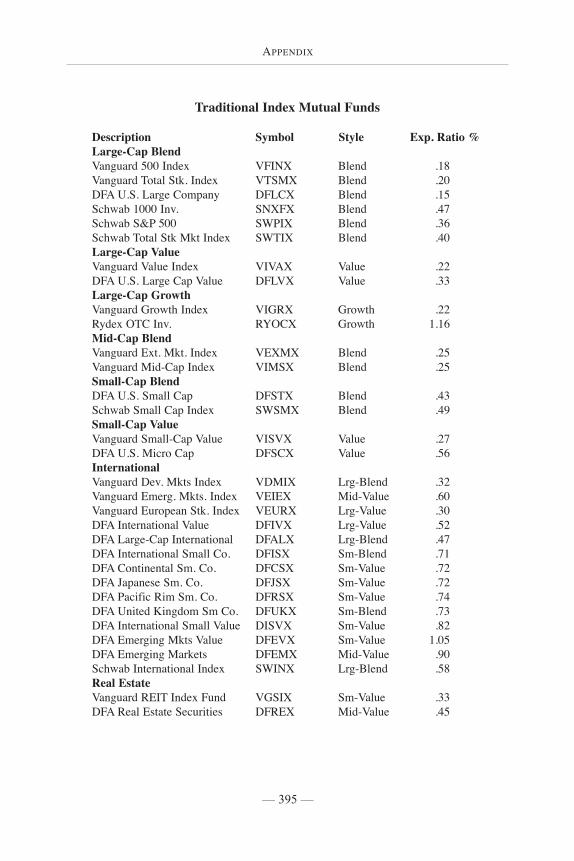
APPENDIX
— 395 —
Traditional Index Mutual Funds
Description Symbol Style Exp. Ratio %Large-Cap BlendVanguard 500 Index VFINX Blend .18Vanguard Total Stk. Index VTSMX Blend .20DFA U.S. Large Company DFLCX Blend .15Schwab 1000 Inv. SNXFX Blend .47Schwab S&P 500 SWPIX Blend .36Schwab Total Stk Mkt Index SWTIX Blend .40Large-Cap ValueVanguard Value Index VIVAX Value .22DFA U.S. Large Cap Value DFLVX Value .33Large-Cap GrowthVanguard Growth Index VIGRX Growth .22Rydex OTC Inv. RYOCX Growth 1.16Mid-Cap BlendVanguard Ext. Mkt. Index VEXMX Blend .25Vanguard Mid-Cap Index VIMSX Blend .25Small-Cap BlendDFA U.S. Small Cap DFSTX Blend .43Schwab Small Cap Index SWSMX Blend .49Small-Cap ValueVanguard Small-Cap Value VISVX Value .27DFA U.S. Micro Cap DFSCX Value .56InternationalVanguard Dev. Mkts Index VDMIX Lrg-Blend .32Vanguard Emerg. Mkts. Index VEIEX Mid-Value .60Vanguard European Stk. Index VEURX Lrg-Value .30DFA International Value DFIVX Lrg-Value .52DFA Large-Cap International DFALX Lrg-Blend .47DFA International Small Co. DFISX Sm-Blend .71DFA Continental Sm. Co. DFCSX Sm-Value .72DFA Japanese Sm. Co. DFJSX Sm-Value .72DFA Pacific Rim Sm. Co. DFRSX Sm-Value .74DFA United Kingdom Sm Co. DFUKX Sm-Blend .73DFA International Small Value DISVX Sm-Value .82DFA Emerging Mkts Value DFEVX Sm-Value 1.05DFA Emerging Markets DFEMX Mid-Value .90Schwab International Index SWINX Lrg-Blend .58Real EstateVanguard REIT Index Fund VGSIX Sm-Value .33DFA Real Estate Securities DFREX Mid-Value .45

APPENDIX
— 396 —
Traditional Index Mutual FundsDescription Symbol Style Exp. Ratio %Fixed IncomeVanguard S/T Bond Index VBISX Short-term .21DFA One-Year Fixed Income DFIHX Short-term .20DFA Two-Year Global Fixed DFGFX Short-term .27DFA Five-Year Govt. DFFGX Intermediate .28DFA Intermediate Govt. F.I. DFIGX Intermediate .18Vanguard L/T Bond Index VBLTX Long-term .21Vanguard Total Bond Index VBMFX Intermediate .22
GLOSSARY
— 397 —
accrued interest—the amount of interest to be paid the buyer of a bondon a purchase completed between interest payment dates. Accruedinterest is effectively returned as the investor receives the full couponpayment.
active manager—a portfolio manager who takes an active role in anyaspect of the investment process, including asset allocation, styleexposures, security selection, and risk management in an attempt tooutperform a given benchmark index.
affluent—financially-speaking, this refers to someone with a net worthbetween $2.5 million to $3 million, or more. Your annual income istypically greater than $250,000.
after-tax return—the return from an investment after all income taxeshave been deducted.
agency debt—obligations issued by an agency of the U.S. governmentand benefiting from government credit. In the U.S., debt of certainformer agencies such as Fannie Mae and Freddie Mac is still referred toas agency debt because it retains implied government support.
alpha—a measure of the incremental return generated from activeportfolio management.
american stock exchange —a stock exchange. Companies that trade onthe AMEX are generally smaller than those traded on the New YorkStock exchange. The AMEX is the principal listing exchange for ETFs.
Glossary
GLOSSARY
— 398 —
annualized rate of return—the average return over a stated number ofyears, taking into account the effect of compounding.
asset allocation—the process of dividing up your money into variousasset classes. Also referred to as your portfolio mix.
asset class—a group of securities with similar characteristics (e.g.,stocks). Asset classes can be divided into sub-groups. For example, large-cap value stocks or small-cap foreign stocks are also considered assetclasses.
asset-class investing—also referred to as indexing, this is the practice ofinvesting in asset classes, as opposed to buying individual securitieswithin an asset class. Asset-class investors will typically buy an entireasset class (i.e., all small-cap growth stocks) rather than selectingindividual securities within the asset class.
average maturity—for a bond portfolio, the average of the statedmaturity dates of the fixed-income securities held. In general, the longerthe average maturity, the greater the portfolio's sensitivity to interest-ratechanges, which means greater price fluctuation.
basis point—a basis point is one one-hundredth of a percent (1/100% or.01%). Yield differences between fixed-income securities are stated inbasis points. (For example, the difference between a bond yielding 5.0%and one yielding 5.15% is 15 basis points.)
bear market—a declining market. In stocks this refers to a drop of 20%or more of a major market index.
benchmark—typically an index or some standard that is used as aperformance comparison for portfolio managers.
beta—a measure of the variability of an investment’s return in relation tothe S&P 500 Index. Securities with betas higher than 1.0 have been, andare expected to be, more volatile than the S&P. Securities with betaslower than 1.0 have been, and are expected to be, less volatile than theS&P.
bid-ask spread—the difference between what a buyer is willing to bid(pay) for a security and the seller's ask (offer) price.
blue chip—a common stock that has had good earnings growth for manyyears.
GLOSSARY
— 399 —
bond—an IOU from a municipality, local government, corporation orfederal government. You lend them money and they agree to pay you afixed interest rate for a specified period of time.
book value—the net worth, or liquidation value, of a business.Calculated by subtracting from total assets all liabilities, including debtand preferred stocks, and dividing by the number of shares of commonstock outstanding.
bottom-up approach—an investment strategy that emphasizes findingoutstanding individual companies before considering broad economictrends.
broad-based index—an index designed to reflect the movement of theentire market or all stocks in a specific capitalization range.
bull market—a rising market (typically for several years or more).
buy-and-hold investment strategy—a strategy whereby you buysecurities and hold them for the long term.
callable bond—callable bonds are redeemable by the issuer prior to thestated maturity date. A call date and price are specified. Bonds arelikely to be called if interest rates drop.
call risk—the possibility that callable bonds will be redeemed prior tomaturity.
capital gain (or loss)—profit (or loss) resulting from the sale of asecurity. If the security is sold and the holding period is less than oneyear this will be a short-term capital gain (or loss). If it is held for morethan one year, it will be considered long term.
capital gains distribution—a distribution (payment) you receive from amutual fund or other investment company when it makes a profit fromselling a security. Capital gains are typically distributed at the end of theyear.
capitalization—the total stock market valuation of a company.
cash equivalents—short-term securities like money market accounts,Treasury bills and to a lesser extent, bond funds with maturities of twoyears or less. These investments can easily be converted to cash andtheir values are relatively stable.
GLOSSARY
— 400 —
certificate of deposit (CD)—an investment typically made with a bank.You loan the bank a certain amount of money for a specified period oftime, and in return you receive a fixed rate of interest for your loan.
common stock—ownership interest (shares) in a company.
compounding—the growth that comes from investment income andgains on both the original principal and the previously reinvested incomeand capital gains of an investment.
contrarian investing—an investing technique that ignores market trendsby buying securities that are considered by the investor to beundervalued and out of favor.
corporate bonds—debt obligations issued by private or publiccompanies to raise funds for a variety of corporate purposes, such asbuilding a new facility, purchasing equipment, or expanding the business.
correction—a relatively short-term drop in stock prices, usually definedas a decline of 10% or more from the market's high.
cost basis—the original cost of an investment, used in determiningcapital gains. Cost basis is usually the purchase price including all fees.
coupon—usually refers to a bond’s stated interest rate based on facevalue. Coupons are generally paid every six months.
creation unit—the minimum module for issue or redemption of sharesin an open exchange-traded fund (ETF), usually between 25,000 and300,000 fund shares, depending on the fund's policy. Existing ETFs issuetheir shares in return for portfolio deposits of securities in multiples ofthe creation unit basket specified by the fund's advisor.
credit quality—a measure of a bond issuer's ability to repay interest andprincipal in a timely manner.
credit rating—an evaluation of the creditworthiness of a debt securityby an independent rating service.
credit risk—the potential for default by an issuer on its obligation to payinterest or principal on debt securities. Most U.S. government securitiesare considered to have very little credit risk.
cumulative total return—the actual performance of an investment overa stated period of time.
GLOSSARY
— 401 —
currency risk—the risk of fluctuation (appreciation or depreciation) inthe value of an investment (international stocks or bonds) versus theU.S. dollar. U.S.-based investors have currency risk when purchasingforeign stocks or bonds.
current yield—the rate of actual cash flow as a percentage of thepurchase price. It is calculated by dividing the annual interest dollarsreceived on the bond by its purchase price.
custodian—the bank, trust or brokerage firm that holds your assets.
default—failure to pay principal or interest promptly when due.
Diamonds—an exchange-traded fund product that seeks to mimic thedividend and price of the Dow Jones Industrial Average. It comprisesthe 30 companies in the Dow Jones Industrials.
direct rollover—a distribution from a qualified plan or IRA account thatis sent directly to the custodian of an IRA account and is reported to theIRS as a rollover.
diversification—allocating investments among many securities to lessenor spread risk. Also, the practice of including in a portfolio differenttypes of assets in order to minimize risk or improve performance.
dividend—a payment of cash or stock from a company's earnings toeach stockholder as declared by the company's board of directors.
Dow Jones Industrial Average—the most widely followed average ofthe performance of the stock market. However, because it is made up ofonly 30 large-cap, U.S.-based companies, it does not represent the totalstock market.
early withdrawal penalty—a penalty on money withdrawn early from afixed-term investment. For example, withdrawing from a tax-advantagedretirement plan before age 59 1/2 or cashing in a certificate of deposit(CD) before its maturity.
earnings per share—a measure of a company's financial performance,calculated by dividing a company's earnings by the number of commonshares outstanding. This is an important figure for investors who arelooking for stocks they consider to be undervalued in price.
efficient market—the theory that stock prices reflect all marketinformation that is known by all investors. Also states that investors
GLOSSARY
— 402 —
cannot beat the market because it is impossible to determine future stockprices.
equivalent taxable yield—the yield needed from a taxable bond to givethe same after-tax yield as a tax-exempt issue.
exchange-traded funds (ETFs)—an ETF is basically a hybrid. It’s sortof like an indexed, closed-end fund that trades throughout the day. Youpurchase ETFs on the American Stock Exchange (not through a fundcompany) and you pay normal brokerage commissions to do so. Whatyou’re buying is a fund designed to track a certain index or sector. Inthis way, ETFs are very similar to traditional index funds. As theiradvertisement states, they “act like index funds but trade like stocks.”
expense ratio—for mutual funds, ETFs or unit investment trusts, thisrefers to the percentage of the investment’s assets that are used to pay forexpenses (e.g., management fees, 12b-1 fees, administrative fees).
Federal Home Loan Mortgage Corporation (FHLMC)—agovernment organization designed to create and maintain a secondarymarket for conventional home mortgages. The FHLMC buys and poolsmortgages from federally insured financial institutions and sells them asmortgage-backed securities called “Freddie Macs.”
Federal National Mortgage Association “Fannie Mae”—agovernment-sponsored private corporation authorized to purchase andsell mortgages and to facilitate the orderly operation of a secondarymarket for home mortgages.
fee-only compensation—an arrangement in which an investment advisorcharges a set hourly rate, or an agreed upon percentage of assets undermanagement to manage a portfolio.
first in, first out (FIFO)—a method for calculating taxable gain or losswhen an investment is sold. The FIFO method assumes that the firstshares sold were the first shares purchased.
fixed-income investments—typically refers to investments that pay outa certain rate of interest for a specified period of time.
fundamental analysis—the study of a company's business and financialcondition to help forecast future movements in its stock price. Analystsconsider the company's past record of earnings and sales as well as
GLOSSARY
— 403 —
company assets, management, and markets to predict trends that couldaffect a company's stock.
general obligation bond—a municipal bond that is backed by the fullfaith and credit of the issuer. These bonds are of higher quality thanbonds issued for specific projects but also provide lower returns.
global fund—a mutual fund that invests in stocks of companies in theUnited States and foreign countries.
good-till-canceled order—an order to buy or sell a security, usually at aspecified price, that remains in effect until the order is executed orcanceled.
Government National Mortgage Association (GNMA)—an agencywithin the U.S. Department of Housing and Urban Development thatbuys mortgages from lending institutions and pools them to formsecurities, known as “Ginny Maes,” which are then sold to investors.
growth investing—a style of equity investing that emphasizes stockswith above-average price-to-book ratios and sales and earnings growth,but below-average dividend yields.
hedge—to hedge is to offset investment risk in a particular security withanother investment or transaction in another market.
highest in, first out (HIFO)—a principle of tax efficiency in aconventional mutual fund or other security that defers taxes as much aspossible by selling the highest cost lot of a particular stock first and thenothers in sequence until the lowest cost lot is sold last.
high yield bonds—bonds that are rated below Baa (Moody’s), thelowest investment grade bond rating.
index—a group of securities considered a benchmark for performancefor professional money managers.
index fund—a passively managed mutual fund that seeks to parallel theperformance of a particular market index.
indexing—a low-cost investment strategy that seeks to match, ratherthan outperform, the return and risk characteristics of an index, byholding all securities that make up the index or a statisticallyrepresentative sample of the index. Also know as passive management.
GLOSSARY
— 404 —
index tracking—a reference to the correlation between a portfolio'sreturn and the return on a benchmark index, or, alternately, to theportfolio's tracking error relative to the index.
individual retirement account (IRA)—a tax-deferred retirementaccount into which an investor may contribute a portion of his or herearned income. Withdrawals before the investor reaches age 59 1/2 aregenerally subject to a 10% penalty tax imposed by the federalgovernment. Types of IRAs include the traditional IRA and Roth IRA.
inflation risk—the risk that the purchasing power of your dollars willdecline over time, due to inflation.
interest rate risk—the risk that a security or fund will decline in pricebecause of changes in market interest rates.
Investment Company Act of 1940—the federal law, enforced by theSecurities and Exchange Commission (SEC), that regulates the activitiesof investment companies.
investment grade—a bond whose credit quality is considered to beamong the highest by independent bond-rating agencies.
interest—compensation paid to a lender (investor) by the borrower(issuer of bonds) for the use of money. Interest is usually expressed asan annual percentage rate.
international fund—a mutual fund that invests in securities traded inmarkets outside of the United States. Foreign markets present additionalrisks, including currency fluctuation and political instability.
investment horizon—the length of time an investor expects to keep asum of money invested.
investment style—an investment style that emphasizes either stocks withgrowth or value characteristics, or a blend of these characteristics.
iShares—a type of exchange-traded funds (ETFs) managed by BarclaysGlobal Investors.
issuer—the issuer is the entity borrowing money through the issuance ofbonds.
junk bonds—lower-rated, higher-yielding bonds with a credit rating ofBB (S&P) or Ba (Moody’s) or lower.
GLOSSARY
— 405 —
large capitalization stocks—the stocks of companies whose marketvalue is typically more than $10 billion.
leverage—the act of borrowing on margin or using forward or futurescontracts to effectively invest more money than is on deposit with thecustodian. A leveraged fund will often trade at 2x your investment—your percentage return will be doubled (up or down).
limit order—an order to buy or sell a security at a specific price orbetter.
liquidity—the ability to easily turn assets into cash. An investor shouldbe able to sell a liquid asset quickly with little effect on the price.
long-term capital gain—a profit on the sale of an investment that hasbeen held for more than one year—generally taxed at 20%.
management company—the firm that organizes, manages, andadministers a fund.
margin account—a brokerage account that allows investors to buysecurities by borrowing a portion of the purchase price. Margin accountsare governed by the National Association of Securities Dealers (NASD),the New York Stock Exchange (NYSE), and the lending brokerage firm.
margin call—a brokerage firm's requirement that a customer depositenough money or securities to bring a margin account up to theminimum maintenance amount. If the customer fails to do so, accountholdings may be liquidated.
market capitalization—a determination of a company's value,calculated by multiplying the total number of company stock sharesoutstanding by the price per share. Also called capitalization.
market order—an order to buy or sell immediately at the best availableprice. Most orders executed on the exchanges are market orders.
market risk—the possibility that stock or bond prices will fluctuate.
market timing—an investment strategy based on predicting markettrends. The goal is to anticipate trends, buying before the market goes upand selling before the market goes down.
maturity (maturity date)—the maturity date is when the face amountof a security is returned to the investor. A bond issue can have multiple
GLOSSARY
— 406 —
maturities.
micro-capitalization stock—a stock with a median market capitalizationof approximately $75 million.
mid-capitalization stock—a “middle-sized” company. Mid capsgenerally have a median market capitalization between $2 and $7 billion.
money market fund—a type of mutual fund that invests in very short-term, fixed-income securities. A money market fund typically invests inT-bills or commercial paper with maturities of three months or less. It isconsidered a “safe” investment, and is usually used to park money thatyou will need in the near term.
Moody's Investors Service, Inc.—a company that independently ratesbonds covering the entire U.S. bond market.
mortgage-backed security—debt instruments that are guaranteed (orcollateralized) by residential, commercial, or industrial real-estatemortgages.
municipal bond—an IOU issued by a state, city, or other municipality tofinance public works such as the construction of roads or schools. Theinterest is usually free from federal income tax and may be free fromstate and local taxes as well.
mutual fund—an investment company that pools money from manyinvestors to buy securities.
NASDAQ—the National Association of Securities Dealers AutomatedQuotations. A computerized system for pricing securities of over-the-counter traded stocks.
Nasdaq Composite—launched in 1971, the composite represents all thestocks listed on the Nasdaq market.
net asset value (NAV)—the value (price) of a mutual fund share. TheNAV is calculated daily by taking the fund's total assets (securities, cash,and accrued earnings), subtracting the fund's liabilities, and dividing bythe number of shares outstanding.
net worth—your total assets minus your total liabilities.
New York Stock Exchange (NYSE)—the oldest stock exchange in theU.S.
GLOSSARY
— 407 —
Nikkei Index—an index of more than 200 leading stocks traded on theTokyo Stock Exchange. Like the Dow Jones Industrial Average, it ismade up of representative blue chip companies.
nominal return—the return on an investment before adjustment forinflation.
noncallable bond—a bond that cannot be redeemed prior to its statedmaturity.
open-end investment company—technically, a mutual fund thatconstantly offers new shares for sale.
operating expenses—the amount paid for asset maintenance or the costof doing business.
par value—the face value amount of a bond or note, which is payable atmaturity. The par value is the amount on which interest payments arecalculated.
passive investing—investing in a fund or other investment that attemptsto match the risk/return pattern of a market index.
portfolio allocation—the proportion of a portfolio's assets invested instocks, bonds and cash equivalents.
portfolio manager—a person (professional) who manages a portfolio ofsecurities.
portfolio mix—also known as asset allocation, this refers to thecombination of asset classes in your portfolio.
portfolio transaction costs—the expenses associated with buying andselling securities, including commissions, purchase and redemption fees,exchange fees, and other miscellaneous costs.
portfolio turnover—a measure that shows how frequently a portfolio istraded. A turnover of 100% would indicate that the entire portfolio isreplaced annually. The typical equity mutual fund has a turnover ratio ofabout 80%.
price/book ratio—the price per share of a stock divided by its bookvalue.
price/earnings ratio (P/E)—a stock’s price divided by its earnings forthe most recent year. Higher P/E ratios are typically seen in companies
GLOSSARY
— 408 —
that have strong growth potential.
real estate investment trust (REIT)—a company that manages a groupof real estate investments and distributes to its shareholders at least 95%of its net earnings annually. REITs often specialize in a particular kind ofproperty. They can, for example, invest in real estate such as officebuildings, shopping centers, or hotels.
real rate of return—the return on an investment after it is adjusted forinflation.
redemption fee—a fee charged by some mutual funds when an investorsells shares within a short period of time.
redemption price—the price at which a holder can sell (redeem) afund's shares, determined by deducting any applicable sales charge fromthe net asset value (NAV) per unit/share.
registered investment advisor—an investment professional who isregistered—but not endorsed—by the Securities and ExchangeCommission (SEC) and/or state, who may recommend certain types ofinvestment products.
replicating portfolio—a portfolio constructed to match the performanceof an index or benchmark almost exactly.
required minimum distribution (RMD)—the minimum amount thatthe IRS requires must be withdrawn each year from all tax-advantagedretirement plans starting in the calendar year following the year in whichthe planholder reaches age 70 1/2. Roth IRAs are excluded from this rule.
retail investor—private investors that typically purchase and sellsecurities in smaller quantities than institutional investors.
revenue bond—a municipal bond that is backed by the revenue from theproject being financed. Revenue bonds are less securely backed thangeneral obligation bonds, and thus may trade with higher yields.
risk—the potential to lose money. There are various risks inherent inowning stocks, for example—size, style and market risk.
risk-adjusted return—a measure of how much risk a portfolio hasassumed to earn its returns. Sharpe ratios and alphas are risk-adjustedreturn measurements.
GLOSSARY
— 409 —
rollover IRA—a tax-free rollover of one tax-deferred account intoanother.
sector—a group of stocks, often related to a particular industry, thathave certain shared characteristics.
sector fund—a concentrated fund that invests exclusively in a relatedgroup of industries. Sector funds are often more volatile than funds thatinvest in a more diversified group of industries.
Securities and Exchange Commission (SEC)—The federal agencycreated by the Securities and Exchange Act of 1934 that administers thelaws governing the securities markets. The SEC also regulates theregistration and distribution of unit investment trusts, exchange-tradedfund shares and mutual fund shares.
Securities Investor Protection Corporation (SIPC)—a nonprofitmembership corporation created under the Securities Investor ProtectionAct of 1970 to protect client accounts of brokerage firms that are forcedinto bankruptcy. The SIPC does not protect investors from market risk.
Select Sector SPDRs—an exchange-traded fund product line that begantrading on December 22, 1998 on the AMEX. There are nine SelectSector SPDR funds that offer diversification among the various sectorsthat make up the S&P 500. Each company of the S&P 500 is allocated toa different sector.
settlement date—the settlement date is the date on which thetransaction settles, and either securities or money is due. For manysecurities, the settlement day is typically the trade date plus 3 days.
share—a unit of ownership in a mutual fund or a unit of equityownership in a corporation, represented by a stock certificate naming thecompany and the shareholder.
Sharpe ratio—a measure of risk-adjusted return. To calculate a Sharperatio, an asset's excess returns (its return in excess of the returngenerated by risk-free assets such as Treasury bills) is divided by theasset's standard deviation.
short sale—the sale of a security not owned by the seller, in theexpectation that it will be possible to repurchase at a lower price sometime in the future.
GLOSSARY
— 410 —
short sale rule—a requirement imposed by the SEC requiring that shortsales can only be made on a plus tick or zero plus tick (a price higherthan the last sale at a different price).
short-term capital gain—a profit on the sale of an investment held forone year or less.
small-capitalization stock—stock of a company with a total marketvalue of under $2 billion.
specialist—a floor member of an exchange who accepts primaryresponsibility for making a fair market in securities at all times that theexchange is open for business.
spread—for stocks and bonds, the difference between the bid price andthe asked price.
Standard & Poor Depositary Receipts (SPDRs, commonly referred toas a Spiders)—exchange-traded funds designed to mirror the returns ofthe S&P 500 Composite Stock Index. Created as a unit investment trust,a Spider holds shares of all the companies in the S&P 500. Its objectiveis to track the price performance and dividend yield of the S&P 500.
Standard & Poor’s 500 Stock Index (S&P 500)—a widely followedindex of 500 large-cap companies in diversified industries. It accountsfor approximately 80% of the total value of the U.S. stock market. It isthe performance benchmark for most equity mutual funds.
Standard & Poor's MidCap 400 Index—a market-cap weightedbenchmark index made up of 400 securities in the mid-cap market.
Standard & Poor's SmallCap 600 Index—a small-capitalizationbenchmark index made up of 600 domestic stocks.
standard deviation—a measure of the degree to which an investment’sreturn varied from its average return over a certain period. The smallerthe difference, the lower the standard deviation, and the greater thedegree of stability.
stock—a security that represents part ownership, or equity, in acorporation.
stock split—a company-initiated increase in the number of shares of thecompany’s stock, accompanied by a decrease in share price, so thatshareholder equity remains the same. For example, in a “2 for 1” stock
GLOSSARY
— 411 —
split, a shareholder who had 100 shares of the stock when its price was$60 a share will have 200 shares valued at $30 a share after the split.
target investment mix—the percentage mix of stocks, bonds, and cashequivalents that an investor considers appropriate based on his or herpersonal objectives, time horizon, risk tolerance, and financial resources.
taxable equivalent yield—the interest rate that must be received on ataxable security to provide the holder with the same after-tax return asthe yield earned on a tax-exempt security.
tax deferred—taxes can be postponed until a later date. Typicallycontributions to an IRA, for example, are not taxed until they arewithdrawn from the account, but when withdrawn, they are fully taxedat the applicable tax rate.
tax efficient—an investment (e.g., mutual fund, exchange-traded fund)that maximizes after-tax returns for shareholders. A tax-efficientinvestment will typically distribute minimal capital gains to shareholdersannually and have a low turnover ratio.
tax-exempt bond—a bond, usually issued by municipal, county, or stategovernments, whose interest payments are not subject to federal and, insome cases, state and local income tax.
tax-exempt income—dividends and interest not subject to federal and,in some cases, state and local income.
tax-loss carryforward—a tax benefit that allows an individual or a fundto offset past losses against future profits.
tax-loss harvesting—tax-loss-motivated sales of securities.
tax-sheltered—an investment exempt from federal and, in some cases,state or local income taxes.
technical analysis—analysis of the supply and demand for securitiesusing charts and graphs to identify price trends that may forecast futureprice movements.
time horizon—the amount of time, usually expressed in years, that aninvestor expects to hold an investment.
top-down approach—an approach to investing in which the investorfirst looks at general trends in the economy and then chooses specific
GLOSSARY
— 412 —
industries and particular companies that will benefit from these broadtrends.
total return—the all-inclusive return of an investment, which includesgains and losses from all sources, namely dividends and capital gains.
traditional IRA—a personal, tax-deferred retirement account that allowsan investor to make contributions from current income.
Treasury bills (T-bills)—a T-bill is a U.S. government security with amaturity of one year or less.
Treasury bonds—long-term obligations of the U.S. Treasury that maturein 10 to 30 years are called bonds. Interest is paid semiannually, andthey can be easily purchased in minimum denominations of $1,000.
Treasury notes—U.S. government obligations that are available forterms of from 1-10 years. Interest is paid twice a year and they can bepurchased in denominations of $1,000.
turnover rate—an indication of trading activity during the past year.Portfolios with high turnover rates incur higher transaction costs and aremore likely to distribute capital gains.
undervalued security—a security selling below its market value orliquidation value.
unit investment trust (UIT)—a portfolio of securities bought and heldin trust for a specified period of time. The trust units are sold to investorsand the trust is priced much like a mutual fund.
unrealized capital gain—a dollar gain that is not yet “realized” or taken.
valuation—the estimated worth of an asset such as a security. Avaluation makes it easier to decide if an asset would make a goodinvestment at a given purchase price. The price/earnings ratio is anexample of a stock valuation.
value investing—a strategy for equity investing that emphasizes stockswith low price-to-book ratios and/or low price-to-earnings ratios.
variable annuity—a type of insurance contract having a value thatchanges based on an underlying investment portfolio, which may includemutual funds, or on another performance index. Funds held in theannuity accumulate on a tax-deferred basis.
GLOSSARY
— 413 —
VIPERs—Vanguard Index Participation Equity Receipts (VIPERShares) are exchange-traded funds that represent an interest in stocksheld by certain Vanguard index mutual funds.
volatility—the fluctuations in market value of an investment.
volume—the amount (expressed in shares or dollars) of a security thattrades during a specific period.
wash sale—the sale and repurchase of the same asset within 30 days.The IRS does not allow an investor to claim a tax loss on a wash sale.
Wilshire 5000 Index—this index measures the stock market as a whole.It originally contained 5,000 companies, but it has grown to include over7,000. The biggest 500 stocks in this index represent about 80% of thetotal market. To be included in this index a company must beheadquartered in the U.S.
yield—a measure of the amount of income an investment generates.
yield to maturity—the annual return on a bond, assuming the bond isheld until its maturity date. This takes into consideration the purchaseprice, redemption value, time to maturity, coupon yield, and timebetween interest payments.

BIBLIOGRAPHY AND RECOMMENDED READING
— 414 —
Here are some books that have helped me. You may find themhelpful, too.
Belsky, Gary and Gilovich, Thomas Why Smart People Make Big MoneyMistakes—And How To Correct Them: Lessons from the New Science ofBehavioral Economics Simon & Schuster
Bernstein, Peter L. Against the Gods; The remarkable story of risk JohnWiley & Sons, Inc.
Bernstein, William The Intelligent Asset Allocator McGraw-Hill
Blitzer, David M. Outpacing the Pros; Using indexes to beat WallStreet’s Savviest Money Managers McGraw-Hill
Bogle, John C. Common Sense on Mutual Funds: New Imperatives forthe Intelligent Investor John Wiley & Sons, Inc.
Clements, Jonathan 25 Myths You’ve Got to Avoid If You Want toManage Your Money Right: The New Rules for Financial Success Simon& Schuster
Edleson, Michael E. Value Averaging: The Safe and Easy Strategy forHigher Investment Returns International Publishing Corporation
Evans, Richard E., Malkiel, Burton G. Earn More (Sleep Better): TheIndex Fund Solution Simon & Schuster
Bibliography andrecommended reading
BIBLIOGRAPHY AND RECOMMENDED READING
— 415 —
Evensky, Harold R. Wealth Management: The Financial Advisor’sGuide to Investing and Managing Client Assets Irwin ProfessionalPublishing
Faerber, Esmé All About Bonds and Bond Mutual Funds McGraw-Hill
Gastineau, Gary I. The Exchange Traded Funds Manual John Wiley &Sons
Gibson, Roger C. Simple Asset Allocation Strategies MarketplaceBooks
Good, Walter R. CFA, Hermansen, Roy W. CFA Index Your Way toInvestment Success: Using Institutional Investment Strategies to BoostReturns and Control Risk New York Institute of Finance
Lerman, David Exchange Traded Funds and E-Mini Stock IndexFutures John Wiley & Sons
Malkiel, Burton G. A Random Walk Down Wall Street Norton &Company
Murray, Nick The Excellent Investment Advisor and The Craft ofAdvice: Essays 1995-1998
Reinhardt, Werba, Bowen The Prudent Investor’s Guide to Beating theMarket Irwin Professional Publishing
Schott, M.D., John W. Mind Over Money: Match Your Personality to aWinning Financial Strategy Little, Brown and Company
Schwab, Charles Charles Schwab’s Guide To Financial Independence:Simple Solutions for Busy People Three Rivers Press
Siegel, Jeremy J. Stocks For The Long Run: The Definitive Guide toFinancial Market Returns and Long-Term Investment StrategiesMcGraw-Hill
Simon, W. Scott Index Mutual Funds: Profiting from an InvestmentRevolution Namborn Publishing Co.
Slesnick, Twila and Suttle, John C. Taking Your Money Out; IRAs,401(k)s & other retirement plans Nolo Press
Swedroe, Larry E. What Wall Street Doesn’t Want You To Know; Howyou can build real wealth investing in index funds St. Martin’s Press

BIBLIOGRAPHY AND RECOMMENDED READING
— 416 —
Tanous, Peter J. Investment Gurus New York Institute of Finance
Thau, Annette The Bond Book McGraw Hill
Thomas, Kaye A. Capital Gains, Minimal Taxes Fairmark Press
Wiandt, Jim and McClatchy, Will Exchange Traded Funds; An Insider’sGuide to Buying the Market John Wiley & Sons

FAVORITE WEB SITES
— 417 —
Favorite Web sites
www.amex.comwww.barra.comwww.bigcharts.com www.bloomberg.comwww.cnnfn.comwww.dfafunds.comwww.djindexes.comwww.etfconnect.comwww.firstcall.com www.ifa.tvwww.indexfunds.comwww.ishares.com
www.morningstar.com www.nasdaq.comwww.russell.comwww.schwab.comwww.spglobal.com www.stockcharts.com www.thestreet.comwww.thomsonfn.comwww.tiaacref.comwww.troweprice.comwww.yahoo.com (finance)www.yardeni.com

ABOUT THE AUTHOR
— 419 —
Stuart Chaussée is an independent, Registered Investment Advisor.Since 1986 Mr. Chaussée has focused on advising affluent individualsand business owners. He received a Bachelor of Arts degree from theUniversity of California at Berkeley and a Master’s degree from theAmerican Graduate School of International Management (Thunderbird).He is the author of Portfolio Management for the Affluent: Guide to atax-efficient, low-cost, growth-oriented portfolio and Stocks, Bonds and“Greenspan’s Model”: How the model can help make you a betterinvestor (Palisade Business Press). Mr. Chaussée lives in SouthernCalifornia with his wife and three children.
About the author
DIVIDEND INVESTING FOR INCOME AND GROWTH
- 163 -
Stuart Chaussée is an independent, fee-only Registered Investment Advisor. Since 1986 Mr. Chaussée has focused on advising affluent individuals and business owners. He received a Bachelor of Arts degree from the University of California at Berkeley and a Master's degree from Thunderbird School of Global Management . He is the author of five investment books including the award-winning Advanced Portfolio Management: Strategies for the Affluent (Palisade Business Press). His most recent writings , Understanding Risk, Investor Behavior and Surviving Bubbles and Dividend Investing for Income and Growth are available together in Essential Works of Stuart Chaussée. Mr. Chaussée is married with three children.
ABOUT THE AUTHOR
— 419 —
Stuart Chaussée is an independent, Registered Investment Advisor.Since 1986 Mr. Chaussée has focused on advising affluent individualsand business owners. He received a Bachelor of Arts degree from theUniversity of California at Berkeley and a Master’s degree from theAmerican Graduate School of International Management (Thunderbird).He is the author of Portfolio Management for the Affluent: Guide to atax-efficient, low-cost, growth-oriented portfolio and Stocks, Bonds and“Greenspan’s Model”: How the model can help make you a betterinvestor (Palisade Business Press). Mr. Chaussée lives in SouthernCalifornia with his wife and three children.
About the author
418